![no · PDF fileE. Kendrick Ma] 16-3 Round 4 Kendrick Gustilo E. Kendrick C. Lewis Kendrick Maj 16-4 ... Johnson South port puni Jayden Bowles Citrus Wrestlin Mason Wislon](https://static.fdocuments.in/doc/165x107/5a8ed0e57f8b9a4a268d68c8/no-kendrick-ma-16-3-round-4-kendrick-gustilo-e-kendrick-c-lewis-kendrick-maj.jpg)
Looking Ahead Beyond 2015: Making Growth Work For The Poor Rogier van den Brink, Lead Economist and...
37
Looking Ahead Beyond 2015: Making Growth Work For The Poor Rogier van den Brink, Lead Economist and Program Leader, and Karl Kendrick Chua, Senior Country Economist Macroeconomics and Fiscal Management Global Practice Presentation to the Philippine Economic Society, November 14, 2014
-
Upload
katrina-hardy -
Category
Documents
-
view
217 -
download
0
Transcript of Looking Ahead Beyond 2015: Making Growth Work For The Poor Rogier van den Brink, Lead Economist and...

Looking Ahead Beyond 2015:Making Growth Work For The Poor
Rogier van den Brink, Lead Economist and Program Leader, and
Karl Kendrick Chua, Senior Country EconomistMacroeconomics and Fiscal
Management Global Practice
Presentation to the Philippine Economic Society, November 14, 2014

Contents1. Global trends—pessimistic
2. Philippine trends—optimistic
3. Inclusive growth—challenge
4. Opportunity—stars aligned, wind in your sails
5. Poverty projections—look good
6. Jobs challenge—remains
7. The way forward….

3
Recent economic and policy developments Global Recovery: Weak and Slow
Disappointing year
Global growth forecasts: revised further down
Trade: slower long-term growth
Outlook is pessimistic:
Summers’ “Secular Stagnation”
Lagarde’s “New Mediocre”
Rodrik’s pessimism about the “old” growth strategies
Developing countries: transition to a new environment Post-crisis growth slowdown widespread
Structural challenges abound

Recent economic and policy developments
Global growth:
3.2% >> 2.6%
Growth in developing countries:
5.3% >> 4.5%
Growth in high income countries:
2.2% >> 1.8%Source: World Bank Global Economic Prospects
Global growth has been downgraded since January

5
Medium-term global growth projections
Sources: World Development Indicators; DECPG Projections
2007
2008
2009
2010
2011
2012
2013
2014
2015
2016
2017
-4
-2
0
2
4
6
8
10World High income countries Developing countries
GDP growth (percent)

6
Slower trade growth….
2005 20
020
020
06 200
200
2007 20
020
020
08 200
200
2009 20
020
020
10 201
201
2011 20
120
120
12 201
201
2013 20
120
120
14 201
20180
100
120
140World trade Trend 05-08 Trend 11-14
Index, 2008Q1 = 100

7
Rodrik on service sector and growth strategies in developing countries….

8
3% by 2030 is far from assured: Business as usual will not get us there
ScenarioHeadcount (percent)
Number of poor (million)
Average income growth of 4% p.a. in each country 3 252
Each country sustains avg per capita growth during past 20 years 6.8 573
Each country sustains avg per capita growth during past 10 years 4.8 405.4
Each country sustains avg per capita growth during past 10 years (survey-based growth) 6.7 564.8
Global Poverty in 2030 at $1.25 per day (2005 PPP),
assuming unchanged inequality
Source: World Bank, 2014, A Measured Approach to Ending Poverty and Boosting Shared Prosperity
…and growth is slowing.

9
Projecting the Changing Faceof Poverty to 2030
Source: World Bank, 2014, A Measured Approach to Ending Poverty and Boosting Shared Prosperity

10
The Philippines has experienced higher growth in the last decade..
-10
-5
0
5
10 Real GDP per capita (2000 prices) growth
Per
cent
Sources: National Statistics Office (NSO), WDI, World Bank staff estimatesNote: Red line at 2.5 percent (long run average)
Post war reconstruction
Debt-drivengrowth
Governance-led growth

11
..along with strong macro fundamentals..
-9
-6
-3
0
3
6Current account balance
Per
cent
of G
DP
Sources: WDI, Department of Budget and Management (DBM)Notes: The red line is at -3 percent. Current account balance has a series break in 1977 and in 2005.

..low and stable inflation..
12
Low and stable inflation in the last decade has led to increased real income for businesses and households
0
5
10
15
20
Perc
ent
CPI inflation
Sources: Philippine Statistics Authority, Bangko Sentral ng PilipinasNotes: The red line is at 5 percent.

-6
-5
-4
-3
-2
-1
0
1
2
0
10
20
30
40
50
60
70
80
90
Perc
ent o
f GD
P
National government deficit and debt
DebtDeficit (rhs)
Perc
ent o
f GD
P
Source: WB staff estimates using NSCB, BTr, and DOF data
..improving fiscal position..
13
Lower debt levels and deficit mean more fiscal space for pro-poor spending. In fact, social spending doubled in the last 4 years.

..and a history of successful reforms that made a big difference.
0
100
200
300
400
500
600
700
800
900
Hun
dred
tho
usan
ds
BPO sector - total employment
Source: BPAP
0
10
20
30
40
50
60
70
80
90
100
Mill
ions
Number of mobile phone subscribers
Source: WDI
0
5
10
15
20
25
30
Mill
ions
Number of internet users
Source: WDI
0
5
10
15
20
25
Mill
ions
Air transport, passengers carried
Source: WDINote: Data include passengers of both domestic and
international flights.

15
GDP growth decelerated somewhat to 6.0 percent in H1 2014 due to weak government consumption and public construction.
Private consumption continued to drive growth. But growth was third highest in the region behind only China
and Malaysia.
-15
-10
-5
0
5
10
15
Q1 Q2 Q3 Q4 Q1 Q2 Q3 Q4 Q1 Q2 Q3 Q4 Q1 Q2
2011 2012 2013 2014
Pe
rce
nta
ge p
oin
t
Demand side: contribution to GDP Growth
Private consumption Govt consumption Capital formation
Statistical Discrepancy Net Exports GDP growth
Source: PSA
Recent economic and policy developments

Inclusive growth challenge:Creating more and better jobs, reducing poverty and protecting the vulnerable
Growth may be necessary but is not sufficient to ensure poverty reduction…
How broadly based growth is—i.e., how pro-poor the distribution
of growth is—also matters…
Raising the returns to labor—the main asset of the poor
by…
…increasing value-added per worker in
agriculture
…moving workers out of agriculture to higher value-
added activities in manufacturing and service
…as does how resilient growth is and the extent to which poor and vulnerable households are protected
from shocks
Putting in place
appropriate social
protection schemes
…and raising human capital
endowments

China’s incidence of growth:inclusive growth in several periods

Philippines?• Long history of policy distortions has
slowed the growth of agriculture and manufacturing in the last six decades.
• Incomplete structural transformation• Agricultural productivity has
remained depressed, manufacturing has failed to grow sustainably, and a low-productivity, low-skill services sector has emerged as the dominant sector of the economy.
Structural transformation?
0
10
20
30
40
50
60 Sector share to GDP
Agriculture Industry ServiceSource: NSCB
Perc
ent
0
10
20
30
40
50
60
70
Per
cent
Employment share by sector (detailed)
Agriculture Manufacturing Other industries Formal services Informal services
Source: LFSSource: LFS

-10
-5
0
5
10
15
20
10 20 30 40 50 60 70 80 90 100
Ave
rage
ann
ual
grow
th in
per
capi
ta c
onsu
mpti
on (
%)
Percentiles of the distribution of per-capita household consumption
PHILIPPINES: per-capita household consumption GROWTH INCIDENCE CURVES
1994-1997
2006-2009
2003-2006
2000-2003
1997-2000
Philippine incidence of growth:less so…

• A regional environment favorable to the Philippines
• Sound macroeconomic fundamentals
• A government committed to reform
• Widespread confidence
• Highly skilled, talented, English-speaking, youthful population
• Abundant natural resources
• Opportunity to build on momentum of reforms already successfully
implemented, for instance:
• Better public financial management, which created fiscal space
• Doubling of budgets for social services since 2010
• Conditional cash transfer and CDD programs
• Major improvements in transparency (Open Government)
A window of opportunity

The East Asia and Pacific (EAP)region is a global growth driver
21
EAP accounts for over 25% of world nominal GDP, and its share will continue to rise At current real growth rates of 7% annually,
developing EAP countries will add a further $7 trillion by 2019 China 2nd largest economy, Indonesia 10th
Increasing trade and FDI with all regions
China will remain growth driver in the region and globally Rethinking its growth model with greater focus on
sustainability Market-oriented reforms
Regional integration is increasing ASEAN integration in 2015 presents opportunities
for furthering reforms Nearly 50% of FDI in ASEAN countries originates
within EAP
Challenges and Risks Need to move forward with structural reforms and
investments to raise factor productivity and address vulnerabilities
2003
2004
2005
2006
2007
2008
2009
2010
2011
2012
2013
2014
2015
2016
0
2
4
6
8
10
12
14 Real GDP Growth (%) %
Developing EAP
Developing EAP exc China
1990
1991
1992
1993
1994
1995
1996
1997
1998
1999
2000
2001
2002
2003
2004
2005
2006
2007
2008
2009
2010
2011
2012
2013
2014
2015
2016
2017
2018
2019
0%
5%
10%
15%
20%
25%
30%
35% EAP Share of Global GDPChinaDeveloping countries excluding ChinaNewly Industrialized Economies*High income**
Forecast***
* Includes Hong Kong SAR, China; Taiwan, China; Singapore; and Korea. ** Includes Japan, Australia, New Zealand, and Brunei Darussalam.*** Differs by country; 34% of countries have their estimates start after 2013.

East Asia and ASEAN Growth Projections
22
Forecast2012 2013 2014 2015 2016
East Asia 6.0 6.1 6.0 6.1 6.1
Developing East Asia 7.4 7.2 6.9 6.9 6.8
China 7.7 7.7 7.4 7.2 7.1
Indonesia 6.3 5.8 5.2 5.6 5.6
Malaysia 5.6 4.7 5.7 4.9 5.0
Philippines 6.8 7.2 6.4 6.7 6.5
Thailand 6.5 2.9 1.5 3.5 4.0
Vietnam 5.2 5.4 5.4 5.5 5.8
Cambodia 7.3 7.4 7.2 7.5 7.2
Lao PDR 8.0 8.5 7.5 6.4 7.0
Myanmar 7.3 8.3 8.5 8.5 8.2
ASEAN 5.7 5.0 4.5 5.0 5.3
Developing EAP excluding China 6.2 5.2 4.8 5.3 5.1
World 2.5 2.4 2.6 3.2 3.3
High-income countries 1.5 1.3 1.8 2.3 2.4
Developing countries 4.8 4.8 4.5 5.0 5.3Source: World Bank, "East Asia and Pacific Economic Update: Enhancing Competitiveness in an Uncertain World", October 2014
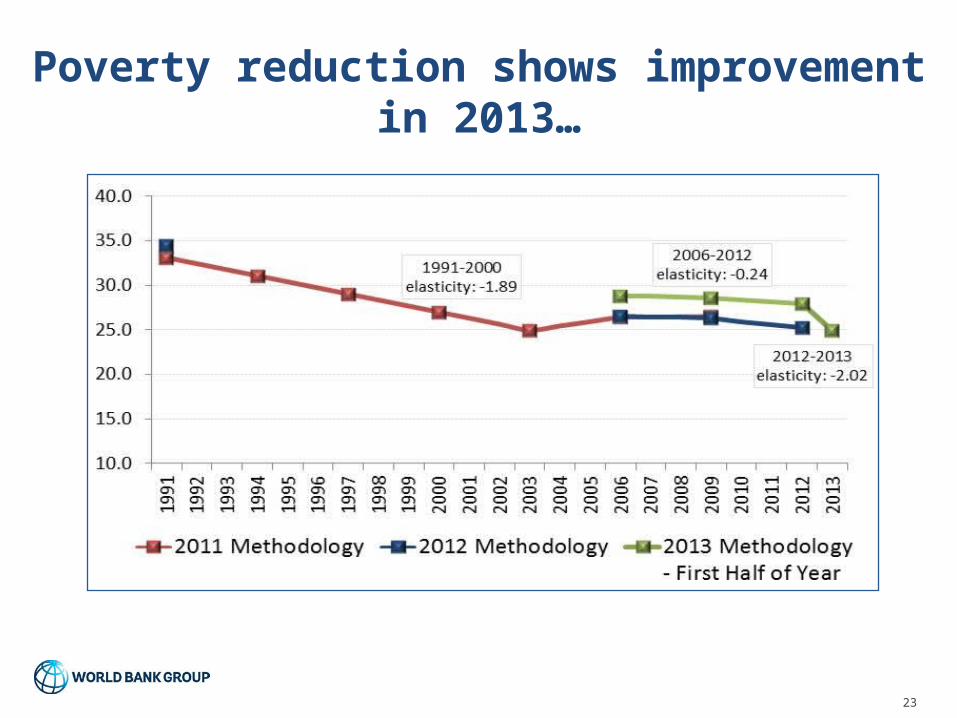
Poverty reduction shows improvement in 2013…
23

24
First half poverty incidence among the population fell by 3 ppt. to 24.9 percent, down from 27.9 percent in the same period in 2012.
This translates to around 2.5 million Filipinos uplifted from poverty. Job creation:
In 2013, still weak job creation. In 2014, better.
Jan Apr Jan Apr Jan AprUnemployment 7.2 6.9 7.1 7.6 7.5 7.0Underemployment 18.8 19.3 20.7 19.2 19.5 18.2Job creation (thousands) 1,005 1,001 519 -37 283 1,654
By industry:
Agriculture 132 323 -540 -621 121 323Industry 210 219 318 228 117 345Services 664 458 741 393 45 910
By sector:
Public sector 115 21 24 45 -35 -11Private sector 891 980 495 -82 318 1,665
By class of worker:
Wage and Salary 435 838 1,820 593 -994 914Self-employed 349 -15 -613 -225 705 445Unpaid workers 220 178 -688 -404 536 296
Source: LFS
2012 2013 2014
Note: January estimates exclude Region 8, whi le Apri l estimatesexclude the provnce of Leyte, due to the effects of typhoon Yolanda.
20
22
24
26
28
30
32
0
4
8
12
16
20
24
28
Pove
rty
inci
denc
e (p
erce
nt o
f pop
ulati
on)
Mag
nitu
de o
f poo
r (in
mill
ions
)
Poverty incidence and magnitude(first semester estimates)
Magnitude (in millions) Incidence (lhs)
Source: PSA, United Nations World Population Prospects
In 2013, poverty incidence declined significantly
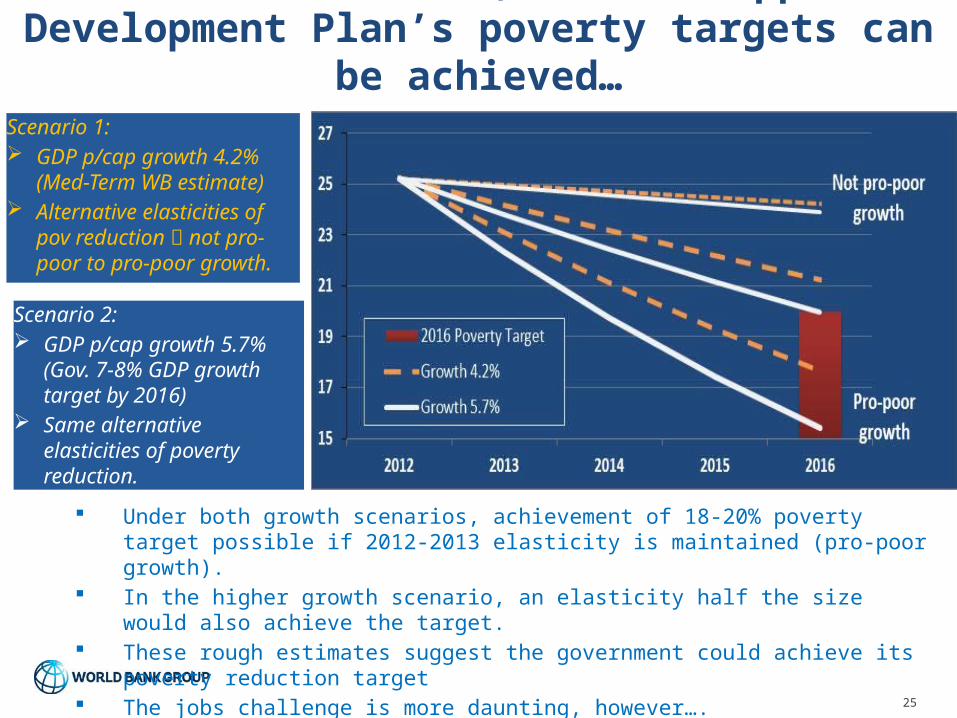
At current trends, the Philippine Development Plan’s poverty targets can be achieved…
25
Under both growth scenarios, achievement of 18-20% poverty target possible if 2012-2013 elasticity is maintained (pro-poor growth).
In the higher growth scenario, an elasticity half the size would also achieve the target. These rough estimates suggest the government could achieve its poverty reduction
target The jobs challenge is more daunting, however….
Scenario 1: GDP p/cap growth 4.2%
(Med-Term WB estimate) Alternative elasticities of
pov reduction not pro-poor to pro-poor growth.
Scenario 2: GDP p/cap growth 5.7%
(Gov. 7-8% GDP growth target by 2016)
Same alternative elasticities of poverty reduction.

More challenging: providing more and better jobs to the 15 million Filipino’s who are either
unemployed or underemployed
26
Jobs challenge Three million unemployed Seven million underemployed New entrants to the labor force number 1.15
million/year Informality accounts for 75 percent of
employment

Medium-term reform agenda:
27
Thematic reform areas
Enhancing competition
Simplifying business regulations
Securing property rights
Increasing investment in physical and human capital

0
1
2
3
4
5
6
Perc
ent o
f GDP
Education
0
1
2
3
Perc
ent o
f GDP
Health
0
1
2
3
4
5
Perc
ent o
f GDP
Infrastructure
Public Expenditure
Source: WDI and ADB estimatesNotes: Education and health figures are from 1995 to 2012 (Some countries have missing values for certain years.). Infrastructure data is from 2008 to 2012.
Investing on infrastructure, education and health
can help sustain inclusive growth
28
However, the Philippines has an investment deficit Spending on infrastructure, health and education has been lower than in
some neighboring countries. Low spending has contributed to weak health outcomes and lower quality
of education, and tremendous traffic. But recent trends are in the right direction…

Financing this trend needs more revenues…so reduce the tax gap
29
0.31.8
3.01.8
6.9
0.8
0.3
1.4
1.4
4.0
0
2
4
6
8
10
12
SEP CE CIT VAT Total
Actual Gap
(0.5)
-
0.5
1.0
1.5
2.0
2.5
1997
1998
1999
2000
2001
2002
2003
2004
2005
2006
2007
2008
Using NSO imports Using BOC imports
BIR tax gap (in percent of GDP)(Actual collection plus collection gap)
BOC tax gap (in percent of GDP)

…and more reforms in areas such as real property tax.
30
21
23
25
48
27
0 10 20 30 40 50
1991-1995
1996-2000
2001-2005
2006-2010
2011-2012
Number of cities
Base Year of Property Valuation of Cities
Source: Official Page for the Joint Memorandum Circulars (JMCs) on Revision of SMVs and Property Assessments (2010-01) and Idle Land Taxation (2010-02).
1
3
6
14
36
20
0 10 20 30 40
1985
1991-1995
1996-2000
2001-2005
2006-2010
2011-2012
Number of provinces
Base Year of Property Valuation of Provinces
Source: Official Page for the Joint Memorandum Circulars (JMCs) on Revision of SMVs and Property Assessments (2010-01) and Idle Land Taxation (2010-02).
As of June 2014, around 80% of cities and 75% of provinces use outdated schedule of market values (SMVs) for collecting real property tax.

A proposed tax reform package to finance investments
31
Raising tax revenues efficiently and equitablyFirst phase: raising tax revenues
Rationalize tax incentives to reduce redundancy;Enact a tax expenditure ceiling
Reduce the number of VAT exemptions; use the NHTS-PR to protect vulnerable Filipinos
Centralize the valuation of real properties and, if needed, levy a national surtax to enhance equity
Index petroleum excise taxes once prices have fallen or automatic increase in excise tax once fuel price falls to enhance equity
Second phase: lowering tax rates and further broadening the base
Reduce the corporate income tax rate while increasing the gross income earned to enhance equity
Reduce the highest marginal tax rate for personal income tax and reduce the number of brackets
Consolidate all laws and regulations on tax incentives into one code
Simplify the tax regime for micro and small firms into a single tax on turnover to reduce compliance cost

Broad reform coalitions are necessary. Without a broad coalitions, reforms made under a strong president can be reversed, as the country’s history has shown.
Stakeholders need to focus on a package of reforms to support inclusive growth. Given the political economy, individual reforms will face strong opposition.
Example: sin tax reform
These coalitions can form at many levels and around many themes
Country needs to come together and seize this unique window of opportunity
…not to be missed!
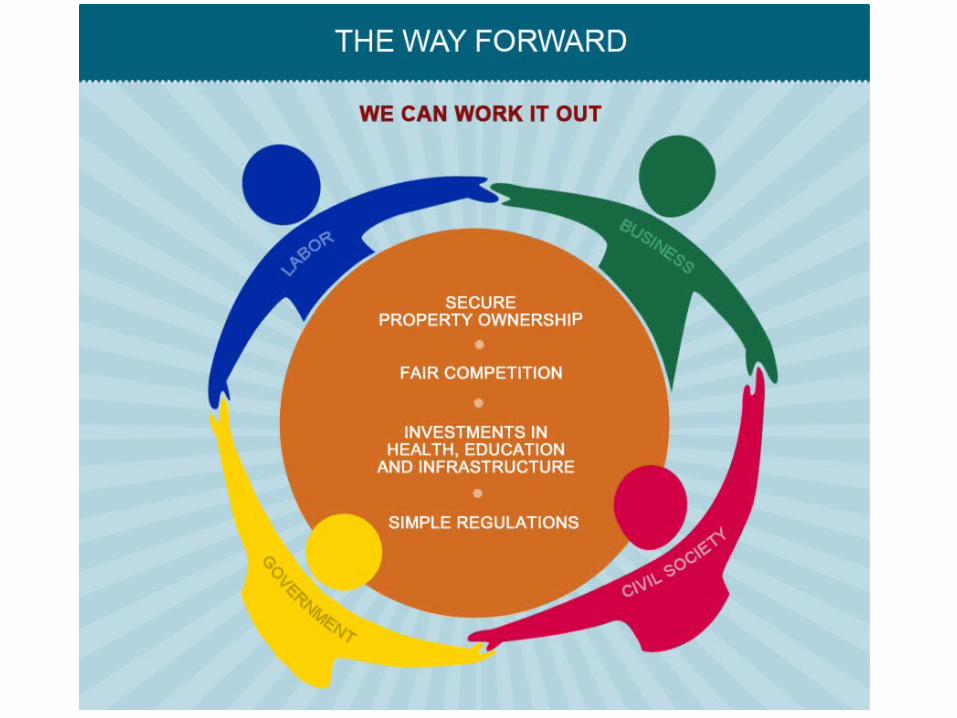
“Working together” is not just a nice slogan…

Example: shipping industry
33
Philippines EAPWeak competition Share of primary routes served by a single operator (%) 40 NAHigh shipping costs Share of logistics costs to wholesale price (%) 24-53 20High shipping costs Share of shipping and port handling costs to wholesale price (%) 8.4 NAHigh shipping costs Share of shipping and port handling costs to retail price (%) 4.9 NASmall domestic trading volumes Domestic market throughput (millions of metric tons) 74 782Low quality of services Rank in liner shipping connectivity (out of 157) 66 17Poor port infrastructure Rank in quality of port index (out of 148) 116 47Low profitablity Average return on equity (%) 1 NAOld vessel age Average age of ships (years) 30 22Poor safety standards Average number of yearly accidents 228 32Poor safety standards Average number of yearly casualties 303 60Sources: World Bank (2013), World Economic Forum (2013), JBIC (2002), Securities and Exchange Commission, MARINA, National Statistical Coordination Board, World Development Indicators, and Board of Maritime Inquiry, UNCTAD (2011), Various country statistical officesNote: Average age of ships used was global average in the absence of dataSelect East Asia and the Pacific countries are Singapore, Hong Kong, China, Malaysia, Thailand, Viet Nam, and IndonesiaA group of 5 international comparator shipping firms from the region were used for average return on equity
Sector Features Measurement Indicator

Example: what to about rice prices?
Rice Policy in the Philippines 34
Jan-
00
May
-01
Sep-0
2
Jan-
04
May
-05
Sep-0
6
Jan-
08
May
-09
Sep-1
0
Jan-
12
May
-13
Sep-1
40
0.1
0.2
0.3
0.4
0.5
0.6
0.7
0.8
0.9
1
Philippines
Vietnam
Thailand
Wh
ole
sa
le p
ric
es
, US
D/k
g
In September 2014, 1kg of rice cost PHP 41 in Philippine supermarkets. Consumers in Vietnam were paying the equivalent of PHP 16.
Source: FAO GIEWS Price Tool

Government
• Enhance programs to reduce food prices without farm profits falling
• Provide universal social protection, health insurance, basic education
• Simplify business regulations, for firms of all sizes
Businesses
• Support reforms that promote competition to level the playing field
• Support freedom of association and collective bargaining
• Partner with government and organize training for workers to create and upgrade skills
Labor
• Actively participate in dialogue and include informal workers
• Recognize valid forms of flexible contracts
• Reduce calls to hike minimum wages, as food prices fall.
Civil society
• Ensure broad-based participation and support for this type of agreement.
• Monitor commitments made
• Support evidence-based policy making, performance-informed budgeting (media, Open Government)
Example of a balanced package of reforms:

Thank you
Rogier van den Brink, Lead Economist and Program Leader, and
Karl Kendrick Chua, Senior Country EconomistMacroeconomics and Fiscal
Management Global Practice