Longitudinal Morphometric Study of Genetic Influence of ...Longitudinal Morphometric Study of...
57
Longitudinal Morphometric Study of Genetic Influence of APOE e4 Genotype on Hippocampal Atrophy - An N=1925 Surface-based ADNI Study by Bolun Li A Thesis Presented in Partial Fulfillment of the Requirements for the Degree Master of Science Approved April 2015 by the Graduate Supervisory Committee: Yalin Wang, Chair Ross Maciejewski Jianming Liang ARIZONA STATE UNIVERSITY May 2015
Transcript of Longitudinal Morphometric Study of Genetic Influence of ...Longitudinal Morphometric Study of...
Longitudinal Morphometric Study of Genetic
Influence of APOE e4 Genotype on Hippocampal
Atrophy - An N=1925 Surface-based ADNI Study
by
Bolun Li
A Thesis Presented in Partial Fulfillment of the Requirements for the Degree
Master of Science
Approved April 2015 by the Graduate Supervisory Committee:
Yalin Wang, Chair Ross Maciejewski
Jianming Liang
ARIZONA STATE UNIVERSITY
May 2015

i
ABSTRACT
The apolipoprotein E (APOE) e4 genotype is the most prevalent known genetic
risk factor for Alzheimer's disease (AD). In this paper, we examined the longitudinal
effect of APOE e4 on hippocampal morphometry in Alzheimer's Disease Neuroimaging
Initiative (ADNI). Generally, atrophy of hippocampus has more chance occurs in AD
patients who carrying the APOE e4 allele than those who are APOE e4 noncarriers. Also,
brain structure and function depend on APOE genotype not just for Alzheimer's disease
patients but also in health elderly individuals, so APOE genotyping is considered critical
in clinical trials of Alzheimer's disease. We used a large sample of elderly participants,
with the help of a new automated surface registration system based on surface conformal
parameterization with holomorphic 1-forms and surface fluid registration. In this system,
we automatically segmented and constructed hippocampal surfaces from MR images at
many different time points, such as 6 months, 1- and 2-year follow up. Between the two
different hippocampal surfaces, we did the high-order correspondences, using a novel
inverse consistent surface fluid registration method. At each time point, using Hotelling's
T^2 test, we found significant morphological deformation in APOE e4 carriers relative to
noncarriers in the entire cohort as well as in the non-demented (pooled MCI and control)
subjects, affecting the left hippocampus more than the right, and this effect was more
pronounced in e4 homozygotes than heterozygotes.

ii
To my parents, and all the other family members.

iii
ACKNOWLEDGMENTS
I would like to thank many people for helping me to get this thesis finished. First,
I owe particular thanks to my committee chair and advisor, Professor Yalin Wang, who
has been very nice and patient to me during my Master study. He gave me bunches of
advice and helped me conquer many difficulties in my study. I offer my sincere
appreciation and gratitude to his warm help, funding and edits of the documents. Second,
I would like to thank Professor Ross Maciejewski and Professor Jianming Liang for
serving on my thesis committee.
I would also thanks you to all my friends in our lab, Jie Shi, Wen Zhang, Liang
Mi and Duyan Ta. Special thanks to Jie for providing lots of materials and valuable help
in my research. I offer my enduring gratitude for their friendship and kind help.
iv
TABLE OF CONTENTS
Page
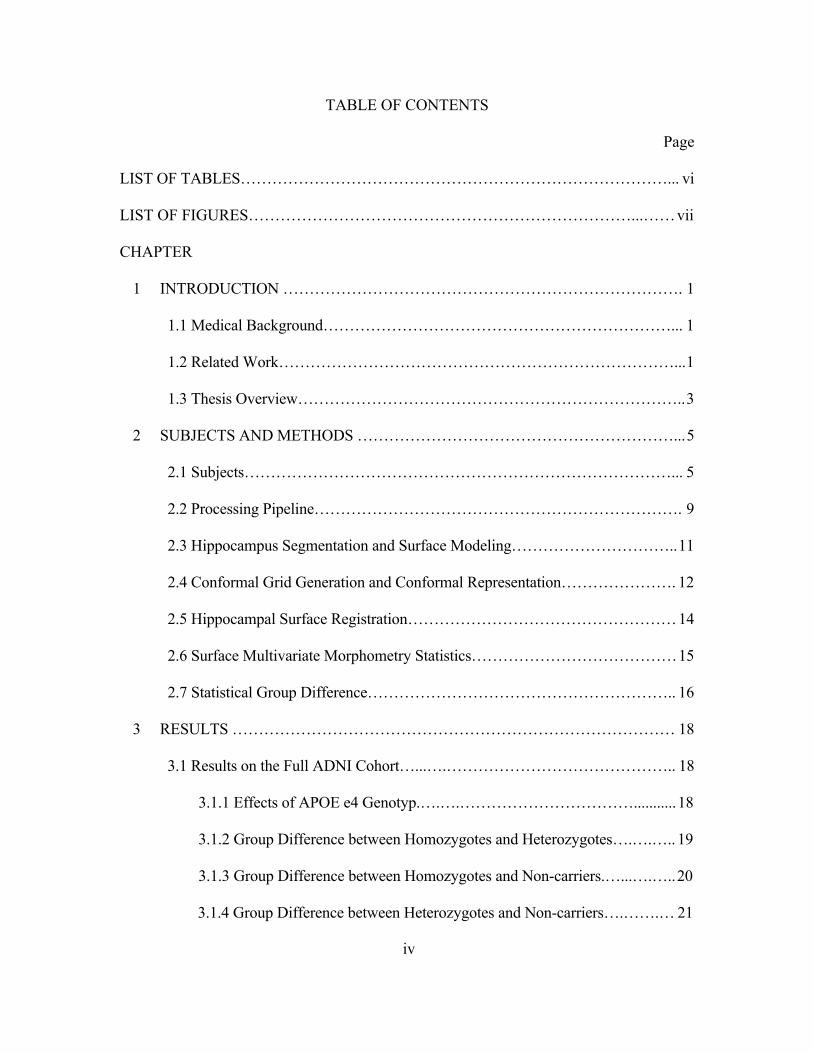
LIST OF TABLES………………………………………………………………………... vi
LIST OF FIGURES………………………………………………………………...…… vii
CHAPTER
1 INTRODUCTION …………………………………………………………………. 1
1.1 Medical Background…………………………………………………………... 1
1.2 Related Work…………………………………………………………………... 1
1.3 Thesis Overview……………………………………………………………….. 3
2 SUBJECTS AND METHODS ……………………………………………………... 5
2.1 Subjects………………………………………………………………………... 5
2.2 Processing Pipeline……………………………………………………………. 9
2.3 Hippocampus Segmentation and Surface Modeling………………………….. 11
2.4 Conformal Grid Generation and Conformal Representation…………………. 12
2.5 Hippocampal Surface Registration…………………………………………… 14
2.6 Surface Multivariate Morphometry Statistics………………………………… 15
2.7 Statistical Group Difference………………………………………………….. 16
3 RESULTS ………………………………………………………………………… 18
3.1 Results on the Full ADNI Cohort…...….…………………………………….. 18
3.1.1 Effects of APOE e4 Genotyp.….….……………………………........... 18
3.1.2 Group Difference between Homozygotes and Heterozygotes….….….. 19
3.1.3 Group Difference between Homozygotes and Non-carriers.…...….….. 20
3.1.4 Group Difference between Heterozygotes and Non-carriers….…….… 21

v
CHAPTER Page
3.2 Results on the Non-demented ADNI Cohort………..………………………. 22
3.2.1 Effects of APOE e4 Genotype…………………………….….….……. 22
3.2.2 Group Difference between Homozygotes and Heterozygotes….….….. 23
3.2.3 Group Difference between Homozygotes and Non-carriers…....…..…. 24
3.2.4 Group Difference between Heterozygotes and Non-carriers...…...….... . 25
3.3 Results on the Arizona APOE Cohort………………………………………. 26
3.4 Cumulative Distribution Functions of P-values in Statistical P-maps.….....…. 27
4 DISCUSSION …………………………………………………………………….. 31
REFERENCES…………………………………………………………………………… 38

vi
LIST OF TABLES
Table Page
1. Table of Demographic Data by Diagnositic and Genotype Groups….….….………... 8

vii
LIST OF FIGURES
Figure Page
1. Overall Processing Sequence. ……..………………………………………………... 10
2. Shape Differences between Non-carriers and Carriers in Full ADNI.…..... ………… 19
3. Shape Differences between Heterozygotes and Homozygotes in Full ADNI………. 20
4. Shape Differences between Non-carriers and Homozygotes in Full ADNI……..…... 21
5. Shape Differences between Non-carriers and Heterozygotes in Full ADNI…...……. 22
6. Shape Differences between Non-carriers and Carriers in Nondemented.….….…….. 23
7. Shape Differences between Heterozygotes and Homozygotes in Nondemented…… 24
8. Shape Differences between Non-carriers and Homozygotes in Nondemented.….….. 25
9. Shape Differences between Non-carriers and Neterozygotes in Nondemented…..…. . 26
10. Shape Differences (P-values) of BAI Second Scan…………………………….…… 27
11. Cumulative Distribution Function Plots Comparison………………….….…….…... 29
12. Cumulative Distribution Function Plots Comparisons on Two Group Differences.... 30
13. Linear Correlation between Number of APOE e4 and Multivariate Statistics….… 37

1
1. INTRODUCTION
1.1 Medical Background
Alzheimer’s disease (AD), a highly prevalent neurodegenerative disease, is
widely recognized as a major, escalating, epidemic, world-wide challenge to global
health care systems. AD is the most common type of dementia, accounting for 60-80% of
age-related dementia cases. The direct cost of care for AD patients by family members or
healthcare professionals is more than $114 billion per year in US alone; this figure is
expected to rise dramatically as the population ages during the next several decades (Frey,
2003).
1.2 Related Work
It is commonly agreed that an effective presymptomatic diagnosis and treatment
of AD would have enormous public health benefits. AD is a neurodegenerative disorder
characterized by progressive cognitive dysfunction. However, the underlying disease
pathology most probably precedes the onset of cognitive symptoms by many years.
Efforts are underway to find early diagnostic markers to evaluate AD risk
presymptomatically in a sufficiently rapid and rigorous way. The discovery of APOE as
the most prevalent risk factor for AD (Corder et al., 1993; Saunders et al., 1993) has
made it possible to study large numbers of genetically at-risk individuals before the onset
of symptomatic memory impairment and has led to the concept of preclinical stage AD
(Sperling et al., 2011), a concept validated in autopsy studies of non-demented elderly
subjects with neuropathological evidence of AD (Bennett et al., 2009; Caselli et al., 2010;
Dickson et al., 1992; Gouras et al., 1997; Kok et al., 2009), brain imaging studies (Dean

2
et al., 2014; Erten-Lyons et al., 2013; Filippini et al., 2009; Knickmeyer et al., 2014;
Morris et al., 2010; Reiman et al., 1996; Reiman et al., 2005; Reiman et al., 2009;
Roussotte et al., 2014a), and neuropsychological studies (Caselli et al., 2011; Caselli et
al., 2009). As the paradigm in AD research shifts to a new stage, targeting earlier
intervention and prevention, APOE genotyping is currently considered beneficial in
prevention trials for AD because the selective enrollment of APOE e4 carriers may
accelerate the evaluation of preclinical or presymptomatic AD treatments (Caselli and
Reiman, 2013; Langbaum et al., 2013).
Brain imaging and cerebrospinal fluid (CSF) biomarkers may help in the
preclinical detection, tracking and scientific of AD. Structural magnetic resonance
imaging (MRI) measurements of regional and whole brain tissue shrinkage, together with
fluorodeoxyglucose positron emission tomography (FDG PET) measurements of decline
in the regional cerebral metabolic rate for glucose (CMRgl), and PET measurements of
fibrillar amyloid-β (Aβ) burden are among the best established measurement for the
preclinical detection and tracking of AD (Reiman and Jagust, 2012). In AD research,
structural magnetic resonance imaging (MRI) based measures include whole-brain (Chen
et al., 2007; Fox et al., 1999; Stonnington et al., 2010), entorhinal cortex (Cardenas et al.,
2009), hippocampus (den Heijer et al., 2010; Jack et al., 2003; Reiman et al., 1998; Shi et
al., 2014; Thompson et al., 2004; Wolz et al., 2010), and temporal lobe volumes (Hua et
al., 2010), as well as ventricular enlargement (Jack et al., 2003; Shi et al., 2015;
Thompson et al., 2004; Wang et al., 2011). Since reductions in hippocampal and
entorhinal cortex volumes become apparent in the early stages of memory decline and
may anticipate progression to MCI and AD (de Leon et al., 1989; Jack et al., 2004),

3
hippocampal atrophy measures with structural MRI were one of the most studied brain
imaging biomarkers for early detection and tracking of AD. It is natural for us to develop
novel imaging measure of hippocampal morphometry which discovers the association
between APOE genotype and the structural MRI patterns of hippocampal deformation
and benefits preclinical AD research.
1.3 Thesis Overview
In our recent work (Shi et al., 2014), we automatically segmented and constructed
hippocampal surfaces from the baseline MR images of 725 subjects with known APOE
genotype information including 167 with AD, 354 with mild cognitive impairment (MCI),
and 204 normal controls. We also build high-order correspondences between
hippocampal surfaces and compute multivariate statistics consisting multivariate tensor-
based morphometry (mTBM) and radial distance. Using Hotelling’s T2 test, we found
significant morphological deformation in APOE e4 carriers relative to non-carriers in the
entire cohort as well as in the non-demented (pooled MCI and control) subjects, affecting
the left hippocampus more than the right, and this effect was more pronounced in e4
homozygotes than heterozygotes. In this paper, we extend our prior work (Shi et al., 2014)
to study a large dataset of brain MR images (N=1925) from the Alzheimer’s Disease
Neuroimaging Initiative (ADNI). To track the longitudinal hippocampal atrophy across
baseline, 6-month (N=724), 12-month (N=673) and 24-month (N=533) follow up scans,
we applied a novel surface multivariate tensor-based morphometry (mTBM) system (Shi
et al., 2013a; Shi et al., 2013q; Wang et al., 2012; Wang et al., 2011; Wang et al., 2010)
to create 3D maps of hippocampal atrophy associated with the APOE e4 genotype. We

4
hypnotized that (1) we may observe the similar patterns on different time points, 6-
months, 12-months and 24-months, as what we observed in the baseline study (Shi et al.,
2014); (2) the degree of hippocampal deformation would relate to genetic risk groups for
AD, particularly, the APOE e4 homozygotes may have a faster longitudinal hippocampal
atrophy.

5
2. SUBJECTS AND METHODS
2.1 Subjects
Data used in the preparation of this thesis were obtained from the Alzheimer’s
Disease Neuroimaging Initiative (ADNI) database (adni.loni.usc.edu). The ADNI was
launched in 2003 by the National Institute on Aging (NIA), the National Institute of
Biomedical Imaging and Bioengineering (NIBIB), the Food and Drug Administration
(FDA), private pharmaceutical companies and non-profit organizations, as a $60 million,
5-year public-private partnership. The primary goal of ADNI has been test whether serial
magneticreasonance imaging (MRI), positron emission tomography (PET), other
biological markers, and clinical and neuropsychological assessment can be combined to
measure the progression of mild cognitive impairment (MCI) and early Alzheimer’s
disease (AD). Determination of sensitive and specific markers of very early AD
progression is intended to aid researchers and clinicians to develop new treatments and
monitor their effectiveness, as well as lessen the time and cost of clinical trials.
The Principal Investigator of this initiative is Michael W. Weiner, MD, VA
Medical Center and University of California – San Francisco. ADNI is the result of
efforts of many co-investigators from a broad range of academic institutions and private
corporations, and subjects have been recruited from over 50 sites across the U.S. and
Canada. The initial goal of ADNI was to recruit 800 subjects but ADNI has been
followed by ADNI-GO and ADNI-2. To date these three protocols have recruited over
1500 adults, ages 55 to 90, to participate in the research, consisting of cognitively normal
older individuals, people with early or late MCI, and people with early AD. The follow
up duration of each group is specified in the protocols for ADNI-1, ADNI-2 and
6
ADNIGO. Subjects originally recruited for ADNI-1 and ADNI-GO had the option to be
followed in ADNI-2. For up-to-date information, see www.adni-info.org.
At the time of downloading (September 2011), the baseline dataset consisted of
843 adults, ages 55 to 90, including 233 elderly healthy controls (CTL), 410 subjects with
mild cognitive impairment (MCI) and 200 AD patients. The 6 month dataset consisted of
adults, ages 55 to 90, including 214 elderly healthy controls (CTL), 359 subjects with
mild cognitive impairment (MCI) and 165 AD patients. The 12 month dataset consisted
of adults, ages 55 to 90, including 203 elderly healthy controls (CTL), 338 subjects with
mild cognitive impairment (MCI) and 144 AD patients. The 24 month dataset consisted
of adults, ages 55 to 90, including 178 elderly healthy controls (CTL), 254 subjects with
mild cognitive impairment (MCI) and 111 AD patients. All subjects underwent thorough
clinical and cognitive assessment at the time of acquisition, including the Mini-Mental
State Examination (Folstein et al., 1975), Clinical Dementia Rating (CDR) (Berg, 1988),
and Delayed Logical Memory Test (Wechsler, 1987). APOE genotyping was performed
on DNA samples obtained from subjects’ blood, using an APOE genotyping kit, as
described in http://www.adni-info.org for detailed information on blood sample
collection, DNA preparation, and genotyping methods.
Participants were scanned with a standardized MRI protocol developed for this
cohort (Jack et al., 2008). We applied our hippocampal morphometry pipeline (Shi et al.,
2014; Shi et al., 2013a) to reconstruct hippocampal meshes (detailed in Sec. 2.3). As a
quality control, we manually checked all the constructed meshes. In 6-months data, we
manually excluded 3 subjects from CTL group , 6 subjects from MCI group and 5
subjects from AD group with wrong surface topologies (Shi et al., 2014; Shi et al.,
7
2013a). Similarly, in 12-months data, we manually excluded 3 subjects from CTL group,
8 subjects from MCI group, and 1 subject from AD group. In 24-months data, we
manually excluded 2 subjects from CTL group, 5 subjects from MCI group, and 3
subjects from AD group. As a result, a total of 1925 ADNI longitudinal brain MR scans,
including 211 controls (mean age is 76.41), 353 MCI (mean age is 75.06), and 160 AD
(mean age is 74.88) from the 6-months data, 200 controls (mean age is 76.38), 330 MCI
(mean age is 74.82), and 143 AD (mean age is 75.63) from the 12-months data, 176
controls (mean age is 76.44), 249 MCI (mean age is 74.75), and 108 AD (mean age is
75.17) from the 24-months data, were analyzed in the study. We also used their baseline
data as a reference to study the longitudinal effects. The baseline data information and
processing results were reported in our prior work (Shi et al., 2014). Table 1 gives
detailed demographic data information on the subjects.

8
APOE genotype
CON MCI AD Total
0 APOE e4 allele
N6 115(52) 127(44) 43(21) 285(117) N12 104(46) 120(41) 40(18) 264(105) N24 98(46) 90(33) 28(13) 216(92) Age 76.51(±4.91) 76.13(±7.53) 76.82(±8.55) 76.39(±6.75) MMSE 29.10(±1.13) 26.54(±3.36) 20.79(±5.00) 26.77(±4.06) 1 APOE e4 allele
N6 43(21) 125(44) 61(25) 229(90) N12 44(21) 117(41) 58(25) 219(87) N24 40(19) 86(26) 45(18) 171(63) Age 76.43(±4.42) 74.67(±6.65) 75.70(±6.06) 75.30(±6.13) MMSE 28.79(±2.92) 25.41(±3.59) 21.25(±4.66) 24.96(±4.69) 2 APOE e4 allele
N6 3(1) 41(18) 32(13) 76(32) N12 4(2) 39(16) 28(10) 71(28) N24 4(2) 31(12) 21(9) 56(23) Age 73.36(±2.92) 71.82(±5.74) 72.07(±6.91) 72.00(±6.13) MMSE 29.09(±1.58) 25.68(±3.31) 20.72(±5.23) 23.88(±4.92) Total N6 161(74) 293(106) 136(59) 590(239) N12 152(69) 276(98) 126(53) 554(220) N24 142(67) 207(71) 94(40) 443(178) Age 76.41(±4.76) 74.89(±7.07) 75.22(±7.31) 75.40(±6.58) MMSE 29.01(±1.82) 25.94(±3.49) 20.99(±4.89) 25.71(±4.52)
Table 1. Demographic data by diagnositic and genotype groups.
In Table 1, N6, N12, and N24 indicate sample size at 6-month, 12-month and 24-
month follow up cohorts, respectively. The number of women in the sample sizes are
indicated in parentheses. Means are followed by standard deviations in parentheses for
age and MMSE measures.
In our study, following prior work (Morra et al., 2009a; Morra et al., 2009c; Shi et
al., 2014; Shi et al., 2013a), we pooled both the subjects who are heterozygotes APOE e4

9
carriers (e3/e4) and homozygotes APOE e4 carriers (e4/e4) together to form the APOE e4
carriers group and correlated presence of the APOE e4 allele with hippocampal
morphometry, both (1) in the entire sample and (2) in non-demented (pooled MCI and
controls) subjects. Throughout the paper, we call these two populations as the full ADNI
cohort and non-demented cohort, respectively.
2.2 Processing Pipeline
Figure 1 summarizes the overall processing sequence. The original input data
were the three-dimensional (3D) T1-weighted images from ADNI dataset (6-months, 12-
months and 24-months), an example image is shown in Figure 1 (a). First, we used the
FIRST (FMRIB’s Integrated Registration and Segmentation Tool) software (Patenaude et
al., 2011) to segment the original data and got the hippocampus substructure. The
hippocampal surfaces were automatically reconstructed based on binary segmentation
results (Shi et al., 2014; Shi et al., 2013a). Second, we generated a conformal grid for
each surface with the holomorphic 1-form based on the surface conformal
parameterization (Wang et al., 2011). With the help of conformal grid, we can compute
the conformal factor (intrinsic features of the surface) and mean curvature (extrinsic
features of the surface), which are the conformal representation of the surface (Shi et al.,
2014; Shi et al., 2013a). And then, we can take advantage of conformal factor and mean
curvature to compute the “feature image” of a surface. Thirdly, registering the feature
image of each surface in the dataset to a common template with an inverse consistent
fluid registration algorithm. With conformal parameterization, the 3D surface registration
problem was converted into a 2D image registration problem. The flow induced in the

10
parameter domain establishes high-order correspondences between 3D surfaces. Finally,
we studied the longitudinal differences between different diagnostic groups with the
multivariate tensor-based morphometry (mTBM) statistics (Wang et al., 2010) which
retain the full tensor information of the deformation Jacobian matrix, together with the
radial distance, which retains information on the deformation along the surface normal
direction. The similar processing pipeline was used in several of our prior work (Joshi et
al., 2015; Lao et al., 2014; Shi et al., 2014; Shi et al., 2013q; Wang et al., 2011; Wang et
al., 2013).

11
Figure 1. Overall processing sequence
In Figure 1, (a): Longitudinal data (6-months, 12-months and 24-months) were
obtained from the Alzheimer’s Disease Neuroimaging Initiative (ADNI) database; (b)
automatic hippocampus segmentation with FIRST software (Patenaude et al., 2011); (c)
hippocampal surface reconstruction with marching cube method (Lorensen and Cline,
1987); (d) hippocampal surface conformal parameterization with holomorphic 1-forms
(Wang et al., 2007c); (e) groupwise inverse consistent surface fluid registration of
hippocampal surfaces (Shi et al., 2013a); (f) multivariate statistics (Wang et al., 2010)
consisting of radial distance and multivariate TBM; (g) longitudinal genetic influence of
APOE e4 allele on hippocampal morphometry.
2.3 Hippocampus Segmentation and Surface Modeling
In the process of segmentation, we used FIRST (Patenaude et al., 2011) to
automatically all T1-weighted MR images. FIRST is a model based subcortical structure
segmentation and registration tool developed as part of the FSL library, which is written
mainly by members of the Analysis Group, FMRIB, Oxford, UK. The shape/appearance
models used in FIRST are constructed from manually segmented images provided by the
Center for Morphometric Analysis (CMA), MGH, Boston. With the FIRST, we ran the
run_first_all routine with default parameters tuned by FIRST as optimal for hippocampal
segmentation. For now, we took three-phase image which contains the labels of the left
and right hippocampi. The binary image of each side of hippocampus was obtained by a
simple thresholding process. Figure 1 (b) shows an example of segmented hippocampus
substructure. Then hippocampal surfaces were constructed with a topology-preserving
12
level set method (Han et al., 2003), which is based on the binary segmentations, and we
can obtain the triangular surface meshes by using the marching cubes algorithm
(Lorensen and Cline, 1987). After mesh refinement (Shi et al., 2014; Shi et al., 2013a),
we obtained smooth surfaces that are suitable for generating conformal grids. Finally,
with the help of global affine transformation with a nine-parameter (three parameters for
translation, three parameters for rotation, and three parameters for scaling) matrix that
was computed by FIRST, the smoothed meshes were aligned into the MNI standard space.
Figure 1 (c) shows a pair of reconstructed hippocampal surfaces.
2.4 Conformal Grid Generation and Conformal Representation
To facilitate hippocampal shape analysis, we generated a conformal grid on each
surface, which is used as a canonical space for surface registration and multivariate
statistical analysis. We applied an automatic topological optimization algorithm to
introduce two cuts on each hippocampal surface to convert it into a genus zero surface
with two open boundaries (Shi et al., 2014; Shi et al., 2013a). The locations of the two
cuts are at the front and back of the hippocampal surface, representing its anterior
junction with the amygdala, and its posterior limit as it turns into the white matter of the
fornix. They are biologically valid and consistent landmarks across subjects. Given the
hippocampal tube-like shape, these landmark curves are automatically determined by
checking the extreme points when searching along the first principle direction of
geometric moments of surface (Elad et al., 2004; Wang et al., 2011; Zhang and Lu, 2004).
For quality control purposes, we have manually checked the consistency of all landmark
curves. On each hippocampal surface, we compute harmonic 1-form basis which is the

13
union of the exact 1-form basis and closed but non-exact 1 form basis (Wang et al., 2007c;
Wang et al., 2010). By solving a linear system with the harmonic 1-form basis, we
obtained the conjugate of the exact 1-form basis. The exact 1-form basis and its conjugate
1-form form the holomorphic 1-form basis, which induces a conformal grid on the
hippocampal surface. Figure 1 (d) shows an example hippocampal surface with its exact
1-form basis, conjugate 1-form basis and holomorphic 1-form basis and its rectangular
parameter domain. In the picture, the overlaid texture is used to demonstrate the
computed 1-form bases. The checkboard texture is used to show the angle preserving
property, i.e. the right angles on the planar checkerboard texture are well preserved after
they are overlaid on hippocampal surfaces.
We adopted surface conformal representation (Shi et al., 2014; Shi et al., 2013a)
as surface geometric features for automated surface registration. It is consisted of
conformal factor and mean curvature, encoding both intrinsic surface structure and 3D
embedding information. Specifically, the conformal factor describes the intrinsic surface
features while the mean curvature describes the extrinsic features. They uniquely
determine a 3D closed surface up to a rigid motion. Both measurements, the conformal
factor and mean curvature, are local features which are defined on each surface vertex.
The conformal factor is the area ratio of an infinitesimal region around a point on the
surface and an infinitesimal region around the same point on the planar parameter domain.
The mean curvature is the average of the two principle curvatures defined on each surface
point. After we computed these two local features on each surface point, we computed
their summation and then linearly scaled the dynamic range of the summation into [0,
255] to get the feature image of the surface.

14
2.5 Hippocampal Surface Registration
In order to do the longitudinal morphometric analysis, we need to register each
individual hippocampal surface to a common template surface. With surface conformal
parameterization and conformal representation, we converted the 3D surface registration
problem into a 2D image registration problem. The well-studied image fluid registration
algorithm (Bro-Nielsen and Gramkow, 1996; D'Agostino et al., 2003) can be easily
applied to induce a deformation flow in the parameter domain, which in turn enforces a
high-order correspondence in 3D. In order to compensate for the parameterization area
distortion, we introduced a correction term in the traditional Navier–Stokes equation.
With conformal parameterization, the correction term was simply the conformal factor
and the surface fluid registration can be easily developed by extending the Navier–Stokes
equation to drive flows on general surfaces, regardless of the underlying
parameterizations. This method is called surface fluid registration (Shi et al., 2013a).
Furthermore, most image registration algorithms in the literature are not
symmetric, i.e., the correspondences established between the two images depend on
which image is assigned as the deforming image and which is the non-deforming target
image. An asymmetric algorithm can be problematic as they tend to penalize the
expansion of image regions more than shrinkage (Rey et al., 2002). Thus, in our system,
we further extended the surface fluid registration method into an inverse consistent
framework (Leow et al., 2005). The obtained surface registration is diffeomorphic. For
details of our inverse consistent surface fluid registration method, we refer to (Shi et al.,
2013a).

15
2.6 Surface Multivariate Morphometry Statistics
Our multivariate morphometry statistical analysis consists of multivariate tensor-
based morphometry (mTBM) (Shi et al., 2014; Shi et al., 2013a; Wang et al., 2011;
Wang et al., 2010) and radial distance analysis (Pizer et al., 1999; Thompson et al., 2004).
This combines complementary information from mTBM, which measures deformation
within surfaces, and radial distance, which measures hippocampal size in terms of the
surface normal direction.
The mTBM statistics have been carefully studied in brain structure morphology
analyses and they can demonstrate improved signal detection power relative to more
standard Jacobian matrix statistics (Shi et al., 2013a; Shi et al., 2013q; Wang et al., 2012;
Wang et al., 2011; Wang et al., 2013). As mTBM retains the full information in the
deformation tensor fields, it is very sensitive to deformations such as rotation, dilation,
and shear along the surface tangent direction, which is perpendicular to the surface
normal. Given the hippocampal tube-like shape, its atrophy and enlargement directly
affect the distance from each surface point to its medial core (analogous to the center line
in a tube). We call this distance the radial distance of a hippocampal surface. Radial
distance mainly describes morphometric changes along the surface normal direction and
has been applied in many subcortical studies (Bansal et al., 2000; Gerig et al., 2001;
Morra et al., 2009c; Pizer et al., 1999; Thompson et al., 2004). Thus, these two statistics
are complementary to each other. In this paper, we adopted the multivariate statistics
proposed in (Wang et al., 2011) to study shape differences between groups with different
diagnosis, APOE e4 dose, and healthy controls.

16
As in our prior work (Wang et al., 2011), the mTBM was computed as a 3×1
vector consisting of the “Log-Euclidean metric” (Arsigny et al., 2006), computed as the
matrix logarithm of the deformation tensor. Given a hippocampal surface with the
conformal parameterization as described in Sec. 2.4, the radial distance was computed as
the distance from each parametric surface point to the center of 3D positions of the iso-u
curves in the parameter domain (Wang et al., 2011), as shown by the red curves in
Figure 1 (f). We formed the new multivariate surface morphometry statistic as a 4×1
vector consisting of the mTBM and radial distance.
2.7 Statistical Group Difference
To assess group differences with multivariate statistics, we applied Hotelling's 2T
test (Cao and Worsley, 1999; Hotelling, 1931; Kim et al., 2012b; Thirion et al., 2000) on
sets of values in the log-Euclidean space of the deformation tensors. For each surface
vertex, given two groups of 4×n -dimensional vectors, 𝑆! , 𝑖 = 1,2,… ,𝑝,𝑇! , 𝑗 = 1,2,… , 𝑞,
we used the Mahalanobis distance 𝑀 to measure the group mean difference,
𝑀 = !!!!!!!!!
𝑆 − 𝑇 !∑!! 𝑆 − 𝑇 .
where 𝑁! and 𝑁! are the numbers of subjects in the two groups, 𝑆 and 𝑇 are the means of
the two groups and ∑ is the combined covariance matrix of the two groups (Leporé et al.,
2008; Wang et al., 2011; Wang et al., 2010).
Specifically, for each hippocampal surface point, we ran a permutation test with
10,000 random assignments of subjects to different groups to estimate the statistical
significance of the areas with group difference in surface morphometry. We also used a

17
pre-defined statistical threshold of 𝑝 = 0.05 at each surface point to estimate the overall
significance of the group difference maps by non-parametric permutation testing (Holmes
et al., 1996; Nichols and Holmes, 2002). In each case, the covariate (group membership)
was permuted 10,000 times and a null distribution was developed for the area of the
average surface with group difference statistics above the pre-defined threshold in the
significance map. The overall significance of the map is defined as the probability of
finding, by chance alone, a statistical map with at least as large a surface area beating the
pre-defined statistical threshold of 𝑝 = 0.05. This omnibus p-value is commonly referred
to as the overall significance of the map (or the features in the map), corrected for
multiple comparisons. It basically quantifies the level of surprise in seeing a map with
this amount of the surface exceeding a pre-defined threshold, under the null hypothesis of
no systematic group differences. The permutation test on the overall rejection areas is
used to evaluate the significance of overall experimental results and correct the overall
significant p-values for multiple comparisons. Figure 1 (g) shows an example of the
significance p-map with uncorrected p-values, which is used to visualize the surface
regions with significant differences between groups.

18
3. RESULTS
Similar to our prior work (Shi et al., 2014), we mainly focused on studying the
effects of APOE e4 genotype on hippocampal morphometry in two populations: (1). the
full ADNI cohort; (2) the non-demented cohort, i.e., patients of MCI and normal control
subjects. Subjects with one e2 allele, i.e., e2/e3 and e2/e4 were excluded due to the
possible protective effect of e2 allele for AD (Morra et al., 2009c; Shi et al., 2014). To
explore whether APOE e4 allele dose affects hippocampal surface morphometry and how
this atrophy is related to normal aging, we studied hippocampal morphometry between
persons homozygotes for the APOE e4 allele and those heterozygotes for this allele. We
studied group differences between heterozygotes and homozygotes APOE e4 subjects in
the full ADNI cohort, and in the nondemented APOE e4 carrier cohort in ADNI 6-month,
12-month and 24-month follow up datasets. The experiments aimed to determine if the
APOE e4 allele was associated with hippocampal atrophy in all subjects or in subjects
who have not yet developed AD.
3.1 Results on the Full ADNI Cohort
3.1.1 Effects of APOE e4 genotype
To explore whether the presence of the APOE e4 allele was associated with
greater hippocampal atrophy, we study the effects of APOE e4 genotype in three follow
up cohorts. In the 6-month follow up, there were 285 non-carriers (all homozygotes for
APOE e3, e3/e3) and 305 APOE e4 carriers (e3/e4 and e4/e4). In the 12-month follow up,
there were 265 non-carriers (e3/e3) and 290 APOE e4 carriers (e3/e4 and e4/e4). In the
24-month follow up, there were 218 non-carriers (e3/e3) and 226 APOE e4 carriers

19
(e3/e4 and e4/e4). Figure 2 shows the statistical p-maps for these 3 different follow up
time points, specifically, (a) for 6-month follow up (N=590, 285 non-carriers vs. 305
carriers), (b) for 12-month follow up (N=555, 265 non-carriers vs. 290 carriers), and (c)
for 24-month follow up (N=444, 218 non-carriers vs. 226 carriers). Non-blue colours
show vertices with statistical differences at the nominal 0.05 level, uncorrected for
multiple comparisons. After correcting for multiple comparisons, the differences
remained highly significant (p<0.0001 for 6-month, p<0.0001 for 12-month, p<0.0005
for 24-month).
Figure 2. Illustration of local shape differences (P values) between the APOE e4
noncarriers (e3/e3) and carriers (e3/e4 and e4/e4) in the full ADNI cohort.
3.1.2 APOE e4 dose effects: group difference between APOE e4 homozygotes and APOE e4 heterozygotes
To explore whether APOE e4 allele dose affects hippocampal surface
morphometry and how this atrophy is related to normal aging, we studied hippocampal
morphometry between persons homozygotes for the APOE e4 allele and those
heterozygotes for this allele in three follow up cohorts. In the 6-month follow up cohort,
76 subjects were homozygotes (e4/e4) and 229 were heterozygotes (e3/e4) for APOE e4
allele. In the 12-month follow up cohort, 71 subjects were homozygotes (e4/e4) and 219
were heterozygotes (e3/e4) for APOE e4 allele. In the 24-month follow up cohort, 56

20
subjects were homozygotes (e4/e4) and 170 were heterozygotes (e3/e4) for APOE e4
allele. Figure 3 shows the statistical p-maps for these 3 different follow up time points,
specifically, (a) for 6-month follow up (N=305, 76 e4 homozygotes vs. 229 e4
heterozygotes), (b) for 12-month follow up (N=290, 71 e4 homozygotes vs. 219
heterozygotes), and (c) for 24-month follow up (N=226, 56 e4 homozygotes vs. 170
heterozygotes). Non-blue colours show vertices with statistical differences at the nominal
0.05 level, uncorrected for multiple comparisons. After correcting for multiple
comparisons, the differences remained significant for the 6- and 12-month cohort but not
for the 24-month cohort. (p<0.0117 for 6-month, p<0.0024 for 12-month, p<0.0959 for
24-month).
Figure 3. Illustration of local shape differences (P values) between the heterozygotes
APOE e4 carriers (e3/e4) and the homozygotes APOE e4 carriers (e4/e4) in the full
ADNI cohort.
3.1.3 APOE e4 dose effects: group difference between APOE e4 homozygotes and APOE e4 non-carriers
We also studied hippocampal morphometry between persons homozygotes for the
APOE e4 allele and the APOE e4 non-carriers. In the 6-month follow up cohort, there
were 76 e4 homozygotes (e4/e4) and 285 e4 non-carriers (all homozygotes for APOE e3,
e3/e3). In the 12-month follow up cohort, there were 71 homozygotes (e4/e4) and 265

21
noncarriers (e3/e3). In the 24-month follow up cohort, there were 56 homozygotes (e4/e4)
and 218 noncarriers (e3/e3). Figure 4 shows the statistical p-maps for these 3 different
follow up time points, specifically, (a) for 6-month follow up (N=361, 76 e4
homozygotes vs. 285 non-carriers), (b) for 12-month follow up (N=336, 71 e4
homozygotes vs. 265 non-carriers), and (c) for 24-month follow up (N=274, 56 e4
homozygotes vs. 170 non-carriers). Non-blue colours show vertices with statistical
differences at the nominal 0.05 levels, uncorrected for multiple comparisons. After
correcting for multiple comparisons, the differences remained significant for all three
cohorts. (p<0.0001 for 6-month, p<0.0001 for 12-month, p<0.0001 for 24-month).
Figure 4. Illustration of local shape differences (P values) between the APOE e4
noncarriers (e3/e3) and the homozygotes APOE e4 carriers (e4/e4) in the full ADNI
cohort.
3.1.4 APOE e4 dose effects: group difference between APOE e4 heterozygotes and APOE e4 non-carriers
We further studied hippocampal morphometry between persons heterozygotes for
the APOE e4 allele and the APOE e4 non-carriers. In the 6-month follow up cohort, there
were 229 APOE e4 heterozygotes (e3/e4) and 285 e4 non-carriers (all homozygotes for
APOE e3, e3/e3). In the 12-month follow up cohort, there were 219 heterozygotes (e3/e4)
and 265 non-carriers (e3/e3). In the 24-month follow up cohort, there were 170

22
heterozygotes (e3/e4) and 218 non-carriers (e3/e3). Figure 5 shows the statistical p-maps
for these 3 different follow up time points, specifically, (a) for 6-month follow up
(N=514, 229 e4 heterozygotes vs. 285 non-carriers), (b) for 12-month follow up (N=484,
219 e4 heterozygotes vs. 265 non-carriers), and (c) for 24-month follow up (N=388, 170
e4 heterozygotes vs. 218 non-carriers). Non-blue colours show vertices with statistical
differences at the nominal 0.05 level, uncorrected for multiple comparisons. After
correcting for multiple comparisons, the differences remained significant for all three
cohorts. (p<0.0116 for 6-month, p<0.0039 for 12-month, p<0.0003 for 24-month).
Figure 5. Illustration of local shape differences (P values) between the APOE e4
noncarriers (e3/e3) and the heterozygotes APOE e4 carriers (e3/e4) in the full ADNI
cohort.
3.2 Results on the Non-demented ADNI Cohort
3.2.1 Effects of APOE e4 genotype
In the 6-month follow up non-demented cohort, there were 242 APOE e4 non-
carriers (all homozygotes for APOE e3, e3/e3) and 212 e4 carriers (e3/e4 and e4/e4). In
the 12-month follow up non-demented cohort, there were 225 non-carriers (e3/e3) and
204 e4 carriers (e3/e4 and e4/e4). In the 24-month follow up non-demented cohort, there
190 noncarriers (e3/e3) and 160 e4 carriers (e3/e4 and e4/e4). Figure 6 shows the
23
statistical p-maps for these 3 different follow up time points, specifically, (a) for 6-month
follow up (N=454, 242 non-carriers vs. 212 e4 carriers), (b) for 12-month follow up
(N=429, 225 non-carriers vs. 204 e4 carriers), and (c) for 24-month follow up (N=350,
190 non-carriers vs. 160 e4 carriers). Non-blue colours show vertices with statistical
differences at the nominal 0.05 level, uncorrected for multiple comparisons. After
correcting for multiple comparisons, the differences remained significant for all three
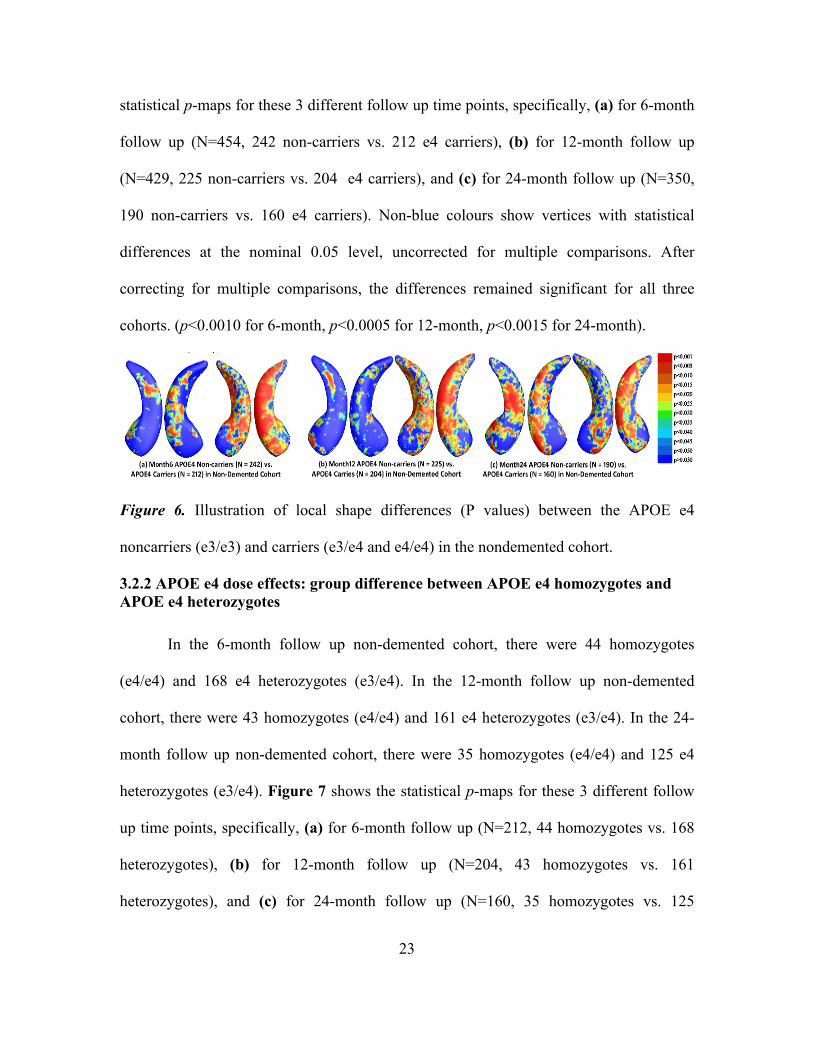
cohorts. (p<0.0010 for 6-month, p<0.0005 for 12-month, p<0.0015 for 24-month).
Figure 6. Illustration of local shape differences (P values) between the APOE e4
noncarriers (e3/e3) and carriers (e3/e4 and e4/e4) in the nondemented cohort.
3.2.2 APOE e4 dose effects: group difference between APOE e4 homozygotes and APOE e4 heterozygotes
In the 6-month follow up non-demented cohort, there were 44 homozygotes
(e4/e4) and 168 e4 heterozygotes (e3/e4). In the 12-month follow up non-demented
cohort, there were 43 homozygotes (e4/e4) and 161 e4 heterozygotes (e3/e4). In the 24-
month follow up non-demented cohort, there were 35 homozygotes (e4/e4) and 125 e4
heterozygotes (e3/e4). Figure 7 shows the statistical p-maps for these 3 different follow
up time points, specifically, (a) for 6-month follow up (N=212, 44 homozygotes vs. 168
heterozygotes), (b) for 12-month follow up (N=204, 43 homozygotes vs. 161
heterozygotes), and (c) for 24-month follow up (N=160, 35 homozygotes vs. 125

24
heterozygotes). Non-blue colours show vertices with statistical differences at the nominal
0.05 level, uncorrected for multiple comparisons. After correcting for multiple
comparisons, the differences only remained significant for 12-month cohort (p<0.0204)
and not for the other two cohorts (p<0.1351 for 6-month, p<0.1870 for 24-month).
Figure 7. Illustration of local shape differences (P values) between the heterozygotes
APOE e4 carriers (e3/e4) and the homozygotes APOE e4 carriers (e4/e4) in the
nondemented cohort.
3.2.3 APOE e4 dose effects: group difference between APOE e4 homozygotes and APOE e4 non-carriers
In the 6-month follow up non-demented cohort, there were 44 e4 homozygotes
(e4/e4) and 242 e4 non-carriers (all homozygotes for APOE e3, e3/e3). In the 12-month
follow up non-demented cohort, there were 43 homozygotes (e4/e4) and 225 e4 non-
carriers (e3/e3). In the 24-month follow up non-demented cohort, there were 35
homozygotes (e4/e4) and 190 e4 non-carriers (e3/e3). Figure 8 shows the statistical p-
maps for these 3 different follow up time points, specifically, (a) for 6-month follow up
(N=286, 44 homozygotes vs. 242 non-carriers), (b) for 12-month follow up (N=268, 43
homozygotes vs. 225 non-carriers), and (c) for 24-month follow up (N=225, 35
homozygotes vs. 190 non-carriers). Non-blue colours show vertices with statistical
differences at the nominal 0.05 level, uncorrected for multiple comparisons. After

25
correcting for multiple comparisons, the differences remained significant for 6- and 12-
month cohorts (p<0.0035 for 6-month and p<0.0010 for 12-month) but not for 24-moth
cohorts (p<0.0770 for 24-month).
Figure 8. Illustration of local shape differences (P values) between the APOE e4
noncarriers (e3/e3) and the homozygotes APOE e4 carriers (e4/e4) in the nondemented
cohort.
3.2.4 APOE e4 dose effects: group difference between APOE e4 heterozygotes and APOE e4 non-carriers
In the 6-month follow up non-demented cohort, there were 168 e4 heterozygotes
(e3/e4) and 242 e4 non-carriers (all homozygotes for APOE e3, e3/e3). In the 12-month
follow up non-demented cohort, there were 161 e4 heterozygotes (e3/e4) and 225 e4 non-
carriers (e3/e3). In the 24-month follow up non-demented cohort, there were 125
heterozygotes (e3/e4) and 190 e4 non-carriers (e3/e3). Figure 9 shows the statistical p-
maps for these 3 different follow up time points, specifically, (a) for 6-month follow up
(N=410, 168 heterozygotes vs. 242 non-carriers), (b) for 12-month follow up (N=386,
161 homozygotes vs. 225 non-carriers), and (c) for 24-month follow up (N=315, 125
heterozygotes vs. 190 non-carriers). Non-blue colours show vertices with statistical
differences at the nominal 0.05 level, uncorrected for multiple comparisons. After
correcting for multiple comparisons, the differences remained significant for 6- and 24-

26
month cohorts (p<0.0058 for 6-month and p<0.0110 for 24-month) but not for 12-moth
cohorts (p<0.1191 for 12-month).
Figure 9. Illustration of local shape differences (P values) between the APOE e4
noncarriers (e3/e3) and the heterozygotes APOE e4 carriers (e3/e4) in the nondemented
cohort.
3.3 Results on the Arizona APOE Cohort
Besides the ADNI data, we also used the longitudinal volumetric MRI data from a
subset of health study participants with 0, 1 or 2 copies of APOE e4 alleles, obtained at
the BAI (Banner Alzheimer’s Institute).
This BAI dataset includes two scan cohorts: subjects had their follow up scans
two years after their baseline ones. Subjects with one e2 allele, i.e., e2/e3 and e2/e4, are
excluded from our study due to the possible protective effect of e2 allele for AD. As a
result, the baseline scan cohort had data from 152 subjects, including 57 non-carriers of
e4 (e3/e3, mean age is 57.47), 45 heterozygous subjects (e3/e4, mean age is 56.51) and
33 homozygous subjects (e4/e4, mean age is 56.51). The follow up scan cohort had data
from 123 subjects, including 43 non-carriers of e4 (e3/e3, mean age is 57.47), 38
heterozygous subjects (e3/e4, mean age is 56.86) and 27 homozygous subjects (e4/e4,
mean age is 56.02).

27
In both first and second cohorts, we found no cognitive performance differences
among the 3 groups. We also did not find any significant differences between groups in
the first scan cohort. Figure 10 shows the statistical p-maps for these 3 different group
differences of the second scan. In the second scan, (a) we found significant differences
between the APOE e4 non-carriers (e3/e3) and carriers (e3/e4 and e4/e4) overall at the
left hippocampus (p =0.0086), but not in right part (p =0.5489). (b) Similar only left
hippocampal significant differences held between the APOE e4 non-carriers (e3/e3) and
the APOE e4 heterozygotes (e3/e4) (p = 0.0165), (c) and between the APOE e4 non-
carriers (e3/e3) and the APOE e4 homozygotes (e4/e4) of the left part of hippocampus (p
=0.0192) but not in right side (p = 0.4778, p = 0.0916 for heterozygotes and homozygotes
respectively compared to non-carriers).
Figure 10. Illustration of local shape differences (P values) of BAI second scan.
3.4 Cumulative Distribution Functions of the p-values in the Statistical p-maps
In Figure 11, we organized some cumulative distribution functions (CDF) of the
p-values observed in four group difference experiments in the full ADNI cohort.
Specifically, we chose those experimental results that passed the permutation based
multiple comparison tests (i.e., after correcting for multiple comparisons, p<0.05). Since
there are too few homozygote samples in the 24-moth follow up cohort (56 subjects in

28
the full ADNI cohort), we also excluded the CDF from the 24-month follow up cohort.
The CDFs of p-values are plotted against the corresponding p-value that would be
expected, under the null hypothesis of no group difference, for all above experiments
shown in Figures 11. For null distributions, the cumulative distribution of p-values is
expected to fall approximately along the dotted line. Large deviations from that curve are
associated with significant signal, and greater effect sizes represented by larger deviations.
The theory of false discovery rates (FDR) (Benjamini and Hochberg, 1995) gives
formulae for thresholds that tend to control false positives at a known rate. This protocol
was adopted in several of our prior papers (Shi et al., 2014; Shi et al., 2013a; Shi et al.,
2013q; Wang et al., 2015b; Wang et al., 2011; Wang et al., 2013; Wang et al., 2010) as
an empirical standard to compare effects in group difference analysis. We note that the
deviation of the statistics from the null distribution generally increases longitudinally
from 6-month, to 12-month and 24 month data in the full ADNI cohort. It shows that the
continually accelerated atrophy between APOE e4 carriers and non-carriers (Figure 11
(a)), APOE e4 heterozygotes and homozygotes (Figure 11 (b)) and APOE e4
heterozygotes, homozygotes and APOE e4 non-carriers (Figure 11 (c) and (d),
respectively).

29
Figure 11. Cumulative Distribution Function (CDF) plots comparison.
Following our prior work (Shi et al., 2014), we drew some CDFs of the p-values
observed in group difference between e4 homozygotes and non-carriers and e4
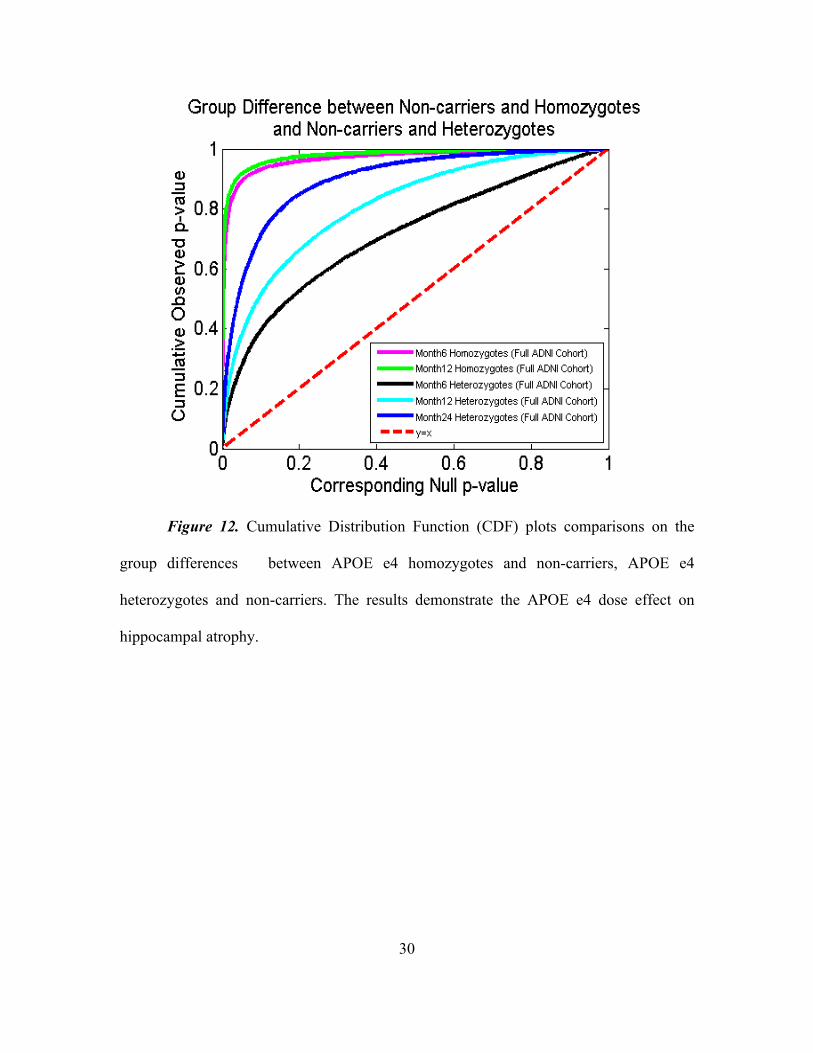
heterozygotes and non-carriers in the full ADNI cohort as shown in Figure 12. From the
CDF plots, we can observe the trend that all follow up cohorts, APOE e4 homozygotes
appear to differ more from non-carriers than do e4 heterozygotes, so does the results from
6-month follow up cohort. Such a simple empirical comparison may suggest a clear
APOE e4 dose effect in our longitudinal study.
30
Figure 12. Cumulative Distribution Function (CDF) plots comparisons on the
group differences between APOE e4 homozygotes and non-carriers, APOE e4
heterozygotes and non-carriers. The results demonstrate the APOE e4 dose effect on
hippocampal atrophy.

31
4. DISCUSSION
In our current work, with the full ADNI cohort, we found statistical significance
between e4 carriers and non-carriers on all three follow up cohorts (Figure 2), e4
homozygotes and heterozygotes on 6- and 12-month follow up cohorts but not on 24-
month follow up cohort (Figure 4), e4 homozygotes and non-carriers on all three follow
up cohorts (Figure 6), e4 heterozygotes and non-carriers on all three follow up cohorts
(Figure 8). Also, from the CDF shown in Figure 11, we can observe the trend that the
group differences roughly appear to be sharper as time goes, except two group
differences involving e4 homozygotes on the 24-month cohort. Our results are consistent
with our observations on the baseline cohort (Shi et al., 2014) and another prior work
(Pievani et al., 2011) in a relatively small dataset (, suggesting a clear relationship
between APOE genotype and hippocampal atrophy in full ADNI cohort at all four time
points. On the other hand, some prior work (e.g. (Crivello et al., 2010; Lemaitre et al.,
2005; Lyall et al., 2013; Protas et al., 2013; Soininen et al., 1995)) reported no APOE e4
gene dose effect on hippocampal atrophy. In a relatively large imaging cohort (N=1925),
we found that in the full ADNI cohort, the APOE e4 dose is associated with greater
hippocampal deformation (Figure 12). Although more rigorous statistical tests are
certainly necessary, from the p-maps and CDF plots, we can observe the trend that in
these groups shown in Figure 12, APOE e4 homozygotes appear to differ more from
non-carriers than do e4 heterozygotes. Our findings confirm and extend our observation
that the APOE e4 dose is associated with great hippocampal deformation, and they
support that sMRI hippocampal morphometry measure may become a valid imaging
biomarkers to track AD progression and intervention.

32
Consistent with our prior study on non-demented ADNI cohort (Shi et al., 2014),
our studied detected significant difference in most of group differences on non-demented
ADNI cohorts, except for homozygotes vs. heterozygotes on 6- and 24-month follow up
cohorts, heterozygotes and non-carriers on 12-month follow up cohort and homozygotes
and non-carriers on 24-month follow up cohorts. However, the effects of homozygotes on
regional patterns of hippocampal morphometry at 24-month follow up did not pass the
permutation tests when comparing with heterozygotes or non-carriers, probably as a
results of insufficient statistical power, as sample sizes were much smaller (N=35) only
than other subjects numbers. We found significant differences between e4 homozygotes
and heterozygotes on 12-month follow up non-demented cohorts, e4 homozygotes and
non-carriers on the 6- and 12-month follow up non-demented cohorts. Note that, in our
prior work (Shi et al., 2014), we did not detect difference between homozygotes and
heterozygotes on the baseline non-demented cohort. Here we detected increasing
difference comparing homozygotes with heterozygotes on 12-month follow up non-
demented cohort, homozygotes and non-carriers on both 6- and 12-month follow up non-
demented cohorts. It supports our hypothesis that the homozygotes may have an
accelerated atrophy comparing with two other groups and there exists an association
between APOE does and hippocampal deformation for non-demented population. The
fact that we detected statistical difference between heterozygotes and non-carriers on
both baseline and 6-month follow up non-demented cohort while not in 12-month follow
up non-demented cohort, may suggest that the decreasing of hippocampal volume is also
associated with normal aging. However, for a complete understanding of the longitudinal

33
APOE dose effect on non-demented population, we still need more systematic validation
and comparison studies.
Prior work (Cohen et al., 2001; Farrer et al., 1997; Lemaitre et al., 2005; O'Dwyer
et al., 2012) found greater differences on the right hippocampus when comparing
heterozygotes and homozygotes APOE e4 groups with non-carriers. In contrast, our
results suggest carriers, heterozygotes and homozygotes APOE e4 patients have greater
deformities for the left than the right hippocampus when comparing with non-carriers. By
contrast with comparisons of APOE e4 carriers vs. non-carriers, differences between the
heterozygotes and homozygotes APOE e4 groups were greater on the right side than on
the left. Our results are consistent with some prior work (Morra et al., 2009c; Pievani et
al., 2011; Shi et al., 2014). They may suggest that the APOE e4 dose effects start from
the left side and further extend to the right side when considering people at 3 levels of
genetic risk for AD by carrying 0, 1, or 2 copies of the APOE e4 allele.
To our knowledge, it is the first study to apply a surface-based approach to study
the longitudinal APOE e4 gene dose effects on hippocampal morphometry differences
among subjects with different genetic risk levels for late-onset AD. Prior work (Morra et
al., 2009c; Qiu et al., 2009; Roussotte et al., 2014a; Roussotte et al., 2014e; Shi et al.,
2014) has demonstrated that surface based subregional structure analysis may offer
additional benefits, such as better visualization and increased statistical power, for
genetic influence analysis.
There is an ever growing variety of methods for examining the structure and
function of the hippocampus via in vivo MR images (de Flores et al., 2015; Hao et al.,
2014). Extensive studies have focused on examining the subfields of the hippocampal

34
formation and subregions of the parahippocampal gyrus (Van Leemput et al., 2009;
Wang et al., 2006; Wang et al., 2003; Yassa et al., 2010; Yushkevich et al., 2015a;
Yushkevich et al., 2015b), which segment hippocampus into different regions and
analyze the volume and shape changes of these subfields. These methods compute
volumetric image registration between template and individual subject and translate and
visualize the deformation on surfaces. Surface-based hippocampal shape analyses rely
primarily on two components. First, to build an appropriate representation and
correspondence between hippocampal shapes. Second, to carry out group analysis based
within this common domain. Surface parameterization methods (Brechbühler et al., 1995;
Gu et al., 2004; Wang et al., 2007c) play an important role to build a canonical space to
match hippocampal surfaces. When the canonical space is a sphere, the spherical
harmonic functions (SPHARM) based approaches (Gutman et al., 2009; Shen et al., 2009;
Styner et al., 2004) use the coefficients of the harmonic expansion to infer shape
differences between patient groups and controls. Another group of methods is aimed to
build dense correspondence between surfaces (Csernansky et al., 2000; Wang et al.,
2007a; Wang et al., 2011). For example, the Large Deformation Diffeomorphic Metric
Mapping (LDDMM) (Joshi and Miller, 2000) has been used to deform labeled
anatomical templates of the hippocampus onto new images, using a combination of
manual land marking of points on the hippocampus and 3D fluid image registration
(Csernansky et al., 2000; Haller et al., 1996; Wang et al., 2007a). Other dense mapping
methods registered hippocampal surfaces with surface geometric features (Apostolova et
al., 2010; Cho et al., 2011; Morra et al., 2009a; Qiu et al., 2009; Shi et al., 2013a;
Thompson et al., 2004). For group difference analysis, while some work used single low

35
dimensional feature vector (Kim et al., 2012a; Wachinger et al., 2015; Yang et al., 2013),
other detailed local geometric features such as medial distance (Thompson et al., 2004),
the LDDMM metric (Younes et al., 2014), and tensor-based morphometry (Wang et al.,
2011) were also widely adopted for detailed statistical shape analysis. This type of
methods affords the benefits of high resolution information from the hippocampal surface
representation and efficient numerical solutions to register and analyze surface
deformation across subjects.
Another important way studying APOE e4 dose effect is to investigate the
correlation between number of APOE e4 alleles and multivariate statistics using linear
discriminant analysis-based model (Chen et al., 2007; Roussotte et al., 2014a), depicting
relationships between number of APOE e4 alleles (0, 1 or 2) and multivariate statistics of
the left hippocampal surfaces. With normal group mean as the average, we first converted
our multivariate statistics to a univariate index with the Mahalanobis distance. We
applied a linear regression to study the correlation where the number of APOE e4 alleles
as the predictor and the difference between the follow up and the baseline of the
univariate index data as the outcome variable. Our experiment showed that carrying more
APOE e4 alleles was associated with hippocampal surface atrophy, and this association
was more widespread and more significant at 24-month than at 6-month (but not at 12-
month). In Figure 13 (a), (b), blue to red hues indicate regions where higher APOE e4
loading is associated with atrophy of the surfaces, after controlling for age and sex. We
also studied this linear correlation in the non-demented ADNI cohort. After controlling
for age and sex, none of the experiments on these three follow up time points passed the
FDR correction. It does not necessarily suggest that higher APOE e4 load is not

36
associated with hippocampal atrophy effect, as we discovered from our group difference
studies. In a threshold statistical map, the power can be insufficient to detect the presence
of APOE e4 dose effects if present. Prior work (Roussotte et al., 2014a) reported that
surface-based patterns of ventricular expansion in dementia and normal aging in the full
ADNI cohort. It may be due to that the effect sizes of APOE genotype on ventricular
enlargement were much lager than those on hippocampal atrophy. Even so, our findings
are consistent with our baseline result (Shi et al., 2014) and demonstrate the APOE dose
effect trend on hippocampal atrophy. The results may mean that this relatively large
sample was limited in statistical power that cannot be detected with our current software
assuming such effects exist. Our continuing work on geometric shape analysis (e.g. (Mi
et al., 2015; Shi et al., 2015) may provide new insights to this study in future.
Figure 13. Linear Correlation
Between number of APOE e4
and Multivariate Statistics.
As noted in Shi, et al. (2014), there are two main caveats in our current work. First,
the ADNI participants are generally elderly, they may not be the best representative of
patient populations in clinical trials. Our ongoing study on the association of APOE e4
genotype and hippocampal morphometry (Li et al., 2015) on a cognitively normal cohort,
Arizona APOE cohort (Caselli et al., 2009), represents our latest efforts to corroborate
37
and extend our current biological discoveries to younger and healthy population. Even so,
our current findings may support the genetic influence of APOE genotype on non-
demented cohort. Second, we excluded the APOE e2 carriers from our current study
because of the extremely low number of APOE e2 carriers in ADNI dataset.
Even so, we were able to show that with our novel hippocampal morphometry
system in the longitudinal ADNI datasets, we replicated the influence of APOE genotype
on hippocampal morphometry observed in the baseline study (Shi et al., 2014). We also
demonstrated the strong dose effects of APOE genotype on the 6-month and 12-month
follow up cohorts. Our work may provide practical experience for further investigation
on human hippocampus surface in AD research.
In future, we will continue developing novel imaging shape analysis systems to
increase the sensitivity on genetic influence detection and further on AD prognosis and
prevention. We plan to apply this framework together with our ventricular morphometry
system (Wang et al., 2011) and cortical thickness estimation system (Wang et al., 2015a)
in cognitively normal subjects for the detection of preclinical AD (Li et al., 2015).

38
REFERENCES
Apostolova LG, Morra JH, Green AE, Hwang KS, Avedissian C, Woo E, Cummings JL, Toga AW, Jack CR, Jr., Weiner MW and others. (2010): Automated 3D mapping of baseline and 12-month associations between three verbal memory measures and hippocampal atrophy in 490 ADNI subjects. Neuroimage 51(1):488-99.
Arsigny V, Fillard P, Pennec X, Ayache N. (2006): Log-Euclidean Metrics for Fast and Simple Calculus on Diffusion Tensors. Magn. Reson. Med. 56(2):411-421.
Bansal R, Geiger B, Banihashemi A, Krishnan A. 2000. Integrated segmentation, registration and visualization of multimodal medical image datasets. IEEE Visualization.
Benjamini Y, Hochberg Y. (1995): Controlling the False Discovery Rate: A Practical and Powerful Approach to Multiple Testing. Journal of the Royal Statistical Society. Series B (Methodological) 57(1):289-300.
Bennett DA, De Jager PL, Leurgans SE, Schneider JA. (2009): Neuropathologic intermediate phenotypes enhance association to Alzheimer susceptibility alleles. Neurology 72(17):1495-503.
Berg L. (1988): Clinical Dementia Rating (CDR). Psychopharmacol Bull 24(4):637-9.
Brechbühler C, Gerig G, Kübler O. (1995): Parametrization of Closed Surfaces for 3-D Shape Description. Computer Vision and Image Understanding 61(2):154-170.
Bro-Nielsen M, Gramkow C. 1996. Fast fluid registration of medical images. Visualization in Biomedical Computing (VBC'96). : Springer. p 267-76.
Cao J, Worsley KJ. (1999): The detection of local shape changes via the geometry of Hotelling's T2 fields. Ann. Statist 27(3):925-942.
Cardenas VA, Chao LL, Studholme C, Yaffe K, Miller BL, Madison C, Buckley ST, Mungas D, Schuff N, Weiner MW. (2009): Brain atrophy associated with baseline and longitudinal measures of cognition. Neurobiol Aging.
Caselli RJ, Dueck AC, Locke DE, Sabbagh MN, Ahern GL, Rapcsak SZ, Baxter LC, Yaari R, Woodruff BK, Hoffman-Snyder C and others. (2011): Cerebrovascular

39
risk factors and preclinical memory decline in healthy APOE epsilon4 homozygotes. Neurology 76(12):1078-84.
Caselli RJ, Dueck AC, Osborne D, Sabbagh MN, Connor DJ, Ahern GL, Baxter LC, Rapcsak SZ, Shi J, Woodruff BK and others. (2009): Longitudinal modeling of age-related memory decline and the APOE epsilon4 effect. N Engl J Med 361(3):255-63.
Caselli RJ, Reiman EM. (2013): Characterizing the preclinical stages of Alzheimer's disease and the prospect of presymptomatic intervention. J Alzheimers Dis 33 Suppl 1:S405-16.
Caselli RJ, Walker D, Sue L, Sabbagh M, Beach T. (2010): Amyloid load in nondemented brains correlates with APOE e4. Neurosci Lett 473(3):168-71.
Chen K, Reiman EM, Alexander GE, Caselli RJ, Gerkin R, Bandy D, Domb A, Osborne D, Fox N, Crum WR and others. (2007): Correlations between apolipoprotein E epsilon4 gene dose and whole brain atrophy rates. Am J Psychiatry 164(6):916-21.
Cho Y, Seong JK, Shin SY, Jeong Y, Kim JH, Qiu A, Im K, Lee JM, Na DL. (2011): A multi-resolution scheme for distortion-minimizing mapping between human subcortical structures based on geodesic construction on Riemannian manifolds. Neuroimage 57(4):1376-92.
Cohen RM, Small C, Lalonde F, Friz J, Sunderland T. (2001): Effect of apolipoprotein E genotype on hippocampal volume loss in aging healthy women. Neurology 57(12):2223-8.
Corder EH, Saunders AM, Strittmatter WJ, Schmechel DE, Gaskell PC, Small GW, Roses AD, Haines JL, Pericak-Vance MA. (1993): Gene dose of apolipoprotein E type 4 allele and the risk of Alzheimer's disease in late onset families. Science 261(5123):921-3.
Crivello F, Lemaitre H, Dufouil C, Grassiot B, Delcroix N, Tzourio-Mazoyer N, Tzourio C, Mazoyer B. (2010): Effects of ApoE-epsilon4 allele load and age on the rates of grey matter and hippocampal volumes loss in a longitudinal cohort of 1186 healthy elderly persons. Neuroimage 53(3):1064-9.
Csernansky JG, Wang L, Joshi S, Miller JP, Gado M, Kido D, McKeel D, Morris JC, Miller MI. (2000): Early DAT is distinguished from aging by high-dimensional

40
mapping of the hippocampus. Dementia of the Alzheimer type. Neurology 55(11):1636-43.
D'Agostino E, Maes F, Vandermeulen D, Suetens P. (2003): A viscous fluid model for multimodal non-rigid image registration using mutual information. Med Image Anal 7(4):565-75.
de Flores R, La Joie R, Landeau B, Perrotin A, Mezenge F, de La Sayette V, Eustache F, Desgranges B, Chetelat G. (2015): Effects of age and Alzheimer's disease on hippocampal subfields: comparison between manual and FreeSurfer volumetry. Hum Brain Mapp 36(2):463-74.
de Leon MJ, George AE, Stylopoulos LA, Smith G, Miller DC. (1989): Early marker for Alzheimer's disease: the atrophic hippocampus. Lancet 2(8664):672-3.
Dean DC, 3rd, Jerskey BA, Chen K, Protas H, Thiyyagura P, Roontiva A, O'Muircheartaigh J, Dirks H, Waskiewicz N, Lehman K and others. (2014): Brain differences in infants at differential genetic risk for late-onset Alzheimer disease: a cross-sectional imaging study. JAMA Neurol 71(1):11-22.
den Heijer T, van der Lijn F, Koudstaal PJ, Hofman A, van der Lugt A, Krestin GP, Niessen WJ, Breteler MMB. (2010): A 10-year follow-up of hippocampal volume on magnetic resonance imaging in early dementia and cognitive decline. Brain 133(4):1163-1172.
Dickson DW, Crystal HA, Mattiace LA, Masur DM, Blau AD, Davies P, Yen SH, Aronson MK. (1992): Identification of normal and pathological aging in prospectively studied nondemented elderly humans. Neurobiol Aging 13(1):179-89.
Elad M, Milanfar P, Golub GH. (2004): Shape from moments - an estimation theory perspective. Trans. Sig. Proc. 52(7):1814-1829.
Erten-Lyons D, Dodge HH, Woltjer R, Silbert LC, Howieson DB, Kramer P, Kaye JA. (2013): Neuropathologic basis of age-associated brain atrophy. JAMA Neurol 70(5):616-22.
Farrer LA, Cupples LA, Haines JL, Hyman B, Kukull WA, Mayeux R, Myers RH, Pericak-Vance MA, Risch N, van Duijn CM. (1997): Effects of age, sex, and ethnicity on the association between apolipoprotein E genotype and Alzheimer

41
disease. A meta-analysis. APOE and Alzheimer Disease Meta Analysis Consortium. JAMA 278(16):1349-56.
Filippini N, MacIntosh BJ, Hough MG, Goodwin GM, Frisoni GB, Smith SM, Matthews PM, Beckmann CF, Mackay CE. (2009): Distinct patterns of brain activity in young carriers of the APOE-epsilon4 allele. Proc Natl Acad Sci U S A 106(17):7209-14.
Folstein MF, Folstein SE, McHugh PR. (1975): "Mini-mental state". A practical method for grading the cognitive state of patients for the clinician. J Psychiatr Res 12(3):189-98.
Fox NC, Scahill RI, Crum WR, Rossor MN. (1999): Correlation between rates of brain atrophy and cognitive decline in AD. Neurology 52(8):1687-9.
Frey BJ. 2003. Alzheimer's disease." . 2003. Encyclopedia.com. 27 Mar. 2015 <Error! Hyperlink reference not valid.. Gale Encyclopedia of Mental Disorders.
Gerig G, Styner M, Jones D, Weinberger D, Lieberman M. 2001. Shape analysis of brain ventricles using SPHARM. IEEE Workshop on Mathematical Methods in Biomedical Image Analysis (MMBIA'01).
Gouras GK, Relkin NR, Sweeney D, Munoz DG, Mackenzie IR, Gandy S. (1997): Increased apolipoprotein E epsilon 4 in epilepsy with senile plaques. Ann Neurol 41(3):402-4.
Gu X, Wang Y, Chan TF, Thompson PM, Yau S-T. (2004): Genus zero surface conformal mapping and its application to brain surface mapping. IEEE Trans. Med. Imag. 23(8):949-958.
Gutman B, Wang Y, Morra J, Toga AW, Thompson PM. (2009): Disease classification with hippocampal shape invariants. Hippocampus 19(6):572-578.
Haller JW, Christensen GE, Joshi SC, Newcomer JW, Miller MI, Csernansky JG, Vannier MW. (1996): Hippocampal MR imaging morphometry by means of general pattern matching. Radiology 199(3):787-91.
Han X, Xu C, Prince JL. (2003): A topology preserving level set method for geometric deformable models. Pattern Analysis and Machine Intelligence, IEEE Transactions on 25(6):755-768.

42
Hao Y, Wang T, Zhang X, Duan Y, Yu C, Jiang T, Fan Y, Alzheimer's Disease Neuroimaging I. (2014): Local label learning (LLL) for subcortical structure segmentation: application to hippocampus segmentation. Hum Brain Mapp 35(6):2674-97.
Holmes AP, Blair RC, Watson JD, Ford I. (1996): Nonparametric analysis of statistic images from functional mapping experiments. J Cereb Blood Flow Metab 16(1):7-22.
Hotelling H. (1931): The generalization of Student's ratio. Ann. Math. Statist. 2:360-378.
Hua X, Lee S, Hibar DP, Yanovsky I, Leow AD, Toga AW, Jack Jr CR, Bernstein MA, Reiman EM, Harvey DJ and others. (2010): Mapping Alzheimer's disease progression in 1309 MRI scans: Power estimates for different inter-scan intervals. NeuroImage 51(1):63-75.
Jack CR, Jr., Bernstein MA, Fox NC, Thompson P, Alexander G, Harvey D, Borowski B, Britson PJ, Whitwell JL, Ward C and others. (2008): The Alzheimer's disease neuroimaging initiative (ADNI): MRI methods. Journal of Magnetic Resonance Imaging 27(4):685-691.
Jack CR, Jr., Shiung MM, Gunter JL, O'Brien PC, Weigand SD, Knopman DS, Boeve BF, Ivnik RJ, Smith GE, Cha RH and others. (2004): Comparison of different MRI brain atrophy rate measures with clinical disease progression in AD. Neurology 62(4):591-600.
Jack CR, Jr., Slomkowski M, Gracon S, Hoover TM, Felmlee JP, Stewart K, Xu Y, Shiung M, O'Brien PC, Cha R and others. (2003): MRI as a biomarker of disease progression in a therapeutic trial of milameline for AD. Neurology 60(2):253-60.
Joshi SC, Miller MI. (2000): Landmark matching via large deformation diffeomorphisms. IEEE Trans Image Process 9(8):1357-70.
Joshi SH, Espinoza RT, Pirnia T, Shi J, Wang Y, Ayers B, Leaver A, Woods RP, Narr KL. (2015): Structural plasticity of the hippocampus and amygdala induced by electroconvulsive therapy in major depression. Biological Psychiatry.
Kim S-G, Chung MK, Schaefer SM, van Reekum C, Davidson RJ. (2012a): Sparse Shape Representation using the Laplace-Beltrami Eigenfunctions and Its Application to Modeling Subcortical Structures. Proceedings / sponsored by IEEE Computer

43
Society Technical Committee on Pattern Analysis and Machine Intelligence. Workshop on Mathematical Methods in Biomedical Image Analysis:25-32.
Kim WH, Pachauri D, Hatt C, Chung MK, Johnson SC, Singh V. Wavelet based multi-scale shape features on arbitrary surfaces for cortical thickness discrimination; 2012b.
Knickmeyer RC, Wang J, Zhu H, Geng X, Woolson S, Hamer RM, Konneker T, Lin W, Styner M, Gilmore JH. (2014): Common variants in psychiatric risk genes predict brain structure at birth. Cereb Cortex 24(5):1230-46.
Kok E, Haikonen S, Luoto T, Huhtala H, Goebeler S, Haapasalo H, Karhunen PJ. (2009): Apolipoprotein E-dependent accumulation of Alzheimer disease-related lesions begins in middle age. Ann Neurol 65(6):650-7.
Langbaum JB, Fleisher AS, Chen K, Ayutyanont N, Lopera F, Quiroz YT, Caselli RJ, Tariot PN, Reiman EM. (2013): Ushering in the study and treatment of preclinical Alzheimer disease. Nat Rev Neurol 9(7):371-81.
Lao Y, Wang Y, Shi J, Ceschin R, Nelson MD, Panigrahy A, Lepore N. (2014): Thalamic alterations in preterm neonates and their relation to ventral striatum disturbances revealed by a combined shape and pose analysis. Brain Struct Funct.
Lemaitre H, Crivello F, Dufouil C, Grassiot B, Tzourio C, Alperovitch A, Mazoyer B. (2005): No epsilon4 gene dose effect on hippocampal atrophy in a large MRI database of healthy elderly subjects. Neuroimage 24(4):1205-13.
Leow A, Huang SC, Geng A, Becker J, Davis S, Toga A, Thompson P. (2005): Inverse consistent mapping in 3D deformable image registration: its construction and statistical properties. Inf Process Med Imaging 19:493-503.
Leporé N, Brun C, Chou Y-Y, Chiang M-C, Dutton RA, Hayashi KM, Luders E, Lopez OL, Aizenstein HJ, Toga AW and others. (2008): Generalized Tensor-Based Morphometry of HIV/AIDS Using Multivariate Statistics on Deformation Tensors. IEEE Trans. Med. Imag. 27(1):129-141.
Li B, Mcmahon T, Shi J, Gutman BA, Thompson PM, Baxter LC, Chen K, Reiman EM, Caselli RJ, Wang Y. Correlation between ApoE4 Genotype and Hippocampal Atrophy on Arizona APOE Cohort: A Surface Multivariate Tensor-based Morphometry Study 2015; Tempe, AZ.

44
Lorensen WE, Cline HE. (1987): Marching cubes: A high resolution 3D surface construction algorithm. SIGGRAPH Comput. Graph. 21(4):163-169.
Lyall DM, Royle NA, Harris SE, Bastin ME, Maniega SM, Murray C, Lutz MW, Saunders AM, Roses AD, del Valdes Hernandez MC and others. (2013): Alzheimer's disease susceptibility genes APOE and TOMM40, and hippocampal volumes in the Lothian birth cohort 1936. PLoS One 8(11):e80513.
Mi L, Su Z, Gu X, Wang Y. A Novel Isometry-Invariant Descriptor for Detection of Brain Cortical Surface Deformation Affected by Alzheimer's Disease; 2015; Tempe, AZ.
Morra JH, Tu Z, Apostolova LG, Green AE, Avedissian C, Madsen SK, Parikshak N, Hua X, Toga AW, Jack CR, Jr. and others. (2009a): Automated 3D mapping of hippocampal atrophy and its clinical correlates in 400 subjects with Alzheimer's disease, mild cognitive impairment, and elderly controls. Hum Brain Mapp 30(9):2766-88.
Morra JH, Tu Z, Apostolova LG, Green AE, Avedissian C, Madsen SK, Parikshak N, Toga AW, Jack CR, Jr, Schuff N and others. (2009c): Automated mapping of hippocampal atrophy in 1-year repeat MRI data from 490 subjects with Alzheimer's disease, mild cognitive impairment, and elderly controls. NeuroImage 45(1, Supplement 1):S3 - S15.
Morris JC, Roe CM, Xiong C, Fagan AM, Goate AM, Holtzman DM, Mintun MA. (2010): APOE predicts amyloid-beta but not tau Alzheimer pathology in cognitively normal aging. Ann Neurol 67(1):122-31.
Nichols TE, Holmes AP. (2002): Nonparametric permutation tests for functional neuroimaging: a primer with examples. Hum Brain Mapp 15(1):1-25.
O'Dwyer L, Lamberton F, Matura S, Tanner C, Scheibe M, Miller J, Rujescu D, Prvulovic D, Hampel H. (2012): Reduced hippocampal volume in healthy young ApoE4 carriers: an MRI study. PLoS One 7(11):e48895.
Patenaude B, Smith SM, Kennedy DN, Jenkinson M. (2011): A Bayesian model of shape and appearance for subcortical brain segmentation. Neuroimage 56(3):907-22.
Pievani M, Galluzzi S, Thompson PM, Rasser PE, Bonetti M, Frisoni GB. (2011): APOE e4 is associated with greater atrophy of the hippocampal formation in Alzheimer's disease. Neuroimage 55(3):909-19.

45
Pizer S, Fritsch D, Yushkevich P, Johnson V, Chaney E. (1999): Segmentation, registration, and measurement of shape variation via image object shape. IEEE Trans. Med. Imag. 18:851-865.
Protas HD, Chen K, Langbaum JB, Fleisher AS, Alexander GE, Lee W, Bandy D, de Leon MJ, Mosconi L, Buckley S and others. (2013): Posterior cingulate glucose metabolism, hippocampal glucose metabolism, and hippocampal volume in cognitively normal, late-middle-aged persons at 3 levels of genetic risk for Alzheimer disease. JAMA Neurol 70(3):320-5.
Qiu A, Taylor WD, Zhao Z, MacFall JR, Miller MI, Key CR, Payne ME, Steffens DC, Krishnan KR. (2009): APOE related hippocampal shape alteration in geriatric depression. NeuroImage 44(3):620-6.
Reiman EM, Caselli RJ, Yun LS, Chen K, Bandy D, Minoshima S, Thibodeau SN, Osborne D. (1996): Preclinical evidence of Alzheimer's disease in persons homozygotes for the epsilon 4 allele for apolipoprotein E. N Engl J Med 334(12):752-8.
Reiman EM, Chen K, Alexander GE, Caselli RJ, Bandy D, Osborne D, Saunders AM, Hardy J. (2005): Correlations between apolipoprotein E epsilon4 gene dose and brain-imaging measurements of regional hypometabolism. Proc Natl Acad Sci U S A 102(23):8299-302.
Reiman EM, Chen K, Liu X, Bandy D, Yu M, Lee W, Ayutyanont N, Keppler J, Reeder SA, Langbaum JB and others. (2009): Fibrillar amyloid-beta burden in cognitively normal people at 3 levels of genetic risk for Alzheimer's disease. Proc Natl Acad Sci U S A 106(16):6820-5.
Reiman EM, Jagust WJ. (2012): Brain imaging in the study of Alzheimer's disease. Neuroimage 61(2):505-16.
Reiman EM, Uecker A, Caselli RJ, Lewis S, Bandy D, de Leon MJ, De Santi S, Convit A, Osborne D, Weaver A and others. (1998): Hippocampal volumes in cognitively normal persons at genetic risk for Alzheimer's disease. Ann Neurol 44(2):288-91.
Rey D, Subsol G, Delingette H, Ayache N. (2002): Automatic detection and segmentation of evolving processes in 3D medical images: Application to multiple sclerosis. Med Image Anal 6(2):163-79.

46
Roussotte FF, Gutman BA, Madsen SK, Colby JB, Narr KL, Thompson PM, Alzheimer's Disease Neuroimaging I. (2014a): Apolipoprotein E epsilon 4 allele is associated with ventricular expansion rate and surface morphology in dementia and normal aging. Neurobiol Aging 35(6):1309-17.
Roussotte FF, Gutman BA, Madsen SK, Colby JB, Thompson PM, Alzheimer's Disease Neuroimaging I. (2014e): Combined effects of Alzheimer risk variants in the CLU and ApoE genes on ventricular expansion patterns in the elderly. J Neurosci 34(19):6537-45.
Saunders AM, Strittmatter WJ, Schmechel D, George-Hyslop PH, Pericak-Vance MA, Joo SH, Rosi BL, Gusella JF, Crapper-MacLachlan DR, Alberts MJ and others. (1993): Association of apolipoprotein E allele epsilon 4 with late-onset familial and sporadic Alzheimer's disease. Neurology 43(8):1467-72.
Shen L, Firpi HA, Saykin AJ, West JD. (2009): Parametric surface modeling and registration for comparison of manual and automated segmentation of the hippocampus. Hippocampus 19(6):588-95.
Shi J, Lepore N, Gutman BA, Thompson PM, Baxter LC, Caselli RJ, Wang Y. (2014): Genetic influence of apolipoprotein E4 genotype on hippocampal morphometry: An N = 725 surface-based Alzheimer's disease neuroimaging initiative study. Hum Brain Mapp 35(8):3903-18.
Shi J, Stonnington CM, Thompson PM, Chen K, Gutman B, Reschke C, Baxter LC, Reiman EM, Caselli RJ, Wang Y and others. (2015): Studying ventricular abnormalities in mild cognitive impairment with hyperbolic Ricci flow and tensor-based morphometry. Neuroimage 104:1-20.
Shi J, Thompson PM, Gutman B, Wang Y. (2013a): Surface fluid registration of conformal representation: Application to detect disease burden and genetic influence on hippocampus. Neuroimage 78C:111-134.
Shi J, Wang Y, Ceschin R, An X, Lao Y, Vanderbilt D, Nelson MD, Thompson PM, Panigrahy A, Lepore N. (2013q): A Multivariate Surface-Based Analysis of the Putamen in Premature Newborns: Regional Differences within the Ventral Striatum. PLoS One 8(7):e66736.
Soininen H, Partanen K, Pitkanen A, Hallikainen M, Hanninen T, Helisalmi S, Mannermaa A, Ryynanen M, Koivisto K, Riekkinen P, Sr. (1995): Decreased

47
hippocampal volume asymmetry on MRIs in nondemented elderly subjects carrying the apolipoprotein E epsilon 4 allele. Neurology 45(2):391-2.
Sperling RA, Aisen PS, Beckett LA, Bennett DA, Craft S, Fagan AM, Iwatsubo T, Jack CR, Jr., Kaye J, Montine TJ and others. (2011): Toward defining the preclinical stages of Alzheimer's disease: recommendations from the National Institute on Aging-Alzheimer's Association workgroups on diagnostic guidelines for Alzheimer's disease. Alzheimers Dement 7(3):280-92.
Stonnington CM, Chu C, Kloppel S, Jack CR, Jr., Ashburner J, Frackowiak RS. (2010): Predicting clinical scores from magnetic resonance scans in Alzheimer's disease. Neuroimage 51(4):1405-13.
Styner M, Lieberman JA, Pantazis D, Gerig G. (2004): Boundary and medial shape analysis of the hippocampus in schizophrenia. Med Image Anal 8(3):197-203.
Thirion JP, Prima S, Subsol G, Roberts N. (2000): Statistical analysis of normal and abnormal dissymmetry in volumetric medical images. Med Image Anal 4(2):111-121.
Thompson PM, Hayashi KM, de Zubicaray GI, Janke AL, Rose SE, Semple J, Hong MS, Herman DH, Gravano D, Doddrell DM and others. (2004): Mapping hippocampal and ventricular change in Alzheimer's disease. NeuroImage 22(4):1754 - 1766.
Van Leemput K, Bakkour A, Benner T, Wiggins G, Wald LL, Augustinack J, Dickerson BC, Golland P, Fischl B. (2009): Automated segmentation of hippocampal subfields from ultra-high resolution in vivo MRI. Hippocampus 19(6):549-57.
Wachinger C, Golland P, Kremen W, Fischl B, Reuter M, Alzheimer's Disease Neuroimaging I. (2015): BrainPrint: A discriminative characterization of brain morphology. Neuroimage 109:232-48.
Wang G, Zhang X, Su Q, Shi J, Caselli RJ, Wang Y. (2015a): A novel cortical thickness estimation method based on volumetric Laplace-Beltrami operator and heat kernel. Med Image Anal 22(1):1-20.
Wang G, Zhang X, Su Q, Shi J, Caselli RJ, Wang Y, for the Alzheimer's Disease Neuroimaging I. (2015b): A novel cortical thickness estimation method based on volumetric Laplace-Beltrami operator and heat kernel. Med Image Anal 22(1):1-20.
48
Wang L, Beg F, Ratnanather T, Ceritoglu C, Younes L, Morris JC, Csernansky JG, Miller MI. (2007a): Large deformation diffeomorphism and momentum based hippocampal shape discrimination in dementia of the Alzheimer type. IEEE Trans Med Imaging 26(4):462-70.
Wang L, Miller JP, Gado MH, McKeel DW, Rothermich M, Miller MI, Morris JC, Csernansky JG. (2006): Abnormalities of hippocampal surface structure in very mild dementia of the Alzheimer type. Neuroimage 30(1):52-60.
Wang L, Swank JS, Glick IE, Gado MH, Miller MI, Morris JC, Csernansky JG. (2003): Changes in hippocampal volume and shape across time distinguish dementia of the Alzheimer type from healthy aging. NeuroImage 20(2):667 - 682.
Wang Y, Lui LM, Gu X, Hayashi KM, Chan TF, Toga AW, Thompson PM, Yau S-T. (2007c): Brain Surface Conformal Parameterization using Riemann Surface Structure. IEEE Trans. Med. Imag. 26(6):853-865.
Wang Y, Shi J, Yin X, Gu X, Chan TF, Yau S-T, Toga AW, Thompson PM. (2012): Brain Surface Conformal Parameterization with the Ricci Flow. IEEE Trans. Med. Imag. 31(2):251-264.
Wang Y, Song Y, Rajagopalan P, An T, Liu K, Chou YY, Gutman B, Toga AW, Thompson PM. (2011): Surface-based TBM boosts power to detect disease effects on the brain: An N=804 ADNI study. Neuroimage 56(4):1993-2010.
Wang Y, Yuan L, Shi J, Greve A, Ye J, Toga AW, Reiss AL, Thompson PM. (2013): Applying tensor-based morphometry to parametric surfaces can improve MRI-based disease diagnosis. Neuroimage 74:209-30.
Wang Y, Zhang J, Gutman B, Chan TF, Becker JT, Aizenstein HJ, Lopez OL, Tamburo RJ, Toga AW, Thompson PM. (2010): Multivariate tensor-based morphometry on surfaces: Application to mapping ventricular abnormalities in HIV/AIDS. NeuroImage 49(3):2141-2157.
Wechsler D. 1987. Wechsler Memory Scale-Revised Manual. San Antonio, TX: Psychological Corporation.
Wolz R, Heckemann RA, Aljabar P, Hajnal JV, Hammers A, Lötjönen J, Rueckert D. (2010): Measurement of hippocampal atrophy using 4D graph-cut segmentation: Application to ADNI. NeuroImage 52(1):109-118.

49
Yang X, Goh A, Chen SH, Qiu A. (2013): Evolution of hippocampal shapes across the human lifespan. Hum Brain Mapp 34(11):3075-85.
Yassa MA, Stark SM, Bakker A, Albert MS, Gallagher M, Stark CE. (2010): High-resolution structural and functional MRI of hippocampal CA3 and dentate gyrus in patients with amnestic Mild Cognitive Impairment. Neuroimage 51(3):1242-52.
Younes L, Ratnanather JT, Brown T, Aylward E, Nopoulos P, Johnson H, Magnotta VA, Paulsen JS, Margolis RL, Albin RL and others. (2014): Regionally selective atrophy of subcortical structures in prodromal HD as revealed by statistical shape analysis. Hum Brain Mapp 35(3):792-809.
Yushkevich PA, Amaral RS, Augustinack JC, Bender AR, Bernstein JD, Boccardi M, Bocchetta M, Burggren AC, Carr VA, Chakravarty MM and others. (2015a): Quantitative comparison of 21 protocols for labeling hippocampal subfields and parahippocampal subregions in in vivo MRI: Towards a harmonized segmentation protocol. Neuroimage.
Yushkevich PA, Pluta JB, Wang H, Xie L, Ding SL, Gertje EC, Mancuso L, Kliot D, Das SR, Wolk DA. (2015b): Automated volumetry and regional thickness analysis of hippocampal subfields and medial temporal cortical structures in mild cognitive impairment. Hum Brain Mapp 36(1):258-87.
Zhang D, Lu G. (2004): Review of shape representation and description techniques. Pattern Recognition 37(1):1-19.