Long-Term Trash Load Reduction Plan and Assessment Strategy · Long-Term Trash Load Reduction Plan...
53
Long-Term Trash Load Reduction Plan and Assessment Strategy Submitted by: City of Brisbane Engineering Division 50 Park Place Brisbane, CA 94005 In compliance with Provisions C.10.c of Order R2-2009-0074 January 28, 2014
Transcript of Long-Term Trash Load Reduction Plan and Assessment Strategy · Long-Term Trash Load Reduction Plan...
Long-Term Trash Load Reduction Plan and Assessment Strategy
Submitted by:
City of Brisbane
Engineering Division
50 Park Place
Brisbane, CA 94005
In compliance with Provisions C.10.c of Order R2-2009-0074
January 28, 2014

ii
Page Intentionally Left Blank
Long-Term Trash Load Reduction Plan
iii
CITY OF BRISBANE
LONG-TERM TRASH LOAD REDUCTION PLAN AND
ASSESSMENT STRATEGY
CERTIFICATION STATEMENT
"I certify, under penalty of law, that this document and all attachments were
prepared under my direction or supervision in accordance with a system designed to ensure that qualified personnel properly gather and evaluate the information submitted. Based on my inquiry of the person or persons who manage the system, or those persons directly responsible for gathering the information, the information submitted, is, to the best of my knowledge and belief, true, accurate, and complete. I am aware that there are significant penalties for submitting false information, including the possibility of fine and imprisonment for knowing violations.”
Signature by Duly Authorized Representative:
Signed electronically
Randy L. Breault, P.E. January 28, 2014 Director of Public Works/City Engineer
CITY OF BRISBANE
iv
TABLE OF CONTENTS
CERTIFICATION STATEMENT .............................................................................................................................................. III
TABLE OF CONTENTS ............................................................................................................................................................... IV
LIST OF TABLES .......................................................................................................................................................................... V
LIST OF FIGURES ........................................................................................................................................................................ V
ABBREVIATIONS ........................................................................................................................................................................ VI
PREFACE ........................................................................................................................................................................................ 1
1.0 INTRODUCTION .......................................................................................................................................................... 2
1.1 PURPOSE OF LONG-TERM TRASH REDUCTION PLAN ................................................................................................................... 2 1.2 BACKGROUND ...................................................................................................................................................................................... 3
1.2.1 Long-Term Trash Load Reduction Plan Framework ............................................................................................ 3 1.2.2 BASMAA Generation Rates Project .............................................................................................................................. 4 1.2.3 Short-Term Trash Load Reduction Plan .................................................................................................................... 5
1.3 ORGANIZATION OF LONG-TERM PLAN ............................................................................................................................................ 7
2.0 SCOPE OF THE TRASH PROBLEM ......................................................................................................................... 8
2.1 PERMITTEE CHARACTERISTICS ......................................................................................................................................................... 8 2.2 TRASH SOURCES AND PATHWAYS .................................................................................................................................................... 9 2.3 TRASH GENERATING AREAS ............................................................................................................................................................ 10
2.3.1 Generation Categories and Designation of Areas ................................................................................................ 10 2.3.2 Summary of Trash Generating Areas and Sources .............................................................................................. 12
3.0 TRASH MANAGEMENT AREAS AND CONTROL MEASURES ...................................................................... 14
3.1 MANAGEMENT AREA DELINEATION AND PRIORITIZATION ....................................................................................................... 14 3.2 CURRENT AND PLANNED TRASH CONTROL MEASURES ............................................................................................................. 17
3.2.1 Trash Management Area #1[US 101] ....................................................................................................................... 17 3.2.2 Trash Management Area #2 [Beatty Road/Alana Way] .................................................................................. 18 3.2.3 Trash Management Area #3 [Industrial Way/Main Stree]t ............................................................................ 19
3.2.4 Trash Management Area #4 [Bayskore Boulevard] ........................................................................................... 23
3.2.5 Trash Management Area #5 [Tunnel Avenue/Lagoon Way] .......................................................................... 24
3.2.6 Trash Management Area #6 [Crocker Industrial/N Hill & Brisbane Technology Park] ...................... 25
3.2.7 Trash Management Area #7 [Sierra Point] ............................................................................................................ 26
3.2.8 Trash Management Area #8 [VWR/abandoned WW Pump Station] .......................................................... 27
3.2.9 Trash Management Area #9 [S81/Quarry/BES/LS #4] ................................................................................... 28
3.2.10 Trash Management Area #10 [Visitacion Avenue/Community Park/Village] ........................................ 29
3.2.11 Trash Management Area #11 [Canyons] ................................................................................................................ 30
3.2.12 Trash Management Area #12 [Central Brisbane & NER residential/Levinson Detention Basin] .... 30
3.2.13 Jurisdiction-wide Control Measures .......................................................................................................................... 32
3.2.14 Creek and Shoreline Hot Spot Cleanups ................................................................................................................... 35 3.2.15 Summary of Trash Control Measures........................................................................................................................ 36
3.3 CONTROL MEASURE IMPLEMENTATION SCHEDULE.................................................................................................................... 38
4.0 PROGRESS ASSESSMENT STRATEGY ................................................................................................................ 40
4.1 SMCWPPP PILOT ASSESSMENT STRATEGY................................................................................................................................ 40 4.1.1 Management Questions .................................................................................................................................................. 40 4.1.2 Indicators of Progress and Success ............................................................................................................................ 40 4.1.3 Pilot Assessment Methods .............................................................................................................................................. 41
4.2 BASMAA “TRACKING CALIFORNIA’S TRASH” PROJECT ............................................................................................................ 44 4.2.1 Testing of Trash Monitoring Methods ...................................................................................................................... 45 4.2.2 Full Capture Equivalent Studies .................................................................................................................................. 45

Long-Term Trash Load Reduction Plan
v
4.3 LONG-TERM ASSESSMENT STRATEGY ........................................................................................................................................... 45 4.4 IMPLEMENTATION SCHEDULE......................................................................................................................................................... 45
5.0 REFERENCES ............................................................................................................................................................. 47
LIST OF TABLES
TABLE 1. SAN FRANCISCO BAY AREA TRASH GENERATION RATES BY LAND USE (GALLONS/ACRE/YEAR). TABLE 2. PERCENTAGES OF THE CITY OF BRISBANE'S JURISDICTIONAL AREA WITHIN LAND USE CLASSES IDENTIFIED BY ABAG
(2005) TABLE 3. TRASH GENERATION CATEGORIES AND ASSOCIATED GENERATION RATES (GALLONS/ACRE/YEAR). TABLE 4. DEFINITIONS OF ON-LAND TRASH ASSESSMENT CONDITION CATEGORIES. TABLE 5. PERCENTAGE OF JURISDICTIONAL AREA WITHIN THE CITY OF BRISBANE ASSIGNED TO EACH TRASH GENERATION
CATEGORY. TABLE 6. JURISDICTIONAL AREA AND PERCENTAGE OF EACH TRASH MANAGEMENT AREA (TMA) COMPRISED OF TRASH
GENERATION CATEGORIES TABLE 7. CITY OF BRISBANE TRASH CONTROL MEASURE IMPLEMENTATION SCHEDULE. TABLE 8. TRASH CONDITION CATEGORIES USED IN THE DRAFT ON-LAND VISUAL ASSESSMENT PROTOCOL. TABLE 9. CITY OF BRISBANE TRASH PROGRESS ASSESSMENT IMPLEMENTATION SCHEDULE.
LIST OF FIGURES
FIGURE 1. EIGHT-STEP FRAMEWORK FOR DEVELOPING, IMPLEMENTING AND REFINING LONG-TERM TRASH REDUCTION PLANS. FIGURE 2. CONCEPTUAL MODEL OF TRASH GENERATION, INTERCEPTION AND LOAD. FIGURE 3. TRASH SOURCES CATEGORIES AND TRANSPORT PATHWAYS TO URBAN CREEKS. FIGURE 4. TRASH SOURCES CATEGORIES AND TRANSPORT PATHWAYS TO URBAN CREEKS. FIGURE 5. FINAL TRASH GENERATION MAP FOR THE CITY OF BRISBANE. FIGURE 6. TRASH MANAGEMENT AREA MAP FOR THE CITY OF BRISBANE. FIGURE 7. TRASH FULL CAPTURE DEVICE MAP FOR THE CITY OF BRISBANE.
CITY OF BRISBANE
vi
ABBREVIATIONS
BASMAA Bay Area Stormwater Management Agencies Association BID Business Improvement District BPD Brisbane Police Department CalRecycle California Department of Resources Recycling and Recovery Caltrans California Department of Transportation CASQA California Stormwater Quality Association CDS Continuous Deflection Separator CEQA California Environmental Quality Act CY Cubic Yards DPW Department of Public Works EIR Environmental Impact Report EPA Environmental Protection Agency FCTD Full Capture Treatment Device GIS Geographic Information System MRP Municipal Regional Stormwater NPDES Permit MS4 Municipal Separate Storm Sewer System NGO Non-Governmental Organization NPDES National Pollutant Discharge Elimination System O&M Operations & Maintenance PCTD Partial Capture Treatment Device PIP Public Information and Participation Program P.O.P. Problem Oriented Policing PSA Public Service Announcement Q Flow SFRWQCB San Francisco Regional Water Quality Control Board SMCWPPP San Mateo Countywide Water Pollution Prevention Program SWRCB State Water Resource Control Board TMA Trash Management Area TMDL Total Maximum Daily Load USEPA United States Environmental Protection Agency Water Board San Francisco Regional Water Quality Control Board WDR Waste Discharge Requirements

Long-Term Trash Load Reduction Plan
1
PREFACE
This Long-Term Trash Load Reduction Plan and Assessment Strategy (Long-Term Plan) is
submitted in compliance with provision C.10.c of the Municipal Regional Stormwater NPDES Permit
(MRP) for Phase I communities in the San Francisco Bay (Order R2-2009-0074). The Long-Term
Plan was developed using a regionally consistent outline and guidance developed by the Bay Area
Stormwater Management Agencies Association (BASMAA) and reviewed by San Francisco Bay
Regional Water Quality Control Board staff. The Long-Term Plan is consistent with the Long-Term
Trash Load Reduction Framework developed in collaboration with Water Board staff. Its content is
based on the City of Brisbane’s current understanding of trash problems within its jurisdiction and
the effectiveness of control measures designed to reduce trash impacts associated with Municipal
Separate Storm Sewer (MS4) discharges. This Long-Term Plan is intended to be iterative and may
be modified in the future based on information gained through the implementation of trash control
measures. The City of Brisbane therefore reserves the right to revise or amend this Long-Term Plan
at its discretion. If significant revisions or amendments are made by the City, a revised Long-Term
Plan will be submitted to the Water Board through the City’s annual reporting process.

CITY OF BRISBANE
2
1.0 INTRODUCTION
1.1 Purpose of Long-Term Trash Reduction Plan
The Municipal Regional Stormwater National Pollutant Discharge Elimination System (NPDES) Permit for Phase I communities in the San Francisco Bay (Order R2-2009-0074), also known as the Municipal Regional Permit (MRP), became effective on December 1, 2009. The MRP applies to 76 large, medium and small municipalities (cities, towns and counties) and flood control agencies in the San Francisco Bay Region, collectively referred to as Permittees. Provision C.10.c of the MRP requires Permittees to submit a Long-Term Trash Load Reduction Plan (Long-Term Plan) by February 1, 2014. Long-Term Plans must describe control measures that are currently being implemented, including the level of implementation, and additional control measures that will be implemented and/or increased level of implementation designed to attain a 70% trash load reduction by July 1, 2017, and 100% (i.e., “No Visual Impact”) by July 1, 2022.
This Long-Term Plan is submitted by the City of Brisbane in compliance with MRP provision C.10.c. Consistent with provision C.10 requirements; the goal of the Long-Term Plan is to solve trash problems in receiving waters by reducing the impacts associated with trash in discharges from the City’s municipal separate storm sewer system (MS4) that are regulated by NPDES Permit requirements. The Long-Term Plan includes:
1. Descriptions of the current level of implementation of trash control measures, and the type and extent to which new or enhanced control measures will be implemented to achieve a target of 100% (i.e. full) trash reduction from MS4s by July 1, 2022, with an interim milestone of 70% reduction by July 1, 2017;
2. A description of the Trash Assessment Strategy that will be used to assess progress towards trash reduction targets achieved as a result of control measure implementation; and,
3. Time schedules for implementing control measures and the assessment strategy. The Long-Term Plan was developed using a regionally consistent outline and guidance developed by the Bay Area Stormwater Management Agencies Association (BASMAA) and reviewed by the San Francisco Bay Regional Water Quality Control Board (Water Board) staff. The Long-Term Plan is consistent with the Long-Term Trash Load Reduction Framework (see section 1.2.1) developed in collaboration with Water Board staff. Its content is based on the City’s current understanding of trash problems within its jurisdiction and the effectiveness of control measures designed to reduce trash impacts associated with Municipal Separate Storm Sewer (MS4) discharges. The Long-Term Plan builds upon trash control measures implemented by the City prior to the adoption of the MRP and during the implementation of the Short-Term Trash Load Reduction Plan submitted to the Water Board on February 1, 2012. As will be described later in this Plan, staff is proposing that to the maximum extent possible the collection and disposal of solid waste materials will be consolidated into the Franchise Agreements the city enters into for the collection, transport and disposal of solid waste. By ordinance, the city recently created three franchise zones for collection of solid waste. We are actively in sole source negotiations with two franchisees, and both parties are amendable to all of the “consolidation” efforts to be described later. As these agreements are still being discussed at the city council

Long-Term Trash Load Reduction Plan
3
subcommittee level, it was deemed inappropriate at this time to provide the full Council a Long Term Trash Reduction Plan that included these components.
1.2 Background
1.2.1 Long-Term Trash Load Reduction Plan Framework
A workgroup of MRP Permittees, Bay Area countywide stormwater program staff and Water Board staff met between October 2012 and March 2013 to better define the process for developing and implementing Long-Term Plans, methods for assessing progress toward reduction goals, and tracking and reporting requirements associated with provision C.10. Through these discussions, an eight-step framework for developing and implementing Long-Term Plans was created by the workgroup (Figure 1).
5. Define method(s) to assess progress
4. Identify/select control measures
3. Delineate and prioritize management
areas
2. Identify trash sources
(as needed)
8. Modify area designations &
reprioritize areas / problems
7. Assess progress via defined methods
6. Implement control measures
1. Identify and map trash generating areas
Figure 1. Eight-step framework for developing, implementing and refining Long-Term Trash Reduction
Plans.
The workgroup agreed that as the first step in the framework, Permittees would identify very high, high, moderate, and low trash generating areas in their jurisdictional areas. Trash generation rates developed through the BASMAA Baseline Trash Generation Rates Project (as discussed below) were used as a starting point for differentiating and delineating land areas with varying levels of trash generation. Permittees would then use local knowledge and field and/or desktop assessments to confirm or refine the level of trash generation for specific areas within their jurisdiction. Each Permittee would then develop a map depicting trash generation categories within their jurisdiction.
As a next step, Permittees would then delineate and prioritize Trash Management Areas (TMAs) where specific control measures exist or are planned for implementation. TMAs delineated by Permittees are intended to serve as reporting units in the future. Reporting at the management area level provides the level of detail necessary to demonstrate implementation and progress towards trash reduction targets.

CITY OF BRISBANE
4
Once control measures are selected and implemented, Permittees will evaluate progress toward trash reduction targets using outcome-based assessment methods. As the results of the progress assessments are available, Permittees may choose to reprioritize trash management areas and associated control measures designed to improve trash reduction within their jurisdictions.
1.2.2 BASMAA Generation Rates Project
Through approval of a BASMAA regional project in 2010, Permittees agreed to work collaboratively to develop a regionally consistent method to establish trash generation rates within their jurisdictions. The project, also known as the BASMAA Trash Generation Rates Project (Generation Rates Project) assisted Permittees in establishing the rates of trash generation and identifying very high, high, moderate and low trash generating areas. The term “trash generation” refers to the rate at which trash is produced or generated onto the surface of the watershed and is potentially available for transport via MS4s to receiving waters. Generation rates do not explicitly take into account existing control measures that intercept trash prior to transport. Generation rates are expressed as trash volume/acre/year and were established via the Generation Rates Project. In contrast to trash generation, the term “trash loading” refers to the rate at which trash from MS4s enters receiving waters. Trash loading rates are also expressed as trash volume/acre/year and are equal to or less than trash generation rates because they account for the effects of control measures that intercept trash generated in an area before it is discharged to a receiving water. Trash loading rates are specific to particular areas because they are dependent upon the effectiveness of control measures implemented within an area. Figure 2 illustrates the difference between trash generation and loading.
Figure 2. Conceptual model of trash generation, interception and load.
Trash generation rates were estimated based on factors that significantly affect trash generation (i.e., land use and income). The method used to establish trash generation rates for each Permittee builds off “lessons learned” from previous trash loading studies conducted in urban areas (Allison and Chiew 1995; Allison et al. 1998; Armitage et al. 1998; Armitage and Rooseboom 2000; Lippner et al. 2001; Armitage 2003; Kim et al. 2004; County of Los Angeles 2002, 2004a, 2004b; Armitage 2007). The method is based on a conceptual model developed as an outgrowth of these studies (BASMAA 2011b). Trash generation rates were developed through the quantification and characterization of trash captured in Water Board-recognized full-capture treatment devices installed in the San Francisco Bay area. Trash generation rates estimated from this study are listed for each land use type in Table
1. Methods used to develop trash generation rates are more fully described in BASMAA (2011b,
2011c, and 2012).

Long-Term Trash Load Reduction Plan
5
Table 1. San Francisco Bay Area trash generation rates by land use (gallons/acre/year).
Land Use Lowb Bestb Highb
Commercial & Services 0.7 6.2 17.3
Industrial 2.8 8.4 17.8
Residentiala 0.3 - 30.2 0.5 - 87.1 1.0 - 257.0
Retaila 0.7 - 109.7 1.8 - 150.0 4.6 - 389.1
K-12 Schools 3 6.2 11.5
Urban Parks 0.5 5.0 11.4
a For residential and retail land uses, trash generation rates are provided as a range that takes into account the correlation between rates and household median income.
b For residential and retail land uses: Low = 5% confidence interval; Best = best fit regression line between generation rates and household median income; and, High = 95% confidence interval. For all other land use categories: High = 90th percentile; Best = mean generation rate; and, Low = 10th percentile.
1.2.3 Short-Term Trash Load Reduction Plan
In February 2012, the City of Brisbane developed a Short-Term Plan that described the current level of control measures implementation and identified the type and extent to which new or enhanced control measures would be implemented to attain a 40% trash load reduction from its MS4 by July 1, 2014. Since that time, the City of Brisbane has begun to implement its short-term plan. Highlights of the control measures implemented to date via the short-term trash reduction plan include:
• Single-Use Carryout Plastic Bag Ordinance On March 18, 2013, the Brisbane City Council adopted a reusable bag ordinance (No. 580 adding Chapter 8.17 to the Brisbane Municipal Code) banning retail establishments from distributing single-use carry-out bags (with only limited exceptions). The ban was developed through close cooperation with San Mateo County Environmental Health, who is also authorized to act as the Enforcement Officer within the city. Due to an extensive outreach with retail businesses, there were no objections expressed by Brisbane businesses during public hearings on this ordinance. Although challenging to quantify, subjective evaluations of on-land trash generation reveals a significantly noticeable reduction in the presence of single-use plastic bags. Staff believes that the “measure of success” identified in the report to Council, “An apparent reduction of single-use bag trash within the city, its waterways, and the surrounding bay and environment”, has been achieved.
• Public Education and Outreach Programs City staff believes that one of the most critical components of reaching long-term trash reduction goals is to inform the public by raising awareness of the issue, and changing behaviors. As a small city with limited staff, Brisbane leverages the county and regional-wide programs provided by the SMCWPPP’s Public Information and Participation Program, and the BASMAA Regional Media Relations Project. While it will be important to continue to engage adults, staff believes that engaging youth, much like the health programs directed to end tobacco use, will ultimately result in the greatest changes, as children provide pressure to their parents to change their patterns of trash disposal.

CITY OF BRISBANE
6
• On-land Trash Cleanups The City has ascertained that the majority of its on-land trash problems occur in two of the new franchise areas, along the side of the roadways. Although the existing Franchise Agreement for solid waste collection does not include a clause for on-land cleanup, the franchisee has agreed to provide a crew of 4 personnel on an as-needed basis (currently scheduled for monthly) to physically walk approximately twelve (12) curb miles of Bayshore Boulevard, Lagoon Way, Sierra Point Parkway, Industrial Way and Main Street. In the fourth quarter of 2013 the following quantities of trash were removed; 2,700 lbs (October), 1,160 lbs (November),and 560 lbs (December)
• Anti-littering and Illegal Dumping Deterrence Activities In an effort to prevent the on-land trash collected as described above from reaching the roadway in the first place, the Brisbane Police Department opened Problem Oriented Policing (P.O.P.) project #13-01 in July 2013 with the focused goal of enforcing the California Vehicle Code and Brisbane Municipal Code prohibitions on unsecured truck loads. Based on the lack of citations against trucks, the next P.O.P. to be scheduled will focus on littering from passenger vehicles. Tunnel Avenue is an isolated, unlit roadway in the City of Brisbane that was the location for a moderately significant quantity of illegal dumping. With only 2-3 uniformed police officers on duty at any given time, manned surveillance was not an option. Working once again with our trash franchisee, the city placed two 14 cubic yard dumpsters outside its corporation yard main gate (which coincidentally is the southern end of Tunnel Avenue). During normal work hours, there are signs indicating, “No Dumping”. These signs are removed at night, and while the use of the bins is not “encouraged” through any public advertisement, the city “turns a blind eye” to any dumping that occurs during off-work and nighttime/weekend periods. This somewhat passive approach has reduced illegal dumping on Tunnel Avenue to a fraction of its previous quantities, and has resulted in the collection of 122.89 tons (81 debris boxes) during calendar year 2013.
14 cubic yard dumpsters outside city corporation yard on Tunnel Avenue
As shown in the following photo, the city has used concrete “k-rail” to prevent illegal dumping along dark, isolated stretches of roadway. The city has also installed surveillance

Long-Term Trash Load Reduction Plan
7
cameras along a high priority area on Guadalupe Canyon Parkway, where physically prohibiting entry to the dumping hot spots was not feasible.
Access to former illegal dumping area restricted by k-rail
In addition to the highlights discussed above, the City has also implemented the following control measures of the short-term trash load reduction plan; installation of fifteen (15) FCTDs treating 100 acres of catchment area, installation of five (5) PCTDs, monthly street sweeping in residential areas, and semi-monthly street sweeping in commercial areas. Control measures described in this Long-Term Plan build upon actions taken to-date via City of Brisbane’s Short-Term Plan. A full description of control measures implemented via short and long-term plans is included in section 3.2. Outcomes associated with short-term plan implementation will be reported in the City of Brisbane’s Fiscal Year 2013-14 Annual Report, scheduled for submittal to the Water Board by September 15, 2014.
1.3 Organization of Long-Term Plan
This Long-Term Plan is organized into the following sections:
1.0 Introduction;
2.0 Scope of the Trash Problem;
3.0 Trash Management Areas and Control Measures;
4.0 Progress Assessment Strategies; and
5.0 References
Section 2.0 provides a description of the extent and magnitude of the trash problem in the City of Brisbane. Control measures that will be implemented by the City of Brisbane as a result of this Long-Term Plan are described in section 3.0. Section 4.0 describes the methods that will be used to assess progress toward trash reduction targets.
CITY OF BRISBANE
8
2.0 SCOPE OF THE TRASH PROBLEM
2.1 Permittee Characteristics
Incorporated in 1961, the City of Brisbane is located in San Mateo County, and has a jurisdictional area of 734 acres. According to the 2010 Census, it has a population of 4,282, with a population density of 213.3 people per square mile and average household size of 2.34. Of the 4,282 residents who call Brisbane home, 19.2% are under the age of 18, 5.0% are between 18 and 24, 31.7% are between 25 and 44, 34.1% are between 45 and 64, and 10% are 65 or older. The median household income was estimated at $90,156 in 2010. The City of Brisbane is home to Bebe corporate offices, Dolby Laboratories, Golden State Lumber, Monster Cable, a portion of Recology Sunset Scavenger; and San Bruno Mountain, the site of a county and state park, which includes the first Habitat Conservation Plan established in the United States.
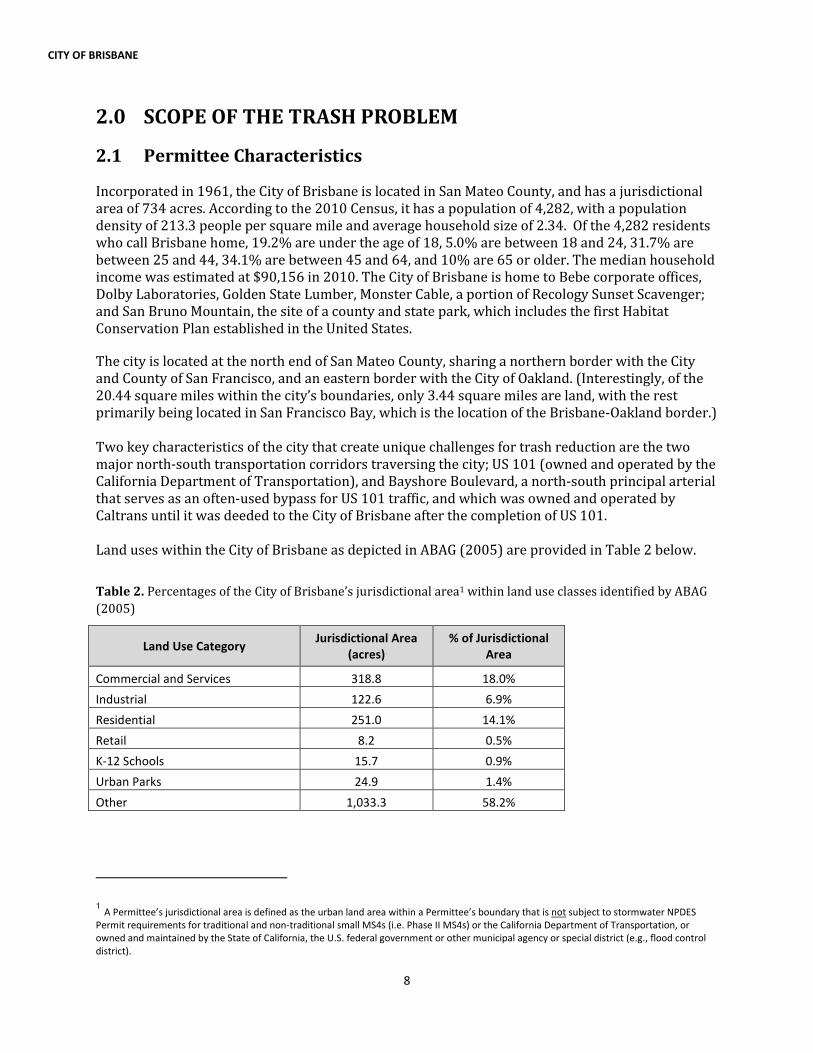
The city is located at the north end of San Mateo County, sharing a northern border with the City and County of San Francisco, and an eastern border with the City of Oakland. (Interestingly, of the 20.44 square miles within the city’s boundaries, only 3.44 square miles are land, with the rest primarily being located in San Francisco Bay, which is the location of the Brisbane-Oakland border.) Two key characteristics of the city that create unique challenges for trash reduction are the two major north-south transportation corridors traversing the city; US 101 (owned and operated by the California Department of Transportation), and Bayshore Boulevard, a north-south principal arterial that serves as an often-used bypass for US 101 traffic, and which was owned and operated by Caltrans until it was deeded to the City of Brisbane after the completion of US 101. Land uses within the City of Brisbane as depicted in ABAG (2005) are provided in Table 2 below.
Table 2. Percentages of the City of Brisbane’s jurisdictional area1 within land use classes identified by ABAG
(2005)
Land Use Category Jurisdictional Area
(acres)
% of Jurisdictional
Area
Commercial and Services 318.8 18.0%
Industrial 122.6 6.9%
Residential 251.0 14.1%
Retail 8.2 0.5%
K-12 Schools 15.7 0.9%
Urban Parks 24.9 1.4%
Other 1,033.3 58.2%
1 A Permittee’s jurisdictional area is defined as the urban land area within a Permittee’s boundary that is not subject to stormwater NPDES
Permit requirements for traditional and non-traditional small MS4s (i.e. Phase II MS4s) or the California Department of Transportation, or
owned and maintained by the State of California, the U.S. federal government or other municipal agency or special district (e.g., flood control
district).

Long-Term Trash Load Reduction Plan
9
2.2 Trash Sources and Pathways
Trash in San Francisco Bay Area creeks and shorelines originates from a variety of sources and is transported to receiving waters by a number of pathways (Figure 3). Of the four source categories, pedestrian litter includes trash sources from high traffic areas near businesses and schools, transitional areas where food/drinks are not permitted (e.g. bus stops), and from public or private special events with high volumes of people. Trash from vehicles occurs due to littering from automobiles and uncovered loads. Inadequate waste container management includes sources such as overflowing or uncovered containers and dumpsters as well as the dispersion of household and business-related trash and recycling materials before, during, and after collection. On-land illegal dumping of trash is the final source category. Trash is transported to receiving waters through three main pathways: 1) Stormwater Conveyances; 2) Wind; and, 3) Direct Dumping. Stormwater or urban runoff conveyance systems (e.g., MS4s) consist of curbs/gutters, and pipes and channels that discharge to urban creeks and the San Francisco Bay shorelines. Wind can also blow trash directly into creeks or the Bay. Lastly, trash in receiving waters can also originate from direct dumping into urban creeks and shorelines. This Long-term Plan and associated trash control measures described in Section 3.0 are focused on reducing trash from one of the transport pathways illustrated in Figure 3– stormwater
conveyances. Specifically, the Long-Term Plan is focused on reducing the impacts of discharges from MS4s to San Francisco Area receiving waters and the protection of associated beneficial uses.
Pedestrian
Litter
Litter from
Vehicles
On-land
Dumping
Source
Categories
Wind Direct Dumping
Urban Creeks and the San Francisco Bay Estuary
Transport
Pathways
Receiving
Waters
Stormwater
Conveyances
Inadequate
Waste Container
Management
Figure 3. Trash sources categories and transport pathways to urban creeks.
The City of Brisbane’s challenges with wind as a transport pathway is focused on three roadways; Bayshore Boulevard, Lagoon Way, and Sierra Point Parkway. These three roadways effectively form the west, north and east boundaries of the Brisbane Lagoon, which is directly connected to the San Francisco Bay. Sierra Point Parkway also leads directly to the Brisbane Marina, which is located on the western edge of the bay. The monthly on-land cleanups of these roadways and the

CITY OF BRISBANE
10
Problem Oriented Policing enforcement project described earlier in Section 1.2.3 are the current mechanisms used to abate this transport pathway. Direct dumping is not identified as a major transport pathway in the City of Brisbane. We do occasionally see a tire abandoned in the Lagoon, and recently a couch was apparently tossed by some miscreants from its location at Fisherman’s Park (located at the northeast corner of the lagoon) into the Lagoon. Combined, we receive only a handful of service requests related to direct dumping into the Lagoon, with none received for our two urban creeks or the shoreline of the Bay.
2.3 Trash Generating Areas
2.3.1 Generation Categories and Designation of Areas
The process and methods used to identify the level of trash generation within the City of Brisbane are described in this section and illustrated in Figure 4.
Figure 4. Trash sources categories and transport pathways to urban creeks.
As a first step, trash generation rates developed through the BASMAA Trash Generation Rates
Project were applied to parcels within the City of Brisbane based on current land uses and 2010 household median incomes. A Draft Trash Generation Map was created as a result of this application. The draft map served as a starting point for the City of Brisbane to identify trash generating levels. Levels of trash generation are depicted on the map using four trash generation rate (gallons/acre/year) categories that are symbolized by 4 different colors illustrated in Table 3.
Table 3. Trash generation categories and associated generation rates (gallons/acre/year).
Category Very High High Moderate Low
Generation Rate
(gallons/acre/year) > 50 10-50 5-10 < 5
The City of Brisbane then reviewed and refined the draft trash generation map to ensure that trash generation categories were correctly assigned to parcels or groups of parcels. City staff refined maps using the following process:
1. Based upon our knowledge of trash generation and problem areas within the City, staff identified areas on the draft map that potentially had incorrect trash generation category designations.

Long-Term Trash Load Reduction Plan
11
2. Trash generation category designations initially assigned to areas identified in step #1 were then assessed and confirmed/refined by the City using the methods listed below.
a. On-Land Visual Assessments
To assist Permittees with developing their trash generation maps, BASMAA developed a Draft On-land Visual Trash Assessment Protocol (Draft Protocol). The Draft Protocol entails walking a street segment and visually observing the level of trash present on the roadway, curb and gutter, sidewalk, and other areas adjacent to the street that could potentially contribute trash to the MS4. Based on the level of trash observed, each segment (i.e., assessment area) was placed into one of four on-land assessment condition categories that are summarized in Table 4. Using the Draft Protocol, the city assessed a total of fifty-one (51) areas to assist in conducting/refining trash generating area designations.
Each of the 51 areas were independently assessed by two (2) individuals using the Draft Protocol, with photos and notes taken, and location accurately identified for all areas. These independent assessments were then reviewed by the Storm Drain Team Leader. The Team Leader’s review focused on ensuring consistency between the Draft Protocol and the recommended condition category of the two assessors. When necessary, the Team Leader personally visited the site(s) to ascertain the most appropriate condition category. The Team Leader then reviewed the final recommended results of all inspections with the City Engineer, for a final determination as to the assignment of condition categories and trash generating area designations.
Table 4. Definitions of on-land trash assessment condition categories.
On-land Assessment
Condition Category Summary Definition
A Effectively no trash is observed in the assessment area.
(Low)
B Predominantly free of trash except for a few pieces that are easily observed. (Moderate)
C Trash is widely/evenly distributed and/or small accumulations are visible on the street, sidewalks, or inlets. (High)
D Trash is continuously seen throughout the assessment area, with large piles and a strong impression of lack of concern for litter in the area. (Very High)
b. Querying Municipal Staff
During initial review of the draft trash generation map, the Public Works Department had multiple conversations with the Planning & Community Development Department regarding zoning. In cases where the approved zoning indicated a higher potential trash generation area than the draft map, that area was either identified for a visual assessment, or was changed to a higher condition category.

CITY OF BRISBANE
12
c. Viewing Areas via Google Maps – Street View
Google Maps was used as a tool to identify potential visual assessment areas and to plot the locations ultimately assessed. All 51 of the areas assessed were physically evaluated by a minimum of two individuals working independently. The Street View found in Google Maps was not used by the City of Brisbane as a substitute for sending a city employee to the area to be assessed.
3. Based on assessments conducted to confirm/refine trash generation category designations, the City created a final trash generation map that depicts the most current understanding of trash generation within the City of Brisbane. The City documented this process by tracking the information collected through the assessments and subsequent refinements to the Draft Trash Generation Map. The City of Brisbane’s Final Trash Generation Map is included as Figure 5 (see next page).
2.3.2 Summary of Trash Generating Areas and Sources
Summary statistics for land use and trash generation categories generated through the mapping and assessment process are presented in Table 5.
Table 5. Percentage of jurisdictional area within the City of Brisbane assigned to each trash generation
category.
Trash
Generation
Category
Jurisdictional
Area (Acres)
Commercia
l and
Services
Industria
l
Residentia
l Retail
K-12
Schools
Urban
Parks Other
Very High 21.3 0.0% 18.5% 0.0% 0.9% 0.0% 0.0% 80.6%
High 59.9 2.9% 14.2% 1.5% 0.7% 0.0% 0.0% 80.7%
Medium 473.1 65.7% 23.3% 0.6% 1.5% 3.3% 5.2% 0.4%
Low 1,220.3 0.5% 0.0% 20.3% 0.1% 0.0% 0.0% 79.1%
Note that the overarching majority of “Other” areas identified as “Very High” or “High” trash generating
areas are three arterial roads, the first two of which traverse the entire south-north extent of the city;
US 101, Bayshore Boulevard, and Tunnel Avenue.

Long-Term Trash Load Reduction Plan
13
Figure 5. Final Trash Generation Map for the City of Brisbane

CITY OF BRISBANE
14
3.0 TRASH MANAGEMENT AREAS AND CONTROL MEASURES
This section describes the control measures that the City of Brisbane has or plans to implement to solve trash problems and achieve a target of 100% (i.e. “No Visual Impact”) trash reduction from their MS4 by July 1, 2022. The selection of control measures described in this section is based on the City of Brisbane’s current understanding of trash problems within its jurisdiction and the effectiveness of control measures designed to reduce trash impacts associated with MS4 discharges. Information on the effectiveness of some trash control measures is currently lacking; therefore, in the absence of this information the City based its selection of control measures on existing effectiveness information, their experience in implementing trash controls and knowledge of trash problems, and costs of implementation. As knowledge is gained through the implementation of these control measures, the City may choose to refine their trash control strategy described in this section. If significant revisions or amendments are made, a revised Long-Term Plan will be submitted to the Water Board through the City’s annual reporting process.
3.1 Management Area Delineation and Prioritization
Consistent with the long-term plan framework, the City of Brisbane delineated and prioritized trash management areas (TMAs) based on the geographical distribution of trash generating areas, types of trash sources, and current or planned control measure locations. TMAs are intended to form the management units by which trash control measure implementation can be tracked and assessed for progress towards trash reduction targets. Once delineated, TMAs were also prioritized for control measure implementation. The City of Brisbane’s primary management areas were selected based on the spatial distribution of trash generating areas and the location of specific existing or planned management actions within Brisbane’s jurisdiction. City staff used the following procedure to designate TMAs: The city’s process for delineating trash management areas was initiated with the end in mind, that is, the ultimate elimination of trash reaching receiving waters. Using that mindset, staff reviewed the trash generation maps, the results of the fifty-one (51) visual assessments conducted, and also gathered “corporate knowledge” from both Operations & Maintenance staff and our trash franchisee to validate and identify the dominant types and most likely sources of trash. With that information in hand, staff then went through a brainstorming session to develop a series of measures that might be effective in reducing trash. This brainstorming session involved multiple meetings, and included stakeholders not only from the Department of Public Works (DPW), but also from the Police Department, the two solid waste firms with whom we are presently negotiating franchise rights, and the City of South San Francisco (who performs Brisbane’s street sweeping). These meetings resulted in a series of selected trash measures that could reasonably be applied, and which would not conflict with each other. With the measures in hand, DPW staff then overlaid the measures that would be most effective at mitigating suspected sources of trash to create Trash Management Areas. The TMAs were numbered with the highest trash generating area (thus, our highest priority for reduction) being assigned the first numbers (i.e., the highest trash generating area with a specific set of measures to be applied was identified as TMA 1). In some cases, it was necessary to create sub-TMAs to reflect the dynamic of areas that although part of one TMA, had their own unique problem sources which would require different measures. As an example, the area in Brisbane
Long-Term Trash Load Reduction Plan
15
known as “Fisherman’s Park” on the Brisbane Lagoon is part of TMA 1, which has its primary boundaries identified by US 101, and receives the majority of its trash load from US 101. However, due to the recreational fishing uses that occur at this Park, measures in addition to those to be applied for TMA 1 (US 101) will be required; thus, the Park received a sub-designation as TMA 1A. In some cases staff elected to create separate TMAs even if the areas were expected to receive similar control measures. These decisions were based on staff’s knowledge and best professional judgment of the locations, including potential challenges of assessing progress in the absence of unique TMAs, and also staff’s expectations of what additional control measures might be applied in future to specific areas if ongoing assessments indicate that currently proposed measures are not achieving the desired results.
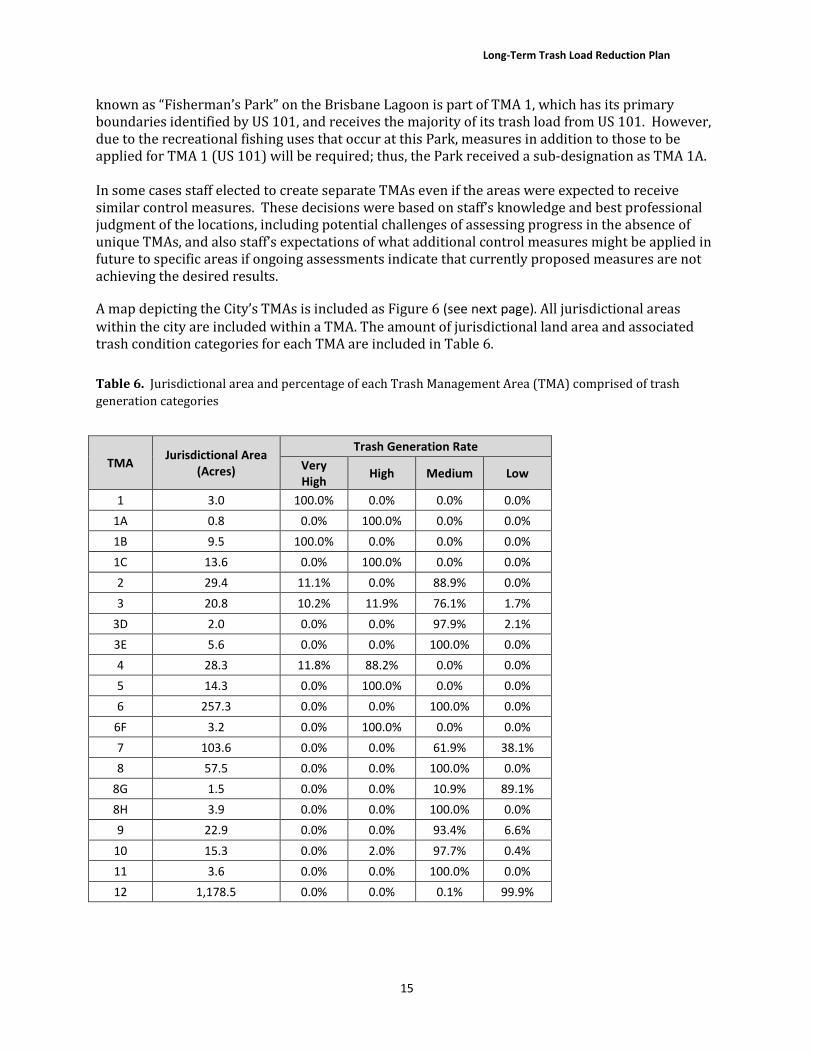
A map depicting the City’s TMAs is included as Figure 6 (see next page). All jurisdictional areas
within the city are included within a TMA. The amount of jurisdictional land area and associated trash condition categories for each TMA are included in Table 6.
Table 6. Jurisdictional area and percentage of each Trash Management Area (TMA) comprised of trash
generation categories
TMA Jurisdictional Area
(Acres)
Trash Generation Rate
Very
High High Medium Low
1 3.0 100.0% 0.0% 0.0% 0.0%
1A 0.8 0.0% 100.0% 0.0% 0.0%
1B 9.5 100.0% 0.0% 0.0% 0.0%
1C 13.6 0.0% 100.0% 0.0% 0.0%
2 29.4 11.1% 0.0% 88.9% 0.0%
3 20.8 10.2% 11.9% 76.1% 1.7%
3D 2.0 0.0% 0.0% 97.9% 2.1%
3E 5.6 0.0% 0.0% 100.0% 0.0%
4 28.3 11.8% 88.2% 0.0% 0.0%
5 14.3 0.0% 100.0% 0.0% 0.0%
6 257.3 0.0% 0.0% 100.0% 0.0%
6F 3.2 0.0% 100.0% 0.0% 0.0%
7 103.6 0.0% 0.0% 61.9% 38.1%
8 57.5 0.0% 0.0% 100.0% 0.0%
8G 1.5 0.0% 0.0% 10.9% 89.1%
8H 3.9 0.0% 0.0% 100.0% 0.0%
9 22.9 0.0% 0.0% 93.4% 6.6%
10 15.3 0.0% 2.0% 97.7% 0.4%
11 3.6 0.0% 0.0% 100.0% 0.0%
12 1,178.5 0.0% 0.0% 0.1% 99.9%

CITY OF BRISBANE
16
Figure 6. Trash Management Area Map for the City of Brisbane
Long-Term Trash Load Reduction Plan
17
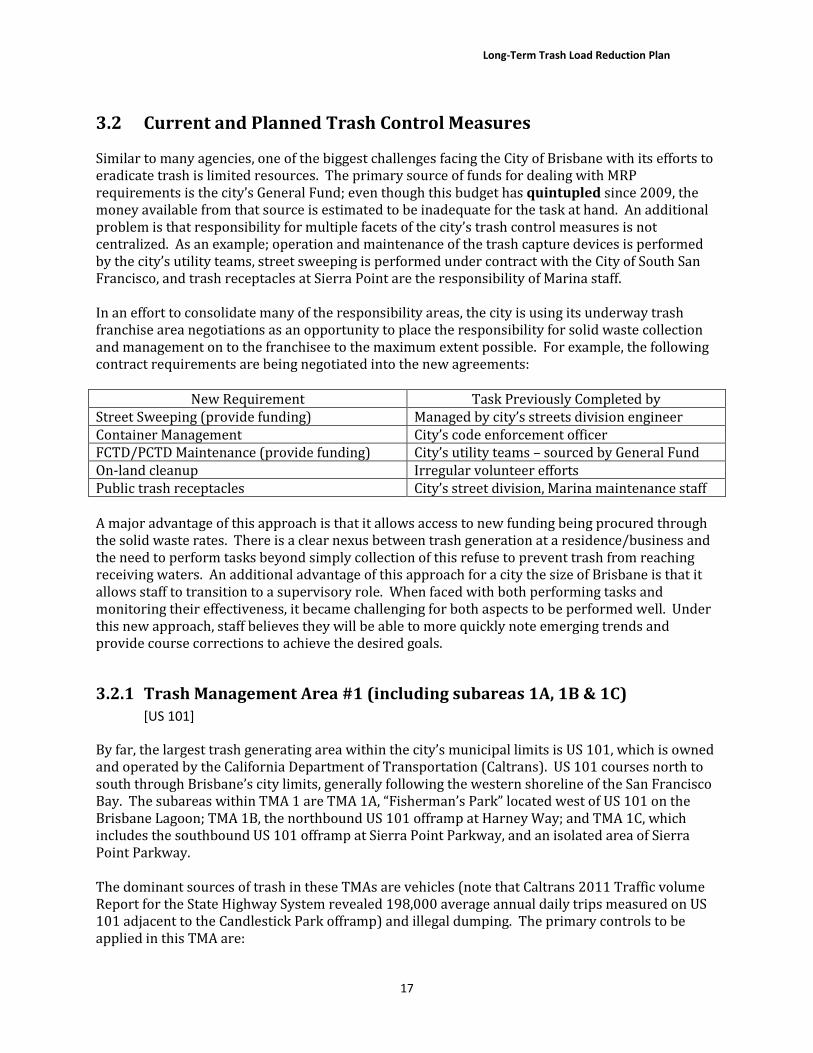
3.2 Current and Planned Trash Control Measures
Similar to many agencies, one of the biggest challenges facing the City of Brisbane with its efforts to eradicate trash is limited resources. The primary source of funds for dealing with MRP requirements is the city’s General Fund; even though this budget has quintupled since 2009, the money available from that source is estimated to be inadequate for the task at hand. An additional problem is that responsibility for multiple facets of the city’s trash control measures is not centralized. As an example; operation and maintenance of the trash capture devices is performed by the city’s utility teams, street sweeping is performed under contract with the City of South San Francisco, and trash receptacles at Sierra Point are the responsibility of Marina staff. In an effort to consolidate many of the responsibility areas, the city is using its underway trash franchise area negotiations as an opportunity to place the responsibility for solid waste collection and management on to the franchisee to the maximum extent possible. For example, the following contract requirements are being negotiated into the new agreements:
New Requirement Task Previously Completed by
Street Sweeping (provide funding) Managed by city’s streets division engineer
Container Management City’s code enforcement officer
FCTD/PCTD Maintenance (provide funding) City’s utility teams – sourced by General Fund
On-land cleanup Irregular volunteer efforts
Public trash receptacles City’s street division, Marina maintenance staff
A major advantage of this approach is that it allows access to new funding being procured through the solid waste rates. There is a clear nexus between trash generation at a residence/business and the need to perform tasks beyond simply collection of this refuse to prevent trash from reaching receiving waters. An additional advantage of this approach for a city the size of Brisbane is that it allows staff to transition to a supervisory role. When faced with both performing tasks and monitoring their effectiveness, it became challenging for both aspects to be performed well. Under this new approach, staff believes they will be able to more quickly note emerging trends and provide course corrections to achieve the desired goals.
3.2.1 Trash Management Area #1 (including subareas 1A, 1B & 1C)
[US 101]
By far, the largest trash generating area within the city’s municipal limits is US 101, which is owned and operated by the California Department of Transportation (Caltrans). US 101 courses north to south through Brisbane’s city limits, generally following the western shoreline of the San Francisco Bay. The subareas within TMA 1 are TMA 1A, “Fisherman’s Park” located west of US 101 on the Brisbane Lagoon; TMA 1B, the northbound US 101 offramp at Harney Way; and TMA 1C, which includes the southbound US 101 offramp at Sierra Point Parkway, and an isolated area of Sierra Point Parkway. The dominant sources of trash in these TMAs are vehicles (note that Caltrans 2011 Traffic volume Report for the State Highway System revealed 198,000 average annual daily trips measured on US 101 adjacent to the Candlestick Park offramp) and illegal dumping. The primary controls to be applied in this TMA are:
CITY OF BRISBANE
18
Coordination with Caltrans
Because US 101 is owned and operated by Caltrans, city staff has little control over the enforcement of vehicle generated trash. Staff regularly communicates with Caltrans regarding debris when its accumulation is observed. City staff is hopefully confident that SFB RWQCB will impose effective trash reduction requirements on Caltrans to mitigate this trash source. Full-Capture Treatment Devices
Recognizing that the ultimate imposition of effective trash reduction requirements may be some time in coming, the city is proposing to install new FCTDs to treat approximately 10 acres of catchment area under the direct influence of trash from US 101. Installation of these devices is based upon successful negotiations with trash franchisees that will result in a revenue stream for capital and O&M costs. On-land Trash Cleanups
Prior to the MRP (that is, before December 2009), cleanup of TMA 1A and 1C was conducted during the annual Brisbane Coastal Cleanup held in conjunction with the WorldWide Coastal Cleanup Day. Additional on-land cleanups for TMAs 1A, 1B and 1C were also conducted based on service requests submitted by the public or self-generated by O&M staff. These activities have continued after the MRP effective date. During the MRP’s effective period, the city established a web and Smartphone based application (“Government Outreach”) that facilitates the submittal of service requests for trash cleanup by allowing users to snap a photo, utilize the GPS-identified location of the photo, and seamlessly submit the request to staff. Also during the MRP, staff piloted the use of on-land cleanups by the trash franchisee. It has been determined that this last measure is effective (see Section 1.2.3), and as such, it will be continued on a monthly basis during this MRP period and after July 2014. Anti-littering and Illegal Dumping Enforcement Activities
In these specific areas there was very little pre-MRP specific trash reduction measures taken; all efforts were reactive to calls for service after the littering/dumping had occurred. As noted above, the implementation of Government Outreach during the MRP has provided an important tool to also react to littering/dumping. In an effort to “encourage” illegal dumpers to not utilize the roadways, the city has also placed unmarked 14 cubic yard dumpsters outside the city’s corporation yard – the availability of these dumpsters is not advertised, but their presence has resulted in a significant quantity of trash being dumped in them, with a noticeable reduction in trash in the adjoining areas. These bins were not available during a 2-week period in 2013, and O&M staff noticed an immediate recommencement of illegal dumping in TMA 1C. In addition to continuing these actions, the city will also transition responsibility for the trash bins in TMA 1A to the solid waste franchisee. We anticipate that this action and the required reporting will result in more litter being placed in trash bins as a result of this responsibility being transferred to the franchisee.
3.2.2 Trash Management Area #2
[Beatty Road/Alana Way]
TMA 2’s boundaries are identified by a business district at the city’s northern limits, which is occupied primarily by Recology/Sunset Scavenger, the trash franchisee for the City & County of San Francisco. The dominant sources of trash in this TMA are vehicles, inadequate container management, and illegal dumping. The primary controls to be applied in this TMA are:

Long-Term Trash Load Reduction Plan
19
Street Sweeping
Prior to the MRP, street sweeping was conducted semi-monthly in this area. That effort has continued through the MRP. Prior to July 2014, and continuing beyond that point, the new trash franchisee for this area will be required to conduct street sweeping on a weekly basis on Beatty Road and Alana Way. When this requirement is in place, signage to restrict parking during scheduled street sweeping and enforcement of same will also be put in place. (Both of these roads presently have primarily dirt shoulders, with limited concrete curb and gutter – the on-land trash cleanup requirements below are expected to supplement trash collection along these roads.) It will not be possible to schedule street sweeping immediately after trash collection in this TMA, because the commercial businesses have varying frequencies of pickup depending on their generation; some businesses may have a weekly pickup, but most have multiple pickups during a single week. On-land Trash Cleanup
On-land trash clean-up prior to the MRP and up until this point in time has been voluntarily conducted by Recology. Starting with the new trash franchise agreement (currently scheduled to be signed in February 2014), the new franchisee will be required to conduct cleanups on a weekly basis (on both Beatty Road and Alana Way) throughout the term of the franchise, unless it can be demonstrated that a less frequent schedule will result in the desired goal of no trash generation. Note that the schedule of weekly on-land cleanups is presently envisioned for this area because it is an occasional location for illegal dumping, and also because of the less than optimal impact of street sweeping as a result of dirt shoulders. Improved Trash Bins/Container Management
Prior to the MRP and up to this point in time, the primary action to deal with container management has been for the city’s code enforcement officer to work with the trash franchisee to identify problem addresses, or to respond to citizen complaints about problem areas, and to then work directly with the address to resolve the complaint/concern. Moving forward, the city will require the trash franchisee in each of the three franchise areas the city has created to establish a system of identifying improper container management (i.e., lids that are not closed, and/or containers that are overfilled) and developing a plan to obtain the desired behavior. This plan will include photographic evidence of the “violation”, a first-time warning that includes options the customer can voluntarily take (i.e., calling for extra pickups, changing to a larger bin, etc.) and that will also include a fine/penalty for further violations. This enhanced action is planned for implementation with the new franchise agreements scheduled for February 2014.
3.2.3 Trash Management Area #3 (including subareas 3D & 3E)
[Industrial Way/Main Street]
TMA 3’s boundaries are identified by a business district at the northern end of Bayshore Boulevard, primarily on Industrial Way. TMA 3D is the road Main Street on the opposite side of Bayshore Boulevard, and TMA 3E is a single business on the east side of Bayshore Boulevard, and contiguous with TMA 3. The dominant source of trash in these TMAs is vehicles, inadequate container management, and illegal dumping. TMA 3 is distinct from TMA 2 because 3 has a much higher percentage of 24-hour business operations, and also has a higher level of non-business hour street parking. While TMA 2 typically only sees street parking during Recology’s standard business hours, TMA 3 sees vehicles parked all day and night. The primary controls to be applied in these TMAs are:

CITY OF BRISBANE
20
Street Sweeping
Prior to the MRP, street sweeping was conducted semi-monthly in this area. That effort has continued through the MRP. Prior to July 2014, and continuing beyond that point, the new trash franchisee for this area will be required to conduct street sweeping on Industrial Way and Main Street) on a weekly basis. Additionally, in this area the city will post and enforce No Parking signs during the scheduled street sweeping period. Enhanced street sweeping is expected to be effective once the enforcement is in place, as this will permit the sweeper to reach the curb and gutter. It will not be possible to schedule street sweeping immediately after trash collection in this TMA, because the commercial businesses have varying frequencies of pickup depending on their generation; some businesses may have a weekly pickup, but most have multiple pickups during a single week. On-land Trash Cleanup
Prior to the MRP, on-land trash cleanup in this area was only conducted reactively to a service request. As noted in section 1.2.3, during the MRP the city has tested the effectiveness of monthly on-land trash cleanups using crews provided by the trash franchisee. Based on the demonstrated value of this action (see Section 1.2.3), the monthly on-land cleanups of Industrial Way and Main Street will be a continuing requirement, and will be a business point required in the trash franchise agreement scheduled to be finalized in February 2014. Improved Trash Bins/Container Management
Prior to the MRP and up to this point in time, the primary action to deal with container management has been for the city’s code enforcement officer to work with the trash franchisee to identify problem addresses, or to respond to citizen complaints about problem areas, and to then work directly with the address to resolve the complaint/concern. Moving forward, the city will require the trash franchisee in each of the three franchise areas the city has created to establish a system of identifying improper container management (i.e., lids that are not closed, and/or containers that are overfilled) and developing a plan to obtain the desired behavior. This plan will include photographic evidence of the “violation”, a first-time warning that includes options the customer can voluntarily take (i.e., calling for extra pickups, changing to a larger bin, etc.) and that will also include a fine/penalty for further violations. This enhanced action is planned for implementation with the new franchise agreements scheduled for February 2014. Note that in both TMA 2 and 3 the primary focus for container management is the commercial bins; there are no residences within these TMAs. Full-Capture Treatment Devices
The City installed three FCTDs in this TMA during the MRP. These devices currently treat 1.16 acres. Trash full-capture devices and inlet screens are maintained twice a year and inspected after significant rain events. Cleaning of trash full-capture devices is accomplished using our sewer combination truck to pressure wash and vacuum all debris from catch basin, connector pipe screen, inlet screen (if installed) and nearby gutter line. Inlet screens are cleaned by hand using rakes and shovels. All functions of automatic and manual retracting inlet screens are tested during every maintenance event. A Trash Capture Device Maintenance Report is filled out for every maintenance event and is logged on our municipality page on Bayareatrashtracker.org. A hard copy of the maintenance reports are kept at the Public Works Operation and Maintenance offices, and available upon request made at the Public Works counter at City Hall.
(continued next page)

Long-Term Trash Load Reduction Plan
21
Additional Full-Capture Treatment Devices
The City has identified an additional 20.6 catchment acres proposed for installation of FCTDs. Installation of these devices is dependent upon successful negotiations with trash franchisees that will result in a revenue stream for capital and O&M costs. The City is working closely with FCTD suppliers to review the feasibility of obtaining certification for large FCTDs so that these devices can be installed in lieu of smaller (currently certified) devices. The primary reason for this work is to minimize the ultimate long-term costs for regular operations and maintenance of FCTDs. Based on the need for this coordination with suppliers, and the time needed to accrue necessary capital, installation of these devices is tentatively scheduled for FY2017-18.
Figure 7 – Trash Full Capture Device Map for the City of Brisbane (following page) shows the extent of the areas currently covered citywide by installed devices.

CITY OF BRISBANE
22
Figure 7. Trash Full Capture Device Map for the City of Brisbane

Long-Term Trash Load Reduction Plan
23
3.2.4 Trash Management Area #4
[Bayshore Boulevard]
TMA 4’s boundaries are the right-of-way limits for Bayshore Boulevard, a 4-lane principal arterial traversing the approximate center of the city from north to south, and generally running parallel to, but offset from, US 101. TMA 4 is distinct from TMA 1 not only in it being owned by Brisbane, rather than Caltrans, but also in that the average annual daily trips is an order of magnitude lower on this road (e.g., less than 20,000 on Bayshore, compared to 198,000 on US 101). Also included in this TMA is the area in front of the city’s corporation yard on Tunnel Avenue. The dominant source of trash in this TMA is vehicles. The primary controls to be applied in this TMA are: Full-Capture Treatment Devices
The City has identified 163.8 catchment acres proposed for installation of FCTDs. Installation of these devices is dependent upon successful negotiations with trash franchisees that will result in a revenue stream for capital and O&M costs. The City is working closely with FCTD suppliers to review the feasibility of obtaining certification for large FCTDs so that these devices can be installed in lieu of smaller (currently certified) devices. The primary reason for this work is to minimize the ultimate long-term costs for regular operations and maintenance of FCTDs. Based on the need for this coordination with suppliers, and the time needed to accrue necessary capital, installation of these devices is tentatively scheduled for FY2017-18. Street Sweeping
Prior to the MRP, street sweeping was conducted semi-monthly in this area. That effort has continued through the MRP. Prior to July 2014, and continuing beyond that point, the new trash franchisee for this area will be required to conduct street sweeping on a weekly basis. Because there are less than 6 homes along Bayshore Boulevard, and very limited parking permitted, there is no currently identified need to post/enforce No Parking during street sweeping periods. In a similar vein, there is no need to schedule the street sweeping to be closely coupled to the residential trash pickup day. On-land Trash Cleanup
Prior to the MRP, on-land trash cleanup in this area was only conducted reactively to a service request. As noted in section 1.2.3, during the MRP the city has tested the effectiveness of monthly on-land trash cleanups using crews provided by the trash franchisee. Based on the demonstrated value of this action (see Section 1.2.3), the monthly on-land cleanups of the entire length of Bayshore Boulevard will be a continuing requirement, and will be a business point required in the trash franchise agreement scheduled to be finalized in February 2014.
Anti-littering Enforcement and Illegal Dumping Enforcement Activities
Pre-MRP, the city installed concrete k-rail on a section of Bayshore Boulevard to restrict access to a problem dumping area. That effort was very successful, as it did not leave room on the shoulder of a 45 MPH arterial street for vehicles to pull over and illegally dump. During the MRP, DPW did coordinate a P.O.P. with the Brisbane Police Department for uncovered truck loads, but the results did not indicate that to be a serious problem. Based on the types of litter found, DPW staff will coordinate with BPD to conduct an anti-litter P.O.P. The city does need to be clear that diverting the focus of the 2-3 police officers on duty for the entire city at any one time will be limited. The city will post warning signs on Bayshore Boulevard advising the fines for littering in an effort to encourage the travelling public to not litter on the roadways.
CITY OF BRISBANE
24
3.2.5 Trash Management Area #5
[Tunnel Avenue/Lagoon Way]
TMA 5’s boundaries are the right-of-way limits for Tunnel Avenue and Lagoon Way. The dominant sources of trash in this TMA are illegal dumping and vehicles. TMA 5 is distinguished from our other roadways by the fact that these are both relatively low volume roadways, and Tunnel Avenue is dark and deserted at night, thus lending itself to illegal dumping. The primary controls to be applied in this TMA are: On-land Trash Cleanup
Prior to the MRP, on-land trash cleanup on Lagoon Way was only conducted reactively to a service request. As noted in section 1.2.3, during the MRP the city has tested the effectiveness of monthly on-land trash cleanups on Lagoon Way using crews provided by the trash franchisee. Based on the demonstrated value of this action (see Section 1.2.3), the monthly on-land cleanups will be a continuing requirement, and will be a business point required in the trash franchise agreement scheduled to be finalized in February 2014. (On-land trash cleanup on Tunnel Avenue is the primary responsibility of the underlying property owner – Sunquest Properties, who has granted the public access to the road, but retains fee ownership.) Anti-littering Enforcement and Illegal Dumping Enforcement Activities
Pre-MRP, the city did attempt to locate and fine illegal dumpers in this area; however, that effort has been plagued with problems, because unless the perpetrators are caught in the act it is exceptionally difficult to associate the trash with who dumped it. The most common story from anyone who had trash in an illegal dump with their name on it was that they had paid some unidentified hauler to remove the trash, and they had no idea it was going to be dumped illegally. In 2013 the city worked with our current single trash franchisee and arranged to place two 14 cubic yard dumpsters outside our corporation yard’s main gate (which coincidentally is the southern end of Tunnel Avenue). During normal work hours, there are signs indicating, “No Dumping”. These signs are removed at night, and while the use of the bins is not “encouraged” through any public advertisement, the city “turns a blind eye” to any dumping that occurs during off-work and nighttime/weekend periods. This somewhat passive approach has reduced illegal dumping on Tunnel Avenue to a fraction of its previous quantities and has resulted in the collection of 122.89 tons (81 debris boxes) during calendar year 2013. This activity is not expected to continue post-MRP. Although the collection of material is impressive, there is concern that the presence of these bins may also have become an alternative for those who might previously have taken their trash to a transfer station, and is thus resulting in an increased diversion to landfill as the trash franchisee is unable to sort the materials after picking up the bins. The city is presently negotiating with the expected trash franchisee for this area to require a weekly on-land cleanup of Tunnel Avenue after the bins are removed from their location. Street Sweeping
Prior to the MRP, street sweeping was conducted semi-monthly in this area. That effort has continued through the MRP. Prior to July 2014, and continuing beyond that point, the new trash franchisee for this area will be required to conduct street sweeping on a weekly basis. Because there are no residences and no parking permitted in this area, there is no currently identified need to post/enforce No Parking during street sweeping periods. In a similar vein, there is no need to schedule the street sweeping to be closely coupled to the residential trash pickup day.
Long-Term Trash Load Reduction Plan
25
3.2.6 Trash Management Area #6 (including subarea 6F)
[Crocker Industrial Park/N Hill & Brisbane Technology Park]
TMA 6’s boundaries are generally identified as Crocker Industrial Park, and the adjoining two office parks; one on North Hill Drive, the other situated at the intersection of Bayshore Boulevard and Guadalupe Canyon Parkway. This TMA is distinct from others because it is the first commercial area with a storm drain system that lends itself to the successful utilization of trash capture devices. Additionally, although illegal dumping does occasionally occur during the nighttime hours, the occurrence rate is so low that a reactive response has produced successful results to date. The dominant sources of trash in these TMAs are vehicles, inadequate container management and illegal dumping. The primary controls to be applied in this TMA are: Full-Capture Treatment Devices
The City installed five FCTDs in this TMA during the MRP. These devices currently treat 17.71 acres. Trash full-capture devices and inlet screens are maintained twice a year and inspected after significant rain events. Cleaning of trash full-capture devices is accomplished using our sewer combination truck to pressure wash and vacuum all debris from catch basin, connector pipe screen, inlet screen (if installed) and nearby gutter line. Inlet screens are cleaned by hand using rakes and shovels. All functions of automatic and manual retracting inlet screens are tested during every maintenance event. A Trash Capture Device Maintenance Report is filled out for every maintenance event and is logged on our municipality page on Bayareatrashtracker.org. A hard copy of the maintenance reports are kept at the Public Works Operation and Maintenance offices, and available upon request made at the Public Works counter at City Hall. Additional Full-Capture Treatment Devices
The City has identified an additional 136 catchment acres proposed for installation of FCTDs. Installation of these devices is dependent upon successful negotiations with trash franchisees that will result in a revenue stream for capital and O&M costs. The City is working closely with FCTD suppliers to review the feasibility of obtaining certification for large FCTDs so that these devices can be installed in lieu of smaller (currently certified) devices. The primary reason for this work is to minimize the ultimate long-term costs for regular operations and maintenance of FCTDs. Based on the need for this coordination with suppliers, and the time needed to accrue necessary capital, installation of these devices is tentatively scheduled for FY2017-18. Street Sweeping
Prior to the MRP, street sweeping was conducted semi-monthly in this area. That effort has continued through the MRP. Prior to July 2014, and continuing beyond that point, the new trash franchisee for this area will be required to conduct street sweeping on a weekly basis. Because there are no residences and no parking permitted in this area, there is no currently identified need to post/enforce No Parking during street sweeping periods. In a similar vein, there is no need to schedule the street sweeping to be closely coupled to the residential trash pickup day. The streets to be swept include; Valley Drive, North Hill, South Hill, West Hill, West Hill Place, Cypress Lane, Park Lane, and Park Place. All of these streets have existing accessible concrete curb and gutter, which allows effective cleaning with a traditional street sweeper. Improved Trash Bins/Container Management
Prior to the MRP and up to this point in time, the primary action to deal with container management has been for the city’s code enforcement officer to work with the trash franchisee to identify problem addresses, or to respond to citizen complaints about problem areas, and to then

CITY OF BRISBANE
26
work directly with the address to resolve the complaint/concern. Moving forward, the city will require the trash franchisee in each of the three franchise areas the city has created to establish a system of identifying improper container management (i.e., lids that are not closed, and/or containers that are overfilled) and developing a plan to obtain the desired behavior. This plan will include photographic evidence of the “violation”, a first-time warning that includes options the customer can voluntarily take (i.e., calling for extra pickups, changing to a larger bin, etc.) and that will also include a fine/penalty for further violations. This enhanced action is planned for implementation with the new franchise agreements scheduled for February 2014. Note that similar to TMA 2 and 3, the primary focus for container management in TMA 6 is the commercial bins because there are no residences in TMA 6. On-land Trash Cleanup
Prior to and during the MRP, on-land trash cleanup has been conducted reactively to reports of dumping for request for service. The City did institute the web/Smartphone Government Outreach application to simplify the process of reporting problems for businesses, citizens, and non-DPW staff. As noted above, the infrequent occurrence of dumping in this TMA will continue to be responded to reactively post-MRP.
3.2.7 Trash Management Area #7
[Sierra Point]
TMA 7 is the land mass known as Sierra Point, a former landfill that has been developed into a commercial office building space, and also home to the Brisbane Marina. The dominant sources of trash in this TMA are pedestrian litter and vehicles. The primary controls to be applied in this TMA are: Street Sweeping
Prior to the MRP, street sweeping was conducted semi-monthly in this area. That effort has continued through the MRP. Prior to July 2014, and continuing beyond that point, the new trash franchisee for this area will be required to conduct street sweeping on a weekly basis. Because there are no residences and no parking permitted in this area, there is no currently identified need to post/enforce No Parking during street sweeping periods. In a similar vein, there is no need to schedule the street sweeping to be closely coupled to the residential trash pickup day. The streets to be swept include; Sierra Point Parkway, Marina Boulevard, Shoreline Court, and the public parking lots. All of these streets have existing accessible concrete curb and gutter, which allows effective cleaning with a traditional street sweeper. Anti-littering Enforcement and Illegal Dumping Enforcement Activities
During the MRP, DPW did coordinate a P.O.P. with the Brisbane Police Department for uncovered truck loads in TMA 4, but the results did not indicate that to be a serious problem. Based on the types of litter found in TMA 7 being similar to the roadside litter found in TMA 4, DPW staff will coordinate with BPD to conduct an anti-litter P.O.P. in this area as well. The city does need to be clear that diverting the focus of the 2-3 police officers on duty for the entire city at any one time will be limited. The city will post warning signs at the entrance to Sierra Point advising the fines for littering in an effort to encourage the travelling public to not litter on the roadways.
Full-Capture Treatment Devices
The City installed one FCTD in this TMA during the MRP. This device currently treats 0.19 acres. Trash full-capture devices and inlet screens are maintained twice a year and inspected after

Long-Term Trash Load Reduction Plan
27
significant rain events. Cleaning of trash full-capture devices is accomplished using our sewer combination truck to pressure wash and vacuum all debris from catch basin, connector pipe screen, inlet screen (if installed) and nearby gutter line. Inlet screens are cleaned by hand using rakes and shovels. All functions of automatic and manual retracting inlet screens are tested during every maintenance event. A Trash Capture Device Maintenance Report is filled out for every maintenance event and is logged on our municipality page on Bayareatrashtracker.org. A hard copy of the maintenance reports are kept at the Public Works Operation and Maintenance offices, and available upon request made at the Public Works counter at City Hall. Additional Full-Capture Treatment Devices
The City has identified an additional 23 catchment acres proposed for installation of FCTDs. Installation of these devices is dependent upon successful negotiations with trash franchisees that will result in a revenue stream for capital and O&M costs. Installation of these devices is tentatively scheduled for FY2015-16.
3.2.8 Trash Management Area #8 (including subareas 8G & 8H)
[VWR/abandoned WW Pump Station]
TMA 8 includes two areas that are former light industry areas. One of these areas is the now-empty building that formerly housed the VWR laboratory supply business; the other is the former location of a wastewater pump station. TMA 8G is the Peninsula Corridor Joint Power Board right-of-way (including the railroad tracks used by Caltrain). TMA 8H includes isolated private businesses abutting Bayshore Boulevard. The dominant sources of trash in these TMAs are container management and illegal dumping. The primary controls to be applied in these TMAs are: Improved trash Bins/Container Management (This action is applicable to 8G and 8H.)
Prior to the MRP and up to this point in time, the primary action to deal with container management has been for the city’s code enforcement officer to work with the trash franchisee to identify problem addresses, or to respond to citizen complaints about problem areas, and to then work directly with the address to resolve the complaint/concern. Moving forward, the city will require the trash franchisee in each of the three franchise areas the city has created to establish a system of identifying improper container management (i.e., lids that are not closed, and/or containers that are overfilled) and developing a plan to obtain the desired behavior. This plan will include photographic evidence of the “violation”, a first-time warning that includes options the customer can voluntarily take (i.e., calling for extra pickups, changing to a larger bin, etc.) and that will also include a fine/penalty for further violations. This enhanced action is planned for implementation with the new franchise agreements scheduled for February 2014. Note that within these three subareas there are commercial sites, and a handful of residential sites, so both types of containers will be managed in these areas. Anti-littering Enforcement and Illegal Dumping Enforcement Activities
The location of the former wastewater pump station is adjacent to a public road, and relatively close to the city’s corporation yard; therefore, the same actions described in TMA 5 (pre-MRP reactive response only, currently “encouraging” use of 14-yard dumpsters outside corporation yard, post-MRP plan to require franchisee to conduct a weekly on-land cleanup) will have some positive impact.
CITY OF BRISBANE
28
However, this site is owned by a sanitary district, and the VWR site is owned privately (and currently vacant). City code enforcement and BPD both work with the two property owners and require them to promptly remove illegal dumping and any signs of graffiti (only applicable to the VWR site). This action will continue for both sites post-MRP.
3.2.9 Trash Management Area #9
[S81/Quarry/BES/LS #4]
TMA 9 includes four areas with unique, but similar issues; Brisbane Fire Department Station 81, the Guadalupe Valley Quarry, the Brisbane Elementary School, and the city’s Sewer Lift Station No. 4 site. The dominant source of trash in this TMA is container management. The primary controls to be applied in this TMA are: Improved trash Bins/Container Management
Prior to the MRP and up to this point in time, the primary action to deal with container management has been for the city’s code enforcement officer to work with the trash franchisee to identify problem addresses, or to respond to citizen complaints about problem areas, and to then work directly with the address to resolve the complaint/concern. Moving forward, the city will require the trash franchisee in each of the three franchise areas the city has created to establish a system of identifying improper container management (i.e., lids that are not closed, and/or containers that are overfilled) and developing a plan to obtain the desired behavior. This plan will include photographic evidence of the “violation”, a first-time warning that includes options the customer can voluntarily take (i.e., calling for extra pickups, changing to a larger bin, etc.) and that will also include a fine/penalty for further violations. This enhanced action is planned for implementation with the new franchise agreements scheduled for February 2014. Note that similar to TMA 2, 3 and 6, the primary focus for container management in TMA 9 is the commercial bins because there are no residences in TMA 9.
Street Sweeping
Prior to the MRP, street sweeping was conducted semi-monthly in this area. That effort has continued through the MRP. Prior to July 2014, and continuing beyond that point, the new trash franchisee for this area will be required to conduct street sweeping on a weekly basis. There are residences in the area adjacent to the Brisbane Elementary School, and the main road in front of the school (San Bruno Avenue) is already signed for No Parking during sweeping. Although signed, the city has not enforced this prohibition. Post-MRP, the city intends to commence an education, encouragement, and then enforcement program to ensure that San Bruno Avenue’s prohibition on parking during sweeping is followed.
Full-Capture Treatment Devices
The City installed one FCTD in this TMA during the MRP. This devices currently treats 1.96 acres. Trash full-capture devices and inlet screens are maintained twice a year and inspected after significant rain events. Cleaning of trash full-capture devices is accomplished using our sewer combination truck to pressure wash and vacuum all debris from catch basin, connector pipe screen, inlet screen (if installed) and nearby gutter line. Inlet screens are cleaned by hand using rakes and shovels. All functions of automatic and manual retracting inlet screens are tested during every maintenance event. A Trash Capture Device Maintenance Report is filled out for every maintenance event and is logged on our municipality page on Bayareatrashtracker.org. A hard copy of the maintenance reports are kept at the Public Works Operation and Maintenance offices, and available upon request made at the Public Works counter at City Hall.

Long-Term Trash Load Reduction Plan
29
3.2.10 Trash Management Area #10 (including subarea 10I)
[Visitacion Avenue/Community Park/Village]
TMA 10 is the city’s business district on Visitacion Avenue. TMA 10I includes the Community Park and the Brisbane Village retail shopping center on Old County Road. The dominant source of trash in this TMA is pedestrian litter. The primary controls to be applied in this TMA are: Street Sweeping
Prior to the MRP, street sweeping was conducted semi-monthly in this area. That effort has continued through the MRP. Prior to July 2014, and continuing beyond that point, the new trash franchisee for this area will be required to conduct street sweeping on a weekly basis. As no parking is presently permitted in this area, there is no need to post and enforce additional no parking during sweeping restrictions. Also, because there are no residences adjacent to the Village, there is no need to coordinate street sweeping with residential trash collection days.
Full-Capture Treatment Devices
The City installed three FCTDs in this TMA during the MRP. These devices currently treat 1.28 acres. Trash full-capture devices and inlet screens are maintained twice a year and inspected after significant rain events. Cleaning of trash full-capture devices is accomplished using our sewer combination truck to pressure wash and vacuum all debris from catch basin, connector pipe screen, inlet screen (if installed) and nearby gutter line. Inlet screens are cleaned by hand using rakes and shovels. All functions of automatic and manual retracting inlet screens are tested during every maintenance event. A Trash Capture Device Maintenance Report is filled out for every maintenance event and is logged on our municipality page on Bayareatrashtracker.org. A hard copy of the maintenance reports are kept at the Public Works Operation and Maintenance offices, and available upon request made at the Public Works counter at City Hall. Additional Full-Capture Treatment Devices
The City has identified an additional 13 catchment acres proposed for installation of FCTDs. Installation of these devices is dependent upon successful negotiations with trash franchisees that will result in a revenue stream for capital and O&M costs. The City is working closely with FCTD suppliers to review the feasibility of obtaining certification for large FCTDs so that these devices can be installed in lieu of smaller (currently certified) devices. The primary reason for this work is to minimize the ultimate long-term costs for regular operations and maintenance of FCTDs. Based on the need for this coordination with suppliers, and the time needed to accrue necessary capital, installation of these devices is tentatively scheduled for FY2018-19. Partial-Capture Treatment Devices
The City installed five PCTDs with inlet screens only in this TMA during the MRP. Inlet screens were chosen due to the main for the storm sewer running through the catch basin. During every maintenance event, a Trash Capture Device Maintenance Report is filled out and logged on our municipality page on Bayareatrashtracker.org. A hard copy of the maintenance reports are kept at the Public Works Operation and Maintenance offices, available upon request.
(continued next page)

CITY OF BRISBANE
30
3.2.11 Trash Management Area #11
[Canyons]
TMA 11 includes three natural canyons in the older residential area of Brisbane; Firth, Costanos and Sierra Point. The dominant source of trash in this TMA is pedestrian litter. The primary control to be applied in this TMA is: On-land Trash Cleanup
Pre and during MRP actions for the cleanup of the city’s canyons is led by the Open Space and Ecology Committee. The effort is completed annually, with the Committee selecting the site for that year, staff developing and leading the effort, and volunteers providing the manual labor necessary to remove both trash and invasive species. Considering the relatively low trash generation found in these canyons, there is no plan to increase the frequency of this activity post-MRP. Full-Capture Treatment Devices
The City installed one FCTD in this TMA during the MRP. This device and the device in TMA 12 currently treat combined total of 77.7 acres. Trash full-capture devices and inlet screens are maintained twice a year and inspected after significant rain events. Cleaning of trash full-capture devices is accomplished using our sewer combination truck to pressure wash and vacuum all debris from catch basin, connector pipe screen, inlet screen (if installed) and nearby gutter line. Inlet screens are cleaned by hand using rakes and shovels. All functions of automatic and manual retracting inlet screens are tested during every maintenance event. A Trash Capture Device Maintenance Report is filled out for every maintenance event and is logged on our municipality page on Bayareatrashtracker.org. A hard copy of the maintenance reports are kept at the Public Works Operation and Maintenance offices, and available upon request made at the Public Works counter at City Hall.
3.2.12 Trash Management Area #12
[Central Brisbane & NER Residential/Levinson Detention Basin]
TMA 12 is the remainder of the very low trash generation areas within the city, including; the older residential area, a newer residential development within the Habitat Conservation Plan area known as the Northeast Ridge, a detention basin south of the PG&E Jefferson-Martin facility, and the underdeveloped area generally known as the Baylands. The dominant sources of trash in this TMA are pedestrian litter and container management. The primary controls to be applied in this TMA are: Street Sweeping
The two major residential areas in Brisbane are very low generators of trash; many of the upper streets in Central Brisbane are without sidewalk, curb and gutter, and are therefore not particularly conducive to walking. This fact, coupled with the area being primarily single family dwellings may explain the low generation. The other residential area, Northeast Ridge (NER), is a newer development with significant landscape responsibilities adjoining the public sidewalks. All three of the Homeowner Associations in this area have private landscape maintenance contractors who pick up litter in addition to their other duties. Pre-MRP, the residential streets were oftentimes only swept during the fall season to pick up humic debris after a windstorm. During the MRP, the residential street sweeping was increased to once

Long-Term Trash Load Reduction Plan
31
per month. Post-MRP, the city is currently negotiating with its two trash franchisees to increase sweeping in the residential areas to monthly. This poses only minimal problems in the NER, because the side of the street where trash cans are placed is generally designed to not permit parking, so there are only small areas where parking enforcement will be required; thus, coordinating the sweeping to occur closely after trash pickup is more of a scheduling issue than any other conflict. The upper streets of central Brisbane pose a significantly different challenge; these streets are without gutters, and the small lot sizes of homes built starting in the early 1900s often do not have adequate onsite parking (in fact, there are residences that have only pedestrian access to their property, with all vehicles parked on the public street). The hilly topography coupled with narrow streets creates an additional challenge for street sweeping equipment. Recognizing that there is no value to a street sweeper driving down the middle of the street, and having no place to shift cars during sweeping, we are actively engaged with our current sweeper to determine possible options. One of these is to employ a device such as a “MadVac” CN 100 sweeper, which includes a 14’ “wanderhose” to access hard to reach areas (see photo below)
to collect on those streets where vehicles cannot be moved. Determining the efficiency and cost-effectiveness of employing such a device will require a test period and ongoing on-land before/after visual assessments. Because of the already identified very low generation rates of this residential area, the implementation and testing period will not occur until late into the next MRP. Improved Trash Bins/Container Management
Prior to the MRP and up to this point in time, the primary action to deal with container management has been for the city’s code enforcement officer to work with the trash franchisee to identify problem addresses, or to respond to citizen complaints about problem areas, and to then work directly with the address to resolve the complaint/concern. Moving forward, the city will require the trash franchisee in each of the three franchise areas the city has created to establish a system of identifying improper container management (i.e., lids that are not closed, and/or containers that are overfilled) and developing a plan to obtain the desired behavior. This plan will include photographic evidence of the “violation”, a first-time warning that includes options the customer can voluntarily take (i.e., calling for extra pickups, changing to a larger bin, etc.) and that will also include a fine/penalty for further violations. This enhanced action is planned for implementation with the new franchise agreements scheduled for February 2014. The primary container focus in this TMA is the residential trash containers.

CITY OF BRISBANE
32
Full-Capture Treatment Devices
The City installed one FCTD in this TMA during the MRP. This device and the device in TMA 11 currently treat combined total of 77.7 acres. Trash full-capture devices and inlet screens are maintained twice a year and inspected after significant rain events. Cleaning of trash full-capture devices is accomplished using our sewer combination truck to pressure wash and vacuum all debris from catch basin, connector pipe screen, inlet screen (if installed) and nearby gutter line. Inlet screens are cleaned by hand using rakes and shovels. All functions of automatic and manual retracting inlet screens are tested during every maintenance event. A Trash Capture Device Maintenance Report is filled out for every maintenance event and is logged on our municipality page on Bayareatrashtracker.org. A hard copy of the maintenance reports are kept at the Public Works Operation and Maintenance offices, and available upon request made at the Public Works counter at City Hall.
3.2.13 Jurisdiction-wide Control Measures
The City of Brisbane enacted a single-use carryout bag ban in place after participating with and leveraging the bi-county efforts of San Mateo County Environmental Health. We are also able to participate in a robust public education and outreach program as a result of our funding provided to the San Mateo Countywide Water Pollution Prevention Program. Single-Use Carryout Bag Policy
Pre-MRP there was no policy banning single-use carry out bags; the City Council adopted the Reusable Bag Ordinance No. 580 on March 18, 2013, adding Chapter 8.17 to the Brisbane Municipal Code, which banned retail establishments from distributing single-use carryout bags. The County of San Mateo Environmental Health Division is authorized at act as the city’s enforcement officer for this policy, and will continue to serve in that role after 2014. In the City of Brisbane there has been little to no negative feedback on the implementation of this ordinance. The community is generally very environmentally conscious, and the retail stores found a new revenue opportunity in selling reusable bags. Polystyrene Foam Food Service Ware Policies
Pre-MRP there was no policy on polystyrene foam food service ware. In 2013 the City Council directed its Open Space and Ecology Committee to develop a citywide ordinance for their review. This ordinance is expected in 2014. Enhanced Storm Drain Inlet Maintenance
The City has a total of 576 storm drain inlets. Pre-MRP, the inlets were cleaned annually in the Fall. All inlets are cleaned using the City’s Sewer Combination Truck. A record of inlets cleaned and inspected are kept using the SMCWPPP Municipal Government Maintenance Activates form. Hard copies of the maintenance activates forms are kept at the Public Works office at City Hall, available upon request. This activity’s frequency and intensity will continue beyond 2014. Public Education and Outreach Programs
The City of Brisbane implemented the following public education and outreach control measures prior to the effective date of the MRP and has continued to implement these measures since MRP adoption.
Long-Term Trash Load Reduction Plan
33
SMCWPPP Public Information and Participation Program (Countywide) Through participation and funding of the San Mateo Countywide Water Pollution Prevention Program’s (SMCWPPP) Public information and Participation program (PIP), the City of Brisbane plans to continue implementing litter reduction outreach to school-age children and youth. SMCWPPP currently oversees a contract to provide direct outreach to grades K-5 in a school setting on behalf of all permittees. The contract is currently held by the Banana Slug String Band, which performs a presentation called “We All Live Downstream.” Through songs and interactive exercises, the message of not putting anything in storm drains (including trash) is delivered, along with basic concepts of the water cycle and the impact of pollution on aquatic life. In addition, SMCWPPP has developed a presentation entitled “Water Pollution Prevention: Problems and Solutions” that is delivered to high school students. This presentation is dedicated to watershed and storm drain education, and the impact of litter on local creeks and waterways. For communities without High Schools, the feeder schools in neighboring communities are specifically targeted for presentations. In addition to outreach at the school sites, a number of student activity guides and coloring books related to watershed health and littering are provided to children who attend outreach events. Schools are also directly targeted in promotion of Coastal Cleanup Day. PIP also participates in a regional anti-littering campaign developed by BASMAA targeted at youth ages 14 to 24. As acting chair of the BASMAA PIP committee, SMCWPPP PIP has participated in the development and dissemination of campaign materials, and has conducted local events on behalf of all jurisdictions to promote the campaign. The campaign, entitled “Be The Street You Want to See”, will soon transition from building a community of youth dedicated to not littering to engaging that community in action. SMCWPPP, through its PIP program, plans to continue to conduct community outreach events on behalf of Permittees who request support. Outreach materials related to litter that are distributed include, in addition to the children’s materials listed above under Outreach to School-age Children or Youth, a promotional sign for cigarette smokers to discourage cigarette litter, and pocket ashtrays are given out. A general stormwater pollution prevention flyer in English and Spanish that includes litter reduction in its messaging is distributed. In addition to table outreach events conducted for specific Permittees, PIP also conducts a Countywide Event aimed to reach residents from throughout the County. PIP manages an online calendar which promotes cleanup events by non-profit organizations throughout the County. In FY 2012, PIP completed its 7th year acting as the county coordinator for Coastal Cleanup Day, increasing volunteer participation by 400% in that time, and trash removal increased by 300%. During the term of the MRP, new outreach materials have been disseminated to the public, including reusable shopping bags to encourage reduction in use of plastic carryout bags. PIP has supported a countywide ban on carryout bags that began implementation on April 22, 2013. In addition, spring cleanups taking place in individual jurisdictions are promoted under one theme by PIP, entitled “Spring Cleaning SMC.” PIP assists in directing volunteers to cleanup events in their communities. SMCWPPP conducted a total of 11 outreach events on behalf of various jurisdictions within the County in 2012-13 fiscal year. SMCWPPP will also continue maintaining an online calendar of cleanups on a monthly basis. In addition to using the SMCWPPP website, flowstobay.org, to promote cleanups, PIP is actively involved in social media platforms such as Facebook, Twitter, You Tube, and Instagram to deliver anti-littering and cleanup messages.
(continued next page)
CITY OF BRISBANE
34
Coastal Cleanup Day Promotion (Countywide) On the countywide level, SMCWPPP also conducts annual press releases for Coastal Cleanup Day, and uses Twitter to promote cleanup events. These releases are intended to gain support and assistance for cleanup events conducted each September in local water bodies. BASMAA Regional Media Relations Project (Regional) Through participation and funding of the BASMAA Regional Media Relations Project, the City of Brisbane is continuing to implement a media relations project partially designed to reduce littering from target audiences in the Bay Area. The goal of the BASMAA Media Relations Project is to generate media coverage that encourages individuals to adopt behavior changes to prevent water pollution, including littering. At least two press releases of PSAs focus on litter issues each year (e.g., creek clean-up activities, preventing litter by using reusable containers, etc.). In FY 12-13 the Media Relations project developed a press release new and recent bag bans in cities around the region. The pitch included information on the litter caused by plastic bags. Information ran on KBAY, KCBS and on eight Bay Area Patch.com sites. The City’s FY 11-12 report detailed the extensive number of outreach programs, both locally, and as supported by the countywide program, that we do and will continue to participate in.
In addition to the control measures continued port-MRP adoption, the City of Brisbane is currently implementing or planning to implement the following public education and outreach control measures that were initiated after the MRP was adopted. BASMAA Youth Outreach Campaign (Regional) Through participation and funding of the regional BASMAA Youth Outreach Campaign, the City of Brisbane is implementing an outreach campaign designed to reduce littering from the target audience in the Bay Area. The Youth Outreach Campaign was launched in September 2011 and aims to increase the awareness of Bay Area Youth (ages 16-24) on litter and stormwater pollution issues, and eventually change their littering behaviors. Combining the ideas of Community Based Social Marketing with traditional advertising, the Youth Campaign aims to engage youth to enable the peer-to-peer distribution of Campaign messages. The Campaign will at least run through FY 13-14. A brief description of the Campaign activities is provided below:
Raising Awareness: The Campaign is raising awareness of the target audience on litter and stormwater pollution issues. Partnerships with youth commissions, high schools, and other youth focused organizations have been developed to reach the target audience. Messages targeted to youth have been created and distributed via paid advertising, email marketing, Campaign website and social networking sites (e.g., Facebook and Twitter).
Engage the Youth - The advertisements encourage the audience to participate in the Youth
Campaign by joining a Facebook page, entering a contest, taking an online quiz, etc., and providing their contact information. At the beginning of FY 12-13, a video contest was launched to get Bay Area youth further involved in the Campaign. An online voting system was used to select the winning entry. Media advertising was conducted to promote the winning entry.
Long-Term Trash Load Reduction Plan
35
Change Behaviors: To move the audience along the behavior change continuum, the Campaign is using electronic platforms such as email marketing and social networking sites to encourage participants to engage in increasingly more difficult behavior changes, such as participating in a clean-up, organizing a clean-up, etc.
Maintain Engagement: The Campaign continues to interact with the target audience through
email marketing and social media websites.
The Youth Campaign includes a pre and post campaign survey to evaluate the effectiveness of outreach. The pre-campaign survey was conducted in FY 11-12 and the post campaign survey will begin in FY 13-14. Other evaluation mechanisms, such as website hits, number of youth engaged in the Campaign’s social networking website, etc. are also being used to evaluate its effectiveness in increasing awareness and changing behavior. Activities in FY 12-13 included maintaining the website www.BetheStreet.org, Facebook page, and Instagram account. A video contest asking participants to submit their best anti-litter video was also conducted. The Be the Street campaign received 52 entries in response to the contest. The winning video was promoted on television, Pandora (online music site), YouTube, Google, and Facebook. The city will participate in as many of the programs developed in the SMCWPPP program (and described in their annual report) as is feasible. The City is also working with its solid waste franchise to develop a Brisbane-specific flyer for inclusion in bill mailers that will discuss trash reduction.
3.2.14 Creek and Shoreline Hot Spot Cleanups
The city completes one shoreline cleanup annually, at the Brisbane Lagoon, which is adjacent to TMA 1. Pre-MRP, the city held an annual Brisbane Coastal Clean Up Day is in conjunction with the World Wide Coastal Clean Up Day. This activity is focused on the Brisbane Lagoon, which is directly connected to the San Francisco Bay. Brisbane Coastal Cleanup day held September 15, 2012 involved 62 people and the removal of approximately 400 lbs of trash. This activity is permittee-led and staffed with volunteers. The annual activity is scheduled to continue beyond 2014. Pre-MRP, the city did not conduct hot spot clean ups. We have a single hot spot location (Bayshore Creek, north of Main Street and west of Bayshore Boulevard, starting 100 yards downstream of the west end of the open channel and ending 100 yards further downstream) in TMA 12. While the numbering for the TMA would indicate that the area is a low trash generator, this hot spot was selected because it is a major storm drain outfall from another city’s stormwater system. As the adjoining city increases its effectiveness of not allowing trash to enter its storm drain system, similar to the efforts of all the MRP permittees, we expect to see a significant reduction in the amount of trash collected at this location. The May 2, 2013 clean up at this area removed .02 cubic yards of trash, which included plastic bags, plastic bottles, glass bottles, Styrofoam; spray paint cans and sports balls.

CITY OF BRISBANE
36
3.2.15 Summary of Trash Control Measures
Trash Management Area 1 (including subareas 1A, 1B & 1C)
• Current Measures – on-land trash clean ups, illegal dumping enforcement, semi-monthly street sweeping
• Planned Measures believed to result in “full” trash reduction – close coordination with Caltrans (including expected requirements imposed by RWQCB), installation of FCTDs, modifications to responsibility for trash receptacles and on-call dumping pickup, weekly street sweeping
Trash Management Area 2
• Current Measures – semi-monthly street sweeping, code enforcement of trash bins
• Planned Measures believed to result in “full” trash reduction – weekly street sweeping, solid waste franchise required weekly on-land cleanups, container management (and citations) transferred to franchisee
Trash Management Area 3 (including subareas 3D & 3E)
• Current Measures – FCTD, semi-monthly street sweeping, reactive on-land trash clean up
• Planned Measures believed to result in “full” trash reduction – installation of FCTDs, weekly street sweeping, monthly on-land clean ups, container management (and citations) transferred to solid waste franchisee
Trash Management Area 4
• Current Measures – semi-monthly street sweeping, monthly on-land trash clean up
• Planned Measures believed to result in “full” trash reduction – installation of FCTDs, weekly street sweeping, continued monthly on-land trash clean up, anti-litter enforcement by police
Trash Management Area 5
• Current Measures – reactive on-land cleanup, illegal dumping enforcement, semi-monthly street sweeping
• Planned Measures believed to result in “full” trash reduction – monthly on-land clean up by solid waste franchisee, weekly street sweeping, anti-litter enforcement by police
Trash Management Area 6 (including subarea 6F)
• Current Measures – FCTD, reactive on-land clean up, semi-monthly street sweeping
• Planned Measures believed to result in “full” trash reduction – installation of FCTDs, container management (and citations) transferred to solid waste franchisee, continued reactive on-land clean ups, weekly street sweeping
Trash Management Area 7
• Current Measures – FCTD, semi-monthly street sweeping
• Planned Measures believed to result in “full” trash reduction – installation of FCTDs, weekly street sweeping, anti-litter enforcement by police, transfer of public trash receptacle management to solid waste franchisee
(continued next page)

Long-Term Trash Load Reduction Plan
37
Trash Management Area 8 (including subareas 8G, 8H & 8I)
• Current Measures – code enforcement management, illegal dumping enforcement
• Planned Measures believed to result in “full” trash reduction – transfer of public trash receptacle management to solid waste franchisee, container management
Trash Management Area 9
• Current Measures – FCTD, code enforcement management, semi-monthly street sweeping
• Planned Measures believed to result in “full” trash reduction – container management (and citations) transferred to solid waste franchisee, weekly street sweeping
Trash Management Area 10 (including subarea 10J)
• Current Measures – FCTD, PCTD, semi-monthly street sweeping
• Planned Measures believed to result in “full” trash reduction – installation of FCTDs, weekly street sweeping
Trash Management Area 11
• Current Measures – FCTD, on-land trash clean up
• Planned Measures believed to result in “full” trash reduction – continuation of the successful staff-led, volunteer clean up in these three natural canyons within the older residential area of the city
Trash Management Area 12
• Current Measures – monthly street sweeping, FCTD
• Planned Measures believed to result in “full” trash reduction – increase street sweeping to weekly (include selected enforcement, and use of specialized equipment), and container management (including citations for noncompliance)

CITY OF BRISBANE
38
3.3 Control Measure Implementation Schedule
Table 7, City of Brisbane trash control measure implementation schedule, on the following page graphically demonstrates the control measures the City of Brisbane will use to achieve “full” trash reduction. The table shows measures initiated prior to December 2009, those that were initiated during the current MRP, and those that will be implemented in later years. In those cases where an action has or will be implemented and will be continued in the following years, the table is marked to reflect the continuation of those actions.

Long-Term Trash Load Reduction Plan
39
Table 7. City of Brisbane trash control measure implementation schedule.
Trash Management Area and
Control Measures
Pr
e-M
RP
Short-Term Long-Term
FY
20
09
-20
10
FY
20
10
-20
11
FY
20
11
-20
12
FY
20
12
-20
13
FY
20
13
-20
14
a
FY
20
14
-20
15
FY
20
15
-20
16
FY
20
16
-20
17
b
FY
20
17
-20
18
FY
20
18
-20
19
FY
20
19
-20
20
FY
20
20
-20
21
FY
20
21
-20
22
c
TMA #1 On-land clean ups x X X X X X X X X X X X X x
Street Sweeping x X X X X X X X X X X X X x
Illegal dumping enforcement2 X X X X X X X X X x
Coordination with Caltrans-FCTD installation x X X X X X X X X X X X X x
Increase street sweeping frequency X X X X X X X x
Solid waste franchise modifications3 X X X X X X X x
TMA #2 Street Sweeping x X X X X X X X X X X X X x
On-land clean ups X X X X X X X X x
Increase street sweeping frequency X X X X X X X x
Container management4 X X X X X X X x
TMA #3 Street Sweeping x X X X X X X X X X X X X x
FCTD-additional FCTDs X X X X X X X X X X x
Increase street sweeping frequency X X X X X X X x
On-land clean ups X X X X X X X x
Container management X X X X X X X x
TMA #4 On-land clean ups x X X X X X X X X X X X X x
Street Sweeping x X X X X X X X X X X X X x
Uncovered load enforcement x X X X X X X X X X X X X x
FCTDs X X X X X
Increase street sweeping frequency X X X X X X X x
Anti-litter enforcement X X X X X X X x
TMA #5 Street Sweeping x X X X X X X X X X X X X x
Illegal dumping enforcement x X X X X X X X X X X X X x
On-land clean ups X X X X X X X x X
Increase street sweeping frequency X X X X X X X x X
Anti-litter Enforcement X X X X X X X x X
TMA #6 FCTD-additional FCTDs X X X X X X X X X X x
Street Sweeping x X X X X X X X X X X X X x
On-land clean ups X X X X X X X X X X X X x
Increase street sweeping frequency X X X X X X X x
Container management X X X X X X X x
TMA #7 Street Sweeping x X X X X X X X X X X X X x
FCTD-additional FCTDs X X X X X X X X X X x
Increase street sweeping frequency X X X X X X X x X
Anti-litter enforcement X X X X X X X x X
Solid waste franchise modifications X X X X X X X x
TMA #8 Illegal dumping enforcement x X X X X X X X X X X X X x
Container management X X X X X X X x
Increase street sweeping frequency X X X X X X X x X
TMA #9 FCTD X X X X X X X X X X x
Street Sweeping x X X X X X X X X X X X X x
Container management X X X X X X X x
Increase street sweeping frequency X X X X X X X x X
TMA #10 FCTD & PCTD – additional FCTDs X X X X X X X X X X x
Street Sweeping x X X X X X X X X X X X X x
Increase street sweeping frequency X X X X X X X x X
TMA #11 On-land clean ups x X X X X X X X X X X X X x
FCTD X X X X X X X X X X x
TMA #12 FCTD X X X X X X X X X X x
Street Sweeping x X X X X X X X X X X X X x
Increase street sweeping frequency X X X x X
Jurisdiction-wide Control Measures
Single-Use Carryout Bag Policy X X X X X X X X X x
Polystyrene Foam Food Service Ware Policies X X X X X X x X
Enhanced Storm Drain Inlet Maintenance x X X X X X X X X X X X X x
Public Education and Outreach Programs X X X X X X X X X X X X x
Creek and Shoreline Hot Spot Cleanups
Coastal Clean Up Day x X X X X X X X X X X X X x
Annual Hot Spot Clean Up aJuly 1, 2014 - 40% trash reduction target bJuly 1, 2017 - 70% trash reduction target cJuly 1, 2022 - 100% trash reduction target
2 As noted in earlier sections, the city will transition away from a “passive” illegal dumping enforcement of allowing the use of 14-cubic yard dumpsters, and transition to a solid waste
franchisee responsibility for regular on-land clean ups. 3 These modifications include negotiation of a solid waste franchise agreement that places responsibility on the franchisee for all public trash receptacles and cleanup of all on-land trash.
4 The city has always used its code enforcement officer to enforce container management; this action will make the responsibility for management (and citation of offenders) the responsibility
of the solid waste franchisee.

DRAFT
Long-Term Trash Load Reduction Plan
40
4.0 PROGRESS ASSESSMENT STRATEGY
Provision C.10.a.ii of the MRP requires Permittees to develop and implement a trash load reduction tracking method that will be used to account for trash load reduction actions and to demonstrate progress and attainment of trash load reduction targets. Early into the MRP, Permittees decided to work collaboratively to develop a trash load reduction tracking method through the Bay Area Stormwater Management Agencies Association (BASMAA). Permittees, Water Board staff and other stakeholders assisted in developing Version 1.0 of the tracking method. On behalf of all MRP Permittees, the Bay Area Stormwater Management Agencies Association (BASMAA) submitted Version 1.0 to the Water Board on February 1, 2012. The Trash Assessment Strategy (Strategy) described in this section is intended to serve as Version 2.0 of the trash tracking method and replace version 1.0 previously submitted to the Water Board. The Strategy is specific to Permittees participating in the San Mateo Countywide Water Pollution Prevention Program (SMCWPPP), including the City of Brisbane. The City intends to implement the Strategy in phases and at multiple geographical scales (i.e., jurisdiction-wide and trash management area) in collaboration with SMCWPPP. Pilot implementation is scheduled for the near-term and as assessment methods are tested and refined, the Strategy will be adapted into a longer-term approach. The Strategy selected by the City is described in the following sections.
4.1 SMCWPPP Pilot Assessment Strategy
The following SMCWPPP Pilot Trash Assessment Strategy (SMCWPPP Pilot Strategy) was developed by SMCWPPP on behalf of the City and other San Mateo County Permittees. The SMCWPPP Pilot Strategy will be implemented at a pilot scale on a countywide basis and includes measurements and observations in the City of Brisbane.
4.1.1 Management Questions
The SMCWPPP Pilot Strategy is intended to answer the following core management questions over time as trash control measures outlined in section 3.0 are implemented and refined:
• Are the MS4 trash load reduction targets being achieved?
• Have trash problems in receiving waters been resolved?
• If trash problems in receiving waters exist, what are the important sources and transport pathways?
The SMCWPPP Pilot Strategy, including indicators and methods, is summarized in this section and fully described in the SMCWPPP Pilot Trash Assessment Strategy, a compendium document submitted to the Water Board on February 1, 2014 on behalf of all SMCWPPP Permittees (SMCWPPP 2014).
4.1.2 Indicators of Progress and Success
The management questions listed in the previous section will be addressed by tracking information and collecting data needed to report on a set of key environmental indicators. Environmental indicators are simple measures that communicate what is happening in the environment. Since trash in the environment is very complex, indicators provide a more practical and economical way to track the state of the environment than if we attempted to record every possible variable.

Long-Term Trash Load Reduction Plan
41
With regard to municipal stormwater trash management, indicators are intended to detect progress towards trash load reduction targets and solving trash problems. Ideally, indicators should be robust and able to detect progress that is attributable to multiple types of trash control measure implementation scenarios. Assessment results should also provide Permittees with an adequate level of confidence that trash load reductions from MS4s have occurred, while also assessing whether trash problems in receiving waters have been resolved. Indicators must also be cost effective, relatively easy to generate, and understandable to stakeholders. Primary and secondary indicators that SMCWPPP Permittees will use to answer core management questions include:
Primary Indicators:
1-A Reduction in the level of trash present on-land and available to MS4s
1-B Effective full capture device operation and maintenance
Secondary Indicators:
2-A Successful levels of trash control measures implementation
2-B Reductions in the amount of trash in receiving waters
In selecting the indicators above, the City of Brisbane in collaboration with SMCWPPP and other SMCWPPP Permittees recognize that no one environmental indicator will provide the information necessary to effectively determine progress made in reducing trash discharged from MS4s and improvements in the level of trash in receiving waters. Multiple indicators were therefore selected. The ultimate goal of municipal stormwater trash reduction strategies is to reduce the impacts of trash associated with MS4s on receiving waters. Indicators selected to assess progress towards this goal should ideally measure outcomes (e.g., reductions in trash discharged). The primary indicators selected by SMCWPPP are outcome-based and include those that are directly related to MS4 discharges. Secondary indicators are outcome or output-based and are intended to provide additional perspective on and evidence of, successful trash control measure implementation and improvements in receiving water condition with regard to trash. As described in Section 2.2, trash is transported to receiving waters from pathways other than MS4s, which may confound our ability to observe MS4-associated reductions in creeks and shorelines. Due to this challenge of linking MS4 control measure implementation to receiving water conditions, the receiving water based indicator is currently considered a secondary indicator. Evaluations of data on the amount of trash in receiving waters that are conducted over time through the Pilot Assessment Strategy will assist the City in further determinations of the important sources and pathways causing problems in local creeks, rivers and shorelines.
4.1.3 Pilot Assessment Methods
This section briefly summarizes the preliminary assessment methods that the City of Brisbane will implement through the SMCWPPP Pilot Strategy to generate indicator information described in the previous section. Additional information on each method can be found in the SMCWPPP Pilot Trash Assessment Strategy submitted to the Water Board by SMCWPPP on behalf of the City.

CITY OF BRISBANE
42
1-A. On-land Visual Assessments
As part of the Trash Generation Map assessment and refinement process (see Section 2.3.1), a draft on-land visual assessment method was developed to assist Permittees in confirming and refining trash generating area designations (i.e., very high, high, moderate and low trash generating categories). The draft on-land visual assessment method is intended to be a cost-effective tool and provide Permittees with a viable alternative to quantifying the level of trash discharged from MS4s. As part of BASMAA’s Tracking California’s Trash grant received from the State Water Resources Control Board (see Section 4.2), quantitative relationships between trash loading from MS4s and on-land visual assessment condition categories will be established. Condition categories defined in the draft on-land assessment protocol are listed in Table 8
Table 8. Trash condition categories used in the draft on-land visual assessment protocol.
Trash Condition
Category Summary Definition
A (Low)
Effectively no trash is observed in the assessment area.
B (Moderate)
Predominantly free of trash except for a few pieces that are easily observed.
C (High)
Trash is widely/evenly distributed and/or small accumulations are visible on the street, sidewalks, or inlets.
D (Very High)
Trash is continuously seen throughout the assessment area, with large piles and a strong impression of lack of concern for litter in the area.
On-land visual assessments will be conducted in trash management areas within the City of Brisbane as part of the SMCWPPP Pilot Trash Assessment Strategy. On-land assessments are intended to establish initial conditions and detect improvements in the level of trash available to MS4s over time. More specifically, on-land visual assessment methods will be conducted in areas not treated by trash full capture devices in an attempt to evaluate reductions associated with other types of control measures. Assessment methods for areas treated by full capture devices are described in this next section. Given that the on-land assessment method and associated protocol have not been fully tested and refined, initial assessments will occur at a pilot scale in the City and in parallel to the Tracking California’s Trash project. The frequency of assessments and number of sites where assessments will occur during the pilot stage are more fully described in the SMCWPPP Pilot Trash Assessment Strategy (SMCWPPP 2014).
(continued next page)
Long-Term Trash Load Reduction Plan
43
1-B. Full Capture Operation and Maintenance Verification
Consistent with the MRP, adequate inspection and maintenance of trash full capture devices is required to maintain full capture designation by the Water Board. The City of Brisbane is currently developing an operation and maintenance verification program (Trash O&M Verification Program), via SMCWPPP, to ensure that devices are inspected and maintained at a level that maintains this designation. The SMCWPPP Trash O&M Verification Program will be modeled on the current O&M verification program for stormwater treatment controls implemented consistent with the Permit new and redevelopment requirements. Additional details regarding the Trash O&M Verification Program can be found in the SMCWPPP Pilot Trash Assessment Strategy (SMCWPPP 2014). 2-A. Control Measure Effectiveness Evaluations
In addition to on-land trash assessments and full capture operation and maintenance verification, the City will also conduct assessments of trash control measures implemented within their jurisdictional area. Assessment methods will be selected based on trash sources and the type of control measure being implemented. Control measure effectiveness evaluations are more fully described in the SMCWPPP Pilot Trash Assessment Strategy. The following are example assessment methods that may be used to demonstrate successful control measure implementation and progress towards trash reduction targets:
• Product-related Ordinances – Annually tracking and reporting the % of businesses in compliance with the ordinance and the percentage requiring a response.
• Street Sweeping – Reporting the frequency of sweeping and ability to sweep to the curb in specific areas where enhanced sweeping is implemented; and/or documenting the level of trash on streets directly after street sweeping during wet and dry weather seasons.
• Public/Private Trash Container Management – Reporting the magnitude and extent of enhanced actions; and/or visually assessing and documenting conditions around public trash containers before and after implementing enhanced control measures.
• Targeted Outreach and Enforcement – Reporting the magnitude and extent of enhanced actions; tracking and reporting the % increase in enforcement actions; and/or visually assessing and documenting the conditions in targeted areas before and after implementing control measures.
• Public Outreach Campaigns – Reporting the magnitude and extent of enhanced actions, and/or conducting pre and post campaign surveys.
• On-land Cleanups and Enforcement – Reporting the magnitude and extent of enhanced actions; visually assessing and documenting the conditions in targeted areas before and after control measure implementation; and/or tracking the volumes of trash removed.
• Illegal Dumping Prevention – Reporting the magnitude and extent of enhanced actions; and/or tracking and reporting improvements in the number of incidents.

CITY OF BRISBANE
44
• Business Improvement Districts (if any are created)– Reporting the magnitude and extent of enhanced actions; and/or visually assessing and documenting the conditions in BID areas before and after implementing control measures.
• Prevention of Uncovered Loads - Reporting the magnitude and extent of enhanced actions; tracking and reporting the decreases in the number of incidents; and/or visually assessing and documenting the conditions in targeted areas before and after implementing control measures.
• Partial Capture Devices – Reporting the magnitude and extent of enhanced actions; and/or visually assessing and the amount of trash in storm drains or downstream of partial capture devices.
2-C. Receiving Water Condition Assessments
The ultimate goal of stormwater trash management in the Bay Area is to significantly reduce the amount of trash found in receiving waters. In the last decade, San Mateo County Permittees and volunteers have collected data on the amounts of trash removed during cleanup events. More recently, Permittees have conducted trash assessments in creek and shoreline hotspots using standardized assessment methods. In an effort to answer the core management question Have trash problems in receiving waters been resolved?, the City of Brisbane plans to continue conducting receiving water condition assessments at trash hot spots a minimum of one time per year. Assessment will be conducted consistent with Permit hot spot cleanup and assessment requirements. Additional information on receiving water assessment methods can be found in the SMCWPPP Pilot Trash Assessment Strategy (SMCWPPP 2014).
4.2 BASMAA “Tracking California’s Trash” Project
The SMCWPPP Pilot Assessment Strategy described in the previous section recognizes that outcome-based trash assessment methods needed to assess progress toward trash reduction targets are not well established by the scientific community. In an effort to address these information gaps associated with trash assessment methods, the Bay Area Stormwater Management Agencies Association (BASMAA), in collaboration with SMCWPPP, the 5 Gyres Institute, San Francisco Estuary Partnership, the City of Los Angeles, and other stormwater programs in the Bay Area, developed the Tracking California’s Trash Project. The Project is funded through a Proposition 84 grant awarded to BASMAA by the State Water Resources Control Board (SWRCB) who recognized the need for standardized trash assessment methods that are robust and cost-effective. The Project is intended to assist BASMAA member agencies in testing trash assessment and monitoring methods needed to evaluate trash levels in receiving waters, establish control measures that have an equivalent performance to trash full capture devices, and assess progress in trash reduction over time. The following sections provide brief descriptions of tasks that BASMAA will conduct via the three-year Project. Full descriptions of project scopes, deliverables, and outcomes will be developed as part of the task-specific Sampling and Analysis Plans required by the SWRCB during the beginning of the Project. The Project is currently underway and will continue through 2016.
(continued next page)

Long-Term Trash Load Reduction Plan
45
4.2.1 Testing of Trash Monitoring Methods
BASMAA and the 5 Gyres Institute will evaluate the following two types of assessment methods as part of the Project:
• Trash Flux Monitoring – Trash flux monitoring is intended quantify the amount of trash flowing in receiving waters under varying hydrological conditions. Flux monitoring will be tested in up to four receiving water bodies in San Francisco Bay and/or the Los Angeles areas. Methods selected for evaluation and monitoring will be based on a literature review conducted during this task and through input from technical advisors and stakeholders. Monitoring is scheduled to begin in 2014 and will be completed in 2016.
• On-land Visual Assessments – As part of the Project, BASMAA will also conduct an evaluation of on-land visual assessment methods that are included in the SMCWPPP Pilot Assessment Strategy. The methods are designed to determine the level of trash on streets and public right-of-ways that may be transported to receiving waters via MS4s. BASMAA plans to conduct field work associated with the evaluation of on-land visual assessment at a number of sites throughout the region. To the extent practical, sites where the on-land methods evaluations take place will be coordinated with trash flux monitoring in receiving waters. On-land assessments will occur in areas that drain to trash full capture devices, and all sites will be assessed during wet and dry weather seasons in order to evaluate on-land methods during varying hydrologic conditions. Monitoring is scheduled to begin in 2014 and will be completed in 2016.
4.2.2 Full Capture Equivalent Studies
Through the implementation of BASMAA’s Tracking California’s Trash grant-funded project, a small set of “Full Capture Equivalent” projects will also be conducted in an attempt to demonstrate that specific combinations of control measures will reduce trash to a level equivalent to full capture devices. Initial BMP combinations include high-frequency street sweeping, and enhanced street sweeping with auto-retractable curb inlet screens. Other combinations will also be considered. Studies are scheduled to begin in 2014 and will be completed in 2016.
4.3 Long-Term Assessment Strategy
The City of Brisbane is committed to implementing standardized assessment methods post-2016 based on the lessons learned from pilot assessments and studies that will occur between 2014 and 2016. Assessment activities described in the previous sections will evaluate the utility of different assessment methods to demonstrate progress towards trash reduction targets and provide recommended approaches for long-term implementation. Lessons learned will be submitted to the Water Board with the FY 2015-2016 Annual Report and a revised Strategy will be developed and submitted, if necessary. The revised Strategy will include agreed upon assessment methods that will be used to demonstrate progress during the remaining term of trash reduction requirements. Reporting using the new/revised methods will begin with the FY 2016-17 Annual Report.
4.4 Implementation Schedule
The implementation schedule for the SMCWPPP Pilot Implementation Strategy, BASMAA’s Tracking California’s Trash project, and the Long-Term Assessment Strategy are included in Table 9. Load

CITY OF BRISBANE
46
reduction reporting milestones are also denoted in the table. The schedule is consistent with the need for near-term pilot assessment results to demonstrate progress toward short-term targets, while acknowledging the need for testing and evaluation of assessment methods and protocols prior to long-term implementation. For more detailed information on implementation timelines, refer to the SMCWPPP Pilot Trash Assessment Strategy (SMCWPPP 2014) and monitoring plans developed as part of BASMAA’s Tracking California’s Trash project.
Table 9. City of Brisbane trash progress assessment implementation schedule.
Trash Assessment Programs and Methods
Pr
ior
to F
Y
20
13
-14
Fiscal Year
20
13
-14
a
20
14
-15
20
15
-16
20
16
-17
b
20
17
-18
20
18
-19
20
19
-20
20
20
-21
20
21
-22
c
Pilot Trash Assessment Strategy (SMCWPPP)
On-land Visual Assessments
Initial (Baseline) Assessments X
Pilot Progress Assessments X X X X
Full Capture Operation and Maintenance Verification X X X
Control Measure Effectiveness Evaluations X X X X X
Receiving Water Condition Assessments X X X X X
Tracking California’s Trash Project (BASMAA)
Testing of Trash Monitoring Methods
Trash Flux Monitoring Protocol Testing X X X
On-land Visual Assessment Evaluations X X X
Full Capture Equivalent Studies X X X
Long-Term Trash Assessment Strategy (SMCWPPP) X X X X X
aJuly 1, 2014 - 40% trash reduction target bJuly 1, 2017 - 70% trash reduction target cJuly 1, 2022 - 100% trash reduction target

DRAFT
Long-Term Trash Load Reduction Plan
47
5.0 REFERENCES
Allison R.A. and F.H.S. Chiew 1995. Monitoring stormwater pollution from various land uses in an urban catchment.
Proceedings from the 2nd International Symposium on Urban Stormwater Management, Melbourne, 551-516.
Allison, R.A., T.A. Walker, F.H.S. Chiew, I.C. O’Neill and T.A McMahon 1998. From Roads to rivers: Gross pollutant removal from urban waterways. Report 98/6. Cooperative Research Centre for Catchment Hydrology. Victoria, Australia. May 1998.
Armitage, N. 2003. The removal of urban solid waste from stormwater drains. Prepared for the International Workshop on Global Developments in Urban Drainage Management, Indian Institute of Technology, Bombay, Mumbai India. 5-7 February 2003.
Armitage, N. 2007. The reduction of urban litter in the stormwater drains of South Africa. Urban Water Journal Vol. 4, No. 3: 151-172. September 2007.
Armitage N., A. Rooseboom, C. Nel, and P. Townshend 1998. “The removal of Urban Litter from Stormwater Conduits and Streams. Water Research Commission (South Africa) Report No. TT 95/98, Prestoria.
Armitage, N. and A. Rooseboom 2000. The removal of urban litter from stormwater conduits and streams: Paper 1 – The quantities involved and catchment litter management options. Water S.A. Vol. 26. No. 2: 181-187.
ABAG (Association of Bay Area Governments). 2005. Bay Area Land Use Geographical Information Systems Datalayer.
BASMAA (Bay Area Stormwater Management Agencies Association). 2011a. Progress Report on Methods to Estimate Baseline Trash Loads from Bay Area Municipal Stormwater Systems and Track Loads Reduced. February 2011.
BASMAA (Bay Area Stormwater Management Agencies Association). 2011b. Method to Estimate Baseline Trash Loads from Bay Area Municipal Stormwater Systems: Technical Memorandum #1. Prepared by EOA, Inc. April 2011.
BASMAA (Bay Area Stormwater Management Agencies Association). 2011c. Sampling and Analysis Plan. Prepared by EOA, Inc. April 2011.
BASMAA (Bay Area Stormwater Management Agencies Association). 2012. Trash Baseline Generation Rates: Technical Report. Prepared by EOA, Inc. February 1, 2012.
County of Los Angeles. 2002. Los Angeles County Litter Monitoring Plan for the Los Angeles River and Ballona Creek Trash Total Maximum Daily Load. May 30, 2002.
County of Los Angeles. 2004a. Trash Baseline Monitoring Results Los Angeles River and Ballona Creek Watershed. Los Angeles County Department of Public Works. February 17, 2004.
County of Los Angeles 2004b. Trash Baseline Monitoring for Los Angeles River and Ballona Creek Watersheds. Los Angeles County Department of Public Works. May 6, 2004.
Kim, L.H, M. Kayhanian, M.K. Stenstrom 2004. Event mean concentration and loading of litter from highways during storms. Science of the Total Environment Vol 330: 101-113.
Lippner, G., R. Churchwell, R. Allison, G. Moeller, and J. Johnston 2001. A Scientific Approach to Evaluating Storm Water Best Management Practices for Litter. Transportation Research Record. TTR 1743, 10-15.
SMCWPPP (San Mateo Countywide Water Pollution Prevention Program). 2014. Pilot Trash Assessment Strategy. Prepared by EOA. February 1.