Long Term Services & Supports Measure Development Meeting
41
Long Term Services & Supports Measure Development Meeting February 26, 2019
Transcript of Long Term Services & Supports Measure Development Meeting

Long Term Services & Supports Measure Development Meeting
February 26, 2019
Agenda
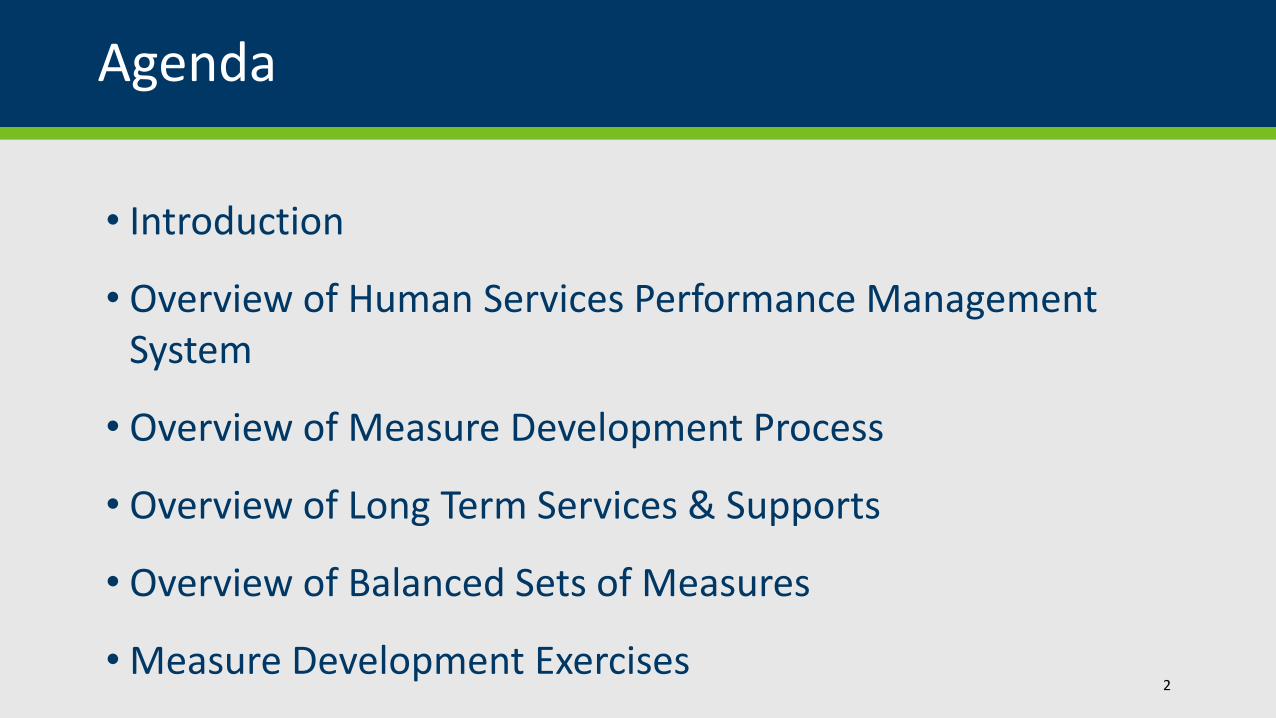
• Introduction
• Overview of Human Services Performance Management System
• Overview of Measure Development Process
• Overview of Long Term Services & Supports
• Overview of Balanced Sets of Measures
• Measure Development Exercises2

Overview
Overview of Human Services Performance Management System
3
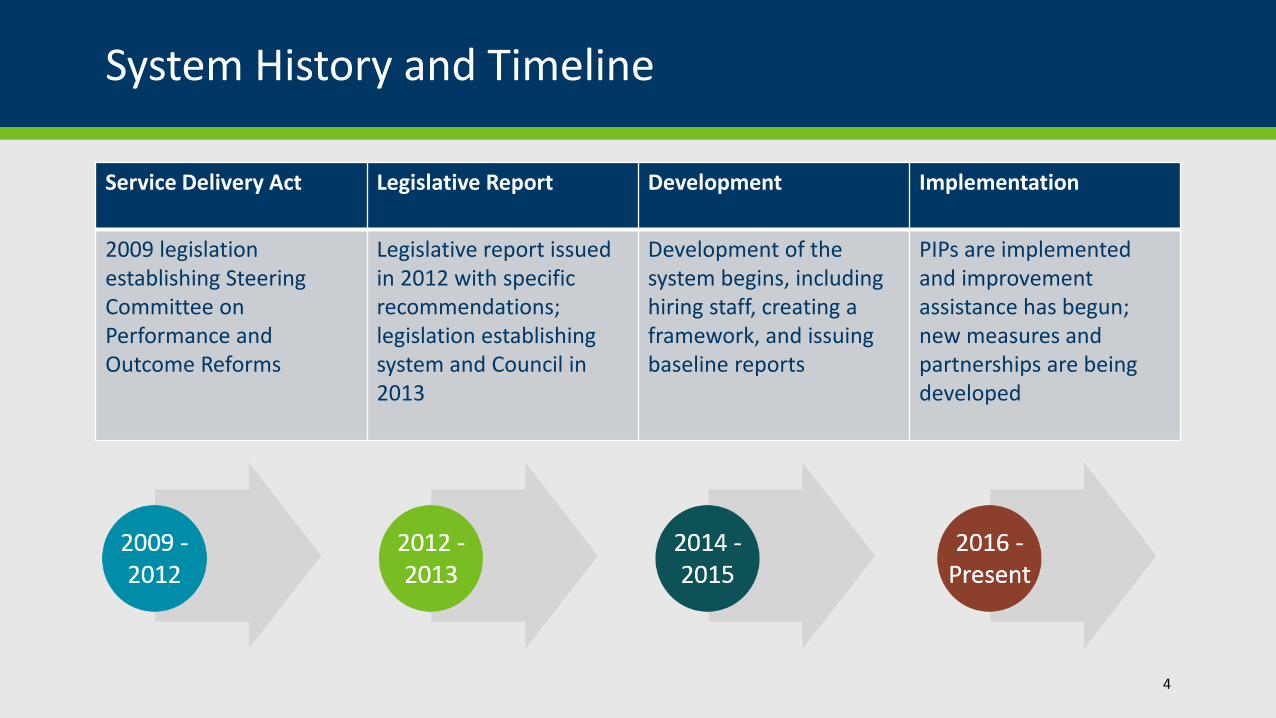
System History and Timeline
Service Delivery Act Legislative Report Development Implementation
2009 legislation establishing Steering Committee on Performance and Outcome Reforms
Legislative report issued in 2012 with specific recommendations; legislation establishing system and Council in 2013
Development of the system begins, including hiring staff, creating a framework, and issuing baseline reports
PIPs are implemented and improvement assistance has begun; new measures and partnerships are being developed
4
Mission and Values
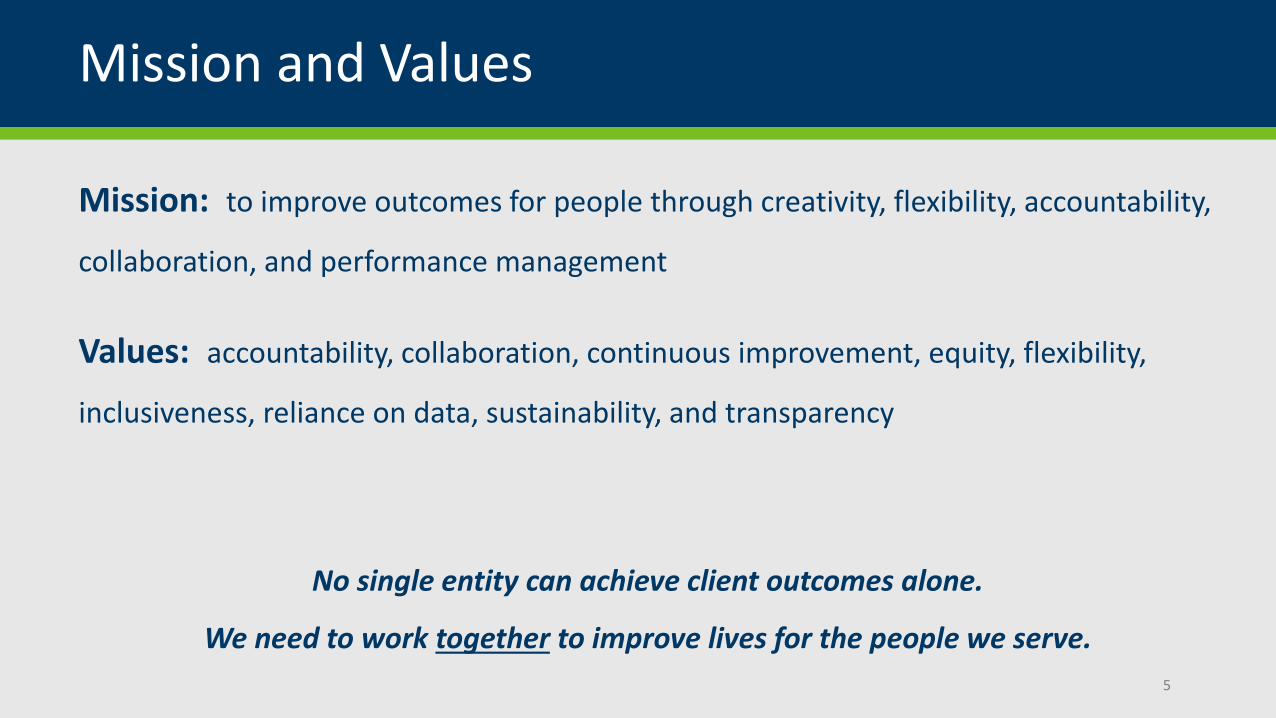
Mission: to improve outcomes for people through creativity, flexibility, accountability,
collaboration, and performance management
Values: accountability, collaboration, continuous improvement, equity, flexibility,
inclusiveness, reliance on data, sustainability, and transparency
No single entity can achieve client outcomes alone.
We need to work together to improve lives for the people we serve.
5

Performance Management System Goals
The Human Services Performance
Management System creates an
opportunity for the Minnesota
Department of Human Services, counties,
and community partners to work more
closely together to improve the lives of
people served.
6
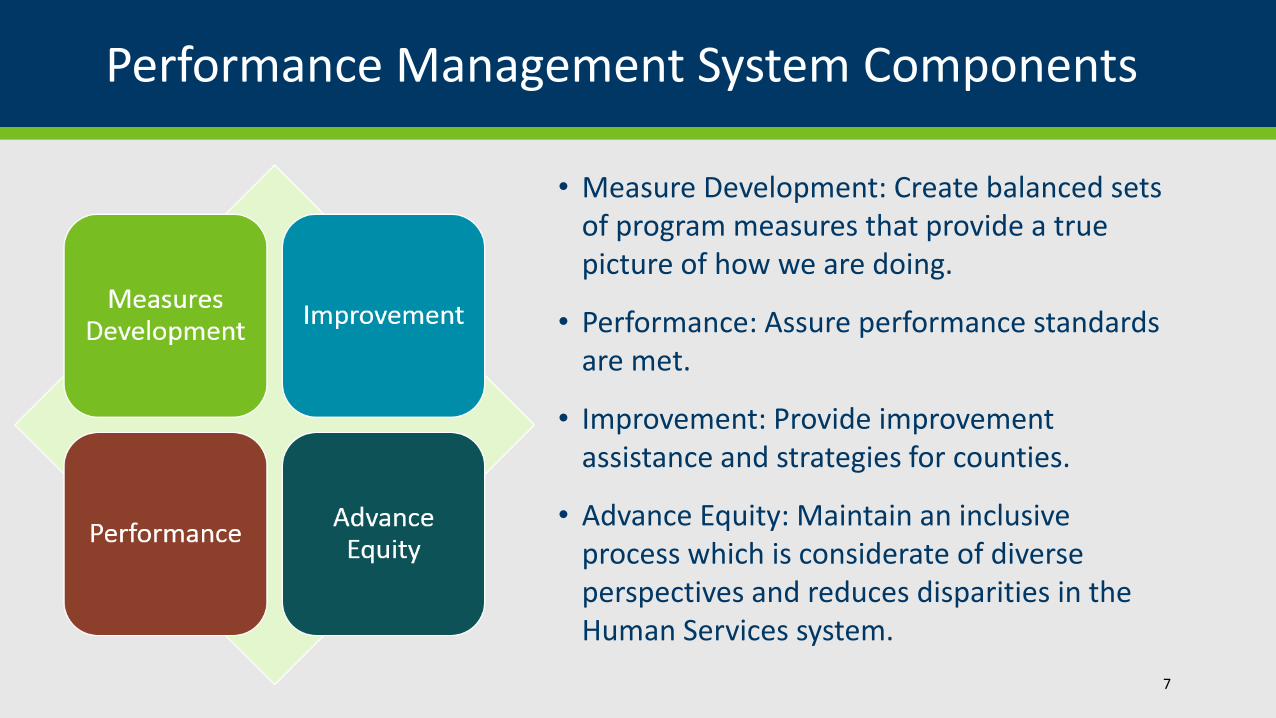
Performance Management System Components
• Measure Development: Create balanced sets of program measures that provide a true picture of how we are doing.
• Performance: Assure performance standards are met.
• Improvement: Provide improvement assistance and strategies for counties.
• Advance Equity: Maintain an inclusive process which is considerate of diverse perspectives and reduces disparities in the Human Services system.
7
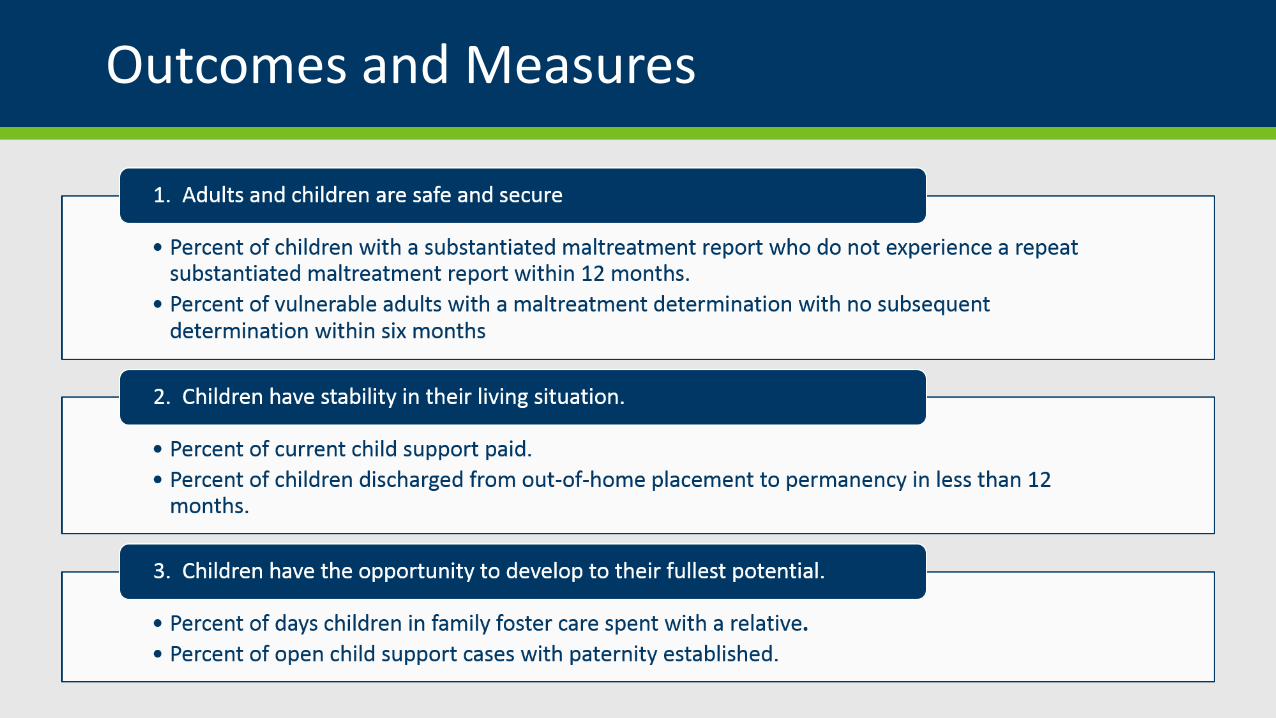
Outcomes and Measures
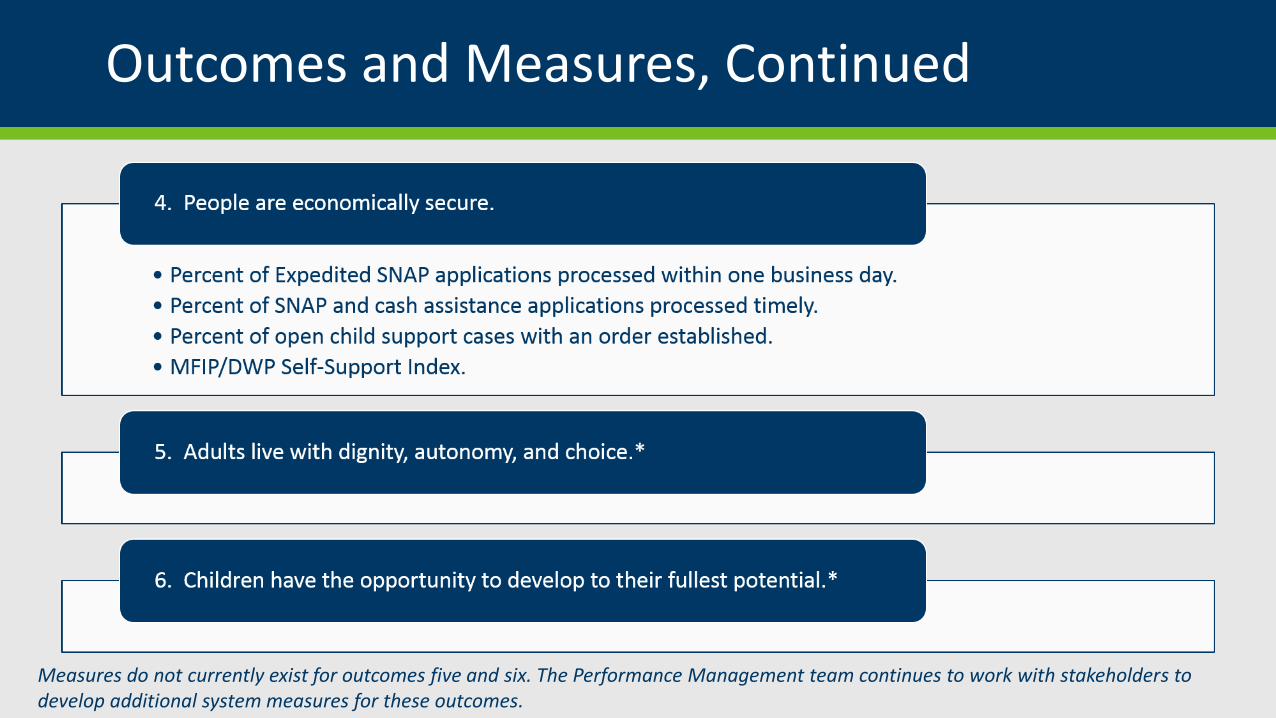
Outcomes and Measures, Continued
Measures do not currently exist for outcomes five and six. The Performance Management team continues to work with stakeholders to develop additional system measures for these outcomes.

Overview of Measures Development
Overview of Measure Development Process
10

Measure Development Approach
• Bring together stakeholders from DHS, Counties, and the community to develop shared measures.
• Performance management is more than developing measures. A successful system integrates the use of data into all facets of the organization.
• We meet our partners where they are on their performance management journey to develop a system that meets their organizations unique needs.
• We leverage our partners expertise throughout the process of developing a performance management system.
11

Team Roles and Responsibilities
Team Team Members Team Responsibilities
Steering Committee
• Representatives from DHS• Representatives from Counties• Agency & County Performance
• Provide background information and understanding of DHS Long Term Services and Supports
• Provide feedback on key deliverables• Guide measure development work
Data Team • Representatives from Policy, Program, and Data areas
• Conduct research and provide information about DHS Long Term Services and Supports
• Collect information needed to review DHS Long Term Services and Supports
Measure Development Team
• Representatives from DHS• Representatives from Counties• Provider representatives• Partners and advocates
• Provide subject matter expertise, experience, and strategic thinking to develop Performance Measures for DHS Long Term Services and Supports
Office of Strategy and Performance Project Team
• Carol Becker, project manager• Olufemi Fajolu, county data• Gary Mortensen, manager,
Human Services Performance Management
• Manage the measurement development, gaps analysis, and data infrastructure phases of the project
• Facilitate the outcome measures development conversations• Collect and manage project information from County and DHS teams• Synthesize key findings to develop measurement inventory, data inventory and
program inventory.
12

Project Overview (page 1 of 2)
• Steering committee of DHS and county staff identifies participants and reviews meeting agenda.
• Host meeting of DHS, county and community folks to discussion current measures, the Balanced Framework and potential new measures. • Outcome: List of potential new measures.
• Give list of potential new measures to data team to determine what is feasible.
• Get participants from meeting back together to discuss which potential new measures:• are feasible.• have data quality issues and what could be done about that.• could be built into future system development.• will not be possible anytime soon.
13

Project Overview (page 2 of 2)
• For measures that are currently possible, move them into the existing measurement processes.
• Develop draft measures for each county. Give them a year to adjust their processes before moving the measure into the PIP process.
• For measures that have data quality issues, carry out discussions among DHS, counties and providers to identify what is needed to improve data quality.
• For measures that could be included in future system development, ensure that these needs are included in planning documents.
• For measures that are not possible, hold further discussions on how to address these needs.
• Repeat process as necessary.
14
Overview of Long Term Services and Supports
Overview of Long-Term Services and Supports
15

Overview of Balanced Sets of Measures
Overview of Balanced Sets of Measures
16
Statute Language
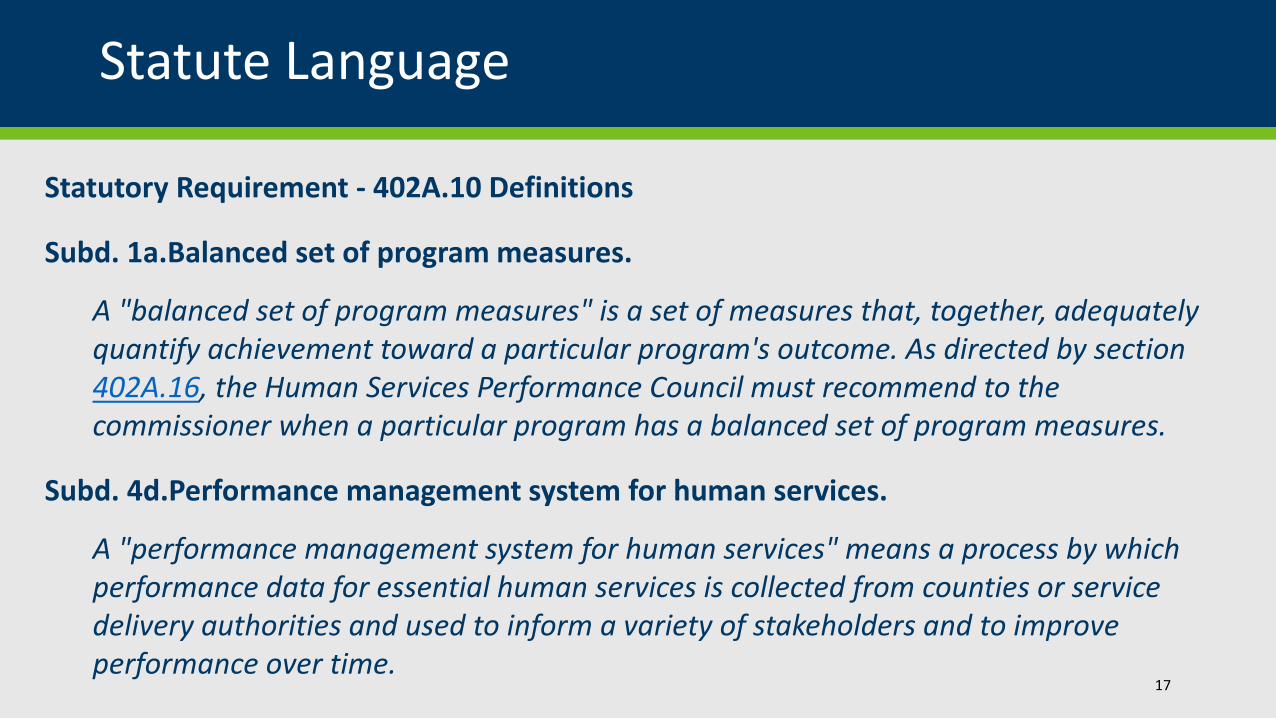
Statutory Requirement - 402A.10 Definitions
Subd. 1a.Balanced set of program measures.
A "balanced set of program measures" is a set of measures that, together, adequately quantify achievement toward a particular program's outcome. As directed by section 402A.16, the Human Services Performance Council must recommend to the commissioner when a particular program has a balanced set of program measures.
Subd. 4d.Performance management system for human services.
A "performance management system for human services" means a process by which performance data for essential human services is collected from counties or service delivery authorities and used to inform a variety of stakeholders and to improve performance over time.
17

Research and Planning
Research
• Partnered with the Management Analysis and Development team at MN Management and Budget to guide us in the development of planning Balanced Sets of Measures
• Researched scorecards and performance measures used by other organizations
• Interviewed organizations with strong performance management systems
• Presented to MACSSA Forum for feedback
18

Balanced Sets of Measures – Guiding Principles
• A list of ten guiding principles was created to ensure measures are developed with people and communities at the core, the stakeholders involved, and using the principles of Results-Based Accountability.
• The measures developed will represent the core components that create a strong program so that we can identify and promote what is working, identify systemic issues and work with counties to improve performance.
19
Balanced Sets of Measures – Categories
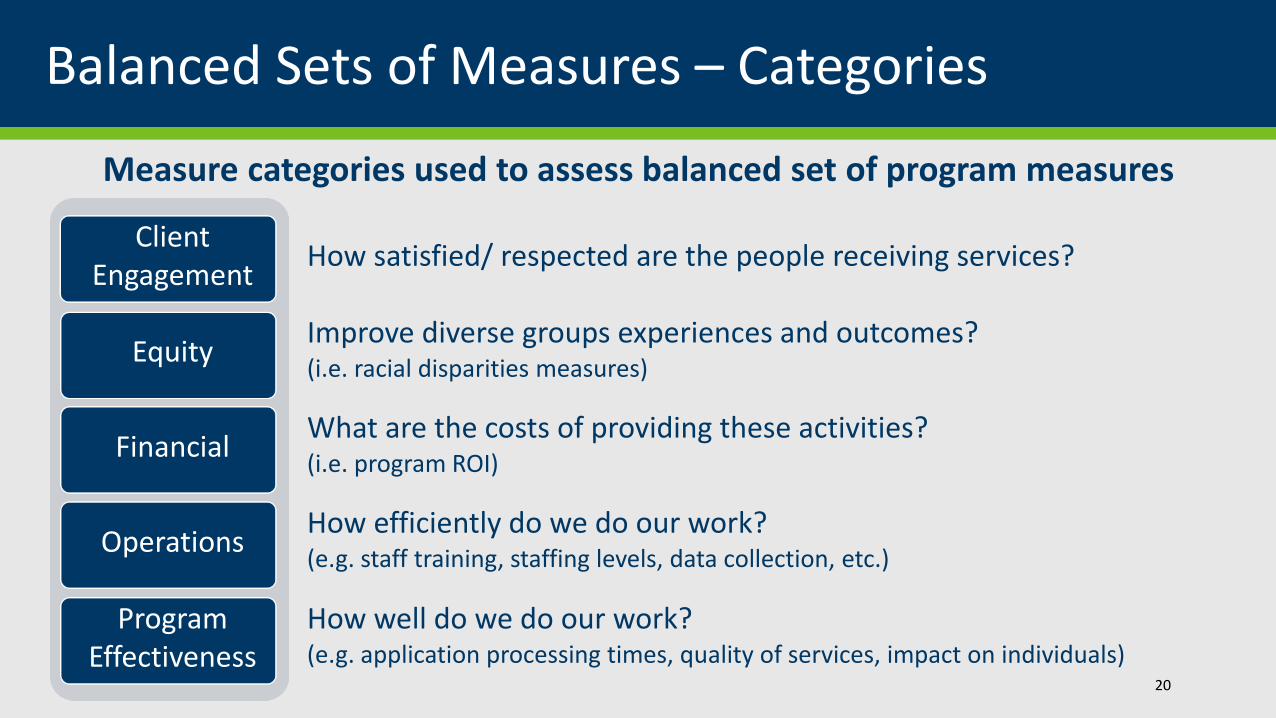
Measure categories used to assess balanced set of program measuresCategory How it will be used
Client Engagement
How satisfied/ respected are the people receiving services?
EquityImprove diverse groups experiences and outcomes? (i.e. racial disparities measures)
FinancialWhat are the costs of providing these activities? (i.e. program ROI)
Operations How efficiently do we do our work? (e.g. staff training, staffing levels, data collection, etc.)
Program Effectiveness
How well do we do our work? (e.g. application processing times, quality of services, impact on individuals)
20

Balanced Sets of Measures – Sample Measures
Category Sample Measures
Client Engagement
• Were you treated with dignity and respect?• Were staff members courteous and helpful?• Staff had the knowledge to handle my request?
Equity• County staff reflects population served• Rates of out-of-home placement by race• Family Assessment versus Investigation by race
Financial• Cost effectiveness of services• Return on Investment• Timeliness of payments / submitting requests for reimbursement
Operations • Percentage of staff trained in a timely manner• Staff to case load ratio• Data integrity
Program Effectiveness
• Percent of applications processed within one business day• Number of hours between initial contact and crisis assessment• Percent of people with paying jobs
21

Balanced Sets of Measures – Criteria
Measure criteria used to select and create a balanced set of measures
Criteria Description of Criteria
DataPower
Timely, reliable, currently exists, easily accessible, high validity, low
human error
CommunicationPower
Easily understood, compelling to stakeholders
ProxyPower
Says something of central importance, matches direction of other
measures in the mix
22
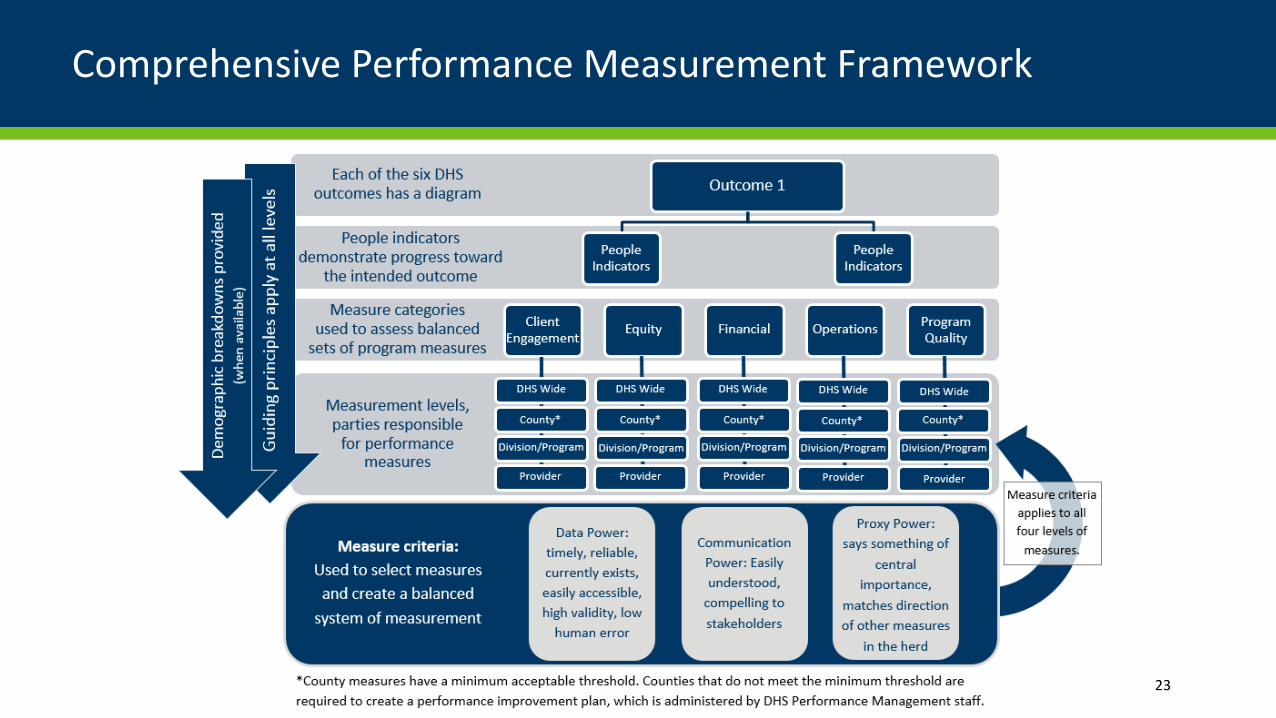
Comprehensive Performance Measurement Framework
23
Questions?

Results Based Accountability
Results Based Accountability
25

Key RBA concepts
• Two levels of accountability: population and program
• Three questions for program accountability
• How much did we do?
• How well did we do it?
• Is anyone better off?
26

Results accountability - Two Parts
• Population accountability:
about the well-being of
whole populations
For Communities – Cities – Counties – States – Nations
• Performance accountability:
about the well-being of
client populations
For Programs – Agencies – Service Systems
27

Definitions
Population
• Result or OutcomeA condition of well-being for children, adults, families or communitiesChildren born healthy, children ready for school, safe communities, clean environment, prosperous economy
• Indicator or BenchmarkA measure that helps quantify the achievement of a resultRate of low-birthweight babies, Percent ready at K entry, crime rate, air quality index, unemployment rate
Performance
• Performance MeasureA measure of how well a program, agency or service system is working
Three types:
• 1. How much did we do? • 2. How well did we do it? • 3. Is anyone better off?
=Customer Results
28
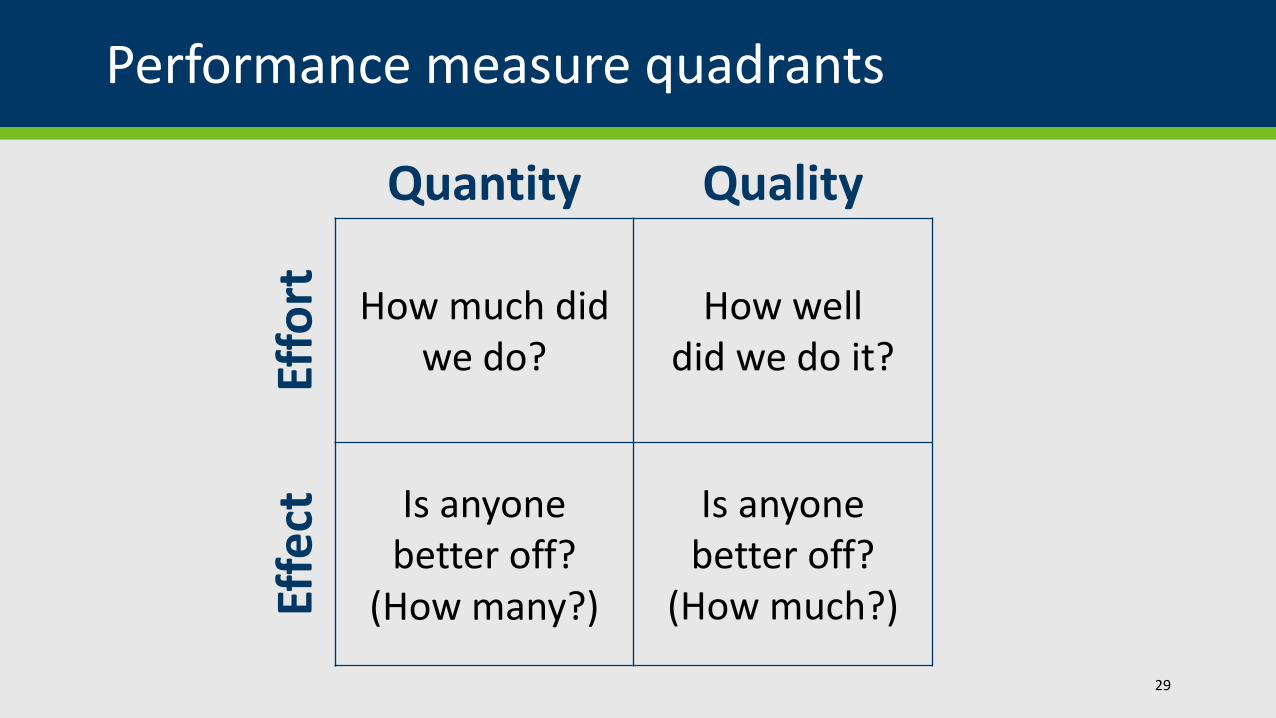
Performance measure quadrants
Quadrants
Quantity Quality
Effo
rt How much did we do?
How welldid we do it?
Effe
ct Is anyone better off?
(How many?)
Is anyone better off?
(How much?)
29

Example performance measures by quadrant
Quadrants
Quantity Quality
Effo
rt Number of Students
Student-teacher ratio
Effe
ct Number of high school graduates
Percent of high school
graduates.
30

Types of measures found in each quadrant
Quadrants
Quantity Quality
Effo
rt
How much did we do?
• Number of clients/customersserved
• Number of activities (by type of activity)
How well did we do it?
• Staffing: client/staff ratio, workload ratio, staff turnover rate, staff morale, percent of staff fully trained, percent clients seen in their own language, worker safety, unit cost
• Service delivery: percent timely, percent of clients completing activity, percent correct and complete, percent meeting standard
Effe
ct
Is anyone better off?• Number of clients improved
(point-in-time vs. point-to-point)
Is anyone better off?
• Percent with skills/knowledge (e.g. parenting skills)
• Percent with an attitude/opinion (e.g. toward drugs)
• Percent with behavior (e.g. school attendance)
• Percent in desired circumstance (e.g. working, in stable housing)
31
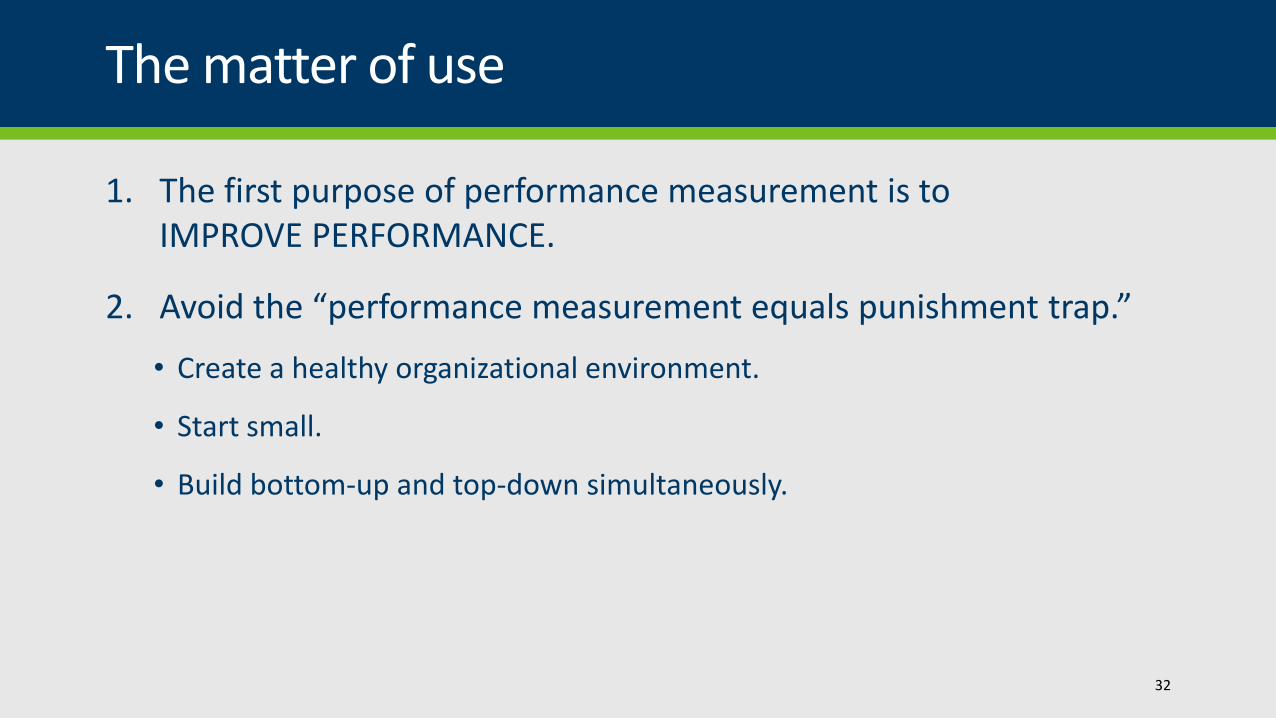
The matter of use
1. The first purpose of performance measurement is to IMPROVE PERFORMANCE.
2. Avoid the “performance measurement equals punishment trap.”
• Create a healthy organizational environment.
• Start small.
• Build bottom-up and top-down simultaneously.
32

Different Descriptions of Progress
1. Data
a) Population indicators: movement for the better away from the baseline
b) Program performance measures: customer progress and better service
How much did we do?How well did we do it?Is anyone better off?
2. Accomplishments: Positive activities, not included above
3. Stories behind the statistics that show how individuals are better off
33
Measure Development Exercises
Measure Development Exercises
34

Ground Rules
•All voices hold equal weight
•Respect others, respect yourself
• This is only one step in the process
•Do not assume we are all on the same page
35

Table Introductions
• Share your name
•What “hat” you’re wearing today (your role or roles)
• Ice Breaker
36
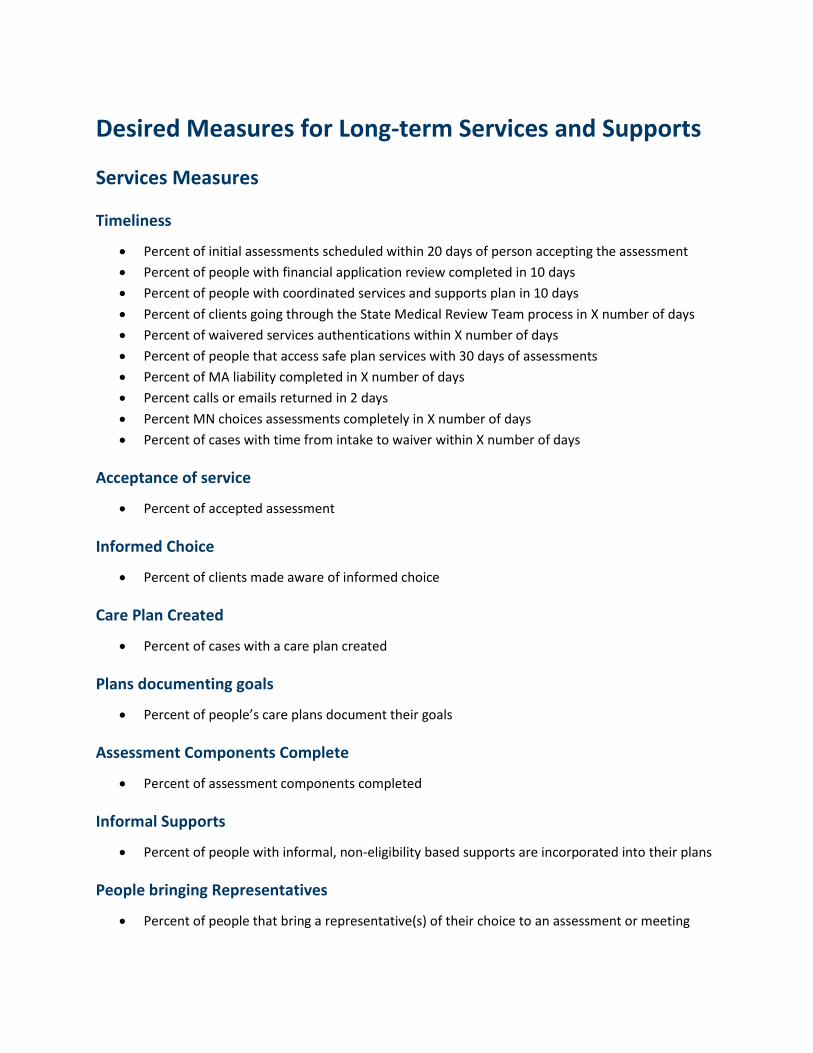
Desired Measures for Long-term Services and Supports
Services Measures
Timeliness
Percent of initial assessments scheduled within 20 days of person accepting the assessment
Percent of people with financial application review completed in 10 days
Percent of people with coordinated services and supports plan in 10 days
Percent of clients going through the State Medical Review Team process in X number of days
Percent of waivered services authentications within X number of days
Percent of people that access safe plan services with 30 days of assessments
Percent of MA liability completed in X number of days
Percent calls or emails returned in 2 days
Percent MN choices assessments completely in X number of days
Percent of cases with time from intake to waiver within X number of days
Acceptance of service
Percent of accepted assessment
Informed Choice
Percent of clients made aware of informed choice
Care Plan Created
Percent of cases with a care plan created
Plans documenting goals
Percent of people’s care plans document their goals
Assessment Components Complete
Percent of assessment components completed
Informal Supports
Percent of people with informal, non-eligibility based supports are incorporated into their plans
People bringing Representatives
Percent of people that bring a representative(s) of their choice to an assessment or meeting
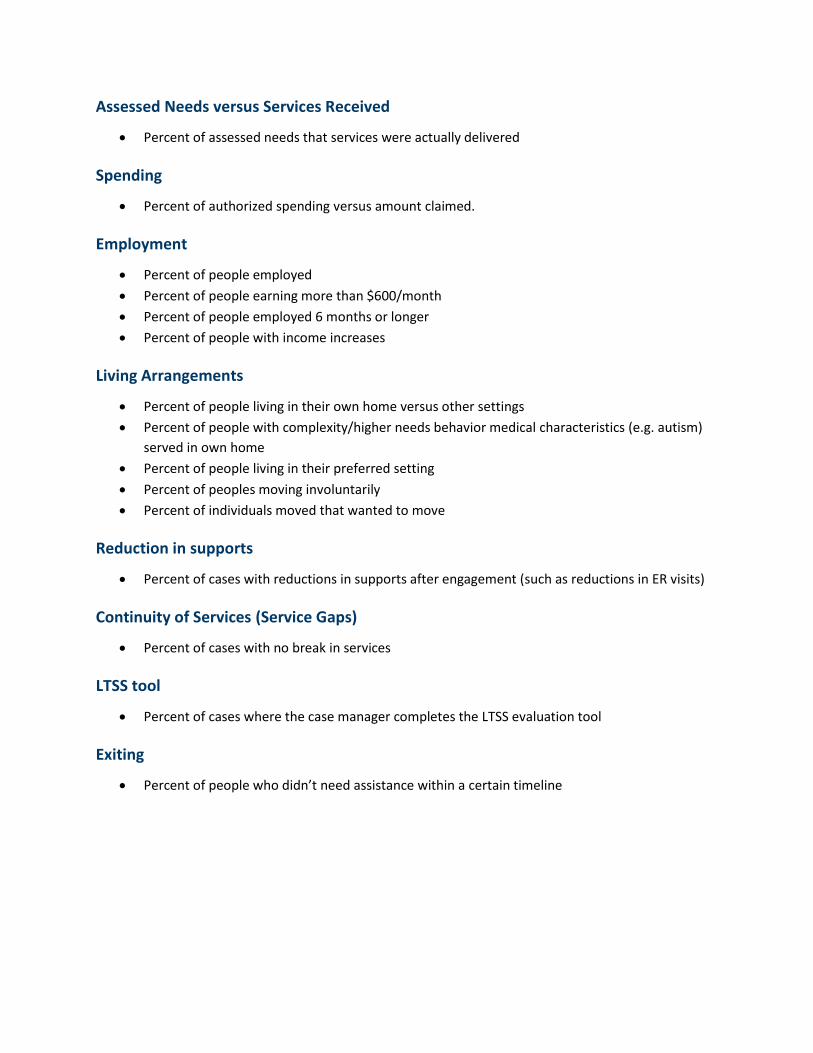
Assessed Needs versus Services Received
Percent of assessed needs that services were actually delivered
Spending
Percent of authorized spending versus amount claimed.
Employment
Percent of people employed
Percent of people earning more than $600/month
Percent of people employed 6 months or longer
Percent of people with income increases
Living Arrangements
Percent of people living in their own home versus other settings
Percent of people with complexity/higher needs behavior medical characteristics (e.g. autism)
served in own home
Percent of people living in their preferred setting
Percent of peoples moving involuntarily
Percent of individuals moved that wanted to move
Reduction in supports
Percent of cases with reductions in supports after engagement (such as reductions in ER visits)
Continuity of Services (Service Gaps)
Percent of cases with no break in services
LTSS tool
Percent of cases where the case manager completes the LTSS evaluation tool
Exiting
Percent of people who didn’t need assistance within a certain timeline

Operational Measures
LTSS Survey Tool Impacts
Percent of cases where issues were identified with the LTSS tools and corrective action was
taken.
Percent of services implemented that were evaluated using the LTSS improvement tool to
ensure effectiveness
Cost
Cost of providing services per case
Timeliness of Data Entry
Percent of SA entry into MMIS prior to previous year’s SA end date
Appeals
Percent of cases resulting in appeals
Availability of Services
Ratio of services needed within a geographic area to the amount of provider capacity within that
geographic area
Number of waivers denied services due to lack of availability of service
Language other than English
Percent of people served by a person that spoke their language?
Number/proportion that need/request interpretive services that received those services (in-
person, language live, tele-interpretation)
Number of translated documents/info available
Percent of services provided in native language
Number of forms translated
Client Contacts
Percent of clients whose case manager met face to face at least two times in a year
Percent of phone calls returned
Minimum number of client contacts provided
Percent of clients who keep metal health services and case management into waiver services
Average number of case managers a client has over a given amount of time
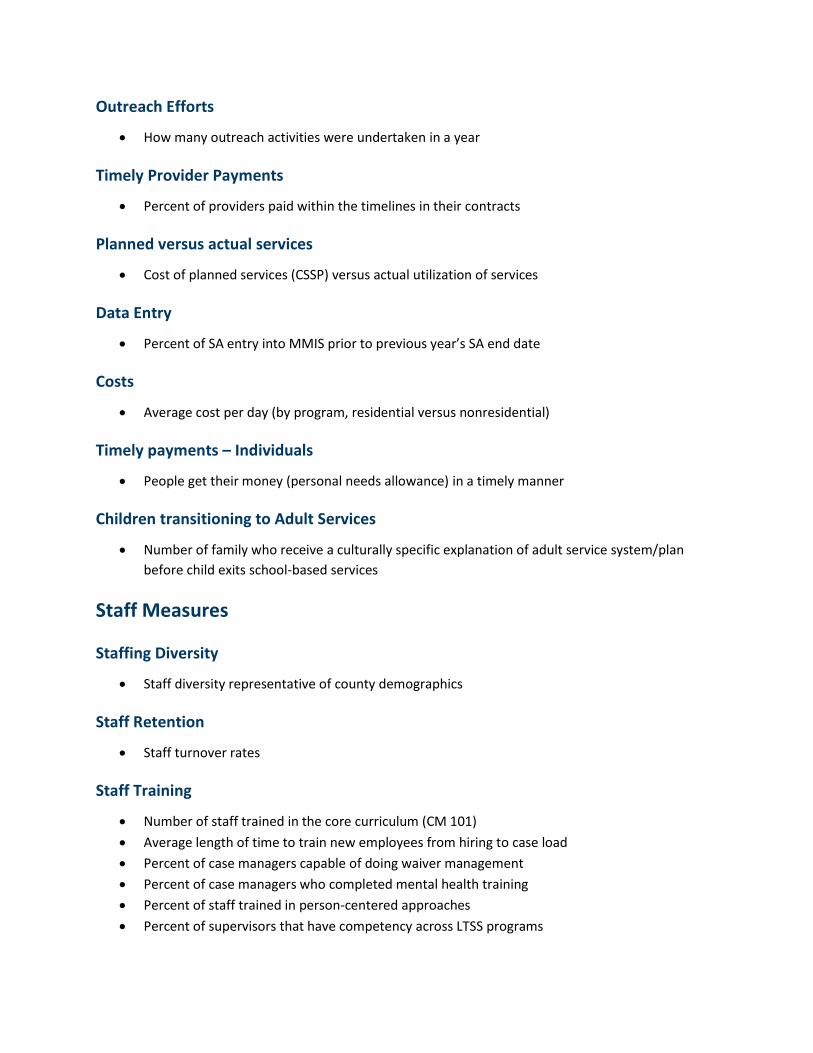
Outreach Efforts
How many outreach activities were undertaken in a year
Timely Provider Payments
Percent of providers paid within the timelines in their contracts
Planned versus actual services
Cost of planned services (CSSP) versus actual utilization of services
Data Entry
Percent of SA entry into MMIS prior to previous year’s SA end date
Costs
Average cost per day (by program, residential versus nonresidential)
Timely payments – Individuals
People get their money (personal needs allowance) in a timely manner
Children transitioning to Adult Services
Number of family who receive a culturally specific explanation of adult service system/plan
before child exits school-based services
Staff Measures
Staffing Diversity
Staff diversity representative of county demographics
Staff Retention
Staff turnover rates
Staff Training
Number of staff trained in the core curriculum (CM 101)
Average length of time to train new employees from hiring to case load
Percent of case managers capable of doing waiver management
Percent of case managers who completed mental health training
Percent of staff trained in person-centered approaches
Percent of supervisors that have competency across LTSS programs

Case Load
Caseload ratio to staffing and a threshold of acceptable caseload
Client Satisfaction Measures
Client Survey Questions
Percent of people that learned of a new support that they felt could help them
Percent of people who felt they could take reasonable risk in their life
Percent of people who feel they have control over their life
Percent of people who feel they have control & choice over the support they receive
Percent of people who feel they have the options available they want
Percent of people who felt they had the right level of support
Percent of people who felt their support are culturally responsive
Percent of people reporting information was helpful
Percent of surveys completed
Percent of people from under-represented groups tell us they feel respected at same/similar
ration as general population or as compared to other sub-groups
Percent satisfaction: housing, work, socialization, living in an environment of choice
Percent of people who report that their plan helps them achieve their goals aspirations
Percent of people who know who to contact for what
Percent of clients reporting increased satisfaction with case management support
Percent of people who know how to access help if they want or need it
Percent of people who report that their support plans meet their needs
Percent of people who report that their plans help them achieve their goals/aspirations