RC-1550 Sustainable Recycled Materials for Concrete Pavements

Rowan University Rowan University
Rowan Digital Works Rowan Digital Works
Theses and Dissertations
8-2-2019
Long-term performance of sustainable pavements using ternary Long-term performance of sustainable pavements using ternary
blended concrete with recycled aggregates blended concrete with recycled aggregates
Seth M. Wagner Rowan University
Follow this and additional works at: https://rdw.rowan.edu/etd
Part of the Civil and Environmental Engineering Commons, and the Materials Science and Engineering
Commons
Recommended Citation Recommended Citation Wagner, Seth M., "Long-term performance of sustainable pavements using ternary blended concrete with recycled aggregates" (2019). Theses and Dissertations. 2726. https://rdw.rowan.edu/etd/2726
This Thesis is brought to you for free and open access by Rowan Digital Works. It has been accepted for inclusion in Theses and Dissertations by an authorized administrator of Rowan Digital Works. For more information, please contact [email protected].

LONG-TERM PERFORMANCE OF SUSTAINABLE PAVEMENTS USING
TERNARY BLENDED CONCRETE WITH RECYCLED AGGREGATES
by
Seth M. Wagner
A Thesis
Submitted to the
Department of Civil and Environmental Engineering
College of Engineering
In partial fulfillment of the requirement
For the degree of
Master of Science in Civil Engineering
at
Rowan University
August 1, 2019
Thesis Advisor: Gilson R. Lomboy, D.Eng., Ph.D.

iii
Acknowledgements
I would like to thank my advisor Dr. Gilson R. Lomboy for guiding this research
and teaching me the difference between data and “good” data. I also thank my research
committee members Dr. Douglas B. Cleary, D. Eng., Ph.D. and Dr. Yusuf A. Mehta, D.
Eng., Ph. D. for always providing assistance when it was needed.
I would like to express gratitude to my parents Lon E. Wagner and Kathleen L.
Weise for supporting me on this journey. I would not have made it this far without you.

iv
Abstract
Seth M. Wagner
LONG-TERM PERFORMANCE OF SUSTAINABLE PAVEMENTS USING
TERNARY BLENDED CONCRETE WITH RECYCLED AGGREGATES
2018-2019
Gilson R. Lomboy, D.Eng., Ph.D.
Master of Science in Civil Engineering
The purposes of this study were to (a) design concrete pavement mixtures with
recycled concrete aggregates using ternary blends of cementitious materials and a low
water-to-binder ratio, (b) measure the fresh and hardened properties of the proposed
concrete mixtures and (c) assess the long-term performance of the concrete implementing
the use of recycled coarse aggregates. Preliminary investigation into ternary blend
combinations via the compressive testing of mortar cubes and isothermal calorimetry was
used to predict an optimal blend of cementitious material. Mixes using recycled concrete
aggregates at varying replacement rates were tested for fresh and hardened properties
using the proposed blend. It was found that a blend of portland cement, Class C fly ash,
and ground granulated blast furnace slag produced the highest strength of ternary binder.
Ternary blended cement mixtures showed improvement in hardened properties in late-age
testing. At 50% replacement of virgin aggregates, specimens showed comparable
mechanical performance to the control mix.

v
Table of Contents
Abstract .............................................................................................................................. iv
List of Figures ................................................................................................................... vii
List of Tables ..................................................................................................................... ix
Chapter 1: Introduction ........................................................................................................1
Chapter 2: Literature Review ...............................................................................................3
Recycled Concrete Aggregate (RCA) ............................................................................3
Aggregate Properties ................................................................................................6
Fresh RCA Concrete Properties ...............................................................................9
Hardened RCA Concrete Properties ......................................................................10
Regulations ............................................................................................................16
Ternary Blended Cement-Based Binder ......................................................................18
Fresh Ternary Blended Concrete Properties ..........................................................22
Hardened Ternary Blended Concrete Properties ...................................................23
Blended Cement Mixtures with RCA (B-RCA) ..........................................................25
Fresh B-RCA Properties ........................................................................................25
Hardened B-RCA Properties..................................................................................26
Chapter 3: Materials Identification ....................................................................................28
Chapter 4: Methodology ....................................................................................................31
Blend Optimization ......................................................................................................31
Mortar Compressive Strength ................................................................................31
Isothermal Calorimetry ..........................................................................................33
Ternary Blended Concrete with RCA Replacement ....................................................34

vi
Table of Contents (Continued)
Chapter 5: Results and Analysis ........................................................................................37
Binder Optimization.....................................................................................................37
Mortar Cube Strength ............................................................................................37
Isothermal Calorimetry ..........................................................................................39
Statistical Analysis .................................................................................................44
Ternary Blended Concrete .....................................................................................48
Ternary Blended Concrete with RCA Replacement ....................................................53
Chapter 6: Summary and Conclusions ...............................................................................63
Summary of Findings ...................................................................................................63
Conclusions ..................................................................................................................64
Future Work .................................................................................................................66
References ..........................................................................................................................67
Appendix A: Additional Tabulated Data ...........................................................................76

vii
List of Figures
Figure Page
Figure 1. Hydration curve for portland cement concrete ................................................19
Figure 2. Aggregate gradations .......................................................................................30
Figure 3. Mortar compressive strength results for 28 day (solid bars) and 56 day
(hatched bars) strength for mixtures tested ......................................................38
Figure 4. Plot of thermal power vs time of Type I cement and binary binders ...............40
Figure 5. Plot of thermal power vs time of ternary blends of PC-FAC-GGBFS ............41
Figure 6. Plot of thermal power vs time of ternary blends of PC-FAF-GGBFS .............41
Figure 7. Plot of thermal power vs time of ternary blends of PC-FAC-SF .....................42
Figure 8. Plot of thermal power vs time of ternary blends of PC-FAF-SF .....................42
Figure 9. Total heat of hydration for all blends ...............................................................44
Figure 10. Scatterplot of 28 day (left) and 56 day (right) compression data by % PC .....45
Figure 11. Class F fly ash and silica fume data surface plot .............................................46
Figure 12. Class F fly ash and slag data surface plot ........................................................46
Figure 13. Class C fly ash and silica fume data surface plot .............................................47
Figure 14. Class C fly ash and slag surface plot ...............................................................47
Figure 15. Ternary blended concrete compressive strength ..............................................51
Figure 16. Ternary blended concrete electrical resistivity ................................................52
Figure 17. Ternary blended concrete alkali-silica reaction ...............................................52
Figure 18. Ternary blended RCA setting time ..................................................................55
Figure 19. Ternary blended RCA compressive strength ...................................................56

viii
List of Figures (Continued)
Figure Page
Figure 20. Ternary blended RCA elastic modulus ............................................................57
Figure 21. Ternary blended RCA modulus of rupture ......................................................58
Figure 22. Ternary blended RCA surface resistivity .........................................................59
Figure 23. Ternary blended RCA drying shrinkage ..........................................................60
Figure 24. Ternary blended RCA freeze-thaw durability ..................................................60
Figure 25. Ternary blended RCA ASR .............................................................................62

ix
List of Tables
Table Page
Table 1. Density of Concrete with Recycled Concrete Aggregates ...............................26
Table 2. Project Materials ..............................................................................................28
Table 3. Cementitious Material Oxide Composition .....................................................29
Table 4. Aggregate Properties ........................................................................................30
Table 5. Tested Mixture Matrix .....................................................................................33
Table 6. Ternary Blend (TB)-Recycled Concrete Aggregates (RCA) Test Schedule ...36
Table 7. Optimized Ternary Blends ...............................................................................48
Table 8. Mixture Proportions of Ternary Blended Concrete Per Cubic Yard ...............49
Table 9. Ternary Blended Concrete Fresh Properties ....................................................50
Table 10. Ternary Blended RCA Mixture Proportions ....................................................54
Table 11. Ternary Blended RCA Fresh Properties ..........................................................55

1
Chapter 1
Introduction
Due to the high production rate of portland cement concrete, demand for suitable
aggregates and portland cement raises concerns for both the environmental and economic
availability of these materials. The production of portland cement and aggregates plays a
large role in the creation of pollution in the concrete industry and depletes natural rock
quarries. For many years, alternative materials have been used to either supplement or
replace these in concrete materials to varying degrees of success.
Supplementary cementitious materials (SCM) are mineral admixtures – often
byproducts of other industries – which can be used in combination with portland cement
to improve the fresh and hardened properties of concrete. These admixtures can be
hydraulic, exhibiting cementitious properties when reacted with water. They may also be
pozzolanic, reacting with calcium hydroxide and water to provide additional strength.
Common SCM include ground granulated blast furnace slag, fly ash and silica fume.
Blast furnace slag is a byproduct of iron production, fly ash is produced from coal
burning operations and silica fume is a byproduct of silicon and ferrosilicon alloy
production. In locations where these industrial processes create an excess of these
byproducts, it is possible to reduce both the environmental impact and cost of concrete
construction with their use. Ternary blended binders consisting of two SCM and portland
cement are actively researched for their additive benefits to concrete mixtures. In these
cases, cementitious or pozzolanic mineral admixtures which are observed to have a
positive interaction may be used to replace a significant portion of portland cement in a
proposed binder.

2
Recycled concrete aggregate (RCA) or crushed concrete coarse aggregate
(CCCA) is existing concrete which has been removed, crushed, and graded to be used as
aggregate [1]. RCA consists of virgin aggregate (VA) coated fully or partially by
hardened mortar from the previous mix. RCA tend to have higher porosity and poorer
mechanical properties than virgin aggregates due to the presence of adhered mortar,
which may be less hard or durable than rock. However, given appropriate constraints on
usability, RCA may replace part or all of the required aggregates in a concrete mixture. In
these cases, the demand for virgin aggregates may be reduced, preserving existing
quarries. RCA may also be more readily available in some instances via on-site or local
crushing facilities, reducing materials and transportation costs.
There is little in the way of literature addressing the use of ternary blended
cements in conjunction with RCA replacement in concrete mixes. The purpose of this
research is to perform additional experimentation on the interaction of ternary blended
binders and crushed concrete coarse aggregates in developed concrete mixtures with low
water-to-binder ratio. This work is divided into two tasks; (a) to determine an optimal
ternary blended binder consisting of portland cement and two of: blast furnace slag, Class
C fly ash, Class F fly ash and silica fume and (b) to assess the performance of concrete
mixtures with varying amounts of recycled coarse aggregate and the effect of using a
ternary blended binder in concrete mixtures with high RCA replacement rates.
3
Chapter 2
Literature Review
Recycled Concrete Aggregate (RCA)
Hardened concrete may be broken down and used as coarse aggregate for new
mixes. Aggregate created by this recycling process is known as recycled concrete
aggregate or crushed concrete coarse aggregate. Concrete is commonly recycled in this
manner from the demolition of buildings and pavements [1]. Apart from impurities that
may be present in aggregate of this type due to the wide variety of sources, the presence
of mortar alters physical properties of the aggregate. Density is decreased, and porosity
and adsorption are increased with respect to VA [2]. RCA is primarily used in
consideration of the environmental impacts of concrete construction. The use of RCA
prevents material from occupying landfills and limits the harvesting of virgin aggregates
[3]. Depending on the cost and availability of VA, using RCA may also prove to be an
economical choice where there is less cost in recycling than in removing and disposing of
rubble, particularly in cases where a mobile recycling operation can be brought on to the
site [4].
The production of RCA begins with demolition of the site. ACI Committee 555
provides a list of common types of structures that may be a part of this process [1]. These
include mass concrete structures, underground concrete structures, reinforced concrete
structures and prestressed/post-tensioned concrete structures. Different types of structures
require additional considerations in demolition to avoid accidental collapse. Demolition
methods are selected based on safety, environmental impact, budgetary constraints, and
the size and location of the site. Available methods of demolition include: hand tools,
4
vehicle-mounted equipment, explosive blasting, chemical demolition agents, mechanical
splitters, heat demolition and hydrodemolition.
Following successful demolition, reinforcement is removed from the debris, and
the concrete is transported to a processing plant. Once at the plant, large rubble is crushed
to suitable size via several differently-sized crushers. Aggregate size is reduced to a final
maximum diameter of 20 to 25 millimeters [1]. Further processing is required to remove
other contaminants in the concrete, which can vary by source. Any additional rebar in the
concrete is removed by magnet. Other contaminants present in concrete removed from
building demolitions include wood, plaster, plastic, oil, etc. ACI Committee 555 closely
relates the operations at RCA processing plants to those of plants that process unused
virgin aggregate.
American Concrete Pavement Association (ACPA) has found RCA stockpiles are
notably more alkaline as a result of calcium hydroxide being leached from the pile [5].
The calcium hydroxide reacts with carbon dioxide to form carbonates. Abbaspour, et al.
confirms these findings, noting increases in pH with stockpile aging as well as an
increase in carbonate content [6]. ACPA suggests stockpiling washed RCA to help avoid
carbonate runoff from clogging drains. Additionally, the acidity of rain reacting to form
the carbonates may reduce or potentially neutralize the alkalinity of the stockpile [7].
There are no further known disadvantages to stockpiling RCA as opposed to virgin
aggregate.
Production of crushed concrete coarse aggregate as an alternative source of coarse
aggregate has a few notable environmental effects. Sources of virgin aggregate are finite
in supply and ever reducing, and recycling already-used materials helps to preserve these
5
supplies [4]. In addition, reusing demolished concrete as RCA reduces the output of
material from the construction industry into landfills. By processing RCA for a given
project, the carbon dioxide emissions and energy consumption associated with quarrying
can be reduced or eliminated [3]. RCA production can be accomplished via mobile
recycling operations placed on the construction site or fixed recycling plants that require
materials transportation off-site [8]. McIntyre, et al. conducted a study through which the
optimal amount of RCA production was found to depend on both cement consumption
and transportation [8]. If increasing the RCA replacement rate of a mix requires more
cement to be added to maintain a target strength, RCA replacement begins to lose value.
On-site recycling reduces the costs associated with materials transportation. McGinnis, et
al. quantified the land use, water use, energy demand, and carbon emissions associated
with the production of natural and recycled aggregates via field study [9]. Their study
found that in all four categories, recycled aggregate production required a fraction of the
resources of virgin aggregate production. The study concluded that RCA production had
a 55% reduced environmental impact over virgin aggregate. Additionally, the study
investigated the economic possibilities of RCA and found that recycled aggregates cost
74% of the price virgin aggregates between nearest competitors.
6
Aggregate Properties. The increase in aggregate void space in RCA greatly
impacts the bulk density of the aggregates [10]. This is found via ASTM C29/C29M
standard testing. Bulk density is essential for proportioning, voids calculation and volume
control. A low percentage of voids in RCA is preferable for concrete production because
less paste is required for mixing. Adding binder increases the cost of portland cement
concrete. The presence of old, porous mortar adhered to recycled aggregates and the
additional interfacial zones reduce the density of concrete with RCA. Specific gravity for
recycled aggregate ranges from 2.2 to 2.6, lower than virgin aggregate which has a range
of 2.4 to 2.9 [11-14].
Absorption, porosity and permeability are affected by the pore volume in the
aggregate and between aggregates. These voids affect the strength, abrasion resistance
and freeze-thaw durability of a concrete mixture. Porosity is the ratio of the voids in an
aggregate to the total volume of the aggregate, and is found via ASTM C29/29M [15].
Porosity is higher in RCA than in virgin aggregates due to the adhered mortar content of
recycled aggregates. Concrete mixtures using RCA thus require more water to maintain
workability, and may suffer a decrease in hardened strength and density.
The Los Angeles (LA) Abrasion Test measures the effect of degradation on an
aggregate while enduring impact, abrasion and grinding [16]. ASTM C131/131M-14
outlines this process. The aggregate sample is placed in a steel drum containing steel
spheres, which undergoes a specified number of revolutions. A higher percent loss of
aggregate mass following the test procedure indicates less resistance to crushing while a
load is applied. Virgin aggregates tend to have a loss value between 10-20%, while RCA
typically suffers 20-45% mass loss due to the removal of the adhered paste [11, 17].

7
ASTM C136/136M-14 details the process by which the particles size distribution
of fine and coarse aggregates in a sample is determined [18]. Coarse aggregates are
defined as those retained on a 4.75-mm opening sieve whereas fine aggregates pass
through. The particle size distribution of aggregates is important to the construction
process in engineering. Fine aggregates are stronger when placed under load and have
less pore space. Using more coarse aggregate reduces construction cost as less binder is
required to cover the surface area of the aggregates. Therefore, a gradation with an
appropriate blend of fine and coarse aggregates (well-graded) is required to balance
concrete strength with cost. A well-graded aggregate will result in small, tightly packed
voids and a stable matrix structure. Fineness modulus (FM), which is used in portland
cement concrete mixture design and quality control checks during concrete production, is
also determined from fine aggregate gradation. Typical values of FM for fine aggregates
are between 2.3 and 3.1.
The flat and elongated test determines the shape of aggregates to be used in a
mixture. ASTM D4791–10 gives the process by which the percentage of elongated
particles, flat particles, or flat and elongated particles is found for an aggregate sample
[19]. Flat or elongated particles have a greater chance to fracture and are harder to
compact. The shape for typical virgin aggregates is blended between well rounded
smooth gravel, and angular rough crushed rock. RCA tends to be rougher due to the
presence of adhered mortar [20]. The shape, texture and angularity of aggregates
determine the uncompacted void content percentage. If the void content increases, it may
be attributed to a greater angularity, less sphericity or a rougher surface of the aggregate.
Angular aggregates create void space as angularity prohibits tight compaction [20].
8
Angular aggregates also require more binder material and subsequently increase mixture
cost. Angular aggregates improve interlocking within the concrete matrix, increasing
compressive strength. However, rounded, smooth aggregates flow more easily over the
aggregates and may improve fresh concrete workability [21].
Contaminants negatively affect the hardened properties of concrete. In a virgin
aggregate blend such contaminants are extraneous clays and organic material, however
RCA sources typically contain contaminants relating to the demolition site they are
obtained from. Most contaminants are found via a visible check at stockpiles and during
mixing. Limiting the number of contaminants increases the strength of the concrete.
Currently the NJDOT limits the contaminant presence to 10% in RCA [22]. Standard
aggregate processing procedures outlined by ACI Committee 221 allow for the control of
aggregate parameters which include cleanliness and fine particle removal [23]. RCA
production processes follow this standard procedure closely and thus undergo the same
treatment [1]. The contaminants in virgin or recycled aggregates are primarily controlled
through the quality control/quality assurance procedures at the quarries during crushing
procedures.
Sulfate testing measures the capacity of aggregate to withstand intense weathering
that occurs during freeze-thaw action. This test is conducted by placing the aggregate in
magnesium sulfate or sodium sulfate for an extended time in accordance with ASTM
C88-13. These mixtures simulate the formation of ice crystals that can form on
aggregates during winter. The Washington DOT found that both virgin and recycled
aggregate pass the magnesium sulfate component of the test however only virgin
aggregates are able to endure sodium sulfate testing based upon acceptable mass losses.

9
Due to the contradiction of the results from the two tests, agencies commonly waive RCA
soundness testing [20].
Fresh RCA Concrete Properties. The workability of concrete typically refers to
how easily it can be set into place and finished. Workability depends on the consistency
of concrete mixtures and is commonly indicated through a procedure known as slump
testing as specified by ASTM C143 [24]. In laboratory conditions for normal concrete,
slump increases proportionally to water content and is inversely related to strength. The
acceptable slump value for a concrete mixture is dependent on the structure in which the
concrete will be used. These ranges typically fall between 50-100 millimeters for most
applications [22]. Recycled aggregates absorb more water due to high porosity, thus
concrete made with RCA has been observed to require approximately 5% more water
than concrete made with virgin aggregates to achieve the same workability [25]. Pre-
saturating RCA prior to mixing can counteract this effect. Brown, et al. concluded that
the roundness of RCA produced commercially increased workability when compared
with natural basalt aggregate [29]. The pumpability of concrete can be described as its
ability to remain well mixed and easily moveable under pressure [27]. This is an
important characteristic of concrete because many structures require the use of concrete
pumps in order to place material. Pumpability is closely related to workability although it
also accounts for the capacity of the mixture to avoid segregation while pumping.
Concrete which is not readily pumpable will segregate or create pipe blockages. Ensuring
that concrete made with RCA can be used in concrete pumps shares many of the same
measures needed to ensure its workability. This includes the pre-soaking of recycled
aggregates and strict slump control.

10
Water expands when freezing by approximately 9% [28]. Concrete that is
expected to experience freeze-thaw conditions is required to have air entrainment. Air
entrainment produces more distributed air voids in a concrete mixture, allowing water
room to expand during freezing [29]. Boyle, et al. determined that the air content of RCA
mixes was only marginally greater than concrete made with virgin aggregates, but the
values had greater variability [30]. However, the concrete with RCA did show better
resistance to cracking during freeze-thaw cycles. The higher air content of the RCA
mixture is due to the air voids within the adhered mortar of the recycled aggregate. This
study also suggested that target air contents be raised when designing concrete with RCA.
Curing of concrete is a procedure that takes place after mixing and placing
concrete in which the moisture and temperature are kept within a specific range for a
certain amount of time [29]. Typical curing methods include membrane curing, steam
curing and the ponding method [11]. Membrane curing requires covering the wetted
material with a waterproof surface for seven days to prevent the evaporation of water.
Concrete cured using the steam method requires control of temperature and humidity to
prevent the sample from drying out. Concrete cured via this method may achieve 70% of
ultimate strength after 28 days. The ponding method entails submerging the concrete
surface in water during the curing process. Amorim, et al. found that curing conditions
did not tend to affect concrete mixtures with RCA any differently than those with virgin
aggregates [31].
Hardened RCA Concrete Properties. In general, the addition of RCA decreased
the strength of concrete, though little difference in strength can be found for replacement
rates below 30%. As the percentage of RCA goes up, the compressive strength of the

11
specimen goes down [12, 13, 32, 33]. At 50% and 100% replacement, the compressive
strength decreases by 16.6% and 26.4% respectively [34]. Hayles, et al. also concluded
that concrete mixtures with RCA failed to meet targeted mixture strengths of 25 MPa and
35 MPa [35]. ASTM C39 and AASHTO T22 may be used to test the compressive
strength of a cylindrical concrete specimen.
Abdel-Hay observed the impact of curing conditions in RCA concrete strength
gain [36]. Through experimentation, it was found that water curing lead to increased 28-
day compressive strength at 25% and 100% RCA replacement, however air curing lead to
higher strengths at all ages at 50% RCA replacement. This indicates no obvious link
between curing condition and concrete strength at given RCA replacement rates. A
replacement rate of 50% is suggested to achieve maximum compressive strength for a
concrete mixture with RCA. The compressive strength of RCA mixtures may vary with
the RCA used. Corinaldesi found that compressive strength was 8% lower when fine
RCA was used rather than a strictly coarse blend of RCA using the same water to cement
ratio [37]. Corinaldesi attributed this strength difference to the variation of absorption,
porosity, and average dimension of the RCA particles. Davis, et al. found that ASTM #57
coarse aggregates made RCA 10-15% weaker compared to RCA with smaller ASTM #8
coarse aggregates [34].

12
Concrete does not have a linear stress-strain relationship and so chord modulus is
appropriate for determining this relationship as per ASTM C469 [21, 38]. When recycled
concrete aggregate is added in to supplement virgin aggregate, the chord modulus of the
concrete sample decreases. This decrease can vary widely due to the type and amount of
RCA used. On average the decrease in elastic modulus is 15%. Equal or higher elastic
moduli have been found when using RCA by the inclusion of additives [39-41]. A more
dramatic difference in elastic modulus can be seen with replacement by more than 50%
RCA [42].
Porosity is a measurement of the amount of interconnected pores and air voids in
a sample of concrete at the interfacial transition zone. This measurement is used to
suggest the relative durability of a mixture against freeze-thaw and abrasion [43].
Residual mortar present in recycled aggregates increases the porosity of RCA above
virgin aggregate or gypsum. This high porosity allows for sorption into the concrete and
the penetration of chemicals. Water absorption in the aggregate is increased which may
be detrimental to the concrete's durability [21]. Large or connected voids in concrete may
decrease strength and increase permeability [29]. ASTM C642-13 presents standard
practice for determining voids in hardened concrete [44]. Additionally, ASTM D4404-10
gives a method of porosity determination in aggregates using mercury intrusion
porosimetry (MIP) [45]. As this test is conducted by mercury intrusion under high
pressure, it provides accurate analysis considering even very small pore spaces.
Larger pores in RCA create passageways for chemical seepage into the material.
When chemicals such as chloride infiltrate a section of reinforced concrete, the steel
corrodes and the structure weakens [21]. A high permeability suggests a low strength

13
value and high porosity of the concrete [29]. RCA can be up to 6 times more permeable
than virgin aggregate [1, 46]. Additionally, reducing the water to cement ratio by 5% to
10% may counteract the permeability issues of RCA. Abdel-Hay found that sample
permeability is reduced by curing the RCA concrete in water. 100 mm cube samples that
were cured in water had sorptivity values that were 50% less compared to those obtained
by curing in air at 28-days [36]. Thomas, et al. showed that the high porosity of RCA
may lead to higher water and oxygen permeability in concretes using recycled aggregates
when compared to those without [47]. This leads to concerns in regard to the durability of
RCA especially in instances where aggressive deleterious processes occur such as freeze-
thaw action. However, Andal concluded that recycling concrete for aggregate while
selecting material for original-mixture-quality preservation characteristics drastically
reduced these concerns [48]. However, this process excludes recycled materials that do
not reflect the characteristics of the original mixture and thus reduces the amount of
material that may be recycled on a job site.
Newly made concrete goes through a phase of drying shrinkage. Due to
evaporation and chemical shrinkage, new concrete decreases in volume. After this initial
shrinkage, the sample may continue to shrink as it settles which causes cracking in the
sample. Meinhold, et al. concluded that drying shrinkage causes an increase in tensile
stress and increases linearly as RCA replacement rates increase [39]. Due to RCA’s
higher absorption, it causes 40-60% more shrinkage than virgin aggregate. Over the
course of the first year, the concrete is expected to shrink 65% to 85% more. When RCA
was used in mixtures containing fly ash, the drying shrinkage was reduced. Xiao, et al.
showed that replacement rates of 50% and 100% RCA resulted in 17% and 59% higher

14
shrinkage respectively over natural aggregate mixtures [49]. Yamato, et al. found that the
use of shrinkage reducer can counteract the effects of RCA [50]. Drying shrinkage can be
determined via ASTM C596-09 [51].
Freeze Thaw is the tendency for internal cracking due to the creation of forces
inside the concrete when water enters a sample, freezes, and expands. Freeze-thaw
durability performance may be assessed using ASTM C666 [52]. While most studies
agree that RCA replacement may not notably impact concrete strength, the increased
permeability of these mixtures allows freeze-thaw processes to deteriorate the concrete
more quickly. Thus the main concern with recycled aggregates is their impact on concrete
durability. A study by Yamasaki and Tatematsu confirmed this, showing a marked
decrease in freeze-thaw performance for samples with RCA replacement [53]. The
negative effects of recycled aggregates in recycled aggregate concrete (RAC) mixtures
can be limited effectively by mixture design and the use of additional additives. Yamato,
et al. suggested that this reduction in durability can be counteracted in part by limiting
RCA replacement, reducing water to cement ratio, and increasing entrained air in the
mixture [50]. Salem, et al. confirmed these findings and claimed that entrained air may
neutralize the durability differences between virgin aggregate mixtures and RCA
mixtures [54]. Additionally, Wei suggested that the addition of calcined diatomite in
small amounts (2%) can reduce the permeability of RAC mixtures and improve durability
characteristics [55].
Huda and Alam found that increasing RCA replacement rates from 30% to 50%
correlated with decreasing relative dynamic modulus throughout the testing [56].
However, it was found that all samples greatly exceeded the passing criteria set forth by

15
ASTM C666 of 60% of initial elastic modulus at 300 cycles. This study concluded that
the use of RCA does not have a significant detrimental impact to the durability of
concrete in freeze-thaw conditions. Amorim Jr., et al. found similar results in the testing
of concrete with 15% to 50% replacement rates, with instances of concrete with RCA
replacement even surpassing the durability factor of samples containing only virgin
aggregates [57].
In concrete subjected to sufficient moisture, it is possible for the alkaline cement
paste to react with silica found in aggregates in a manner that causes swelling in the
concrete [58]. This causes cracking over time in the material. Concrete swelling due to
alkali-silica reaction (ASR) can be measured following standard practice ASTM C 1293
[59]. Li and Gress found that this reaction requires a pH threshold to be met within the
mixture [60]. The substitution of fly ash into the mixture at a rate of 25% effectively
controlled this reaction. It was found that RCA mixtures with a fly ash replacement rate
of 25% met all ASTM limitations for ASR swelling. This is due to the pozzolanic
reaction depleting calcium in the mixture, which halts the alkali-silica reaction. A study
by Thomas, et al. agrees that supplementary cementitious materials such as fly ash, slag,
or silica fume at threshold replacement levels effectively limited the alkali-silica reaction
in concrete [61]. The study also suggested the use of portland cement with low alkali
content as a method of controlling this reaction in low- to moderate-risk scenarios, but
suggested a combination of this and SCM incorporation for high-risk cases.

16
Regulations. The United States Army Corps of Engineers puts forth the United
Facilities Criteria (UFC) that applies to the use of recycled concrete aggregates in
individual circumstances. These may include pavement surfaces, structures, airfields,
heavy-duty pavements, and aggregate base courses. Detailed requirements for usage are
as follows.
Concerning concrete pavements, UFC 3-250-04 states that recycled concrete may
be crushed and used as both coarse and fine aggregate [62]. This assumed the concrete is
crushed to a proper gradation following standard ASTM C33 guidelines. The UFC
requires recycled aggregates to be washed only if they are contaminated with base or
subgrade material. If the aggregate comes from D-cracked pavement, it must be crushed
to 20 millimeters maximum size. Implementing a maximum size prevents D-cracking
from occurring again. Aggregate interlock load transfer capacity is reduced but short
panel lengths address this issue [63].
UFC 3-250-07 details the procedure for production and use of crushed concrete
aggregate [63]. It may be collected from both pavements and structures given that
asphalt, subbase, and subgrade materials are removed as thoroughly as possible and all
steel reinforcement is removed. Once recycled aggregates are crushed, stockpiled, and
have met all requirements for normal aggregates for the intended purpose, they may be
treated as such and are usable as unbound or bound cement treated bases, and as per UFC
3-250-04 Standard Practice for Concrete Pavements.
UFGS-32 13 13.06 provides additional information on the use of recycled
aggregates in pavements and site facilities [64]. Concrete is allowed as an appropriate
recycled material in the use of aggregates for these purposes under the condition that it

17
complies with ASTM D6155 Standard Specification for Nontraditional Coarse
Aggregates for Bituminous Paving Mixtures and gradation following ASTM C33/C33M.
This document addresses these standards for coarse aggregate only. Aggregate for use in
airfield pavement and other heavy-duty pavements requires a thorough survey of
materials, including source, test results, mill certificate data, composition, and service
records [65]. These requirements preclude the use of recycled aggregate for these
applications.
UFGS-32 11 23 allows the use of crushed concrete aggregates in the base course
for road use [66]. Recycled materials must meet ASTM gradation requirements for coarse
aggregate. For use in airfield pavement coarse bases, additional alkali-silica reaction
testing must be completed before use in accordance with IPRF-01-G-002-03-5, which
outlines evaluation techniques for recycled materials to be used in airfield pavement base.
For both road and airfield uses, subgrade soil must contain 0.3% or lower sulfates in
order to avoid ettringite reactions with recycled aggregates. This is an expansive reaction
that causes cracking and swelling. Additionally, risk assessment must be completed for
airfield projects in accordance with Engineering Technical Letter 07-6 Risk Assessment
Procedure for Recycling Portland Cement Concrete Suffering from Alkali-Silica
Reaction in Airfield Pavement Structures [67]. This is done to avoid concrete failures
such as cracking as well as damage to adjacent facilities. UFGS-32 11 36.13 also allows
the use of recycled aggregates in lean concrete (low cement content) base courses
provided it meets the ASTM standards and strength requirement for the intended use
[68].

18
Ternary Blended Cement-Based Binder
The process of making portland cement requires an immense amount of energy
and is known to release carbon dioxide into the environment. The inclusion of
supplementary cementitious materials (SCM) into portland cement concrete mixtures
allows for a reduction in the amount of portland cement needed in the concrete binder,
while incorporating other benefits such as increased strength. Consequently, there is
much interest in researching and standardizing the addition of SCM into cement concrete
[69]. SCM are materials that have cementitious properties on their own, or when
combined with portland cement. Therefore, including them into concrete mixtures
properly improves fresh mixture properties and hardened concrete properties [68].
Isothermal calorimetry measures the change in heat of a substance undergoing a
chemical reaction at a constant ambient temperature. This can be used to measure and
identify patterns in the heat of hydration of cement mixtures containing different
supplements. This correlates directly with the ultimate strength and durability of the
concrete [70]. In general, the hydration of cement occurs in five distinct stages. Upon
first contact with water, a rapid heating process begins with a duration of 15 to 30
minutes as a result of ions dissolving in the water and reacting with components of the
cement (Stage 1) [71]. This period provides no strengthening characteristics to the
concrete; however it can reduce the reaction rate in latter stages [70]. The second part of
hydration is a period of dormancy during which hydration stops temporarily (Stage 2).
During this time, the concrete does not generate heat and is in a workable condition. This
stage may last upward of 5 hours and can be retarded by the inclusion of supplementary
materials and additives. Following the dormant phase, hydration of tricalcium silicate

19
(C3S) and dicalcium silicate (C2S) accelerates in a concrete-strengthening reaction that
produces a significant amount of heat (Stage 3). Following this accelerated hydration
stage, hydrate layers thicken and there is less available surface area of unhydrated
particles, slowing the hydration reaction (Stage 4). During this portion of the reaction,
C3A hydration may occur and will cause a secondary peak in heat of hydration. The
magnitude of this secondary reaction is dependent on the inclusion of pozzolanic
materials in the mixture and will increase significantly with their addition. Finally, the
reaction reaches a steady state where little or no hydration occurs (Stage 5). The figure
below shows the general heat of hydration curve for portland cement concrete as
provided by Kosmatka, et al. [18].
Figure 1. Hydration curve for portland cement concrete [18].
Total heat of hydration is an indicator of completion of reaction in a mixture and thus the
analysis of these reactions through calorimetry is effective in explaining the strength and
durability of individual ternary mixtures.

20
When selecting components and proportions for a concrete mixture, there are
several factors to be considered. Dewar suggested considering the following parameters:
consistency, stiffening rate, cohesion, density, strength, durability, and air content [72].
Requirements in these categories impact the chosen mixture and the method of
proportioning. Concerning individual tests, there are additional factors that must be
considered in a real-world scenario. Materials should accurately represent those to be
used in construction and should be in similar condition to avoid discrepancies between
results in laboratory and field evaluations. Smaller test batches will lose water content
more easily to evaporation and absorption. Lastly, multiple initial tests are preferred
when used as a representation of larger-scale mixtures.
Dewar has cataloged several mixture design methods. The British Ready Mixed
Concrete Association (BRMCA) proposes mixture design based on the plastic properties
of the concrete and measurement of hardened performance [72]. Dewar proposed an
addition to this process based on a computer model of gradation, bulk density and relative
density of aggregates. The goal is to model the interaction between particles accurately as
to avoid the need for preliminary trial mixing. The American Concrete Institute suggests
ACI 211.1-91 as a guideline for selecting proportions for cement concrete made with
other cementitious materials [73]. This document outlines the procedure for determining
mixture proportions by weight equivalency and conversion of absolute volumes to
weights, dependent on specifications regarding water-to-cement ratio, cement content, air
content, required slump, aggregate size, and strength. Kansas Department of
Transportation (KDOT) provides a solution for absolute volume design dependent on the
known required volumes of each component of the mixture [74].
21
Hydraulic cements are materials that demonstrate cementitious properties when
mixed with water, such as portland cement. Excluding portland cement, these are
considered secondary cementitious materials. Blended hydraulic cements are those that
include portland cement along with other hydraulic SCM. These types of SCM include
materials such as slag cement and Class C fly ash. Slag cement is a byproduct of the
operation of iron blast furnaces, and it has been found to increase set time and concrete
strength [75]. Fly ash is a byproduct of coal burning and is usually separated into two
classes for use in cement. Class C fly ash is described as sometimes exhibiting
cementitious properties and contains more calcium oxide [36]. Its effects on concrete can
include needing less water to achieve a set workability, increased strength, and reduced
heat of hydration.
Another type of SCM is pozzolans. These are not cementitious on their own, but
are when combined with calcium hydroxide, a chemical found in hydrating cementitious
materials. There are various types of pozzolans that are added to portland cement
concrete. These can include Class F fly ash, silica fume, and other natural pozzolans.
Class F fly ash is described as being only pozzolanic and containing less calcium oxide
than Class C. Silica fume is a byproduct of making silicon and ferrosilicon alloys.
Pozzolans can strengthen concrete by furthering the production of calcium silica hydrate
(CSH), a strengthening reaction product in hydraulic cements. The addition of silica fume
may increase strength of the cement though the mixture requires a higher water to cement
ratio [76]. Using these products is advantageous in that cement production is a primary
producer of carbon dioxide and using replacement pozzolans helps lower greenhouse gas
emissions. Natural pozzolans were originally used as SCM and include materials such as
22
volcanic ash, calcined clay, calcined shale, and metakaolin [36]. One of the greater points
of interest concerning SCM is decreasing the amount of variability between producers as
most SCM are byproducts and their actual compositions can differ depending on when
they were produced. Decreased variability in the materials can lead to more accurate,
consistent testing results.
Limestone is another material that may be used to lessen the environmental
impact of concrete. Blending limestone and portland cement is a fairly new practice. In
2012 ASTM defined portland limestone cement (PLC) as containing 5% to 15%
limestone [77]. PLC is made by adding limestone to the cement clinker before it is
ground. The limestone is softer than the clinker so it may be crushed into finer particles
than cement, creating a greater particle size distribution in the binder. The purpose of
PLC is to improve the environmental performance of cement. Limestone may affect the
set time, compressive strength, and permeability of concrete [78]. Finer limestone may
decrease the setting time and these fine particles increase density and lower permeability.
Low concentrations of limestone increase early strength. However, when the cement is
more than 15% limestone it may negatively impact compressive strength. When paired
with Class C Fly Ash and slag, the compressive strength of concrete increases [78].
Fresh Ternary Blended Concrete Properties. The inclusion of SCM may affect
the required setting time of a concrete mixture. Setting time affects the construction
logistics as the concrete needs to be transported and placed before setting occurs. After it
is placed, it then needs to be consolidated or formed. Ghosh, et al. found that when Class
C fly ash is used to replace 20% of Type I portland cement, initial and final setting time
can be increased by 96 and 189 minutes, respectively [69]. Class C may be more

23
effective than Class F at increasing setting time when it has a higher content of oxides or
sulfur. Larger increases in setting time occurred when Class C fly ash was mixed into a
ternary mixture with Class F. Time to set was increased by 402 minutes compared to a
control mixture of portland cement only [69].
Hardened Ternary Blended Concrete Properties. Bektas, et al. investigated the
trends that binary and ternary blended concretes exhibited in their hardened properties
[79]. The study found that in binary mixtures of additives and portland cement, adding
Class C fly ash provides similar compressive strengths at 15% and 30% to that of control
samples of portland cement. Ternary blends of Class C fly ash and slag showed improved
strengths. The inclusion of Class F fly ash lowered compressive strengths at 28 days
independent of replacement rate, however the inclusion of slag and Class F fly ash
produced greater strengths. Hariharan, et al. analyzed the effects of ternary blended
binders of fly ash and silica fume on compressive strength and chloride ion permeability
[80]. It was observed that the use of silica fume increased the early and final strength of
concrete compared to a control. When Class C fly ash was mixed with the silica fume, the
silica fume was also found to have a positive effect on the compressive strength of the
concrete and accelerated the early strength. An optimal compressive strength was found
using 30% Class C fly ash and 6% silica fume. The study also found that, except for the
mixture designed for maximum strength, the difference in compressive strength between
the control mixture and the binary and ternary blended concrete mixtures was negligible
[80].

24
Air void systems are a required part of concrete and have a large effect on the
mechanical properties of a mixture. Air void systems consider the air content, spacing
factor, and specific surface of voids in fresh and hardened concrete. Having a well
formed air void system may increase the durability of concrete under freeze-thaw
conditions. Bektas, et al. provides that a good air void system has a spacing factor of less
than 0.2 mm in hardened concrete [79]. The addition of SCM does not have obvious
trends on air void systems. High dosages of silica fume may have a negative effect on air
voids [79, 81].
When cement is mixed, a byproduct of the chemical reaction is the release of heat.
In general, ternary blended concrete have a lower heat of hydration than portland cement
alone [82]. Portland cement with slag takes longer to set and as such releases heat over a
longer period of time than portland cement alone. This leads to a lower peak temperature
of mixtures with slag [81]. When the percentage of fly ash is increased and the
percentage of slag is decreased, the overall heat signature decreases.
Due to sourcing and mixing procedures, drying shrinkage in ternary blended
cement concretes is difficult to examine as the additives have inconsistent effects on the
hardened property [81]. The addition of high doses of silica fume or slag increases drying
shrinkage. Volume stabilization is seen in ternary blends of portland cement, silica fume,
and slag or fly ash. Shrinkage is generally reduced with a reduction of SCM usage. At
higher percent replacements such as 30% slag and 20% fly ash with portland cement, the
mixture may be unable to resist drying shrinkage and are more susceptible to cracking
[82].

25
Freeze-thaw durability is a measure of the capacity of a hardened concrete
mixture to resist cyclic degradation processes. In areas of harsh or varied weather
conditions, freeze-thaw testing may gauge the effect that the environment will have on
the finished concrete. Stundebeck offered that air void structure and air entrapment of a
sample has a great effect on its freeze-thaw resistance [83]. The use of silica fume creates
a refined pore structure which may aid durability, though more than 5% silica fume was
not found to increase resistance any further [81, 83]. Stundebeck also found that
replacing portland cement with slag gives a greater risk of surface damage and freeze-
thaw damage than replacement by fly ash. Mixtures with silica fume, portland cement,
and fly ash also have lower freeze-thaw resistance.
Blended Cement Mixtures with RCA (B-RCA)
Blended, recycled aggregate concretes (B-RCA) achieve the environmental,
economic and materials properties benefits of both binder admixtures and aggregate
substitution when properly used. However, mixtures including RCA and SCM also incur
the negative impacts on the mixture associated with both. This can include the chemical
and physical aggregate properties as well as binder properties and interactions.
Fresh B-RCA Properties. Mixtures incorporating RCA require more water in
order to maintain a comparable workability to virgin aggregate concrete mixtures.
Guardián, et al. found that concrete slump decreases when RCA levels increase, however
when 35% fly ash is added, the slump begins to stabilize and equal the control blend [84].
Kim, et al. finds that adding 30% of fly ash increases the slump of RCA mixtures by a
45% to 100% [85]. The density of concrete mixes only slightly changes when low levels
of fly ash and/or RCA are introduced. The following table shows how density changes

26
based upon the concrete blend, presented by Blezynski, et al. and gathered by Sadati, et
al., Cong, Pepe, Kou and Poon, and Lima, et al. [86-90].
Table 1
Density of Concrete with Recycled Concrete Aggregates
Concrete Mixtures Density (kg/m3)
Conventional Materials 2211-2365
Fly Ash and Coarse RCA 1958-2324
Fly Ash and Fine RCA 1958-2299
The fresh density of concrete mixes decreased when RCA and FA increased.
Mixes with a higher water-cement ratio were less affected than those with low w-c ratios
when RCA and FA were introduced.
Hardened B-RCA Properties. The presence of adhered mortar on recycled
aggregates impacts the ability of fresh mortar to adhere to RCA and may impact mixture
strength. Akbari and Rushabh found that the compressive strength of recycled aggregate
concrete with ternary blended binder is typically at least 76% of that of a virgin mix [91].
The strength of the original pavement which is recycled along with the strength of the
new mix contribute to the strength of a mixture of concrete containing RCA. The
percentage of RCA used and the aggregate size proportion also contribute to the strength
of the mixture. The study found that compressive strength increased with increasing RCA
replacement, with a maximum strength identified between 30% and 40% recycled
aggregate replacement. When introducing secondary cementitious material (SCM) such
as fly ash and silica fume, the adherence was improved between the recycled aggregate

27
and the paste. The optimum percentage of SCM was found to be 5% silica fume and 20%
fly ash without recycled aggregate and 20% fly ash, 10% silica fume with recycled
aggregate at a replacement rate of 50% [91].

28
Chapter 3
Materials Identification
Table 2 provides the raw materials used in testing as well as suppliers from which
the materials were procured.
Table 2
Project Materials
Material Source
Portland Cement, Type I Keystone Cement Co.
Silica Fume BASF Co.
Ground, Granulated Blast Furnace Slag (GGBFS),
Grade 100 Lehigh Hanson, Inc.
Fly Ash, Class C (FAC) Headwaters, Inc.
Fly Ash, Class F (FAF) Salomone Bros., Inc.
Recycled Concrete Aggregate (#57) Salomone Bros., Inc.
Virgin Coarse Aggregate (#57), Trap Rock F. J. Fazzio, Inc.
Fine Aggregate (F.M. = 2.65) F. J. Fazzio, Inc.
Air Entraining Admixture Sika Corp.
Water Reducing Admixture Sika Corp.

29
Portland cement and four supplementary mineral admixtures were addressed in
this study. These were ground, granulated blast furnace slag, Class C fly ash, Class F fly
ash and silica fume. X-ray fluorescence (XRF) was used to determine the oxide
composition of each mineral as given in Table 3. Figure 2 provides the gradations for the
three aggregates used in experimentation. Table 4 provides additional characteristics for
each aggregate.
Table 3
Cementitious Material Oxide Composition
Component Portland Cement
Fly Ash Class C
(FAC)
Fly Ash Class F
(FAF) GGBFS Silica Fume
SiO2 (%) 19.32 28.13 39.01 25.69 94.23
Al2O3 (%) 5.77 13.49 22.75 10.35 0.37
Fe2O3 (%) 2.38 8.97 24.79 0.51 0.32
CaO (%) 61.55 37.30 5.97 56.33 2.23
MgO (%) 2.63 2.87 0.63 3.54 0.27
SO3 (%) 4.56 3.02 1.47 1.76 0.30
Na2O (%) 0.33 1.00 0.37 0.13
K2O (%) 0.97 0.85 2.98 0.45 1.55
TiO2 (%) 2.08 1.43 0.77
P2O5 (%) 1.28 0.35 0.02 0.16
ZnO (%) 0.03 0.26
MnO (%) 0.22 0.09
Others (%) 2.49 1.01 0.22 0.24 0.13

30
Figure 2. Aggregate gradations.
Table 4
Aggregate Properties
Sample Type Bulk Specific Gravity
DRY
Bulk Specific Gravity
SSD
Absorption, %
RCA 2.38 2.49 4.71
Virgin Aggregate 2.76 2.77 0.20
Fine Aggregate 2.60 2.62 1.04

31
Chapter 4
Methodology
Experimentation was segmented into two tasks. Task 1 was blend optimization,
which included all procedures for optimizing the ternary binder composition which was
used for full-scale RCA concrete mixtures. First, mortar cubes were mixed for all binder
combinations of portland cement and mineral admixtures proposed in this research.
Second, isothermal calorimetry was conducted for each mixture in order to observe
curing characteristics and identify interactions between additives. Third, a statistical
analysis was performed on mortar cube strength data to find an optimized solution for the
binder proportions which produce the highest predicted strength for each blend of mineral
admixtures. Finally, fresh mixture tests, surface resistivity, alkali-silica reaction and
concrete compression tests were conducted for each optimized ternary blend to compare
strength gain and resistivity characteristics for each blend. From this data a single blend
was chosen for further testing in RCA concrete. The second task was the testing of
ternary blended concrete with RCA replacement. Additional large-volume concrete
batches were mixed to compare fresh and hardened properties between a control and
ternary blended concrete with varying levels of RCA replacement.
Blend Optimization
Mortar Compressive Strength. Tests were conducted to evaluate the
performance of 25 unique blends of cementitious materials. Mixture proportions, listed
in Table 5, were determined by percentage mass of total cementitious material to create a
design matrix. The notation includes each mineral component followed by that
component’s percentage by mass. Maximum replacements of 30%, 25%, 25%, and 5%
were used for slag, Class C, and Class F fly ashes and silica fume, respectively. These

32
limits were established based upon New Jersey Department of Transportation
recommended practice and a previous study conducted by Taylor, who suggests a
maximum portland cement replacement rate of 60% [92]. Rupnow also observed
improved physical properties for some combinations of ternary blended cements at 50%
portland cement replacement and recommends a maximum portland cement replacement
rate of 70% [93]. Intermediate replacement rates were chosen at equal intervals between
minimum (0%) and maximum replacement rates. Thus, one mix was portland cement,
four were binary blended cements, and the remainders were ternary mixes.
50 millimeter mortar cubes were mixed following ASTM C305. The mortar
water-to-binder ratio (w/b) was 0.45, and the ratio of the binder to fine aggregate by mass
was 0.50. Triplicates were produced for each mix to be tested for compressive strength at
28 and 56 days. Batches were mixed and molded following ASTM C109. Cube
specimens in molds were stored in a moist closet for 24 hours, at which point, cubes were
de-molded and placed in a lime-saturated water curing bath. Prior to testing, cubes were
removed from the bath, surface-dried, and cleared of any debris. The compression testing
configuration conforms to ASTM C109, at a loading rate of 1350 ± 450 Newtons per
second. Peak load at sample failure was recorded for each test.

33
Table 5
Tested Mixture Matrix
Mixture
PC
(%)
FAC
(%)
FAF
(%)
SF
(%)
GGBFS
(%)
PC100 100 0 0 0 0
PC75FAC25 75 25 0 0 0
PC75FAF25 75 0 25 0 0
PC95SF5 95 0 0 5 0
PC70GGBFS30 70 0 0 0 30
PC45FAC25GGBFS30 45 25 0 0 30
PC55FAC25GGBFS20 55 25 0 0 20
PC65FAC25GGBFS10 65 25 0 0 10
PC57.5FAC12.5GGBFS30 57.7 12.5 0 0 30
PC67.5FAC12.5GGBFS20 67.5 12.5 0 0 20
PC77.5FAC12.5GGBFS10 77.5 12.5 0 0 10
PC70FAC25SF5 70 25 0 5 0
PC72.5FAC25SF2.5 72.5 25 0 2.5 0
PC82.5FAC12.5SF5 82.5 12.5 0 5 0
PC85FAC12.5SF2.5 85 12.5 0 2.5 0
PC45FAF25GGBFS30 45 0 25 0 30
PC55FAF25GGBFS20 55 0 25 0 20
PC65FAF25GGBFS10 65 0 25 0 10
PC57.5FAF12.5GGBFS30 57.7 0 12.5 0 30
PC67.5FAF12.5GGBFS20 67.5 0 12.5 0 20
PC77.5FAF12.5GGBFS10 77.5 0 12.5 0 10
PC70FAF25SF5 70 0 25 5 0
PC72.5FAF25SF2.5 72.5 0 25 2.5 0
PC82.5FAF12.5SF5 82.5 0 12.5 5 0
PC85FAF12.5SF2.5 85 0 12.5 2.5 0
Isothermal Calorimetry. Isothermal calorimetry was used to measure the energy
release of paste samples during the hydration process. This was used to measure and
identify patterns in the heat of hydration of cement mixtures containing different
supplementary materials. The test results may correlate directly with the gain and

34
ultimate strength of concrete [94]. Total heat of hydration is an indicator of the extent of
the reaction in a mix, and thus the analysis of these reactions through calorimetry is
effective in explaining the strength and durability of individual ternary mixes.
A high-precision calorimeter was used to measure the energy released during
hydration. The machine was calibrated according to manufacturer specifications for 20˚C
using calcium sulfate hemihydrate, a manufacturer-supplied reference material. The
testing of the cementitious pastes was conducted in compliance with ASTM C1679. All
test samples consisted of 50 grams of cementitious material proportioned by mass
according to Table 5 with a water-to-binder ratio of 0.50. Prior to testing, materials were
stored at 20˚C for 24 hours to minimize temperature differential at the beginning of
testing. Samples were hand-mixed with a plastic stirrer in manufacturer-provided sample
containers over a period of 45 seconds. The date and time were recorded at the beginning
of mixing, approximated to the nearest minute. Two tests were conducted simultaneously,
and data was collected per minute for 72 hours. The cumulative heat of hydration (Joules)
and power (Watts/gram cement) were recorded for each test.
Ternary Blended Concrete with RCA Replacement
Four mixtures were prepared in order to assess the performance of RCA in a
ternary blended concrete. A mixture with only portland cement binder and no RCA
substitution was prepared as a control. Then, a mixture with 30% coarse aggregate
replacement was prepared in order to identify the effects of RCA replacement. Third, a
30% replacement mixture using the ternary blended binder was produced to assess the
performance alterations due to the proposed binder blend. Lastly, a mixture was prepared
using the ternary-blended binder at 50% coarse aggregate RCA replacement to assess

35
high replacement strength and durability. For each mix which included recycled
aggregate, the RCA portion of the coarse aggregate was pre-soaked 24 hours before
mixing to account for the effect of high porosity on fresh mix properties. All mixture
proportions are included in the results and discussion. Table 6 provides a schedule of
tests which were conducted, mix volume, and applicable testing standards. In all cases,
fresh and hardened concrete test procedures follow the addressed ASTM standard.
Compressive strength, elastic modulus, and resistivity were tested at 3, 7, 14, 28, 56 and
90 days. Modulus of rupture was tested at 28 and 90 days. Required volume indicates
mix volume needed for the appropriate testing procedure. Bolded volumes were
summated to attain required batch volume. In all cases, this was 0.15 cubic meters (c.m.).
Fresh properties were tested to ensure mixtures were comparable. In all cases,
slump was controlled via the addition of water reducer to maintain a target of 25 to 50
millimeters. Control for workability ensured that the hardened properties of each batch
can be compared on the assumption that fresh mixture behavior is similar. Target air void
content was 6.0% ± 1.0 to promote proper durability to freeze-thaw cycling. Unit weight
and setting time were recorded for logistical purposes.

36
Table 6
Ternary Blend (TB)-Recycled Concrete Aggregates (RCA) Test Schedule
Property Required Volume
(c.m.) Test Method
Fresh Concrete Properties
Slump 0.006 ASTM C143/ AASHTO T 119
Air Content 0.007 ASTM C231/ AASHTO T 152
Air Voids System - AASHTO T 348
Unit Weight 0.007 ASTM C 138/ AASHTO T 121
Setting Time 0.007 ASTM C403/ AASHTO T 197
Hardened Concrete Properties
Compressive Strength 0.030 ASTM C39/ AASHTO T 22
Electrical Resistivity 0.030 ASTM C1760/ AASHTO T 95
Alkali-Silica Reaction - ASTM C1260
Modulus of Rupture 0.078 ASTM C78/ AASHTO T 97
Elastic Modulus 0.030 ASTM C469
Drying Shrinkage 0.005 ASTM C157/ AASHTO T 150
Resistance to Cyclic F-T 0.009 ASTM C666/ AASHTO T 161

37
Chapter 5
Results and Analysis
Binder Optimization
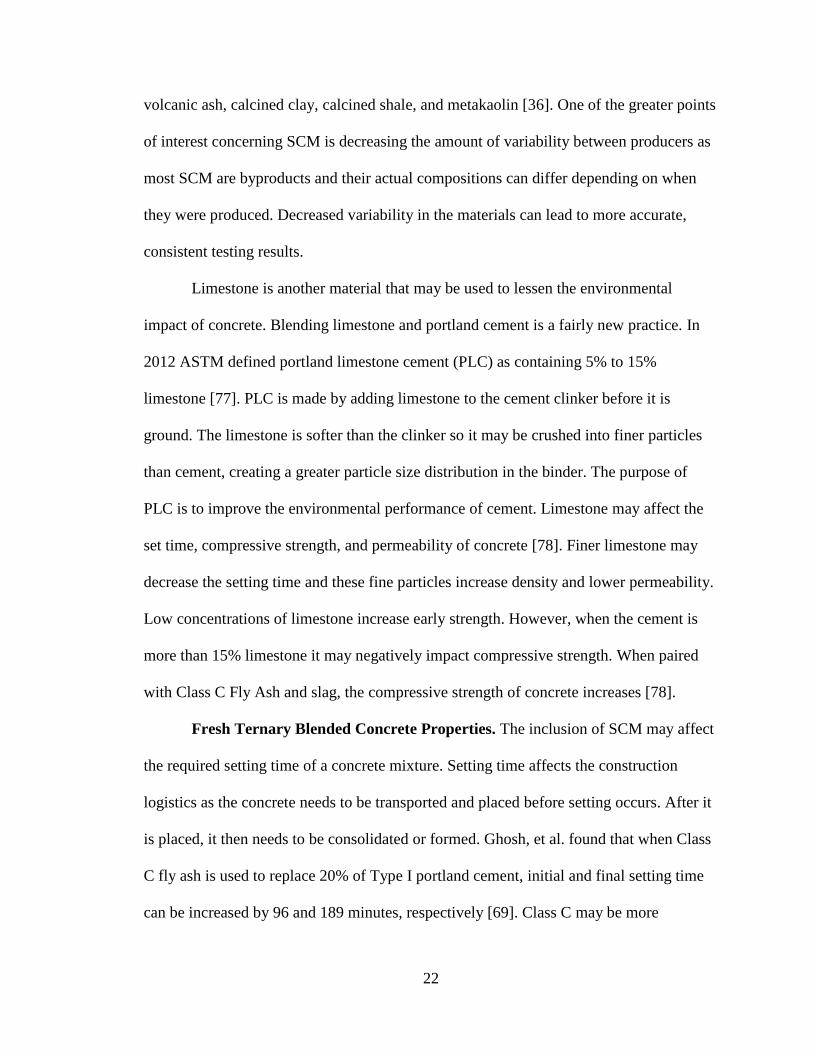
Mortar Cube Strength. Results for the 28-day and 56-day mortar cube average
compressive tests are shown in Figure 3. The bars represent (from left) compressive
strength of a mortar with a portland cement only binder, then binary binders, while the
remaining results are from ternary binders. The ternary binders are grouped by Class C
fly ash with slag (FAC-GGBFS), Class C fly ash with silica fume (FAC-SF), Class F fly
ash with slag (FAF-GGBFS), and Class F fly ash with silica fume (FAF-SF), all with
portland cement. Full tabulated strength data is available in Appendix A.
38
Figure 3. Mortar compressive strength results for 28-day (solid bars) and 56-day (hatched
bars) strength for mixtures tested.
Comparing the binary combinations results to the PC results, replacement of PC
with Class C fly ash or silica fume are shown to be effective in increasing compressive
strength at 28 and 56 days. On the other hand, replacement of PC with Class F fly ash or
GGBFS has a slightly lowering effect on compressive strength at 25% and 30%
replacement, respectively. Comparing the ternary combination results to the PC results, it
is observed that the ternary combinations with Class C fly ash produce higher strengths
than PC, except for PC45FAC25GGBSF30 which has the least amount of portland
cement in the group. With the Class F and GGBFS combination, the compressive
strength becomes lower than the strength of portland cement when Class F fly ash is at
25%, except for PC65FAF25GGBFS10, which has a similar 56 day strength to PC 56 day

39
strength. For the Class F fly ash and silica fume combination, the compressive strengths
are lower or equal in strength to PC strength, except for PC82.5FAF12.5SF5 which has a
higher 56 day compressive strength compared to PC compressive strength.
Isothermal Calorimetry. Calorimetry tests were conducted on all binder
combinations listed in Table 5. Heat of hydration curves plotted as the thermal power
emitted by the binder hydration and reactions over time can be found in Figure 4 to
Figure 8. The figures are grouped by blend compositions.
The first group includes Type I cement paste and four binary blended binders,
Figure 4. The cement paste heat of hydration curve shows a main peak at 11.5 hours and
a sulfate depletion point at 16 hours. The main peak is primarily due to dicalcium silicate
(C2S) and tricalcium silicate (C3S) hydration reaction. The peak heat of hydration
produced by cement is higher than the peak of the binary blends. The pattern of the heat
of hydration with 5% silica fume is similar to the cement curve, only that lower values
were produced. The curve for binary blend with 25% Class F fly ash has a main peak that
is much lower than the cement paste main peak, but occurs at a similar time. It has a
second peak (after the main) at 28 hours, which is due to the secondary tricalcium
aluminate (C3A) reaction [95]. However, the heat of hydration curve for the binder with
25% Class C fly ash had its main peak 4 hours after the portland cement paste. Its second
peak can also be observed to be higher than its main peak. With the paste containing 30%
GGBFS, the main peak is lower that the main peak of the paste with only portland
cement, but occurs at a similar time. Its second peak is slightly lower than its main peak,
much more pronounced than the Class F fly ash curve and not as high as the Class C fly
ash curve. Comparing the presence of GGBFS and Class C fly ash in the binder indicates

40
that the GGBFS has more hydrating calcium silicates while Class F fly ash had more
calcium aluminates reacting during the early age.
Figure 4. Plot of thermal power vs time of Type I cement and binary binders.
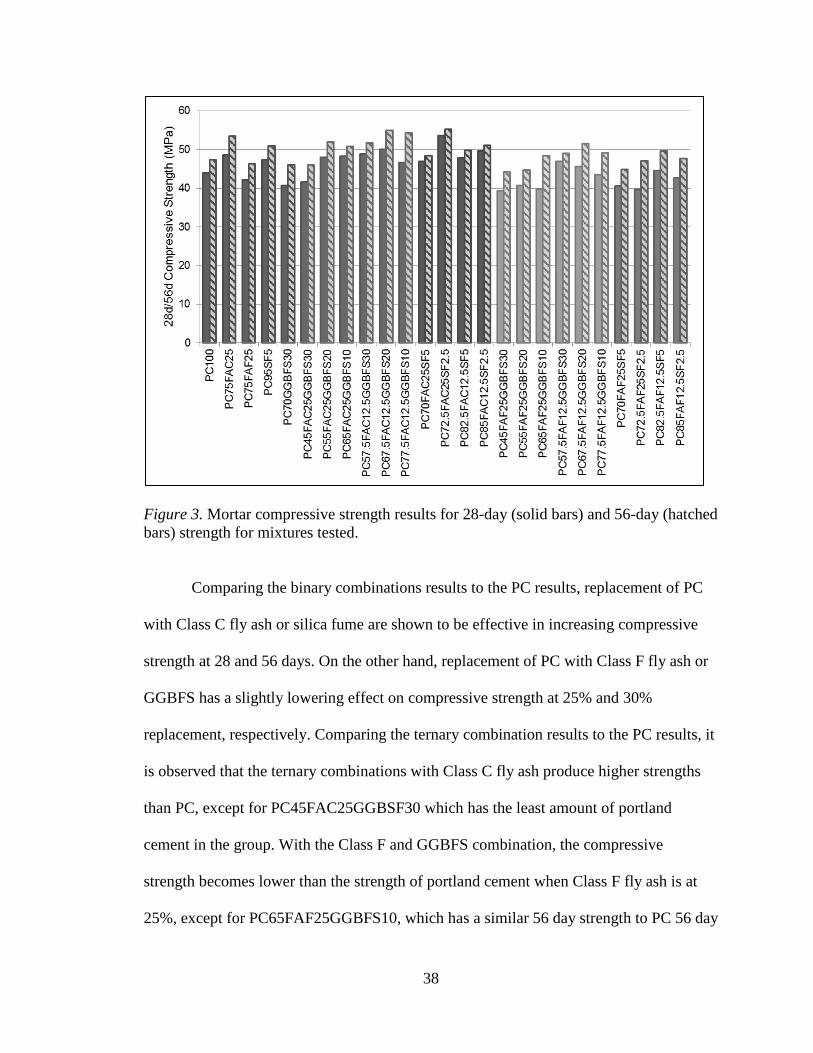
Figure 5 presents results for ternary blends of Class C fly ash and GGBFS. In cases of
very high replacement rates, the secondary reactions shown by the second peak overtake
the initial C2S, C3S reactions by a significant margin. This manifests as a delayed strength
gain in the curing process. Low replacement mixes (see PC77.5FAC12.5GGBFS10)
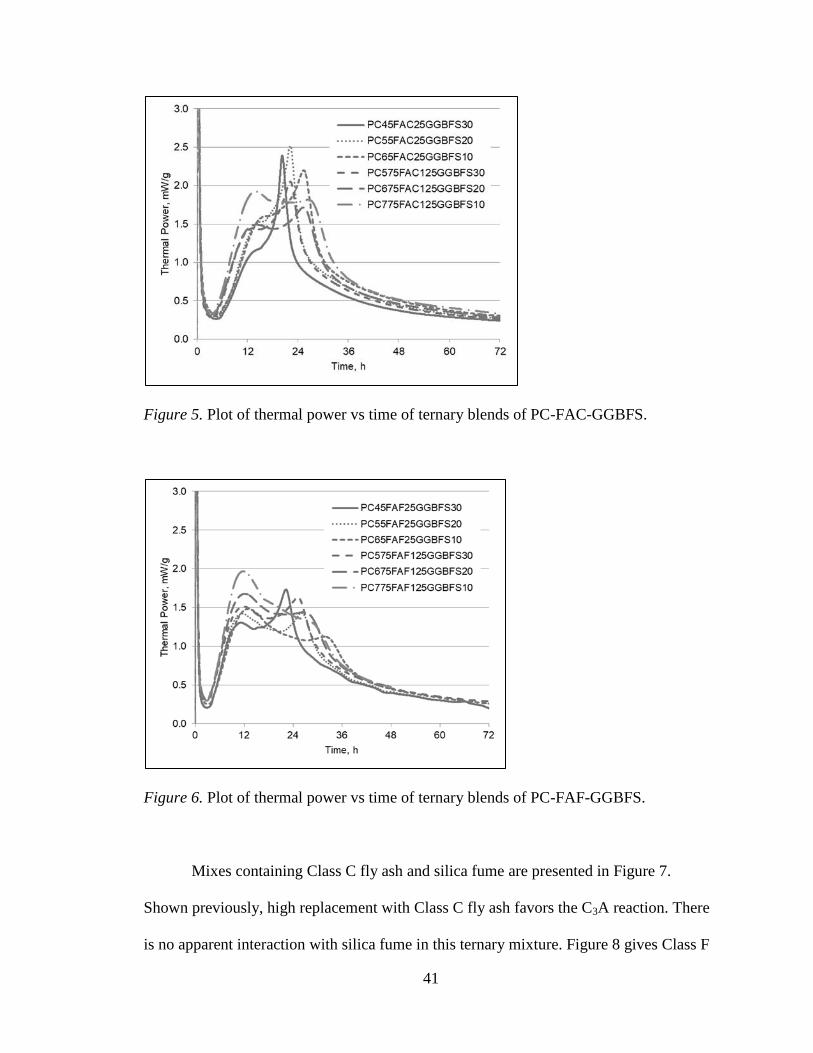
maintain a more significant C2S, C3S reaction. Figure 6 shows blends of Class F fly ash
and GGBFS. These mixes are characterized by a markedly lower peak thermal output
with respect to other mixes as a result of high replacement rates with Class F fly ash in
addition to significant replacement by pozzolanic materials.
41
Figure 5. Plot of thermal power vs time of ternary blends of PC-FAC-GGBFS.
Figure 6. Plot of thermal power vs time of ternary blends of PC-FAF-GGBFS.
Mixes containing Class C fly ash and silica fume are presented in Figure 7.
Shown previously, high replacement with Class C fly ash favors the C3A reaction. There
is no apparent interaction with silica fume in this ternary mixture. Figure 8 gives Class F

42
fly ash and silica fume combinations. These are marked by low thermal peaks and further
reduced heat with an increase in either supplementary material.
Figure 7. Plot of thermal power vs time of ternary blends of PC-FAC-SF.
Figure 8. Plot of thermal power vs time of ternary blends of PC-FAF-SF.

43
The total heat of hydration is determined from thermal power plots by integration
of the area under the curve. A comparison of all conducted tests can be seen in Figure 9.
There is a consistent trend of reduced heat of hydration with an increase in SCM use for
ternary blended cements. However, it was observed that total heat did not necessarily
correlate with peak thermal activity. As such, it is not clear that there is a reduced
completion of reaction in low-heat blends. From the binary blends, it can be seen that
GGBFS has greater reactivity compared to the fly ashes. Even with greater portland
cement replacement, the paste with GGBFS released more heat compared to the pastes
with fly ash. In the Class C fly ash and GGBFS combinations, the GGBFS complements
the fly ash. A higher or equal amount of heat is produced with higher amounts fly ash at
about the same level of total portland cement replacement. In the Class F fly ash and
GGBFS combination, the heat of hydration indicates little or no interaction between the
supplementary cementitious materials; with about the same level of total replacement, a
higher proportion of GGBFS will produce a higher amount of heat of hydration. In silica
fume and fly ash combinations, Class C fly ash with silica fume tends to have a higher
heat of hydration. A lower proportion of silica fume to the amount of Class C fly ash
seems to favor reducing the heat of hydration, while a high proportion of silica fume to
Class F fly ash seems to increase the heat of hydration.

44
Figure 9. Total heat of hydration for all blends.
Statistical Analysis. The 28-day and 56-day compressive strength test data was
analyzed using statistical analysis software JMP. When the 28-day and 56-day strength
data was analyzed by percent portland cement used in each mix, it was determined in
both datasets that the percentage of the cementitious material that was PC does not
impact the average compressive strength above 55% replacement. These plots can be
seen in Figure 10. The diamonds in the figures illustrate a sample mean and 95%
confidence interval. The line across each diamond represents the group mean and the
vertical span represents the 95% confidence interval for each group. As seen in Figure 10,
there is no obvious trend in average strength with total cement replacement value, which
may suggest that the type of SCM used in each mix and the interactions between the PC
and SCM have a more significant effect on the ultimate strength of the concrete than the
fraction of PC used within the ranges considered in this study. It can be noted however

45
that the mean strength of 45% PC is much lower than the mean strengths of 55% PC and
greater.
Figure 10. Scatterplot of 28 day (left) and 56 day (right) compression data by % PC.
Surface plots were made to model the relationship between the replacement rates
of supplementary cementitious materials and the predicted compressive strength from the
data collected in the mortar cube tests. The x- and y- axes each represent the percent
replacement of one SCM being analyzed and range from 0% to maximum replacement
rate tested along each of these axes. Thus the origin point represents no replacement
(Type I portland cement), and data points which lay on an axis represent binary blends
with replacement by only a single SCM. There are four such plots created representing
the studied combinations of SCM seen in Figures 11 through 14. Optimal mix designs
were selected based on the 56-day strength (f’c) analysis as this represents closest the
ultimate strength of the mix.
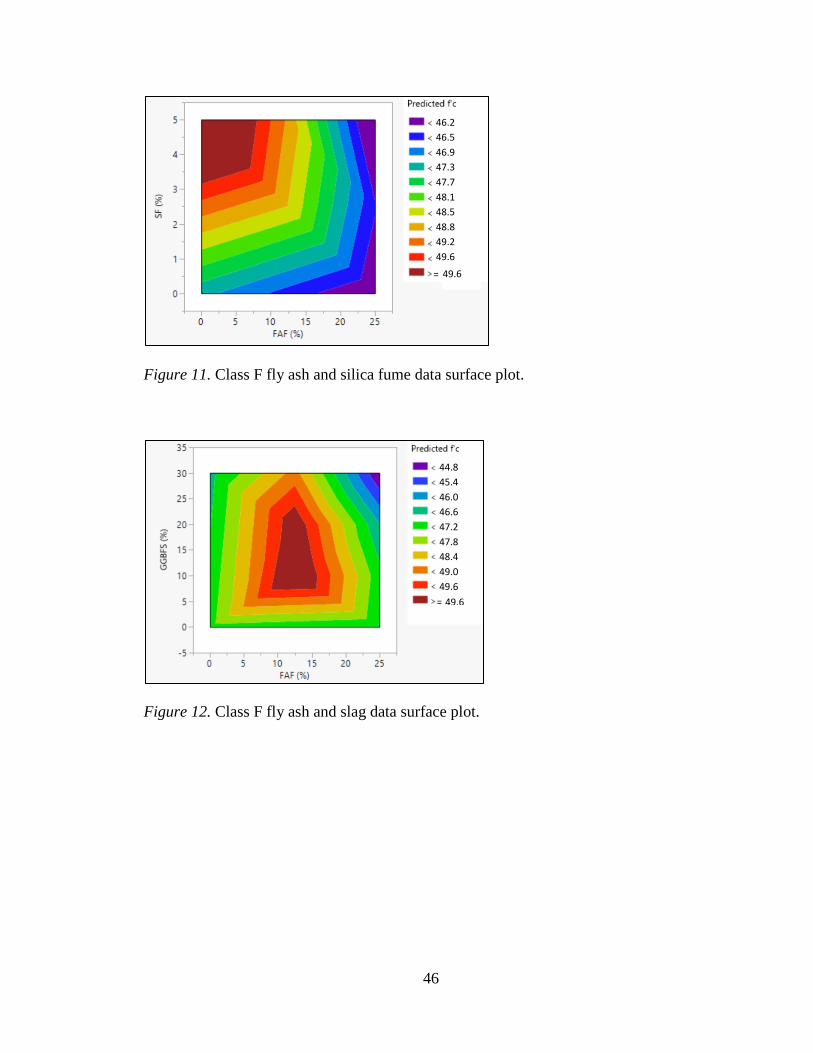
46
Figure 11. Class F fly ash and silica fume data surface plot.
Figure 12. Class F fly ash and slag data surface plot.
46.2
46.5
46.9
47.3
47.7
48.1
48.5
48.8
49.2
49.6
49.6
44.8
45.4
46.0
46.6
47.2
47.8
48.4
49.0
49.6
49.6

47
Figure 13. Class C fly ash and silica fume data surface plot.
Figure 14. Class C fly ash and slag surface plot.
Based on this analysis, Table 7 was produced. These results include optimal SCM
replacement rates for each ternary blend within the studied percent replacement of Type I
portland cement ranges found using the surface plots, as well as total replacement rates
and predicted mortar compressive strengths for each combination. These predicted
compressive strength values were calculated by inputting the optimal percentages of each
45.5
46.1
46.7
47.3
47.9
48.5
49.1
49.8
50.4
51.0
51.0
46.9
47.7
48.6
49.4
50.3
51.2
52.0
52.9
53.7
53.7

48
material found using the surface plots into the function of the corresponding surface
given by the statistical software. It is noted that in the case of PC-FAF-SF combination,
an optimum combination excludes FAF, which makes it a binary binder. Among the three
SCM combinations in Table 7 that are ternary combinations, FAC-GGBFS has the
highest strength and highest total heat of hydration at 72 hours curing within the studied
range of percent replacement of type I portland cement. FAC-SF has the lowest total heat
of hydration, but is second highest in strength. The predicted 56-day compressive
strength of the optimal mixes was compared to the experimentally found compressive
strength at 56-days.
Table 7
Optimized Ternary Blends
SCM
PC
(%)
FAC
(%)
FAF
(%)
GGBFS
(%)
SF
(%)
%
SCM
by
weight
Predicted
56 day
Strength,
MPa
Tested 56
day
Strength,
MPa
Total Heat
of
Hydration
(50g), kJ
FAF-SF 95 0 5 5 51.1 47.3 13.86
FAF-BFS 77.5 12.5 10 22.5 50.7 49.1 11.0
FAC-SF 72.5 25 2.5 27.5 52.5 55.3 10.36
FAC-BFS 77.5 12.5 10 22.5 54.9 54.3 11.81
Ternary Blended Concrete. 100 millimeter diameter concrete cylinders were
mixed for each of the three ternary binder proportions listed in Table 7. Table 8 gives the
mixture proportions used. Proportions for a comparable control mix are available in
Appendix A, Table 10.

49
Table 8
Mixture Proportions of Ternary Blended Concrete Per Cubic Yard
PC77.5FAF12.5GGBFS10
Mix 1
PC72.5FAC25SF2.5
Mix 2
PC77.5FAC12.5GGBFS10
Mix 3
Cement, lb 344.7 415.8 405.3
Fly Ash, lb 74.9 148.5 90.1
Slag, lb 179.9 - 105.1
Silica Fume, lb - 29.7 -
Water, lb 269.8 267.3 270.2
Sand, lb 1459.2 1459.2 1459.2
Nat. Agg., lb 1542.8 1542.8 1542.7
AEA, fl oz/cwt 1.8 2.2 2
Fresh and hardened mixture properties were recorded for each of the three blends.
All hardened tests were conducted in triplicate and average values are presented. Full
tabulated data is available in Appendix A. Table 9 shows the recorded fresh mixture
properties for each of these concrete blends. Slump and air content were maintained for
all blends. This indicated that none of the proposed ternary blends have a significant
detrimental effect on workability or air content. Table 9 also provides data recorded with
an air voids analyzer (AVA). In addition to calculation air content, the test also calculates
specific surface, a ratio of surface area to volume, and spacing factor, or the maximum
distance to an air void in the matrix. Due to the stiffness of the mixtures, samples were
not necessarily fully broken apart by the stirring mechanism.

50
Table 9
Ternary Blended Concrete Fresh Properties
PC77.5FAF12.5
GGBFS10
PC72.5FAC25
SF2.5
PC77.5FAC12.5
GGBFS10
Slump (in) 1.0 1.5 1.25
Air Content, % 5.50 5.50 5.00
Unit Wt. (pcf) 148.36 148.66 143.60
Mix temp (°F) 65 65 65
Air Void Analyzer
Air-% Concrete 2.3 3.1 2.9
Specific Surface (in-1
) 432 401 485
Spacing Factor (in) 0.0197 0.0186 0.0193
Figures 15, 16 and 17 provide evolution of strength, electrical resistivity, and
alkali-silica reaction for each blend. All mixtures have similar late-age strength and
resistivity values. PC77.5FAC12.5GGBFS10 had the slowest strength gain trend,
however ultimately all mixtures performed nearly identical. While these mixes performed
similarly in mortar testing, some factors are considered which may have caused more
similarities in concrete mixing. First, concrete cylinders were mixed in a drum mixer,
which has higher mixing energy than the process used to mix mortar cubes, which may
have influenced mix properties. Additionally, the inclusion of coarse aggregates
introduces additional interfacial transition zones and anisotropy to the mix which controls
failure behavior more so than binder in the case where binders are relatively similar in
strength. Likewise, alkali-silica reactivity is similar for all mixtures. ASR testing was
conducted to 30 days to assess late-age trends in reactivity beyond specification. At up to
30 days, all samples maintained low-risk compliancy. Ultimately to select a blend to

51
proceed forward with in RCA testing the mortar cube analysis is considered. It was
decided that PC77.5FAC12.5GGBFS10 was the optimal ternary binder blend based on
higher predicted strength values from the mortar tests.
Figure 15. Ternary blended concrete compressive strength.

52
Figure 16. Ternary blended concrete electrical resistivity.
Figure 17. Ternary blended concrete alkali-silica reaction.

53
Ternary Blended Concrete with RCA Replacement
Table 10 shows proportions per cubic yard for each mixture with and without
RCA and SCM. In this table, NC is used to describe the control mix with only virgin
aggregates and portland cement binder. NC30 indicates that 30% of the coarse aggregate
of the mix was replaced with RCA. NC30T indicates that the ternary blended binder was
then implemented for the third iteration at 30% RCA. NC50T indicates that recycled
aggregate content was then increased to 50%. Table 11 gives fresh properties recorded.
For all mixes, slump was maintained at 25 millimeters ± 6 millimeters. Air content met or
exceeded the target of 6% +2/-1 in all mixtures. AVA analysis indicated much lower air
content, however it was noted that for all AVA tests the mortar samples were not
properly broken apart during mechanical stirring. There was a slight pattern of loss of
slump with increasing RCA replacement rate. This may be in part due to an increased
mixing temperature as well as recycled aggregate porosity requiring more water. A
higher dose of water reducer was required to counteract loss of slump at constant water
content across all mixtures. The increase in RCA content also increased air content and
reduced mixture unit weight.

54
Table 10
Ternary Blended RCA Mixture Proportions
NC NC30 NC30T NC50T
Cement, lb 656 656 502.3 502.3
Fly Ash C, lb - - 81 81
Slag, lb - - 64.8 64.8
Water, lb 262.4 262.4 259.3 259.3
Sand, lb 1455 1455 1455.4 1455.4
Natural Agg, lb 1539 1077 1077.1 769.4
RCA, lb - 415 415 691.6
AEA, fl oz/cwt 4 4 4 4
HRWR, fl oz/cwt - 2.9 3.05 6.75
Figure 18 shows the progression of setting for each mixture. There is a clear
increase in setting time of approximately 45-minutes to an hour when supplementary
cementitious materials are included in the binder.

55
Table 11
Ternary Blended RCA Fresh Properties
NC NC30 NC30T NC50T
Slump (in) 1.25 1.0 1.0 0.75
Air Content, % 6.0 6.0 6.0 7.0
Unit Wt. (pcf) 145 146 146 142
Mix temp (°F) 76 77 75 87
Air Void Analyzer
Air-% Concrete 1.1 1.5 1.9 3.1
Specific Surface (in-1
) 330.20 236.22 322.58 294.64
Spacing Factor (in) 0.0346 0.0433 0.0255 0.0241
Setting Time
Initial (hrs:min) 3:30 3:20 5:15 4:55
Final (hrs:min) 5:15 5:10 6:35 6:30
Figure 18. Ternary blended RCA setting time.

56
Trends in hardened properties for each mixture were also observed. All tabulated
data is available in Appendix A. Compressive strength is shown in Figure 19. There is an
increase in compressive strength at up to 50% recycled aggregate replacement. In all
cases, mixtures including recycled aggregates exceed the control strength. At 30%
replacement, the ternary blended mixture reduced early strength. However, late-age
strength appears to increase beyond 56-days in ternary blends. Figure 20 shows results
for elastic modulus. Modulus is similar for all blends at late age, however at 50% RCA
the mixture developed more slowly. Modulus developed most quickly in the control
blend but does not ultimately exceed the other blends.
Figure 19. Ternary blended RCA compressive strength.

57
Figure 20. Ternary blended RCA Elastic Modulus.
Modulus of rupture at 28-days and 90-days is shown in Figure 21. In all cases,
mixtures with RCA replacement had greater performance than the control. At 90-days,
both mixtures with SCM had higher modulus of rupture than either the control or the
30% RCA mixture without mineral admixtures.

58
Figure 21. Ternary blended RCA modulus of rupture.
Electrical resistivity development is show in Figure 22. At 28-days, the control
mixture maintains higher surface resistivity than the 30% RCA mixture. However,
surface resistivity is improved in both ternary blended mixtures. NC30T (30% RCA,
ternary blended) performed best, indicating that RCA had a negative effect on the surface
resistivity of the mixtures and that the addition of SCM counteract this effect. Figure 23
shows data for drying shrinkage for all mixtures. The control blend showed the least
change in length for the duration of testing. NC30 (30% RCA) showed the highest
change in length. Again, this indicates that RCA replacement may increase drying
shrinkage, however the use of SCM may alleviate this somewhat. As a measure of
surface permeability, electrical resistivity should correlate with drying shrinkage. Higher
permeability enables more surface drying due to climate exposure. This trend is observed

59
for tested samples. Figure 24 shows freeze-thaw durability testing for all mixtures. All
mixtures reached 300 freeze-thaw cycles while maintaining relative dynamic modulus
above 0.95.
Figure 22. Ternary blended RCA surface resistivity.

60
Figure 23. Ternary blended RCA drying shrinkage.
Figure 24. Ternary blended RCA freeze-thaw durability.

61
Alkali-silica reactivity for each mixture is presented in Figure 25. Length change
over time increased with higher replacement rates of RCA. There was little difference in
results between ternary blended mixtures and mixtures including only portland cement.
At 50% RCA replacement, the samples failed to meet the 16-day low risk limit for length
change (0.10%). The Class F fly ash and slag blend, PC72.7FAF12.5GGBFS10 was then
tested at 50% replacement to analyze the effect of using a different binder (NC50Tb). As
previously shown, this blend performed very similarly to the chosen ternary binder blend
in compressive strength, resistivity, and alkali-silica reactivity in mixtures without RCA.
The alternate blend had similar ASR to the control mixture. It is theorized that the Class
F fly ash used may have contained less alkali content than the Class C (equivalent alkali
content above 5%), and therefore lessened ASR when a more reactive aggregate was
included. Equivalent alkali content is calculated as the sum of sodium oxide and
potassium oxide compounds in the sample.

62
Figure 25. Ternary blended RCA ASR.

63
Chapter 6
Summary and Conclusions
Four ternary blended cement binders were analyzed at different proportions in
order to optimize a concrete binder blend for the purpose of concrete strength. These
were as follows: Class C fly ash and silica fume, Class C fly ash and ground granulated
blast furnace slag (GGBFS), Class F fly ash and silica fume, Class F fly ash and GGBFS.
Mortar cube compressive strength was recorded at 28 and 56 days for 25 unique cement
blends varying mineral admixture replacement rate from 0% to 55% of binder by weight.
Isothermal calorimetry was used to identify curing properties for each blend by analyzing
thermal activity and hydration heat for each blend. Concrete compressive testing and
statistical analysis concluded that a blend of 77.5% portland cement, 12.5% Class C fly
ash, and 10% slag will produce the best compressive strengths among ternary blends
without a loss in surface resistivity or alkali-silica reaction resistance.
Summary of Findings
1. Ternary combinations with Class C fly ash produced higher strengths than portland
cement up to 55% total replacement with SCM at 56-days.
2. Ternary combinations with Class F fly and slag produced higher or similar strengths
to portland cement when replacement is up to 57.5% at 56-days.
3. Ternary combinations of 12.5% Class F fly ash with 5% silica fume may produce
strengths higher than PC at 56 days, but 5% silica fume alone with portland cement
produced higher strength than the ternary blend.
4. The use of SCM tend to reduce the main peak in the heat of hydration, and the total
amount of heat measured in the first 72 hours of hydration. Class C fly ash and slag had a
64
strong secondary C3A reaction which may produce heat greater than the main C3S and
C2S peak.
5. There was a consistent trend of reduced heat of hydration for ternary blended cements
in the first 72-hours of hydration. The optimum strength with the low heat of hydration
was replacement of portland cement with 25% Class C fly ash and 2.5% silica fume,
while the ternary blend with the highest compressive strength was replacement with
12.5% Class C fly ash and 10% slag.
6. Less than 55% portland cement in a ternary blend lead to a decrease in mean strength
compared to 100% portland cement strength at 56-days.
7. Flexural strength improved at up to 30% RCA use. The proposed ternary blended
binder improved 90-day flexural strength above the portland cement mixtures.
8. 25 millimeters ± 25 millimeters slump and 6% +2/-1% air content were consistently
achieved with the proposed mix design for all iterations of binder implementation and
RCA replacement studied.
9. Surface resistivity decreased, drying shrinkage increased, and alkali-silica reaction
increased with RCA use. However, the proposed ternary blended binder improved
concrete performance in these tests.
Conclusions
Concrete mixtures were tested with increasing replacement rate of coarse aggregates
by recycled concrete coarse aggregate and with the optimized ternary blended binder
proportions. Fresh concrete properties were collected to check consistency of workability
and air content between mixtures. Hardened concrete properties were analyzed up to 90-

65
days to compare the strength, durability, and resistance to chemical attack of each
mixture. The following conclusions are drawn from this study.
1. For use in concrete with a fraction of recycled coarse aggregates, a binder proportion
of 77.5% Type I portland cement, 12.5% Class C fly ash, and 10% ground granulated
blast furnace slag proved to be optimal with respect to concrete strength, surface
resistivity, and the limiting of drying shrinkage and alkali-silica reaction.
3. Screened and graded recycled concrete aggregate may be used in concrete mixtures at
up to a 50% fraction of the coarse material without detriment to the strength, modulus, or
durability of the concrete.
4. The porosity of RCA necessitated presoaking prior to batching as well as the potential
use of workability-improving admixture to maintain consistent fresh mix workability at
high coarse aggregate replacement by RCA.
5. The use of supplementary cementitious materials increased setting time consistently
across trials. This has logistical application however may require additional planning to
account for an additional 80 minutes to set time over portland cement mixtures.
6. Proper air entrainment (6% +2 -1 air voids) was sufficient to ensure marginal loss of
freeze-thaw durability characteristics at 50% RCA use.
7. Durability characteristics were properly controlled at 50% RCA with the
incorporation of the optimized ternary blended binder.
66
Future Work
This study proves the utility of ternary blended binders applied in concrete mixtures
which use recycled concrete coarse aggregates. The following are recommended as
additional avenues of research following this study.
1. This study addresses the use of Class C fly ash, Class F fly ash, silica fume, and
ground granulated blast furnace slag. There are several mineral admixtures commonly
used which may be examined via similar experimentation which include limestone,
metakaolin, etc.
2. Higher replacement rates of RCA may be tested. In this study, the detrimental effects
of RCA (shrinkage, resistivity, ASR) are controlled at up to 50%. There exists the
potential for successful concrete mixtures that incorporate up to 100% coarse RCA
replacement.
3. This study addresses the incorporation of RCA that was collected from a single
source. Due to the variability of RCA, additional RCA sources of varying qualities may
be tested.
4. Different sources of RCA will have varying strength and durability characteristics.
With the testing of many sources of RCA, unified guidelines for the use of RCA based on
aggregate quality as it relates to the tests conducted in this study may be designed.

67
References
[1] J.F. Lamond, R.L. Campbell Sr., T.R. Campbell, J.A. Cazares, A. Giraldi, W.
Halczak, H.C. Hale Jr., N.J.T. Jenkins, R. Miller, and P.T. Seabrook. (2001).
“Removal and Reuse of Hardened Concrete.” ACI Committee 555. ACI 555R-01.
[2] D. Pedro, L. de Brito, and L. Evangelista. (2014). “Influence of the use of recycled
concrete aggregates from different sources on structural concrete.” Elsevier.
Construction and Building Materials. 71, pp. 141-151.
[3] M.S. Meddah. (2016). “Recycled aggregates in concrete production: engineering
properties and environmental impact.” MATEC. Web of Conferences. 101, 05021.
[4] ACPA (2010). “Why Recycle Concrete Pavements?” Concrete Pavement Technology
Series, TS043, pp. 1. Skokie, IL.
[5] ACPA (2010). “Properties and Characteristics of CCCA.” Concrete Pavement
Technology Series, TS043, pp. 5. Skokie, IL.
[6] A. Abbaspour, B.F. Tanyu, and B. Cetin. (2016). “Impact of Aging on Leaching
Characteristics of Recycled Concrete Aggregate.” Environmental Science and
Pollution Research. 23:20835–20852.
[7] C.-S. Poon, X. C. Qiao, and D. Chan. (2006). "The Cause and Influence of Self-
Cementing Properties of Fine Recycled Concrete Aggregates on the Properties of
Unbound Sub-Base." Waste Management, 26 (10), pp. 1166-1172.
[8] J. McIntyre, S. Spatari, and H. L. MacLean. (2009). “Energy and Greenhouse Gas
Emissions Trade-Offs of Recycled Concrete Aggregate Use in Nonstructural
Concrete: A North American Case Study.” ASCE Journal of Infrastructure Systems,
Dec. 2009. pp. 361-370.
[9] M.J. McGinnis, M. Davis, A. de la Rosa, B.D. Weldon, and Y.C. Kurama. (2017).
“Quantified Sustainability of Recycled Concrete Aggregates.” Institution of Civil
Engineers. Magazine of Concrete Research, Paper 1600338.
[10] ASTM C29/C29M-17a, Standard Test Method for Bulk Density (“Unit Weight”)
and Voids in Aggregate, ASTM International, West Conshohocken, PA, 2015,
www.astm.org.
[11] S. H. Kosmatka, B. Kerkhoff and W. C. Panarese. (2002). “Design and Control of
Concrete Mixtures.” Skokie:Portland Cement Association.
[12] M. C. Limbachiya, T. Leelawat and R. K. Dhir. (2000). "Use of Recycled Concrete
Aggregate in High-Strength Concrete." Materials and Structures, 33 (233), pp. 574-
580.

68
References (Continued)
[13] N. K. Bairagi, K. Ravande and V. K. Pareek. (1993). "Behaviour of Concrete with
Different Proportions of Natural and Recycled Aggregate." Resources, Conservation
and Recycling, 9 (1-2), pp. 109-126.
[14] L. Butler, J. S. West and S. L. Tighe. (2011). "The Effect of Recycled Concrete
Aggregate Properties on the Bond Strength Between CCCA Concrete and Steel
Reinforcement." Cement and Concrete Research, 41 (10), pp. 1037-1049.
[15] ASTM C29/C29M, Standard Test Method for Bulk Density (“Unit Weight”) and
Voids in Aggregate, ASTM International, West Conshohocken, PA, 2017,
www.astm.org.
[16] ASTM C131/C131M-14, Standard Test Method for Resistance to Degradation of
Small-Size Coarse Aggregate by Abrasion and Impact in the Los Angeles Machine,
ASTM International, West Conshohocken, PA, 2017, 2006, www.astm.org.
[17] M. A. Berube, J. Frenette and B. Marquis. (2002). "Frost-Resistance of Concrete
Incorporating Coarse Aggregates Made of Recycled Concrete." in Proceedings,
Annual Conference - Canadian Society for Civil Engineering.
[18] ASTM C136/C136M-14, Standard Test Method for Sieve Analysis of Fine and
Coarse Aggregates, ASTM International, West Conshohocken, PA, 2014,
www.astm.org.
[19] ASTM D4791 – 10, Standard Test Method for Flat Particles, Elongated Particles, or
Flat and Elongated Particles in Coarse Aggregate, ASTM International, West
Conshohocken, PA, 2010, www.astm.org.
[20] K.W. Anderson, J.S. Uhlmeyer, and M Russell. (2009). “Use of Recycled Concrete
Aggregate in PCCP: Literature Search.” Washington State Department of
Transportation. Special Report.
[21] D.B. Cleary. (2013). “Recycled Concrete Aggregate in Portland Cement Concrete.”
Rowan University. NJDOT Final Report.
[22] (2007). New Jersey Department of Transportation Standard Specifications for Road
and Bridge Construction. NJDOT. Table 901.10.02-1, pp. 321.
[23] ACI Committee 221 (2001). “Guide for Use of Normal Weight and Heavyweight
Aggregates in Concrete.” ACI Committee 221. ACI 221R-96.
[24] ASTM C143 / C143M-15a, Standard Test Method for Slump of Hydraulic-Cement
Concrete, ASTM International, West Conshohocken, PA, 2015, www.astm.org.

69
References (Continued)
[25] M. Barra, M. Etxeberria, A. Marí, and E. Vázquez. (2007). "Influence of Amount of
Recycled Coarse Aggregates and Production Process on Properties of Recycled
Aggregate Concrete." Cement and Concrete Res., 37 (5), pp. 735-742.
[26] T. Brown, K.K. Sagoe-Crentsil, and A.H. Taylor. (2001). “Performance of Concrete
Made With Commercially Produced Coarse Recycled Concrete Aggregate.” Cement
Concrete Res., 31(5), pp. 707-712.
[27] B. Bissonnette, D. Burns, F. Gagnon, M. Jolin, and L. Bolduc. (2009)
"Understanding the Pumpability of Concrete." Shotcrete for Underground Support
XI.
[28] Hallet, Bernard. (2006). “Why Do Freezing Rocks Break?” Science, 314 (5802), pp.
1092–1093.
[29] M.S. Mamlouk, and J.P. Zaniewski. (2011). Materials for Civil and Construction
Engineers, third edition. Upper Saddle River, NJ.
[30] S.R. Boyle, D.I. McLean, D.G. Mjelde, T.C. Spry, and H. Wen. (2014). “Evaluation
of Recycled Concrete as Aggregate in New Concrete Pavements.” Research Project
T4120-32 Evaluation of Recycled Concrete. Dept. of Transportation, Olympia, WA.
[31] P. Amorim, J. de Brito, and L. Evangelista. (2012). "Concrete Made with Coarse
Concrete Aggregate: Influence of Curing on Durability." ACI Mater J, 109 (2).
[32] S. Desai. (2004). "Appreciation of Risks in Specifying and Designing Concrete
Structures," Building Engineer, 79 (6), pp. 26-29.
[33] S. B. Desai and M. C. Limbachiya. (2006). "Coarse Recycled Aggregate - A
Sustainable Concrete Solution." Indian Concrete Journal, 80 (7), pp. 17-23.
[34] M. Davis, A. de la Rosa, Y. Kurama, and M. McGinnis. (2017). “Strength and
Stiffness of Concrete with Recycled Concrete Aggregates.” Construction and
Building Materials, 154, pp. 258-269.
[35] M. Hayles, F. Ahimoghadam, L. Sanchez, and M. Noel. (2017) “Effect of Original
Concrete Properties on Performance of CCCA Concrete.” Presented at ACI October
2017.
[36] A.S. Abdel-Hay. (2015). “Properties of Recycled Concrete Aggregate Under
Different Curing Conditions.” Housing and Building National Research Center, 2-6.

70
References (Continued)
[37] V. Corinaldesi (2010). “Mechanical and Elastic Behavior of Concrete Made of
Recycled-Concrete Coarse Aggregate.” Construction and Building Materials 24, pp.
1616-1620.
[38] ASTM, ASTM C469 / C469M - 10 Standard Test Method for Static Modulus of
Elasticity and Poisson's Ratio of Concrete in Compression, Conshohocken, PA,
www.astm.org.
[39] U. Meinhold, G. Mellmann, and M. Maultzsch. (2001). "Performance of High-Grade
Concrete with Full Substitution of Aggregates by Recycled Concrete." in SP-202:
Third Canmet/ACI International Symposium: Sustainable Development of Cement
and Concrete.
[40] V. W. Y. Tam, C. M. Tam and Y. Wang. (2007) "Optimization on Proportion for
Recycled Aggregate in Concrete Using Two-Stage Mixing Approach," Construction
and Building Materials, 21 (10), pp. 1928-1939.
[41] S. C. Kou, C. S. Poon and C. Dixon, "Influence of Fly Ash as Cement Replacement
on the Properties of Recycled Aggregate Concrete," Journal of Materials in Civil
Engineering, 19 (9), pp. 709-717, 2007.
[42] K.Y. Ann, Y.B. Kim, H.Y. Moon, and J. Ryou. (2007). “Durability of Recycled
Concrete Using Pozzolanic Materials.” Waste Management, 28, pp. 993-999.
[43] S.C. Angulo, B. Cazacliu, A. Cothenet, E. Hamard, and M. Quattrone. (2016).
“Measuring the Water Absorption of Recycled Aggregates, What is the Best Practice
for Concrete Production?” Construction and Building Materials, 123, pp. 690-703.
[44] ASTM C642-13, Standard Test Method for Density, Absorption, and Voids in
Hardened Concrete, ASTM International, West Conshohocken, PA, 2013,
www.astm.org.
[45] ASTM D4404-10, Standard Test Method for Determination of Pore Volume and
Pore Volume Distribution of Soil and Rock by Mercury Intrusion Porosimetry,
ASTM International, West Conshohocken, PA, 2010, www.astm.org.
[46] T.C. Hansen. (1986). “Recycled Aggregates and Recycled Aggregate Concrete
Second State-of-the-Art Report Developments 1945-1985.” Materials and
Structures, 1 (111), pp. 201-246.
[47] C. Thomas, J. Setién, J.A. Polanco. P. Alaejos, and M. Sánchez De Juan. (2013).
“Durability of Recycled Aggregate Concrete.” Construction and Building Materials,
40, pp. 1054-1065.

71
References (Continued)
[48] J. Andal, M. Shehata, and P. Zacarias. (2016). “Properties of Concrete Containing
Recycled Concrete Aggregate of Preserved Quality.” Construction and Building
Materials, 125, pp. 842-855.
[49] J-Z. Xiao, X-D. Xu, and Y-H. Fan. (2013). “Shrinkage and creep of recycled
aggregate concrete and their prediction by ANN method.” Journal of Building
Materials, 16 (5), pp. 752-757.
[50] T. Yamato, Y. Emoto, and M. Soeda. (1998). “Mechanical Properties, Drying
Shrinkage and Resistance to Freezing and Thawing of Concrete Using Recycled
Aggregate.” American Concrete Institute. ACI Special Publication SP 179-7, 179 pp.
105-122.
[51] ASTM C596-09, Standard Test Method for Drying Shrinkage of Mortar Containing
Hydraulic Cement, ASTM International, West Conshohocken, PA, 2017,
www.astm.org
[52] ASTM, ASTM C666 (2012b), Standard test method for resistance of concrete to
rapid freezing and thawing, Conshohocken, PA, www.astm.org.
[53] J. Yamasaki and K. Tatematsu. (1998). “Strength and Freeze-Thaw Resistance
Properties of Concrete Using High-Quality Recycled Aggregate.” Asanuma Corp.
Japan. Transactions of the Japan Concrete Institute, 20, pp. 45-52.
[54] R. M. Salem, E. G. Burdette and N. M. Jackson. (2003). "Resistance to Freezing and
Thawing of Recycled Aggregate Concrete." ACI Materials Journal, 100 (3), pp. 216-
221.
[55] Y. Wei, Y. Meng and Q. Sun. (2012). "Effects of Calcined Diatomite on Resistance
to Permeability and Freeze-Thaw of Recycled Aggregate Concrete (RAC)." 2nd
International Conference on Frontiers in Manufacturing and Design Science.
[56] S.B. Huda and M.S. Alam. (2015). “Mechanical and Freeze-Thaw Durability
Properties of Recycled Aggregate Concrete Made with Recycled Coarse
Aggregate.” Journal of Materials in Civil Engineering, 27 (10).
[57] N.S. Amorim, Jr., G.A.O. Silva, and D.V. Ribeiro. (2017). “Effects of the
Incorporation of Recycled Aggregate in the Durability of the Concrete Submitted to
Freeze-Thaw Cycles.” Construction and Building Materials.
[58] K. Obla. (2005). “Alkali Silica Reactions.” Concrete in Focus. Naylor Publications,
Inc. Silver Spring, Md. pp. 45-47.
72
References (Continued)
[59] ASTM C 1293, Standard Test Method for Determination of Length Change of
Concrete Due to Alkali-Silica Reaction, ASTM International, West Conshohocken,
PA, 2015, www.astm.org.
[60] X. Li and D.L. Gress. (2006). “Mitigating Alkali-Silica Reaction in Concrete
Containing Recycled Concrete Aggregate.” Transportation Research Record, 1979,
pp. 30-35.
[61] M.D.A. Thomas, B. Fournier, K.J. Folliard. (2008). “Report on Determining the
Reactivity of Concrete Aggregates and Selecting Appropriate Measures for
Preventing Deleterious Expansion in New Concrete Construction.” The Transtec
Group, Inc. Austin, Tx.
[62] United States of America Department of Defense. (2004). Standard Practice for
Concrete Pavements. UFC 3-250-04 pp. 4.
[63] United States of America Department of Defense. (2004). Standard Practice for
Pavement Recycling. UFC 3-250-07 pp. (5-1)-(5-3).
[64] United States of America Department of Defense. (2011). Portland Cement Concrete
Pavement for Roads and Site Facilities. USACE Unified Facilities Guide
Specifications, UFGS-32 13 13.06.
[65] United States of America Department of Defense. (2015). Concrete Pavement for
Airfields and Other Heavy-Duty Pavements. USACE Unified Facilities Guide
Specifications, UFGS-32 13 11.
[66] United States of America Department of Defense. (2017). Aggregate Base Courses.
USACE Unified Facilities Guide Specifications, UFGS-32 11 23.
[67] United States of America Department of Defense. (2007). Engineering Technical
Letter (ETL) 07-6: Risk Assessment Procedure for Recycling Portland Cement
Concrete (PCC) Suffering from Alkali-Silica Reaction (ASR) in Airfield Pavement
Structures. HQ AFCESA/CEOA, ETL-07-6.
[68] United States of America Department of Defense. (2006). Lean Concrete Base
Course. USACE Unified Facilities Guide Specifications, UFGS-32 11 36.13.
[69] P. Ghosh, S. Hanson, P. Taylor, P. Tikalsky, and K. Wang. (2011). “Development
Of Performance Properties Of Ternary Mixtures: Laboratory Study On Concrete.”
Report No. DTFH61-06-H-00011, National Concrete Pavement Technology Center,
Ames, IA.

73
References (Continued)
[70] S.G. Kim. (2010). “Effect of Heat Generation from Cement Hydration on Mass
Concrete Placement.” MS thesis. Iowa State University. pp. 14-20.
[71] K. Wang, Z. Ge, J. Grove, J. Mauricio Ruiz, and R. Rasmussen. (2006).
“Developing a Simple and Rapid Test for Monitoring the Heat Evolution of
Concrete Mixtures for Both Laboratory and Field Applications.” Center for
Transportation Research and Education, Iowa State University.
[72] J. Dewar. (2003). “Mix Design.” Advanced Concrete Technology; Processes.
Elsevier, Butterworth-Heinemann. Oxford, UK.
[73] ACI Committee 211. (2002). “Standard Practice for Selecting Proportions for
Normal, Heavyweight, and Mass Concrete.” ACI Committee 211. ACI 211.1-91.
[74] (2012). “5.3 Mix Design Methods.” Construction Manual, 2012. Kansas DOT. pp. 1-
7.
[75] M.E. Ayers, A. Davis, G.J. Fick, J. Gajda, J. Grove, D. Harrington, B. Kerkhoff,
S.H. Kosmatka, H.C. Ozyildirim, J.M. Shilstone., K. Smith, S.M. Tarr, P.D. Tennis,
P.C. Taylor, T.J. Van Dam, G.F. Voigt, and S. Waalkes. (2007). “Integrated
Materials and Construction Practices for Concrete Pavement: A State-of-the-Practice
Manual.” Report No. FHWA HIF - 07 – 004, Federal Highway Administration,
Washington, D.C.
[76] H Tutanji and T El-Korchi. (1995), “The influence of silica fume on the compressive
strength of cement paste and mortar” Cement and Concrete Research, 25(7). pp
1592.
[77] ASTM C595 / C595M-17, Standard Specification for Blended Hydraulic Cements,
ASTM International, West Conshohocken, PA, 2017, www.astm.org.
[78] C. Goguen. (2014). “Portland-Limestone Cement.” (Online). Available:
<http://precast.org/2014/06/portland-limestone-cement/> (Oct. 16, 2017).
[79] F. Bektas, H. Ceylan, P, Taylor, and E. Yurdakul. (2014), “Effect of Water-to-
Binder Ratio, Air Content, and Type of Cementitious Materials on Fresh and
Hardened Properties of Binary and Ternary Blended Concrete.” Journal of Materials
in Civil Engineering, 26 (60).
[80] A.R. Hariharan, A S Santhi, and G Mohan Ganesh. (2011), “Effect of Ternary
Cementitious system on compressive strength and resistance to Chloride ion
penetration” International Journal of Civil and Structural Engineering, 1 (4). (700-
701).

74
References (Continued)
[81] R. Bleszynski, R.D. Hooton, M.D.A. Thomas, and C.A. Rogers. (2002) “Durability
of Ternary Blend Concrete with Silica Fume and Blast-Furnace Slag: Laboratory and
Outdoor Exposure Site Studies” ACI Materials Journal, 99 (5), pp. 499-508.
[82] X. Hu, C. Shi, X. Shi, B. Tong, and D. Wang. (2017) “Early Age Shrinkage and
Heat of Hydration of Cement-Fly Ash-Slag Ternary Blends.” Construction and
Building Materials." 153, pp. 858-865.
[83] C.J. Stundebeck. (2007) “Durability of Ternary Blended Cements in Bridge
Applications.” University of Missouri-Columbia.
[84] H. Gurdián, E. García-Alcocel, F. Baeza-Brotons, P. Garcés, E. Zornoza. (2014).
“Corrosion Behavior of Steel Reinforcement in Concrete with Recycled Aggregates,
Fly Ash and Spent Cracking Catalyst.” Materials, 7 (4) pp. 3176-3197.
[85] K. Kim, M. Shin, and S. Cha. (2013). “Combined Effects of Recycled Aggregate
and Fly Ash Towards Concrete Sustainability.” Construction and Building Materials,
48 pp. 499-507.
[86] S. Sadati, M. Arezoumandi, K.H. Khayat, and J.S. Volz. “Shear Performance of
Reinforced Concrete Beams Incorporating Recycled Concrete Aggregate and High-
Volume Fly Ash.” J. Cleaner Product., 115 pp. 284-293.
[87] K. Cong. (2006). “Reusing Recycled Aggregates in Structural Concrete.” PhD
thesis. Hong Kong Polytechnic University/Civil Engineering. Hong Kong, China.
pp. 278.
[88] M. Pepe. (2015). “A Conceptual Model For Designing Recycled Aggregate Concrete
For Structural Applications.” PhD thesis. University of Salerno/Civil Engineering.
Italy. pp. 167.
[89] S. Kou, C. Poon. (2009). “Properties of Self-Compacting Concrete Prepared with
Coarse and Fine Recycled Concrete Aggregates.” Cement and Concrete Composites,
vol. 31 no. 9, pp. 622-627.
[90] C. Lima, A. Caggiano, C. Faella, E. Martinelli, M. Pepe, and R. Realfonzo. (2013).
“Physical Properties and Mechanical Behaviour of Concrete Made with Recycled
Aggregates and Fly Ash.” Construction Building Materials, 47 pp. 547-559.
[91] Y.V. Akbari and D. Rushabh. (2015). “Behavior of Recycled Coarse Aggregate in
Ternary Blended Concrete with Microsilica and Flyash.” International Journal for
Scientific Research & Development. 3 (3).

75
References (Continued)
[92] Taylor, P. (2014). “The Use of Ternary Mixtures in Concrete.” InTrans Project
Reports. 74.
[93] Rupnow, T. D. “Evaluation of Ternary Cementitious Combinations.” Louisiana
Transportation Research Center, Baton Rouge, LA, 2012.
[94] S.G. Kim. “Effect of Heat Generation from Cement Hydration on Mass Concrete
Placement.” MS thesis. Iowa State University. 2010, pp. 14-20.
[95] Neville, A. M., Properties of Concrete, 4th ed. New York: John Wiley and Sons,
1996.

76
Appendix A
Additional Tabulated Data
Table A1
28-Day Mortar Cube Compressive Strength
Mixture Compressive Strength, psi Average Standard
Deviation
PC100 6839.30 6306.70 5996.10 6380.70 426.443
PC75FAC25 6482.70 7648.40 6980.30 7037.13 584.924
PC75FAF25 6384.50 5726.70 6208.80 6106.67 340.586
PC95SF5 6605.80 7379.10 6598.10 6861.00 448.704
PC70GGBFS30 5135.90 4564.60 6673.00 5457.83 1090.44
PC45FAC25GGBFS30 6052.10 6311.60 5733.80 6032.50 289.398
PC55FAC25GGBFS20 6779.10 7209.40 6852.10 6946.87 230.272
PC65FAC25GGBFS10 7025.70 7129.80 6842.10 6999.20 145.669
PC57.5FAC12.5GGBFS30 6837.30 7320.70 7095.60 7084.53 241.89
PC67.5FAC12.5GGBFS20 6830.50 7692.00 7247.10 7256.53 430.827
PC77.5FAC12.5GGBFS10 6436.10 6836.80 6984.70 6752.53 283.842
PC70FAC25SF5 6770.90 6987.10 6651.50 6803.17 170.111
PC72.5FAC25SF2.5 7676.30 8261.50 7367.00 7768.27 454.286
PC82.5FAC12.5SF5 6905.40 7040.10 6878.00 6941.17 86.7672
PC85FAC12.5SF2.5 7247.70 7074.70 7269.20 7197.20 106.631
PC45FAF25GGBFS30 5767.60 5366.10 5987.10 5706.93 314.914
PC55FAF25GGBFS20 5627.10 6059.10 5987.90 5891.37 231.614
PC65FAF25GGBFS10 5834.70 5716.30 3628.60 5059.87 1240.93
PC57.5FAF12.5GGBFS30 6840.30 6802.20 6752.90 6798.47 43.8194
PC67.5FAF12.5GGBFS20 6457.90 7339.30 6043.30 6613.50 661.863
PC77.5FAF12.5GGBFS10 6384.90 6475.40 6084.30 6314.87 204.74
PC70FAF25SF5 5822.10 6029.90 5803.50 5885.17 125.687
PC72.5FAF25SF2.5 5122.00 6099.70 6041.60 5754.43 548.473
PC82.5FAF12.5SF5 6298.00 6281.50 6787.20 6455.57 287.321
PC85FAF12.5SF2.5 5584.80 6627.50 6324.50 6178.93 536.375
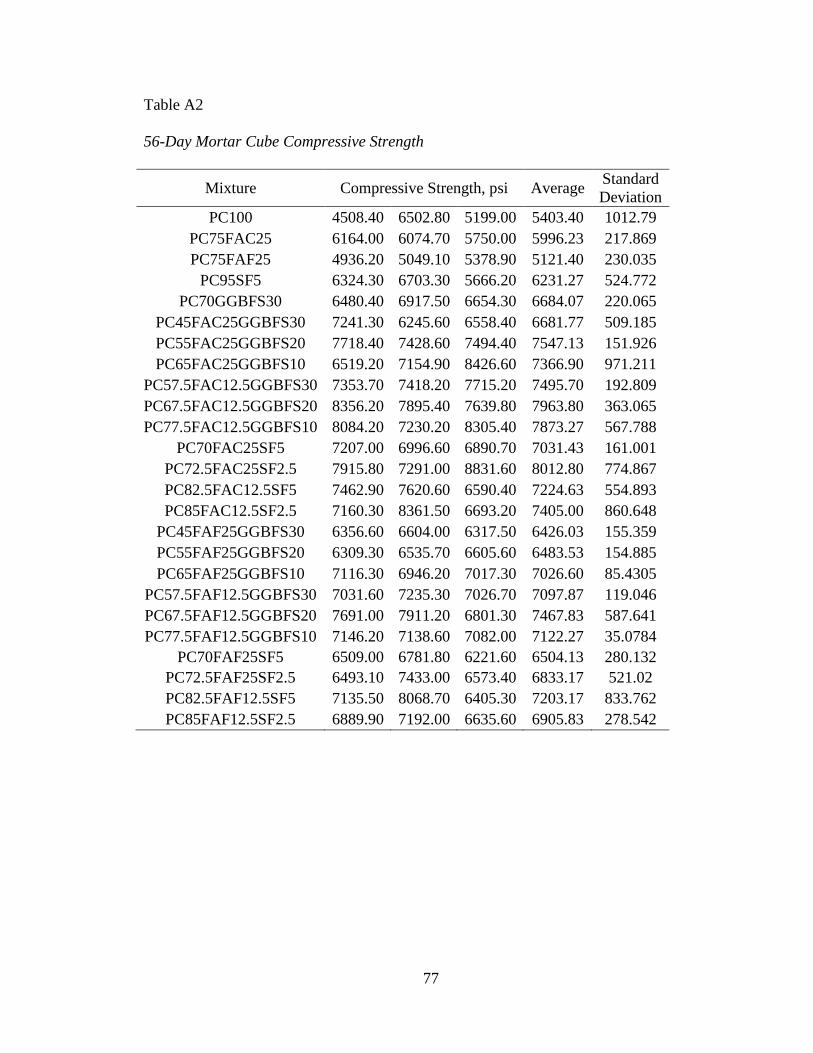
77
Table A2
56-Day Mortar Cube Compressive Strength
Mixture Compressive Strength, psi Average Standard
Deviation
PC100 4508.40 6502.80 5199.00 5403.40 1012.79
PC75FAC25 6164.00 6074.70 5750.00 5996.23 217.869
PC75FAF25 4936.20 5049.10 5378.90 5121.40 230.035
PC95SF5 6324.30 6703.30 5666.20 6231.27 524.772
PC70GGBFS30 6480.40 6917.50 6654.30 6684.07 220.065
PC45FAC25GGBFS30 7241.30 6245.60 6558.40 6681.77 509.185
PC55FAC25GGBFS20 7718.40 7428.60 7494.40 7547.13 151.926
PC65FAC25GGBFS10 6519.20 7154.90 8426.60 7366.90 971.211
PC57.5FAC12.5GGBFS30 7353.70 7418.20 7715.20 7495.70 192.809
PC67.5FAC12.5GGBFS20 8356.20 7895.40 7639.80 7963.80 363.065
PC77.5FAC12.5GGBFS10 8084.20 7230.20 8305.40 7873.27 567.788
PC70FAC25SF5 7207.00 6996.60 6890.70 7031.43 161.001
PC72.5FAC25SF2.5 7915.80 7291.00 8831.60 8012.80 774.867
PC82.5FAC12.5SF5 7462.90 7620.60 6590.40 7224.63 554.893
PC85FAC12.5SF2.5 7160.30 8361.50 6693.20 7405.00 860.648
PC45FAF25GGBFS30 6356.60 6604.00 6317.50 6426.03 155.359
PC55FAF25GGBFS20 6309.30 6535.70 6605.60 6483.53 154.885
PC65FAF25GGBFS10 7116.30 6946.20 7017.30 7026.60 85.4305
PC57.5FAF12.5GGBFS30 7031.60 7235.30 7026.70 7097.87 119.046
PC67.5FAF12.5GGBFS20 7691.00 7911.20 6801.30 7467.83 587.641
PC77.5FAF12.5GGBFS10 7146.20 7138.60 7082.00 7122.27 35.0784
PC70FAF25SF5 6509.00 6781.80 6221.60 6504.13 280.132
PC72.5FAF25SF2.5 6493.10 7433.00 6573.40 6833.17 521.02
PC82.5FAF12.5SF5 7135.50 8068.70 6405.30 7203.17 833.762
PC85FAF12.5SF2.5 6889.90 7192.00 6635.60 6905.83 278.542

78
Table A3
Ternary Blended Concrete Hardened Properties
PC77.5FAF12.5
GGBFS10 PC72.5FAC25SF2.5
PC77.5FAC12.5
GGBFS10
Compressive strength
3d (psi) 4189 3493 3231
7d (psi) 4309 4396 3892
14d (psi) 4953 4535 4438
28d (psi) 5037 5061 5426
56d (psi) 5528 5659 5686
Electrical Resistivity
3d (kΩ/cm) 9.5 6.6 7.6
7d (kΩ/cm) 14.1 11.4 10.8
14d (kΩ/cm) 17.0 11.8 16.5
28d (kΩ/cm) 23.2 17.8 21.9
56d (kΩ/cm) 25.6 25.8 25.1

79
Table A4
PC77.5FAC12.5GGBFS10 Ternary Blended Alkali-Silica Reaction
Time
(days)
Std Bar
RDG
(in)
Specimen
RDG (in) CRD ∆Lx (%) Mass (lb)
Specimen
RDG (in) CRD ∆Lx (%) Mass (lb)
Specimen
RDG (in) CRD ∆Lx (%) Mass (lb)
1 2 3
-1 0.2651 0.2942 0.0291 0
0.2919 0.0268 0
0.2938 0.0287 0
0 0.2652 0.2974 0.0322 0 440.5000 0.2959 0.0307 0 438.6000 0.3013 0.0361 0 441.8000
1 0.2651 0.2994 0.0343 0.021 441.1000 0.2968 0.0317 0.01 440.1000 0.3019 0.0368 0.007 442.0000
3 0.2652 0.3005 0.0353 0.031 441.9000 0.2976 0.0324 0.017 440.6000 0.3029 0.0377 0.016 442.8000
5 0.2652 0.3014 0.0362 0.040 442.3000 0.2986 0.0334 0.027 440.9000 0.3036 0.0384 0.023 443.1000
7 0.265 0.3016 0.0366 0.044 442.4000 0.2985 0.0335 0.028 441.0000 0.3036 0.0386 0.025 443.2000
10 0.265 0.3018 0.0368 0.046 443.1000 0.2989 0.0339 0.032 441.9000 0.3039 0.0389 0.028 444.3000
14 0.2648 0.3028 0.038 0.058 443.4000 0.2997 0.0349 0.042 442.1000 0.305 0.0402 0.034 444.2000

80
Table A5
PC77.5FAF12.5GGBFS10 Ternary Blended Alkali-Silica Reaction
Time
(days)
Std Bar
RDG
(in)
Specimen
RDG (in) CRD ∆Lx (%) Mass (lb)
Specimen
RDG (in) CRD ∆Lx (%) Mass (lb)
Specimen
RDG (in) CRD ∆Lx (%) Mass (lb)
1 2 3
-1 0.2651 0.2958 0.0307 0
0.2986 0.0335 0
0.2958 0.0307 0
0 0.2652 0.2955 0.0303 0 433.20 0.2931 0.0279 0 440.60 0.2964 0.0312 0 437.20
1 0.2651 0.2961 0.031 0.007 433.90 0.2938 0.0287 0.008 441.00 0.297 0.0319 0.007 437.80
3 0.2652 0.2966 0.0314 0.011 434.70 0.2944 0.0292 0.013 442.00 0.2976 0.0324 0.012 438.50
5 0.2652 0.2972 0.032 0.017 435.10 0.295 0.0298 0.019 442.20 0.2983 0.0331 0.019 438.90
7 0.265 0.2971 0.0321 0.018 435.30 0.295 0.03 0.021 442.60 0.2981 0.0331 0.019 439.20
10 0.265 0.2973 0.0323 0.02 436.10 0.2952 0.0302 0.023 443.00 0.2982 0.0332 0.02 439.90
14 0.2648 0.2982 0.0334 0.031 436.50 0.2962 0.0314 0.035 443.70 0.2991 0.0343 0.031 440.00

81
Table A6
PC72.5FAC25SF2.5 Ternary Blended Alkali-Silica Reaction
Time
(days)
Std Bar
RDG
(in)
Specimen
RDG (in) CRD ∆Lx (%) Mass (lb)
Specimen
RDG (in) CRD ∆Lx (%) Mass (lb)
Specimen
RDG (in) CRD ∆Lx (%) Mass (lb)
1 2 3
-1 0.2652 0.2948 0.0296 0 438.90 0.2908 0.0256 0 428.20 0.2875 0.0223 0 435.90
0 0.2651 0.2932 0.0281 0 438.60 0.2958 0.0307 0 430.40 0.3005 0.0354 0 441.40
1 0.2653 0.2946 0.0293 0.012 439.20 0.2975 0.0322 0.015 431.10 0.3019 0.0366 0.012 442.00
3 0.2652 0.2957 0.0305 0.024 439.80 0.2984 0.0332 0.025 431.50 0.3028 0.0376 0.022 442.50
5 0.2651 0.2962 0.0311 0.03 440.00 0.2989 0.0338 0.031 431.80 0.3033 0.0382 0.028 442.60
7 0.2651 0.2962 0.0311 0.03 440.00 0.2989 0.0338 0.031 432.00 0.3033 0.0382 0.028 443.30
10 0.2648 0.2966 0.0318 0.037 440.90 0.2993 0.0345 0.038 432.70 0.3037 0.0389 0.035 443.90
14 0.2649 0.2968 0.0319 0.038 441.30 0.2996 0.0347 0.04 433.00 0.3041 0.0392 0.038 444.00
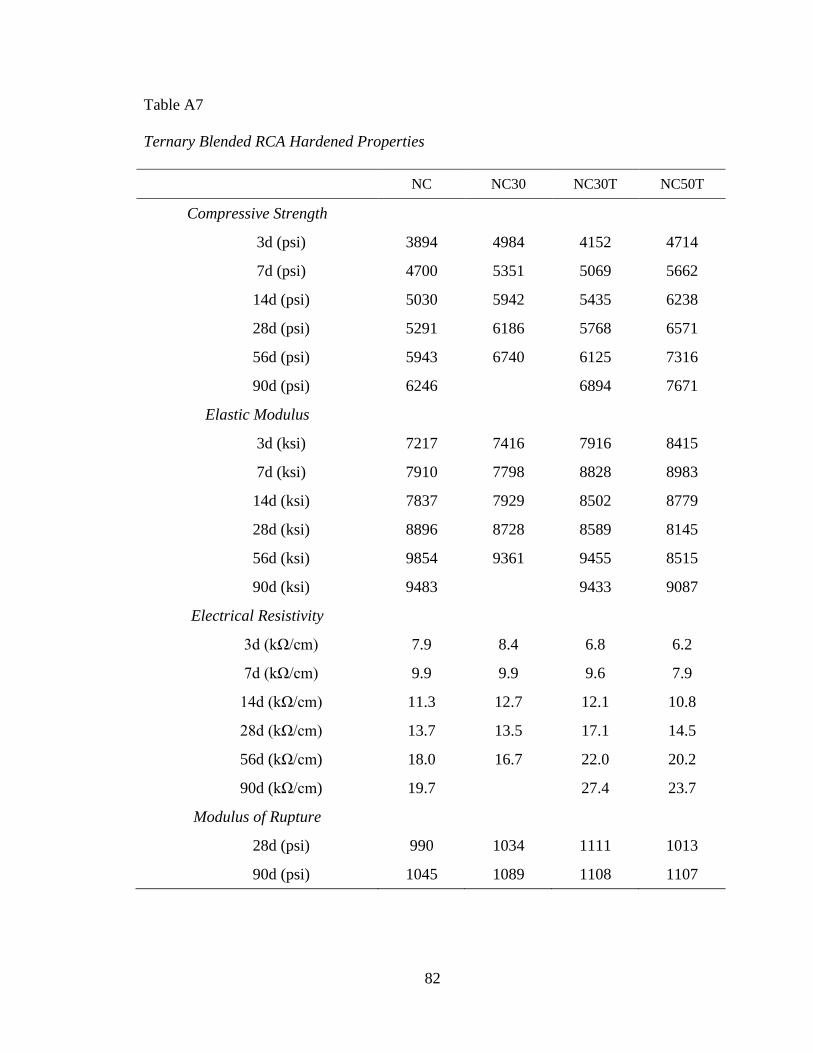
82
Table A7
Ternary Blended RCA Hardened Properties
NC NC30 NC30T NC50T
Compressive Strength
3d (psi) 3894 4984 4152 4714
7d (psi) 4700 5351 5069 5662
14d (psi) 5030 5942 5435 6238
28d (psi) 5291 6186 5768 6571
56d (psi) 5943 6740 6125 7316
90d (psi) 6246 6894 7671
Elastic Modulus
3d (ksi) 7217 7416 7916 8415
7d (ksi) 7910 7798 8828 8983
14d (ksi) 7837 7929 8502 8779
28d (ksi) 8896 8728 8589 8145
56d (ksi) 9854 9361 9455 8515
90d (ksi) 9483 9433 9087
Electrical Resistivity
3d (kΩ/cm) 7.9 8.4 6.8 6.2
7d (kΩ/cm) 9.9 9.9 9.6 7.9
14d (kΩ/cm) 11.3 12.7 12.1 10.8
28d (kΩ/cm) 13.7 13.5 17.1 14.5
56d (kΩ/cm) 18.0 16.7 22.0 20.2
90d (kΩ/cm) 19.7 27.4 23.7
Modulus of Rupture
28d (psi) 990 1034 1111 1013
90d (psi) 1045 1089 1108 1107

83
Table A8
NC Alkali-Silica Reaction
Time
(days)
Std Bar
RDG (in)
Specimen
RDG (in) CRD ∆Lx (%)
Mass
(g)
Specimen
RDG (in) CRD ∆Lx (%)
Mass
(g)
Specimen
RDG (in) CRD ∆Lx (%)
Mass
(g)
1 2 3
-1 0.2348 0.2569 0.0221 0 444.88 0.2563 0.0215 0 440.14 0.2578 0.023 0 443.68
0 0.235 0.2638 0.0288 0 444.6 0.2634 0.0284 0 440.64 0.2649 0.0299 0 444.09
1 0.2347 0.2642 0.0295 0.007 445.29 0.2634 0.0287 0.003 440.63 0.2654 0.0307 0.008 444.3
3 0.2348 0.2645 0.0297 0.009 445.51 0.2637 0.0289 0.005 441.41 0.2657 0.0309 0.01 444.86
5 0.2343 0.2649 0.0306 0.018 445.8 0.2638 0.0295 0.011 441.7 0.2657 0.0314 0.015 444.98
7 0.2349 0.2656 0.0307 0.019 445.5 0.2653 0.0304 0.02 441.28 0.2668 0.0319 0.02 444.84
10 0.2347 0.2665 0.0318 0.03 445.7 0.2659 0.0312 0.028 441.61 0.2671 0.0324 0.025 444.91
14 0.2351 0.2673 0.0322 0.034 445.48 0.2664 0.0313 0.029 441.2 0.268 0.0329 0.03 444.75

84
Table A9
NC30 Alkali-Silica Reaction
Time
(days)
Std Bar
RDG (in)
Specimen
RDG (in) CRD ∆Lx (%) Mass (g)
Specimen
RDG (in) CRD ∆Lx (%) Mass (g)
Specimen
RDG (in) CRD ∆Lx (%) Mass (g)
1 2 3
-1 0.2348 0.2562 0.0214 0 442.63 0.2592 0.0244 0 440.05 0.257 0.0222 0 437.03
0 0.235 0.263 0.028 0 442.64 0.2661 0.0311 0 440.77 0.2634 0.0284 0 437.8
1 0.2347 0.2635 0.0288 0.008 442.75 0.2665 0.0318 0.007 440.7 0.2641 0.0294 0.010 437.86
3 0.2348 0.2638 0.029 0.010 443.42 0.2673 0.0325 0.014 441.28 0.265 0.0302 0.018 438.5
5 0.2343 0.2642 0.0299 0.019 443.55 0.2678 0.0335 0.024 441.38 0.2657 0.0314 0.030 438.52
7 0.2349 0.2661 0.0312 0.032 443.57 0.2691 0.0342 0.031 441.35 0.2669 0.0320 0.036 438.65
10 0.2347 0.2677 0.033 0.050 444.3 0.271 0.0363 0.052 442.13 0.2672 0.0325 0.041 439.17
14 0.2351 0.2714 0.0363 0.083 444.27 0.2742 0.0391 0.080 442.37 0.2721 0.0370 0.086 439.5
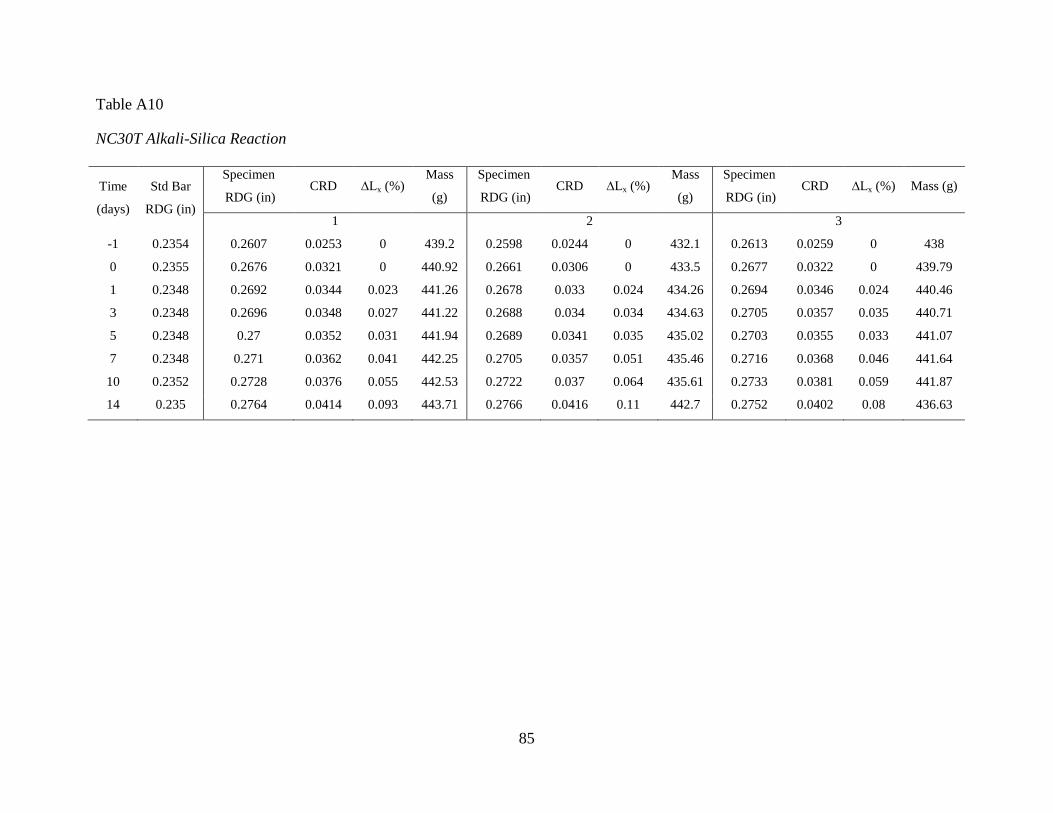
85
Table A10
NC30T Alkali-Silica Reaction
Time
(days)
Std Bar
RDG (in)
Specimen
RDG (in) CRD ∆Lx (%)
Mass
(g)
Specimen
RDG (in) CRD ∆Lx (%)
Mass
(g)
Specimen
RDG (in) CRD ∆Lx (%) Mass (g)
1 2 3
-1 0.2354 0.2607 0.0253 0 439.2 0.2598 0.0244 0 432.1 0.2613 0.0259 0 438
0 0.2355 0.2676 0.0321 0 440.92 0.2661 0.0306 0 433.5 0.2677 0.0322 0 439.79
1 0.2348 0.2692 0.0344 0.023 441.26 0.2678 0.033 0.024 434.26 0.2694 0.0346 0.024 440.46
3 0.2348 0.2696 0.0348 0.027 441.22 0.2688 0.034 0.034 434.63 0.2705 0.0357 0.035 440.71
5 0.2348 0.27 0.0352 0.031 441.94 0.2689 0.0341 0.035 435.02 0.2703 0.0355 0.033 441.07
7 0.2348 0.271 0.0362 0.041 442.25 0.2705 0.0357 0.051 435.46 0.2716 0.0368 0.046 441.64
10 0.2352 0.2728 0.0376 0.055 442.53 0.2722 0.037 0.064 435.61 0.2733 0.0381 0.059 441.87
14 0.235 0.2764 0.0414 0.093 443.71 0.2766 0.0416 0.11 442.7 0.2752 0.0402 0.08 436.63

86
Table A11
NC50T Alkali-Silica Reaction
Time (days) Std Bar
RDG (in)
Specimen
RDG (in) CRD ∆Lx (%) Mass (g)
Specimen
RDG (in) CRD ∆Lx (%) Mass (g)
1 2
-1 0.2354 0.2589 0.0235 0 431.7 0.2569 0.0215 0 438.6
0 0.2355 0.2649 0.0294 0 433.6 0.2637 0.0282 0 440.5
1 0.2348 0.2662 0.0314 0.02 434.13 0.2651 0.0303 0.021 440.35
3 0.2348 0.2664 0.0316 0.022 434.22 0.2666 0.0318 0.036 440.9
5 0.2348 0.2667 0.0319 0.025 435.9 0.2667 0.0319 0.037 441.55
7 0.2348 0.2689 0.0341 0.047 435.43 0.2684 0.0336 0.054 442.03
10 0.2352 0.2715 0.0363 0.069 435.96 0.2719 0.0367 0.085 442.35
14 0.235 0.2772 0.0422 0.128 436.94 0.277 0.042 0.138 443.19

87
Table A12
NC50Tb Alkali-Silica Reaction
Time
(days)
Std Bar
RDG (in)
Specimen
RDG (in)
CRD ∆Lx (%) Mass (g) Specimen
RDG (in)
CRD ∆Lx (%) Mass (g) Specimen
RDG (in)
CRD ∆Lx (%) Mass (g)
1 2 3
-1 0.2342 0.2598 0.0256 0 446.21 0.2568 0.0226 0 438.14 0.2565 0.0223 0 439.47
0 0.2342 0.2663 0.0321 0 445.3 0.264 0.0298 0 440 0.2639 0.0297 0 442
1 0.2342 0.2673 0.0331 0.01 0.2645 0.0303 0.005 -0.2342 0
3 0.2342 0.2676 0.0334 0.013 0.2643 0.0301 0.003 0.2645 0.0303 0.006
5 0.2342 0.2678 0.0336 0.015 0.2651 0.0309 0.011 0.2646 0.0304 0.007
7 0.2342 0.2689 0.0347 0.026 449.4 0.2658 0.0316 0.018 441.9 0.2654 0.0312 0.015 443.7
10 0.2342 0.2692 0.035 0.029 449.8 0.2663 0.0321 0.023 442.5 0.2656 0.0314 0.017 444.1
14 0.2348 0.2717 0.0369 0.048 451 0.2686 0.0338 0.04 443 0.2683 0.0335 0.038 444