Long Term Monitoring Optimization (LTMO) – Concepts - CityChlor
43
Long Term Monitoring Optimization (LTMO) Concepts and tools
Transcript of Long Term Monitoring Optimization (LTMO) – Concepts - CityChlor

Long Term Monitoring Optimization (LTMO) Concepts and tools

Long Term Monitoring Optimization (LTMO) – Concepts and tools 2

Long Term Monitoring Optimization (LTMO) – Concepts and tools 3
Summary
According to a previous literature review carried out by INERIS in 2009, evolution of a long-
term monitoring (increase/decrease or stop of the monitoring) is performed usually on a "case
by case" approach in many countries. Mainly because of the uniqueness of a site, the
evolutions are usually based on different arguments that may affect the consistency of the
approach. In order to harmonize practices and assist site managers and regulators, it seems
necessary to develop a code of best practices.
The works carried out since 2009 by INERIS indicate the existence of two methods for the
development and the optimization of groundwater monitoring on polluted site: the verification
(UK-EA) and the Long Term Monitoring Optimization (US-EPA). The best professional
judgment and the quantification approach are similar concepts to these two methods but the
LTMO seems more complete (more detailed) and many applications are available today.
Optimization techniques have been applied in the USA to the design of monitoring networks
for site characterization, detection monitoring, and compliance monitoring. In practice,
however, optimization techniques are most often applied to Long-term monitoring (LTM)
programs, as these programs typically provide well-defined spatial coverage of the monitored
area, and have been implemented for a sufficient period of time to generate a relatively
comprehensive monitoring history.
LTMO offers an opportunity to improve the effectiveness of the LTM in place by assuring that
monitoring achieves its objectives with an appropriate level of effort. These methods are
mostly used in the USA on large polluted sites, with very important network. INERIS analyzed
the main methods and carried out tests on French polluted sites to evaluate and adapt the
method to smaller sites, similar to those involved in CityChlor.
The results acquired on four real sites on which the process was carried out until the end by
INERIS show that recommendations for changes in monitoring networks may differ
depending on the method used, in particular with the quantitative approach. A qualitative
approach is always necessary to analyze the data and to judge the relevance of the
proposals of the quantitative analysis.
The qualitative approach is of interest to frame the process and provide guidance on the
elements for reflection.
This report presents the first things to consider in the context of the evolution of monitoring:
the minimum size of the network, the prerequisites and some adaptations proposed in the
qualitative approach at this stage.
Indeed, work is continuing to draft a national methodology for specifying the issues in the
context of an assessment of a monitoring (monitoring points and frequency, substances to be
considered in particular).
Whatever the approach it turns out to be a tool for decision support, such as analytical or
numerical modeling, the final stakeholders must make a choice, based on the results but also
the uncertainties associated (must be clearly identified and presented).
Long Term Monitoring Optimization (LTMO) – Concepts and tools 4
Table of content
Summary ................................................................................................................................... 3
Table of content ......................................................................................................................... 4
1 Introduction ....................................................................................................................... 5
1.1 CityChlor and the integrated approach ...................................................................... 5
1.2 CityChlor and technical innovations .......................................................................... 5
2 Context and aim of this guideline ...................................................................................... 6
3 Literature review, feedback in Europe and the USA ......................................................... 7
3.1 Concept developed in the UK: verification (with short-term, medium-term and long-term monitoring) .................................................................................................................... 8
3.2 Approach developed in the USA: Long Term Monitoring Optimization ................... 11
4 Summary of LTMO concepts and tools .......................................................................... 14
4.1 Qualitative evaluation – Best professional judgment ............................................... 14
4.2 Quantitative evaluation ............................................................................................ 16
5 Methods tests .................................................................................................................. 18
5.1 Brief overview of the data available and evaluations .............................................. 19
5.1.1 Site background information .............................................................................. 19
5.1.2 Qualitative evaluation......................................................................................... 24
5.1.3 Quantitative evaluation ...................................................................................... 24
5.2 Synthesis qualitative and quantitative evaluation (test 1) ........................................ 29
5.3 Comparison between tests results (test 1 and test 2) ............................................. 32
6 Recommendations in the context of « Citychlor » (COHV, Urban zone) ........................ 33
6.1 Remarks / prerequisites ........................................................................................... 33
6.2 Adaptation of the qualitative approach .................................................................... 34
7 Conclusion and further work ........................................................................................... 36
8 References ...................................................................................................................... 37
9 Annexes .......................................................................................................................... 38

Long Term Monitoring Optimization (LTMO) – Concepts and tools 5
1 Introduction
1.1 CityChlor and the integrated approach
Space is scarce in Europe. Even in the subsurface it is getting busier. Large-scale soil and groundwater contamination with chlorinated solvents are often an obstruction for urban developments. The traditional way of dealing with polluted soil and groundwater does not work in all cases and is not economically and sustainable feasible. In urban environments multiple contaminations with chlorinated solvents are often mixed with each other and spread underneath buildings. This not only leads to technical problems for remediation, but also to liability and financial discussions and hence has an impact on society. An integrated approach and area-oriented approach is needed to tackle the problems. The CityChlor project has demonstrated that remediation and sustainable development can evolve on a parallel timescale. An integrated approach combines all aspects that are relevant to tackle the problems that pollution with VOC in urban environment causes. Depending on area, site and context different aspects together or parallel to each other can be used. Not only technical solutions are included, but also socio-economical aspects as urban development, communication, financial and legal aspects, time, space, environment and actors (active & passive) have to be handled. CityChlor did not remain at single case remediation, but looked at the area as a whole in a bigger context: the area-oriented approach. A technical approach that makes it possible to remediate, monitor and control multiple groundwater sources and plumes within a fixed area.
1.2 CityChlor and technical innovations
The managing of knowledge and technical innovations are one of the key to achieve a sustainable city development. A development project has to cope with loads of information coming from different disciplines in different (technical) languages and with different uncertainties. With chlorinated solvents, the knowledge about the pollution will always have a certain uncertainty that can have an impact on the course and the costs of the remediation. An efficient 'managing of knowledge' will try to decrease this degree of uncertainty. CityChlor therefore also worked on the technical aspects of characterization and remediation. The conventional techniques that are applied for investigation and remediation have their limitations dealing with chlorinated solvents. Promising innovative techniques exist, but do not easily find their way to current application. This barrier is often caused by lack of knowledge on different levels. Experts and contractors do not always have the means to invest in experiments with new techniques, authorities are reluctant to accept techniques of which the results may be uncertain and clients aren't eager to pay for experimental techniques. Dissemination of knowledge can break this deadlock. CityChlor therefore collected experiences from field application of innovative techniques and implemented itself a number of techniques in pilot projects. For the detailed outcomes, the reader is referred to the specific reports.
CityChlor - “new solutions for complex pollutions” http://www.citychlor.eu/

Long Term Monitoring Optimization (LTMO) – Concepts and tools 6
2 Context and aim of this guideline
Depending on management options, groundwater quality monitoring aims to inform about the
presence of pollution, to understand its evolution, or guide and verify the effectiveness of
management actions.
In the framework of the CityChlor project (polluted sites with chlorinated hydrocarbons in
urban areas), long-term monitoring can be necessary. The present document deal with “how
this long-term groundwater monitoring can evolve?”
According to a previous literature review carried out by INERIS in 2009, evolution of a long-
term monitoring (increase/decrease the sampling frequency or the number of substances and
monitoring wells, completely stop the monitoring) is performed usually on a "case by case"
approach in many countries (INERIS, 2009). Mainly because of the uniqueness of a site, the
evolutions are usually based on different arguments that may affect the consistency of the
approach. In order to harmonize practices in France and in Europe and assist site managers
and regulators, it seems necessary to develop a code of best practices.
The state of the art about long-term monitoring optimization has not identified a specific
methodological tool in Europe (INERIS, 2009). But a recent approach for verification of
remediation efficiency is available in the UK (for short-term, medium-term and long-term
monitoring). In the USA, it appears that concept is underway for several years and feedback
is important on Long-Term Monitoring Optimization (LTMO) (EPA, 2005).
Optimization techniques have been applied in the USA to the design of monitoring networks
for site characterization, detection monitoring, and compliance monitoring (Loaiciga et al.,
1992). In practice, however, optimization techniques are most often applied to Long-term
monitoring (LTM) programs, as these programs typically provide well-defined spatial
coverage of the monitored area, and have been implemented for a sufficient period of time to
generate a relatively comprehensive monitoring history.
LTM is defined in the USA as a monitoring conducted after some active, passive, or
containment remediation has been selected and put in place. It’s also used to evaluate the
efficiency of the remediation as regard to its objectives (e.g., removal of groundwater
contaminants, restoration of groundwater quality, etc.). After a site enters the LTM phase, site
characterization is essentially complete, and the existing monitoring network can be adapted,
as necessary, to achieve the objectives of the LTM program (Reed et al., 2000). However,
site characterization networks often are not perfectly suited for LTM, because they were
installed with a different purpose, to define the nature and extent of the problem when the site
was not very well known. Sometimes, the money spent on LTM program provides incomplete
information but in other situations the monitoring yields procures much more information than
necessary.
LTMO offers an opportunity to improve the effectiveness of the LTM in place (during cycles:
between 2 and 5 years,) by assuring that monitoring achieves its objectives with an
appropriate level of effort. The optimization may identify inadequacies in the monitoring
program, and recommend changes to achieve remediation objectives and limit potential
impacts to the public and the environment. LTMO may also reduce monitoring costs.
These methods are mostly used in the USA on large polluted sites, with very important
network. INERIS analyzed the main methods and carried out tests on French polluted sites to
evaluate and adapt the method to smaller sites, similar to those involved in CityChlor.

Long Term Monitoring Optimization (LTMO) – Concepts and tools 7
3 Literature review, feedback in
Europe and the USA
The state of the art regarding the optimization of monitoring programs for groundwater was
carried out over Europe and the USA. In addition to the consultation of scientific publications
and Internet sites, various people involved in the field of groundwater pollution have been
contacted. Our request was for current practices in their respective countries and the
existence of specific methodological tools on groundwater monitoring evolution (especially in
the context of a polluted site).
As shown in Figure 1 about 81 people were initially contacted. 29 answers were received, for
27 countries (mainly in Europe).
Figure 1 : Contacts and number of answers (modified from INERIS, 2009)
Although the number of answers collected thanks to this survey does not guarantee the
completeness of the information shown, they nevertheless provide an indication. Thus, it
appears that many studies on groundwater monitoring are ongoing in relation with the
implementation of WFD (Water Framework Directive).
Works on verification of the effectiveness of remediation are in progress in the UK and works
on long term monitoring and optimization are underway in the U.S.A for several years
(LTMO).
The following sections introduce the concepts developed in the UK and in the USA.

Long Term Monitoring Optimization (LTMO) – Concepts and tools 8
3.1 Concept developed in the UK: verification (with short-
term, medium-term and long-term monitoring)
This document provides guidance on designing and implementing verification activities to
demonstrate the effectiveness and to increase confidence in the outcome of a remediation
strategy.
Verification is defined by Environmental Agency (EA) as the process of demonstrating that
the risk has been reduced to meet remediation criteria and objectives based on a quantitative
assessment of remediation performance (Figure 2). The fundamental objective of a
verification program is to proof that identified risks are successfully managed over pre-
defined timescales and to stop monitoring.
Figure 2 : Verification definitions (EA, 2010)
In many cases the duration of post-remediation monitoring is short enough to enable
verification leading to project closure, with no need for further monitoring or maintenance.
However, groundwater monitoring may need to be extended over a period of years, possibly
decades, to demonstrate that long-term remediation objectives are achieved (Figure 3).
The verification report may be interim in nature. Indeed, monitoring and verification activities
may need to continue until all objectives are achieved.
A list of lines of evidence related to the verification of remediation is proposed. This list
includes in particular the achievement of field measurements to complement and correlate
laboratory analysis, data acquisition for the immobilization of pollutants (sorption), the
analysis of concentrations of intermediates and final (bio)degradation products (Figure 4).

Long Term Monitoring Optimization (LTMO) – Concepts and tools 9
Figure 3 : Flowchart for long-term monitoring (EA, 2010)

Long Term Monitoring Optimization (LTMO) – Concepts and tools 10
Figure 4 : Examples of lines of evidence (EA, 2010)
To interpret “lines of evidences” EA presents “weight of evidence” approaches that are taken
to assess multiple information sources used for risk assessment. The approaches are
reproduced below with comment on their applicability to remediation. This is an evolving area
of environmental decision-making, and the aim should be to apply as objective a method as
possible to integrate individual lines of evidence. In many cases this will rely on sound, and
defensible, professional judgement. A key to integration will be to maximise the use of
information collected before or in preparation of the remediation strategy to understand how
best individual lines of evidence can be linked.
As we shall see, best professional judgment and quantification are similar concepts to these
which are developed in the USA. But LTMO seems more complete (more detailed) and many
applications are available today (see annex 1).
Long Term Monitoring Optimization (LTMO) – Concepts and tools 11
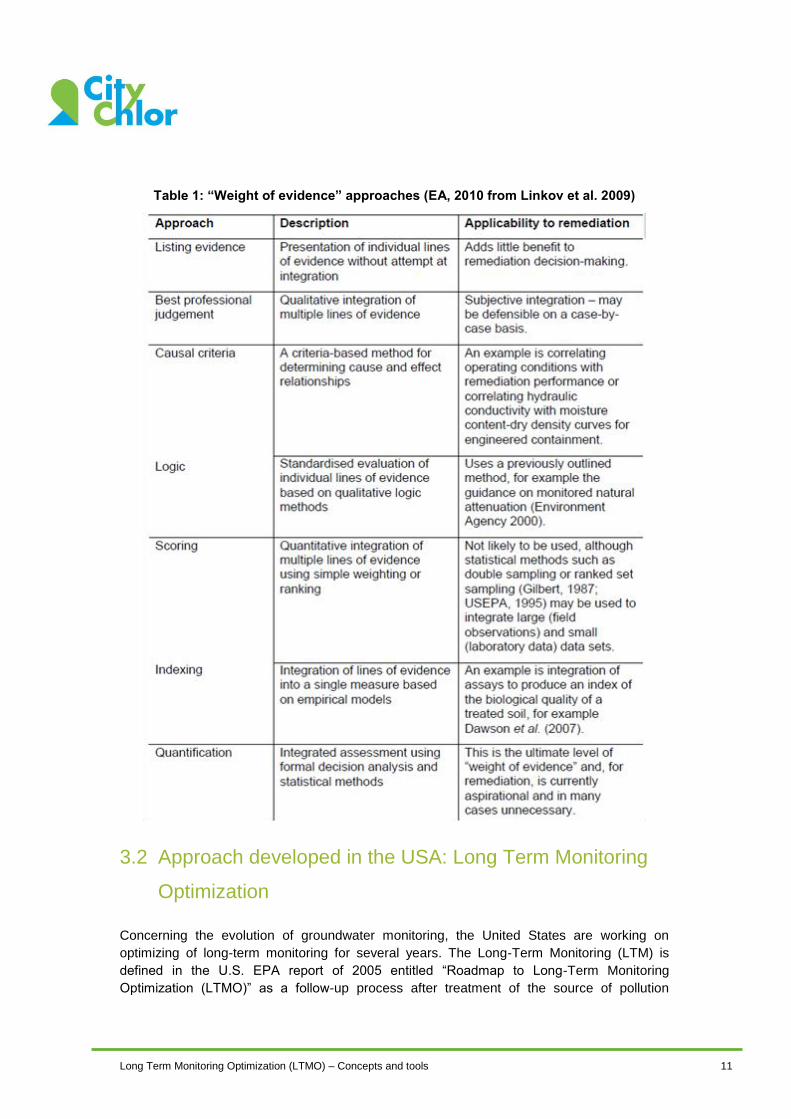
Table 1: “Weight of evidence” approaches (EA, 2010 from Linkov et al. 2009)
3.2 Approach developed in the USA: Long Term Monitoring
Optimization
Concerning the evolution of groundwater monitoring, the United States are working on
optimizing of long-term monitoring for several years. The Long-Term Monitoring (LTM) is
defined in the U.S. EPA report of 2005 entitled “Roadmap to Long-Term Monitoring
Optimization (LTMO)” as a follow-up process after treatment of the source of pollution

Long Term Monitoring Optimization (LTMO) – Concepts and tools 12
(assets, liabilities or confinement) and used to assess to what extent the objectives of
remediation are achieved over time (EPA, 2005).
Optimization techniques have been applied to the design of monitoring networks for site
characterization, detection monitoring and compliance monitoring (Figure 5) but they are
most often applied to LTM programs after remediation (if they provide well-defined spatial
coverage of the area they are monitoring and have been implemented for a period of time
sufficient to generate a relatively comprehensive monitoring history).
Figure 5: Applications of an optimization approach (LTMO) in USA
Work is still on-going but according to the U.S. EPA there are many ways to complete this
process and various guides, documents, tools are available and have been successfully
applied on sites.
Many references are given including case studies. (annex 1).
7 Steps to optimize a long-term groundwater monitoring are defined as follows (EPA, 2005;
Figure 6). We will detail LTMO in the next section.

Long Term Monitoring Optimization (LTMO) – Concepts and tools 13
Figure 6 : 7 Steps to optimize a long-term monitoring (EPA, 2005)
The time interval between periodic LTMO evaluations will vary depending upon site conditions; typically,
programs should be evaluated at least every 2
to 5 years
Long Term Monitoring Optimization (LTMO) – Concepts and tools 14
4 Summary of LTMO concepts and
tools
LTMO offers an opportunity to improve effectiveness of the LTM by assuring that monitoring
achieves its objectives with an appropriate level of effort (eliminate redundancy, reduce
sampling frequency, change sampling method…).
What does LTMO includes?
- data management;
- evaluation of sampling locations;
- evaluation of sampling frequency;
- evaluation of sampling methods;
- evaluation of analytical program.
This approach can result in increase or decrease in effort, depending on site conditions and
objectives. This should involve site manager, all stakeholders and population depending on
the issues.
Two types of evaluation can be used:
- qualitative evaluation: using technical expertise, professional judgment;
- quantitative evaluation: temporal and spatial analysis, using statistical, numerical
analysis.
According to the previous works there is no definitively right way to conduct a LTMO,
because various guidance documents, tools, standardized methods and approaches exists
and have been applied successfully (annex 1).
4.1 Qualitative evaluation – Best professional judgment
Qualitative aspects include especially a review of the site conceptual model, hydrogeology
and contaminant distribution, sampling and analytical methods, data management and
regulatory framework.
Table 2 presents priority and useful information, potential data sources and the associated
purpose of the data required to conduct a LTMO.
Typical factors considered in developing recommendations are given in Table 3.
Remark and recommendation (section 6):
In order to carry out a first test concerning a possible evolution of the monitoring program, the
following requirements should be met (in porous media):
- the monitoring network should be composed of at least 5 wells;
- at least 2 sampling campaigns should be carried out per year;
- at least 4 years of monitoring should be available.

Long Term Monitoring Optimization (LTMO) – Concepts and tools 15
Table 2: Data needed checklist (EPA, 2005)
RCRA: Resource Conservation and Recovery Act
ROD: Record of Decision
CSM: Conceptual Site Model
Long Term Monitoring Optimization (LTMO) – Concepts and tools 16
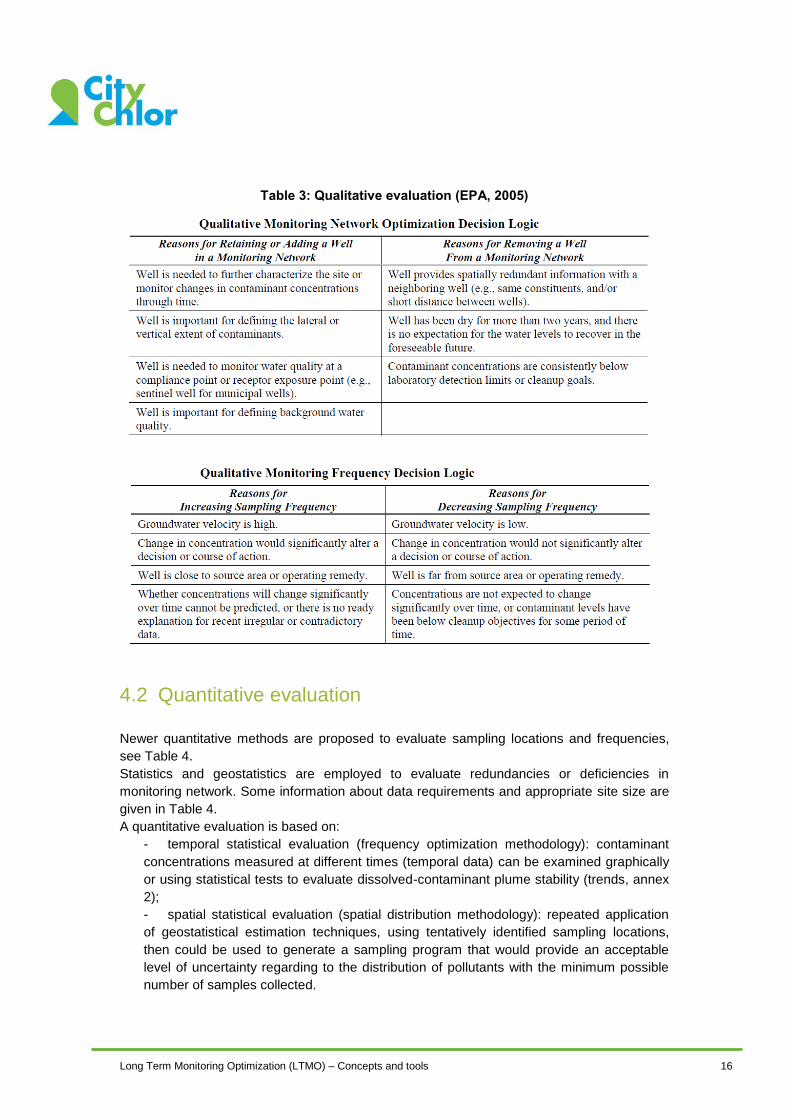
Table 3: Qualitative evaluation (EPA, 2005)
4.2 Quantitative evaluation
Newer quantitative methods are proposed to evaluate sampling locations and frequencies,
see Table 4.
Statistics and geostatistics are employed to evaluate redundancies or deficiencies in
monitoring network. Some information about data requirements and appropriate site size are
given in Table 4.
A quantitative evaluation is based on:
- temporal statistical evaluation (frequency optimization methodology): contaminant
concentrations measured at different times (temporal data) can be examined graphically
or using statistical tests to evaluate dissolved-contaminant plume stability (trends, annex
2);
- spatial statistical evaluation (spatial distribution methodology): repeated application
of geostatistical estimation techniques, using tentatively identified sampling locations,
then could be used to generate a sampling program that would provide an acceptable
level of uncertainty regarding to the distribution of pollutants with the minimum possible
number of samples collected.

Long Term Monitoring Optimization (LTMO) – Concepts and tools 17
Table 4: Quantitative evaluation - LTMO tools and approaches methodology and data requirements (EPA, 2005)
LTMO approaches offer an opportunity to improve the effectiveness of the LTM in place and
may also reduce costs of monitoring (Table 5).
Table 5: Costs of monitoring / optimized sites
Site Original sample frequency (events/yr)
Optimized sampling frequency (percent
reduction) (cost reduction/yr)
Fort Lewis 180 113 – 110 (37 – 39 %)
($ 34 600 – $ 36 500)
Mc Clellan 34 31.5 – 17 (7 – 50 %)
($ 300 – $ 2 550)
Long Prairie 51 36 – 24 (30 – 53 %)
($ 4 000 – $ 6 700)

Long Term Monitoring Optimization (LTMO) – Concepts and tools 18
5 Methods tests
Following the study previously carried out by INERIS in 2009, data was collected on 8 French
sites (Figure 7), with groundwater pollution by organic and inorganic substances and a
monitoring network. All sites were monitored for about 10 years at the beginning of our study
and the aquifers were of sedimentary rock (porous media). Several LTMO methods were
tested on 4 sites particularly in different conditions in order to provide feedback and
recommendations.
Figure 7 : Illustration of the range of networks (piezometers and sampling campaigns) for 8 sites used for tests
All results are not presented here but the site circled in red in Figure 7 is presented below
because it corresponds to a typical configuration in urban area, with less than ten monitoring
wells and few substances sampled twice a year (hydrocarbon pollution with monitoring of
tracers or global settings). This example does not cover chlorinated hydrocarbons but it is the
most representative to highlight the qualitative and quantitative approaches and to provide
feedback in order to give recommendations on LTMO.
As shown in the figure below two tests were conducted on this site and the main information
are presented.

Long Term Monitoring Optimization (LTMO) – Concepts and tools 19
Figure 8 : Tests conducted by INERIS on this site
A first test was performed by coupling the results of the qualitative assessment with those of
the statistical and geostatitical tools (Mann-Kendall and Delaunay triangulation).
Concerning Mann-Kendall the recommendations are made via a decision tree used with the
tool Parsons 3-Tiered.
A second test consisted in using the tool MAROS and following its recommendations without
conducting a qualitative evaluation before (the software provides the final recommendations
to be made to the network).
Test 1 is detailed below, results are compared with test 2.
5.1 Brief overview of the data available and evaluations
5.1.1 Site background information
The site was an in-service industry producing lubricants. These activities started in the 80s.
The hydrogeological context is mainly sedimentary with chalk groundwater.
Groundwater quality monitoring began in 1997 and the last measurement campaign
considered in this work was conducted in the first semester of 2012.
8 wells (Figure 9) are or have been part of the groundwater quality monitoring network
(chemical and piezometric measurements). Pz 4, Pz 5 and Pz 6 are not used for sampling
(piezometric measures).

Long Term Monitoring Optimization (LTMO) – Concepts and tools 20
Figure 9 : Pilot site (8 wells for sampling)
The piezometric level varied from 6 to 9 meters deep depending on the season. The direction
of flow not varies.
Substances measured are Benzene (Figure 10), Toluene, Xylenes (BTX), naphthalene and
total petroleum hydrocarbons (TPH).

Long Term Monitoring Optimization (LTMO) – Concepts and tools 21
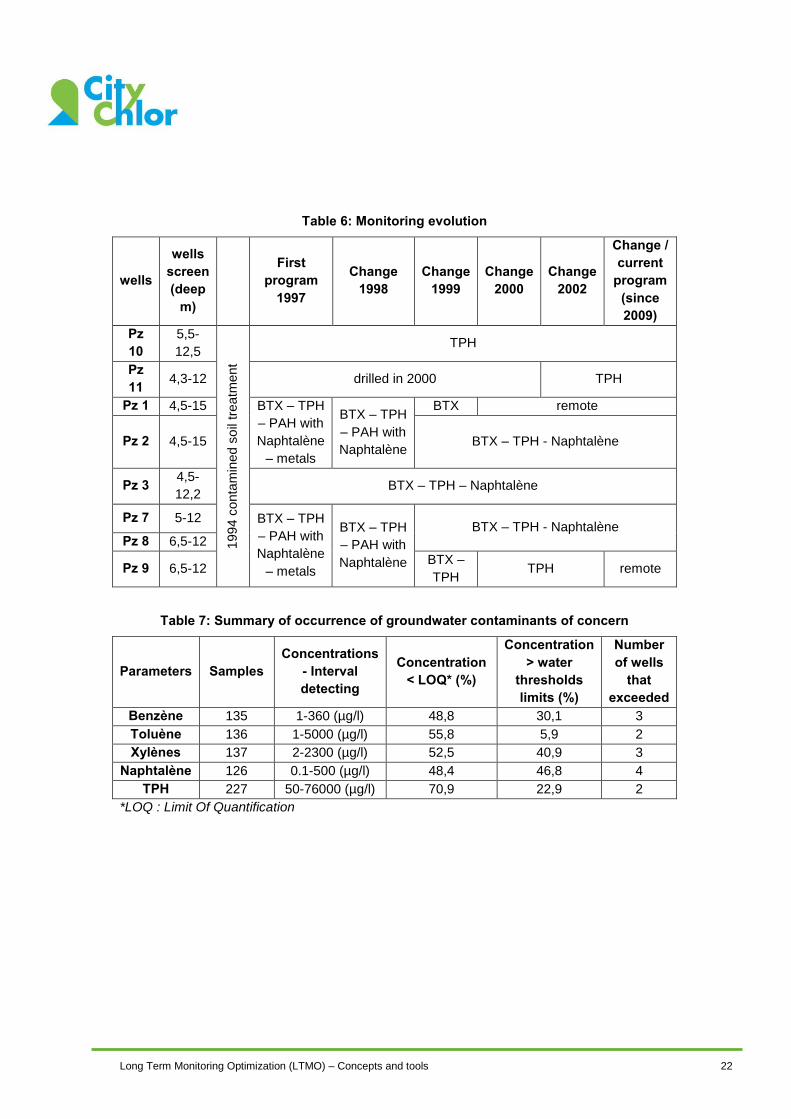
Table 6 summarizes evolutions of the monitoring program of groundwater quality. Table 7
give information about quality data for substances studied (number of samples, detection
intervals...).
It appears that the xylenes and naphthalene are substances that are regularly observed at
concentrations above the threshold values (40.9 and 46.8% respectively). Total
hydrocarbons are below the detection limit in almost 71% of the samples analyzed since
1997 and all wells in the network but detected in two piezometers (Pz 2 and Pz 3) only
(plume). Overall the site only Pz 2 and Pz 3 detect pollution, the rest of the piezometer
network detect only very rarely concentrations above the detection limits of substances.
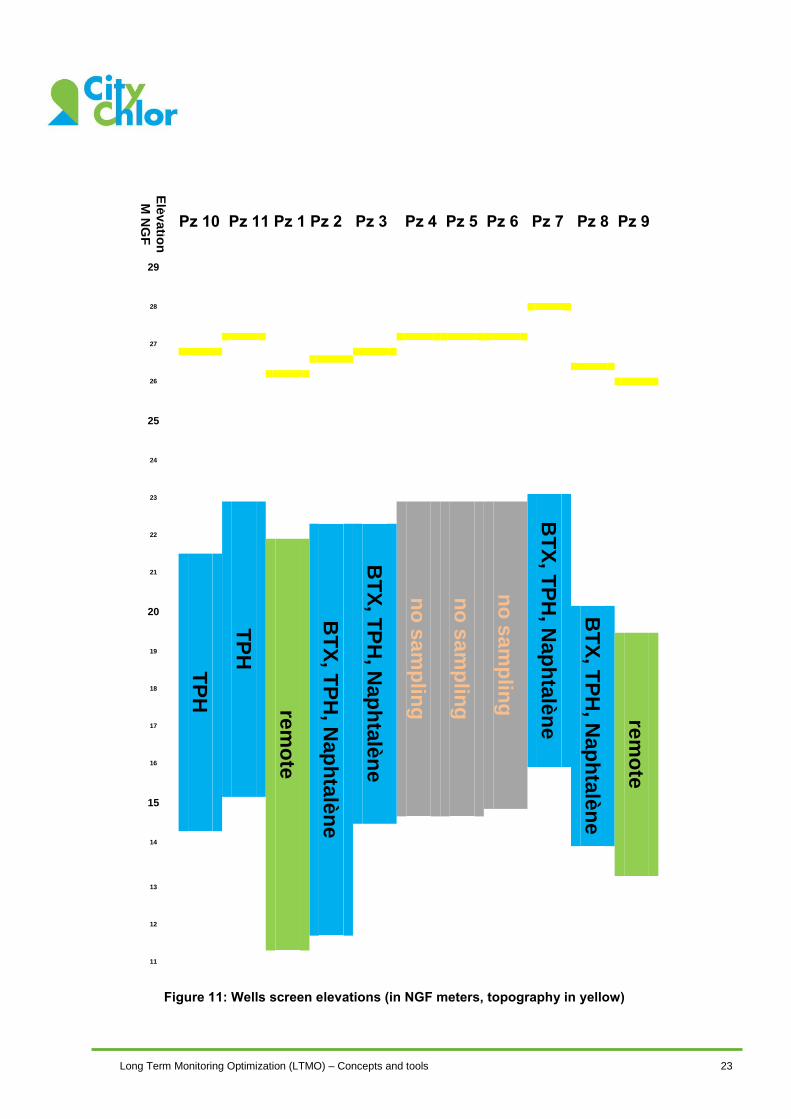
Screen intervals are depicted graphically on Figure 11; the portions that are monitored by
wells are not consistent across the site.
Figure 10 : Benzene results (1997-2012)
Long Term Monitoring Optimization (LTMO) – Concepts and tools 22
Table 6: Monitoring evolution
wells
wells screen (deep
m)
First
program 1997
Change 1998
Change 1999
Change 2000
Change 2002
Change / current
program (since 2009)
Pz 10
5,5-
12,5
1994
conta
min
ed s
oil
treatm
ent
TPH
Pz 11 4,3-12 drilled in 2000 TPH
Pz 1 4,5-15 BTX – TPH
– PAH with
Naphtalène
– metals
BTX – TPH
– PAH with
Naphtalène
BTX remote
Pz 2 4,5-15 BTX – TPH - Naphtalène
Pz 3 4,5-
12,2 BTX – TPH – Naphtalène
Pz 7 5-12 BTX – TPH
– PAH with
Naphtalène
– metals
BTX – TPH
– PAH with
Naphtalène
BTX – TPH - Naphtalène Pz 8 6,5-12
Pz 9 6,5-12 BTX –
TPH TPH remote
Table 7: Summary of occurrence of groundwater contaminants of concern
Parameters Samples Concentrations
- Interval detecting
Concentration < LOQ* (%)
Concentration > water
thresholds limits (%)
Number of wells
that exceeded
Benzène 135 1-360 (µg/l) 48,8 30,1 3
Toluène 136 1-5000 (µg/l) 55,8 5,9 2
Xylènes 137 2-2300 (µg/l) 52,5 40,9 3
Naphtalène 126 0.1-500 (µg/l) 48,4 46,8 4
TPH 227 50-76000 (µg/l) 70,9 22,9 2
*LOQ : Limit Of Quantification
Long Term Monitoring Optimization (LTMO) – Concepts and tools 23
Elé
va
tion
M N
GF
I1
I2
Pz 1
Pz 2
Pz 3
Pz 4
Pz 5
Pz 6
Pz 7
Pz 8
Pz 9
29
28
27
26
25
24
23
BT
X, T
PH
, Nap
hta
lèn
e
TP
H
no
sa
mp
ling
no
sa
mp
ling
no
sa
mp
ling
BT
X, T
PH
, Nap
hta
lèn
e
BT
X, T
PH
, Nap
hta
lèn
e
22
rem
ote
TP
H
21
20 BT
X, T
PH
, Nap
hta
lèn
e
rem
ote
19
18
17
16
15
14
13
12
11
Figure 11: Wells screen elevations (in NGF meters, topography in yellow)
Pz 10 Pz 11 Pz 1 Pz 2 Pz 3 Pz 4 Pz 5 Pz 6 Pz 7 Pz 8 Pz 9

Long Term Monitoring Optimization (LTMO) – Concepts and tools 24
5.1.2 Qualitative evaluation
Typical factors considered in developing recommendations for example to retain a well in, or
remove a well from, or all others changes are summarized in Table 3.
Based on the data presented above and others not presented here, the main conclusions of
this evaluation are:
- hydrodynamic conditions of the site have not changed over time (flow direction and
gradient similar, no occurrence around the site seems to have changed the
conditions);
- wells are suitable for monitoring LNAPL (screen levels);
- monitoring TPH on Pz 10 and Pz 11 can be stopped (the results do not show
concentrations above the LOQ TPH since monitoring began), replaced by
naphtalene, BTX;
- monitoring on Pz 2, Pz 3 and Pz 8 can’t be modified (measured concentrations for
benzene notably are still above the concentrations in upstream Pz 7 and water
thresholds limits);
- Pz 4 can be sampling to get more information on the site (lateral);
- monitoring electron acceptors and electron donors may give information on
biodegradation process (natural attenuation).
This recommendations are based on available data regarding current (and assumed future)
site conditions. Changing site conditions (e.g., periods of drought or excessive rainfall or
changes in hydraulic stresses) could affect contaminant fate and transport. Therefore, the
LTM program should be reviewed if hydraulic conditions change significantly (with new
pumping well for example), and revised as necessary to adequately track changes in the
magnitude and extent of pollution in environmental media over time.
5.1.3 Quantitative evaluation
Temporal analysis
Visual identification of trends in plotted data may be a subjective approach, particularly if the
concentration data do not exhibit a uniform trend, but are variable through time (annex 2).
The possibility of arriving at incorrect conclusions can be reduced by examining temporal
trends in chemical concentrations using various statistical procedures, including regression
analyses and the Mann-Kendall test for trends.
The Mann-Kendall nonparametric test is well-suited for evaluation of environmental data
because the sample size can be small (as few as four data points), no assumptions are made
regarding the underlying statistical distribution of the data, and the test can be adapted to
account for seasonal variations in the data.
The Mann-Kendall test statistic can be calculated at a specified level of confidence to
evaluate whether a statistically significant temporal trend is exhibited by contaminant
concentrations detected through time in samples from an individual well. A negative slope
(indicating decreasing contaminant concentrations through time) or a positive slope
(increasing concentrations through time) provides statistical confirmation of temporal trends
that may have been identified visually from plotted data. In this analysis, a 90% confidence
level is used to define a statistically significant trend.

Long Term Monitoring Optimization (LTMO) – Concepts and tools 25
This statistical tool can be useful for example in the following cases:
- a trend of increasing contaminant concentrations in groundwater at a location
between a contaminant source and a potential receptor exposure point may
represent information critical in evaluating whether contaminants are migrating to the
exposure point, thereby completing an exposure pathway.
- a trend of decreasing contaminant concentrations at the same location may be useful
in evaluating decreases in the area extent of dissolved contaminants, but does not
represent information that is critical to the protection of a potential receptor.
- a trend of decreasing contaminant concentrations in groundwater near a contaminant
source may represent important information regarding the progress of remediation
near, and downgradient from, the source.
By contrast, the absence of a statistically significant (as defined by the Mann-Kendall test
with a 90% confidence level) temporal trend in contaminant concentrations at a particular
location within or downgradient from a plume indicates that virtually no additional information
can be obtained by frequent monitoring of groundwater at that location, in that the results of
continued monitoring through time are likely to fall within the historic range of concentrations
that have already been detected. Continued monitoring at locations where no temporal trend
in contaminant concentrations is present serves merely to confirm the results of previous
monitoring activities at that location.
The temporal trends and relative location of wells can be weighed to determine if a well
should be retained, excluded, or continued in the program with reduced sampling. Figure 12
presents a flowchart demonstrating the method for using trend results to draw these
conclusions.
Table 8 give results of this analysis. These results confirm qualitative evaluation. Abandoning
Pz 9 is also validated by this approach. However, Pz 1 should be monitoring, this conclusion
is due to the small amount of data available for this well (3 years of monitoring).
Statistical results must be read taking into account other factors that may affect the
recommendations.

Long Term Monitoring Optimization (LTMO) – Concepts and tools 26
Figure 12 : Temporal trend decision - Flowchart for long-term monitoring (Wash King Laundry Superfund Site, annex 1)

Long Term Monitoring Optimization (LTMO) – Concepts and tools 27
Table 8: Temporal analysis results (quantitative evaluation)
D: Decreasing, NT: No Trend, S: Stable, I: Increasing
Spatial analysis
Spatial statistical techniques can also be applied to the design and evaluation of groundwater
monitoring programs to assess the quality of information generated during monitoring and to
evaluate monitoring networks. This analysis may eliminate “redundant” wells or add wells in
areas with high concentration uncertainty.
The Delaunay method is developed based on Delaunay triangulation, which is the
triangulation of a point set with the property that no point in the point set falls in the interior of
the circumcircle of any triangle in the triangulation. All nodes (potential well locations) are
joined by the blue lines, which form the edges of Delaunay triangles. The yellow lines form
many polygons called Thiessen polygons or Voronoi diagrams, which are the dual parts of
Delaunay triangles.
This method is presented in detail in the annexes of the manual software MAROS
(http://www.gsi-net.com/en/software/free-software/maros.html).
wells In current program?
Situation / plume
Contaminants Results
Be
nzèn
e
To
luèn
e
Xylè
ne
s
Na
ph
talè
ne
TP
H
Re
tain
Re
mo
ve
Pz 1 no upstream D NT NT NT NT X
Pz 2 yes plume area S D S I D X
Pz 3 yes plume area NT S NT NT D X
Pz 7 yes upstream S D D S S X
Pz 8 yes downstream D D D D NT X
Pz 9 no downstream S S S NT S X
Pz 10 yes upstream - - - - S X
Pz 11 yes upstream
(lateral) - - - - S X

Long Term Monitoring Optimization (LTMO) – Concepts and tools 28
The application of this method gives the following results for benzene and TPH.
Figure 13 : Spatial analysis results Benzene (quantitative evaluation)
Long Term Monitoring Optimization (LTMO) – Concepts and tools 29
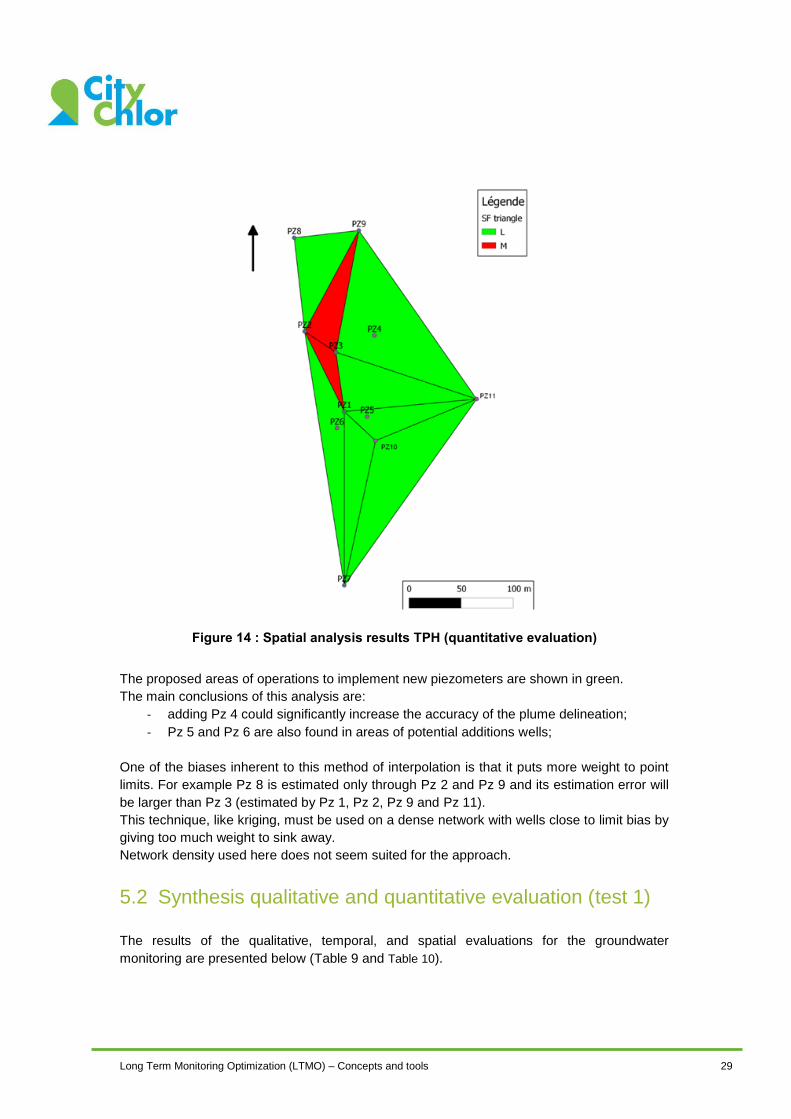
Figure 14 : Spatial analysis results TPH (quantitative evaluation)
The proposed areas of operations to implement new piezometers are shown in green.
The main conclusions of this analysis are:
- adding Pz 4 could significantly increase the accuracy of the plume delineation;
- Pz 5 and Pz 6 are also found in areas of potential additions wells;
One of the biases inherent to this method of interpolation is that it puts more weight to point
limits. For example Pz 8 is estimated only through Pz 2 and Pz 9 and its estimation error will
be larger than Pz 3 (estimated by Pz 1, Pz 2, Pz 9 and Pz 11).
This technique, like kriging, must be used on a dense network with wells close to limit bias by
giving too much weight to sink away.
Network density used here does not seem suited for the approach.
5.2 Synthesis qualitative and quantitative evaluation (test 1)
The results of the qualitative, temporal, and spatial evaluations for the groundwater
monitoring are presented below (Table 9 and Table 10).

Long Term Monitoring Optimization (LTMO) – Concepts and tools 30
They were combined and summarized in accordance with the decision logic shown on Figure
12 and these recommendations:
- each well retained in the monitoring network on the basis of the qualitative
hydrogeologic evaluation was recommended to be retained in the refined monitoring
program;
- those wells recommended for exclusion from the monitoring program on the basis of
all three evaluations, or on the basis of the qualitative and temporal evaluations (with
no recommendation resulting from the spatial evaluation) were recommended for
removal from the monitoring program;
- if a well was recommended for removal based on the qualitative evaluation and
recommended for retention based on the temporal or spatial evaluation, the final
recommendation was based on a case-by-case review of well information;
- if a well was recommended for retention based on the qualitative evaluation and
recommended for removal based on the temporal and spatial evaluation, the well
was recommended to be retained, but the possibility of reducing the sampling
frequency was evaluated based on a case-by-case review of well information
Figure 15 : Combined temporal and spatial analysis - quantitative evaluation (Wash King Laundry Superfund Site, annex 1)

Long Term Monitoring Optimization (LTMO) – Concepts and tools 31
Table 9: Evaluations results – test 1 (qualitative and quantitative)
wells Situation / plume Frequency
Qualitative evaluation Evaluation quantitative
Recommendations (see Figure 15)
Temporal Spatial
Re
mo
ve
Re
tain
Su
bsta
nce
s
Fre
qu
en
cy
Exclu
ded
/
red
uce
d
Re
tain
Re
mo
ve
Re
tain
Re
mo
ve
Re
tain
Frequency
Pz 10 upstream
Every 6
months X replace by
naphtalene,
BTX
No
change X X X
Every 6
months
Pz 11
upstream
(lateral)
Every 6
months X
No
change X X X
Every 6
months
Pz 1 downstream No
sampling - - - - X - - - - -
Pz 2 plume area Every 6
months X No change
No
change X X X
Every 6
months
Pz 3 plume area Every 6
months X No change
No
change X X X
Every 6
months
Pz 4 near plume
area
No
sampling X
add
naphtalene,
BTX
Every
6
months
- - - - X Every 6
months
Pz 5 upstream No
sampling - - - - - - - - - - -
Pz 6 upstream No
sampling - - - - - - - - - - -
Pz 7 upstream Every 6
months X No change
No
change X X X
Every 6
months
Pz 8 downstream Every 6
months X No change
No
change X X X
Every 6
months
Pz 9 downstream No
sampling - - - - X - - - - -
Table 10: Evaluations results – test 1 – Recommendations comments
wells Recommendations comments
Pz 10 Monitoring naphtalene, BTX
Pz 11 Pz 1 -
Pz 2 Plume monitoring – no evolution Pz 3
Pz 4 add Pz 4 with naphtalene, BTX
Pz 5 - Pz 6
Pz 7 upstream monitoring – no evolution
Pz 8 downstream monitoring – no evolution
Pz 9 -
Long Term Monitoring Optimization (LTMO) – Concepts and tools 32
5.3 Comparison between tests results (test 1 and test 2)
Test 1 presented above showeds that under an optimization approach, the qualitative
assessment may be sufficient. Indeed, the qualitative study recommended an increase in
monitoring of BTX and naphthalene parameters (Pz 10 and Pz 11) instead of the parameter
TPH and the addition of Pz 4 to the monitoring network too.
The spatial and temporal analyzes (quantitative approach) dido not provide additional
recommendations to the qualitative assessment: they confirmed those made previously.
Thus, the analyses allowed firstly to validate the hypothesis formulated in terms of trends in
the qualitative evaluation with the use of Mann-Kendall, then it also validated the changes
previously made to the monitoring program including the removal of Pz 9 (stable trends,
without going over the threshold value). Spatial analysis using the Delaunay triangulation did
not provide additional information, but it allowed identifying an area to improve the existing
network (near Pz 4).
The recommendations of test 2, obtained using the software MAROS seemed partially
different. On the one hand, the frequency of monitoring could be reduced to a campaign per
year according to these results. On the other hand, the analysis did not find monitoring points
to remove, even taking into account Pz 1 and Pz 9, the decision to remove these wells was
not justified according MAROS.
The difference between the recommendations made by test 1 and test 2 came from the
decision matrix used in the case of test 2 by MAROS, which is different from decision trees
used for test 1 (from the Parsons 3 – Tiered method).
However, test 2 considered the network as not sufficient for the proper characterization of the
pollution plume. This was consistent with the conclusion of the spatial analysis conducted via
the Delaunay triangulation in test 1 at the end of which an area to add a tracking point is
proposed (near Pz 4).
The advantages of the qualitative assessment are that it considers the specific context of the
site and includes multiple factors, though it depends on the experience of the hydrologist in
charge of the study which can lead to biases in data interpretations. The quantitative
evaluation identifies data gaps and is less likely to be biased. However, to be effective, this
quantitative evaluation requires a certain rigor to acquire and format data, test different tools
and be able to judge the relevance of the results (based on uncertainties).
The results acquired on this site as well as on the others on which the process was carried
out until the end, therefore show that recommendations for changes in monitoring networks
may differ depending on the method used, in particular for the quantitative approach. In both
cases, a qualitative analysis is necessary to analyze the data and to judge the relevance of
the proposals of the quantitative analysis. The financial aspects were not taken into account
in this study.
Recommendations are given thereafter to carry out such an evolution process.

Long Term Monitoring Optimization (LTMO) – Concepts and tools 33
6 Recommendations in the context of
« Citychlor » (COHV, Urban zone)
Following the tests, the following recommendations can be made. In order to carry out a first
test concerning a possible evolution of the monitoring program, the following requirements
should be met (in porous media):
- the monitoring network should be composed of at least 5 wells;
- at least 2 sampling campaigns should be carried out per year;
- at least 4 years of monitoring should be available.
6.1 Remarks / prerequisites
Notes on prerequisites to any change in monitoring:
- the control of the source (or sources) is essential for any decrease and therefore to
stop monitoring. Moreover, the presence of secondary sources initially untreated can
be especially highlighted during the monitoring by observing peak pollution due to
unusual rainfall events (flushing effect or remobilization of pollutants); these sources
should also be controlled;
- the objectives and criteria must be defined (in relation to regulatory thresholds,
geochemical background / local environmental control, and other criteria for
acceptability on the basis of a cost / benefit analysis).
Notes on data and information necessary to consider the development of monitoring
- the quantity but also the quality of the monitoring data is essential especially when it
comes to change and stop monitoring;
- enough data on concentrations allow the use of a statistical tool to identify trends.
Trend analysis should be conducted over several seasonal cycles and focused on
"normal" conditions or reflect "abnormal"events (eg heavy rainfall may cause
remobilization of pollutants);
- the hydrogeological context (porous media, fractured / fissured, karst) must be
sufficiently known in particular to evaluate the transfer time of a source area to an
observation point, a stake;
- the behavior of pollutants is very variable depending on the substance considered,
mobility (dissolved, particulate, gas), the retention of substances (eg PAHs sorption
on organic matter) or (bio) degradation in other substances more toxic ( ex.
trichlorethylene with the appearance of vinyl chloride). These phenomena are
studied;
- in the case of pollutants that (bio) degrade the byproducts must be followed as well
as the pollutants identified in the source zone.
Notes relating to the sustainability of the situation:
- the control of the site use and memory are important to sustain the situation
observed over several years and avoid any modification of hydrogeological
conditions and geochemical due to anthropic action. Indeed, a change in flow (rate,

Long Term Monitoring Optimization (LTMO) – Concepts and tools 34
direction) may occur due to the establishment of a pumping whose radius of
influence disturbs the studied area and affects the transfer of pollutants;
- hydrogeological and geochemical conditions must be stable and sustainable over
time before considering stopping monitoring.
6.2 Adaptation of the qualitative approach
As indicated, the qualitative approach seems at first most relevant to have a framed and
reproducible method. Compared to information obtained from the method, INERIS has made
adaptations and especially regarding the questions to be asked to consider various aspects,
such as natural attenuation with monitoring the introduction of donor and acceptor electron,
or the taking into account of the tides.
The following tables summarize this information.
Table 11 : Evolution related to monitoring points
Reta
in
Groundwater well is used to monitor and improve the understanding of changes in
concentrations observed over time
Groundwater well is important to define the extent of the plume
Groundwater well is necessary to monitor the water quality at a potential stake
Groundwater well can monitoring groundwater underlying to see its quality
Groundwater well allows us to characterize relations between groundwater / river and /
or tidal
Groundwater well is necessary to define the quality of groundwater upstream of polluted
zone. Upstream point should be integrated into all campaigns as the first criterion for
assessing an impact
Rem
ove
Groundwater well provides redundant information with another one near this one for
several campaigns (minimum 4 years)
Groundwater well is dry and the situation is unlikely to change in the coming years. Rely
on regional piezometric or constructive conditions (drawdown, civil engineering) to
assess the sustainability of the situation
The concentrations of monitored parameters arebelow the predefined threshold values
or detection limits of the laboratory for several campaigns (minimum 4 years). Rely on
regional piezometric or constructive conditions (drawdown, civil engineering) to assess
the sustainability of the situation
Groundwater well is not adapted to the requirements of the monitoring. Not deep
enough, screened interval is not positioned to monitor NAPL ...
Cre
ation
Hydrodynamic conditions and flow direction changed due to natural or anthropogenic
reason
Result analysis on several campaigns shows that pollution will spread outside the area
covered by the network
Malfunction is observed. Vandalism, clogged srceened interval, unintentional
destruction ...
One or more control points are not suitable for monitoring requirements.Not deep
enough, screened interval is not positioned to monitor NAPL ...

Long Term Monitoring Optimization (LTMO) – Concepts and tools 35
Table 12 : Evolution related to number of monitoring parameters / substances
Incre
ase
A secondary pollution is highlighted and further diagnosis is carried out
Monitoring of degradation products was not considered when defining initial network
In the case of in situ remediation by injection, monitoring of injected product is carried
out
Monitoring of electron acceptors and donors is relevant in assessing natural attenuation
Decre
ase
The concentrations did not change significantly, or the concentrations are below the
predefined threshold values for several years (minimum 4 years). Rely on regional
piezometric or constructive conditions (drawdown, civil engineering) to assess the
sustainability of the situation
The remediation of a source may cause the disappearance, not appearance or
stabilization of some compounds. Rely on regional piezometric or constructive
conditions (drawdown, civil engineering) to assess the sustainability of the situation
Redundancy between information. Behavior of similar pollutants families , analysis of
specific substances, semi-volatile screening ...
Table 13 : Evolution related to monitoring frequency
Incre
ase
Hydrodynamic conditions and flow direction changed due to natural or anthropogenic
reason. Increase sustainable over time of flow velocity associated with the activation of
an industrial pumping
A change of uses within the area of influence of the site. A new stake is to be
considered: catchment that provide drinking water or residential with private wells
downstream
Groundwater well is located near the source area where rehabilitation works will be
undertaken
Significant changes or contradictory (concentrations and / or piezometric measures) are
observed and can not be explained
Decre
ase
Hydrodynamic conditions and flow direction changed due to natural or anthropogenic
reason. Decrease sustainable over time of flow velocity associated with the activation of
an industrial pumping
A change of uses within the area of influence of the site. An existing stake is no longer
to be considered: catchment that provide drinking water is abandoned in a sustainable
way
Piezometer is far from the source area or upstream, source has been treated, treatment
whose efficiency is followed by other wells
Concentrations did not change significantly, or they are below the predefined threshold
values for several years (minimum 4 years). Rely on regional piezometric or
constructive conditions (drawdown, civil engineering) to assess the sustainability of the
situation

Long Term Monitoring Optimization (LTMO) – Concepts and tools 36
7 Conclusion and further work
The works carried out since 2009 by INERIS and pursued here indicate the existence of two
methods for the development and the optimization of groundwater monitoring on polluted
site: the verification (UK-EA) and the Long Term Monitoring Optimization (US-EPA). The best
professional judgment and the quantification approach are similar concepts to these two
methods but the LTMO seems more complete (more detailed) and many applications are
available today.
The LTMO consists of two evaluations: a qualitative and a quantitative approach. Qualitative
aspects include especially a review of the site conceptual model, hydrogeology and
contaminant distribution, sampling and analytical methods, data management and regulatory
framework. Typical factors considered in developing recommendations are notably some
questions to ask itself. Quantitative analyses include statistics and geostatistics and are
employed to evaluate redundancies or deficiencies in monitoring network.
The advantages of the qualitative assessment are that it consideres the specific context of
the site and includes multiple factors, though it depends on the experience of the hydrologist
in charge of the study and that can lead to biases in the interpretations of data. The
quantitative evaluation identifies data gaps and is less likely to be biased However, to be
effective, this quantitative evaluation requires a certain rigor to acquire and format data, test
different tools and be able to judge the relevance of the results (based on uncertainties).
The results acquired on four sites on which the process was carried out until the end by
INERIS, one example is presented here, show that recommendations for changes in
surveillance networks may differ depending on the method used, in particular with the
quantitative approach. A qualitative approach is always necessary to analyze the data and to
judge the relevance of the proposals of the quantitative analysis.
The qualitative approach is of interest to frame the process and provide guidance on the
elements for reflection.
This report presents the first things to consider in the context of the evolution of monitoring:
the minimum size of the network, the prerequisites and some adaptations proposed in the
qualitative approach at this stage.
Indeed, work is continuing to draft a national methodology for specifying the issues in the
context of an assessment of a monitoring (monitoring points and frequency, substances to be
considered in particular).
Whatever the approach it turns out to be a tool for decision support, such as analytical or
numerical modeling, the final stakeholders must make a choice, based on the results but also
the uncertainties associated (must be clearly identified and presented).

Long Term Monitoring Optimization (LTMO) – Concepts and tools 37
8 References
Loaiciga, H.A., R.J. Charbeneau, L.G. Everett, G.E. Fogg, B.F. Hobbs, and S. Rouhani.
Review of ground-water quality monitoring network design. Journal of Hydraulic
Engineering118(1):11-37, 1992.
Reed, P.M., B.S. Minsker, and A.J. Valocchi. Cost-effective long-term groundwater
monitoring design using a genetic algorithm and global mass interpolation. Water Resources
Research 36(12), 2000.
EPA (USA). Roadmap to long-term monitoring optimization. EPA 542-R-05-003, 2005.
Linkov, I., Loney, D., Cormier, S., Satterstrom, F.K. and Bridges, T. Weight-of-evidence
evaluation in environmental assessment: review of qualitative and quantitative approaches.
Sci. Tot. Environ. 407, 5199–520, 2009.
INERIS (F. Quiot). Etat des connaissances et perspectives quant à l’évolution des
programmes de surveillance des eaux souterraines (dans le contexte des installations
classées, des sites pollués ou potentiellement pollués). N° DRC-09-103772-15448A, 2009.
EA (UK). Verification of remediation of land contamination SC030114/R1, 2010.

Long Term Monitoring Optimization (LTMO) – Concepts and tools 38
9 Annexes
Long Term Monitoring Optimization (LTMO) – Concepts and tools 39
Annex 1
LTMO references and case studies
(http://clu-in.org/)

Long Term Monitoring Optimization (LTMO) – Concepts and tools 40
Study (http://clu-in.org)
Roadmap to Long-Term Monitoring Optimization
Demonstration of Two Long-Term Groundwater Monitoring Optimization Approaches
Final Report: Applied Materials Building 1: Long-Term Monitoring Strategy
Final Report: Pilot Region-Based Optimization Program for Fund-Lead Sites, EPA Region III
Final Report: Technical Assistance for the Gilson Road Superfund Site, Nashua, New Hampshire, EPA
Region 1
Final Report: Technical Assistance for the Kearsarge Metallurgical Corporation Superfund Site,
Conway, New Hampshire, EPA Region 1
Final Report: Technical Assistance for the Somersworth Sanitary Landfill Superfund Site, Somersworth,
New Hampshire, EPA Region 1
Groundwater Monitoring Network Optimization, Delatte Metals Superfund Site, Ponchatoula, Louisiana,
Region 6
Groundwater Monitoring Network Optimization, Frontier Hard Chrome Superfund Site, Vancouver,
Washington
Long-Term Groundwater Monitoring Optimization, Clare Water Supply Superfund Site, Permeable
Reactive Barrier and Soil Remedy Areas, Clare, Michigan
Long-Term Groundwater Monitoring Optimization, Clare Water Supply Superfund Site, StageRight
Area, Clare, Michigan
Long-Term Monitoring Network Optimization Evaluation for Operable Unit 2, Bunker Hill Mining and
Metallurgical Complex Superfund Site, Idaho
Long-Term Monitoring Network Optimization Evaluation for Wash King Laundry Superfund Site, Lake
County, Michigan
Long-Term Groundwater Monitoring Optimization, Newark, Muscoy, and Source Operable Units,
Newmark Superfund Sites, San Bernardino, California
Long-Term Groundwater Monitoring Optimization, Taylor Road Landfill Superfund Site, Seffner,
Hillsborough County, Florida

Long Term Monitoring Optimization (LTMO) – Concepts and tools 41
Annex 2
Conceptual representation of temporal trends
and temporal variations in concentrations

Long Term Monitoring Optimization (LTMO) – Concepts and tools 42

Document description
Title: Long Term Monitoring Optimization (LTMO) – Concepts and tools
INERIS reference: DRC-13-102468-03673A Number of Pages: 43 Date of publication: April 11 2013
Contact: Fabrice Quiot ([email protected]) Key words: groundwater, monitoring, optimization