Sustaining Long Term Regional Coordinated Monitoring Programs
Upload
james-pealeCategory
view
10download
0
LONG TERM MONITORING DATA EVALUATION OF BIOAUGMENTATION
DURING ISCR-ENHANCED BIOREMEDIATION OF TCE DNAPL
James G.D. Peale, RGErik I. Bakkom, PE (Maul Foster & Alongi Inc.)
Jeff Roberts, Sandra Dworatzek (SiREM Laboratories)
Josephine Molin(FMC Environmental Solutions)
June 2013

Site Overview Technology Summary Problem Statement Analysis Results Summary Implications
TOPICS
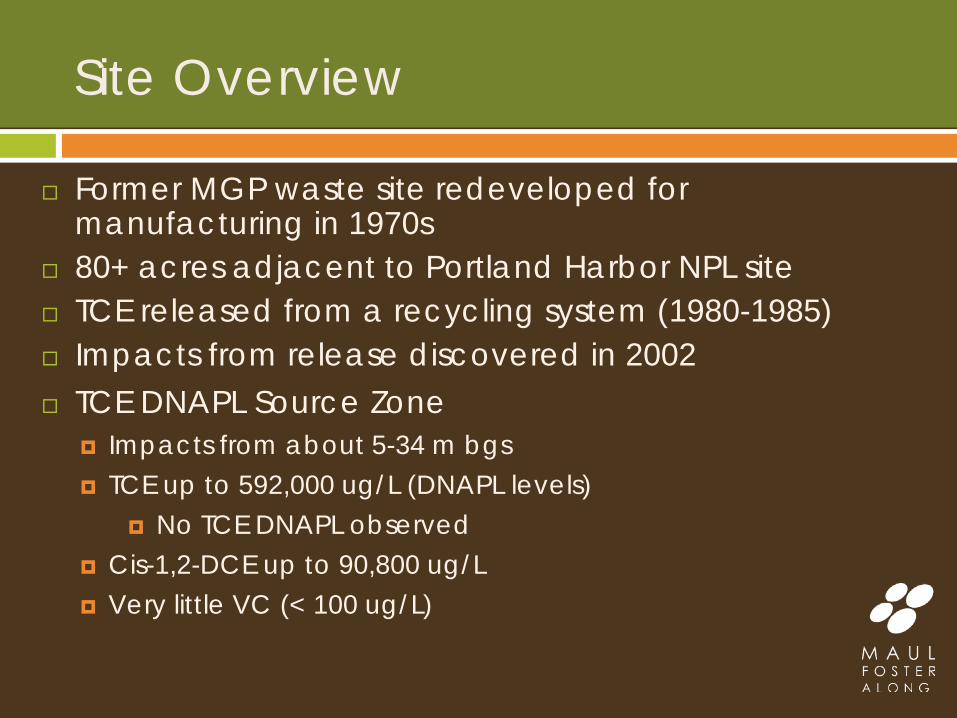
Former MGP waste site redeveloped for manufacturing in 1970s
80+ acres adjacent to Portland Harbor NPL site TCE released from a recycling system (1980-1985) Impacts from release discovered in 2002 TCE DNAPL Source Zone
Impacts from about 5-34 m bgs TCE up to 592,000 ug/L (DNAPL levels)
No TCE DNAPL observed Cis-1,2-DCE up to 90,800 ug/L Very little VC (< 100 ug/L)
Site Overview

Site Overview
Technology Summary
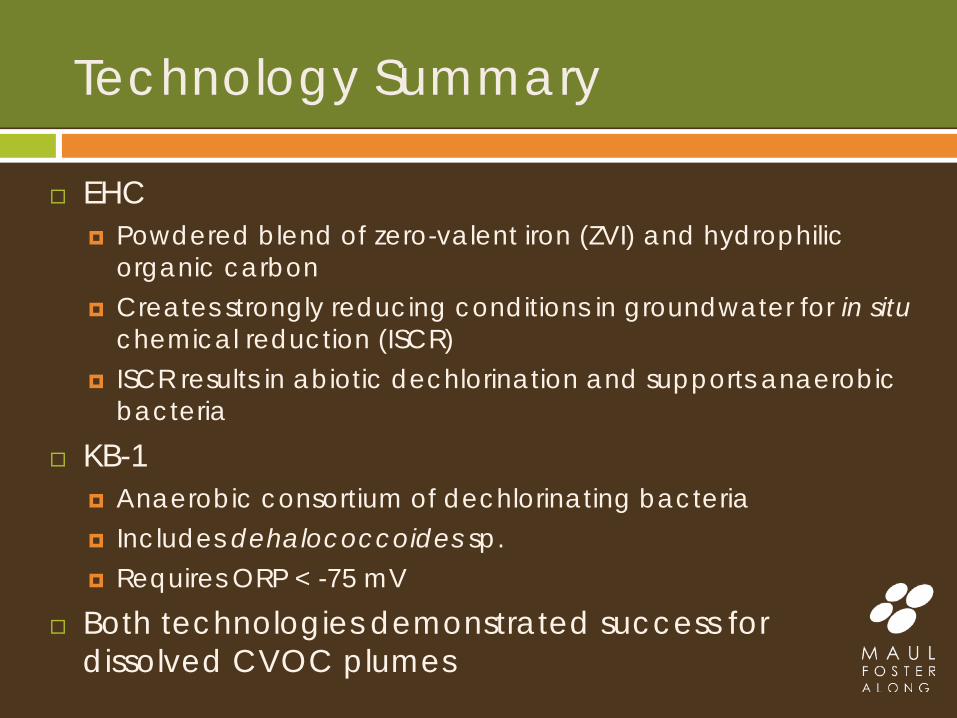
EHC Powdered blend of zero-valent iron (ZVI) and hydrophilic
organic carbon Creates strongly reducing conditions in groundwater for in situ
chemical reduction (ISCR) ISCR results in abiotic dechlorination and supports anaerobic
bacteria
KB-1 Anaerobic consortium of dechlorinating bacteria Includes dehalococcoides sp. Requires ORP < -75 mV
Both technologies demonstrated success for dissolved CVOC plumes
Technology Summary
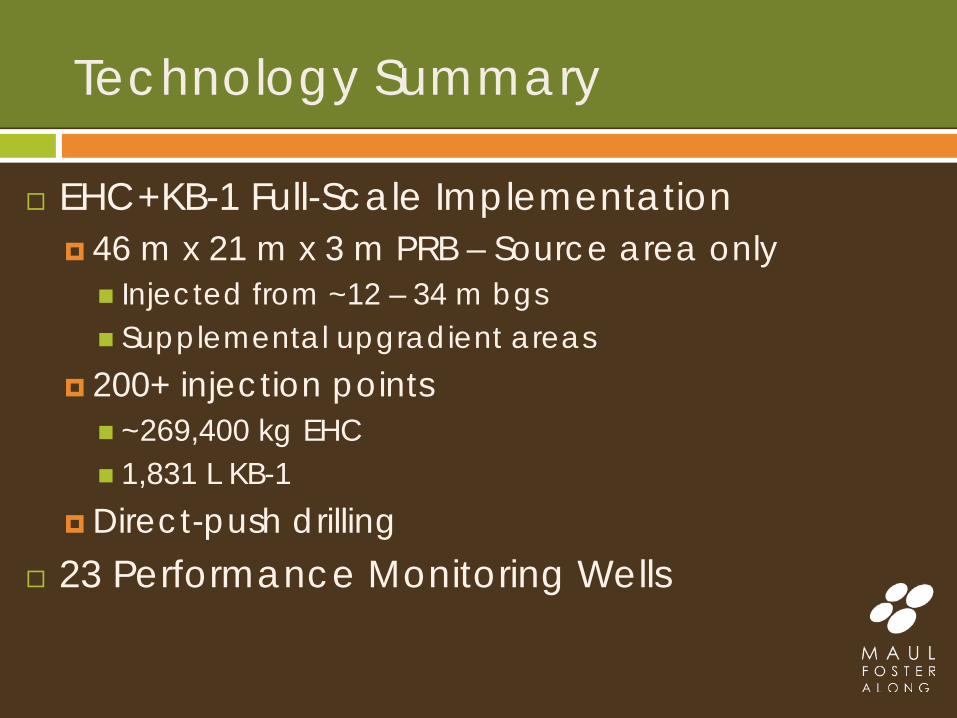
EHC+KB-1 Full-Scale Implementation 46 m x 21 m x 3 m PRB – Source area only Injected from ~12 – 34 m bgs Supplemental upgradient areas
200+ injection points ~269,400 kg EHC 1,831 L KB-1
Direct-push drilling 23 Performance Monitoring Wells

Injection Layout
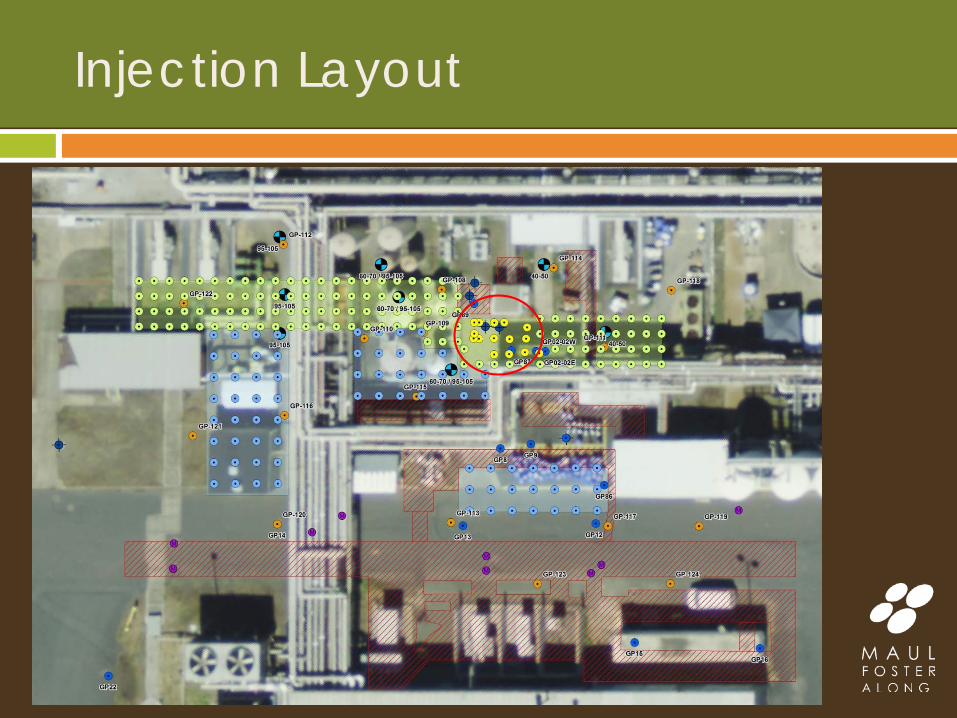
Injection Layout
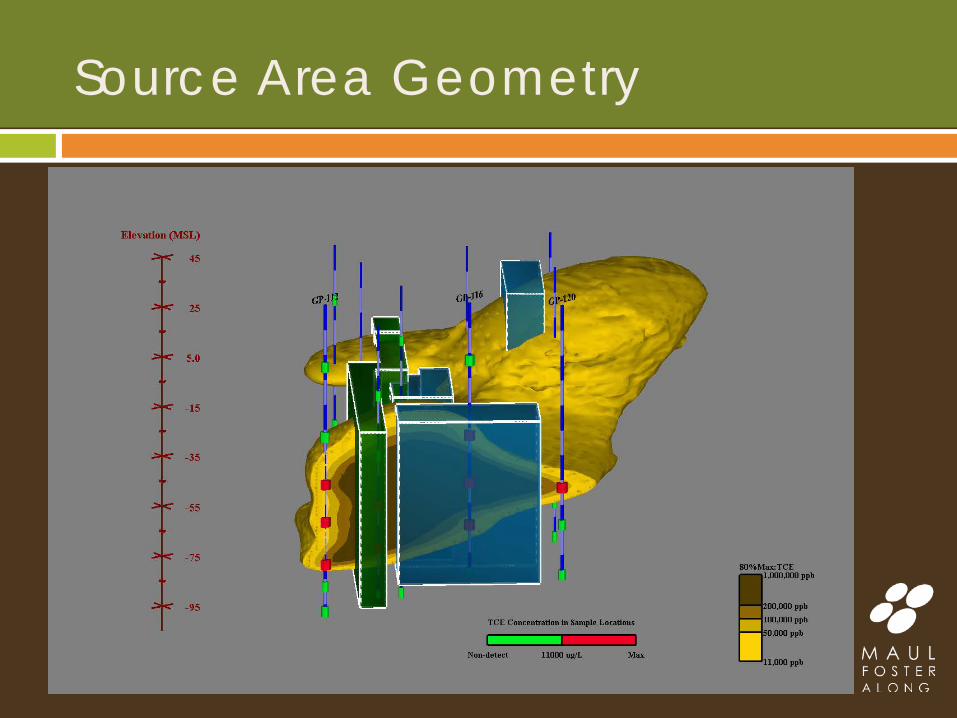
Source Area Geometry
Problem Statement
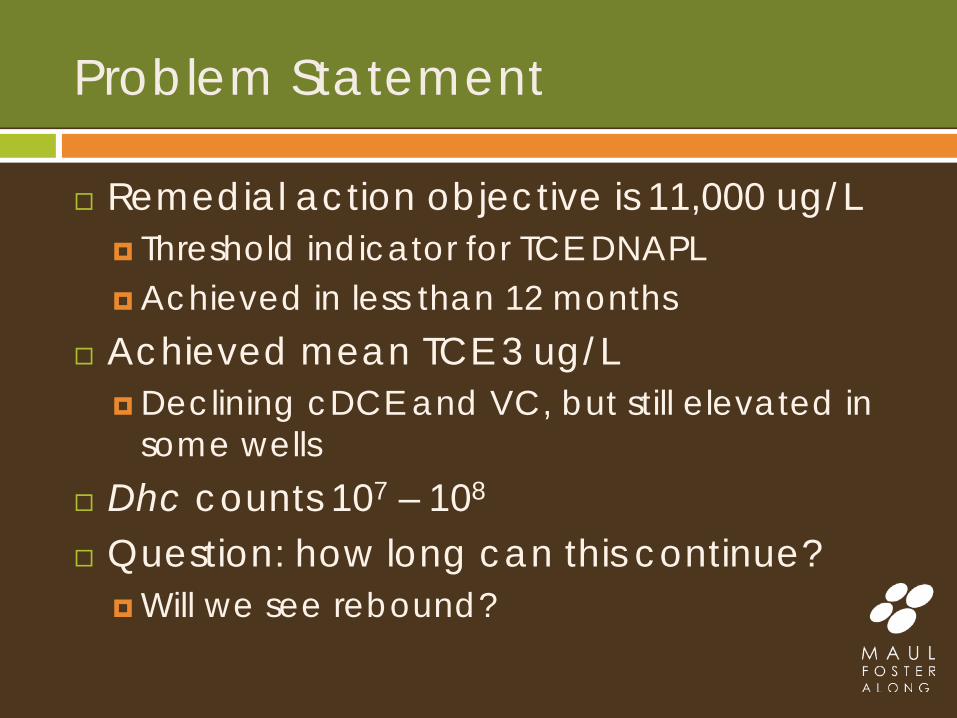
Remedial action objective is 11,000 ug/L Threshold indicator for TCE DNAPL Achieved in less than 12 months
Achieved mean TCE 3 ug/L Declining cDCE and VC, but still elevated in
some wells Dhc counts 107 – 108
Question: how long can this continue? Will we see rebound?
Problem Statement
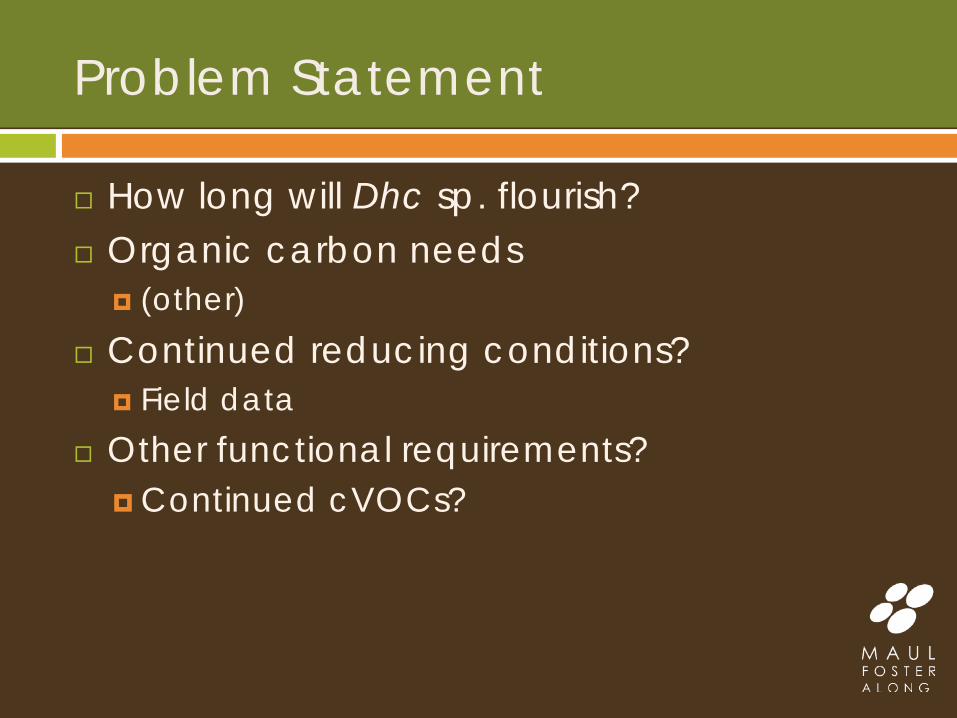
How long will Dhc sp. flourish? Organic carbon needs
(other) Continued reducing conditions?
Field data Other functional requirements?
Continued cVOCs?

Long-Term Data Sets
Pilot Study Data 2006-2008 Shallow and deep wells, within and
downgradient of injection zone Full-scale Data
2009-present 19 wells + pilot study wells
Monitoring program includes: VOCs, TOC, Dhcv, vCRA Field parameters

CVOC Data – kg estimated in source area (EVS)
0
200
400
600
800
1,000
1,200
1,400
1,600
1,800
11/1/2008 5/20/2009 12/6/2009 6/24/2010 1/10/2011 7/29/2011 2/14/2012 9/1/2012 3/20/2013
TCE (kg) cDCE VC Ethene

CVOC Data – normalized (C/C0) to show ethene generation (also VC…uh oh)
0.001
0.01
0.1
1
10
100
Nov-08 May-09 Dec-09 Jun-10 Jan-11 Jul-11 Feb-12 Sep-12 Mar-13
TCE cDCE VC Ethene CVOC

Not to worry - VC Data regression
y = -0.1601x + 6676.3R² = 0.7136
-20
0
20
40
60
80
100
120
140
160
Dec-11 Apr-12 Jul-12 Oct-12 Jan-13 May-13 Aug-13 Nov-13 Mar-14 Jun-14
Estimated VC Mass (kg)
Estimated VC Mass (kg) Linear (Estimated VC Mass (kg))

TOC Data – Mean of Full Scale Data Set (n=23)
194
0
500
1000
1500
2000
2500
3000
3500
Total Organic Carbon (Total and Dissolved)Primary Well Group (mg/L)
TOC (Total) - Mean TOC (Total) - Geometric Mean TOC (Dissolved) - Mean TOC (Dissolved) - Geometric Mean
Background TOC ~ 10 mg/L

Dhc Data – Full Scale Data Set (n=23)
1.E+04
1.E+05
1.E+06
1.E+07
1.E+08
1.E+09
1.E+10
7/1/2009 1/17/2010 8/5/2010 2/21/2011 9/9/2011 3/27/2012 10/13/2012 5/1/2013
DHCFull Scale Well Group (Count)
1/2 of non-detect values used
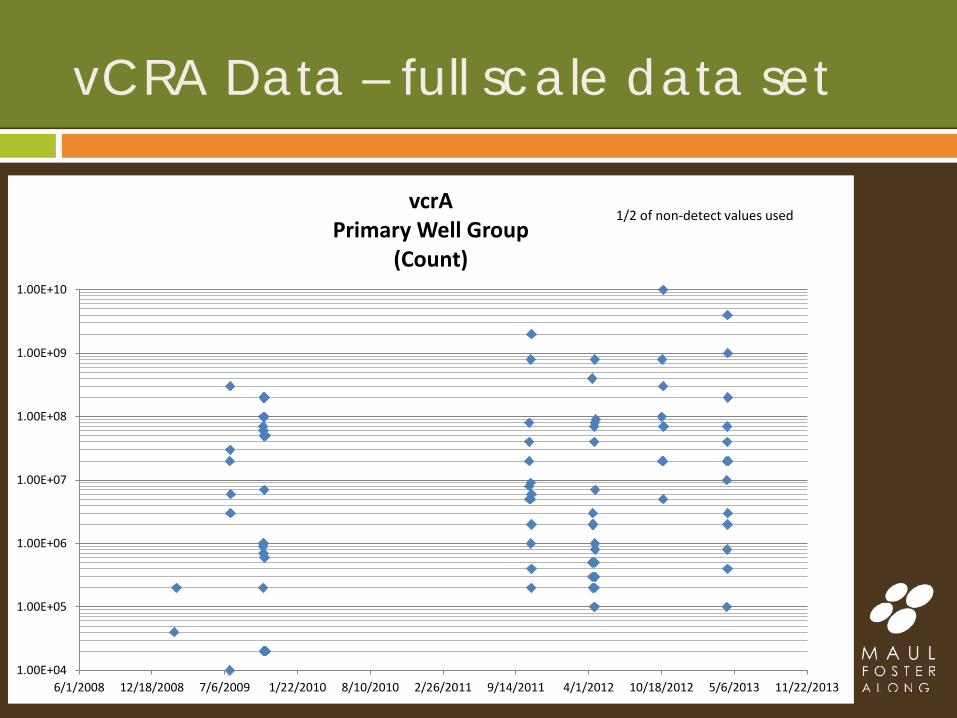
vCRA Data – full scale data set
1.00E+04
1.00E+05
1.00E+06
1.00E+07
1.00E+08
1.00E+09
1.00E+10
6/1/2008 12/18/2008 7/6/2009 1/22/2010 8/10/2010 2/26/2011 9/14/2011 4/1/2012 10/18/2012 5/6/2013 11/22/2013
vcrA Primary Well Group
(Count)
1/2 of non-detect values used

TOC and DHC Data – Long Term (n=4)
1.E+03
1.E+04
1.E+05
1.E+06
1.E+07
1.E+08
1.E+09
0
500
1000
1500
2000
2500
3000
3500
4000
5/1/2006 9/13/2007 1/25/2009 6/9/2010 10/22/2011 3/5/2013
Dhc
(cou
nt)
TOC
(mg/
L)
WS-19 WS-18-101 WS-18-71 DHC

ORP data
-200
-150
-100
-50
0
50
100
150
200
37922 38288 38653 39018 39383 39749 40114 40479 40844 41210
Redox potentialMean of Primary Well Group (n varies) eH - Mean

Analysis
All indicators look good! VOC mass decreasing Sustained elevated TOC levels Sustained negative ORP levels Continued ethene generation Regression predicts VC decrease by 2014
Some indicators look iffy? Would like to see higher Dhc numbers? Others?

Results
Success!
Other considerations DNAPL/CVOC reduction
Other Useful?

Summary (tbd)
Literature range sets boundaries 20 – 750 yrs (latter less useful) Developing data set
Regression provides simple tool for prediction Dual rates observed and should be considered Early consumption followed by equilibrium
Modeling is promising approach Estimates match lower range of regression Can provide conservative (short) predictions to
improve site planning/closure

Implications (tbd)
Micro-scale ZVI is extremely durable Data fit well with other observations
Similarity to presumed P&T timeframes (30 yrs) How do we manage long-term?
Is monitoring required to demonstrate complete exhaustion?
How can we extend confidence of this long-term remedy to support site closure?

Acknowledgements/Questions
Thank you.
SiREM Laboratories FMC Environmental Solutions
Questions?