LONG TERM FLOOD SOLUTIONS · - 5 - Red River Basin Long Term Flood Solutions Executive Summary...
139
- 1 - Final Report to the States of Minnesota Pursuant to Session Laws (2009 Chapter 93) and North Dakota Pursuant to the 2009 North Dakota Chapter 20, House Bill 1046, section 9 RED RIVER BASIN COMMISSION’S LONG TERM FLOOD SOLUTIONS For the Red River Basin Red River Basin Commission MANITOBA Municipalities Hank Enns Kurtiss Krasnesky Doreen Negrich- Lozinski Art Petkau Cities Jeff Browaty R.S. “Bud” Oliver Water Co-op Sam Schellenberg Environmental Colleen Sklar Provincial Muriel Smith Steven Topping Dwight Williamson At-large Herm Martens FIRST NATIONS/ TRIBAL Melissa Hotain MINNESOTA Counties Jerry Dahl Jon Evert Cities Hank Ludtke Betty Pikop Mark Voxland Watersheds John Finney Daniel Wilkens State Paul Aasen Mike Carroll John Jaschke Environmental Henry Van Offelen At-large Derek Crompton SOUTH DAKOTA At-large Roger Navratil NORTH DAKOTA Counties Joe Belford Hetty Walker Cities Dick Johnson Shane Walock Bob Werkhoven Watersheds Tom Fischer Ben Varnson State Dave Glatt Todd Sando Terry Steinwand Environmental Genevieve Thompson At-large Jake Gust EX OFFICIO Federal Elected: Rep. Berg - Tom Nelson Sen. Conrad - Scott Stofferahn Sen. Franken - Val Gravseth Sen. Hoeven - Shane Goettle Sen. Johnson - Sharon Stroschein Sen. Klobuchar - Andy Martin Rep. Peterson - Wally Sparby Sen. Thune - Judy Vrchota M.P. James Bezan M.P. Vic Toews Federal Agencies: Judy DesHarnais Tony Kettler September 2011 Red River Basin Commission
Transcript of LONG TERM FLOOD SOLUTIONS · - 5 - Red River Basin Long Term Flood Solutions Executive Summary...

- 1 -
Final Report to the States of Minnesota Pursuant to Session Laws (2009 Chapter 93) and North Dakota Pursuant to the 2009 North Dakota Chapter 20, House Bill 1046, section 9
RED RIVER BASIN COMMISSION’S
LONG TERM FLOOD SOLUTIONS
For the Red River Basin
Red River Basin Commission MANITOBA Municipalities Hank Enns Kurtiss Krasnesky Doreen Negrich- Lozinski Art Petkau Cities Jeff Browaty R.S. “Bud” Oliver Water Co-op Sam Schellenberg Environmental Colleen Sklar Provincial Muriel Smith Steven Topping Dwight Williamson At-large Herm Martens FIRST NATIONS/ TRIBAL Melissa Hotain
MINNESOTA Counties Jerry Dahl Jon Evert Cities Hank Ludtke Betty Pikop Mark Voxland Watersheds John Finney Daniel Wilkens State Paul Aasen Mike Carroll John Jaschke Environmental Henry Van Offelen At-large Derek Crompton SOUTH DAKOTA At-large Roger Navratil
NORTH DAKOTA Counties Joe Belford Hetty Walker Cities Dick Johnson Shane Walock Bob Werkhoven Watersheds Tom Fischer Ben Varnson State Dave Glatt Todd Sando Terry Steinwand Environmental Genevieve Thompson At-large Jake Gust
EX OFFICIO Federal Elected: Rep. Berg - Tom Nelson Sen. Conrad - Scott Stofferahn Sen. Franken - Val Gravseth Sen. Hoeven - Shane Goettle Sen. Johnson - Sharon Stroschein Sen. Klobuchar - Andy Martin Rep. Peterson - Wally Sparby Sen. Thune - Judy Vrchota M.P. James Bezan M.P. Vic Toews Federal Agencies: Judy DesHarnais Tony Kettler
September 2011 Red River Basin Commission

- 2 -
Long Term Flood Solutions Committees
LTFS Oversight Committee
North Dakota Minnesota Manitoba Tom Fischer Morrie Lanning Steve Topping ND State Senator Representative, Dist. 9A – MN Legislature Manitoba Water Stewardship Todd Sando John Jaschke North Dakota State Engineer Executive Director ND State Water Commission MN Board of Water and Soil Resources Jake Gust Jon Evert Engineer Clay County Commissioner Red River Basin Commission Red River Basin Commission Chair
LTFS Project Advisory Committee
John Finney, Co-chair Jim Lyons, Co-chair MN Red River Watershed Management Board ND Red River Joint Water Board Bruce Albright Charlie Anderson Buffalo Red River Watershed District TSAC/WSN Engineering Mark Brodshaug Damon DeVillers ND Red River Joint Water Resource District Interstate Engineering Brian Dwight Tom Fischer MN Board of Water and Soil Resources ND State Senator/ Red River Joint Water Board/SE Randy Gjestvang Cass WRD ND State Water Commission/ND Red River Terry Guttormson Joint Water Board Landowner/Producer/Downstream Interests Ron Harnack Al Kean Red River Watershed Management Board MN Board of Water and Soil Resources Lee Klapprodt Jon Roeschlein ND State Water Commission Bois de Sioux Watershed District Jim Solstad Rick St. Germain MN Dept. of Natural Resources Houston Engineering Dan Thul Henry Van Offelen MN Dept. of Natural Resources MN Center for Environmental Advocacy Jeff Volk Dan Wilkens Moore Engineering MN Red River Watershed Management Board/Sand
Hill River WD
LTFS AC Technical Subcommittee
Bruce Albright* Charlie Anderson* Keith Berndt – Cass County, ND Damon DeVillers* Randy Gjestvang* Terry Guttormson* Scott Jutilla - US Army Corps of Engineers Al Kean* Jon Roeschlein* Jim Solstad* Rick St. Germain* Dan Thul* Jeff Volk* Alf Warkentin - Manitoba Water Stewardship Melissa Zeis - Lightowler Johnson Associates
LTFS AC Policy Subcommittee
Mark Brodshaug* Brian Dwight* Tom Fischer* Ron Harnack* Lee Klapprodt* Henry Van Offelen* Dan Wilkens* Other Committees and Subcommittees: Funding, Farm Commodity, Impediments

- 3 -
CONTENTS Part I: BACKGROUND: CRISIS, PAST RESPONSES, CURRENT STUDY 1 Crisis of Red River Basin Flooding.......................................................................................8 Overview of Red River Basin........................................................................................8 Overview of Red River Basin Flooding .......................................................................12 Factors that Contribute to Basin Flooding...................................................................15 Nature of Current Risks and Challenges.....................................................................20 Citizens’ Reports ........................................................................................................25 2 Past Responses and Challenges .......................................................................................26 1930s – 1950s............................................................................................................26 1960s – 1990s............................................................................................................28 Post-1997...................................................................................................................32 Current Challenges.....................................................................................................33 3 Long Term Flood Solutions Study ......................................................................................36 Scope of LTFS Study .................................................................................................36 Timeliness of LTFS Study...........................................................................................37 LTFS Study Participants.............................................................................................38 Primary Methods ........................................................................................................40 Assisting Ongoing Local Flood Issues ........................................................................42 Part II: CARRYING OUT THE CHARGE: DETERMINING COSTS OF FLOODING, BUILDING FOUNDATIONS FOR RESPONSE, PREPARING DATA AND TOOLS FOR THE BASIN 4 Costs of Red River Basin Flooding.....................................................................................43 Overview of Methods and Findings.............................................................................43 Costs of Basin Flooding: Urban ..................................................................................44 Costs of Basin Flooding: Agriculture...........................................................................51 Costs of Basin Flooding: Transportation, Other Infrastructure, Rural Structures .......................................................................................................56 Under- and unreported Costs of Flood Damage .........................................................58 5 Building Foundations: Development of Principles; Review of Governance ........................60 Building Foundations Through Development of Principles ..........................................60 Building Foundations: Review of Governance ............................................................63 6 Preparing Data and Tools for Basin-wide Application.........................................................69 Hydrologic and Hydraulic Information .........................................................................69 Applications to Flood Risk Management.....................................................................73 Part III: CORNERSTONE SOLUTIONS 7 Floodplain Management – Nonstructural Strategies...........................................................82 Definitions ..................................................................................................................83 Current Floodplain Legislation ....................................................................................85 Towards Developing Long-range Floodplain Management .........................................88 Challenges .................................................................................................................94

- 4 -
8 Floodplain Management – Raising Levels of Protection .....................................................96 Review of Past Progress and Practices......................................................................96 Guidelines for Levels of Protection .............................................................................99 Current Status of Local Protection in Basin Communities.........................................101 Need and Potential for Additional Local Protection ...................................................102 Estimated Costs .......................................................................................................104 9 Floodplain Management - Retention ................................................................................106 Definition and Initial Conclusions ..............................................................................106 Theoretical Testing of Strategy of Flow Reduction....................................................107 On-the-ground Testing of Retention .........................................................................110 Analyzing Cumulative Findings on Potential for Retention........................................114 Estimated Costs .......................................................................................................115
Results of Complimentary Floodplain Management Approaches..............................117 Part IV: CONCLUSIONS AND RECOMMENDATIONS 10 Conclusions and Recommendations for Action ...............................................................119 Immediate Needs/Critical Risks: Fargo-Moorhead, Devils Lake ...............................119 Cornerstone Solutions: Floodplain Management ......................................................120 2A Floodplain Management – Nonstructural Strategies ........................................121 2B Floodplain Management – Raising Levels of Protection ..................................122 2C Floodplain Management – Retention...............................................................127 Information and Tools for Maximizing Efforts Going Forward....................................129 Resources to Implement...........................................................................................131 11 Funding Timeline for Project Implementation Costs along the Red River of the North and Tributaries ...................................................................132 12 Red River Basin Commission Long Term Flood Solutions Implementation Table .............................................................................................135

- 5 -
Red River Basin Long Term Flood Solutions Executive Summary
September 30, 2011
The Red River basin is an international, multi-jurisdictional watershed of 45,000 square miles, with 80 percent of the basin lying in the United State and 20 percent in Manitoba, Canada. Eighteen Minnesota counties and 22 North Dakota counties lie wholly or partially in the basin. The economic impact of the basin, from both urban-generated activity and a vibrant agricultural economy, is significant. This basin is home to more than half a million people, and serves as a jobs, education and medical hub, in addition to a world-renowned agricultural producer.
NEED FOR ACTION
The increase in frequency and magnitude of flooding in the Red River basin is unmistakable. The spring flood of 1997 that decimated the metropolitan center of Grand Forks-East Grand Forks and gravely threatened areas throughout the basin introduced a decade of flooding. Since 2000, the basin has experienced damaging flooding in all but 2 years, including major floods in 2006, 2009, 2010 and 2011. Since 1997, most sites along the main stem Red River have seen levels of flooding at or close to 100-year levels, some in more than one flood event. And tributary areas have experienced up to 500-year flood levels during the past decade. The conclusion reached by the International Joint Commission that we need to expect and prepare for even larger floods than that experienced in 1997 has already been proven true in this decade. We know today that larger floods are both possible and probable.
THE IMPETUS
Before the major flood waters of 2009 had even receded, state legislators in North Dakota and Minnesota asked the Red River Basin Commission (RRBC), as an international basin-wide organization, to spearhead the effort to develop a comprehensive, proactive plan that responds to and mitigates flooding throughout the watershed. The RRBC was uniquely positioned for this endeavor given its ongoing organized effort to further commitment to shared land and water stewardship goals through their Red River Basin –
Natural Resource Framework plan, including the goal of flood damage reduction.
OUR FINDINGS
During the last two years under the LTFS project, critical information was gathered, developed and compiled into recommendations which will provide basin managers with key tools to mitigate the effects of flooding and make the basin’s communities more resilient. Part one of the attached report to state and federal officials on flood solutions illustrates the history of flooding throughout the Red River basin, including factors contributing to the problem, progress made to date, and remaining challenges. Part two of the report summarizes the costs of flooding in the basin for both urban and rural areas. It presents basin-wide flood solution principles that were developed to guide current and future implementation of mitigation strategies and reviews governance issues in the basin. This section also presents the study’s technical analysis of current hydrological and hydraulic data to test and undergird potential flood mitigation strategies. And it includes a description of tools utilized or developed as part of the project, such as the MIKE-11 mainstem model, HMS sub-watershed models, and the Decision Support System, Phase 6, the latter which will offers water managers geospatial tools and pre-processed data to improve and streamline project planning. Part three of the report presents three basin-wide approaches to floodplain management with the combined goal of creating a more flood resilient basin. First, numerous nonstructural strategies are explored, from land use to basin participation in federal programs as a way to move beyond minimum standards. A second approach to floodplain management explores levels of protection throughout the basin: existing protection, guidelines for appropriate protection, likely ways to achieve appropriate protection, and approximate costs.

- 6 -
A third approach to floodplain management explored in Part three of the report is flow reduction of peak flood waters by means of basin-wide retention. A goal of a 20 percent reduction in peak flows on the Red River main stem from 1997 flood levels was tested and found to be feasible. Inventories of current storage were completed, together with initial estimates from sub-watershed modeling of the capacities for retention, and an estimate of 1.5 million acre feet was determined as the total required retention to be achieved in the U.S. portion of the basin.
OUTLINE OF RECOMMENDATIONS
The Long Term Flood Solutions report contains specific recommendations for action for local, state and federal officials on the following topics. 1. First and foremost, the two most critical
areas of the basin must be addressed as soon as possible:
a. Fargo-Moorhead, as the most populous
metropolitan city in the United State portion of the basin, at severe risk of significant damage, requires immediate permanent protection measures. State and federal funding to continue the local projects identified to date, should be continued to completion. Beyond this local protection, progress towards the proposed diversion should be advanced beginning with agreement between Minnesota and North Dakota on non-federal cost share formula. Retention should complement the diversion.
b. Devils Lake, ND requires immediate measures as well to mitigate a potential natural overflow its rising waters to head off major water quality and quantity adverse impacts throughout a large portion of the basin. Current efforts must be brought to completion. Progress and timelines should be conveyed to the public. A comprehensive model with real-time data to determine the effects of releases of Devils Lake water should be considered.
2. Floodplain management is a cornerstone of the solutions in the basin:
a. Nonstructural strategies must be
advanced that addresses mitigating existing development and protecting future growth to a higher standard, identification of barriers to increased participation in the community rating system, and education and outreach of floodplain information to
residents. Local floodplain ordinances should be updated and new development in areas of high risk areas adjacent to the mainstem Red River and its tributaries should not be permitted.
b. The levels of protection must be raised
for an integrated approach for urban areas, critical infrastructure, small cities, rural residences and farmsteads, agricultural cropland, and critical transportation systems and emergency services. Funding for identified local protection projects consistent with these levels of protection should be cost-shared among state and local partners. A multipurpose drainage strategy should be developed for agricultural land. Road elevations must be considered as well as funding strategy for county and township road repairs.
c. Retention strategies developed must be funded and implemented, including: strategically located storage to help reduce peak flows on the mainstem while mitigating local flooding on the tributaries, federal funding participation, a review of existing reservoirs for increased water storage, the development of a prioritization process for retention projects, streamlining of the water retention project permitting process, updating and expansion of various modeling efforts throughout the basin, and an analysis of aged dams and restoration potential for increased flood control capacity.
3. The development of further information
and tools is necessary for basin leaders including: advanced collaboration and facilitation of the multijurisdictional issues, creative alternatives for federal agency participation across jurisdictions, expansion of these efforts to Manitoba and South Dakota, improved flood forecasting measures and the development of a consistent a seamless stream gage system. This plan shall remain active with an annual progress report from the RRBC.
4. These recommendations require dedicated
local, state and federal participation in funding and commitment to implement in order to be successful. Identified costs and funding resources are presented in an accompanying spread sheet.

- 7 -
ACKNOWLEDGEMENTS On behalf of the Red River Basin Commission (RRBC) Board of Directors, we say Thank You to all of those individuals, organizations, and agencies that assisted us during the process of developing this Long Term Flood Solutions (LTFS) Report. First, we express our gratitude to the Minnesota and North Dakota Legislators and Governors for their leadership in providing the funding and direction for this effort. We also appreciate their confidence in RRBC and their willingness to explore solutions beyond political and state boundaries. Second, RRBC expresses gratitude and respect for the people who live and work in the Red River Basin. The flood of 2009, like floods before and since, have impacted their lives physically, mentally, and economically. Their first-hand experiences of flooding and ideas for solutions shared during the initial round of public meetings helped shape the focus and direction of the LTFS Project. Their comments and feedback during the final round of public meetings verified the final LTFS Recommendations. Third, RRBC expresses its gratitude to all of those individuals, organizations, and agencies that participated in the committees where ideas were generated; where reports, data, and concepts were discussed and finalized; where the general concepts for the LTFS were formulated; and where the specifics of modeling, flow reductions, levels of protection, assumptions, funding and policies all had their refinement into the final documents in the report. We especially want to thank the members and participants in the LTFS Oversight Committee, the LTFS Advisory Committee, the LTFS Technical Committee and the LTFS Policy Committee. In addition, subcommittees on Impediments, Funding, and Farming Issues provided input and insights into specific sections of the LTFS Final Report. Fourth, we want to say a word of appreciation for the expertise and skill levels of all of those who consulted on the project. The range of expertise that helped with technical, policy, funding, public meetings, and report analysis was of highest level and very valuable. Fifth, we express appreciation for all those who provided review comments on text and data. This input was an invaluable component that assisted in gathering of additional data, development of the final report, and decisions relative to the packaging of the end products for the LTFS Plan for the Basin. Sixth, we express our appreciation to the RRBC staff for their efforts the past couple of years on this project. The project was demanding, the timelines were intense, and the information gathered was monumental. Through it all, the quality of the effort and work was exemplary. Finally, RRBC again extends our deepest gratitude to all the people and organizations that assisted in any way on this project for their commitment, gift of time, and eagerness to work together. Your past effort shows the significance of this problem and the importance of basin wide solutions that address immediate and long term needs. This commitment will be tested in the future as we all work together to get it done. Lance Yohe, RRBC Executive Director

- 8 -
Part I: BACKGROUND: CRISIS, PAST RESPONSES, CURRENT STUDY
1 Crisis of Red River Basin Flooding
The state legislatures of Minnesota and North Dakota called for a comprehensive study of long-term solutions to the ongoing serious flooding in the Red River of the North basin. The Red River Basin Commission (RRBC) was charged with organizing the effort, which would bring together agencies and officials from all levels of government who work with flooding issues, along with citizens and non-governmental organizations, to address the issue. The study began July 1, 2009, with a progress report submitted in January 2010 and final recommendations and report submitted Fall 2011. The RRBC expects to present its findings to the 2012 Minnesota Legislature at a legislative hearing and to the North Dakota Legislature at any appropriate hearing before or during its next session in 2013.
Overview of Red River Basin
The Red River basin is an international, multi-jurisdictional watershed of approximately 45,000 square miles, with approximately 80% of the basin lying in the US and 20% in Manitoba, Canada. Eighteen Minnesota counties and 22 North Dakota counties lie wholly or partially in the basin. The basin’s assets, both urban-generated wealth and a vibrant agricultural economy, have long been recognized.1 Today this basin is home to more than half a million people2 and is a jobs, education and medical hub, in addition to a world-renowned agricultural area.
Urban Economic Snapshot One can get a relative look at the value of communities in the basin through the potential damages to these communities from a single flood event. As illustrated in the damage curves for 36 basin communities (see Appendix C, Table C-90), potential damages of a single flood without protection, even for a small community, can range into the millions of dollars, with urban centers ranging into the billions of dollars of damages. Of the basin’s larger urban centers, Fargo-Moorhead was rated by Forbes in 2009 as the #5 top college town for jobs and the #7 best place for business and careers (including cost of doing business, educational attainment of the population, income growth, projected job growth and net migration).3 The employment by industry in Fargo-Moorhead for July 2010 is categorized as follows:
1 The Souris-Red-Rainy River Basins Comprehensive Study (1972) and USACE’s Red River of the North Reconnaissance Report (1980) both contain detailed summaries of the basin’s assets (see Appendix E, E-6 Reference Reports for full texts). 2 US Census Bureau for 2009. 3 For a recent detailed cost-benefit analysis for Fargo-Moorhead, see Appendix C, Exhibit C-3.

- 9 -
- 10 -
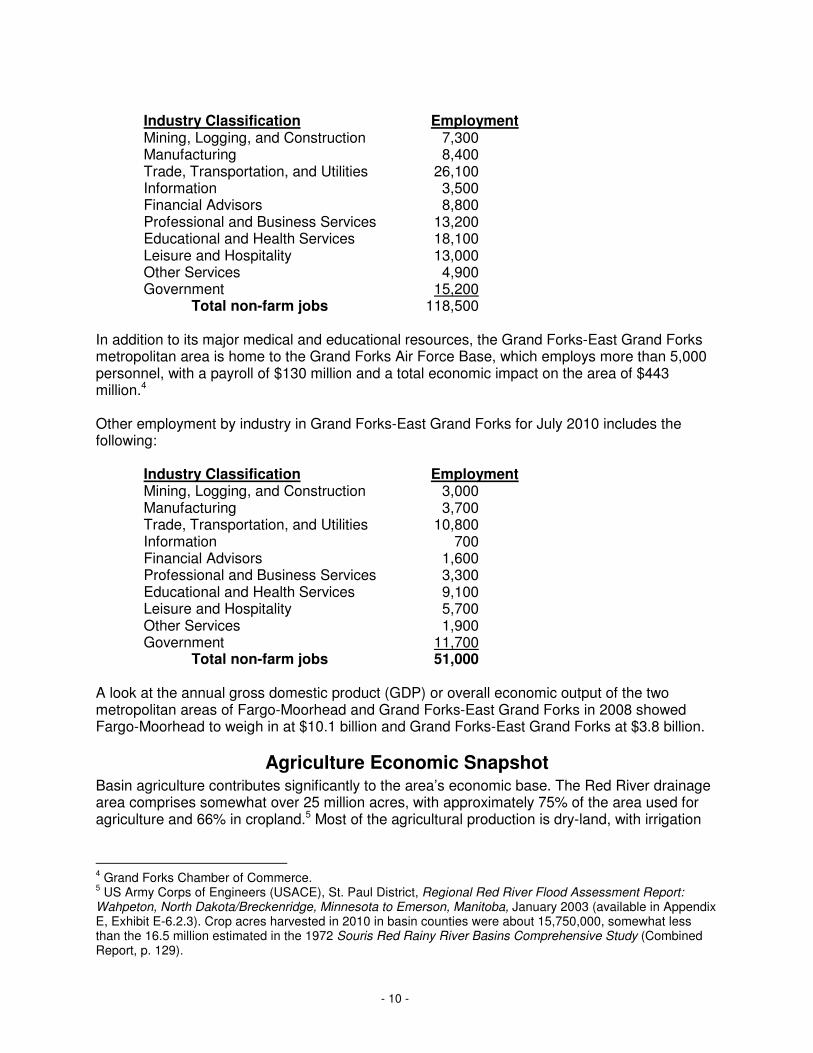
Industry Classification Employment Mining, Logging, and Construction 7,300 Manufacturing 8,400 Trade, Transportation, and Utilities 26,100 Information 3,500 Financial Advisors 8,800 Professional and Business Services 13,200 Educational and Health Services 18,100 Leisure and Hospitality 13,000 Other Services 4,900 Government 15,200 Total non-farm jobs 118,500 In addition to its major medical and educational resources, the Grand Forks-East Grand Forks metropolitan area is home to the Grand Forks Air Force Base, which employs more than 5,000 personnel, with a payroll of $130 million and a total economic impact on the area of $443 million.4 Other employment by industry in Grand Forks-East Grand Forks for July 2010 includes the following: Industry Classification Employment Mining, Logging, and Construction 3,000 Manufacturing 3,700 Trade, Transportation, and Utilities 10,800 Information 700 Financial Advisors 1,600 Professional and Business Services 3,300 Educational and Health Services 9,100 Leisure and Hospitality 5,700 Other Services 1,900 Government 11,700 Total non-farm jobs 51,000 A look at the annual gross domestic product (GDP) or overall economic output of the two metropolitan areas of Fargo-Moorhead and Grand Forks-East Grand Forks in 2008 showed Fargo-Moorhead to weigh in at $10.1 billion and Grand Forks-East Grand Forks at $3.8 billion.
Agriculture Economic Snapshot Basin agriculture contributes significantly to the area’s economic base. The Red River drainage area comprises somewhat over 25 million acres, with approximately 75% of the area used for agriculture and 66% in cropland.5 Most of the agricultural production is dry-land, with irrigation
4 Grand Forks Chamber of Commerce. 5 US Army Corps of Engineers (USACE), St. Paul District, Regional Red River Flood Assessment Report: Wahpeton, North Dakota/Breckenridge, Minnesota to Emerson, Manitoba, January 2003 (available in Appendix E, Exhibit E-6.2.3). Crop acres harvested in 2010 in basin counties were about 15,750,000, somewhat less than the 16.5 million estimated in the 1972 Souris Red Rainy River Basins Comprehensive Study (Combined Report, p. 129).

- 11 -
used on only a small percentage of acres. Additional lands are in forest, pastures/rangeland, water areas, and urban development, among other uses. The following table, representing the 2010 growing year, shows that high value crops of beans, corn, sugar beets, and potatoes dominate in harvested acres. Wheat and a number of specialty crops are also part of many crop rotations. As demonstrated by the table’s summary of net return per acre of major crops, the economic return on basin cropland alone was about $2.6 billion in 2010 (approximately $650 million in Minnesota basin counties and $2 billion in North Dakota basin counties) (see Appendix C, Table C-101): Harvested Crops and Net Return Per Acre for Counties of the Red River Basin in Minnesota and North Dakota
It is important to note that for basin farms to achieve the economic returns described above, those farms put multiple billions of dollars into the local and state economies. As a sample snapshot of this contribution of agriculture to the economy, one can look at the yearly reports of the Farm Business Management program, a program that traces financial records of

- 12 -
participating farms.6 The program’s 2010 composite report of 249 farm operations located in the basin shows that the average spending for the year by a farm operation, including farm and living expenses and taxes, approached $800,000.7 With approximately 25,000 farm operations in the basin,8 the overall contributions of basin agriculture to the economy are highly significant. Nor do any of the above figures describing agriculture’s contributions to the economy include local value-added processing of commodities, an area that has expanded in the last several decades. Together, the economies of the basin’s metropolitan areas and of its major agricultural sector are vital, diverse and strong. This position has resulted in a significantly less severe impact from the recent recession and related economic downturn than that experienced by many areas of the country.
Overview of Red River Basin Flooding
The immediate impetus for the Minnesota and North Dakota legislative appropriation and charge was the spring flood of 2009 in the Red River Basin. The 2009 flood was one of a number of major flood events in the past decade and a half that have challenged the area to an extreme. Of the floods preceding the 2009 event, the 1997 spring flood was particularly devastating, wreaking destruction in large portions of Grand Forks and East Grand Forks and threatening damage to communities and other sites along the entire length of the Red River main stem and many of its tributaries. In its extensive report following that flood, the International Joint Commission (IJC) warned that, as rare an event as was the 1997 flood, a flood of that magnitude or larger “can be expected to occur in the future.”9 Little did anyone expect that a flood of even greater magnitude than 1997 for southern areas of the basin would occur fewer than ten years after the report was released—and that this 2009 flood would be followed by two additional large magnitude floods in 2010 and 2011.
The Gravity of Recent Record The flood of 1950, which forced Winnipeg to evacuate 100,000 residents, might have signaled for the entire basin the potential for large magnitude flooding. However, despite this early warning sign and a number of flood fights in the 1960s and 70s, it took the spring 1997 flood to serve as a wake-up call for the whole basin. On the Red River main stem alone, the 1997 flood threatened the Winnipeg floodway to the north with peak discharges at the highest level in 145 years,10 brought extensive damages to the cities of Wahpeton and Breckenridge in the south, and devastated the cities of Grand Forks and East Grand Forks when record crests overtopped
6 The Farm Business Management program’s primary activity is to analyze farm records to establish benchmarks for successful farming operations that can be used by producers to improve their business. The program considers the US portion of Red River valley, both North Dakota and Minnesota, as one category, with reports generated for this area. 7 Although the farms participating in the program are not selected as a representative sample of the basin, those professionals administering the program attest to the fact that the farms that participate represent a range of sizes, situations, and economic conditions, and in these respects, appear to represent an approximate range of Red River basin crop production economy. 8 The number of farms is based on the 2007 Census of Agriculture, which defines a farm as any place from which $1,000 or more of agricultural products was produced and sold during the census year. For counties that do not lie fully in the basin, the number of farms was approximated. 9 Living With the Red: A Report to the Governments of Canada and the United States on Reducing Flood Impacts in the Red River Basin, 2000, p. 20 (full text available in Appendix E, E-6 Reference Reports). 10 Environment Canada and Manitoba Water Stewardship, June 2011, State of Lake Winnipeg: 1999-2007, p. 4.

- 13 -
levees. Estimated damages for the event totaled $4 billion for the US portion of the basin. Full impacts across the basin from this flood event have yet to be fully measured or comprehended (see Appendix B, Exhibits B-5 and B-6 for detailed studies of the 1997 spring flood). Fortunately, before the 2009 flood, considerable progress had been made in the basin on flood protection. The Grand Forks-East Grand Forks flood control project was largely completed by 2009, and Wahpeton-Breckenridge had substantial parts of a project either complete or useable. In addition, the new Maple River dam and a five-foot raise of the flood pool at Baldhill Dam were completed, providing additional flood storage. While a permanent project for Fargo-Moorhead was not started by 2009, the cities had made several important modifications to their existing facilities. It is generally agreed that without these improvements the cities would likely not have survived 2009 largely intact. In particular, the flood made clear the need for a permanent flood protection project for the Fargo-Moorhead area (see Appendix B, Exhibits B-3 and B-4 for details of 2009 spring flooding in the Dakotas and Minnesota). Not only was the flood of 2009 a close call for the metropolitan area of Fargo-Moorhead, numerous other communities in the basin on both the Red River main stem and tributaries had major flood fights on their hands as well. In North Dakota, emergency dikes were constructed in a number of cities and counties, and the two cities of Valley City and Lisbon sustained significant damage. In Minnesota, the Georgetown levee was raised another two feet, and several other cities north of Moorhead experienced damaging flood levels. In a wide swath of the basin, overland flooding took both predictable and new paths, causing extensive damage to roads, railroad beds, and other infrastructure. Sections of two Interstate highways had to be shut down. Some rural communities found themselves isolated for weeks, causing great concern over lack of access to emergency services. As if the experience of a second large-magnitude flood in 12 years was not enough, summer 2009 rains brought river levels on the main stem back up more than ten feet in southern portions of the basin, reaching levels just short of major flood designation. Numerous tributaries also experienced stage rises and damage to crops during this summer flooding episode. The lessons of 2009 were clear: Large-magnitude floods can occur any year. The region cannot afford to sit back and think “we are past the worst flood.” That the springs of 2010 and 2011 brought two additional large-magnitude floods only confirmed the issue at hand as needing immediate action.
Historical Context of Basin Flood Events The history of basin flooding tells us that floods occur often in the basin. Nor are basin floods only a recent phenomenon. Although flood records for the Red River are, for the most part, not available before 1897in the US portion of the basin11 or before 1872 at Winnipeg, a variety of methods have been used to estimate peak discharges, including journals, tree rings, lake sediment and high water marks, among other methods (see Appendix B, Exhibit B-13). The combination of flood records and other evidence shows flooding to be a natural phenomenon for the region. It suggests early floods to be larger than those measured floods since the 1880s, including a large-magnitude flood in 1776 and, according to Canadian records, a flood of record in 1826.
11 USGS measurements of peak discharge and stage date back to the 1897 flood at Fargo-Moorhead and the 1882 flood at Grand Forks-East Grand Forks.
- 14 -
In the 20th century, most decades, with the exception of the 1930s, have brought one or more floods. The last half-century has seen an unmistakable increase from preceding decades in the frequency and magnitude of flooding. If one adds up the floods designated as major from three recent sources—How Are We Living with the Red (2009), the Red River Basin Flood Damage Reduction Work Group (1998) and the Red River Basin Board Flood Damage Reduction Inventory Team Report (2000)—the total for the last 50 years is 18. That number does not include many lesser flood events. For instance, a look at the past decade reveals that, in addition to major floods, lesser flood events have come to be the norm. In the last ten years, in addition to the major floods of 2006, 2009, 2010 and 2011, the following years also saw damage in the basin from flooding:
• 2000: significant spring damage in Fargo following a severe spring rainstorm, • 2002: damaging summer flooding on the MN Wild Rice River and the Roseau and
Pembina trans-boundary rivers (see Appendix B, Exhibit 7), • 2004: late spring flooding from Mayville-Portland, ND/Ada, MN, to the Canadian border, • 2005: record high summer stage and duration levels on the Red River, • 2007: wet spring and summer conditions and crop losses in areas of the basin, • 2008: spring flood and wet fall conditions damaging to crops.
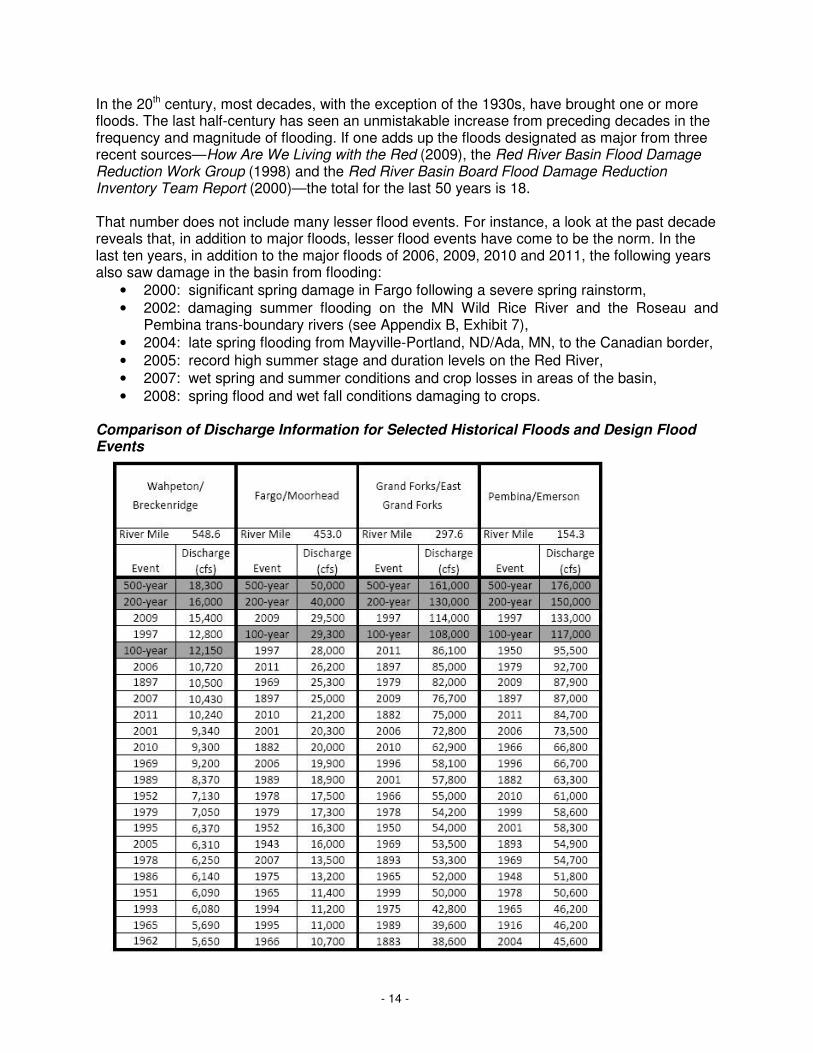
Comparison of Discharge Information for Selected Historical Floods and Design Flood Events

- 15 -
As alarming as the frequency of flooding is the size of recent floods. The above table shows discharges for 20 selected historical floods at four sites on the Red River main stem (see Appendix B and Table B-7 for additional discussion and details about sources). In specific, the table shows that, in the last 15 years, discharges have exceeded 100-year levels at all four sites, and that at one site, discharges have exceeded 100-year levels twice, with one of those instances approaching a 200-year flood. Large magnitude flooding has also been the experience of the Red River’s tributary areas. The following table describing discharges since 1950 at sites on six tributaries shows that all have experienced significant flooding during this time (see Appendix B and Table B-8 for additional discussion). Although two of the sites have not experienced a 100-year flood, in both cases discharges have come very close to that level, with one of the two sites having experienced flooding close to 100-year levels repeatedly. Three of the sites have reached or exceeded 100-year flooding levels, with one of the three sites having exceeded this level twice since 2009. The fifth site has experienced two floods in excess of 500-year. Both occurred in 2002 when a large flood peaked on June 9 and a second on June 24. Top 10 Floods on Selected Tributaries of the Red River
In summary, Red River basin flooding has been occurring with increasing frequency and with record-breaking stages for more than half a century, with that frequency and size intensifying in the last 15 years. Floods of the magnitude of 1826 or greater are potential realities for the basin. A remark by a Fargo-Moorhead leader to the 2010 International Legislators’ Forum captures the resulting situation of the basin: “We know we’ll always have emergency flood fights; we just don’t know if we can win these fights.”
Factors That Contribute to Basin Flooding
One might be tempted to interpret the recent plethora of large-magnitude flood events in the basin as an aberration. A number of factors would suggest otherwise.

- 16 -
Geophysical Features The mere size of the Red River basin is a factor in its flooding. The US portion of the basin is well over 20 million acres,12 and more than two thirds of this area contributes to runoff in the basin. The basin’s topography adds to those features that lead to flooding. Because the basin is a glacial lake bottom rather than a typically carved-out river valley, its bottom areas are remarkably flat. The difference in elevation between headwaters at Wahpeton-Breckenridge and the Red River’s termination at Lake Winnipeg, a distance of 545 river miles, is only 229 feet. A gradient of 1.0 foot per mile at Grand Forks declines to 0.2 feet per mile at the international border. The resulting slow-moving waters in this young landmass have not dug channels of enough depth to contain themselves. The primary elevation differences that do exist in the basin run from the main stem to rising land on either side, with altitudes in the US portion ranging from a low of 750 feet where the Red crosses the international boundary to 2,350 feet in its low rolling hills of drift prairie to the west. To the east are upland hills of the glacial moraine area, dotted with lakes and wetlands. The upper lands from both west and east contribute runoff that collects on the lower areas, first on the tributaries and then on the wide floodplains of the Red River main stem. The Red River’s direction of flow from south to north is another contributing factor to the challenge of retaining water in the basin’s river channels during its already problematic spring floods. When the earlier waters from the south encounter a still-frozen river channel to the north, flow of the river’s waters is impeded. Water levels can rise quickly and dramatically at these points, causing break-outs with resultant damage to infrastructure and environment. When the river’s natural banks become overtopped, water can spread out for tens of miles over the basin’s relatively impermeable clay soils. Waters move from section to section, damaging roads, bridges, farmsteads and, if not protected, communities and urban centers.
Antecedent Conditions It is generally agreed that the potential for spring flooding in the basin increases with the presence and alignment of several antecedent conditions. First are saturated soils at fall freeze-up before snow begins to provide insulation. A second is a deep, moisture-laden snow pack collected during the winter months. Third is a colder-than-average spring that allows for additional precipitation before the thaw can remove the waters. Although it would seem that such an alignment would be rare, in the basin these three factors, which together set the stage for a large flood, are not uncommon. Such a confluence of factors was clear in the 1826 flood, typically considered the flood of largest magnitude in the last 200 years. The conditions of that year are reported in the Red River Basin Board’s Hydrology Inventory Team Report (2000):
1) The fall of 1825 was extremely wet and most of the lakes and wetlands were overflowing,
2) A major snowstorm occurred in late fall, 3) A cold, snowy winter permitted an exceptionally deep snow pack to develop over much
of the basin, and
12 The Souris-Red-Rainy River Basins Comprehensive Study estimates the basin’s acres at 22.6 million (see Combined Report, p. 129).

- 17 -
4) The coldest estimated March-April mean temperature at Winnipeg since 1815 occurred in 1826.
These same factors have contributed to a spate of recent spring floods (for further analysis, see Appendix B, B-1.2.4.1, pp. 41-48). Larger global climate phenomena can affect local conditions. In the case of the basin, according to the National Weather Service (NWS) office in Bismarck, a negative El Nino may be coinciding with a Pacific Decadal Oscillation to result in a longer-term wetter, cooler effect. Such an effect can contribute to a 10-12-day difference in the beginning of spring stream flow.13 Such delays in spring melt, as noted above, are one of the contributing factors to the making of a major flood event in the basin. Even without these conditions in place, floods can occur. A case in point, according to the US Geological Survey (USGS), was the June flood of 2002. Preceding that flood, precipitation had been below normal, and the areas flooded had been in moderate drought conditions before the flood hit (see Appendix B, Exhibit B-7 for the USGS report on the June 2002 basin flood). All evidence points to the fact that, whatever the conditions, flooding in the basin is a regularly occurring event. Given the records and evidence dating back to before 1776, the question has never been whether flooding will return; it is only when, what magnitude, and how often flooding will inundate the basin floor.
Forecasting Challenges Spring snowmelt floods generally can be anticipated weeks if not months in advance of the event. And some of the antecedent conditions described above, including frost depth, soil moisture content, and river ice conditions, can be known in advance and factored into determining the potential magnitude of a spring flood. But forecasting floods in the basin is still challenging. Several conditions most critical to determining the degree of floods, such as temperatures occurring during the snowmelt, final actual snow pack depths and their water equivalencies, and the magnitude and timing of spring rains, cannot be fully known until just before or during the spring thaw. If a heavy rainfall should occur, the actual magnitude of a flood can change dramatically over just a few days. Also difficult to read and factor into flow predictions is overland flooding, which can have new patterns with each flood. The NWS has made concerted efforts to improve flood forecasting in the Red River basin, particularly since the challenges presented by the spring flood of 1997. These efforts are made clear in reports by the NWS following the spring floods of 1997 and 2009 (see Appendix B, Exhibits B-6 and B-3). The latter report contains a “Comparison of Issues” between the technique and practices of flood forecasting for the two flood events. The comparisons capture a variety of improvements made in flood forecasting after 1997, including those in areas of coordination, detail of and access to data, and communications. A substantial number of recommendations and “Best Practices” citations suggest that steps towards further improvements continue to be made. Despite improvements in flood forecasting, particularly since 1997, the variables and uncertainties during any given flood mean decisions, whether about resources to be committed or people or areas that may need evacuation, often have to be made based on complex, partial
13 Allen Schlag, “The Interannual Variability of Northern Plains Cold Season Precipitation and Spring Flooding as Related to the ENSO and the PDO,” Presentation at 28th Annual Red River Basin Land & Water International Summit Conference,” January 18-20, 2011, Fargo, ND.

- 18 -
information. A basin city official captured the resulting difficulties of fighting floods in the basin when she explained to the 2010 International Legislators’ Forum that, during a flood, “Conditions rule—and you can’t know for certain what they are.”
Role of Climate Variables It is generally accepted that the one constant in climatology is change. Add the large variability of climate in the Red River basin resulting from its location at the meeting of arctic, tropical, and Pacific air masses, and you get constant change in climate, together with the uncertainties accompanying that change. Indeed, if changes in climate are going in predicted directions (illustrated, for example, in the rise in US coastal waters), we can expect impacts in the northern mid-section of the continent to include, among others, more vulnerability to both spring and summer flood events. Such a potential factor is already being built into our neighbor Manitoba’s flood protection infrastructure at Winnipeg, which offers 700-year protection to the city. It is also implicit in a recently announced Manitoba Flood Mitigation program, a cooperative federal-provincial effort that recognizes the continued potential for large magnitude flooding in the Red River basin. Research into the climate of the Red River basin has found instances of past climate variability within specific spans of time, as well as apparent longer-term shifts in climate (see Appendix B, Exhibit B-12). Within these larger changes, however, the historical record of basin flooding, as noted, shows that few decades in the last centuries have escaped flood events. Current regional patterns, whether for the Mississippi and Missouri (1993), Rush Creek in Minnesota (2007), Cedar River in Iowa (2008), southeastern Minnesota (2010), or western North Dakota (2011), suggest that flooding occurrence and magnitude may be heightening. In many parts of the Red River basin, conditions would support that supposition. In Fargo-Moorhead, for instance, where attention has been focused since 2009 after the two cities had to wage a critically difficult flood fight, the Red River has exceeded flood stage in 50 of the 106 years up to 2009, with 19 of these years of reaching flood stage occurring consecutively since 1993 (see Appendix B, Exhibit B-11, p. 6). Should such a pattern be seen as a change in climate conditions? This was the question posed to a team of hydrologic and climate experts as part of the US Army Corps of Engineer’s (USACE) feasibility study for permanent flood protection measures for the Fargo-Moorhead metropolitan area. The USACE assembled a team of experts with the goal of determining a more accurate historical flood record to use for their economic analysis of the flood risk reduction project for Fargo-Moorhead: whether the complete hydrologic record since 1900, which included a very dry period prior to the 1940s, or a shorter, “wet” period of record. The panel of experts determined the shorter, wet record to be a statistically more accurate measure for the proposed 50-year life of the project under study (see Appendix B, Exhibit B-11 for the expert opinion determination for Fargo-Moorhead). This conclusion, for purposes of the USACE study, has resulted in revised flood flow frequency curves for several locations in the vicinity of Fargo-Moorhead. The revised frequency curves statistically increase the potential levels of flooding for the two cities.
The Question of Drainage Questions about the impacts of drainage on flooding are not new. Various forms and degrees of drainage have occurred since European settlement in the later 1800s. Since the 1950s, the states of Minnesota and North Dakota have worked to regulate and control the effects of drainage practices, with particular attention to agricultural lands given the extensive agricultural economy of the basin.
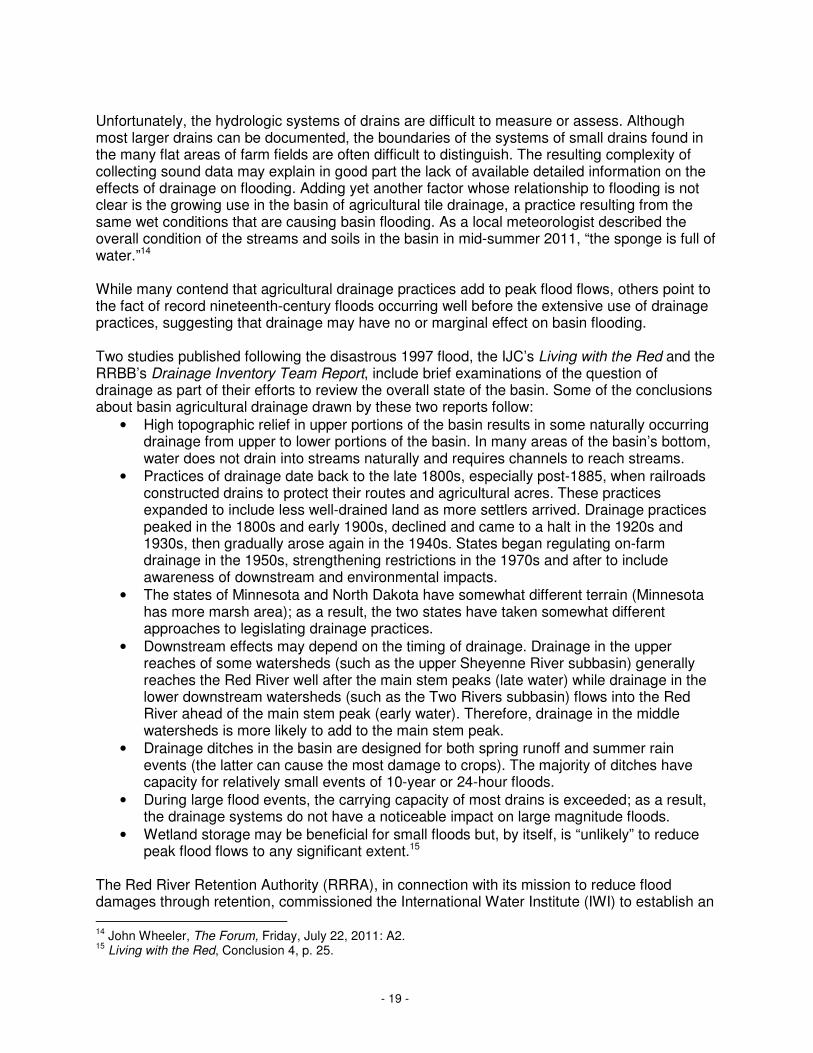
- 19 -
Unfortunately, the hydrologic systems of drains are difficult to measure or assess. Although most larger drains can be documented, the boundaries of the systems of small drains found in the many flat areas of farm fields are often difficult to distinguish. The resulting complexity of collecting sound data may explain in good part the lack of available detailed information on the effects of drainage on flooding. Adding yet another factor whose relationship to flooding is not clear is the growing use in the basin of agricultural tile drainage, a practice resulting from the same wet conditions that are causing basin flooding. As a local meteorologist described the overall condition of the streams and soils in the basin in mid-summer 2011, “the sponge is full of water.”14 While many contend that agricultural drainage practices add to peak flood flows, others point to the fact of record nineteenth-century floods occurring well before the extensive use of drainage practices, suggesting that drainage may have no or marginal effect on basin flooding. Two studies published following the disastrous 1997 flood, the IJC’s Living with the Red and the RRBB’s Drainage Inventory Team Report, include brief examinations of the question of drainage as part of their efforts to review the overall state of the basin. Some of the conclusions about basin agricultural drainage drawn by these two reports follow:
• High topographic relief in upper portions of the basin results in some naturally occurring drainage from upper to lower portions of the basin. In many areas of the basin’s bottom, water does not drain into streams naturally and requires channels to reach streams.
• Practices of drainage date back to the late 1800s, especially post-1885, when railroads constructed drains to protect their routes and agricultural acres. These practices expanded to include less well-drained land as more settlers arrived. Drainage practices peaked in the 1800s and early 1900s, declined and came to a halt in the 1920s and 1930s, then gradually arose again in the 1940s. States began regulating on-farm drainage in the 1950s, strengthening restrictions in the 1970s and after to include awareness of downstream and environmental impacts.
• The states of Minnesota and North Dakota have somewhat different terrain (Minnesota has more marsh area); as a result, the two states have taken somewhat different approaches to legislating drainage practices.
• Downstream effects may depend on the timing of drainage. Drainage in the upper reaches of some watersheds (such as the upper Sheyenne River subbasin) generally reaches the Red River well after the main stem peaks (late water) while drainage in the lower downstream watersheds (such as the Two Rivers subbasin) flows into the Red River ahead of the main stem peak (early water). Therefore, drainage in the middle watersheds is more likely to add to the main stem peak.
• Drainage ditches in the basin are designed for both spring runoff and summer rain events (the latter can cause the most damage to crops). The majority of ditches have capacity for relatively small events of 10-year or 24-hour floods.
• During large flood events, the carrying capacity of most drains is exceeded; as a result, the drainage systems do not have a noticeable impact on large magnitude floods.
• Wetland storage may be beneficial for small floods but, by itself, is “unlikely” to reduce peak flood flows to any significant extent.15
The Red River Retention Authority (RRRA), in connection with its mission to reduce flood damages through retention, commissioned the International Water Institute (IWI) to establish an
14 John Wheeler, The Forum, Friday, July 22, 2011: A2. 15 Living with the Red, Conclusion 4, p. 25.

- 20 -
“objective and defendable process to study and better understand the role of [basin] drainage, its effects on peak flows, and explore ways to improve existing [basin] drainage policy.” In response, IWI formed a Basin Technical and Scientific Advisory Committee (BTSAC) comprised of hydrologists and engineers from identified stakeholder groups engaged with water management in the basin. The BTSAC is currently engaged in research and modeling efforts necessary to better understand the effects of tile drainage on peak flows, with a final tile management report anticipated in June 2012. Results will likely point towards a specific research agenda on questions surrounding the practice of drainage in the basin.
Nature of Current Risks and Challenges
It is an unmistakable fact that the Red River basin is subject to regular flood-level discharges and stages on the main stem and in tributary areas. Certain damage centers in the basin currently face unusually high risk.
The Entire Basin at Risk As noted, due to its origin, the Red River basin lacks the typical areas of elevation of river valleys. As a result, the basin’s larger urban centers and cities that developed relative to early trading/transportation sites on the main stem lack sufficient high ground and find themselves with large areas at high risk for flooding. The expenses and/or damages occasioned by flooding have been growing gradually since the turn to wetter conditions in the mid-1940s and have spiked since the1990s. As a result, very large costs of flood fighting without adequate permanent protection, in cities in particular, have to be absorbed not only by the cities but by their states and the federal government. In rural areas of the basin, where, after 1872, east-west rail routes encouraged development of the basin’s exceptionally rich, deep soils, one finds a related phenomenon. Communities developed along the rail lines to support the growing agricultural base and to host the grain elevators that would purchase and transport these agricultural commodities. Many of these communities, together with the farms they serve, lie in floodplain areas. As a result, many damage centers and repeat damage sites incur flooding costs. Even moderate-sized flood events routinely close transportation routes and bridges. In larger events, damage to township and country roads is typically widespread, and farmsteads/rural residences and whole communities can be isolated for weeks. Extensive overland flooding can cause hundreds of damage sites in a single county, with repairs often taking months, if not years, to complete. If flooding occurs in the summer as a result of intense rains, the area impacted may be smaller, but agricultural loss to growing crops much larger (see Appendix B, Exhibit B-8 for a profile of the summer flood of 1975 and Exhibit B-7 for a discussion of the summer flood of 2002). Whether in spring or summer, instances of erosion and sedimentation can compromise future productivity of eroded land and/or impact water quality.
Unique Challenges A resulting problem for a number of areas in the basin is the phenomenon of repeated damages. As examples, the Red Lake River at Crookston MN regularly overflows its banks, having reached estimated 75-year flood levels in 1969, 1997, and 2009. Wahpeton ND and Breckenridge MN were severely damaged by floods in 1989 and again in 1997. Ada MN has repeatedly sustained damage and was forced to evacuate most of its residents in 1997. The rural reaches in the area were damaged again in a summer flood in 2002, which also struck the Roseau area to the north. The Sheyenne River in North Dakota, which drains an exceptionally large area, repeatedly threatens communities such as Valley City and Lisbon, both of which

- 21 -
experienced extensive damages in the 2009 spring flood and were critically threatened again in 2011. To the north, the Red Lake, Roseau, and Pembina Rivers drain larger-than-average watersheds that pose ongoing hydrologic challenges, the latter two made more complex to address because of shared jurisdiction with Manitoba, Canada. Other damage centers, in most subbasins and along the main stem, could be cited. Adding to the challenge is the fact that every basin flood has its own character and pattern. At the same time that some areas incur repeated damages, one cannot altogether predict from one flood to the next which damage centers will bear the brunt of the flood. For instance, in a list compiled in 2000 by RRBB’s Flood Damage Reduction Inventory Team, of 20 major floods since 1882, seven of the floods considered major for Grand Forks-East Grand Forks were not among the major events for Fargo-Moorhead or Wahpeton-Breckenridge, and two of the major floods at Wahpeton-Breckenridge were not among the major floods for Fargo-Moorhead, just 60 miles away. The following table compiled for the LTFS study listing the top 11 historical floods16 at four locations on the Red River main stem captures such variations among sites. Although the 1997 spring flood was the largest or second largest event for all four locations, second and third-largest floods for the four locations include 1950, 2006, 2011, and 1897. Once beyond the first, second, and third largest floods, the variation among floods at the sites becomes even greater (see Appendix B and Table B-7 for more detailed analysis). Top 11 Floods – Red River Main Stem
16 The table includes three simulated design floods, the 100-, 200-, and 500-year events, for added perspective.

- 22 -
Flooding in tributary areas can also differ from flood to flood. Areas of the basin that do not have a history of overland flooding can find themselves surprised by new patterns of overland movement. And because summer floods are likely to occur from specific occurrences of heavy rainfall, they can occur anywhere. The primary variability that occurs with summer flooding is between areas along the main stem and tributary areas. As illustrated in the following figure (see Appendix B and Figure B-8 for additional discussion), tributary areas are more likely in general to experience their larger floods as summer events, while areas along the main stem tend to experience their largest floods in the spring. The figure illustrates this tendency in its comparison of the number and size of spring and summer floods for three points on the main stem and five tributary areas. While summer floods do not rank among larger floods for main stem sites, they do rank as the larger events at tributary sites, with two of the five tributary sites having a summer flood as their largest flood event. Although the most obvious variation is between main stem and tributary areas, variation also occurs among the tributary summer flooding events, with total numbers of floods at tributary sites ranging from 8 to 75 and the size of largest flood ranging from less than 10-year to 500-year (see Appendix B, Figure B-8). Comparison of Spring Snowmelt and Summer Rainfall Floods – Red River Basin
Areas of Extraordinary Risk The IJC report following the 1997 flood pointed out specific communities and cities that required permanent protection measures to reduce their considerable risk. In a number of instances, including Wahpeton-Breckenridge, protection measures for initial goals of protection are in place

- 23 -
or currently underway. However, two situations in particular remain extraordinarily risk-laden: Fargo-Moorhead and the Devils Lake region. Fargo-Moorhead Fargo-Moorhead is an area of high risk based on potential damages and resulting costs to government if the area is inadequately protected for a future major flood, its condition at this time. The recent USACE Feasibility Report to determine flood protection alternatives for the Fargo-Moorhead area points out that although Fargo and Moorhead have managed successful flood fights in the past using temporary emergency measures, such successes may contribute to an unwarranted sense of security, one that does not reflect the true flood risk in the area. The USACE concludes that the probabilities for such emergency flood fights to continue to be successful for Fargo-Moorhead are “very low.” A senior planner with USACE’s St. Paul District reported to the team of experts called together to determine the more accurate hydrology for Fargo-Moorhead that “both the 1997 and 2009 flood events came close to overwhelming the [two cities’] emergency levee systems.” With current levels of protection, the planner explained, a 500-year flood event would inundate the city of Fargo and a large portion of Moorhead (see Appendix B, Exhibit B-11, p. 27). Estimates for damages to the cities from a lost flood fight at this urban center range from $2.5 billion for a 100-year event to nearly $9 billion for a 500-year event (see Chapter 4 for more details). The gravity of the situation for Fargo-Moorhead is underscored in USACE’s inclusion of estimated relocation costs for the cities in its Feasibility Report.17 Devils Lake A second instance of immediate risk, and of potential risk to a large section of the basin, is the rise of waters in the Devils Lake subbasin. The Devils Lake subbasin is considered a closed subbasin, a condition that is true until its water levels reach an elevation of 1458 feet, at which point, as illustrated by the following figure, it would reach its current natural overflow level. Devils Lake has risen an extraordinary 32 feet since 1993. The rise has flooded about 150,000 acres of land, most privately owned. These flooded areas have remained flooded—the land first flooded in 1993 remains flooded today and will remain under water for years, if not decades, in the future (see Appendix B, Exhibit B-1 for a PowerPoint overview of the Devils Lake subbasin). The inundation by Devils Lake also threatens the subbasin’s cities and rural residents. The threat of flooding resulted in a Federal Emergency Management Agency (FEMA) buyout of the town of Churchs Ferry, and the town of Minnewaukan is currently at a significant risk that could result in buyout or relocation. The city of Devils Lake is protected by a long dam/levee at a cost of over $100 million. That levee/embankment has gone through a series of raises and extensions in response to forecasted water levels and risk assessments. Due to the magnitude and duration of water against what started as a levee, enhancements to the earth embankment have been designed as a dam meeting dam safety criteria. An alternative to increasing the size of the large levee is to pump water out of the much-enlarged lake. Although this solution can reduce the risk of a catastrophic breakout of Devils Lake waters into the Sheyenne River, it poses several other effects: 1) additional flows in the
17 See Supplemental Draft Feasibility Report and Environmental Impact Statement, April 2011 (Appendix C, Exhibit C-4). In the report, the estimated cost of $4.7 billion for a “nonstructural” plan for Fargo-Moorhead cannot be read as comparable to a full relocation cost. The plan does not include costs for lost or new infrastructure or for regional or local damages not covered in National Economic Development (NED) damage numbers. To put the estimate in perspective, the estimated NED flood damages to the Fargo-Moorhead area from a 500-year event are in excess of $7.5 billion.
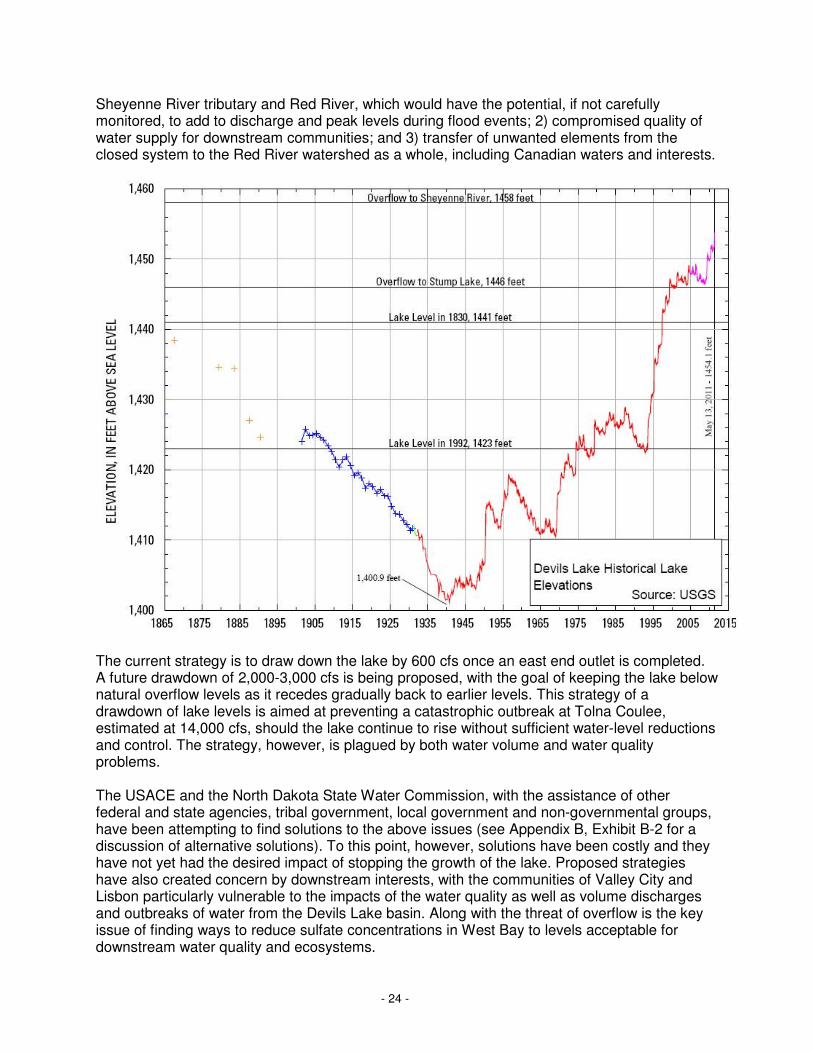
- 24 -
Sheyenne River tributary and Red River, which would have the potential, if not carefully monitored, to add to discharge and peak levels during flood events; 2) compromised quality of water supply for downstream communities; and 3) transfer of unwanted elements from the closed system to the Red River watershed as a whole, including Canadian waters and interests.
The current strategy is to draw down the lake by 600 cfs once an east end outlet is completed. A future drawdown of 2,000-3,000 cfs is being proposed, with the goal of keeping the lake below natural overflow levels as it recedes gradually back to earlier levels. This strategy of a drawdown of lake levels is aimed at preventing a catastrophic outbreak at Tolna Coulee, estimated at 14,000 cfs, should the lake continue to rise without sufficient water-level reductions and control. The strategy, however, is plagued by both water volume and water quality problems. The USACE and the North Dakota State Water Commission, with the assistance of other federal and state agencies, tribal government, local government and non-governmental groups, have been attempting to find solutions to the above issues (see Appendix B, Exhibit B-2 for a discussion of alternative solutions). To this point, however, solutions have been costly and they have not yet had the desired impact of stopping the growth of the lake. Proposed strategies have also created concern by downstream interests, with the communities of Valley City and Lisbon particularly vulnerable to the impacts of the water quality as well as volume discharges and outbreaks of water from the Devils Lake basin. Along with the threat of overflow is the key issue of finding ways to reduce sulfate concentrations in West Bay to levels acceptable for downstream water quality and ecosystems.

- 25 -
Citizens’ Reports
One of the first steps performed by the RRBC for the LTFS study was to obtain first-hand information about flooding from basin residents. A series of 21 community meetings across the US portion of the basin following the 2009 flood revealed some of the struggles individuals and communities experience as a result of repeated flood events. It is not surprising to find that citizens feel helpless in the face of flooding. Many find flood forecasts a mystery relative to their location and as coming too late to give adequate response time. Citizens also find each flood different from the last, and thus unpredictable. Vulnerable populations, especially those who have experienced relocation during a flood event, report their fear of having to repeat the experience. Citizens’ responses also made it clear that many are tiring of fighting floods. Many found the 2009 flood to follow too soon after the traumas of the 1997 flood—and then they found themselves faced with large floods again in 2010 and 2011. Public meeting feedback documents that recent floods have left many ready to “throw in the towel.” Citizens reported at the public meetings that they find flood insurance costly, and many find FEMA practices hard to understand. Overall, the large amounts of money, funding, and time it takes to hold back flood waters and/or repair their damages are concerns at every level. City, township, county, and state officials and agencies find themselves challenged too frequently with months—even years—of infrastructure repairs following damaging floods. Despite citizens’ appreciation for the good help that came from the National Guard, USACE, student populations, and others, the 2009 flood brought a new round of fear, especially in the southern portions of the basin. With the 2010 and 2011 spring floods following without pause, the realization of the high financial and social/emotional costs of flooding in the Red River Basin has indeed come into sharp focus (see Appendix E-1.1 for full report on public meetings).

- 26 -
2 Past Responses and Today’s Challenges
Many efforts have been made to address flooding issues in the Red River basin. Attempted federal major projects and initiatives in the 1940s and 50s showed that the federal government was aware that the basin’s flooding needed to be addressed. And state-based programs have funded flood risk reduction projects for many decades. In the basin, each new major flood, particularly those of 1950, 1969, and 1979, gave impetus to action. However, no single flood caught the undivided attention of the entire basin so much as the spring 1997 flood, which forced the states of Minnesota and North Dakota and agencies at every level to improve their responses. Following the flood, unprecedented investments were made as communities introduced or added to their local site protection. New nonstructural approaches to floodplain management were undertaken as urban centers, towns, and counties were faced with decisions about removing damaged structures from flood flow areas. And efforts at floodwater retention were spurred. To get a glimpse of the variety of proposed efforts that followed the single large flood of 1997, one can review the plethora of recommendations in the 2000 IJC report, Living with the Red. Follow-up reports to the original have tracked progress on the recommendations and found “significant” or “some” progress having been made on a majority of the recommendations. Participants in the RRBC’s LTFS study agree with the IJC’s conclusion that the phenomenon of basin flooding is of large magnitude in both its extent and its effects on the basin. The participants also agree that a variety of measures are necessary to reduce flood risk in the basin—that no single measure by itself can address basin flooding. The LTFS study goes beyond the IJC’s findings in its efforts to identify and explore larger basin-wide approaches and solutions to flooding. The first step of the study was to review how Red River basin flooding has been addressed in the past, together with the challenges those efforts have faced.
1930s - 1950s
The decades of the 1930s and 40s brought several federal flood control acts that were applied in the Red River Basin for decades to follow. The first US-wide act in 1936 authorized engineering of a variety of structural flood-protection measures by USACE, including dams, levees and other flood control measures. The Flood Control Act of 1944 enlarged the flood-protection budget, authorizing thousands of dams and levees across the US. A turn to smaller projects was taken in the 1948 Flood Act, which authorized minor flood control projects to proceed without individual Congressional approval.
Federal Projects: Dams and River Channels Not surprisingly given the early federal emphasis on structural solutions to flooding, the 1930s and 40s saw the construction of dams in the Red River basin. In the 1930s, most tributaries saw the addition of one or more small-capacity dams, most built as Works Progress Administration (WPA) projects. Starting in the 1940s, the US Soil Conservation Service (SCS), now the Natural Resource Conservation Service (NRCS), built several watershed dams in the basin providing local flood control and other benefits. The USACE built several larger-capacity multiple purpose

- 27 -
dams during these years, including the White Rock Dam in South Dakota (1948), Baldhill Dam in North Dakota (1951) and Orwell Dam in Minnesota (1953). The following figure (see Appendix D and Figures D-3, D-4, and D-5 for further discussion) captures the phenomenon of this quick rise in the 1930s and 40s of the federally led effort of dam building on the Red River’s tributaries. Total Flood Strategies in the Red River Basin (1900-2010)
The federal dam building program, however, did not anticipate fully the basin’s needs to manage excess water. Many dams built in this era were for multiple purposes or for purposes other than flood control. WPA dams were often built for fish and wildlife or similar purposes. The SCS/NRCS dams were built as local watershed flood control purposes and not as flood control for the Red River. Baldhill Dam, while a large USACE project, was built primarily for water supply. As originally designed, the entire storage behind Baldhill Dam was allocated to water supply, and its only flood control benefits resulted from early spring draw downs of the conservation pool and limited surcharge storage resulting from raising the gates. Although a five-foot raise specifically for flood control was recently completed, Baldhill Dam’s flood control capabilities remain limited. The dams from this earlier era that were built for flood control were designed to specifications and purposes for smaller floods and thus have limited effectiveness for larger events. These water-storage and flood-protection structures put into place in the 1930s and 40s would have provided the benefits anticipated at the time, and many have continued to offer local benefits to areas of the basin. However, because the time from 1900 to 1940 was a generally dry period, most of the structures were built to address floods that by today’s standards are the smaller,

- 28 -
more frequent events. Many recent flood events have considerably exceeded the flood events that were the basis of design for many of these projects. In addition, today’s available computer modeling tools, which can determine how placement of impoundments and timing of flows impact the flow on the main stem, reveal that the early impoundments were not typically placed to hold floodwaters that contribute to peak flows on the main stem The first attempt at a federal comprehensive plan for the US portion of the basin occurred in 1948. The USACE’s plan included, along with the Orwell Reservoir, channel improvements on the Red River’s tributaries and levees and floodwalls for larger population centers. The plan, particularly the channelization, had uneven support by local areas, and USACE eventually halted the bulk of its work on the project.
1960s – 1990s
The 1960s – 1990s saw a transition away from federal leadership on structural projects, along with new levels of awareness of the need to protect environmental resources. Delays and gaps in response resulted as states and local entities looked for ways to pick up leadership roles in addressing flooding issues and mitigating flood damage while addressing new environmental concerns. At the same time, basin flooding became an unmistakable pattern and problem during the decades of the 1960s – 1990s. Numerous efforts on both structural and nonstructural fronts were attempted to address flood issues during these decades, and efforts were begun to transition from federal to local and state leadership in reducing flood risk.
Delays in Structural Solutions As noted above, the federal government had responded to Red River basin flooding with an ambitious program of projects as early as the late 1940s. Federal awareness of the severity of Red River basin flooding continued into the 1950s, reinforced by a large basin flood in 1950. In 1957, Congress singled out the basin with a recommendation to USACE to come up with solutions to Red River basin flooding. Attempts to address the problem by federal structural projects continued in the following decades. The late 1960s and again the late 1980s saw attempts to provide local site protection to larger urban areas. Many of these attempts did not move ahead, whether due to not meeting cost-benefit ratios, difficult permitting processes, or lack of interest. The devastation that the 1997 flood brought to areas throughout the basin, in particular to the twin cities of Grand Forks and East Grand Forks and Wahpeton and Breckenridge, was a dramatic illustration of the result of the years and decades of delay in responding to the serious flood risks in the basin. A current instance of such delays is the metropolitan area of Fargo-Moorhead. The recommendation for levees to protect Fargo in the 1948 federal legislation took until 1967 to move into planning mode. At this point, the proposed levee project was determined to fall short of federal guidelines for economic feasibility, and most segments were dropped from consideration. It took until 1987 for another attempt to be made to add permanent flood protection in Fargo-Moorhead. This time, federal, state, and local interests worked together in an attempt to develop viable solutions to water and related land resource problems in the two cities and surrounding townships, but, again, levees were not constructed. With the help of USACE, Fargo-Moorhead is once again engaged in the process of determining the feasibility of local site protection. Similar delays in projects occurred in other parts of the basin, most notably after the National Environmental Policy Act (1969) and Clean Water Act (1972) added requirements for more

- 29 -
formal analysis of impacts. Goals to ensure the nation’s ecological well-being brought delays and ends to many flood-related projects that had formerly been supported with federal funding.
New Nonstructural Efforts The decades of the 1960s – 1990s introduced or reinforced a number of nonstructural approaches to flood damage reduction. By the 1950s, the states of Minnesota and North Dakota were demonstrating their growing awareness of potential impacts of drainage practices. Minnesota passed legislation creating a state Water Resources board and watershed districts (1955). The legislation also contained provisions that increased the size of the pool of petitioners to initiate a drainage projects and required counties to evaluate the effects of drainage. North Dakota legislated drainage laws requiring permits to construct projects that drained more than 80 acres (1957). In the 1970s, the two states added teeth to their legislation in response to Environmental Protection Agency’s (EPA) requirement that project sponsors for any project consider alternatives, including nonstructural approaches. In 1975, North Dakota strengthened its drainage regulations with legislation granting the right to prosecute landowners who drained without a permit and requiring local governments to consider impacts of drainage on downstream areas and natural resources. Minnesota instituted the Environmental Policy Act in 1973, which created a review program for determining environmental impact of drainage projects. In 1987 and 1991 respectively, North Dakota and Minnesota legislated “no net loss” requirements for wetlands (North Dakota repealed the law in 1995). At the federal level, the National Flood Insurance Act (NFIA) was enacted in 1968. The new program made available to communities and individuals a new nonstructural approach to flooding in the form of low-cost flood insurance. With this state-administered program, communities could make their residents eligible for the subsidized flood insurance by adopting basic floodplain ordinances that would help minimize risk of flood damage for future developments. Despite these many attempts to mitigate flood damage in the basin on both structural and nonstructural fronts, progress was slow from the 1960s to the 1990s. Structural projects continued to see delay, due to lack of interest in some instances and failure to meet criteria in others. Nor did the states’ communities universally embrace and institute nonstructural measures such as those offered by the NFIP. Of the many efforts that did move forward, most were carried out largely as individual endeavors rather than basin-wide coordinated efforts.
Looking for New Ways to Move Forward By the 1960s, a pattern of basin flooding was becoming clearer. Large magnitude floods hit in three of the next four decades, prompting citizens to organize to find ways past roadblocks in addressing flooding. In the 1990s, the basin saw flooding that resulted in catastrophe. Looking for New Ways to Organize The decades of the 1960s – 1990s saw a shift of lead responsibility from federal to local and state levels for carrying out flood risk reduction. The decades also saw a spontaneous organizing effort by citizens to confront the basin’s flooding issues.
From Federal to State and Local Leadership That a significant shift in leadership in responding to basin flooding occurred during the decades of the 1960s to the 1990s is apparent from the dramatic shift in lead implementer for basin

- 30 -
storage projects. This shift is captured in the following figure, which describes existing storage in the basin by implementing agency between 1909 and 2000 (see Appendix D, Figure D-3). The role of federal agencies as lead agent declined from a high of over 93% in decades from 1910 – 1979 to 30% or less from 1980 – 2010. Flood Storage in Red River Basin by Implementing Agency
With the federal role diminished, a vacuum of sorts developed in making headway against the basin’s flooding problems. Two actions are telling commentaries on the situation. First is the assumption of the USACE’s major Red River of the North Basin-wide Reconnaissance Study of 1980 that, despite the series of basin floods in the 1970s, USACE could offer no comprehensive plan or set of projects for long-term flood damage reduction for the basin. The Summary Report of the USACE study concludes that new models of leadership in flood mitigation efforts are necessary. In specific, the report states with some urgency that local and state levels must step into the role of primary implementors. A second telling sign of a perceived lack of headway against basin flooding was the spontaneous organizing of citizens following the spring flood of 1979. The 1979 flood seemed the last straw for many, coming as it did upon the heels of two decades of recurring flooding. The resulting major citizen effort to address the flooding problem resulted in the formation of The International Flood Coalition, a predecessor organization to The International Coalition for Land and Water Stewardship in the Red River Basin (TIC) and to the current RRBC.
Locals and States Take the Lead Along with this energizing citizen effort, other local and state initiatives were forwarded in the decades of the 1960s, 70s, and 80s. Communities began building levees; some flood-prone homes and structures were removed from floodplain areas; states began stepping in, as seen by Minnesota’s 1987 Flood Damage Reduction Grant Assistance Program and by North Dakota’s Flood program administered by the State Water Commission (SWC), both of which supported rural ring dikes along with other rural protection measures. The following figure, which depicts basin storage sites constructed between 1960 and 2010, shows that work has

- 31 -
continued on retention since 1980 even after federal agencies reduced their lead roles (see Appendix D, Figure D-5). Noteworthy are the retention efforts of the Red River Watershed Management Board (RRWMB). This organization of nine Minnesota basin watershed districts was formed in 1976 with the express purpose of funding flood damage reduction programs and projects. Through the RRWMB, 35 projects ranging in size from 100 to 30,000 acre-feet were constructed between 1976 and 1992, and that construction has continued to the present. Flood Storage Constructed Since 1960 in Red River Basin
During this same time period, North Dakota made several attempts to pass legislation to form water resource districts along the lines of watershed boundaries. Although these attempts were unsuccessful, several joint boards were formed to help forward projects: the Red River Valley Joint Water Resource District Board, the Upper Sheyenne Joint Water Resource District Board, and the Devils Lake Joint Water Resource District Board. Finding Ways Past Roadblocks Local work did not go forward without obstacles. The 1990s saw gridlock in Minnesota on permitting that slowed progress on implementing flood damage reduction projects. As a result, the RRWMB, on behalf of local water districts, challenged in state district court a generic environmental impact statement prepared by USACE and the Minnesota Department of Natural Resources (DNR). A mediation process authorized by the Minnesota Legislature resulted in the Red River Basin Flood Damage Reduction Work Group Agreement (1998). The agreement outlines a process for project review and permitting that links goals for flood damage reduction to natural resources management goals. The many points of the carefully drawn compromise reflect the complex issues surrounding solutions to basin flooding problems.
- 32 -
Surviving Catastrophes and Near Catastrophes Despite local, state and federal efforts throughout the basin to reduce flood risk in these decades, as late as the 1990s and beyond, major population centers remained partly or wholly without permanent protection. Those protection efforts that were in place were not formulated into any comprehensive plan for the full basin. A disconnect among areas in the basin continued, along with a seeming forgetfulness and underestimation of the degree of the problem. For instance, when Winnipeg experienced a catastrophe after losing a major flood fight in the spring flood of 1950 and subsequently took action to construct a large flood diversion channel around the city, the other major population centers did not take heed when it came to putting adequate protection measures into place. This lack of protection took its toll on Grand Forks-East Grand Forks in 1997 when it faced a flood crest of 54.5 feet, which overtopped levees by over 2 feet. Those levees included both permanent and temporary emergency levees erected during the ultimately unsuccessful flood fight. The resulting flood left both Grand Forks and East Grand Forks almost entirely inundated, and with catastrophic damage. During the 1997 flood, Fargo had only partial permanent levees constructed in 1963 that were designed to handle stages from 30 to 42 feet, with most below 37 feet. When a crest of nearly 40 feet materialized, only a major flood fight saved the city from inundation. Substantial permanent protection was still not in place in 2009 when the record-breaking crest of 40.82 feet, a foot higher than the 1997 flood, was experienced. In 2009, and in the following two spring floods in 2010 and 2011, Fargo-Moorhead was saved from catastrophic damage primarily by extraordinary human effort constructing last-minute temporary measures.
Post-1997
The spring flood of 1997 left its mark almost everywhere in the basin. This was the third largest flood on record for Winnipeg and the largest flood on record for Emerson, Grand Forks-East Grand Forks, Wahpeton-Breckenridge, and, until 2009, Fargo-Moorhead. As noted, the IJC’s major report that followed this flood included an exhaustive collection of recommendations, some for specific sites, others for more general measures throughout the basin. Since that time, many, though not all, population and/or damage centers have built additional protection. Development of technological tools that yield more accurate data about land elevations, stream flows, and flood forecasting has advanced. Projects to impound floodwaters continue to be developed on a local basis, and an effort to organize basin natural resource management by developing goals and objectives across jurisdictional boundaries was initiated. Brief descriptions of these efforts follow.
Protecting Individual Damage Centers Efforts to build dikes and levees to protect damage centers, whether large population centers, smaller towns, or farmsteads, have given many communities and individual property owners some level of protection from floodwaters. These efforts are typically assisted with federal and/or state funding, e.g., Minnesota’s Hazard Mitigation funding or North Dakota’s cost share assistance through the SWC. Following the 1997 flood, a special initiative to support ring dikes via the federal Farm program’s Agricultural Water Enhancement Program (AWEP) and other

- 33 -
NRCS programs18 was added to state and local efforts. The combination of federal, state and local funding sources and, in some instances, assistance by USACE, have allowed progress to be made since 1997 on this front of local site protection.
Developing Technological Tools The flooding experience of 1997 also spiked interest in speeding the development of technological tools. Among the recommendations by the IJC were a number promoting improvements in data and decision support, hydrologic and hydraulic modeling, and flood forecasting. Recent analysis of progress on the report’s recommendations reveals that progress has been significant on most of the technological fronts. Some of the specific areas addressed since 1997 include:
• Transition by the US Weather Service to a new flood-forecasting system, • Acquisition of LIDAR data for the entire US portion of the basin, together with some parts
of Manitoba, with mapping capabilities being made accessible to users over the internet, • Completion of the MIKE 11 hydraulic routing model for the entire US and Manitoba
portions of Red River main stem, together with its application in analyzing scenarios for flow reduction on the US side, and its continuation for the remainder of Manitoba,
• A completed HEC-RAS hydraulic model for the US portion of the basin, and • Subbasin HMS hydrologic modeling on the US side now in process of development and
completion. In addition, culvert and road elevation information has been gathered at the international boundary on the border road/dike County Road 55 in North Dakota and the parallel township road, the 2-D Telemac model development and scenario analysis is underway at the North Dakota and Manitoba area of the international boundary, and data is being collected on river flow at additional monitoring sites.
Retention Efforts Work on impoundments has also progressed since 1997. On the Minnesota side of the basin, the RRWMB, aided by its negotiated agreement with the state, has continued to support small- to mid-sized floodwater impoundment projects, to a total of 140,000 acre feet by 2010. On the North Dakota side, two larger floodwater impoundments have been put into place. A five-foot raise of the Baldhill Dam pool (2004), with USACE as lead agency, added 30,800 acre feet of storage, and construction of the Maple River Dam (2006), with the Cass County Joint Water Resource board as lead agency, added another 60,000 acre feet. The Maple River Dam has already contributed “significant” reductions to downstream flooding in the 2009 spring flood19 as well as in the 2010 and 2011 floods. The dam took two years to construct—it took several times the two years to achieve permitting and right-of-way acquisition to begin construction.
Current Challenges
The detailed map of the overall basin developed by RRBC for the LTFS study (Appendix A-Map 2) illustrates the challenge of addressing basin flooding, affecting as it does three states and a province and numerous counties/municipalities and communities. Stepping up to that challenge and moving ahead requires two initial steps. First, it requires changing the thinking about the size of basin flooding to plan for the eventuality of potential floods of even larger magnitude than those recently experienced. Second, it requires identifying and addressing impediments and challenges to achieving the best comprehensive solutions for the basin.
18 The federal support was made available following the 2009 flood as well. 19 Moore Engineering, “Maple River Dam” (handout for public presentation).

- 34 -
Planning for Larger Magnitude Floods Efforts in the past to respond to issues of basin flooding have contributed to reducing flood risk in the basin. But many of the efforts have underestimated the frequency and potential magnitude for basin flooding. The historical lake elevations for Devils Lake are clear signs that the Red River basin is experiencing historic water highs. If one thinks of the water levels in the closed basin of Devils Lake as a barometer for the basin’s water conditions as a whole, one can appreciate the potential for even larger magnitude floods in other parts of the Red River basin. Given these conditions, thinking in terms of major floods must drive response to and planning for flood damage reduction in the basin. This important point is underlined in the 2009 follow-up analysis to the IJC report of 2000, which advises the use of the 500-year rather than the 100-year interval flood as the measure by which we plan for the future of the basin.20 Planning for flood mitigation at these levels means that we need to use all tools at our disposal. It means that we need to take new looks at both structural and nonstructural methods—and find ways for them to complement one another. And it means that planning and implementing strategies must be basin-wide efforts.
Overcoming Impediments to Mitigating Flood Risk To move ahead, impediments to cooperative basin-wide flood risk reduction planning need to be identified and addressed. A first step in determining current impediments was initiated in 2002 by the RRBC as part of a study that set out to recognize the effects of water managers’ individual actions on the basin, together with the challenge that advancement in water management faces in the basin. As a first step in that study, dozens of water managers and policy makers throughout the basin were interviewed and asked to identify challenges to water resource management. A draft inventory report of the results was issued by RRBC in 2003 under the title, Problems, Impediments, Roadblocks and Challenges. That report categorizes responses by water managers into historical, communication, jurisdictional and political challenges. The LTFS study participants used this earlier study as a jumping off place to seek information specific to impediments to flood damage risk reduction. A group consisting of two water and soil professionals representing Minnesota and North Dakota, a water manager, and the assistant director of the LTFS study solicited feedback from watershed administrators in the basin and subsequently from relevant state and federal agencies. The latter included USACE, FEMA, EPA, MN DNR, the office of the North Dakota State Engineer, the North Dakota Department of Health, the Minnesota Board of Water and Soil Resources (BWSR), and the Minnesota Pollution Control Agency. The resulting LTFS report, Challenges to Progress Towards Flood Mitigation Efforts in the Basin of the Red River of the North (2011), indicates first of all that it found diverse perspectives—that most points called forth varying opinions and perspectives. However, the study group found a number of reoccurring themes throughout the basin. In brief, these include the following:
• There is much frustration with agency bureaucracy, exacerbated by multiple offices of the same agency within the basin.
• Watershed managers continue to express that red tape and delays with the permitting process impede progress with projects.
20 How are We Living with the Red? A Report by R. Halliday & Associates to the International Red Board, 2009, p. 12 (full report available in Appendix E, Exhibit 6.3).

- 35 -
• A shortage of on-going funding for potential projects is a significant roadblock. • A perceived inflexibility with government agency policies, standards, and regulations
hinders advancement in the basin. • Local challenges and issues can have the biggest impact on the progress of water
management. 21
These initial steps to identify barriers to developing and implementing flood solutions need to be further explored to identify best solutions and expanded to include more detailed consideration of barriers to nonstructural strategies. Solutions will require creative approaches to prioritizing and expediting projects, including new ways to work across jurisdictional lines (e.g., organizations such as the RRRA operating across state lines and/or single or co-located USACE and NRCS basin offices).
21 See Appendix E, Exhibit E-4 for full report.

- 36 -
3 Long Term Flood Solutions Study
In response to flood history and the record-breaking flood of 2009 in the Red River basin, the Minnesota and North Dakota state legislatures appropriated $500,000 each for a study to be done to address long-term flood solutions for the Red River basin.22 The RRBC was charged with the task of carrying out the study. The legislative charges to the RRBC from the states of Minnesota and North Dakota specify the following guidance:
Minnesota: To develop, in consultation and cooperation with all boards and commissions involved with water management and flood prevention and control in the Red River basin, a comprehensive plan of action to address, mitigate, and respond to flooding and related water quality and land conservation issues in the Red River watershed. The plan must take into account previous federal, state, provincial, regional, and local assessments and make specific recommendations for floodplain management goals and outcomes for the Red River basin including structural and nonstructural measures, wetland restoration, water storage allocations by major watershed, and designation of roles and responsibilities and time frame for implementation. North Dakota: Evaluate, in conjunction with state, local and federal officials and entities, long-term flood control solutions in the Red River valley.
In addition, the Minnesota guidance stipulates that the funds can be used for grants, contracts or agreements with the RRBC, that remaining monies may be used to implement the plan, and that the appropriation is contingent on the state of North Dakota contributing at least an equal amount. It also asked that an interim report be submitted to the legislature by January 15, 2010. The study that emerged from this charge, the LTFS, is aimed at the ambitious goal of comprehensive, basin-wide strategies to reduce flood damage risk in the Red River basin. This chapter will provide a brief overview of that study: its scope, timeliness, participants and structure, and primary emphases.
Scope of LTFS Study
The RRBC’s LTFS study lays the groundwork for an organized, coordinated response to the problems of flooding and flood damage throughout the Red River’s Minnesota, North Dakota, and South Dakota subbasins. At the same time, the project holds in perspective the Canadian portion of the basin. The process, documents and recommendations of the LTFS study were considered and approved by the full board of the RRBC, including its Manitoba delegation.
22 The Minnesota appropriation was contained in the Capital Investment Finance Bill (Session Laws 2009 Chapter 93) through the Board of Water and Soil Resources (BWSR). BWSR approved this funding on June 24, 2009. The North Dakota appropriation was made available through HB 1020, Sec. 9 – SWC projects. In both states, the funds were made available July 1, 2009, with North Dakota stipulating an ending date of June 30, 2011.

- 37 -
The implementation of the report’s recommendations is projected over two decades. For that reason, relevant likely future conditions for that span of time and beyond were identified. Those follow:
Assumptions for Future Conditions23 1) Agriculture will continue to be the dominant land use throughout the basin. Adequate
surface drainage has been and will continue to be integral to maintaining productivity of cropland. Subsurface drainage is likely to become increasingly popular.
2) Current development trends will continue into the foreseeable future. The major urban centers and communities will continue in their present locations. The major metropolitan areas will continue to grow. Future development will occur in compliance with floodplain management regulations.
3) Floods will continue into the future. Floods larger than historically experienced can be expected to occur.
4) Flood damage reduction will need to be implemented in the basin based primarily on the identified needs of basin residents and their willingness to provide or seek funding necessary to implement the measures which they believe are appropriate, effective, and justified. State and federal agencies will support the implementation of the various measures based on their policies, regulations, and availability of funding.
5) Flood damage is just one issue that affects the sustainability of the region. Other key resource issues need to be considered as this plan is developed and implemented, including droughts, water supply, water quality, recreation, and other natural resource areas.
Timeliness of LTFS Study
The basin has made numerous attempts in the last half century, particularly post-1997, to alleviate the damages brought about by basin flooding. Given the size of the basin and the extent of flooding, these attempted solutions have emerged out of an array of efforts. Most often, flooding issues have been analyzed on a local or subwatershed basis rather than from a basin-wide perspective. The multi-jurisdictional nature of the basin has also limited basin-wide approaches to planning. Thus, attempted solutions have typically been partial, whether by the area of the basin they affect or in the degree of protection they offer, or both. The current study comes at a time when circumstances promise to support more comprehensive planning in flood risk reduction for the basin. That promise comes first from the development and availability of technological tools that allow more detailed and complete understanding of the basin’s lands and waters. These include, among others, real-time access to stream gaging data, LIDAR elevation information, and uniform hydrological and hydraulic models. The promise comes as well from growing political will to work together as a basin. The complementary legislative guidance from the states of Minnesota and North Dakota is itself a sign of that political will. So, too, is the recent establishment of the Red River Retention Authority (RRRA), the first joint water(shed) board to organize across the state lines of North Dakota and Minnesota.
23 The Assumptions for Future Conditions were developed by the LTFS Policy Committee and adopted by the RRBC board of directors in May 2010.

- 38 -
That technological tools can help resolve issues even over federal boundaries is illustrated by the sophisticated modeling efforts in the internationally shared Pembina River subbasin that are being used to find answers to a flood-related disagreement (see Appendix B, Exhibit B-10 for a description of the Pembina Telemac model). Efforts are also ongoing via the RRBC to encourage the use of uniform technological tools between the US and Canadian portions of the basin.
LTFS Study Participants
RRBC compiled information for the LTFS study on flooding and flood damage mitigation from a variety of participants: 1) residents of the basin, 2) professional water managers from local, state, regional, and federal levels, and 3) outside experts who brought their extensive professional experience to issues of Red River basin flooding.
Participation of Basin Residents Very importantly, the study began and ended with grass-roots perspectives. The study was launched with an extensive public engagement process of 21 public flood forums held in the Minnesota, North Dakota, and South Dakota portions of the basin, with more than 1,000 attendees in total. Citizens’ experiences, problems and concerns with flooding in the basin were solicited, together with suggestions for solutions. The public input helped shape the study’s committees and identify issues to be explored. A second series of public meetings was held in spring of 2011 to gather feedback from citizens on the study’s conclusions. That feedback helped guide the final conclusions and recommendations. In addition, citizens were encouraged throughout the process to complete surveys to convey their experiences with flooding and their willingness to support particular solutions (see Appendix E, Exhibit 3.1 for compilation of public surveys). Efforts were made to collect information on flood damages from local entities to identify the degree of unreported flood damages. Cities, townships, counties and/or watershed districts were given the opportunity and encouraged to complete a survey of damages, both reported and not reported to programs at other levels of government (see Appendix E, Exhibit 3.2 for city surveys and Exhibit 3.3 for watershed district (MN) and water resource district (ND) surveys).
Participation of Water Managers The LTFS study process brought together water managers from all governmental levels and from all reaches of the basin to identify key flood-related issues and consider alternatives for addressing flood damages. More than 35 representatives from more than 25 local, state, and federal agencies served on LTFS committees and work groups, sharing their expertise across lines of agency, city, county, watershed, state and country. The participants worked together on an Advisory Committee under one of two umbrella committees (Policy and/or Technical) and/or on specific issue workgroups. Multiple larger issues were considered and examined by the appropriate umbrella committee. More specific tasks or issues were given to work groups for examination. Work groups included: Principles, Downstream Impacts/Upstream Storage, Economic Impact, Evaluation/Prioritization, Funding, Challenges/Impediments, and Hydrologic Modeling.

- 39 -
Participation of Outside Experts A number of outside experts were contracted to provide information, analysis and/or development and application of models for central questions addressed in the study. Areas where outside professionals brought their expertise to the study included, among others, developing hydrologic and hydraulic descriptions of the full basin (US portion); developing, applying, and analyzing results of modeling tools; assisting with policy issues and economic analyses; developing systems to assist local water managers with project development and implementation; providing information and advice about the state-administered NFIP and other flood-related programs; and assisting with defining and assessing issues of floodplain management, whether land-use, legal or public safety. In some instances, outside consultants visited the basin multiple times and engaged directly with participants and/or with subbasin water managers in facilitating parts of the study process. Barr Engineering was selected as an outside party to provide guidance and direction to the LTFS Oversight Committee. Barr representatives assisted with public meetings, served ad hoc on the Policy and Technical committees, facilitated development of several key foundation documents, developed descriptions of potential for flooding and of existing and likely flood protection for communities throughout the basin, reviewed and presented updated USACE materials on costs of flooding, and compiled and analyzed hydrologic features of the basin as a way to address key questions regarding flow and retention. Barr also functioned as a liaison between the RRBC’s LTFS study and the USACE’s Basin-Wide Feasibility study. In addition, two engineering firms, JOR Engineering and Widseth Smith Nolting Engineering, tested the MIKE 11 Flow Reduction Strategy model with a full application to the Bois de Sioux Watershed District and partial applications to numerous other basin tributaries.
LTFS Study Oversight Oversight for the Long Term Flood Solutions study was carried out at several levels:
• RRBC Board of Directors: The 41-member board representing all parts of the basin in the states of Minnesota, North Dakota, and South Dakota and the province of Manitoba exercised its powers to implement the mission, administer the budget, and establish and assign tasks related to the LTFS study. It also considered and approved the study’s key documents and recommendations.
• Long Term Flood Solutions Oversight Committee: The Oversight committee consisted of the RRBC Executive Committee, together with the heads of the primary state/provincial water agencies of Minnesota, North Dakota, and Manitoba and a representative of each of the two state legislatures of Minnesota and North Dakota. The Oversight committee guided the overall process and oversaw its budget.
• Long Term Flood Solutions Advisory Committee: The Advisory committee assigned issues to subcommittees and/or specific topic work groups and reviewed all technical, policy and other recommendations.
Partnering Organizations More than 25 entities participated in the LTFS study. These included water agencies, government offices, cities and counties, non-profits and private firms. In addition, the RRBC cooperated with USACE on a number of efforts between the LTFS study and the USACE Red River Basin-wide Feasibility study. In particular:
• The RRBC funded Stage 6 development of the Red River Basin Decision Information Network (RRBDIN) by IWI. In turn, USACE funded Phase 2 of the LTFS’s contract with

- 40 -
Barr Engineering, the study’s primary consulting engineering firm. Because the RRBDIN is deemed a valuable option for flood solution efforts, the LTFS project was significantly advantaged by this 1:1 leveraging of funds.
• Main stem modeling capabilities were expanded by leveraging funds between the RRBC MIKE 11 model and USACE’s HEC/RAS model. Both the Red River main stem and its tributaries will benefit from the resulting valuable river flow information.
• As part of the LTFS planning, USACE agreed to update existing or develop a new Hydrologic Model System (HMS) that can be applied to all Minnesota and North Dakota subbasins at the same level of detail. The RRBC will use the HMS when it becomes available to model subbasin storage potential to determine targeted flood reduction goals for the subbasins and the main stem. In the meantime, the modeling has been done with the best model available in the area.
As noted above, IWI was contracted to complete development of Phase 6 of RRBDIN. The resulting information and tool will allow subbasins to move through the planning process for floodwater retention with fewer delays and more productive results.
Primary Methods
Although multiple methods were used to carry out the charge by the two legislatures to identify and evaluate long-term solutions to flooding in the Red River basin, three strong emphases characterize and distinguish the LTFS’s approach to carrying out the legislative charge: 1) the development of data, action guides, and tools that provide for basin-wide perspective and planning for the US portion, 2) consideration of all potential solutions and identification of several areas for more intensive consideration and analysis, and 3) the development of a comprehensive action plan for the US portion of the basin (when appropriate, there is reference to South Dakota and Manitoba, Canada).
Developing Basin-wide Perspective The considerable amount of updated or newly developed data developed for the LTFS study attempts to address and provide perspective on the entire basin (US portion), both areas on the Red River main stem and on tributaries. Categories of data developed as part of the LTFS study include, among others, hydrologic and hydraulic overviews, economic information, flood protection and flood risk alternatives (by city), and flood storage projects. The data is supported by a number of detailed basin maps developed for the study:
• Map A-1: General Location Map, Red River of the North Basin; includes jurisdictional boundaries, major tributaries and major dams;
• Map A-2: Detailed Watershed Map; includes USGS river gaging stations, flood storage sites, mile markers for Red River main stem, along with water features (rivers, creeks, major ditches and lakes) and land features (major interstates, highways and railroads);
• Map A-3 through A-8: Subbasin Maps: Individual maps of subbasins with features of Map A-2 above in more user friendly format;
• Map A-11: Basin-wide Flood Timing Zone Map—Early, Middle, Late;24 • Map A-12: Basin-wide Flood Timing Zone Map—Relative Contributions to Red River
Peak Flows; • Map A-13: Non-contributing Drainage in the Red River Basin (Courtesy of Agriculture
Canada);
24 The timing zones for North Dakota and South Dakota were developed as part of the LTFS study using similar methodology to the Minnesota timing zones classifications.

- 41 -
• Map A-14 through A-22: Travel Time and Non-Contributing Areas by Subbasin; • Map A-23: Cross-Section at Fargo-Moorhead; and • Map A-24: Inundation Map of 1997 Flood.
In addition, the several key action guides developed for purposes of guiding the RRBC’s LTFS study and its implementation were designed to apply to the basin as a whole. These action guides include:
• Assumptions for Future Conditions: a description of conditions for the basin in the next two or more decades, the expected extent of the study’s implementation (discussed earlier in this chapter),
• Long Term Flood Solutions Principles: principles dedicated to issues and approaches to flood risk reduction in the basin (see Chapter 5), and
• Level of Flood Protection Goals: basin-wide goals for appropriate floodwater protection levels for categories of damage center types across the basin (see Chapter 8).
Consideration of All Potential Solutions LTFS participants identified and cataloged potential solutions, nonstructural and structural, to Red River basin flooding. Alternatives were systematically reviewed with the noting of advantages, disadvantages and other criteria considerations (see Appendix D, Table D-1 for list of options considered). In addition, a presentation on flood damage prevention alternatives was featured as a plenary session of the 2011 Red River Basin Commission Land & Water International Summit Conference (see Appendix D, Exhibit D-2).25 The presenter underscored the conclusion of a number of former studies that it will take a combination of strategies functioning together to address the Red River basin’s flooding issues.
Developing Basin-wide Plan The third method of the LTFS study was to build a basin-wide plan for addressing the problem of flood damage in the basin. To this end, those in the study identified three approaches to managing flooding in the basin’s floodplains: employing nonstructural strategies, raising levels of local protection, and reducing flow via retention. It was determined that the three approaches if carried out as a full basin can reduce flood risk and damage in the basin. It was also determined that flood risk reduction measures that contribute to a larger plan have value added to them, and thus that whole-basin planning and action can better reduce flood risk than can addressing each location on an individual basis. Within the first, nonstructural approach, the LTFS study looked for ways to expand positive practices in land use, both urban and rural, together with ways for communities basin-wide to benefit from participating in floodplain-related programs and efforts (see Chapter 7). The central question asked: What steps can be taken to maintain and improve the conveyance capacity of the basin’s floodplains while maintaining the economic and social well being of the basin, whether urban or agricultural lands?
25 The presentation by John Jascke, “Things We Can Do: Structural and Nonstructural Options,” examined the following options, among others: wet dams, dry dams, on-stream storage, off-stream storage, flood storage wetlands, wetland restoration, river corridor restoration, setback levees, riparian areas, dredging and channelization, storage easement, retirement of land, gating ditches, culvert sizing, controlled drainage, and land use.

- 42 -
The second component, raising levels of protection, is an approach that, by definition, is carried out at specific local sites. To guide that effort, basin-wide goals for level of flood protection were developed to help guide and motivate individuals, communities, and other responsible entities towards achieving appropriate minimum flood risk protection (see Chapter 8). The central question asked: What are the need and appropriate role for local protection measures such as levees, diversions, or ring dikes? What should be considered an appropriate level of flood protection for various types of damageable development in the basin? The third approach of reducing flood flow with retention practices has the potential to benefit many areas within the basin. The RRBC through the LTFS study, provided the tools and steps necessary for initial testing of the concept of retention. Those steps included: 1) developing a model, and, from the model, a theoretical basin-wide goal for flood flow reduction, 2) applying and testing the model in one subbasin, and 3) inviting and preparing all subbasins to model their individual capacities to determine the overall potential for flood flow storage (see Chapter 9). The central question asked: What is the potential in the basin for reducing flood peak flows on the main stem and its tributaries by implementing additional upstream flood retention?
Assisting Ongoing Local Flood Issues
During the course of the study, the RRBC continued to assist current and ongoing flood-related planning occurring in the basin. Following are a sample of flood-related functions that the commission carried out during the timeframe of the LTFS study:
• Held a seat on the Fargo-Moorhead Metro Flood Study Group and hosted a Metro Flood Group visit to the Minnesota House of Representatives,
• Sponsored a meeting between the Fargo-Moorhead Metro Flood Study Group and Winnipeg Floodway personnel and Manitoba officials and a subsequent tour of the Winnipeg Floodway,
• Co-sponsored meetings with communities downstream and upstream (staging area) of the proposed Fargo-Moorhead diversion project and assisted with planning and policy related to mitigation,
• Presented basin and specific flood-related information, along with updates on ongoing efforts to reduce Red River basin flooding risk, to the 2010 and 2011 International Legislative Forums;
• Helped sponsor and host the MN BWSR Information Tour of flooding in Moorhead area, and
• Continued roles in numerous on-going flood-related planning activities in the basin.

- 43 -
Part II: CARRYING OUT THE CHARGE: DETERMINING COSTS OF FLOODING, BUILDING FOUNDATIONS FOR RESPONSE, PREPARING DATA AND TOOLS FOR THE BASIN
4 Costs of Red River Basin Flooding
To consider strategies for flood damage reduction, the extent and cost of flood damages must be determined. In the Red River basin, an area of high economic value where flooding has increased in frequency and magnitude over the past decades, damages can be extensive in both urban and rural areas. Metropolitan centers and communities still without adequate protection in place carry high, even unsustainable, risk. For example, if a flood fight were to be lost at Fargo-Moorhead against just one flood event the size of the 2009 flood, damage costs would exceed $3 billion.26 Flood damages also occur on agricultural lands, particularly in areas of the basin where tributary slopes and size of channels decrease or in the exceptionally flat basin floor area. With up to nearly two million acres of basin agricultural lands subject to inundation, potential agricultural income lost to the basin and region can quickly amount to many millions of dollars in a single season.
Overview of Methods and Findings
The LTFS study addresses both urban and agricultural costs, together with brief analysis of costs to infrastructure and structures in rural areas. Following are comments on methods and summaries of findings.
Comments on Methods The LTFS study adopted the following approaches to analyzing costs of basin flooding:
• A focus primarily on monetary costs of flooding. Although the study acknowledges emotional and social impacts of flood events, it determined that such costs have not been tracked or studied sufficiently to allow either qualitative or quantitative analysis;
• An attempt when possible, given available data, to provide a basin-wide analysis by considering costs of flooding in as many communities and reaches of the basin, both main stem and tributary, as possible;27
• Separate discussions of urban and agricultural flood damages, although it is recognized that the economies of the two are intertwined in numerous ways;
• An attempt to allow comparisons between costs of flood damages vs. investments in potential strategies to reduce flood damages;
• Perspectives on flood damage costs as both direct costs and annual benefits; and • An assumed level of required or appropriate freeboard in determining damage and
benefits.
26 Aaron Snyder, USACE, St. Paul Office, Presentation to Legislators’ Forum, June 22, 2010. 27 Individual City Assessments including flood damage estimates were compiled for most basin cities that have flooding concerns. Data was obtained from the cities along with other sources and, as far as possible, reviewed by the cities (see Appendix C, Tables C-1 – C-89). Agricultural acres flooded are provided for reaches on both the main stem and its tributaries (see Appendix C, Tables C-97 and C-98).
- 44 -
Nutshell Summaries of Findings On Urban Costs: Potential composite urban damages from flooding in the basin with existing protection are estimated at $3 to $4 billion for a single 100-year event, $6.5 to $8 billion for a single 200-year event, and $11 to $13 billion for a single 500-year event.28 Note: The LTFS study used available USACE economic data to compile urban damages. Information was factored to reflect 2010 price levels for the 100-year, 200-year and 500-year floods. The resulting estimate of damages provides a low-end estimate of flood damages because it includes only National Economic Development (NED) data. Actual damages would also include Regional Economic Development (RED) benefits and local damages and thus would be greater than those considering only federal economic benefit.29 On Costs to Agriculture: For purposes of the LTFS study, damage is presented as total acres inundated by a particular level of flood, together with the relative magnitude of potential damages depending on the time of year the flooding occurs (spring vs. summer). Agricultural land inundated by a 100-year basin flood event is estimated to be between 1.3 and 1.9 million acres. Conservative estimated damages to these acres range from somewhat under $100 per acre for a spring time flood to over $300 per acre for a summer flood.30 Agricultural flood damages from a 100-year summer flood could approach or exceed $1 billion. Note: The above ranges for damage per acre were updated to 2011 prices but do not take into account changes in crop mix, yield increases or changes in production practices since 1978. In addition, some reaches of the basin’s agricultural lands have not been included in damage estimates in past studies. Thus, basin agricultural crop damages from flooding may be considerably greater than those presented here.
Costs of Basin Flooding: Urban
The LTFS study determined the most readily available and consistent information on urban flood damages are USACE feasibility studies of communities. These feasibility studies were completed at various times to assist communities in evaluating alternatives for flood risk reduction. To make the information in these studies more uniform and helpful for current analysis, the LTFS study supported updating costs used in the flood damage curves to 2010 dollars. This updating allows for meaningful monetary comparisons between costs of flood damage and costs of current and potential added protection. Arriving at meaningful monetary descriptions of flood damage costs is a complex process because of the many variables involved. These variables include levels of flood flows (discharge) and flood stages, frequency of flooding, degree of development of urban sites, and the effect of protection measures already in place. To consider these and other variables, the LTFS study 1) compiled and determined the relative degree of flooding and flood damage without protection at individual communities, 2) determined and noted relationships between flood discharge/stage levels and frequency, 3) examined the effect of existing protection on
28 Depending on the size of the event, the Fargo-Moorhead metro area accounts for approximately 70% to 85% of these damages. 29 See Appendix C, pp. 21-23, for discussion of federal [NED] vs. regional [RED] benefits. 30 The seasonable crop damages are based on a detailed analysis conducted in 1978 on the Sheyenne River floodplain from Kindred to the mouth of the Sheyenne River.

- 45 -
flood damage reduction, and 4) determined the effect of potential flood protection measures (including levees, diversions, and in some cases upstream flood storage impoundments) on flood damage reduction.
Overview of Relative Damages to Communities The most basic description of basin cities’ vulnerability to incurring flood damage is captured in the flood damage/elevation curves for communities throughout the basin (see Appendix C, Table C-90). Developed by USACE for communities for which they completed feasibility studies, and updated for the LTFS study to 2010 dollars, the flood damage/elevation curves display the relationship between discharge (cfs) or stage and potential damage costs. In each case, as discharge or stage increases, so too do damage costs, with the latter costs also relative to the degree of development of the community. The individual figures in Table C-90 describe this relationship for 13 main stem communities and 22 communities located on tributaries (7 in Minnesota, and 15 in North Dakota). Additional information is provided for Cass County (ND) and for two communities that experience damages from a second river. The flood damage/elevation tables make clear that without any flood protection in place, each city along the Red River main stem and many communities on Red River tributaries begin to incur damages for relatively frequent events, ranging from 2- to 50-year events depending on the city. The tables also demonstrate that 1) damages increase substantially as the size of the flood increases and 2) the scale of damages varies dramatically depending on the community’s degree of development. Adding up the total potential flood damages for the 13 main stem and 22 tributary cities represented in the flood damage/elevation tables, the resulting total potential damages without flood risk reduction projects in place would range from over $6 billion for a 100- year flood to almost $14 billion for a 500-year flood (see Appendix C, Table C-91 for damage costs by basin city). It is important to note that a number of basin communities for which USACE has not yet completed feasibility studies are missing from the analysis, and thus their damage costs are not included in these totals. In addition, as noted earlier, the damage costs included in the analysis are limited to those used to calculate NED benefits and do not account for any RED or local benefits. One must also take into account changes that occur in both hydrological records and in cities’ levels of development. In the last decades, hydrological records have been shifting for several key areas of the basin towards increasing the likelihood of damage. For instance, using USACE’s recommendation for a revised (updated) hydrology for the southern portion of the basin that incorporates flood data from 1998 through 2009 on the Red River, the potential flood damage totals that would occur at some sites of the southern basin increase potential damages for the 35 basin cities by $3 billion for a 100-year flood, to a total of $9 billion in damages, and by $1 billion for a 500-year flood, to a total of more than $15 billion in damages (see Appendix C, Table C-92). These increases do not take into account any changes to the levels of development in the communities since the time the feasibility studies were originally completed. This basic overview of potential damage in the basin’s cities without flood protection projects in place is not intended as a precise representation of the true potential damages, which would take into account existing protection measures along with other factors. Nor should it be used as the primary source of economic justification for projects proposed in the future. However, the analysis provides a perspective of relative potential urban/community flood damages in the Red River basin.

- 46 -
Adding in Flood Frequency To provide further perspective on potential basin flood damage, the LTFS study added the theorized frequency of floods to the flood damage/elevation curves for the above 13 main stem and 22 tributary cities. For each city, frequency floods of 50, 100, 200, and 500 years are described to compare damage amounts in relationship to the potential occurrence of flood events.31 In summary of the results, it is estimated that 50-, 100-, 200-, or 500-year floods occurring along the length of the Red River main stem and on all the tributaries without flood protection projects or dams in place, and if emergency flood fight measures are not successful, would result in urban damages worth $3.0 billion, $6.0 billion, $11.5 billion and $13.8 billion, respectively (see Table C-91), or, with the revised (updated) hydrology, $6 billion, $9 billion, $12 billion and $15.5 billion (see Table C-92). Again, this estimate of flood damages is on the low end; actual damages would be greater when taking into account the regional and local damages that are not included from the perspective of national (NED) analysis. Using the more conservative (lower) damage estimate totals, cities with the most damage for the 50-year flood under conditions of no protection are:
• Fargo ND-Moorhead MN metropolitan area ($1.7 billion), • Grand Forks ND/East Grand Forks MN metropolitan area ($507 million), and • Devils Lake ND ($415 million).
Cities with the most damage for the 100-year flood without protection in place are:
• Fargo ND-Moorhead MN metropolitan area ($4.1 billion), • Grand Forks ND-East Grand Forks MN metropolitan area ($1.2 billion), and • Devils Lake ND ($432 million).
Cities with the most damage for the 200-year flood are
• Fargo ND-Moorhead MN metropolitan area ($8.3 billion), • Grand Forks ND-East Grand Forks MN metropolitan area ($2.0 billion), and • Devils Lake ND ($435 million).
Cities with the most damage for the 500-year flood are
• Fargo ND-Moorhead MN metropolitan area ($10.3 billion), • Grand Forks ND-East Grand Forks MN metropolitan area ($2.2 billion), and • Devils Lake ND ($438 million).
The major urban damage centers in the Red River basin are, in order: the Fargo ND-Moorhead MN metropolitan area, Grand Forks ND-East Grand Forks MN metropolitan area, and Devils Lake ND. These three urban areas make up over 90% of the damages without projects in place in the Red River basin. This information makes clear the importance of adequate protection at major urban centers, some of which have completed or are planning flood risk reduction. It also suggests that states may have the capacity to direct solutions and resources at remaining areas of need. The LTFS Reports by City (see Appendix C, Tables C-1- C-89) can provide a starting place for identifying needs for protection at urban and city locations.
31 The elevation-frequency relationships in Table C-91 are based on the USACE 2003 report, Regional Red River Flood Assessment Report.
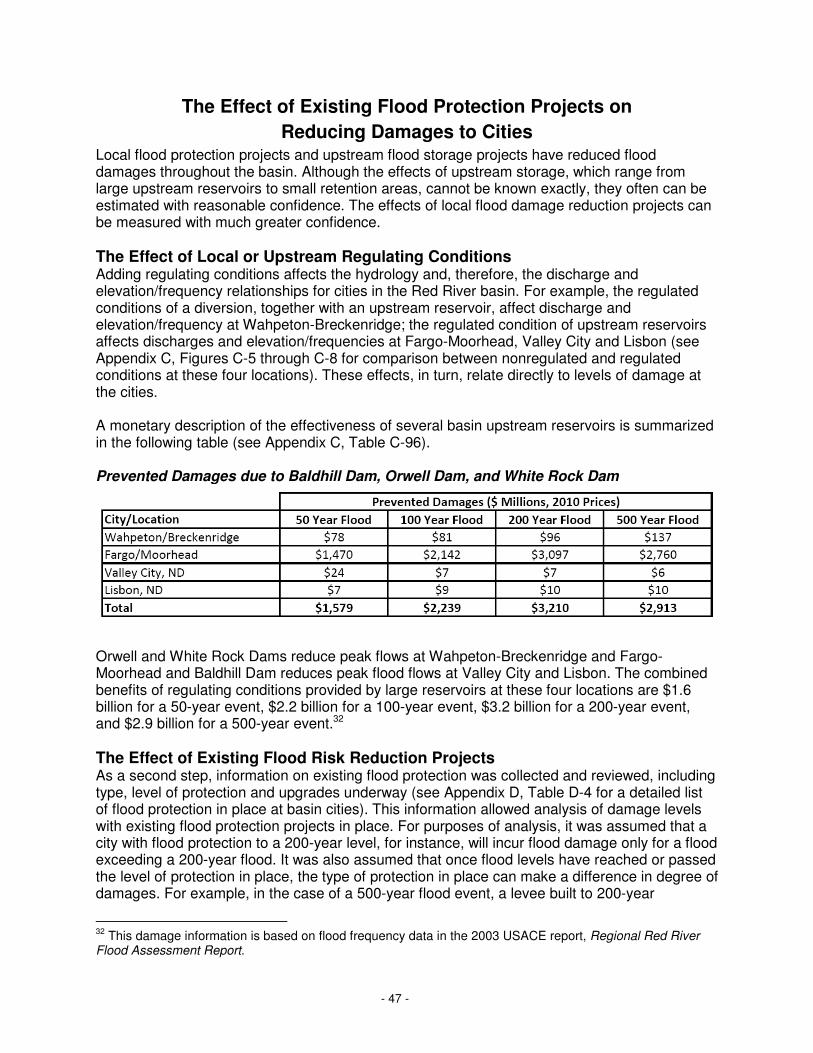
- 47 -
The Effect of Existing Flood Protection Projects on
Reducing Damages to Cities Local flood protection projects and upstream flood storage projects have reduced flood damages throughout the basin. Although the effects of upstream storage, which range from large upstream reservoirs to small retention areas, cannot be known exactly, they often can be estimated with reasonable confidence. The effects of local flood damage reduction projects can be measured with much greater confidence. The Effect of Local or Upstream Regulating Conditions Adding regulating conditions affects the hydrology and, therefore, the discharge and elevation/frequency relationships for cities in the Red River basin. For example, the regulated conditions of a diversion, together with an upstream reservoir, affect discharge and elevation/frequency at Wahpeton-Breckenridge; the regulated condition of upstream reservoirs affects discharges and elevation/frequencies at Fargo-Moorhead, Valley City and Lisbon (see Appendix C, Figures C-5 through C-8 for comparison between nonregulated and regulated conditions at these four locations). These effects, in turn, relate directly to levels of damage at the cities. A monetary description of the effectiveness of several basin upstream reservoirs is summarized in the following table (see Appendix C, Table C-96). Prevented Damages due to Baldhill Dam, Orwell Dam, and White Rock Dam
Orwell and White Rock Dams reduce peak flows at Wahpeton-Breckenridge and Fargo-Moorhead and Baldhill Dam reduces peak flood flows at Valley City and Lisbon. The combined benefits of regulating conditions provided by large reservoirs at these four locations are $1.6 billion for a 50-year event, $2.2 billion for a 100-year event, $3.2 billion for a 200-year event, and $2.9 billion for a 500-year event.32 The Effect of Existing Flood Risk Reduction Projects As a second step, information on existing flood protection was collected and reviewed, including type, level of protection and upgrades underway (see Appendix D, Table D-4 for a detailed list of flood protection in place at basin cities). This information allowed analysis of damage levels with existing flood protection projects in place. For purposes of analysis, it was assumed that a city with flood protection to a 200-year level, for instance, will incur flood damage only for a flood exceeding a 200-year flood. It was also assumed that once flood levels have reached or passed the level of protection in place, the type of protection in place can make a difference in degree of damages. For example, in the case of a 500-year flood event, a levee built to 200-year
32 This damage information is based on flood frequency data in the 2003 USACE report, Regional Red River Flood Assessment Report.

- 48 -
protection level may be overtopped, no longer reducing damages, whereas a diversion channel built to 200-year protection level may still add partial protection for the larger flood. The remaining damage levels, after damage reduction achieved by existing protection is taken into account, are described in the following figure (see Appendix C, Figure C-1).33 Urban Damages with Existing Protection in Place
For a 100-year flood, remaining damage is estimated at $2.7 billion, for a 200-year flood at $6.2 billion, and for a 500-year flood at $11 billion. The Fargo-Moorhead metro area damage 33 Uses 2001/2003 USACE Flood Frequency analysis.

- 49 -
comprises 74% of the total damage for a 100-year flood, 84% of the total damage for a 200-year flood, and 69% of the total damage for a 500-year flood. The decrease in Fargo-Moorhead in percentage of damage for a 500-year event can be attributed in part to the likely overtopping of current protection levels at other large population centers, most specifically at Grand Forks-East Grand Forks, whose current protection up to a 250-year frequency flood would not protect this urban center from larger floods. Determining Benefits from Existing Protection Projects One can also represent costs of basin flooding as benefits of damage reduction in cities provided by existing flood risk reduction projects. Total urban benefits to the basin are described in the following figure for the 100-year and 200-year events (see Appendix C, Figure C-2).34 The benefits are arrived at by noting the difference between the degree of damages with no projects in place and the degree of damages with current local protection and upstream retention projects in place. The difference between the two, which constitutes the benefits of the existing projects, is $3.6 billion for a 100-year event and $5.2 billion for a 200-year event. Potential Damages with Existing Protection
Benefits or damage prevented for a 500-year flood with existing protection in place are approximately $3.0 billion (see Appendix C, Table C-93). These benefits for a 100-year, 200-year and 500-year flood event reduce potential flood damages by 58%, 46%, and 22% respectively. Those basin projects currently providing greatest benefits are the levee/floodwall system in Grand Forks-East Grand Forks, which provide the two cities 250-year protection, and the White
34 The figure uses 2001/2003 USACE Flood Frequency analysis.

- 50 -
Rock and Orwell Dams, which reduce discharges and flood elevations in the Fargo-Moorhead metropolitan area. It is obvious that basin cities are only minimally prepared for larger (500-year) flood events.
Benefits of Adding Potential Additional Projects As a final step in representing costs of flooding in Red River basin urban areas, the LTFS study describes the effects additional potential projects would have for 100-, 200-, and 500-year flood events. Those projects consist of 1) achieving recommended levels of local protection for damage sites35 and 2) adding upstream retention on tributaries to achieve a 20% reduction in peak flows for a 100-year event on the main stem.36 The projects would be put into place over the next decade or two and so are considered for the most part in place within the next 20 years. Because recommended levels of local site protection would protect communities at a minimum to the 200-year flood, potential urban flood damages for 100- and 200-year floods are indicated as $0. For a 500-year flood, potential benefits would exceed $10 billion beyond any benefits of existing projects as of 2010. Urban benefits for the 100-, 200- and 500-year flood events with the addition of the potential projects are summarized in the following figure,37 which demonstrates that, with potential projects in place, the flood damages of about $2.7 billion for the 100-year flood and $6.2 billion for the 200-year floods would essentially be eliminated. For the 500-year flood, potential damages of $10.9 billion with existing conditions would be reduced to less than $0.7 billion (see Appendix C, Figure C-3). Prevented Damages with Existing and Potential Protection
35 Recommended levels of local site protection are discussed in Chapter 8. 36 The 20% goal for reduced flow is discussed in Chapter 9. 37 The figure uses 2001/2003 USACE Flood Frequency analysis.

- 51 -
With the application of the revised (updated) hydrology, urban benefits for the potential additional projects would increase to $3.8 billion for a 100-year flood, $7.8 billion for a 200-year flood and $12.8 billion for a 500-year flood (see Appendix C, Table C-94).
Costs of Basin Flooding: Agriculture
Computing specific agricultural damages from flooding is complex for several reasons. Foremost are the industry’s many variables. Along with crop damage, flood-related farm losses can occur to farmstead buildings, to grain under storage, to marketing of crops (lack of access to market roads), even to the integrity of fields and soil due to erosion, among other factors.38 In addition, effects of flooding are often difficult to ascertain or distinguish from other damaging conditions for crops. And data is often not available. Not only is agricultural land not included in federal cost-benefit analyses, but a number of reaches on basin tributaries have not been included in a federal study and thus are not represented in available data. Agriculture plays a central economic role in the basin and region. The success and viability of basin agriculture is affected by flooding. The following analysis will focus on crop and soil damages due to flooding, together with potential beneficial effects to agriculture of flood flow reduction strategies.39 Agricultural flood damages will be considered as: 1) direct temporary damage (loss of crop), 2) temporary indirect damage (delayed or prevented planting, etc.), and 3) loss of topsoil due to erosion.
Direct Damage Although direct damage from flooding can occur to equipment, farmsteads, stored grain, drainage or irrigation systems, etc., the LTFS study looked primarily at potential damages incurred when growing commodities are inundated for a period of time beyond which a particular crop can withstand. Degree of Inundated Acres The mere number of agricultural acres in the basin combined with the extent of basin flooding suggests the potential for damage from flooding in the agricultural sector. One set of data from USACE estimated agricultural acres inundated for various size floods at: 556,000 acres for a 10-year event, 1.1 million acres for a 50-year event, 1.4 million for a 100-year event and 1.6 million acres for a 200-year event (see Appendix C, Table C-98 for inundation acres by reach on main stem and tributaries).40 Using conservative estimates, agricultural damages from a single 100-year flood event can range from $136 million to $544 million depending on the season in which the flood is experienced.
38 Commodity prices can range widely, as can inputs. Yield levels are determined by multiple variables, including the time of seeding, soil conditions, seed variety, degree of fertilizer use, emergence, disease, weed control, amount and timing of rainfall, among others. 39 Although the LTFS study emphasized agricultural crop production, it recognizes the multiple forms of agriculture in the basin. 40 Figures are based on USACE data without protection projects in place. Note that some agricultural areas of the basin are not included in these estimated acres.

- 52 -
Rates of Crop Damage The following graph, which describes an agricultural curve of crop loss due to flooding in one segment of the basin, illustrates how crop damages due to flooding vary throughout the growing season. The graph shows the largest losses, from $200 to over $300 per acre, occurring from June 1 – July 31. Lesser losses of approximately $150 and above occur from May 1 – May 31 and August 1 – August 16 (see Appendix C, Table C-99).
It is important to note that although the loss figures described on the above graph are updated from 1978 to 2011 for production and crop price levels, they do not take into account significant shifts in the basin since 1978 towards higher-value crops and improved yields. Taking these and related factors into account would increase the levels of crop loss. To verify those changes in cropping and crop yields, types of harvested crops for 2010, 1978, and 1975 in the Minnesota and North Dakota counties of the Red River basin were examined. The results show dramatic shifts in cropping since 1975/1978 towards soybeans and corn (as grain), along with significant increases in yield for commodities across the board, including the high-value crops of corn, sugar beets and beans (see Appendix C, Table C-101). 41
A Comparison of Spring and Summer Floods Related to Agricultural Damages Although large spring floods bring the greatest challenges to the basin as a whole and the main stem areas in particular, typically, greater damages for agriculture are incurred with summer floods. To illustrate the greater impact of summer floods on agricultural losses, the LTFS study compared the agricultural damages of the summer flood of 1975 with the spring flood of 1979.
41 Similar trends are illustrated for a single county, Cass (ND), in Table C-102.

- 53 -
Although every basin flood has distinct characteristics, these two floods occurred close in time and both were high magnitude floods. As summarized in the following table, agricultural damages for the spring flood (1979) were approximately $222 million, while losses for the summer flood (1975) were nearly $1.0 billion (both indexed up to 2011 crop prices) (see Appendix C and Table C-104). It must be noted that recurrence of floods of these magnitudes today would cause significantly higher damages due to changed cropping patterns and crop yields. Agricultural Flood Damages Data for 1975 and 1979 Floods
The above table also makes clear a pattern of greater repercussions of summer floods for tributary areas than for the Red River main stem. Damage costs for the main stem’s 460,000 floodplain acres were somewhat higher for the spring (1979) than for the summer (1975) flood: approximately $120 million vs. $108 million. But on the majority of the tributaries, damages were far greater for the summer event. To compare just one tributary’s agricultural losses with those of the main stem, the Sheyenne River’s floodplain acres sustained nearly $345 million in damages from the summer 1975 flood, while the Red River’s floodplain acres sustained only about $108 million in damages. The table shows that other tributary areas also experienced substantially more losses from the summer (1975) flood than from the spring (1979) event. Tributaries not incurring these greater summer damages appear to have been out of the path of the rainstorms that brought damages to the other tributaries. (The rainfall distribution for the 1975 summer storm is discussed in Appendix B, Exhibit B-8 and illustrated in Figure B-80.) This suggests that summer crop damages, most often caused by excessive rains, may not typically have as widespread an

- 54 -
impact on the basin as a whole as floods caused by spring melt, but rather are more concentrated on individual tributary watersheds. A more recent summer flood, that of 2002 on the Roseau and Wild Rice (MN) subbasins, also documents potentially extensive summer flood damages to tributary agricultural areas. Although the 2002 flood caused significant damage to urban residential and commercial sites as well as to infrastructure, its largest damages were in the form of crop losses. The relatively isolated event caused $56 million in crop damage, together with other agricultural damages of $23 million, in the Roseau and Wild Rice (MN) Rivers subbasins alone.42 (The rainfall event that caused the 2002 summer storm is discussed in Appendix B, Exhibit B-7 and illustrated in Figure B-79.)
Indirect Damage Flooding can also contribute indirect damages to agriculture. Beginning as early as mid-March, spring-flooded agricultural acres can start incurring losses due to delayed seeding, unfavorable seeding conditions, or, if flooding conditions are of long duration, prevented planting.43 As a recent example, a report of spring 2011 planting conditions in North Dakota estimated yield losses of 0.6 to 1.7% per day for crops planted after optimum planting dates.44 Delays for planting in the Red River basin were clearly at or beyond the average delays of 7 to 21 days reported for North Dakota. This would mean yield losses of 30% or more. The report also points to potential problems in crop maturing time, as well as harvest losses resulting from later maturities. In summary, the report concludes that the combination of late planting, poor growing conditions, and drowned crops will result in “significant crop loss” for the year. Prevented planting of agricultural acres not only results in economic loss for the year the planting is prevented but can carry negative impact into the following year as well. When acres are left idle, the permanent water retention achieved by cropping acres each year has broken its positive cycle. This positive cycle is particularly important for acres lying in the floodplain. Each year, the planted crop not only takes up waters from the soil but uses that water, creating space in the soil for the following year’s runoff. Without regular cropping, wet soil conditions have the potential to spiral to an even more unmanageable condition. Such permanent water retention through the cropping of lands, preferably with high-yielding stands, is a productive but often overlooked way of retaining waters following spring frost. The number of acres in the basin that can be affected by the above conditions as a result of inundation from flooding during the spring is large. Along the Red River main stem alone, the area of the basin that experiences the largest, broadest outbreaks along its reaches, approximately 580,000 acres are inundated during a 100-year event and nearly 700,000 during a 200-year event (see Appendix D, Table D-23). Although one or more of the above indirect forms of flood damage are common occurrences in agricultural production, they are difficult to isolate and measure. Most typically, these factors are
42 USACE, Northwest Minnesota 2002 Flood Damage Assessment (for full text, see Appendix C, Exhibit C-2). 43 The Soybean Production Field Guide for North Dakota and Northwestern Minnesota explains that late-planted soybeans have shorter plant size, lower yields, pods set closer to the ground, poorer seed quality and lower oil content than those planted during optimum planting dates (August 2002, p. 15). Seeding into wet soils, a practice farm operators can be pressed into to get seeding done at all, can result in creating barriers for the seeds to soil and/or sun, thus interfering with germination, emergence and/or root development. 44 Dr. Hans Kandel, North Dakota State University, “2011 Crop Development in North Dakota,” July 2011 (unpublished).

- 55 -
not estimated or reported as flood damage until they meet official Federal Crop Insurance Corporation guidelines for prevented planting or for production loss.45 And, as illustrated by the painstaking efforts and multi-faceted sources of information outlined in USACE’s assessment of the 2002 summer flood in northwestern Minnesota (2003), accessing and compiling all the factors that relate to agricultural flood damages can take major effort and still remain incomplete, even when collecting information for a limited area (see Appendix C, Exhibit C-2 for full report).
Costs of Erosion A third category of costs to the agricultural economy from flooding is that of soil loss due to erosion. Although erosion is most often not factored into reports as an economic loss, agricultural acres affected by erosion may see yield losses for years following the erosion. Erosion can also bring increased operating costs, including costs for additional fertilizer applied in an attempt to regain productivity on eroded acres.46 Soil erosion costs can also show up in the regular practice of cleaning out legal drains or in instances of mass erosion on small streams. Most importantly, soil erosion due to flooding can affect water quality by adding excessive sedimentation and nutrients to river and lake systems. The sedimentation, in turn, has the potential to cause loss along the full reaches of the basin’s water systems and, ultimately, at the basin’s mouth in Manitoba’s Lake Winnipeg.47 The LTFS study involved representatives from the NRCS, who address soil erosion in their programs that encourage best management practices to reduce both wind and water erosion.48 A related issue brought forward in the study are questions of the potential relationships between stream bank erosion and control of runoff, which needs to be addressed with research on basin drainage.
Benefits of Adding Potential Additional Projects The RRBC recommended flood flow reduction resulting from upstream floodwater retention is 20% on the Red River main stem from Wahpeton to Emerson (see discussion in Chapter 9). A 20% flood flow reduction on the Red River main stem alone has the potential for decreasing flooded acres by 121,000 acres for a 100-year flood. Additional reductions in flooded acreages on the tributaries would be achieved. The estimation of the value of these reductions in flooded cropland is difficult due to the factors described above, including the time of year of the flood, the flood’s duration, and the types of crops affected by the flood. Although not quantified, the potential reduction in flooding of agricultural lands for the more frequent flood events such as the 10-year event could be substantial and of significance to the local agricultural community due to the much more frequent reduction in damages. Reducing the number of inundated acres by decreasing overall magnitude of flooding can also potentially reduce costs due to soil erosion. Some of these costs of soil erosion can be expressed as monetary values, including cleaning of drains, dredging of waterways, impacts on recreational uses, and, in Manitoba, industries associated with Lake Winnipeg. Losses in
45 2011 Federal Crop Insurance cut-off dates for eligibility for prevented planting payments were as follows: May 25 for corn, May 31 for wheat and sugar beets, June 10 for beans and sunflowers. 46 Northwest Minnesota 2002 Flood Damage Assessment, 2003. 47 For impacts of sediments on Lake Winnipeg, see Environment Canada and Manitoba Water Stewardship, State of Lake Winnipeg: 1997-2007, June 2011: 48-57. 48 Best management practices to reduce water erosion include using grassed buffer areas at erosion areas or sites of potential high water velocity and/or adding and/or maintaining adequate organic matter in farmed soil.

- 56 -
sustainability due to long-term damage to farmland are less convertible to monetary values but need to be taken into account in consideration of benefits of flood flow reduction by means of retention. Although retention itself requires land space, a model such as the North Ottawa Project in the Bois de Sioux watershed is proving to aid local crop production at the same time as it provides flood control and natural resource enhancement.
Costs of Basin Flooding: Transportation, Other Infrastructure, Rural Structures
Flood damages to transportation and infrastructure are substantial and repeated. Costs of such damages are often difficult to collect or assess in the basin because multiple agencies and several levels of jurisdictions are involved. Flood damages to rural buildings have typically not been reported, with the exception of the recent compilation of rural damages along the main stem from south of Fargo-Moorhead (Abercrombie) to north of Grand Forks-East Grand Forks (Drayton) as part of USACE’s Final Feasibility Report for the Fargo-Moorhead metropolitan area. Following will be brief summaries of flood damages to transportation, other infrastructure, and rural structures.
Transportation Flood damages to transportation networks include both the cost of damaged infrastructure (such as road wash-outs, bridge failures and pavement damages) and economic impacts due to road, railway, and airport closures and all the related cancellations and rerouting. Using the example of the Fargo-Moorhead metropolitan area’s current Flood Risk Management project, a 100-year or greater flood event was found to do “major damage” to local private roadway traffic and rail freight, moderate damage to regional private road traffic and truck freight traffic, and minor damage to air passenger traffic (see Appendix C, p. C-33). As an example of on-the-ground problems and damages associated with flooding faced by Minnesota and North Dakota Departments of Transportation, the following challenges were described recently by representatives of the Minnesota DOT:49
• Many communities around the basin, in addition to many rural residences and farmsteads, are isolated during flood events for weeks or more at a time, shutting off roadway access to emergency services.
• Overtopped roadways become unsafe for travel—but must be used. • Debris such as ice and logs can damage bridges, roads and culverts and cause safety
issues for DOT workers and the public. • Roads are routinely damaged with erosion, deteriorated pavement, under-cut
foundations at culvert crossings, potholes and pavement buckling. • Roadway detours add traffic and loads to roads not designed for such traffic. • Improper tile and culvert sizing lead to roadway flooding, additional flows and erosion. • Agencies are not coordinated on drainage issues. • Funding is insufficient for repairing flood-damaged roads and related infrastructure and
for building new projects.
49 Roger Hille and Bridget Miller, Presentation to the Red River Basin Commission Joint Powers Board, May 26, 2011 (see Appendix C, Exhibit C-5).

- 57 -
Representatives of North Dakota DOT voice similar concerns and point out the regular closure of Interstate highways during flood events. In April 2011, more than 30 North Dakota highways were fully or partially closed, and 31 miles of I-29 between Fargo-Moorhead and Grand Forks-East Grand Forks were shut down.
Other Infrastructure Flood damages to other infrastructure, like those to transportation, can be difficult to track. Multiple agencies are involved in responding to rural infrastructure damages, among them, FEMA (the Public Assistance and Emergency Relief programs), the Federal Highway Administration (Emergency Relief program), the US Department of Agriculture (NRCS), and the state DOTs, together with other state agencies such as BWSR in Minnesota or the SWC in North Dakota. Attempts, including that of the LTFS study, to gather information directly often result in only partial data. The LTFS invitation to townships from two counties to submit information about flood-related damages to their infrastructure brought limited response, despite several follow-up efforts to gather the information. It will take ongoing effort to identify the entire basin infrastructure that could potentially incur flood damages. As another potential source of information on infrastructure costs, the LTFS study reviewed recent (1993 to 2009) costs that were covered by the Minnesota Hazard Mitigation Grant program in conjunction with federal disaster dollars (25% local, 75% federal). Those projects covered under the disaster funds include, among others: home buyouts, conversion to underground distribution lines, installation of additional sewer lines and lift stations, installing living snow fences, installing new control structures, stabilizing grade, and installing erosion control measures. Total local share (25%) in Minnesota basin counties for infrastructure costs in the disaster declaration years of 1993, 1995, 1996, 1997, 1998, 1999, 2000, 2001, 2002, 2004, 2007, and 2009 was about $12 million (see Appendix C, Table C-110 for full listing by county and itemized costs). 50 Total local share (25%) in North Dakota basin counties for infrastructure costs from 1997-2009 was about $30 million.51 (See Appendix C, Table C-111 for full listing by county and itemized costs.)
Infrastructure damages for the two subbasins that experienced considerable damage in the 2002 summer flood, Roseau River and Wild Rice River (MN), also were reviewed. For this single flood in the Roseau River watershed alone, urban infrastructure damages were estimated at $58.2 million. Rural infrastructure damages for the two watersheds were estimated at $8.7 million (see Appendix C, Table C-113 and Exhibit C-2).
Rural Residences and Farmsteads The number and types of rural structures have not been compiled for most basin tributary areas. However, a compilation of rural structures along the Red River main stem has recently been completed by USACE in conjunction with the Final Feasibility Report for the Fargo-Moorhead metropolitan area. A total of 8,783 structures, mostly farm buildings, are located on the reaches of the main stem from Abercrombie to Drayton (see Appendix C, Table C-107 for listing by structure type). Along two of the main stem reaches, from Abercrombie to south of Fargo-Moorhead and from north of Fargo-Moorhead to south of Grand Forks-East Grand Forks, rural structures, including residential, commercial, public, and farm, are projected to incur damages
50 Projects are listed by county; disasters are not limited to, but include, flooding. 51
Project costs for North Dakota Hazard Mitigation Grant program are not easily accessible prior to 1997.

- 58 -
ranging from less than $1 million for a 10-year flood to about $40 million for a 100-year flood and $107 million for a 500-year flood (see Appendix C, pp. 29-33 and Table C-108).52 The RRBC recommendation for protection for rural residences and farmsteads is for at least the 100-year flood. A history of appropriations for the latter in Minnesota (1997-2010/11) shows in excess of $11.3 million having been put towards rural and farmstead ring dikes since 1997, with costs shared by the state, the RRWMB, local landowners, and watershed districts (see Appendix C, Table C-106). In both Minnesota and North Dakota, requests for rural ring dikes depend on patterns of flooding during particular floods, together with available levels of cost share. In addition to achieving local protection with ring dikes, rural residences and farmsteads may benefit in the future from potential additional upstream retention (described in Chapter 9).
Under- and Unreported Costs of Flood Damage
A clear need in the basin is to improve data collection for costs of flooding. With frequent substantial floods in the basin, isolating flood-specific costs to track and document them can be difficult. Earlier reports were looked at to determine methods and challenges in reporting flood costs in the basin. One of these earlier attempts, the RRBB Flood Damage Reduction Inventory Team Report, will be used to illustrate the challenges in collecting and documenting flood damage costs.
Estimating Damages with Reimbursed Costs: The RRBB Flood Damage Reduction Inventory
The RRBB Flood Damage Reduction Inventory Team Report (October 2000) was one of nine inventories of land and water management issues in the basin commissioned by the RRBB (see Appendix C, Exhibit C-1 for full report).53 The approach taken by the Inventory Team was to estimate flood damage costs by determining reimbursements to and/or direct expenditures on entities that have sustained flood damages. These entities can range from communities, counties or townships to individual residential dwellings. The team decided to focus, as far as possible, on costs for flood damage for the years 1993 – 1998, a span of years that includes one major spring flood in 1997 and two lesser flood events in 1993 and 1996. The team contacted federal and state/provincial agencies, both governmental and non-governmental, that provide flood recovery assistance in the Red River basin to determine reimbursed costs for the five years. The Flood Damage Reduction Inventory Team collected and reported information on flood expenditures from a thorough search of agencies and specific programs under each agency (see Appendix C, Table C-112 for a summary of the information gathered). However, the team found a number of impediments in accessing damage information. They found it difficult to
52 These estimates are based on revised “wet period” hydrology and do not include existing protection (the latter is largely not in place for rural residences with the exception of individual ring dikes). 53 The Flood Damage Reduction Inventory Team had 13 active members representing ND and MN counties (3 members), the RRBB (2 members), the ND SWC (1 member), USACE (1 member), MN DNR (1 member), Manitoba Natural Resources (1 member), Manitoba rural municipalities (2 members), ND Landowners Association (1 member), US Geological Survey (1 member).

- 59 -
obtain reports: in many cases, materials were not available electronically and thus required time demands on agency staff to retrieve materials; often, reports were submitted past requested deadlines; and, in a number of cases, no reports were available. The Inventory Team also ran into disparities in reporting, whether among agencies or between Manitoba and states, with the latter often funding with cost-sharing between federal, regional, and state. In addition, the team encountered the problem of distinguishing ineligible claims from eligible, and they found some areas, such as psychological and environmental impacts, reported primarily in qualitative terms. Despite their detailed work on tracing reimbursed costs, the Flood Damages Inventory Team had to conclude 1) because of incomplete data, it was not possible to project accurate flood damage estimates for the Red River basin and 2) given the nature and extent of available flood damage records, estimates of losses are considerably less than those actually sustained. The 1997 flood is cited as a case in point, in which damage amounts available to the team were greatly unreported (the Inventory Team arriving at only half the amount of loss estimated by two other sources). In its final summary, the Flood Damage Reduction Inventory Team determined to use USACE’s rule-of-thumb estimate that documented financial loss from flood events to be approximately half of actual losses.54
Current Sampling of Under- or Unreported Costs Attempts were made as part of the LTFS study to collect information on under- or unreported costs from townships. The attempt was a response to the concerns expressed by basin residents and public officials that significant flood damages, both public and private, often go unaccounted and unreimbursed. To carry out the inquiry, RRBC attempted to collect information on unreported or unreimbursed tangible structural damages incurred during the 2009 flood from 80 townships in two sample basin counties, Cass (ND) and Clay (MN). Staff telephoned officials in the 80 townships, asking for estimates of the value of structural damages due to the 2009 spring flood that were submitted and denied, not submitted, or otherwise not compensated. Information was obtained from 13 of 50 townships in North Dakota and 13 of 30 townships in Minnesota. Two of the North Dakota townships reported without using monetary estimates; the remaining 11 estimated $140,000 in unreimbursed or unreported expenses, approximately half public and half private. The 13 Minnesota townships reported $87,500 in unreimbursed or unreported expenses, with twice as many private as public amounts. This lack of response was similar to that experienced by the 1990 Flood Damage Reduction Inventory Team’s attempt to collect local information on unreimbursed costs and may be due to the tendency of basin officials and residents to make do and move on following flood events. However, given the total figures of those townships reporting, it appears that, given time and effort to identify and collect/report unreimbursed and unreported damage costs, townships, and perhaps counties, school districts and residents, could demonstrate significant tangible costs of flooding that are not included in totals from state and federal agencies with jurisdiction over disasters and mitigation.
54 RRBB Flood Damage Reduction Inventory Team Report, p. 45.

- 60 -
5 Building Foundations: Development of Principles;
Review of Governance
The LTFS study built on well-laid foundations. These included major former studies such as the Souris-Red-Rainy River Basins Comprehensive Study (1972), USACE’s Red River of the North Basin-wide Reconnaissance Study (1980) and, more recently, IJC’s Living with the Red: A Report to the Governments of Canada and the United States, which has helped direct the basin’s development of flood resiliency since 2000 (available in Appendix E, Reference Reports 6.4, 6.2, 6.3).55 In addition, basin organizations have developed principles, goals, and objectives for basin land and water management, including those for flooding, and provided leadership in promoting and furthering basin-wide cooperation around these issues. Together, these resources have paved a substantial path for developing more in-depth principles dedicated to flooding issues and for considering basin governance as it relates specifically to flooding.
Building Foundations through Development of Principles
To build a foundation for the LTFS study, participants first looked to principles and goals already in place related to Red River basin flooding. The study then went on to develop in-depth principles designed specifically to guide the planning and future implementation of approaches to basin flooding issues. The resulting document, Long Term Flood Solutions Principles, is the first such attempt to develop in-depth principles for responding to flooding in and as a basin.
Principles and Goals in Place to Guide the Process Two sets of active principles and/or goals and objectives currently being used in the basin include the RRBB/RRBC’s Guiding Principles and the RRBC’s Natural Resources Framework Plan (NRFP). Both address flooding and flood damage reduction as part of broader water and land management principles and goals/objectives. Guiding Principles (1999) The RRBC and its predecessor organizations have worked since their origination in 1979 to identify principles and goals to guide water and land resource management in the basin. Among these efforts was the development of Guiding Principles (1999) by the RRBB (see Appendix E-6.1). These principles still guide the work of the RRBC, and, as such, constitute part of the foundation for the LTFS study. The Guiding Principles outline approaches to basin water and land management centered on the areas of flood damage reduction, water quality, water supply, and conservation, among others. Of the 19 principles, the following address flooding most directly:
• To minimize flood damage, water will be retained where practical in agreement with local, watershed, and basin water management plans.
• All approaches to managing floods and minimizing flood damage will be evaluated for their possible impact on the economy, community, and environment.
55 The IJC report has two updates tracing the implementation of its recommendations, the most recent of which is How are we Living with the Red? (2009).

- 61 -
• Land subject to flooding should be developed only according to planning guidelines that prevent human suffering and property damage, limit public costs and liabilities, and address the impact on the environment.
Additional points from the 1999 document relate to current emphases of the LTFS study, including those on seeking comprehensive solutions to resource issues and problems, keeping human health and safety as first priority, and ensuring that actions taken in water management benefiting one area are designed to minimize adverse effects on other areas. Natural Resources Framework Plan (2005) The Natural Resource Framework Plan (NRFP) was developed by the RRBC to act as a resource management guide for the full basin, including Manitoba (see Appendix E, Exhibit E-6.1). The NRFP’s 13 “Action Goals” and accompanying objectives are designed to move the basin forward as a unified, integrated whole on multiple fronts of resource management. Such unified effort and direction reflects the physical reality of a single basin with shared history, shared resources, and shared issues to address. Goal 6 of the NRFP addresses flooding, with the stated goal of “reduc[ing] risk of flood damages for people, property, and the environment in the main stem floodplain and in tributary waters.” The goal has two objectives:
1) To implement flood mitigation measures that reduce risk to individuals and communities on the main stem and tributaries, and
2) To implement flood mitigation strategies in the upper basin that reduce risk locally and downstream.
This goal and its objectives for basin flooding are more than a printed statement. Since the instituting of the NRFP, numerous local entities throughout the basin—water resource boards, counties, cities—have adopted the overall NRFP as a tool to help guide management of their water resources. The RRBC regularly reviews local plans for their consistency with the goals and objectives of the NRFP, with the goal of supporting and forwarding plans that benefit local areas and the basin as a whole. The RRBC also prepares annual updates of projects throughout the basin that forward the plan’s objectives. This proactive NRFP, aimed at common goals of water and land management in the basin, and including a major goal on flooding, provided a broad, living context for the LTFS study.
Adding New Foundation: Long Term Flood Solutions Principles The basin has a long history of flooding, yet at the start of the LTFS study, no comprehensive principles relating specifically to basin flooding were in place. An early task of the LTFS study was to develop such principles, with the goal of arriving at basin-wide agreement on principles that can guide the study, planning, and implementation of strategies to address flooding problems. Because implementation of some of the study’s recommendations will take significant time, the principles were planned with the perspective of multiple decades in mind. Although reaching consensus on principles among water management leaders and officials representing the entire basin takes time and effort, it was determined that establishing explicit detailed principles to guide the development of a plan to respond to basin flooding issues was an investment that would pay dividends into the future. As an LTFS project consultant advised, “If principles [related to flood issues] are not deliberately set, they will come from somewhere.”
- 62 -
Those Long Term Flood Solutions Principles follow:56
COMPREHENSIVE BASIN-WIDE PROTECTION Principle 1: The Comprehensive Long Term Flood Solutions plan developed by the Red River Basin Commission, in partnership with the Red River Water Management Board (RRWMB), the Red River Joint Water Resource District Board (RRJWRDB), and Manitoba interests, should be the framework for federal, state, provincial, and local agencies and jurisdictions to implement those components of the plan that fall within their authorities, jurisdictions, and capabilities. The Plan will consider both existing and potential future development needs throughout the basin. Principle 2: Levels of flood protection goals for the Red River Basin are essential to a strategic and comprehensive approach to reduce the risk of flooding and flood damages throughout the Red River Basin so that basin residents have a more safe and secure place to live and contribute to the economic well-being of the region, North Dakota, South Dakota, Minnesota, Manitoba, the United States, and Canada. The Level of Flood Protection goals may not be initially achievable due to a variety of factors, including the cost of implementation; however, they provide a long-term vision and guidelines of what is needed for the basin. Principle 3: A comprehensive basin approach is critical to long-term success in reducing flood damages throughout the basin. The basin approach uses all appropriate measures to reduce or prevent flood damages, including levees, diversions, upstream storage, floodplain regulations and zoning, flood insurance, buyouts, and other structural and nonstructural measures. Principle 4: Floodplain regulations and zoning throughout the Red River basin should be uniform, consistent with state and provincial laws, and effectively implemented and enforced by appropriate local governments. Principle 5: Goals for the reduction in flood flows throughout the basin are essential to determining the locations, size, and operation of upstream floodwater storage.
UPSTREAM STORAGE, MULTIPLE PURPOSES, ADVERSE IMPACTS Principle 6: Controlling the volume and timing of runoff is the primary component of a comprehensive approach to reducing flood damages. This can be accomplished through a variety of measures that systematically detain and reduce runoff rate and volume so that peak flows are reduced. Principle 7: Components of the Long Term Flood Solutions plan will incorporate multiple purposes whenever possible consistent with the objectives of the Red River Basin Commission’s Natural Resources Framework Plan, including water quality, water supply, and fish and wildlife resources. Principle 8: Components of the Long Term Flood Solutions plan should avoid, minimize, or mitigate adverse impacts to the maximum extent possible.
56 The Long Term Flood Solutions Principles were developed by the LTFS’ Policy committee and approved in 2010 by the Red River Basin Commission board of directors.

- 63 -
COST-EFFECTIVENESS, SHARED RESPONSIBILITIES, PRIORITIZATION Principle 9: Cost effectiveness is an important measure of the value of the components of an overall Long Term Flood Solutions plan. However, cost-effectiveness is only one of many considerations in judging the overall merits of a plan. Principle 10: The Red River Basin Commission will facilitate the implementation of cross-jurisdictional partnerships for the implementation of the Long Term Flood Solutions plan and will also assist in the resolution of conflicts associated with the plan. Principle 11: Evaluation and prioritization of projects and components of the Long Term Flood Solutions plan will be facilitated by the Red River Basin Commission in conjunction with basin stakeholders. Principle 12: Progress to achieve the Long Term Flood Solutions plan goals and objectives should be measured and evaluated. The Red River Basin Commission will report the outcomes of implementing the plan on an annual basis. Principle 13: Basin residents, organizations and agencies at the local, state, and federal levels must have a shared responsibility and commitment to successfully implement the plan. Together, the Principles achieve a level of specificity and comprehension regarding flood planning and response never before achieved in Red River basin-wide planning.
Building Foundations: Review of Governance
The 2009 spring flood in the Red River basin served as an impetus for a renewed consideration of the existing and preferred processes and institutions through which decisions regarding water management are made in the basin. This consideration included an overview and assessment of the structures of governance already in place, and identification of new directions for strengthening basin leadership.
Overview of Governance Structures The consideration of basin governance was deemed especially important because of the complexities of multiple jurisdictions within the natural boundaries of the Red River basin. A summary of that overview follows. Complex Boundaries of State, Regional and National Governance The geographic area in the US portion of the basin is fragmented by differing water appropriation laws, with Minnesota’s water laws based on the common law doctrine of riparian rights, while North and South Dakota utilize a hybrid doctrine recognizing both riparian and appropriative water rights. Two USACE and FEMA districts operate and administer federal policies, often times differently from the other. Numerous other federal agencies that play a role in flood-related matters have similar dual presence and functioning in the basin. In addition, the international boundary is a source of diverging interests, varying policies and funding impediments. As a result, serious and contentious issues can plague the international boundary. Two of the three most recent and unresolved concerns along the boundary between Canada and the US relate to water quality: (1) release of waters from the Devils Lake subbasin; and (2) biota issues related to the Northwest Water Supply project and the Red River Valley

- 64 -
Water Supply project (both projects proposing to use Missouri River water in the Red River basin). A third issue concerns the Pembina border area road/dike that holds flood waters in North Dakota that would naturally flow into Manitoba. The Boundary Waters Treaty of 1909 provides the principles by which to resolve disputes. The IJC has authority to address border disputes if requested to do so by both countries and corresponding jurisdictions where the issue lies (by call for a Reference Study). Despite these challenges, the efforts of the RRBC have resulted in multi-jurisdictional cooperation between the US and Canadian portions of the basin on water supply, water quality, and, most recently, in planning for floodwater retention. Efforts at cooperation by local basin organizations in border areas are ongoing. Varying Structures of Local Water Governance At the most basic levels are local units of government that work to address water-related problems. These watershed districts in Minnesota and water resource districts in North Dakota carry out similar functions with somewhat different structures and mechanisms.
Minnesota In Minnesota, the boundaries of the districts follow those of a natural watershed, most of which are named after the primary lake or river within the watershed.57 Watershed districts are formed at the request of local citizens, county boards, or cities by petitioning the BWSR under the procedures set forth in the 1955 Watershed Act. The Ottertail watershed that encompasses parts of Wilkin and Otter Tail counties is not formally organized, although a process has been underway in 2011 through BWSR regarding its formation. Each watershed district is governed by a board of managers owning land in the watershed district who are appointed by the county boards of commissioners. Watershed districts are funded by several sources: an ad valorem levy to cover administrative expenses, special assessments for capital expenses, and grants or appropriations for special projects. Additional funding may be available if watershed districts choose to join one or more other watershed districts in a joint powers board. The current statutory purposes of watershed districts are “to conserve the natural resources of the state by land use planning, flood control, and other conservation projects by using sound scientific principles for the protection of public health and welfare and the provident use of ‘natural resources.’” Authorities given to watershed districts include those to:
• Adopt rules with the power of law to regulate, conserve, and control the use of water resources within the district;
• Contract with units of government and private and public corporations to carry out water resource management projects;
• Hire staff and contract with consultants; • Assess properties for benefits received and levy taxes to finance district administration; • Accept grant funds, both public and private, and encumber debt; • Acquire property needed for projects; • Acquire, construct, and operate drainage systems, dams, dikes, reservoirs, and water
supply systems; and
57 The Minnesota Legislature authorized the creation of watershed districts in 1955 through the Watershed Act with the idea that water management policies should be developed on a watershed basis, “because water does not follow political boundaries.”

- 65 -
• Enter upon lands within and without the district to make surveys and conduct investigations.
Eight Minnesota watershed districts within the Red River Valley form the joint Red River Watershed Management board (RRWMB). The RRWMB was created by an act of the Minnesota legislature in 1976 to provide an organization with a basin-wide perspective concerning flooding.58 The RRWMB’s jurisdiction and authority encompass the area managed by the individual watershed districts that have membership on the board. The unorganized watershed in Otter Tail and Wilkin counties is not a part of the RRWMB, and discussions are currently underway regarding whether the Buffalo-Red Watershed district will rejoin this joint board. The activities of the RRWMB to this point have centered largely on flood control. Most efforts to this end have focused on developing floodwater retention projects. Most have been single projects within a localized area, planned with primary regard to local benefits.
North Dakota North Dakota’s local governance units of water resource districts are organized primarily along county lines.59 Unlike Minnesota, state statutes require that all land in North Dakota be within a formal water resource district. Any two or more water resource districts may be consolidated into a single district or existing districts may be adjusted to reflect watershed boundaries, as determined by the State Engineer, by filing with the SWC a petition signed by a majority of the members of the board of each of the districts or 50% or more of the landowners within each of the districts. In addition, joint boards can be formed by agreement between two or more water resource districts.60 Water resource districts may jointly exercise any power in the agreement by which they are authorized. In North Dakota, the formation of joint water resource boards is one means to achieve coordination and communication among water resource districts in a common watershed. The powers and duties of water resource districts include authority to finance projects, together with regulatory and enforcement powers. Districts are specifically charged with the statutory responsibility to review and improve or deny permits for dikes, dams, and other devices either capable of retaining, impounding, diverting, or obstructing more than 12.5 acre feet of water, or that drain a pond, slough, or lake, or any series thereof with a watershed area of 80 acres or more. Water resource districts also have statutory responsibility to remove obstructions to artificial drains and restructure watercourses and to take enforcement actions for unauthorized construction of a dike, dam, or other device for retaining, obstructing, or diverting water, as well as for the unauthorized drainage of wetlands. Water resource districts finance their operations or local projects through a general district-wide mill levy of not more than four mills. Joint water resource boards may levy an additional two mills for water projects. Water resource districts may also use special assessments, user fees, revenue bonds or improvement warrants, and state or federal cost-sharing. Nearly all new water projects and many major maintenance projects receive a cost share from the SWC.
58 Membership watersheds include the Joe River, Two Rivers, Roseau River, Middle-Snake-Tamarac Rivers, Red Lake, Sand Hill River, Wild Rice, and Bois de Sioux. 59 Highly populated counties may have more than one water resource district. 60 North Dakota enacted the Joint Exercise of Powers Statute establishing the ability to form joint water resource districts in 1975 (NDCC 61-16.1-11).

- 66 -
South Dakota In South Dakota, conservation districts, organized by county, function under the South Dakota State Department of Environment and Natural Resources and have primary responsibility for drainage permits. Water development districts (WDDs) are political subdivisions of the state composed of multiple counties or portions of counties and charged by the state with promoting conservation, development, and proper management of water resources according to district priorities. WDDs provide technical, organizational and financial assistance to prospective and existing projects. Not all geographic areas of South Dakota are part of a WDD. In the South Dakota portion of the Red River basin, Marshall County is included in the James River WDD, and Roberts County is currently not a part of a WDD.
Basin Governance Beyond Local and Joint Districts The major study of the US portion of the basin in the 1960s, the Souris-Red-Rainy Basins Comprehensive Study (1972), was a federal effort aimed at understanding the Red River basin. Following that study, members of the study continued to meet to share information under the name of the Red River Water Resources Council (RRWRC). Following the major 1979 spring flood, a new round of efforts began when local leaders organized as the International Flood Coalition, later called The International Coalition for Land and Water Stewardship (TIC). Mayors of the regional cities joined other local leaders from smaller cities and towns, counties, watershed and water resource districts and rural municipalities (Manitoba) and together began adding their collective voice to basin governance, which, at that time, was mostly centered on individual state/provincial and federal agencies and elected officials working within their own political and agency boundaries. By the 1990s, the need was clear for stronger connections between state and provincial agencies in the basin to address permitting and water use issues. Responding to this need, TIC helped form the RRBB to bring state and provincial agencies into the governance structure. In 2002, TIC and the RRBB merged, to form the RRBC, based in Moorhead and Winnipeg. This new organization brought citizen/stakeholders together with local and state/provincial leadership in a new governance model and added tribal and environmental representation. Despite not having legislated authority to act, the RRBC has been the strongest model to date of bringing disparate basin interests together to address basin land and water management issues. Progress has been made by voluntary participation in the creation and achievement of a shared vision for the future. A second non-profit organization, the International Water Institute (IWI), based in Fargo, focuses primarily on providing a forum for research, public education, training and information dissemination relating to flood damage reduction and water resource protection and enhancement in the basin. IWI led the way in bringing LIDAR land imaging to the basin and is completing a Decision Support Network for the basin.
Identifying Further Means for Basin Governance:
The Red River Retention Authority (RRRA) Immediately following the 2009 flood, the question arose of whether the basin should have a strong, federally legislated authority. A number of US city, state and federal officials offered support for such a concept, pointing out the need for a single entity with which government agencies can work and that has the power to settle issues across state lines. The Fargo City Commission unanimously passed a resolution asking Congress to create a Red River valley

- 67 -
authority to control water quality and water retention in the watershed.61 Former US Senator Byron Dorgan (ND) spoke of the need for a “symphony director” with overarching authority.62 However, as discussions began to point out how such models can give non-elected administrators and board members the power to override local and/or state decision-making, interest in a federal authority subsided. During its LTFS study, the RRBC took up the discussion of governance as well. RRBC supported a trial attempt to organize the two joint basin boards, one comprised of Minnesota basin watershed districts and the other of North Dakota basin water resource districts, across state lines. The resulting organization, the RRRA, was formalized in 2010 by a Joint Powers agreement (see Appendix D, Exhibit D-20). The RRRA board is comprised of three appointees from each of the two joint basin boards, one non-voting member from the RRBC, and one non-voting member appointed by each of the two state governors. The legal agreement among the two joint boards allows the RRRA to solicit federal and state funding for storage projects. Although not created by state or federal government nor funded to date, the two joint boards will commit funding through their respective tax levies and state appropriations available through their joint boards, the RRWMB (Minnesota) and the RRJWRDB (North Dakota). At this point, the function of the RRRA is limited to planning and implementing flood storage and retention projects in the Minnesota and North Dakota portions of the basin. The RRRA Joint Powers agreement may be a first step, but it is an important tool in making possible the pooling of funds from the two major political jurisdictions for strategies and projects with regional significance for the basin. Currently, the RRRA is working with the congressional delegation from the region towards a possible provision in the next US Farm bill to streamline $50 million a year into the Red River Valley for flood protection, with the money to be used on retention projects in both states. In a manner following the Chesapeake Bay model in the 2007 farm bill, money would come from a baseline discretionary fund from the farm bill mandated for funding of retention projects in the basin. The five-year lifespan of the new bill’s baseline funding offers the potential to bring up to $250 million towards the goal of reducing flood flow through comprehensive retention, or, if expanded to 10 years, the potential is for $500 million of new federal funds to assist in the Red River basin retention projects.
Reforming and Strengthening Governance Identifying further opportunities to improve water management in the Red River basin needs to be ongoing, whether at the international, regional, state, or local level. The LTFS study has identified the need for regional offices to function more uniformly in the basin and has heard a number of suggestions to have a single coordinated regional office for the US portion of the basin. At the state level, legislative attempts have been made in North Dakota to organize water resource districts along watershed boundaries, but these attempts have failed, leaving the state to rely on joint boards to provide coordination within a watershed. In Minnesota, a number of studies continue to address the state’s water governance. The most recent, Moving Minnesota’s Water Governance Upstream (2009),63 recommends that government roles and responsibilities should promote a collaborative model with the public and among government entities, along with clear, benchmark reporting of progress. The report also urges the state to support local governments by providing data and tools that can be used by those implementing policies at the local level and by highlighting local successes. This report was preceded by the Minnesota Environmental Quality Board’s 2001 review of Minnesota state agencies with jurisdiction over
61 http://www.inforum.com/event/article/id/236483/, April 6, 2009. 62 http://www.inforum.com/event/article/id/270696/, March 10, 2010. 63 http://www.citizensleague.org/publications/reports/482.RPT.To%20the%20Source.pdf.

- 68 -
land and water issues, which identified 827 full time employees employed in 101 agency water programs.64 A year later, the Minnesota Planning report, “Charting a Course for the Future: Report of the State Water Program Reorganization Project,” includes recommendations for improved state agency coordination, greater support to local governments, and comprehensive data management revamping.65 On the local level, efforts have been made, with mixed results, to get the remaining Minnesota basin watershed(s) formally organized. A petition is being attempted to form a watershed district in the Ottertail-Wilkin watershed. Negotiations are ongoing between Buffalo-Red Watershed District and the RRWMB regarding that district’s membership on the joint board. On a legislative front, Minnesota State Representative Morris Lanning (Moorhead) has sponsored legislation that would provide incentives for watershed districts to be established so as to provide a contiguous line of governance in water resources across all geographic areas in the basin and state, and to generate more funding resources to make progress on water issues. Finally, as to the basin’s local water management organizations, although some streamlining occurred in 2002-2003 as noted earlier when organizations came together to form the RRBC, such a review should be ongoing as new challenges arise. One of the strengths of the RRBC, the facilitator of the LTFS study, is that the primary stakeholders in basin water resource management are at the table on the 41-member board, from local governments to watershed districts, state, provincial and federal agencies, environmentalists, tribal representation, and at-large citizens. However, questions remain about the level of authority appropriate to the organization. At this point, the RRBC relies upon a collaboration and facilitation model to advance solutions in the basin. Overall, governance issues for the basin should continue to be mediated, with the ideal outcomes of a less fragmented basin and of regular evaluations of basin-wide solutions not only on flood protection but other related water resource issues as well.
64 “Water Agencies in Minnesota State Government,” Minnesota Environmental Quality Board, http://www.eqb.state.mn.us/pdf/2001/waterplan.pdf. 65 http://www.gda.state.mn.us/pdf/2002/ChartingaCourse.pdf.

- 69 -
6 Preparing Data and Tools for Basin-wide Application
Technical capacities for addressing Red River basin flooding have advanced dramatically since 1997, with striking additions such as LIDAR mapping and detailed hydrologic and hydraulic computer models. The RRBC took the opportunity of the LTFS study to overview available technical capacities and hear updates from key players and agencies carrying out these advancements. As part of the study, the RRBC also assisted in completing, or supporting the completion, of tools such as MIKE 11 modeling or the Flood Damage Reduction Project Planning Tool, a program of geospatical and pre-processed data that can be used by local water managers for help in planning and facilitating projects. This chapter summarizes the LTFS’s project of compiling technical data and employing technical tools with the goal of increasing understanding of the basin’s waters and thus of establishing a basis from which informed decisions about responding to basin flooding can be made. The data compiled includes current profiles of the hydrology and hydraulic characteristics of the basin’s waters, together with initial examples of the kinds of conclusions that can be drawn about the behavior of those waters.
Hydrologic and Hydraulic Information
Understanding flood discharges and flood levels at locations throughout the basin is important to both management and design decisions at flood prone areas. Because no two floods are the same in the basin, it is important to understand both individual floods and longer-term patterns. Understanding the unique patterns of individual floods allows one to see how actions to deal with one flood may not address the issues of another. Understanding longer-term, basin-wide patterns of recurrence frequencies, peak flow rates, flood stages related to the flows, along with the timing of flows along the main stem of the Red River from the tributaries, provides a basin-wide overview from which to develop comprehensive plans.
Hydrology: The Occurrence of Waters in the Basin Analyzing measured amounts (discharge) of waters in the basin, together with level of elevation of floodwaters (stage) and the associated calculated frequency of floods is the most basic tool used for floodplain management. Compiling those overviews was an early task undertaken for the LTFS study. Flood History The first step in establishing baseline information for proposing appropriate long-term flood solutions is to understand past floods. This understanding can be complex because flood discharges and stages are measured by various federal and state agencies. More importantly, each flood affects locations in the basin differently. For example, the 1997 flood was the flood of record at Grand Forks-East Grand Forks and Emerson, Manitoba, whereas the 2009 flood was the flood of record at Wahpeton-Breckenridge and Fargo-Moorhead. Also, at Emerson, the 1950 flood was the second largest in recent history, but at Wahpeton-Breckenridge and Fargo-Moorhead it was considered a very small event (see Appendix B, B-1.2, pp. 25-27 for discussion of flood variability). In some instances, the flood of record on a tributary is associated

- 70 -
with summer rainfall and not spring runoff, such as the June 2002 flood at Roseau, Minnesota (see Appendix B, B-1.2.1.1, pp. 27-28 for discussion of summer rainfall vs. spring melt floods). In addition to understanding differences among magnitudes of past floods, statistical analysis of historically measured discharges and stages allows estimation of potential magnitude of extreme flood events before records were kept. These statistical analyses allow the estimation of “design floods,” and their associated recurrence frequency. This analysis, which engineers and planners use to design local protection measures, is a critically important tool for the basin, given current and forecasted wet conditions. Recurrence Frequency Information on recurrence frequency66 was collected for points throughout the basin on both the main stem and tributaries. This information is important in developing perspective on the size of floods that are possible in the Red River basin. Data was drawn primarily from the analyses done by various federal and state agencies between 2001 and 2003. The information also incorporates flood flows of the 1997 flood, and, if it was available, flood flows after 1997, including the 2009 flood, for comparison purposes. The discharge, or flow, was determined for locations throughout the basin for the 10-year, 50-year, 100-year, 200-year, and 500-year recurrence frequencies (see Appendix B, Table B-1). If available, for some locations the discharges for a simulated “Standard Project Flood” and “Probable Maximum Flood” are added for purposes of perspective. The Probable Maximum Flood is defined as the maximum flood that can reasonably be expected to occur at a location and is commonly used in the design of major dams to reduce the risk of dam failure consequences to as low as possible. The Standard Project Flood is approximately one-half of the Probable Maximum Flood. These models for two larger flood events can be helpful in determining the upper limit of flood risk. For additional perspective, peak discharge measured for the key floods of 1997 and 2009 are specified individually. The discharge data is based on the full length of gaging station records where these were available. In instances where gaging station records were limited or unavailable, data was drawn from historic floods or derived from correlations to nearby gaging stations that have longer periods of record. Comparison of historical peak discharges to discharges associated with the 100-, 200-, and 500-year recurrence frequencies shows that most major cities along the Red River main stem have only experienced floods somewhat greater than a 100-year magnitude. Although the basin experiences major floods almost annually, it has not experienced a truly extreme flood in recent history (see discussion in Appendix B, B-1.1.1.1, pp. 13-14).
Flood Stages Flood stages are also used for floodplain management purposes. The peak flood stage or elevation that a particular flood reaches at a location is critical in determining the degree to
66 Floods are often identified by recurrence interval, such as a “100-year flood.” Recurrence intervals are usually determined by performing statistical analyses on many years of flood elevation and flood discharge data. The more data available, the greater the confidence that can be placed in the estimated recurrence interval. New data, especially for larger and more infrequent floods, help refine estimated recurrence intervals and often lead to a change in the interval following a large flood. A 100-year flood has a 1% chance of being equaled or exceeded in any given year. A 500-year flood has a 1 in 500 or 0.2% chance of occurrence in any given year. The risk of a 100-year flood is the same every year, regardless of whether there was a 100-year flood the year before or 99 years before. The terms 100-year flood, 100-year recurrence interval flood, 100-year frequency flood, 1% flood, 1% annual chance flood and, in the US, base flood, all refer to the same event and are used interchangeably (from International Joint Commission, Living with the Red).

- 71 -
which the location is subject to damage from a flood and, if protection measures are taken, the water level it must be protected against. Estimated flood stages were compiled for multiple Red River main stem and tributary sites across the basin for 10-year, 50-year, 100-year, 200-year, and 500-year flood events, together with 1997 flood stages at these sites (see Appendix B, Table B-2). Estimated flood stages for the 100-year, 200-year, and 500-year floods for six locations along the Red River are shown in the following table, which also contains peak stages for several of the largest recent floods, including the 1997 and 2009 floods. The estimated recurrence frequency and the relative ranking of the actual flood stages are based on the analysis or measurement of the discharges. Site conditions for each actual flood may result in differing flood stages from the estimated stage based on the discharge. For example, the construction of a flood diversion channel at Wahpeton-Breckenridge in 2005 resulted in lower flood stages for the 2006, 2009, and 2011 floods (see Appendix B, B-1.1.1.2, p. 14 for further discussion). Flood Stage Information along the Main Stem of the Red River
Measurements of flood stage are taken at a specific point, normally a gaging station location, and are unique to that particular location (see Appendix B, Table B-3 for detail by city of source information for discharge and stage date). Relationship between Discharge and Stage Each location on a river has a unique relationship between stage and discharge, which is called a rating curve. These rating curves typically vary from one flood to the next and one location to another and are not precise, as there are many variables. These rating curves are based on actual measurements for past floods and also on hydraulic computer models for floods that exceed floods of record. The actual flood elevation for a specific discharge can be impacted by local floodplain topography and by human-made and natural obstacles to flow, including levees, ice, and debris. To illustrate the variation for larger floods between locations, a flow of 5,000 cfs at Fargo-Moorhead will result in a one-foot increase in flood level, whereas at Emerson it takes a flow of 50,000 cfs to increase the flood level by one foot (see Appendix B, B-1.2.1.2, pp. 28-29, and Figure B-9). Variation in Period of Record Recurrence intervals (e.g., 50-year, 100-year, 500-year floods) are determined by historical data/measurements. As more discharge and stage information is made available with each year’s experience, those recurrence intervals are recalculated. This recalculation often follows large flood events.

- 72 -
The current USACE study for the Fargo-Moorhead and Metro Flood Risk Management project includes a consideration of updated recurrence intervals for portions of the Red River main stem from Hickson to Emerson. These evaluations show that, with the additional 12 years of discharge data including the 2009 flood, the computed discharges estimated for the 50-year, 100-year, 200-year, and 500-year floods for the Fargo-Moorhead area are larger than the discharges developed using data through the 1997 flood (see Appendix B, B-1.1.2, pp. 15-19 for full discussion). Non-Contributing Areas/Closed Basin Lakes The topography of some areas within the Red River basin prevents water from flowing downstream; instead, rainfall and runoff from the direct surrounding area is contained and amassed in a lake or a wetland area. These areas do not have natural outflows and do not contribute to flood discharges on the main stem or tributaries of the Red River until they overflow, as has been the case recently for many lakes in Minnesota and may be the case for Devils Lake, the largest and best known closed basin lake, in the near future (see Appendix A, Maps 13 – 22, for detailed illustration of non-contributing areas). Closed basin lakes are an excellent indicator of overall climate patterns of the basin. If conditions are wet, i.e., if precipitation levels exceed evaporation levels, lake levels will rise. Conversely, if conditions are dry, lake levels will fall. The current historic elevation of Devils Lake points to the exceptional flooding conditions currently being experienced in the Red River basin (see figure of this historic rise in Devils Lake in Chapter 1). Devils Lake has risen from an elevation of 1,422.62 in 1993 to 1,454.1 in May 2011. The lake will naturally overflow into the Sheyenne River at an elevation of 1,458 feet. An emergency outlet is making minimal withdrawals at a rate of 250 cfs in the ice-free season, subject to downstream capacity and water quality restrictions. The SWC has plans to increase the capacity of the pumped outlet to 350 cfs in 2011, and the addition of a gravity flow outlet with a capacity of approximately 250 cfs is planned to be operational in 2011 or 2012. It is during this same time span in which Devils Lake has reached historic levels that the Red River and its tributaries have experienced frequent spring and summer flooding, including two floods of record. Along with exceptional flooding from the typical contributing parts of the basin, the Red River tributaries and main stem are facing increased base flow from the operating outlet(s) at Devils Lake and/or the potential for catastrophic overflow from that closed basin. All this is occurring, as the indices of Devils Lake and other closed basin lakes suggest, in conditions of continuing wet climate.
Hydraulics: Runoff and Flood Routing Models To develop baseline information on the basin’s hydraulic or flow characteristics and potential, the RRBC, as part of the LTFS study, reviewed and supported development and application of hydraulic technologies. Runoff Models Runoff models are important in understanding the specific characteristics of each watershed with respect to how runoff from that watershed occurs during spring snowmelt or after summer rainfall events. In particular, the models can analyze potential flood storage sites, including the potential effects a particular storage site might have on downstream areas. These runoff models can be of various types, ranging from HEC-1 and TR-20 to the currently preferred HEC-HMS.

- 73 -
Runoff models are complete for most Red River subbasins (see Appendix B, B-1.3.2 and B-1.3.3, pp. 53-57 for modeling status of individual Minnesota and North Dakota subbasins), allowing estimation of peak discharges for synthetic events (e.g., 100-year, 500-year) along with the impact additional storage would have on reducing discharges in such events in the subbasins. As part of the LTFS study, the 1997 flood hydrograph for each subbasin was used, together with the basin’s existing runoff model where available, to estimate the effects of proposed additional flood storage within each tributary watershed. This estimate was then used to evaluate whether the flow reduction goals for that tributary, and for the Red River, are achievable. Due to lack of runoff models for every subbasin and the varying levels of detail and reliability of the existing models, only preliminary assessments were possible. Because of inconsistencies in existing runoff models throughout the basin, HEC-HMS runoff models are being standardized and expanded to all subbasins (see Appendix B, B-1.3.1 pp. 49-52 for discussion of models, including the updated HMS).67 The upgraded models, which will include the use of the more detailed LIDAR elevation data, are scheduled to be completed in 2012.
Flood Routing Models Flood routing or hydraulic models are important in understanding floods and the effects changes in the floodplain or in tributary watersheds can have on flood flows and flood levels. A flood routing model can take the flood hydrograph from one point on a river and route it to a downstream location, taking into account the characteristics of the floodplain between the points and the contributions of tributary streams. For purposes of the LTFS study, RRBC assisted in completing the calibration of MIKE 11, a flow routing model based on the 1997 flood (see Appendix B, B-2.1, pp. 57-58 for details of MIKE 11). MIKE 11 was used to determine the composite results of runoff modeling by subbasins to estimate impacts of potential reductions on discharge and peak flows on the main stem for the 1997 flood, with the goal of determining whether a 20% flow reduction of 1997 levels can be achieved along the Red River main stem to the Canadian border (results are discussed in Chapter 9).
Applications to Flood Risk Management
As noted, advances have been made in computer models to describe hydrologic and hydraulic relationships and interactions in the basin. LIDAR, a tool to acquire highly accurate land elevations for the entire Red River basin, has also been made available for the US portion of the basin. The results are an improved ability to understand and manage runoff and flow. In particular, the LTFS study examined the timing of runoff in relationship to contributing/non-contributing areas and the timing of flows, together with ways to use technology to improve and expedite the planning and carrying out of projects.
Timing of Runoff and Identification of Contributing and
Non-contributing Areas Applications of the understanding of basin hydrology and hydraulics include identifying the timing of runoff as related to peak flood flows and the areas of the basin that contribute the most and the least to that runoff. The following map developed by Agriculture Canada depicting non-contributing drainage areas in the Red River basin is an early generalized attempt to identify areas that do not contribute waters to the basin’s tributaries and main stem. The LTFS study
67 Upgrading the HEC-HMS runoff models is being done as part of USACE’s basin-wide study and its Fargo-Moorhead Metro Flood Risk Management Project Feasibility study.

- 74 -
prepared a more detailed analysis for US portions of the basin with maps of a number of tributaries depicting non-contributing areas, together with travel time estimates for runoff (see Appendix A, Maps A-14 to A-22).68
Timing of Runoff: Early, Middle, Late Waters The concept of early, middle, and late runoff areas relative to the hydrograph on the Red River at the US/Canada Border was originally identified in a study for the state of Minnesota by the Red River Basin Flood Damage Reduction Work Group in 2004. The study produced by the work group, “Red River Basin Flooding Damage Reduction Framework,” identifies and maps three runoff timing zones in the basin (see Appendix D, Exhibit D-1 for full study). The zones identified are based on evaluations of historical flood hydrographs, knowledge of recent floods, and computed runoff travel times. The three timing zones are:
• Early: Runoff from early areas arrives at Emerson, Manitoba, before the peak flood flows.
• Middle: Runoff from middle areas arrives at Emerson, Manitoba, about the same time as and contributes to the peak flood flows.
• Late: Runoff from late areas arrives at Emerson, Manitoba, after the peak flood flows.
68
Those subbasins included in the contributing/non-contributing analysis are Bois De Sioux, Otter Tail, Buffalo, Wild Rice MN, Wild Rice ND, Sheyenne (two maps), Maple and Elm.

- 75 -
The study explains that certain flood damage reduction alternatives are more appropriate than others depending upon the timing zone. For example, impoundments and storage sites are most effectively located in middle and late areas; channelization and drainage are most effectively located in early areas. Timing of flows from tributaries can be extremely important in estimating their effect on the flood hydrograph on the Red River main stem. Appendix A, Map 11, “Timing Zones: Early, Middle, Late,” presents the timing of the flows from the various parts of the watershed with respect to the flood hydrograph on the Red River as it crosses the border into Canada at Emerson, Manitoba (see Appendix A, A-3.1, pp. 5-6). The study makes clear the lines between early, middle, and late waters are not exact, and each flood damage reduction project needs to be fully analyzed to understand its potential effects on the peak flows on the Red River. Yet the concept, with the assistance of modeling tools, opens the door to better understanding and more comprehensive management of basin floodwaters. Relative Contributions to Red River Peak Flows: Zones Map A-12, “Basin-wide Flood Timing Zone Map: Relative Contributions to Red River Peak Flows,” presents the roles various parts of the tributary watersheds play in the relative amounts they contribute to the peak on the Red River. As such, it suggests the potential effectiveness additional flood storage in these areas could have in reducing peak flood flows on the Red River. The fives zones illustrated on Map A-12 classify an area’s relative potential for contributing to peak flood flows on the Red River main stem combined with the area’s relative potential to reduce main stem peak flow by adding flood storage. These zones range from very low to very high, with ratings based on the following considerations:
• Timing of runoff from the tributary area with respect to its contribution to the Red River flood peak flows,
• Effectiveness of existing flood storage projects, • Magnitude of the tributary flow contribution, and • Potential for flood storage in an area to control runoff from upstream areas that would
typically contribute to the peaks on the main stem. Using the above considerations, watershed areas were classified into the following zones:
1) Very High: For most floods, flood flow contributions from this portion of the watershed coincide with flood peaks on the Red River; the contributions are of significant magnitude; and addition of flood storage in this area is very likely to reduce peak flood flows on the Red River.
2) High: For most or many floods, flood flow contributions from this portion of the watershed are likely to coincide with flood peaks on the Red River; the contributions may be of significant magnitude; and/or addition of flood storage in this area could reduce peak flood flows on the Red River.
3) Medium: For some floods, flood flow contributions from this portion of the watershed coincide near flood peaks on the Red River; the contributions may be of some measurable magnitude; and/or addition of flood storage in this area could reduce peak flood flows on the Red River by some amount for some flood events.
4) Low: For most floods, flood flow contributions from this portion of the watershed generally do not coincide with flood peaks on the Red River; the contributions may be of very small magnitude; and/or addition of flood storage in this area is not likely to reduce peak flood flows on the Red River.
- 76 -
5) Very Low: For almost all floods, flood flow contributions from this portion of the watershed do not coincide with flood peaks on the Red River; the contributions are of small magnitude; and/or addition of flood storage in this area is very unlikely to reduce peak flood flows on the Red River.
(See Appendix A, A-3.2, pp. 7-18 for detailed discussion of zones, including examples of application of the above categories to specific areas of the basin.) Map A-12 is intended to be a general guide to understanding the relative differences that various areas of the Red River basin play in the floods along the Red River main stem. It is not intended as a definitive evaluation tool for individual proposed flood storage projects. Each proposed flood storage project, regardless of the zone in which it is located, would need to be analyzed to identify specifically the effects the project would have on flood flows along the main stem. Timing of Tributary Flows Timing of flows from the various tributaries can make a significant difference in the relative magnitude of flood flows and stages on the Red River main stem. For this reason, the LTFS study compiled historical hydrograph comparisons of the flow contributions during key floods since 1969 from drainage areas upstream of Fargo-Moorhead, Halstad, Grand Forks-East Grand Forks, Drayton, and Emerson on the Red River. Eight large floods were reviewed at Fargo-Moorhead and Halstad and the most relevant of these flood events at other locations. The hydrographs, which show the discharge of a river over time, were compiled from measurements taken by the USGS and USACE. The goal of the hydrograph analysis is to show the general timing of runoff and relative contributions of various tributaries and flood storage impoundments on historical peak floods. These comparisons assist in demonstrating relative contributions of various tributaries and portions of a tributary watershed that are the primary contributors to peak flows. The hydrographs presented are not intended to represent a complete or comprehensive analysis of historical flood events, nor are the hydrographs derived from a hydraulic model and/or intended to be viewed as a tool to predict the exact nature of future floods. With these precautions, one can draw information from the hydrographs concerning relative contributions of various tributaries and the role of major upstream flood storage on the Red River peak flows (see Appendix B, Figures B-11 to B-75 for individual hydrographs and B-1.2.3, pp. 32-41 for discussion).69 For example, as illustrated by Figures B-11 to B-26, the Bois de Sioux and Otter Tail Rivers join to form the Red River at Wahpeton/Breckenridge. However, there is a significant drainage area fed by the Rabbit River that enters the Bois de Sioux River downstream of White Rock Dam. The Wild Rice River flows into the Red River just upstream of Fargo/Moorhead. Again, there is a fairly large drainage area between Wahpeton/Breckenridge and where the Wild Rice River joins the Red. This portion of the upper Red subbasin entering the Red River between Wahpeton/ Breckenridge and Fargo/Moorhead can be better understood by looking at Red River flood flows at Hickson.
69 Reviewing the basin-wide Maps A-1 and A-2 and also the subbasin Maps A-3 through A-10 located in Appendix A concurrently with the hydrographs assists in fully understanding the information presented in the hydrographs.
- 77 -
A number of other observations can be made concerning relative contributions of various tributaries and effects of major upstream flood storage on Red River peak flood flows at several locations. Some of these observations are described below. B-1.2.3.1 Fargo/Moorhead White Rock Dam on the Bois de Sioux River played a key role in reducing peak flood flows at Wahpeton/Breckenridge and Fargo/Moorhead for all the floods investigated (Figures B-11 to B-26). Additional storage in the drainage basin upstream of White Rock Dam would not have increased the dam’s effectiveness during the 2009, 2010, 2006, 1979, 1969, 2001, or 2011 floods; however it could have increased the dam’s effectiveness for the 1997 flood (Figures B-11 to B-26). Orwell Dam on the Otter Tail River had minimal effects on peak flood flows at Wahpeton/ Breckenridge and Fargo/Moorhead (Figures B-11, B-13, B-15, B-17, B-19, B-21, B-23, and B-25). Drainage areas that contribute the most to peak flows at Fargo/Moorhead are areas upstream of Wahpeton/Breckenridge but downstream of White Rock and Orwell Dams (in particular the Rabbit River subwatershed) and the Wild Rice River (ND) subbasin (Figures B-11 to B-26). Portions of the upper Red subbasin (as shown in the Red River at Hickson hydrograph) played a fairly significant role in the 2009 and 2006 floods (Figures B-12 and B-18). In the Wild Rice River (ND) subbasin, the drainage area upstream of Mantador did not appear to have significant contributions to the peak at Fargo/Moorhead during the 2010 or 2011 floods. The drainage area upstream of Dwight on Antelope Creek contributes to peaks at Abercrombie and Fargo/Moorhead (Figures B-73 to B-75). B-1.2.3.2 Halstad Peak flows from the Red River upstream of Fargo/Moorhead, including the Buffalo, Maple, and Wild Rice (MN) Rivers subbasins, all contribute to peak flows at Halstad (Figures B-27 to B-34). Figures B-35 to B-42 provide additional information on the role of the Sheyenne, Maple, and Rush Rivers as related to the peak flows at Halstad. Peak flows at Fargo/Moorhead typically contributed significantly to peak flows at Halstad, and, with an average of 3 days of travel time routed to Halstad, play a major role in Halstad’s peak. Peak flows from the Buffalo River at Dilworth appeared typically to arrive at Halstad before Halstad’s peak, with the exception of the 1997 flood. For the 1997 flood, the Buffalo River experienced two peaks, likely due to the blizzard that occurred on April 5-6 that inhibited flows. The second peaks from both the South Branch Buffalo River and the Buffalo River main stem contributed to the peak at Halstad for the 1997 flood (Figure B-68). The Wild Rice River (MN) flows typically contributed to the peak at Halstad, ranging from the peak on the Wild Rice coinciding with the peak at Halstad or contributing flow on the rising side of Halstad’s hydrograph. The Sheyenne River at Kindred did contribute flows to the peak at Halstad; however, for most floods, especially for the 1997, 2009, 2010, and 2011 floods, the largest peak flow and greatest volume of flow from the Sheyenne River at Kindred occurred after the peak of the Red River at

- 78 -
Halstad (Figures B-35 to B-42). This is further analyzed and illustrated in Figures B-43 to B-47 which show the routing of flows from Baldhill Dam through Valley City, Lisbon, Kindred, and West Fargo. For example, for the 2009 flood (Figure B-43), the figure shows Baldhill Dam made significant flow reductions from the inflow, and the resulting peak flow from Baldhill Dam routed on downstream until arriving at Kindred. Just upstream of the gage at Kindred, major overbank breakout flows occur which reduce and stabilize the amount of water staying in the river channel from Kindred through West Fargo. Therefore, the majority of the flow from the Sheyenne River upstream of Kindred that contributes to peak flows at Halstad comes from the Lower Sheyenne drainage area downstream of Baldhill Dam. The Maple River near Mapleton hydrographs show the Maple River has contributed to peak flows at Halstad for most floods. The Maple River Dam, which was completed in the fall of 2006, has reduced flows from the Maple River that contribute to the Halstad peaks. For the 2009 flood, the Maple River at the Maple River Dam experienced two distinct peaks. The Maple River Dam had a significant effect on reducing the first peak flows from the drainage area upstream of the dam and had potential reductions to the peak at Halstad. The second peak on the Maple River occurred about two weeks after the peak flows on the Red River at Halstad and was too late to contribute to the peak flow at Halstad (Figure B-35). The Maple River Dam also played a role in reducing flows from the drainage area upstream of the dam and had potential reductions to the peak at Halstad in 2010 (Figure B-37). The Maple River Dam reduced the two distinct peaks during the 2011 flood; however, both peaks occurred after the peak on the Red River at Halstad (Figure B-42). The drainage area downstream of the Maple River dam remains a contributor to the peak flows at Halstad. The Rush River appears to be contributing to peak flows at Halstad for most floods, although at relative low flow amounts. B-1.2.3.3 Sheyenne River Baldhill Dam reduced peak flows at Valley City for all floods due to its location immediately upstream and also reduced peak flows at Lisbon, although the relative reductions in the peak flows are somewhat less. Major breakout flows start to occur on Sheyenne River near Kindred. Peak flows at Valley City, Lisbon, and Kindred came primarily from the drainage area upstream of Baldhill Dam (Figures B-43 to B-47). B-1.2.3.4 Major Dams Three of the four major dams presented in these hydrographs (Figures B-48 to B-52), White Rock Dam, Baldhill Dam and Maple River Dam, were all effective in reducing peak flows. Orwell Dam, with its limited storage capacity, was generally not very effective except in the immediate downstream reach. White Rock Dam, with the largest volume of flood storage, was the most effective in attenuating peak flows along the Red River main stem, due to its location in the watershed. B-1.2.3.5 Grand Forks/East Grand Forks Only the 1997, 2009, and 2011 floods were plotted for Grand Forks/East Grand Forks. Peak flows from the Red River upstream of Halstad contributed the largest percent of flow to the Grand Forks/East Grand Forks peaks (Figures B-53 to B-55). The Red Lake River peak flows in 1997 and 2011 contributed significant amounts to the peaks at Grand Forks/East Grand Forks, but in 2009, the Red Lake River peak flows arrived about a week before the peaks on the Red River.

- 79 -
The Marsh River (Figure B-70) and the Sand Hill River and Goose River subbasins contribute somewhat to peak flows at Grand Forks/East Grand Forks (Figures B-53 to B-55). For the 1997 and 2009 floods, the Goose River at Hillsboro had two peaks (Figures B-53 and B-54). For both floods, the first peak on the Goose River occurred before the peak of the Red River at Grand Forks/East Grand Forks. The second peak from the 1997 flood contributed to the peak of the Red River at Grand Forks/East Grand Forks, whereas the second peak from the 2009 flood occurred after the peak of the Red River at Grand Forks/East Grand Forks. For the 1969 flood, the Goose River had one peak and both the north and south branches of the Goose River contributed to the Red River’s peak at Grand Forks/East Grand Forks (Figure B-72). There are no gages on the Elm River, so the exact timing and total contribution from this tributary to the peak on the Red River at Grand Forks is unknown. B-1.2.3.6 Red Lake River Peak flows from the Clearwater River subbasin and the Red Lake River subbasin downstream of Thief River Falls contribute the most to peak flows on the Red Lake River at Crookston (Figures B-56 and B-57). The Thief River subbasin and areas upstream of the Red Lake Dam contribute very little to peak flows at Crookston. B-1.2.3.7 Drayton Peak flows from the Red River upstream of Grand Forks/East Grand Forks contribute the most to peak flows at Drayton (Figures B-58, B-59, and B-70). For the 2009 flood, the Forest River, Snake River, Middle River, Turtle River and Park River had two peaks, but the first occurred much before the peak at Drayton and the second occurred much after the peak at Drayton (Figures B-58 and B-70). For the 1997 flood, all five of these tributaries contributed to the peak flow at Drayton (Figure B-59). There are no gages on Grand Marais Creek, so the exact timing and total contribution from this tributary to the peak on the Red River at Drayton is unknown. B-1.2.3.8 Emerson For most floods, the flood wave that starts in the southern reaches of the basin near Fargo/Moorhead continues along the Red River all the way to Emerson as shown in Hydrographs B-62 to B-67. In general, the actual timing of peak flows along the Red River main stem is very similar to the average approximate travel times presented in Table B-11. Some exceptions include actual difference in date of peaks for the 2009 flood between Drayton and Emerson of 10 days instead of the average approximate travel time of 3 days. For the 2010 and 2006 floods, the peak flow at Grand Forks/East Grand Forks actually occurred one day earlier than at Halstad (instead the norm of 3 days later). The actual difference in the date of the peaks for the 2010 flood between Grand Forks/East Grand Forks and Drayton was 7 days instead of the average approximate travel time of 4 days. The peak flows in 2010 along the Red River may have been complicated by the presence of ice. Although the actual peaks may vary by a few days, it is clear that once the flood starts in the southern basin, that peak flow will form the main part of the flood hydrograph downstream. Each flood will have some variations as the flood peak continues downstream due mainly to the timing and volumes of inflows from tributaries as it proceeds northward. Peak flows from the Red River upstream of Drayton contribute the most to peak flows at Emerson (Figures B-60 and B-61), as evidenced by Drayton’s peak flow being over 90% of the peak flow at Emerson. The Pembina River made a significant contribution to the 1997 flood at Emerson, but in 2009, the Pembina River came into the Red after the peak at Emerson. The Two Rivers does contribute somewhat. The Tongue River contributes very little to the peak at Emerson. There is a large ungaged area on both sides of the Red River between Drayton and

- 80 -
Emerson, so the exact timing and total contribution from this ungaged area to the peak on the Red River at Emerson is unknown. B-1.2.3.9 Other Tributaries The Buffalo River upstream of Halstad, presented in Figure B-68, shows two distinct peaks from the Buffalo River for the flood of 1997, with the first peak that reached the Red River about one week ahead of the peak on the Red at Halstad and the second peak that coincided with the peak on the Red. The Wild Rice River (MN), presented in Figure B-69, shows that the majority of runoff for the 1997 flood from the drainage area upstream of Twin Valley MN arrived about one week before the peak on the Red at Halstad. The Goose River, presented in Figure B-72 shows runoff during the 1969 flood coincided with and added to peak flows on the Red River at Grand Forks/East Grand Forks. The Wild Rice River (SD/ND) presented in Figures B-73 to B-75, shows that runoff from the Antelope Creek portion of the drainage area during the 2009, 2010, and 2011 floods contributed significantly to the peak flows at Fargo/Moorhead. Also, flows from the drainage area upstream of Mantador arrived at the Red River somewhat after the Red River peak flows.
A Basin-wide Tool for Implementation:
The Decision Support System, Phase 6 Local water boards often encounter delays in developing and implementing flood-related projects. To address this issue, the RRBC through its LTFS study supported the development of the Flood Damage Reduction Project Planning Tool. This Project Planning Tool is a user-friendly web application that offers water/land managers geospatial tools and pre-processed data that can improve and streamline project planning and permitting.70 The LTFS support allowed for the components and preparation and piloting of the tool in two watersheds.71 Materials developed for land and water managers in the two pilot watersheds included the following:
• A clear, consistent process (from problem identification to site selection); • Online decision support (mapping tool, project effectiveness tool, permit related reports,
watershed report, new pre-processed LIDAR-derived data projects, permit complexity map);
• Documentation system for project planning, including methods for alternatives analysis consistent with permit requirements; and
• Methods for consistent and transparent project development for review by the public, legislators/funders, board members, local officials, etc.
In specific, the following products will be made available to the pilot watersheds to test their applications:
• Map layers from LiDAR for use in a web-based application that help users identify specific areas on the landscape with the potential to store floodwaters;
70 The Flood Damage Reduction Project Planning Tool is Phase 6 of the Decision Support Network being developed by IWI (see Appendix D, Exhibit D-22). 71 Moccasin Creek watershed in Minnesota and the North Branch of the Park River in North Dakota.

- 81 -
• Map layer for use in a web-based application that helps users identify relative permit complexity based on permit history from the past 10 years;
• Comprehensive decision support system to assess and document project planning, review permit requirements, conduct an alternatives analysis, select sites for comprehensive flood damage reduction, and print reports to document the planning process (see figure below);
• An interactive online application that allows users to evaluate the relative effect of typical flood damage reduction projects (i.e., water storage, land-use change, etc. ) on downstream hydrology at an identified problem area (pre- and post-project hydrograph).
Future steps will include developing data products needed to expand the system to other watersheds in the basin, building additional tools and planning capabilities into the system, integrating new NRCS data and tools into the system, and conducting public education and outreach to increase awareness and use of the system. The following figure summarizes the components of the Flood Damage Reduction Project Planning Tool, including planning steps, tools to carry out the process, and reports required for the process of project planning (see Appendix D, Figure D-7).

- 82 -
Part III: CORNERSTONE SOLUTIONS
7 Floodplain Management – Nonstructural Strategies
Floodplain management in the Red River basin has a long history and is characterized by the challenges posed by the basin’s exceptionally broad basin bottom, lacking as it does the higher elevations of typical carved out river valleys. Early nomadic natives and trappers lived in structures that were moved as floods materialized. The earliest European settlers built on only slightly higher areas of a landscape that were largely wetlands. The railroads brought more development and further infringement into the large floodplain areas. The resulting challenges for the basin in floodplain management are illustrated by the following graphic depicting a cross-section of the Red River main stem at Fargo-Moorhead. The graphic depicts an exceptionally broad floodplain spreading out for many miles on both sides of the river. At some points, the large floodplain is wider on one side of the river; at other points, wider on the other side.

- 83 -
Heightening the challenge for the basin is the growing realization that, as in other areas of the continent and world, instances of natural disasters such as flooding are becoming frequent enough that they must be included in all current planning and readiness. In the instance of flooding, planning must include not only the basin’s floodplain areas most immediately impacted by flooding, but also all areas of the basin that contribute waters to the tributaries and main stem Red River. Together, the basic geological, settlement, and climate factors add up to the need for considered and innovative management of the Red River basin’s floodplains, management that will require several complementary approaches applied basin wide.
Definitions
A first, most fundamental approach to floodplain management is through nonstructural approaches. While nonstructural approaches can include many potential strategies or actions, they begin with consideration of the physical and regulatory floodplain and typically focus on land use practices, with attention to individual structures.
Floodplain Floodplains can be defined as natural geological phenomena, providing functions from carrying flood flows to recharging aquifers. They can also be defined in terms brought about by human use of floodplain areas. Geological Definition In geological terms, a floodplain is a flat surface that can be submerged by floodwaters. This is typically the areas of land next to, or hydraulically or ecologically connected to, the flowing river. In the instance of young river systems such as the Red River and its tributaries, a floodplain is in the process of being built. Thus, a floodplain is a dynamic process, complete with its own unique geological and biological processes. As a result, today’s floodplain is not tomorrow’s. Floodplain management must account for this fact by projecting planning, as illustrated by considering the average lifespan of a building, well into the future.72 Legal/Legislative Definitions The size of a legal floodplain is relative and depends upon the area of land determined to require some form of regulation. In the US, the 100-year flood event (1% annual chance flood) has been adopted as the basic floodplain used by the NFIP and in land use planning. As part of regulatory actions for the current 100-year floodplain, definitions for parts of a floodplain have been developed.
“Regulatory Use” vs. “Non-regulatory Use” “Regulatory use” areas of floodplains have been identified for purposes of prohibiting development in certain areas, or limiting development to, for example, the 25-year or 50-year flood. These regulatory use areas, together with the “floodway” or zone of flowing water in the river channel and typical over bank areas, together constitute the “regulatory flood” area.
72 Edward Thomas, a long-time professional in floodplain mitigation with the Federal Emergency Management Agency and consultant to RRBC for the LTFS study, estimates the current life of a new structure at 165 years.

- 84 -
A third zone, “non-regulated use” is just that: lands where risk of flooding is low and thus that have no code or restrictions prohibiting placement of buildings.
Definitions Used by the NFIP The most familiar definitions of the floodplain in the US portion of the Red River basin are those employed by FEMA in the NFIP. Tools central to the NFIP are floodplain maps that identify flood prone areas for purposes of applying the NFIP. The program’s Base Flood Elevation (BFE), currently defined by FEMA at the 100-year or 1% flood level, determines the extent of a river’s floodplain for the purposes of applying the program. In the past, the NFIP also identified “Special Hazard Areas” (SFHA). These areas typically lie adjacent to floodplains and require a lesser level of regulation than the 100-year floodplain. Currently, NFIP mapping of floodplains is being converted to a system of Flood Insurance Rate Maps (FIRMs). The FIRMs continue to show the area of the 100-year floodplain but with the addition of actual elevations of floodwater potential and, in some instances, inundation areas for 500-year as well as 100-year floods. These additional features of FIRMs replace the “Special Hazard Areas.” Because each year’s river stages and discharge levels add new data to the historical record, floodplain boundaries must be updated to reflect the most recent composite data. The NFIP has been updating those maps for the Red River basin (US portion) in the last several years. Updated definitions and maps can and often do lag behind the physical reality of, and current data for, floodplain areas.
Floodplain Management What distinguishes nonstructural approaches from other kinds of solutions is their focus on land use and on regulating human actions rather than water. As defined by the North Dakota SWC, managing a floodplain involves “determin[ing] how human activity can best build, develop, or redevelop relative to an identified flood hazard. All this is intended to help to break the seemingly unrelenting cycle of disaster-relief-repair-disaster.”73 Floodplain management is necessarily long term and comprehensive. It requires a future perspective and coordinated rather than piecemeal actions. As an example, the life of an average house is not just the time a family intends to live in it, but the many decades others will live in it as well. If that house is built in or near a floodplain, its elevation and flood-proofing features make a big difference in that house’s achieving its average lifespan. Multiply that house by all the houses in a development built to current minimum standards where current standards will likely not suffice for the houses’ average lifetime of a century and a half, and the importance of making the right decisions today becomes very evident. Similarly, if one looks at agricultural-related practices, existing surface drains, new tile drainage systems and dikes are often accepted as rights. Good field drainage, as we know, is one of the most important components for agricultural production. Once established, however, local drainage can have effect on floodplains for decades into the future, beyond any single farming operation. Currently, little is known about these effects as they relate to flooding. Finally, development and land use practices must be considered in the entire contributing drainage basin, whether or not that area itself experiences flooding. Floodplains work for the
73 2009 State Water Management Plan, p. 56.

- 85 -
entire basin by providing areas for flow of excess waters. Because everyone living in the basin benefits from an optimally-functioning floodplain, all must engage in keeping it functioning and healthy and have a responsibility in its management.
Current Floodplain Legislation
Many entities have roles in the important task of determining how floodplains are managed. Together, federal agencies and legislation, state laws and practices, groups such as the Association of State Floodplain Managers (ASFPM), and the priorities and decisions of local water managers determine the use and well-being of the natural phenomenon of floodplains. Following are summaries of current federal and state legislation regarding floodplain management.
Federal Floodplain-related Agencies and Policy Numerous federal agencies are directly or indirectly involved in floodplain management. Agencies most directly involved include USACE, FEMA, the Environmental Protection Agency, and the Department of Agriculture’s Natural Resources Conservation Service (NRCS). Also playing key roles are the Department of Transportation/Federal Highways Administration, the Department of Housing and Urban Development, Department of the Interior/Bureau of Reclamation, the National Oceanic and Atmospheric Administration and the USGS. Water Resources Development Act The 2007 Water Resources Development Act (WRDA) specifies currently approved water resource projects to be carried out by USACE. The act also sets general policy for the projects. Regarding the relationship of water resource projects to floodplains, the WRDA specifies managers should “avoid unwise use of floodplains and flood-prone areas and minimize adverse impacts and vulnerabilities in any case in which a floodplain or flood-prone area must be used.” WRDA policy also asks that first consideration in addressing flooding be given to nonstructural measures and that the “best science” be used in finding solutions.74 In 2007, the WRDA called for a revision of the 1983 Principles and Guidelines,75 a decision supported by the ASFPM, which supports among other changes the emphases in the revised principles on public safety, environmental protection, nonstructural solutions to flooding, and the liability of “nonfederal partners” for post-project maintenance and/or increased risk.76 National Flood Insurance Program The NFIP is often seen as the federal program with most direct participation in floodplain management. The federal program was begun in 1968 to provide affordable flood insurance to those in flood-prone areas. Currently run by FEMA and administered in conjunction with individual states, the NFIP defines floodplain areas, develops rates for flood insurance in those areas and, in the event of flood damage, determines extent of that damage in the form of rebuilding costs. FEMA also participates in buyouts for structures in high risk areas, often in a cooperative effort with communities.
74 www.whitehouse.gov/administration/eop/ceq/Press_Releases/December_3_2009. 75 The Principles and Guidelines for Water and Land Related Resources Implementation Studies are the rules governing how federal agencies evaluate proposed water resource development projects. 76 Comments of the Association of State Floodplain Managers on Proposed National Objectives, Principles, and Standards for Water and Related Resources Implementation Studies, before the Council on Environmental Quality, 2 April 2010.

- 86 -
The program requires communities to meet minimum standards for flood risk protection for individual citizens to be eligible to purchase insurance. Currently, the NFIP uses the 100-year floodplain throughout the US as the standard to which new structures must be built to qualify for insurance. If an existing structure located within a FEMA-designated 100-year floodplain has government-involved financing, flood insurance is required. The authors of Floodplain Management: A New Approach for a New Era77 point out that while the NFIP provides incentive to reduce flood damage, the program also has a number of shortcomings. These include, among others, the fact that the program has become increasingly complex and thus more difficult to administer. Some of the resulting problems, such as not keeping floodplain maps up to date or not dealing with repeat damages, are issues that are impacting basin communities. The book also points out limitations in the NFIP’s regulations for the use of the physical floodplains. In particular, it questions the practice accepted by FEMA of using fill as a way to elevate structures and suggests the program pays too little attention to natural processes of floodplains. This call to attend more to natural processes also fits the current trends and agenda for the Red River basin.
State Administration of Floodplain Regulations States are major players in floodplain management, carrying out a number of major federal water-related programs, including the NFIP. They also determine additional guidelines and regulations for floodplain use. Minnesota Minnesota enacted a State Floodplain Management Act in 1969 (Chapter 103F) in response to the 1968 federal enactment of the NFIP. The act provides incentives for Minnesota communities to participate in the NFIP and gives the state the role of “guiding” the development of floodplains. It also provides that the commissioner of natural resources will coordinate efforts as local governmental units “adopt, enforce and administer sound floodplain management.” The state’s policies give local entities permission to adopt ordinances more restrictive than those of the state commissioner (103F.121) and give priority to floodplain ordinances over “alternative methods” of reducing flood damage (103F.115). In 1987, state policy on floodplain management was amended to establish a state cost-sharing grant program to help local government units plan for and implement flood hazard mitigation measures under the direction of the DNR. The DNR has developed minimum standards for local floodplain management and state agencies that oversee infrastructure.78 These statewide standards require local units of government to submit flood planning data to the state and plan for a minimum of 100-year flood protection in their ordinances. North Dakota An initial floodplain management effort was made in 1977, when Governor Art Link issued a one-page executive order. In 1981, the state referenced and adopted the NFIP under the title, North Dakota Floodplain Management Act (Century Code 61-16.2). The stated purpose of the adoption of the NFIP was to “guide development” of the state’s floodplains with the intent to reduce flood damages.
77 Freitag, Bob, et al. Washington: Island Press, 2009. 78 Statewide Standards and Criteria for Management of Flood Plain Areas of Minnesota (Minn. Rules 6120.5000 – 6120.6200).

- 87 -
North Dakota floodplain policy outlines community floodplain management standards (NFIP minimums) and encourages local floodplain management activities and ordinances. It also outlines the State Engineer’s powers to work with communities to delineate floodplains and floodways and to comply with minimum federal requirements to participate in the NFIP (CC 61-16.2-03, 04). State regulations explicitly state that channels and floodways are not to be inhabited and are to be kept free of obstructions (CC 61-16.2-01). Penalties are defined for noncompliance, including the designation of “public nuisance” for individual actions and loss of eligibility for state flood disaster assistance for communities (61-16.2-09). In 1999 new regulations strengthened communities’ efforts to deal with effects of flooding and gave the State Engineer oversight of technical documentation for development proposed in regulatory floodways. In 2003, state floodplain standards were expanded to exceed NIFP minimums for the first time by adding the alternatives of elevating or dry flood proofing structures. A number of other measures were also added in the 1999 and 2003 additions to floodplain management policy. In the last several years, both North Dakota and Minnesota have been working with FEMA to modernize and digitize the states’ flood maps. The Map Modernization program (Map Mod), developed by FEMA in 2004, allows the identification and remapping of community flood hazards, development of geographical information systems (GIS), and digitization of flood hazard areas. This work is being followed up by the Risk MAP strategy that will enable FEMA and its state partners to identify further flood hazards.79
Association of State Floodplain Managers While not itself a legislative body, the ASFPM recommends policy for floodplain management, from national to local. Brief descriptions of a number of recent ASFPM publications and position papers follow:
• Using Multi-Objective Management to Reduce Flood Losses in Your Watershed, 1996, helps communities select flood loss reduction measures most suitable to their situation and needs (see Appendix E – 6.8.1 for full report).
• Natural and Beneficial Floodplain Functions: Floodplain Management – More than Flood Loss Reduction, 2008, provides multi-objective management criteria for national initiatives as well as for local, state, federal, and public/private entities (see Appendix E – 6.8.2 for full position paper).
• Critical Facilities and Flood Risk, 2010, calls for 500-year event protection for critical facilities, defined as those facilities essential to a community’s resiliency and sustainability (see Appendix E – 6.8.3 for full position paper).
• Guide for Higher Standards in Floodplain Management, 2011, provides ideas for additional options that communities can use beyond current FEMA and state floodplain regulations to take current regulations to higher standards and, in turn, mitigate flood damages and the overall impact of flood events. Twenty options for additional floodplain management measures are specified, with objectives and rationale for each area (with the exception of four areas that deal with coastal zones, the options could apply in most locations, including the Red River basin) (see Appendix D, Exhibit D-4 for full report).
79 The North Dakota SWC has participated as a Cooperating Technical Partner in the NFIP.

- 88 -
Local Water/Floodplain Management Most day-to-day decisions about floodplain management are made and carried out by local water managers, who may be citizen or professional managers. Primary local water management organizations or individuals include:
• Watershed Districts (MN) or Water Resource Districts (ND): Organized by watershed in Minnesota and by county in North Dakota, water(shed) (resource) districts have broad responsibilities. Among other duties, the districts are managers of drainage in the basin.80 Because all of the basin’s waters contribute to the physical definition and functioning of the floodplain, all districts are active in its management. Both Minnesota and North Dakota water(shed) districts can levy taxes and charge special assessments to fund projects.
• Joint boards: Joint watershed or water resource districts are comprised of two or more above districts. Several joint boards have carried out significant retention projects as an approach to managing floodplain and reducing flood damage.
• Soil and Water Conservation Districts (MN), Soil Conservation Districts (ND): Under the federal farm bill, local county conservation districts provide education, incentives, and planning services for landowners who wish to address land and water-related issues. In the last several years, the Agricultural Water Enhancement program (AWEP) has offered incentives and planning to address erosion and implement retention, among other approaches to floodplain management.
• Community leaders or metro water management organizations: The size of the community determines whether the NFIP and other floodplain management is administered by individuals or metro organizations.
• County Commissions: In instances where there are no functioning watershed or water resource districts or in areas outside of community jurisdiction, counties have responsibility for carrying out the NFIP and other floodplain-related regulations.
Towards Developing Long-range Floodplain Management
Some of the basin’s floodplain-related issues, such as altered runoff patterns due to changed land use practices, whether in agriculture or development, are similar to those in other areas of the region and country. Other issues, including the extent and complexity of the floodplain itself and the vulnerability of soils due to instability and erosion, are more particular to the basin. All are part of the picture of managing the basin’s floodplains. Following are a number of components of the larger concept and practice of floodplain management by way of nonstructural strategies examined as a part of the LTFS study.
Recognizing the Role of Floodplains
in Moving and Holding Flood Waters During the early periods of permanent development in the Red River basin, the basin appeared open and ready for whatever use individuals might think of. Footprints were still small, and no clear historical record of flooding was in existence to show that flooding would be a part of most decades ahead. As a result, little attention went to the need of the basin’s floodplains, and specifically floodways, to be kept clear of obstructions to the flow of floodwaters.
80 In Minnesota when delegated by the county; in North Dakota when drainage area is 80 acres or less.

- 89 -
After experiencing over a century of the basin’s flooding patterns, we are far more aware of the limits and fragility of much of the basin’s lands, particularly its floodways and floodplains. With experience from repeated flood damages and the increased use in recent years of the practice of buyouts, more communities are coming face to face with externalized costs resulting when planning does not adequately account for flood risk. As the 1980 USACE Reconnaissance Report concludes, although it is not economically or socially feasible to preclude all development and use of floodplains in the basin, an effective program would prohibit new development within floodplain areas and, where possible, remove existing structures.81 No systematic record has been kept of the extent and costs of buyouts in the basin, although records from 1993-2009 of Hazard Mitigation Grant projects in Minnesota and North Dakota show acquisition of flood prone homes and other buildings to be the major expense resulting from disasters (see Appendix C, Tables C-110 and C-111).
Building Resiliency in Communities
Through Proactive Participation in Available Programs The NFIP is often associated in people’s minds with responding to floods once they have happened. Indeed, this program, which offers citizens flood insurance that covers costs of rebuilding their homes or businesses, should not be underestimated in the extent to which it can help individuals and communities. It is estimated, that on a national (US) average, over 50% of businesses that incur flood damage go out of business.82 Even more important, however, is that in meeting even the minimum requirements for participating in the NFIP, a community has taken first steps to prepare to meet future flood events, thus developing upfront resiliency rather than only responding to floods and the damage they bring when they happen. As the Red River basin prepares for the future, it can find ways through existing programs to be even more proactive in building this upfront resiliency. Several ways to do this include taking steps beyond the minimum required by NFIP, seeking out funding sources from lesser-known disaster-related programs, and working more directly with programs that promote preparedness. Going Beyond the Minimum in FEMA Requirements Both communities and states can benefit when communities elect to take steps beyond minimum standards for participating in the NFIP. For instance, communities can choose to increase base elevation levels for new construction or they can identify high velocity areas, among other strategies. The additional steps taken by the community can help reduce damages and risks in future flood events. As a bonus, adopting such standards can make a community eligible to participate in the Community Rating System, which can result in reduced flood insurance rates of up to 40% for its residents and business owners. Communities and/or states may also choose to take steps beyond federal minimum standards that best fit their needs. As noted earlier, the ASFPM has prepared A Guide for Higher Standards in Floodplain Management (2011), which catalogs and describes 20 ways communities can enhance existing regulations that will reduce risk and protect floodplains. Options include freeboard, access, compensatory storage, critical development protection,
81 Summary Report, p. 28. 82 Edward A. Thomas, “Negotiating the Future of the Red River Basin: Mitigation & Sustainability or Litigation & Misery,” workshop offered in conjunction with the 28th Annual Red River Basin Land and Water International Summit Conference, January 19, 2011.

- 90 -
cumulative substantial damage improvement, fill standards, floodway rise, foundation design, future conditions hydrologic mapping, materials storage, setbacks, storm water management, subdivision standards, use restrictions, regulating areas not mapped on FIRM, and elevation of all additions. Model regulatory wording is provided for each option. Such encouragement for enhanced floodplain management by communities, townships, and/or counties is of utmost importance for the basin. Seeking Out Funding Sources that Reward Proactive Planning States and/or communities can also take advantage of lesser-known existing programs to increase their upfront flood resiliency.
Robert T. Stafford Disaster Relief and Emergency Assistance Act The Robert T. Stafford Disaster Relief and Emergency Assistance Act provides FEMA the authority to fund restoration of eligible facilities having sustained damage in an area declared a presidential disaster. Title 44CRF 206.226, Restoration of Damaged Facilities, contains a provision for consideration of funding additional measures that enhance the facility’s ability to resist similar damage in future events. In providing discretionary authority for the addition of hazard mitigation measures to permanent work restoration, Congress recognized a unique opportunity to prevent recurrence of similar damage from future disaster events during repair of damaged components of facilities. Such measures are in addition to any measures undertaken to comply with applicable codes and standards, although such compliance itself could be considered a form of mitigation. Section 406 and Section 404 of hazard mitigation funding are distinct, yet may be used together:
• Section 406 is applied to the parts of the facility that were actually damaged by the disaster, and the mitigation measure provides protection from subsequent events, and
• Section 404 is used to provide protection to the undamaged parts of the facility. Sometimes, a combination of Section 406 and 404 funding may be appropriate.
Community Development Block Grant Program The US Department of Housing and Urban Development (HUD) provides funding for disaster recovery grants through the federal Community Development Block Grant (CDBG) program. Under this program, HUD established a Disaster Recovery Enhancement Fund (DREF) in 2008 to encourage states to undertake activities and long-term strategies focusing on reducing damages from future natural disasters. The most recent allocation to reduce damages from future disasters by supporting buyouts, relocations and home improvements was in August 2010, when $312 million was passed onto 13 states, none of which were in the Red River basin.83 Under DREF, the HUD program allocated $5.6 billion in disaster recovery funding to the 13 states. As a result of receiving this funding, those states became eligible to receive additional allocations based on the investment they had made by targeting the CDBG funds to disaster mitigation. An additional advantage of the CDBG DREF funding is that, once it has been remitted to a state, it loses its federal identity and can be used to leverage other federal funding. The purpose of DREF is to reward states that invested CDBG disaster recovery funding in activities that reduce risks from future disasters. HUD recognizes that while these types of activities are often expensive in the short-term, they dramatically cut recovery costs over the
83 Among the 13 states receiving DREF funding were Wisconsin ( $15,276,319) and Iowa ($84,126,989). To be eligible for DREF funding, states need to be specifically written into the authorization.

- 91 -
long term. To assist with the additional cost of mitigating future risk, DREF funds can be used for projects meeting unmet disaster recovery needs, as well as those that include:
• Buyout payments for homeowners living in high-risk areas, • Optional relocation payments to encourage residents to move to safer locations, • Home improvement grants to reduce damage risks, • Improving and enforcing building codes, and • Developing forward-thinking land-use plans that reduce development in high-risk areas.
In summary, both the Stafford Disaster Relief and Emergency Assistance Act and the Community Development Block Grant Program build on the assumption that mitigating future flood risks and damage yields benefits. This fact was documented in a Congressionally mandated study by the Multihazard Mitigation Council (MMC), in which it was shown that every $1 invested in pre-hazard mitigation resulted in $3.65 in avoided post-disaster relief costs. In other words, mitigation activities were found to be cost effective and to warrant government funding.84 Representatives from Minnesota state agencies have suggested that the return for mitigation investment in the state may be somewhat higher, ranging from $4 to $7.
Public Assistance Cost-share Infrastructure Program FEMA’s Public Assistance Cost-share Infrastructure program (PA) helps public sector applicants with supplemental costs not covered by insurance related to debris removal; emergency protective measures; and repair, reconstruction, or replacement of public facilities. Standard cost-share is 75% FEMA, 25% state/local. Advocates can request an increase in disaster payments for regional flood relief to 90% FEMA, 10% state/local. The higher federal percentage has been awarded in numerous past disasters. The increase helps speed recovery and can help relieve communities already stretched to the breaking point. Working with Programs that Promote Preparedness Local basin communities or flood-related programs can call upon or team with organizations or agencies that work with flood preparedness. For example, the Silver Jackets program, initiated in both North Dakota and Minnesota in 2010, works to identify long-term flood solutions through collaboration among state and federal agencies, and to apply the information they garner from interagency communication to reduce the risk of flooding. In specific, the programs can assist communities with education about flood risks and flood mitigation, with project requests that support flood control, and with emergency operation plans and hazard mitigation plans. Communities may also choose to work with the Red Cross disaster preparedness program to prepare citizens with a kit, a plan, and information, or they can team with FEMA and the NFIP by educating residents on flood insurance. At the federal level, the US Department of Homeland Security has a protective security advisor for each state who will come into a community and assess it for weaknesses for any threats, including natural disasters such as floods. Security advisors are trained in critical infrastructure protection and vulnerability mitigation and focus on three core areas:
• Enhancing infrastructure protection, • Assisting with incident management, and • Facilitating information sharing.
84 Natural Hazard Mitigation Saves: An Independent Study to Assess the Future Savings from Mitigation Activities, p. 6. The Multihazard Mitigation Council is an arm of the National Institute of Building Sciences; the study can be accessed at www.nibs.org/index.php/mmc/projects/nhms.

- 92 -
The “Ready Business” program developed by Homeland Security in conjunction with many employer and business organizations can help with continuity planning to account for all hazards, including natural disasters.85
Building Resiliency into the Land through Land Use Practices The repeated record-breaking floods of the last 15 years have increased awareness of the basin’s vast, active floodplains. More residents have access to information about the elevations at which they live. Businesses, particularly those in commodity production, are factoring flooding into their operations. The LTFS study considered a number of ways to turn land use challenges into opportunities for improving the basin’s economy and quality of life. Land Use for Development Although the Red River basin may not see the degree of population growth predicted for other areas of the US in the following decades, it is projected that population growth will steadily continue. A majority of that growth will most likely occur in the major population centers along the Red River main stem. As a result, the question of how to best manage development near the basin’s floodplains was considered.
Strategies The logic is, first, to add new structures in higher or protected areas, leaving lower areas as free of obstructions as possible to allow water to flow unimpeded. A second strategy is to keep the footprint of structures on floodplain areas small. Such a requirement, while it may require innovative ways of designing space needs, has the potential to result in economical, efficient, and attractive structures. A third strategy is to find ways to offset additional imperious surfaces that are part of new construction, such as paved lots or roof areas. Most importantly, development needs to occur in harmony with a floodplain area. For the LTFS study, the RRBC invited presentations from cities in Colorado and Kansas that illustrated how new development can take into account the structures and features of the floodplain near which it is located. Examples from both Colorado and Kansas illustrate that urban flood mitigation can be achieved through innovative planning, and that the identity and desirability of developments/communities can be enhanced through the thoughtful integration of the built and natural environments.86
Opportunities A number of opportunities emerge from these floodplain-friendly development strategies: beautiful areas to live and recreate in cities/communities, innovative structures that attract interest, uninterrupted areas for flood flows, and potential area for agricultural production that is not lost to development. The issue of buyouts of existing structures located in floodways and floodplains has, as noted earlier, been practiced by many basin communities, particularly in 1997 and after. Indeed, the last several floods have taught the lesson that a home left undamaged in one basin flood may sustain damage in the next. Carried out with consideration, buyouts can remove both structures and citizens from harm’s way. It is of utmost importance, of course, to avoid actions that result in future buyouts and the resulting externalized costs to the public. This requires creating and
85 http://www.ready.gov/business/index.html. 86 Urban Drainage & Flood Control District, Denver, CO.

- 93 -
enforcing regulations necessary to minimize or eliminate flood risk for new developments or individual structures.
Special Issue: Riverbank Slumping A particular issue arises with structures located on or near river banks. Structures at these locations can threaten the stability of the river’s banks, where weak basin soils are most susceptible. The weight of the structure can place pressure on the riverbank, which causes it, after a time, to slump. Riverbank slumping can be mistaken for erosion, and repair attempts only worsen the problem. Often, homeowners have little option except to move the house off the property. Unfortunately, once the bank slumping has occurred, the damage to the river bank and floodway has been done.87 Land Use for Commodity Production Close connections exist between floodplain management and agricultural practices, and for this reason, the LTFS study included professionals representing the NRCS, as well as representation from producer groups. As noted earlier, the NRCS provides education, incentive, and planning services for landowners who wish to address land and water-related issues. The two primary areas addressed by the NRCS members of the study were 1) incentives and planning to address erosion and 2) incentives to implement detention/retention. Practices to address erosion, such as use of vegetative control of erosion (buffer strips, etc.), can benefit landowners and producers, whether in minimizing ongoing mild erosion from multiple flood events or in preventing severe erosion from large-magnitude floods. It must be remembered that flooding in the basin does not confine itself to the main stem and tributary channels, but can impact much larger areas with overland flooding, significantly impacting agricultural lands. Efforts at detention/retention can be built in conjunction with local erosion-control practices, as well as with other instances of local damages. The LTFS study also examined the potential effects of tile drainage practices on agricultural lands. The RRBC called upon Gary Sands, a leading Midwestern researcher on tile drainage from the University of Minnesota, to address the question of tile damage and flooding at a plenary session of RRBC’s January 2011 Annual Land and Water International Summit Conference. According to Sands, the effects on flooding from tile drainage are inconclusive.88 Participants in the LTFS study pointed to the need for further in-depth research on the effects of basin agricultural drainage practices on the overall patterns and magnitude of flooding in the basin. Rural Structures During the time of the LTFS study, work was done by USACE to identify flood damage potential and best solutions for rural structures. Because the work was done as part of USACE’s nonstructural analysis for the Final Feasibility Report and Environmental Statement for the Fargo-Moorhead Metropolitan Area Flood Risk Management (July 2011), the area of the basin examined included parts of the six counties downstream of the potential project at Fargo-Moorhead, three each in Minnesota and North Dakota. Structures included were located within one mile of the 1997 inundation outline.89
87 www.casscountynd.gov/county/depts/planning/Pages/RiverbankSlumping. 88 Wright, Jerry, and Sands, Gary, “Planning an Agricultural Subsurface Drainage System,” Ag Drainage Publication Series (see Appendix E-6.8.11 for full paper). 89 Structures downstream of Fargo-Moorhead (to Drayton) do not include structures in cities; structures upstream of Fargo-Moorhead (to Abercrombie) include structures in both rural areas and cities.

- 94 -
As part of its costs analysis, the LTFS study includes information about the number and types of rural structures identified by USACE (see Appendix C, Tables 107 and 108). It also notes the work by USACE as a potential model that could be used in additional portions of the basin to catalog and assess the degree to which rural structures are vulnerable to flooding, together with the best solutions for flood-prone structures. In all, the USACE study identified nearly 9,000 structures, investigated over 3,800 structures and assessed in detail 1,117 structures. The assessment determined both the best solution out of eight options for each structure and whether structures would qualify for nonstructural mitigation. 90 Of the 1,117 closely assessed structures, 395 or 35% were determined to be economically feasible to be eligible for potential federal mitigation funds.91
Expanding Vision If a central theme for approaching floodplain management emerged from the LTFS study, it is the need to expand our vision. The study suggests, first, that we need to expand our vision about the floodplain itself to include its primary functions, needs, and vulnerabilities. In addition, we need to expand our vision about what managing our basin’s floodplain entails to include attention to the hydrology and hydraulics of flooding, together with attention to water quality, land use with no adverse impact, stream bank restoration, and recreation, all supported by education. We also need to expand our vision beyond our immediate jurisdictions as we look for ways to cooperate and share resources. A recent study of the emphases and actions of Red River basin water(shed) districts found, among other conclusions, that those water(shed) districts which had joint agreements with other boards saw more projects move ahead. The projects that were chosen, moreover, tended to promote areas such as water quality, retention, and restoration over more traditional emphases. 92 In summary, the goal in floodplain management is to accomplish what we need to do to prevent flood damages but, as far as possible, to do this in a way that does not negatively impact others. Addressing and rebalancing “rights” equations when it comes to floodplain management will require thoughtful, respectful approaches—and thorough knowledge of the floodplain and basin.
Challenges
Edward Thomas, LTFS consultant for floodplain management, advised that changing thinking about floodplains is an enormous challenge. Following are examples of needs and challenges in basin floodplain management identified in LTFS committee deliberations. The examples capture
90 Potential solutions for protecting rural structures identified by the USACE include elevation with extended foundation, elevation with flood-proofed basement, fill basement with main floor addition, elevation on fill, permanent acquisition, nonstructural berm, dry flood proofing, and raising grain bins/silos. 91 Complete discussion is available in Appendix P of Fargo-Moorhead Metropolitan Area Flood Risk Management Final Feasibility Report and Environmental Impact Statement, July 2011. 92 The study points out that, when considering more traditional projects such as drain permits, districts in joint agreements with other districts approved fewer requests. The authors of the study suggest that boards with joint agreements with other boards are more likely to think in terms of other districts, including the problem of passing waters downstream. This same connection to other districts, in the form of collaborative projects, is positively correlated in the study to the number of water retention projects in a district. Robert R. Hearn and Craig C. Kritsky, Characteristics of Active Local Water Management Districts in the Red River Basin, Water Policy, 2009, p. 16.

- 95 -
the scope and importance of the work ahead in developing sound and effective nonstructural strategies for the basin:
• Educating public, developers, and commodity producers about facts on living in the basin, especially in relation to peak flows;
• Identifying and addressing areas where costs of flooding are externalized; • Exploring best ways to ensure that variances are true exceptions; • Developing and following best practices for commodity production;, • Finding ways to ensure/require National Flood Insurance for all; • Educating current and prospective homeowners; • Exploring ways to zone across jurisdictional boundaries; • Aligning incentives (including identifying those that go at cross purposes); • Extending practice of drain tiling to include storage potential, consideration of overall
drainage practices, consideration of overall economic impacts, and other effects; • Encouraging communities to participate in the Community Rating System or other forms
of going beyond minimum flood preparation standards; • Exploring relevant HUD programs (Disaster Recovery Enhancement Fund); • Developing building codes to address issues of bank erosion; and • Considering independent assessments of floodplain management regulations and
management in sample basin cities and counties. These additional needs and challenges emerged from the LTFS Public Engagement meetings:
• Mitigating for CRP acres coming out of program (those that have been holding water); • Developing more coordinated drainage, beginning with assessments such as culvert
inventories; • Keeping federal crop insurance programs and people in the mix; • Coordinating among agencies to develop flexibility and cross solutions; and • Developing and enforcing drain restrictions for urban area development (e.g., ponds to
catch waters from parking lots).

- 96 -
8 Floodplain Management – Raising Levels of
Protection
A second approach to floodplain management explored for the LTFS study was local flood protection. Local protection complements nonstructural measures by providing protection to groups of citizens or established communities not feasible to relocate out of potential damage areas. Often, the most immediate and necessary means of protecting substantial groups of citizens and structures is by keeping water away from damage sites with levees, ring dikes or diversions. While the approach of local protection may not in itself constitute a failsafe long-term solution—levees can fail or be overtopped93—in numerous instances it has reduced flood damage and harm in the basin.94 Local protection is only one part of the overall flood damage reduction needs in the basin, but it is often the quickest method of attaining some minimum level of protection and reduction of damages from flooding. Conclusions of the LTFS study in examining current degree of local protection in the basin are:
1) Levels of local protection are varied and tend to be dependent on a community’s particular experience rather than on the risks of potential flood damages resulting from larger floods. When held up to records of flood recurrence in the basin, most protection projects are undersized. Such a situation can result in damage and threat to human life when local flood protection projects fail or are overtopped.
2) Many first-time projects or improvements in local protection have been put into place in
basin communities, with particularly notable progress since 1997. Despite these achievements, protection levels for basin communities vary, and some communities are still unprotected. In a majority of cases, projects have been constructed only to, or less than, the current minimum FEMA standard of the 100-year flood plus 3 feet of freeboard.95 Numerous portions of the basin have experienced recent floods at the 100-year level or greater, putting communities at great risk even with certified protection.
Review of Past Progress and Practices
A review of past progress and practices in local protection reveals that although the approach of local site protection as a flood risk reduction practice has been considered for the basin for many decades, its implementation has been uneven and somewhat slow, with most progress occurring since 1997.
Past Progress in Local Protection As noted in Chapter 2, the strategy of local protection for the basin has been considered in federal studies beginning as early as the 1940s. Most often, however, the proposed federal
93 See Association of State Floodplain Managers, National Flood Policy Challenges, Levees: The Double-Edged Sword, 2007 (available in Appendix D, Exhibit D-3). 94 In its 2001 report to the state, the Minnesota DNR concludes that although local levee projects are expensive, they are of proven “high value” to communities. Flood Damage Reduction: What Minnesota Has Done and Still Needs to Do, p. 17. 95 The analysis of levels of protection in the basin that follows assumes the current level of freeboard required by FEMA for certification of levees.

- 97 -
projects for the basin were not put into place due to some manner of impediment, whether costs that did not equal the needed benefits, lack of governmental cooperation, or lack of local political will. One large project in the basin that overcame all these obstacles, with the help of great political foresight and will, was the Winnipeg floodway, a project that began in the 1950s in response to the large damages of the 1950 flood. The many basin communities that did not put local protection into place at this point found themselves facing a series of flood fights in the 1960s and 70s, spurring efforts in a number of communities to begin planning permanent protection measures. To support these efforts, which had been funded up to that point primarily by local and federal sources, assistance was made available from the states: in Minnesota with the introduction of the Flood Damage Reduction Grant Assistance Program (1987)96 and in North Dakota through cost-sharing as part of the SWC’s Flood Control program. The 1997 flood made clear for many basin communities that trying to get by without adequate permanent local protection and facing resulting flood fights created an untenable position. Those exceptions such as West Fargo ND or Oslo MN that had permanent protection in place in 1997 escaped millions of dollars of damage.97 Among larger cities, two of the three largest urban centers on the Red River main stem, Grand Forks-East Grand Forks and Wahpeton-Breckenridge, lost their flood fights due to overtopped or inadequate levees. The third urban center of Fargo-Moorhead escaped extensive damage with an expensive and exhausting flood fight, a fight that was repeated in 2009, 2010, and 2011. It is not a surprise that the IJC report following the 1997 flood devotes a significant number of its recommendations to achieving adequate levels of local protection.98 The report addresses the specific needs of numerous urban centers, including Winnipeg, Fargo-Moorhead, Grand Forks-East Grand Forks, Wahpeton-Breckenridge, and Selkirk (MB). A recommendation also addresses local protection for smaller communities and rural areas: “Governments at all levels should ensure that in the development of flood mitigation strategies for the basin the needs of small communities, individual isolated farmsteads and agriculture are not overlooked.”99 Since 1997, significant progress has been made in protecting farmsteads. 100 In the US portion of the basin, a special effort through the USDA Farm Bill made funds available for farmstead ring dikes. In addition to this federal effort, a special Minnesota legislative session in 1997 appropriated $900,000 in grants for individual construction of ring dikes; an additional $1,500,000 was added for 1998. Beginning in 1998, the North Dakota SWC made available cost-share funds up to 60%, with a cap of $40,000, for the construction of ring dikes for farmsteads and rural homes under its Flood Control program.101 In its 1999 report to the state
96 The Minnesota Flood Damage Reduction Grant Assistance program offers technical and financial assistance up to $150,000 (matching) to local government entities for flood damage reduction projects. These funds can be leveraged to enlist the support of the USACE or FEMA. 97 The MN DNR reports that the $2 million spent to mitigate flooding in Oslo saved the town an estimated $31 million between 1984 and 2001. 98 The IJC report warns that “floods of the same size as the 1997 event, or greater, can be expected to occur in the future in the Red River basin. People and property remain at risk from these floods.” (Living with the Red, p. 20). 99 P. 39. 100 The USACE Fargo-Moorhead feasibility report defines ring dikes that do not meet FEMA minimum requirements as nonstructural. The LTFS study suggests that a number of floodplain management systems in addition to ring dikes may possess features of both nonstructural and structural approaches/strategies. 101 Unlike Minnesota, which operates under legislative bonding bills for specific programs, North Dakota, via the SWC, appropriates funds to specific programs under its total budget.
- 98 -
legislature, the North Dakota SWC included farmstead dikes as one of two objectives under its goal for reducing or eliminating flood damage, and between 2000 and the present, ring dikes have been constructed in 8 North Dakota Red River basin counties. As a result of these programs, cities, along with numerous towns and farmsteads, have been able to develop or improve their local protection. This fact is given credit by many for the smaller levels of damage incurred in the basin in the large flood of 2001, as well as in the large floods that followed in 2009, 2010, and 2011.102
Past Practices of Local Protection There is considerable variation in levels of local flood protection in the basin, whether among major metropolitan areas, cities, or rural residences and farmsteads. Among metropolitan areas, for instance, if we look to Manitoba, our neighbor to the north, Winnipeg has a 700-year level of protection provided by a permanent floodway diversion. On the US side of the border, the cities of Grand Forks and East Grand Forks, as noted, have permanent levee and floodwall projects certified at 250-year flood protection. Fargo and Moorhead do not have permanent flood protection projects but rather rely on fighting each flood with emergency measures.103 Among other basin cities, many have permanent protection at the 100-year flood plus one foot, some have somewhat less protection, and others are still without permanent protection projects. Each location’s existing level of protection is based on a combination of factors, including past experiences with floods; community, state, and federal agency policies regarding the threat of flooding; a measure of the benefits received compared to the cost of providing flood protection; and/or the political will to provide the funding to build a permanent project with a level of protection beyond recent experience. Typically, a community or state’s interest in implementing flood risk reduction projects is highest immediately after a flood. Often a permanent flood protection project is implemented only after a flood disaster has been experienced by a community, a localized area, or individuals. So even though the risk of flood damages at a community may be high, if no flood threats have been experienced for several years, the recognition of the risk at that community may be very low. Even when a local flood protection project is determined to be necessary, agency policies and/or budgetary or engineering constraints may delay action or keep protection levels to a minimum. At the federal level, the primary measure of the value of a permanent flood protection project is based on a comparison of the national economic benefits to costs of the project. Little consideration is given to regional and local economic benefits or to non-economic factors. National economic benefit not only determines whether a project will go ahead, it can also play a part in determining the level of protection of the project. Given the many considerations outside of flood flow recurrence that play roles in local flood protection projects, it is not surprising that projects can vary considerably in types and levels of protection.
102 Substantial progress had already been made by 2001 on site protection at Grand Forks-East Grand Forks and Wahpeton-Breckenridge. The MN DNR estimated in 2001 that the value of a single grain storage structure filled with a commodity exceeded the average cost of a farmstead ring dike of $30,000. By 2009-2011, with larger storage structures and higher values for commodities, that value is far greater. 103 Fargo and Moorhead are nearing the end of a feasibility planning stage for developing local protection.
- 99 -
Guidelines for Levels of Protection
As a first step in clarifying and furthering the strategy of local flood protection for the basin, the LTFS study examined 1) the need for level of protection guidelines and 2) existing guidelines for levels of protection. As a result of these examinations, the LTFS, under the auspices of the RRBC, developed level of protection guidelines that reflect current flooding conditions in the basin.
The Need for Local Protection Guidelines The physical characteristics of the Red River basin, where risk levels for flood damages from the upstream to the downstream areas of the basin are similar, make it an ideal place for basin-wide, consistent policies on levels of local protection. Such level-of-protection goals could raise the bar on how we approach flood risk reduction and implement projects. Rather than just solving the last flood, we could plan ahead and prepare for a potentially much larger flood in the future. Level-of-protection goals would guide local, state/provincial, and federal governments in funding strategies, prioritizing projects, and planning long-range to reduce the risk of damages for future larger floods. Without such level-of-protection goals, each community or site in the basin has had to do its own analysis of need, often at the last minute and within the crisis of a flood event. A typical pattern of action starts with a forecast of flooding in the basin. This prompts, at each flood-prone location, a review of the flood risk. Flood fight preparations are then initiated at each community or site based on the severity of the flood predicted and the risk of flood damage for that prediction. Both the preparation for floods and their damaging effects bring consequential expense and disruption at every level. An individual farmstead or rural home preparing for or damaged by flooding can cause significant expense and disruption to productivity. Communities and metropolitan areas, which typically serve areas outside of their borders, can impact productivity and economic activity in a large area. With adequate levels of protection in place throughout the basin, future floods could be considered more as nuisances that can be accommodated rather than as disasters that bring costly damages and severe disruption to life, productivity, and the economy of the basin and region.
Existing Guidelines for Levels of Protection Policies, goals, or guidelines for levels of protection in the basin are few. More importantly, guidelines are inadequately matched to the record of potential flood levels in the basin. In this respect, existing guidelines can give individual communities or other local sites a false sense of protection when they have projects in place that meet minimum standards. This situation is easily illustrated at the federal level. The primary US federal agency for project planning and construction, USACE, has no specific level of protection guidelines but rather focuses on the optimum economic considerations as defined by the National Economic Development Plan. FEMA, which manages the NFIP, uses the 100-year floodplain, rather than, for example, the 200-year or 500-year floodplain, as the level that requires flood insurance for buildings secured by federally backed mortgages. FEMA also uses the 100-year floodplain as the basic measure for accrediting flood protection projects, such as levees, which remove communities from the 100-year floodplain and thus from the requirement to have flood
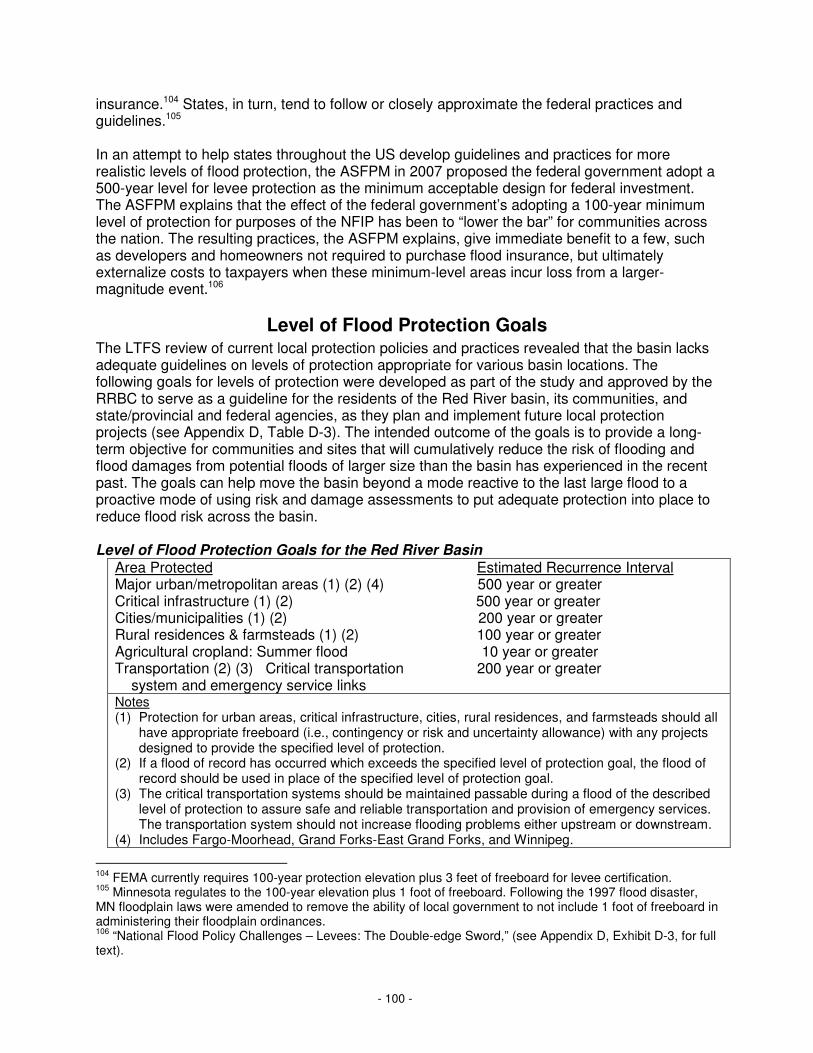
- 100 -
insurance.104 States, in turn, tend to follow or closely approximate the federal practices and guidelines.105 In an attempt to help states throughout the US develop guidelines and practices for more realistic levels of flood protection, the ASFPM in 2007 proposed the federal government adopt a 500-year level for levee protection as the minimum acceptable design for federal investment. The ASFPM explains that the effect of the federal government’s adopting a 100-year minimum level of protection for purposes of the NFIP has been to “lower the bar” for communities across the nation. The resulting practices, the ASFPM explains, give immediate benefit to a few, such as developers and homeowners not required to purchase flood insurance, but ultimately externalize costs to taxpayers when these minimum-level areas incur loss from a larger-magnitude event.106
Level of Flood Protection Goals The LTFS review of current local protection policies and practices revealed that the basin lacks adequate guidelines on levels of protection appropriate for various basin locations. The following goals for levels of protection were developed as part of the study and approved by the RRBC to serve as a guideline for the residents of the Red River basin, its communities, and state/provincial and federal agencies, as they plan and implement future local protection projects (see Appendix D, Table D-3). The intended outcome of the goals is to provide a long-term objective for communities and sites that will cumulatively reduce the risk of flooding and flood damages from potential floods of larger size than the basin has experienced in the recent past. The goals can help move the basin beyond a mode reactive to the last large flood to a proactive mode of using risk and damage assessments to put adequate protection into place to reduce flood risk across the basin. Level of Flood Protection Goals for the Red River Basin
Area Protected Estimated Recurrence Interval Major urban/metropolitan areas (1) (2) (4) 500 year or greater Critical infrastructure (1) (2) 500 year or greater Cities/municipalities (1) (2) 200 year or greater Rural residences & farmsteads (1) (2) 100 year or greater Agricultural cropland: Summer flood 10 year or greater Transportation (2) (3) Critical transportation 200 year or greater system and emergency service links Notes (1) Protection for urban areas, critical infrastructure, cities, rural residences, and farmsteads should all
have appropriate freeboard (i.e., contingency or risk and uncertainty allowance) with any projects designed to provide the specified level of protection.
(2) If a flood of record has occurred which exceeds the specified level of protection goal, the flood of record should be used in place of the specified level of protection goal.
(3) The critical transportation systems should be maintained passable during a flood of the described level of protection to assure safe and reliable transportation and provision of emergency services. The transportation system should not increase flooding problems either upstream or downstream.
(4) Includes Fargo-Moorhead, Grand Forks-East Grand Forks, and Winnipeg.
104 FEMA currently requires 100-year protection elevation plus 3 feet of freeboard for levee certification. 105 Minnesota regulates to the 100-year elevation plus 1 foot of freeboard. Following the 1997 flood disaster, MN floodplain laws were amended to remove the ability of local government to not include 1 foot of freeboard in administering their floodplain ordinances. 106 “National Flood Policy Challenges – Levees: The Double-edge Sword,” (see Appendix D, Exhibit D-3, for full text).

- 101 -
Current Status of Local Protection in Basin Communities
At the start of the LTFS study, no detailed overview of local protection in the basin as a whole (US portion) was available. For purposes of analyzing the current status of, and need for, local flood protection in the basin, an overview of existing local protection, together with a comparison of that protection to the RRBC recommended guidelines for protection, was compiled. The information and its analysis offer perspective to local communities by providing a basis from which to address flood risk status.
Existing Local Protection for Basin Cities A first LTFS compilation looks at a total of 99 basin cities, 22 on the main stem, 40 on Minnesota tributaries and 37 on North Dakota tributaries, to get a basic picture of the use of local site protection in the basin as a flood risk reduction practice (see Appendix D, Table D-4). Information for each of the 99 sites includes:
• Whether or not the city has permanent local flood protection project(s), • The design level of protection (stage/elevation) of the project(s), • The relation of that level of protection to frequency (less than 100-year protection; at or
greater than 100-year protection), • A description of the existing flood protection project(s), • Any studies or work underway to upgrade or provide additional site protection, and • Whether the city relies on emergency flood fights for protection.
Results show that 9 of 22 main stem cities or 41% have some form of permanent flood protection. Percentages of tributary cities that have permanent protection are 12% in Minnesota and 27% in North Dakota. Of those cities that have permanent protection, the percentage whose protection is at or exceeding 100-year flood levels is 36% for main stem cities, 12% for tributary cities in Minnesota and 19% for tributary cities in North Dakota.
Comparison of Existing Flood Protection with
Recommended Guidelines As described, RRBC guidelines for recommended minimum levels of protection for urban areas are 200-year or greater levels for cities and 500-year or greater levels for major urban centers. A second step of the study of local protection was to determine the degree to which local site protection at basin cities meets these goals. The following table applies RRBC recommended levels of protection to 42 basin cities and urban centers, including several in Manitoba, with 18 on the main stem and 24 on tributaries (See Appendix D, Table D-5). The table makes clear that only a small handful of basin urban centers and cities meet the RRBC recommended guidelines for protection. The single urban center that meets the guideline of 500-year protection for urban centers is Winnipeg MB. Three cities, two on the main stem and one on a tributary, meet or exceed the guideline of 200-year protection for cities: Halstad MN, Oslo MN, and West Fargo ND. Fifteen additional cities, including two in Manitoba, have 100-year protection, and 16 cities and the urban center of Fargo-Moorhead have less than 100-year protection.

- 102 -
Comparison of Existing Flood Protection with Recommended Guidelines for Level of Protection
Need and Potential for Additional Local Protection
As next steps in the LTFS study of local protection in the basin, the individual situations of cities in the basin were examined for best/most likely options for protection for each city, together with the need and ease of implementation of the option(s) for that city.
- 103 -
Most Likely Options for Adding Flood Protection As a first step in analyzing potential or improved local protection for cities, the LTFS study examined 140 basin cities to determine each city’s most likely additional protection were the city to add protection to meet the RRBC recommended guidelines (see Appendix D, Table D-6 for list by subbasin and city). The compilation includes the following information and analysis for each city:
• The RRBC recommended level of flood protection, • An assessment of current protection in terms of flood frequency levels, • Planning and upgrades underway at the location, • Most likely options to increase the location’s protection to recommended guidelines, and • Alternatives for reducing risk in the interim.
The alternatives for additional protection identified included permanent levee systems, upstream impoundments/preservation of upstream overflow, flood warning and emergency response, diversion channels, buyouts or relocations, flood insurance, emergency flood fights, emergency earthen levees, control structures, cut-off channels, and strengthening capacity of roads. Among the alternatives, the option most often selected as first or second “most likely addition” for reducing flood risk for the above cities was an upgraded levee system.
Relative Need/Implementability of Options
for Additional Flood Protection A final LTFS compilation and analysis of options for local protection at cities summarizes the need and ease of implementation for a range of options for adding flood protection in cities that need additional protection (see Appendix D, Table D-7). Alternative options, both nonstructural and structural, were considered for 94 basin cities, 22 on the main stem and 72 on Minnesota and North Dakota tributaries. Options considered included flood warning and emergency response, relocations/buyouts, greenways, levees/floodwalls, channel modifications, drainage, diversion channels, impoundments (on-channel, off-channel, dry dam, multipurpose, temporary flood storage only), culvert sizing, and wetland restoration/creation. The analysis shows the option of urban levees as meeting the combined criteria of need and ease of implementation to a higher degree than other options. The option of levees was listed as a “needed/implementable” solution for 15 of the 21 main stem cities, with 14 of the 15 cities defined as having “high” or “very high” need for levees; for 27 of the 37 tributary cities in Minnesota, with 21 defined as having “high” or “very high” need/implementability; and for 31 of the 35 tributary cities in North Dakota, with 30 of the 31 defined as having “high” or “very high” need/implementability. In addition, the option of diversion channels was listed for 4 main stem cities (2 rated as having “high” or “very high” need/implementability), 4 Minnesota cities (3 rated as having “high” or “very high” need/implementability), and 18 North Dakota cities (all rated as having “high” or “very high” need/implementability).
Summary: Assessing Current Local Site Protection in the Basin A survey of current local flood protection projects in place in communities on the Red River and its tributaries reveals a clear discrepancy between the protection offered by those projects and the RRBC recommended Level of Flood Protection Goals. For instance, the recommended protection level of a 500-year or greater flood for urban centers is not current in any US basin metropolitan area: Grand Forks and East Grand Forks have levees and floodwalls certified to approximately 250-year protection; Wahpeton and Breckenridge have levee and diversion

- 104 -
protection certified to 100- to 125-year protection, with a project near completion; Fargo and Moorhead currently do not have permanent protection and are in the planning stage for diversion protection via a USACE project.107 The recommended 200-year or more protection for main stem and tributary cities is currently in place for only two communities on the main stem, Halstad MN and Oslo MN, and one tributary community, West Fargo ND.108 One other tributary community, Ada, has completed a study and is seeking funding for an approximately 200-year protection project. Increasing levels of protection in basin communities is best viewed not as an isolated approach of structural local projects but as one of several complementary approaches. For some communities, the best and most likely alternative to achieve adequate local site protection will be levee systems or flood diversions. However, other communities may be able to increase their level of protection with the additional alternatives of upstream storage/floodwater retention or buyouts and relocations. Cities without adequate protection may need to plan for interim alternatives to reduce risk, such as flood forecasting and flood warning, emergency levee raises, flood insurance and/or emergency flood fights, among others. In a number of cases, it may take years for protection goals to be met, but the RRBC recommended guidelines developed as part of the LTFS study offer direction and motivation as they guide and motivate communities, agencies and stakeholders throughout the basin over years to come to plan and implement the needed local protection to achieve appropriate flood risk reduction goals. Since 1997, local site protection being provided at rural residences and farmsteads has generally been to the 100-year flood, plus 1 foot (MN) or plus 2 feet (ND) of freeboard, or, if the area is not mapped, to the 1997 flood plus 2 feet. These levels are generally less than the suggested RRBC guidelines of 3 feet of freeboard.
Estimated Costs
It is difficult at this time to estimate costs of achieving RRBC recommended levels of protection goals across the basin. However, by surveying current plans in communities to upgrade existing local protection and by reviewing a history of costs for rural ring dikes, it was possible to arrive at approximate costs for upgrades expected in the next ten years. Upgrades to local protection are presently underway at many cities and rural residences and farmsteads in the basin. The LTFS study used existing local protection plans and practices as a starting point in estimating costs.
Urban Details were collected from 120 basin cities and reaches on the Red River and its tributaries on current protection, planned approaches, estimated costs for upgrades, and whether planned approaches provide protection to 100-year certifiable levels and/or RRBC recommended levels (see Appendix D, table D-28). Information from basin cities on planned upgrades to their local protection show estimated costs for site protection109 in Minnesota cities of approximately $88.3 million and in North Dakota cities of approximately $358.4 million, with $138 million of the latter for Devils Lake related damage reduction.
107 As noted, Winnipeg has 700-year diversion protection. 108 Halstad’s project requires time to make levee closure, Oslo’s protection is in process of upgrade. 109 Costs exclude funding already in place for the project(s).

- 105 -
In addition, the two states would share in the costs of a planned Fargo-Moorhead diversion project whose costs are estimated at $1.77 billion, with federal cost share at $785 million and state and local cost share of $985 million.110 Final cost sharing between the two non-federal partners has not yet been determined. Costs would be spread out over one or more decades.
Rural Residences and Farmsteads Costs for rural residences and farmsteads can be estimated, in part, by the record of expenditures on the ring dike program. In Minnesota, the total amount spent on rural and farmstead ring dikes between 1997 and 2010/11 was over $11.3 million, with over $5.6 million state dollars (50%), $2.8 million from RRWMD (25%), and $2.8 million from local landowners and watershed districts.111 Over the 15 years, the average annual appropriation for ring dikes in Minnesota has been over $75,000, with higher appropriations associated with large flood events. It is anticipated that future floods may result in additional needs and requests for local protection of rural residences and farmsteads local protection.
110 The estimated amount of federal cost share is based on the Fargo-Moorhead Metropolitan Area Flood Risk Management project Supplemental Draft Feasibility Report and Environmental Impact Statement, April 2011. 111 See Appendix C, Table C-106 for listing of ring dike funding in Minnesota by year and watershed. The table does not include funds made available for farmstead ring dikes by special mandate by the Farm program for two years following the 1997 flood. Nor does it include the funds made available by the NRCS: $2.4 million following the 2009 flood and $500,000 following the 2011 flood.

- 106 -
9 Floodplain Management - Retention
A third approach to floodplain management considered and reviewed by the LTFS study is that of reducing flood flows by means of temporary flood water retention. Retention may not at first appear a viable option for floodplain management, since in the decades following the 1950s, building larger storage projects fell into disfavor,112 and, although smaller (“micro”) retention projects have been recognized as having value,113 they have been seen as lacking feasibility, whether because of obstacles to implementation114 or because most fall short of federal cost-benefit criteria necessary for federal funding. Despite these attitudes, the basin has seen some successes with retention as a vehicle for flood risk reduction. As noted in Chapter 2, the RRWMB, a coalition of nine Minnesota watershed districts, succeeded in constructing over 62,000 acre feet of storage between 1997 and 2010, after establishing a viable project review and permitting process. One example of these retention projects is the North Ottawa project in the Bois de Sioux watershed of Minnesota. The project, a gated structure that contains about 18,000 acre-feet of flood storage, became operational for the 2010 flood. The project is operated primarily for floodwater storage in the spring and for natural resource enhancement purposes in the summer and fall. In North Dakota, the Cass County Joint Water Resource district, after working through challenges in land acquisition and permitting, succeeded in constructing the Maple River Dam, whose 60,000 acre feet of storage have already been credited with reducing downstream flood events (see Chapter 2). In addition, a 5-foot raise to Baldhill Dam upstream of Valley City ND has created an additional 31,500 acre feet of storage that has considerable local benefits. Between Minnesota and North Dakota, approximately 160,000 acre feet of storage have been built since the 1997 flood. Although the constructed storage is not perfectly timed storage in all instances and does not all translate into main stem benefits, it does demonstrate that progress can be achieved in building retention that provides both local and, in some instances, main stem benefits.
Definition and Initial Conclusions
The goal of the flow reduction strategy of retention is to increase steadily the amount of overall basin-wide floodwater retention by first providing local flood damage reduction benefits. As these local projects are built to address local flood damage reduction, overall basin-wide benefits will accumulate, providing flow reductions that will begin to impact Red River main stem flows measured at key locations. Cumulatively, the retention sites will begin to provide enough storage to make a difference, both in local tributary areas immediately downstream of where the floodwater is retained and in damage centers along the main stem, where peak stages and volume flood flow discharges will be reduced.
112 The 1980 USACE’s Reconnaissance report points to multiple objections of the public based on cultural, biological and land-use grounds (1: p. 11). 113 Both the USACE’s Reconnaissance report and IJC’s Living with the Red recognize this value. 114 See IJC, Living with the Red, p. 24.

- 107 -
A strategy of retention can complement the strategy of local site protection by providing communities with a portion of their desired protection from a strategy other than levees; for while often necessary, levees have the limitations of potentially failing or being overtopped (see Appendix D, Exhibit D-3). To test the flow reduction strategy, an initial goal of achieving a 20% reduction of 1997 peak flood flows along the Red River main stem was established. Several initial conclusions emerged from the preliminary evaluation of the strategy of flow reductions:
• Initial assessments of specific storage sites in many of the subbasins show that achieving the goal of 20% flow reduction of 1997 peak flows along the Red River main stem is achievable.
• Achieving this 20% flow reduction would require about 1.5 million acre-feet of appropriately placed storage in the subbasins.
• Upstream floodwater storage will increase the level of protection at downsteam communities and locations, and in some locations, this increase in protection will help communities achieve the RRBC recommended guidelines for level of protection.
• As retention sites are identified and tested with newer and better modeling, it may be possible to achieve more than a 20% reduction. Additional stage reduction benefits on the main stem may also be achieved with more targeted tributary flow reductions.
Theoretical Testing of Strategy of Flow Reduction
Data was collected and analyzed to establish baseline information and to explore the feasibility and potential effects of reducing flow 20% in the basin from south of Wahpeton-Breckenridge to the border at Emerson, Manitoba. A summary of those results follows.
Existing Storage Baseline information was collected to determine current existing storage projects in the Red River basin. A detailed summary was made of all current retention sites. Organized by subbasin, the information for each site includes size, county, construction date, and implementing agency (see Appendix D, Table D-10). The total amount of current retention storage in the basin from this compilation is 1,945,800 acre feet. The following table summarizes by subbasin the amount of the above storage upstream of six potential damage centers on the main stem (see Appendix D, Table D-8). Although the majority (92%) of existing basin storage was constructed before 1997, the table shows construction of retention sites has continued into the present, with projects in ten areas of the basin. Because the majority of recent projects are initiated at the local level, one can conclude there is significant interest in the basin for the strategy of floodwater retention.

- 108 -
Existing Flood Storage
The Need/Ease of Implementation of Storage A second step was to analyze the need in the basin for additional protection in the form of retention. It was determined that about 75% of basin cities rely on emergency flood fights for protection (see Appendix D, Table D-4), and only a very small handful meet the RRBC proposed guidelines for protection (see Appendix D, Table D-5). When likely options for adding to basin cities’ protection are surveyed, upstream impoundments are identified as first or second most likely options for almost 70% of main stem and tributary cities (see Appendix D, Table D-6). When ease of implementation is added to the criteria of need to determine the most likely potential risk reduction strategies for communities, off-channel storage is rated as “high” or “medium” at almost 90% of basin cities, surpassing all of the other nonstructural and structural options considered for the combined qualities of need and ease of implementation (see Appendix D, Table D-7).

- 109 -
Potential Effects of Storage on Cities The potential effects of flow reduction were evaluated in several ways. In the following table, the approximate potential flow and stage reductions from the 1997 flood are computed for each of six points on the main stem using the proposed reduction allocations and proposed storage for subbasins upstream of each of the six sites (see Appendix D, Table D-17). The resulting flow reductions range from 17% at Grand Forks-East Grand Forks to 24% at Emerson. The resulting stage reductions for the 1997 flood would have ranged from 1.3 feet near the border at Emerson to 2.8 feet at Grand Forks-East Grand Forks. Effects of Potential Additional Storage on 1997 Flood Peak Stages
- 110 -
Effects of potential flow reductions were also computed in terms of 100-year, 200-year, and, where possible, 500-year flood events. This additional step moves the analysis beyond data from a single flood (1997) and extends the analysis to include potential reductions for flood events larger than 100-year. Although the 100-year flood is currently the event used for most planning throughout the basin, the LTFS study concluded that, given the record of large flooding events in the basin, minimum levels of flood protection for small and midsized basin communities should be based on the 200-year event.
Potential Effects of Storage on Agriculture The potential effect of retention for agricultural lands in the floodplain along the Red River main stem was also briefly considered. For a 100-year event with recommended potential storage, croplands flooded along the Red River would be reduced from about 581,000 acres to about 460,000 acres, a reduction of 121,000 acres or an approximately 20% reduction in inundated acres. For a 200-year event, the area flooded would be reduced from about 690,000 acres to about 598,000 acres, a reduction of 92,000 acres or an approximately 9% reduction (see Appendix D, Table D-23). Additional agricultural benefits would be achieved along the tributary streams. However, these are difficult to estimate due to the uncertainty of where potential proposed flood storage within the tributary watershed would be located.
On-the-Ground Testing of Retention
Floodplain management through a flow reduction strategy will benefit both local tributary areas and potential damage sites along the main stem. However, the actual effect of floodwater retention on various parts of the basin and the relative effectiveness of any particular measure is greatly dependent on the location, operation, size, and design of the storage, as well as on the specific characteristics of an individual flood. That each flood is different is well illustrated by the variation between the 1997 and 2009 floods. The 1997 flood was a large flood along the entire reach of the Red River, due in large part to a deep snow pack across almost the entire basin. This produced record or near-record flood levels from the south end to the north end of the basin. The 2009 flood was even larger than the 1997 flood in the southern part of the basin but did not approach the 1997 record at points farther north such as Grand Forks-East Grand Forks. This was due to a large snow pack in the southern and western parts of the basin, with lesser snow pack in the northern and eastern parts of the basin. As a result of the difference between the two major floods, an impoundment that might have had a major influence on 1997 flood levels at a given location might have had a very different influence at that location for the 2009 flood. All of these factors must be considered in the development of the individual components of a basin-wide plan of flood water retention to reduce peak flows. The following steps were taken by the LTFS study participants to test, in all its variability, the efficacy of a peak flood flow reduction plan using basin-wide strategically placed retention.
Making the MIKE 11 Hydraulic Modeling Tool Available Developing and implementing a retention plan in the basin requires estimating the flow reductions needed from each contributing basin watershed. To assist in the allocation process for flow reduction, the RRBC developed a Red River main stem hydraulic unsteady flow model. The model, based on MIKE 11 software developed by DHI Water and Environment, Denmark, was calibrated to simulate the 1997 spring flood.115 Physical features of the Red River and its flood plain are represented in the model as cross-section data. Hydrologic inputs include
115 A more recent unsteady model developed by USACE, HEC/RAS, was not available at the time.

- 111 -
measured flows from main tributaries along with estimated flows from ungaged tributary areas. The model was used to simulate the main stem response to reduced flows from tributary areas.
Preliminary Testing of Impact of Reductions in Tributary Flows As a preliminary exercise to determine the theoretical response of the Red River main stem to reductions in tributary flows, tributary flows were reduced in the model to meet a flow reduction goal of 20% along the entire length of the Red River main stem for the 1997 flood. The primary factor in selecting 20% as an initial goal was the effect it would have had at Grand Forks-East Grand Forks during the 1997 flood. A 20% flow reduction at Grand Forks-East Grand Forks in 1997 would have reduced the peak flood elevation to a level where the flood fight that was waged would have been successful and the levee system would not have been overtopped. Achieving the 20% reduction in flows along the Red River main stem requires larger percentage peak flow reductions on each tributary. Some tributaries have up to a 50% reduction, and the average peak flow reduction on tributaries is about 35%.
Considering Types of Retention It was found that floodwater peak reduction on both the Red River main stem and tributary streams can be achieved by a wide variety of flood water retention measures and projects, both structural and nonstructural. Measures can include, among others, on-channel or off-channel impoundments, culvert sizing or waffle storage, wetland restoration, or land use change. The study considered the question of gate-controlled vs. nongated storage as options for a basin-wide retention effort. Gate controlled flood storage impoundments are typically more efficient in that, strategically located and precisely operated, their operation can be adjusted for the specific flood event in determining when to store and when to release the water. Although the operation of ungated structures cannot be changed to meet the needs of a specific flood event, strategically located ungated storage can also provide significant benefits in reducing flow. In addition, the study’s consensus was that both larger reservoirs on some tributary streams as well as smaller off-channel retention projects have the potential to retain flood peak flows. The best approach to determining the specific type of retention measures to use in each location would rely on site specific details and will likely result in a mix of measures. The individual water(shed) districts would determine the approach for their area that can best contribute to the overall basin-wide goal of reducing flood flows at damage sites in tributary areas as well as on the Red River main stem.
Defining Basin Goals for Implementing Flow Reduction To reduce peak flood flows along the main stem of the Red River for the large floods, it was necessary to develop a basin-wide approach that would distribute flood storage throughout the tributary watersheds. As noted above, the goal of a 20% reduction was selected based on the potential impact of that level on the 1997 flood in Grand Forks-East Grand Forks. The LTFS study participants determined this 20% goal should serve as an initial goal. A 20% reduction of peak flows along the main stem of the Red River for a flood of similar magnitude to the 1997 flood, which is very close to a 100-year event in most locations, was deemed both 1) achievable and 2) effective in reducing flood levels on both the tributaries and main stem. To achieve the potential 20% flood flow reduction along the Red River to the international boundary, it was estimated that about 1,488,000 acre-feet of storage throughout the basin would be needed. This estimate of the amount of flow that would need to be removed from

- 112 -
composite tributary streams as they enter the Red River takes into account the potential types and effectiveness of storage sites in the various subbasins (see Appendix D, pp. D-31-40 for discussion of the effectiveness of storage projects).
Partnering with Subbasins The appropriate amount of floodwater retention in acre feet of storage, as identified by the overall model of basin retention, needs to be assumed by each subbasin as part of its responsibility to manage its flood flows entering the Red River. Due to the variability of basin flood events, it is essential the storage be distributed throughout all the subbasins. This strategy also helps ensure basin-wide benefits. The amount of retention needed in each subbasin would depend on the individual subbasin’s needs, with additional consideration of how the amount and timing of the subbasin’s floodwaters contribute to Red River flood flows. In other words, localized benefits to the tributary watershed should be the primary consideration for local planning and building of retention sites, with additional consideration of benefits to the Red River main stem. This cooperative approach has already proven effective in current flood flow reduction projects that provide benefits locally as well as to the Red River main stem. Flood flow reduction projects also present opportunities for multipurpose benefits, including water supply, recreation, water quality, and other water-related natural resource/recreation enhancement goals. As part of the LTFS study, each water(shed) district determined through the use of its own modeling, in conjunction with the basin-wide modeling, what it could achieve in reducing flood flow into the Red River main stem. The resulting hydrograph developed for each subbasin to describe its potential reduced outflow varied from originally targeted MIKE 11 main stem goals depending on the degree to which projects can reasonably be expected to be built under the watershed’s current conditions. Adjustments to the storage targets and main stem impacts for each watershed will need to be made in the future as detailed project site location design proceeds. Some watersheds may be capable of providing more storage; others may not be able to provide original estimates of required storage. Overall potentials will need to be modeled continually to provide updates on overall basin-wide targets and goals for main stem flow reductions.
Testing Capacities for Retention by Subbasins As a penultimate step in exploring the strategy of flood flow reduction, LTFS study participants tested the potential for retention of flood flows at the subbasin level. The testing consisted of 1) applying the MIKE 11 main stem and tributary goal modeling and analysis to one subbasin and analyzing results of the subbasin’s retention site hydrologic modeling, and 2) gathering the same information for the other subbasins from the identification and modeling of potential storage sites and/or total acre feet of potential retention and flood flow reductions in their tributary area.
Testing of Model with Bois de Sioux Watershed Before all the Minnesota and North Dakota tributary subbasins were asked to identify/model and/or report their capacities for retention and flood flow reduction, the LTFS study worked with one subbasin to test the entire modeling process. The Bois de Sioux River subbasin, draining 1,936 square miles in Minnesota, North Dakota, and South Dakota and the primary subbasin that contributes floodwaters to the Red River at Wahpeton-Breckenridge, was chosen as the initial subbasin for modeling.

- 113 -
The challenge for the Bois de Sioux effort was for the watershed board to identify storage sites and relative locations within the watershed that could potentially be built to address local needs, with the cumulative capacity to meet the flow reduction goal of 20% for the 1997 flood at Wahpeton-Breckenridge. A resulting 26 retention sites were identified in the watershed, which, if built, would provide total flood storage of about 114,000 acre-feet (see Appendix D, Exhibit D-9 for full report). These sites were HMS modeled by the watershed and compared to the main stem flow reduction targets provided by the MIKE 11 main stem model. The analysis showed that, together, these sites would achieve the desired flow reduction at Wahpeton-Breckenridge. Applying Modeling in Subbasins Following the analysis of the Bois de Sioux watershed for its retention potential, 20 subbasins, 10 in Minnesota (including the Bois de Sioux) and 10 in North Dakota, were modeled using the best available models and data. The goal was to determine if individual subbasins could individually find the sites and retention capacity to meet the MIKE 11 flow reduction goals for that tributary. In each instance, water(shed) district boards were asked to consider benefits for main stem flow along with local benefits when selecting retention locations, types, and efficiencies. Results of the efforts for individual tributary subbasins are included in the tributary reports (see Appendix D, Exhibits D-10 through D-17). These reports were used to assess ability of the basin-wide storage proposal to meet the 20% flood flow reduction goal and to determine what the effects might mean for flood risk reduction along the Red River.
Analyzing Potential Effect of Retention at Fargo-Moorhead For a detailed examination of how retention would affect a single major potential damage site, LTFS study participants looked to the USACE study of potential effects of upstream storage/retention for Fargo-Moorhead. The USACE analysis, completed as part of its Feasibility Report and Environmental Impact Statement for adding local site protection at Fargo-Moorhead, showed that storage/retention in the Red River basin would not be effective in reducing the risk of flooding in Fargo-Moorhead for large flood events, including the recent larger historical floods that have affected the area. The USACE analysis indicated that 400,000 acre feet of upstream storage would reduce the peak stage in Fargo by approximately 1.6 feet for a 100-year (32,000 cfs) event. This reduction was found to be far short of the level of stage reduction needed to avoid a catastrophic flood in Fargo-Moorhead. The proposed local protection project in the form of a diversion currently includes staging and storage of 200,000 acre feet of water (65 billion gallons). The retention would result in stage reductions downstream and thus minimize the downstream impacts of the proposed project. The staging and storage of 200,000 acre feet as part of proposed local protection for Fargo-Moorhead is assumed to be effective storage. The farther storage is located from the site to be protected, the less effective it becomes. Thus, to achieve an equal amount of benefit from storage sites located farther upstream of Fargo-Moorhead, significantly more acre feet would be required, with estimates ranging from 400,000 to 600,000 acre feet with average depth of 10 feet.

- 114 -
Although the 20% flow reduction goal for the full basin proposed by the RRBC has potential for reducing peak flood stages at numerous points in the basin, the reduction goal is based on the 1997 flood, which was a small flood event in the Fargo-Moorhead area (28,000 cfs). While a 20% flow reduction would provide some benefits for this level event, it would not solve the problem for Fargo-Moorhead. The proposed diversion project is designed for flows in excess of 61,000 cfs. Achieving a 20% reduction for a large flood event such as 61,000 cfs would require more storage than is available upstream of Fargo-Moorhead. Even if it were possible to construct enough upstream storage to reduce a 500-year event by 20%, the resulting peak flow at the Fargo gage would exceed that experienced in 2009 by more than 60%. Additional concerns with storage-only solutions have been evident in Valley City, Bismarck, and Minot. Each of these communities is provided flood risk reduction from reservoirs, which are drawn down to the maximum extent allowed in preparation for spring flood events. This flood risk reduction works when the reservoir has additional room to store the water; but once the reservoir is full, storage cannot provide any more benefits, and any entering water must be passed downstream to ensure that the dam does not fail. Thus, although the large storage projects for Valley City, Bismarck, and Minot have saved those communities from significant damages many times, the storage operations have their limits.
Analyzing Cumulative Findings on Potential for Retention
With the overall goal of reducing the peak flood flows on the Red River main stem for the 1997 flood by 20% theoretically achieved through the tributary runoff models and the MIKE 11 modeling, the challenge was to extrapolate those results to the various return frequency events being used throughout the basin.
Results Using Full Period of Record Since the 1997 flood was close to the 100-year flood along most of the Red River, the flow reduction results achieved along the Red River main stem for the1997 flood were used as the basis for determining amounts of flow reduction for 100-year, 200-year and 500-year events. Stage reductions for sites on the Red River main stem with RRBC proposed retention goals in place are summarized in the following table, which shows estimated stage reductions ranging from 0.8 foot to 3.1 feet for a 100-year flood event, and from 0.5 to 1.9 feet for a 200-year event, depending on the location along the Red River (see Appendix D, Table D-20).116 Stage reductions for the 500-year event, as available, are similar to those for the 200-year event. Stage Reductions along Red River of Potential Upstream Storage
116 The flood flow data listed is based on the 2001/2003 USACE Flood Frequency analysis.

- 115 -
Because a 200-year event is a potential scenario for most parts of the basin, flow conditions with proposed retention goals met were computed for a 200-year flood along the reaches of the Red River main stem. The table below summarizes those results, demonstrating that, with proposed impoundments in place, the 200-year peak flows would be reduced to close to 100-year flood levels at most of the seven select points along the main stem (See Appendix D- Table D-19). Effects of Potential Storage on 200-Year Flood
Results Using Shorter (Wet) Period of Record Finally, an analysis to determine the feasibility of basin flow reduction based on records that included data through the 2009 flood was completed. Flood risk reduction studies currently underway for the Fargo-Moorhead metropolitan area are using a shorter (wet cycle) period of record to estimate discharges for the various frequency floods. The latter analysis results in a change in stage and discharge levels for many locations along the Red River, especially in the Fargo-Moorhead area. For example, with the shorter record (wet cycle), the 100-year and 200-year flood flows are larger at Fargo-Moorhead, and, as a result, the stage reductions provided by the proposed upstream impoundments for those floods would be less. The stage reduction for the revised 100-year flood at Fargo-Moorhead would be in the range of 1 ½ feet rather than the 2 ½ feet shown in the table (see Sensitivity Analysis in Appendix D, Table D-18). Although it can be noted that stage reductions of from ½ to 3 feet will not adequately address the flood problems at the Red River main stem locations, those stage reductions will help alleviate the magnitude of the problems and, in most cases, increase reliability of local flood protection measures at the damage centers.
Estimated Costs
As described earlier, a total of 1,488,000 acre-feet is estimated to be required to produce a 20% flow reduction on the Red River main stem for a 1997 flood at the international border (see Appendix D, Table D-29). In the following table, 100,000 acre feet have been added to this total in order to account for the 100,000 acre feet of storage identified as needed in the Roseau River basin, where the waters come in north of the border and thus are not included in the earlier figure. Of the total 1,588,000 acre feet, about 130,000 acre feet of storage have already been

- 116 -
put into place between 1997 and 2010, leaving approximately 1.46 million acre feet yet to be implemented to achieve the 20% flow reduction goal. 117 Potential Flood Storage and Associated Costs
As the table shows, costs for the remaining 1.46 million acre feet of floodwater storage, based on the recent history of implementing gated flood impoundments, is approximately $1,000 per acre foot, resulting in a total cost of approximately $1.46 billion (an estimated $861 million for Minnesota and $599 million for North Dakota). It is important to note that approximately 8% of this total goal has already been achieved since the 1997 flood, with a construction rate for flood storage in the basin at about 10,000 acre-feet per year since 1997.118 This has been accomplished almost entirely with local and state funding. Although the strategy of flow reduction is clearly long-term, its benefits will be experienced locally as projects are completed. In the meantime, benefits for the basin in withstanding large main stem floods will gradually accrue. Once in place, the positive effects of the strategy of flow
117 Of the storage constructed since the 1997 flood, 62,600 acre feet have been accomplished in Minnesota and 68,000 acre feet in North Dakota. (Note: An additional 30,700 acre feet accomplished in North Dakota from a raise in Baldhill Dam will not be included in figures in this section on costs because its function does not extend to reducing flood peaks on the Red River main stem.) 118 Because the 1997 flood was used as a baseline for the 20% flow reduction goal, and because all storage constructed pre-1997 was in effect for the 1997 flood, only storage constructed after the 1997 flood is counted towards the acre feet needed for 20% flow reduction.

- 117 -
reduction will potentially reach many locations in the basin not yet identified (for a detailed analysis by city of potential positive impacts of upstream retention, see Appendix D, Table D-21). In addition, the basin and states would experience benefits with every flood event that incurs fewer damages.
Results of Complementary Floodplain Management Approaches
Reducing flood risk in the Red River basin requires the working together of the three complementary approaches of floodplain management: 1) nonstructural attention to the physical floodplain and land use practices, both urban and rural, together with participation in federal programs such as NFIP; 2) local site protection for vulnerable damage sites such as communities, urban centers and, as possible, agricultural lands; and 3) reduction of peak flood flows through a basin-wide effort. Level of Protection at Cities along the Red River
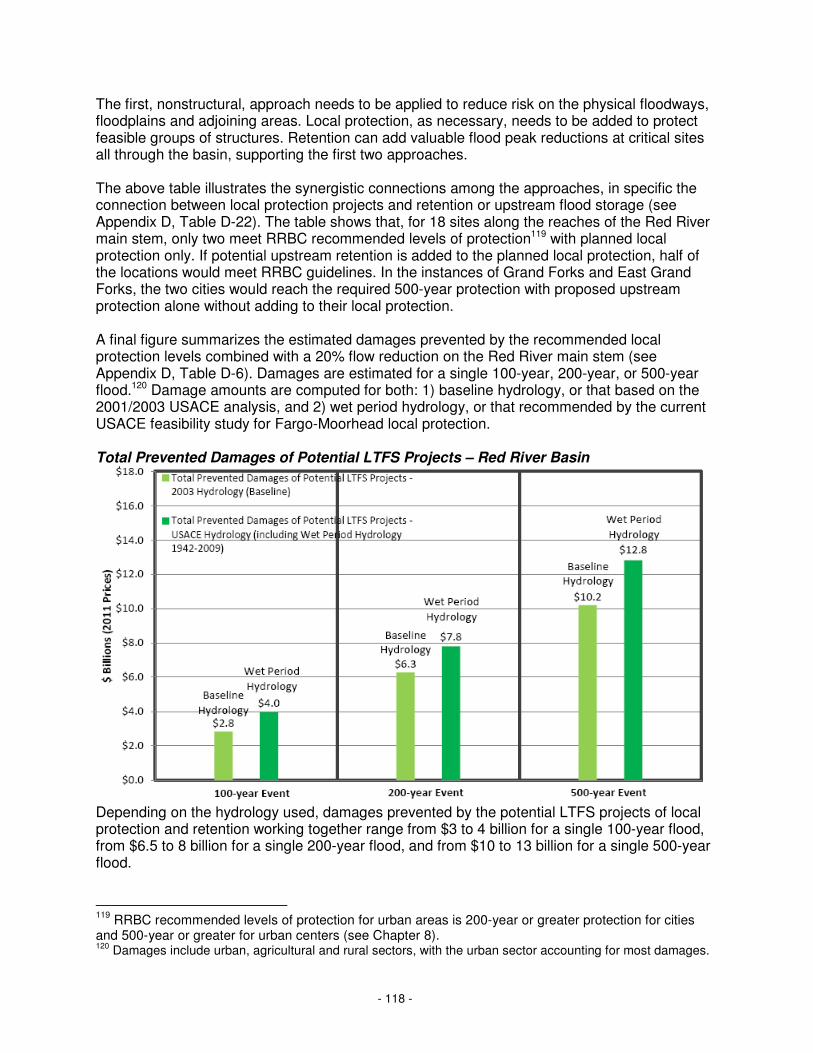
- 118 -
The first, nonstructural, approach needs to be applied to reduce risk on the physical floodways, floodplains and adjoining areas. Local protection, as necessary, needs to be added to protect feasible groups of structures. Retention can add valuable flood peak reductions at critical sites all through the basin, supporting the first two approaches. The above table illustrates the synergistic connections among the approaches, in specific the connection between local protection projects and retention or upstream flood storage (see Appendix D, Table D-22). The table shows that, for 18 sites along the reaches of the Red River main stem, only two meet RRBC recommended levels of protection119 with planned local protection only. If potential upstream retention is added to the planned local protection, half of the locations would meet RRBC guidelines. In the instances of Grand Forks and East Grand Forks, the two cities would reach the required 500-year protection with proposed upstream protection alone without adding to their local protection. A final figure summarizes the estimated damages prevented by the recommended local protection levels combined with a 20% flow reduction on the Red River main stem (see Appendix D, Table D-6). Damages are estimated for a single 100-year, 200-year, or 500-year flood.120 Damage amounts are computed for both: 1) baseline hydrology, or that based on the 2001/2003 USACE analysis, and 2) wet period hydrology, or that recommended by the current USACE feasibility study for Fargo-Moorhead local protection. Total Prevented Damages of Potential LTFS Projects – Red River Basin
Depending on the hydrology used, damages prevented by the potential LTFS projects of local protection and retention working together range from $3 to 4 billion for a single 100-year flood, from $6.5 to 8 billion for a single 200-year flood, and from $10 to 13 billion for a single 500-year flood.
119
RRBC recommended levels of protection for urban areas is 200-year or greater protection for cities and 500-year or greater for urban centers (see Chapter 8). 120 Damages include urban, agricultural and rural sectors, with the urban sector accounting for most damages.

- 119 -
PART IV: MOVING AHEAD WITH INTEGRATED ACTION
10
Conclusions and Recommendations for Action
The basin of the Red River of the North, historically subject to widespread chronic flooding, regularly sustains millions of dollars in economic damages for each flood event. The Red River Basin Commission (RRBC) identified the following conclusions on structural and nonstructural strategies needed for permanent flood solutions in the basin and recommendations for action for states (individually and collectively) and the federal government to consider as they fund and implement Long Term Flood Solutions (LTFS) for the Red River Basin in Minnesota and North Dakota. These recommendations are built around the basin-wide LTFS Level of Protection Goals” adopted by the RRBC in 2010 together with related flood risk reduction needs. The recommendations aim to move basin leaders from the usual response of reacting to the most recent major flood experience to a proactive, long-term plan with appropriate protection levels basin wide. If implemented, these recommendations will significantly reduce the risk of flood damages, and minimize disruption and economic loss and thus facilitate and expedite recovery after spring and summer floods. These recommendations cannot be successful without the dedicated local, state and federal participation in funding and commitment to implement.
Immediate Needs/Critical Risks: Fargo-Moorhead, Devils Lake
• Under current conditions, the Fargo-Moorhead metropolitan area could get, in a major 500-year level flood, $9 to $10 billion or more in basin damages, according to the USACE.
• Current levels of protection for Fargo-Moorhead are inadequate. Protection should be increased to enable a successful 500-year flood fight.
• Protection measures for Fargo-Moorhead should be economically viable and provide the least level of adverse impacts to others.
• A diversion of the Red River around Fargo-Moorhead would provide the protection needed to endure a successful 500-year flood fight if it were supplemented by retention and other available options to achieve the RRBC’s proposed LTFS level of protection goals.
• Retention to achieve the potential 20 percent flow reduction on the main stem should be aggressively pursued upstream of Fargo-Moorhead to decrease the duration, scope, and level of floods in the Fargo-Moorhead area, downstream communities, and rural areas.
Recommendation for Action 1.1 The flood protection trajectory that has increased protection in the Fargo-Moorhead metro area since the 2009 flood should continue. State and federal funds, with local government cost share, should continue supporting ongoing dike construction, property acquisitions, flowage easements, and flood infrastructure projects to be able to fight at least a 100-year flood, and upwards of a 500-year flood in the long term.

- 120 -
Recommendation for Action 1.2 Progress towards the proposed $1.77 billion diversion should be continued utilizing local, state, and federal funds so that, combined with current flood protection strategies, this community will have the capacity within 10 years to wage a successful flood fight equal to or greater than the LTFS 500-year flood.
Recommendation for Action 1.3 Retention upstream of the Hickson and Abercrombie stream gage for a flow reduction of 20 percent (minimum) should be advanced with shared funding by the F-M flood Diversion Authority working with local and joint water boards, using city, local, state, and federal funds.
Recommendation for Action 1.4 Leaders in state government in North Dakota and Minnesota, along with key local government officials and with input from the Diversion Authority and federal agencies, should convene by early 2012 to determine the non-federal cost share formula for the Locally Preferred Plan ($1.77 billion) diversion, and related $3.5 million operational estimates.
• Rising levels of water in the Devils Lake region have increased the potential for a natural overflow that could discharge approximately 14,000 cubic feet per second (cfs) of water into the Sheyenne River, triggering prolonged flooding and catastrophic downstream water quantity and quality problems in the Sheyenne and Red Rivers. This crisis should continue to be addressed with immediate local, state and federal action.
Recommendation for Action 1.5 The recommendations developed by the Devils Lake Executive Committee through the work of the Devils Lake Collaborative Working Group should continue to be supported by the state of North Dakota, local authorities, and federal and tribal governments to guard against critical risks.
Recommendation for Action 1.6 The RRBC and IRRB should distribute information with downstream interests and jurisdictions providing progress and timelines on Devils Lake activities.
Recommendation for Action 1.7 A comprehensive model using real-time data to determine the effects of releases of Devils Lake water via the various outlet channels on the Sheyenne and Red Rivers should be examined by local leaders and state and federal agencies to determine needs and related costs. The examination should include the integration of various models already in use by the USGS, the NWS, the NDSWC, and the USACE and be facilitated by the RRBC.
Cornerstone Solutions: Floodplain Management
2A Floodplain Management – Nonstructural Strategies 2B Floodplain Management – Raising Levels of Protection 2C Floodplain Management – Retention
- 121 -
2A Floodplain Management – Nonstructural Strategies
• A majority of the basin population lives adjacent to the Red River main stem and its tributaries at the lowest geographic elevation subject to flooding with no comprehensive, basin-wide approach to floodplain management , nor is there a mechanism to align the variations in local, state, and federal rules, regulations, and approaches.
• Nonstructural floodplain management strategies should be an integral component of reducing flood damage risks in the basin.
• The most effective overall technique for living with floods is for basin citizens to take personal responsibility for their own flood risk and for the sustainability of our natural resources.
• Minnesota and North Dakota should fund and administer flood mitigation policy consistently throughout the Red River basin so that a flood event in excess of the 100-year becomes the benchmark for managing the risk of flooding, regulating development in the floodplain, and for developing flood risk reduction projects around existing and newly developed areas.
Recommendation for Action 2A.1 State floodplain regulations and local zoning ordinances should contain criteria for new residential, commercial, industrial, and agri-business development that requires the largest of the following protection standards:
• 100-year flood plus three feet • 200-year flood plus one foot • flood of record plus one foot
Recommendation for Action 2A.2 Buildings located in at-risk areas where structural measures cannot accomplish the recommended flood protection levels or are not economically feasible should be publicly acquired and removed over the next three to five years.
Recommendation for Action 2A.3 Local governments in the basin should update floodplain ordinances in the next three years, not permit new development in areas of high risk of flooding immediately adjacent to the Red River and tributaries, and minimize the use of variances, unless protected by elevation or another acceptable FEMA strategy.
Recommendation for Action 2A.4 A review of basic floodplain regulations and programs should be undertaken by appropriate agencies and stakeholders of local, state and federal standards, to include:
2A.4.1 An evaluation of the appropriate standards and regulations for development throughout the basin, including the adequacy of the 100-year regulatory minimum standard (to include FIRMS) and the consideration of future standards to reduce losses;
2A.4.2 An analysis of community and state compliance with the flood insurance program, to include an analysis of proposed mandatory flood insurance for structures protected by dikes, identification of impediments to, and potential tools and

- 122 -
resources for, participation in FEMA’s community Rating System, determination of the feasibility of insurance development, and a strategy to prompt a basin-wide reduction in flood insurance rates;
2A.4.3 An analysis of the use of variances by local governments; the reasons for and consequences of using variances for individuals, communities, and state; and most effective way(s) to track and document the use of variances.
Recommendation for Action 2A.5 Every community and county in the basin should work toward joining or improving their rating through the national FEMA Community Rating System to achieve lower flood insurance premiums for their residents (40-45 percent discounts) by 2015 as part of their mitigation plan update.
Recommendation for Action 2A.6 A Floodplain Bill of Rights, to include a floodplain map and flooding history, should be developed by RRBC with local government, realtors, builders, developers, FEMA, and state agency participation (2012).
Recommendation for Action 2A.7 RRBC should develop education materials on the floodplain related to the floodplain, insurance, personal decisions, and the Floodplain Bill of Rights, to be distributed to the public, realtors, lenders, and others (2012).
Recommendation for Action 2A.8 The USACE nonstructural assessment of identified structures has been completed for the F-M diversion project along the main stem in six counties deemed economically feasible for nonstructural mitigation.
2A.8.1 The USACE should expand its assessment along the entire main stem. 2A.8.2 A local sponsor should be identified to provide the non-federal cost share of 35
percent and implement the mitigation in the next three to five years. 2A.8.3 Congress should authorize such a project and appropriate approximately $12
million in funding for the 65 percent federal cost share to mitigate.
Recommendation for Action 2A.9 Minnesota and North Dakota should use their respective state Silver Jackets (Flood and Hazard Mitigation) teams to regularly communicate issues regarding flood mitigation efforts in the Red River Basin. Silver Jackets team members from Minnesota and North Dakota should contribute to a collaborative interstate strategy for flood recovery and projects for mitigation efforts for the Red River of the North basin, to be coordinated with the RRBC and others as deemed appropriate.
2B Floodplain Management - Raising Levels of Protection
• Comprehensive and strategic level of protection goals are needed for the entire basin. To this point, existing levels of protection have been based most often on the most recent flood experience, political will, and funding availability.
- 123 -
• The Minnesota and North Dakota legislatures should use the RRBC Level of Flood Protection Goals as a guide to future basin flood risk reduction strategies. (See Level of Flood Protection Goals” adopted by the RRBC Board (2010) in LTFS Report, Ch. 8. Analysis assumes required freeboard.
Major Urban/Metropolitan Areas
• Fargo-Moorhead (see Section 1. Biggest Risks). • Grand Forks-East Grand Forks. Over the next 20 to 25 years, Minnesota and North
Dakota should support increasing protection to a 500-year flood level for Grand Forks-East Grand Forks by improving the cities’ current 200- to 250-year protection with upstream retention that achieves the potential minimum 20 percent flow reduction on the Red River main stem at Grand Forks.
• Winnipeg has elevated its level of protection to 700 years by recent expansion of their diversion following the 1997 flood. Since its construction and subsequent first use in 1969, the floodway has operated over 20 times and prevented more than $10 billion in flood damages. This model shows the importance of long range planning to realize the protection required from potential large floods.
Recommendation for Action 2B.1 Grand Forks and East Grand Forks should each request the 500-year or greater level of protection through the appropriate state and federal legislative avenues. Planning should recognize the degree to which the strategy of retention can assist in achieving this level of protection for the two cities.
Recommendation for Action 2B.2 The RRBC shall facilitate an exchange between officials in Winnipeg, Manitoba, and Fargo-Moorhead local government officials, the F-M Diversion Authority, and the public for the purpose of sharing Winnipeg’s experiences and expertise on the development and expansion of that city’s diversion, including engineering, construction, and operation and maintenance of the Red River Floodway. Critical Infrastructure:
• Critical infrastructure needs to be protected from flooding to the greatest levels practical. If adversely affected by flooding, infrastructure such as water and waste water facilities, airports, hospitals, transportation, regional communications facilities, or chemical storage sites can experience major disruptions, resulting in harm to the people, economy, and environment of the basin.
Recommendation for Action 2B.3 Over the next three to five years, state emergency management officers shall facilitate the identification and documentation of at-risk critical basin infrastructure and report to the state legislatures in the annual LTFS update. Small Cities and Municipalities:
• By 2015, cities in Minnesota and North Dakota on the main stem, tributaries, and in other flood prone areas should achieve protection to the 100-year level or three feet of freeboard the largest flood in their area plus three feet of freeboard, whichever is greater.

- 124 -
• Once cities have achieved this level of protection, additional protection should be pursued towards achieving greater than 200-year flood protection using upstream retention. Flood flow reduction from upstream retention can further complement the current levees and other strategies underway or contemplated.
Recommendation for Action 2B.4 Community structural projects in collaboration with the RRWMB and RRJWRD should be funded in the next state funding cycle for each respective state. See attached funding timeline table D-31 and Level of Protection Appendix D, D-3.1, p. 12 with state, local and federal funding. Rural Residences and Farmsteads Funding ring dikes or elevating of buildings for rural residents and farmsteads in flood prone areas should protect to three feet above the 100-year level or three feet above the largest flood in their area, whichever is greater.
Recommendation for Action 2B.5 Structural projects identified in collaboration with the RRWMB and RRJWRD for rural areas, including ring dikes and rural property acquisitions, should be funded beginning in the next state funding cycle through 2015 for each respective state. For those projects that become necessary only after future floods, funding shall become available in subsequent funding cycles. See attached funding table D-31 and Level of Protection Appendix D, D-3.1, p. 12.
Agricultural Cropland • Agriculture is an economic mainstay of the basin, with basin farms experiencing
composite net returns of $3 billion or more annually. • Adequate drainage, whether surface or tile, is crucial to crop production in the basin. • Studies such as the timing analysis study suggest that improvements to drainage
systems in areas that contribute consistently to the rising side of the Red River flood hydrograph (early water) have the potential to help reduce Red River flood peaks if they can move runoff through the system ahead of flood peaks. (Minnesota Flood Damage Reduction Workgroup Technical Paper No. 11)
• At this time, no comprehensive, systematic approach exists to coordinate the release of water in the current drainage system based upon this timing analysis. Recent improvements in modeling, flow data, and elevation data can be utilized to better manage water to reduce flooding on the Red River.
• The strategies that slow water or hold it on the land slightly longer (while allowing for timely movement in the drainage system) are best implemented through land use and easement programs that take into account landowner impacts, as well as benefits to the local area the main stem .
• Potential exists to appropriate new federal funding for land management to the basin through the next U.S. Farm Bill that will assist landowners in reducing runoff, reducing erosion, and improving water quality. This effort will come through programs administered by the Natural Resource Conservation Service or its designee.
Recommendation for Action 2B.6 The RRRA, RRWMB, and RRJWRD, with appropriate state agencies, local government, and commodity group participation and support, should develop a multipurpose drainage strategy for agricultural land that evaluates the following:
- 125 -
2.10.1 Designed and engineered for both private benefits and public water management
objectives. 2.10.2 Temporary detention (slowing down of water) by land management practices and
land use changes. 2.10.3 Side inlet controls for all ditches. 2.10.4 Use of drainage for peak flow reductions and erosion control. 2.10.5 Rate and volume of water related to field and drain capacity. 2.10.6 Timing and movement of water in an equitable manner. 2.10.7 Landowner incentives and needs. 2.10.8 Adding drainage components to hydrologic models. 2.10.9 Need for studies, strategies, moratoriums, and additional information.
Recommendation for Action 2B.7 River channel maintenance such as snagging and clearing of trees, including the removal of trees that have or are at risk of falling into rivers and waterways, should be continued as necessary to maintain open waterways systems. The two states should continue to fund this effort: under current policies, North Dakota at its level of about $1 to $2 million, and Minnesota to restore its historic level of $150,000 per year.
Recommendation for Action 2B.8 For purposes of achieving long-term flood retention and other benefits, Minnesota should provide state funding through bonding of $10 million a biennium for the Red River basin through the Board of Water and Soil Resources for Reinvest In Minnesota (RIM) easements to match or supplement federal USDA conservation funding such as the Wetland Reserve Program, Conservation Reserve Program, EWP, and Environmental Quality Assurance Programs to achieve long term flood retention to leverage federal funding in the next five-year farm bill and for other benefits.
Recommendation for Action 2B.9 A basin wetland bank whereby farmers/landowners can purchase and exchange wetland credits should be developed by Minnesota, North Dakota, and South Dakota in partnership with NRCS and the local joint water resource districts in North Dakota and joint watershed districts in Minnesota.
Recommendation for Action 2B.10 The following pilot projects, demonstrations, and studies should be authorized and funded:
2B.10.1 Drainage as a Flood Reduction Tool Analysis: The RRRA, with appropriate state agency support, shall initiate an analysis of how to better utilize the surface drainage system to lower spring flood hydrographs by removing water on the rising side of the hydrograph consistent with the early, middle, and late zones.
2B.10.2 Culvert Inventory: An analysis outlining the advantages, disadvantages, benefits, and costs of a basin-wide culvert inventory gathered at the local water board level should be completed by RRBC and presented to the appropriate local and state entities with recommended funding from local, state, and federal sources (2012).
2B.10.3 Culvert Size Demonstration Project: A demonstration project in partnership with NRCS and affected local water boards should be implemented to analyze the flow

- 126 -
reduction benefits of small distributed and culvert-sizing retention. The project, estimated to cost about $1.5 million, should be 75/25 percent federal/non-federal cost shared (2012).
2B.10.4 Ag Damage Report: The 1980 and 2002 basin agriculture flood damage reports should be updated and documented in a continuously updated data base, with federal funds provided through USDA to provide local project benefit/cost information to assist in local impoundment strategies at the local landowner and water board level.
2B.10.5 Wetland Water Level Management Pilot Project: Within the next two years, a pilot project should be funded by NRCS in cooperation with the RRRA and other appropriate state and federal agencies to draw down wetlands in the autumn enabling spring storage and determining benefits and impacts for habitat and retention.
2B.10.6 Multi-Purpose Pilot Project: A demonstration project with funding and participation from farm and commodity groups and other interested parties should be developed and implemented in 2012, with RRBC assistance, to gather data on the timing and impacts on flooding from the following: tile drainage, surface drainage, wetland restoration, early water ditch drainage, and culvert sizing.
2B.10.7 Tile Drainage Study: A tile drainage analysis by the RRRA through the Basin Technical and Scientific Advisory Committee under the staff direction of the International Water Institute should be funded by the RRWMB and RRJWRD and completed in 2012.
2B.10.8 Buffer Strip: Buffer strips should be established and enforced at the local level for all natural, altered, and man-made waterways to a minimum of 16.5 feet (1 rod) and a maximum of 50 feet or more with incentives provided to landowners to reduce sediment for water quality and maintenance cost benefits and to slow the flow of water into the waterways.
Recommendation for Action 2B.11 The rural flood control systems that protect agricultural productivity and the economy from spring and summer floods should continue to be implemented throughout the basin. The goal is to reduce crop loss and to reduce planting delays by moving water off of land by mid-May in the spring and maximize flood control designs for peak run off for a 24-hour summer rainfall event with a 10 year reoccurrence interval. Critical Transportation System and Emergency Services
• The Red River basin covers approximately 45,000 square miles or 28 million acres, a majority directly in active agricultural production, with an extensive system of highways, roads, and bridges that provide for the movement of goods and people to enhance the economic output of the region.
• The RRBC should facilitate discussions with regional organizations, state and federal departments of transportation, and EMOs, to identify a strategy for critical transportation preservation including potential road elevations during 100-, 200-, and 500-year flood levels compatible with the LTFS level of protection goals.
• Critical transportation and emergency services throughout the basin are inconsistent with each other and fail to operate effectively for a typical flood event.

- 127 -
Recommendation for Action 2B.16 Minnesota and North Dakota should each explore the issues surrounding dedicating a portion of state aid for highway funding for culvert sizing and related road modifications that benefit basin flood damage reduction strategies and introduce legislation to change state law if necessary. The RRBC shall assist with facilitation the discussion and analysis, by the end of 2013.
Recommendation for Action 2B.17 An analysis of planned and proposed road elevations for 100-, 200-, and 500-year flood protection at township, county and state levels for emergency, population sustainability, and agricultural and economic production needs shall be developed. Engineering expertise funded and directed by the RRWMB, RRJWRD, and appropriate state agencies should identify needs by location and hydrologic impacts on flooding by change of flows, elevation of the flood stage, and other related impacts using the new LiDAR data.
Recommendation for Action 2B.18 Minnesota and North Dakota should develop through their Departments of Transportation, a state and local funding strategy to assist in county and township flood-related road repairs and implement additional flood mitigation efforts once the protection goals are achieved and federal emergency aid under a disaster declaration is less likely.
Recommendation for Action 2B.19 The RRBC should facilitate discussions with relevant regional organizations, state and federal departments of transportation, and emergency management offices to identify a strategy for critical transportation preservation, including potential road elevations during the 100-, 200-, and 500-year flood levels, and to identify state and federal funding needs.
2C Floodplain Management - Retention
• No comprehensive, basin-wide strategy exists to implement the LTFS minimum 20 percent flow reduction goal for the main stem while achieving local tributary flood damage reduction.
• The impacts of retention are often dependant on timing and location. Not all sites are equally beneficial for local tributary and basin main stem flood damage reduction.
• Flow reduction through retention as demonstrated by modeling can reduce flows and stages on the Red River main stem as well as provide local benefits on tributaries. However, due to the variability of flood events, retention must be used in conjunction with other structural and non-structural measures to achieve the LTFS goals that will result in basin-wide improved levels of protection.
• The minimum goal for flow reduction on the Red River main stem at the international boundary for a 100-year flood equates to around 1.5 million acre feet of storage upstream accounting for timing of flow and costing approximately $1.5 billion.
• Retention using the minimum 20 percent flow reduction goal basin-wide can be achieved over the next 20 years if local, state, and federal funds are leveraged to provide comprehensive local, tributary and main stem benefits for residents, property, and the environment.
• Retention that will cumulatively achieve the basin minimum 20 percent flow reductions over the next 20 to 25 years should be managed to improve flood control, improve water

- 128 -
quality, include natural resource enhancement opportunities, and provide potential water supply during extended droughts.
• Numerous small, aged PL 83-566 flood control dams throughout the basin could provide additional capacity for flood storage retention with refurbishment.
Recommendation for Action 2C.1 Federal funding should be provided for retention at $25 million per year or $500 million over the next 20 years, with Minnesota, North Dakota, and local governments providing cost share funding for retention to achieve a minimum 20 percent reduction in peak flows on the Red River.
Recommendation for Action 2C.2 Cost for retention projects should be shared among federal (50 to75 percent), states of Minnesota and North Dakota (25 to 35 percent), and the RRWMB, RRJWRD and local water boards (10 to 25 percent) over a period of 20 years staying within the current local joint board two mil levy.
Recommendation for Action 2C.3 A review of federally operated reservoirs, identifying the potential for increased storage during flood events, should be conducted by USACE and state agencies, and Wildlife Management Areas by the USFWS, reporting to relevant state agencies and the RRRA.
Recommendation for Action 2C.4 The newly formed RRRA should work with each water management board to plan, design, and implement retention, to achieve 25 percent of the retention goal every five years for their respective areas, with the goal of achieving the minimum 20 percent flow reduction for the Red River main stem over 20-25 years.
Recommendation for Action 2C.5 A project prioritization methodology for the use of federal funds reflecting local and main stem needs and benefits should be developed by the RRRA by 2012.
Recommendation for Action 2C.6 The permitting process for water retention projects should be coordinated by the RRRA and a federal agency liaison in the basin working with appropriate state and federal agencies to help streamline the process to decrease timelines for project implementation, allow a one-stop permitting process, and provide general permits for certain projects.
Recommendation for Action 2C.7 NRCS and/or the states of Minnesota and North Dakota should provide $400,000 to expand the Project Planning and Permit Evaluation demonstration project to the entire Red River basin through the International Water Institute as part of the USACE Basin Watershed Feasibility Study.
Recommendation for Action 2C.8 Public outreach on retention programs and a survey to determine landowner interest in storing water on their land should be completed in two years by the RRWMB and RRJWRD (or

- 129 -
the RRRA) to assist in future planning for retention projects and determine achievable timelines and cost expectations that correspond to local participation.
Recommendation for Action 2C.9 Regarding the ongoing USACE Red River Basin-wide Feasibility Study:
2C.9.1 The current ongoing study shall be continued with federal funding at $1 million per year and corresponding $1 million non-federal match.
2C.9.2 The updating of HMS (hydrologic modeling system) of the remaining major watersheds should be completed by the end of 2012. This modeling will provide the tools necessary to identify retention projects on tributaries that provide local benefits and cumulatively benefit the basin.
2C.9.3 Modeling of the remaining main stem Hydrologic Engineering Centers River Analysis System HEC-RAS reach to the Canadian border presently underway, including the work needed to tie all the main stem reaches together into one model from White Rock, South Dakota, to the Canadian border, should be completed by the end of 2012.
2C.9.4 The HEC-RAS main stem model, in conjunction with the new watershed HMS models, should be finalized in such a way that they can be utilized to provide the basis for a RRRA “Project Prioritization Process” needed for evaluating proposed projects, their effectiveness, and downstream impacts in contributing to the RRBC’s flow reduction goals on the major tributaries and Red River main stem.
Recommendation for Action 2C.10 NRCS, in conjunction the RRRA, shall evaluate PL 83-566 and other dams that have flood control capacity in the basin to determine the feasibility of restoration for the purpose of adding potential flood water retention storage, including the identification of specific structures for rehabilitation, specific strategies and funding necessary, and proposed timelines. NRCS shall issue its findings to the RRRA by September 30, 2012. Federal funding of up to $6 million is needed for the evaluation and an additional estimated $10-$15 million for refurbishment.
Information and Tools for Maximizing Efforts Going Forward
• The Red River Basin, a vast geographic area of three states and one Canadian province, has great need for cooperation across boundaries for uniform data and information gathering efforts, an understanding of our differences, and a shared vision of what needs to be accomplished.
• The current local, state, and federal partnership in comprehensive flood risk reduction strategies is disjointed and operates in a piecemeal fashion.
• Each flood varies, creating unique issues regarding preparation and protection needs. • Levels of protection recommended by RRBC for the LTFS Report will provide the
safety net needed and allow for variations in floods, weather, and forecasting. • Further improvements in flood forecasting such as new data sets, modeling
improvements, and real time information to account for variables related to precipitation and temperature are needed to build upon those instituted after the 1997 flood.
• Additional efforts and information are needed as a guide for the future as updated needs become evident.

- 130 -
Recommendation for Action 3.1 The RRBC shall, for the next 10 years, conduct an annual evaluation of flood mitigation progress towards the implementation of the LTFS Report Recommendations. This evaluation shall be submitted to Minnesota, North Dakota, South Dakota, and Manitoba.
Recommendation for Action 3.2 Jurisdictional Multi-Boundary Coordination should be implemented wherever possible through the RRBC.
3.2.1 The Minnesota, North Dakota, and South Dakota governors and the Manitoba
Premier should meet at least once every two years, along with the relevant legislative committee chairs of the state and provincial governments, to receive an update on progress towards the LTFS recommendations on flood reduction strategies, water quality, water quantity, and other relevant natural resource issues.
3.2.2 With the assistance of RRBC, the International Legislators Forum among Manitoba, Minnesota, North Dakota, and South Dakota legislators should be continued to discuss current topics, including flood risk reduction strategies.
3.2.3 Minnesota should coordinate through the Board of Water and Soil Resources and the state legislature the inclusion of all subwatersheds on the Minnesota side as Watershed Districts (Ottertail) and membership in the RRWMB (Ottertail and Buffalo-Red Watershed District).
3.2.4 Federal agencies should utilize their regional structures in innovative new ways to accommodate Red River basin hydrologic boundaries.
3.2.5 When necessary, RRBC shall coordinate a jurisdictional meeting of heads of state, legislative leaders, and key agency officials to prompt dialogue and development of unified action on such issues.
Recommendation for Action 3.3 LTFS should be expanded to include the entire Red River basin:
3.3.1 Manitoba should continue funding RRBC’s efforts to model the 20 percent flow reduction strategy in Manitoba and also continue and accelerate the gathering of Light Detection and Ranging (LIDAR) data, at $70,000 through 2012.
3.3.2 South Dakota and local leadership should determine the feasibility of establishing watershed organizations in Roberts and Marshall counties through the International Legislators Forum within the next two years.
Recommendation for Action 3.4 RRBC should coordinate development of a basin-wide strategy and identification of funding sources for improving flood forecasting during 2012 among local, state, provincial, and federal agencies.
3.4.1 The generation of relevant time appropriate data (real time rain and snowmelt, soil moisture, frost depth information, and other information) and improved modeling through a volunteer network and the development of a real time network shall be addressed.
3.4.2 The feasibility of establishing an on-site decision support service to the region during spring and summer flood events by hosting a US National Weather Service

- 131 -
hydrologist in the basin shall be considered, as well as identifying a funding source for such an effort.
Recommendation for Action 3.5 The USGS, RRWMB, RRJWRD, and their member water boards, NDSWC, MNDNR, and other key stakeholders, should develop a stream gage strategy by 2012 with associated costs and funders for the basin for the main stem Red River and its tributaries that will support the new hydrologic and hydraulic models that will provide a long term record for accurate, timely, and consistent flow data for model development, aid in flood reduction strategies, and include water quality modeling needs in the next two years.
Recommendation for Action 3.6 RRBC should update the LTFS Report in 2021 with the inclusion of Manitoba and South Dakota and shared funding from the four jurisdictions.
Resources to Implement
• Minnesota and North Dakota, cost sharing with local, state, and federal funds, should implement actions consistent with the LTFS to maintain the basin’s social, economic, and environmental welfare and protection from future large floods, as this investment over the next 10 years will significantly reduce the risk of $11-13 billion in losses from a large flood and protect the economic output of the basin.
Recommendations for Action 4.1 The states of Minnesota and North Dakota, cost sharing with local and federal partners, should make a financial investment of about $3.54 billion over the next 10 years to immediately address flooding in the basin with a structural approach.
4.1 Funding in Minnesota needed for the next 10 years is $270.9 million, from local and state sources.
4.2 Funding in North Dakota needed for the next 10 years is $536.4 million from local and state sources.
4.3 Local funding at the RRWMB and RRJWRD levels should be increased and maintained at a two mil levy.
See attached funding timeline table D-31 and Level of Protection Appendix D, D-3.1, p. 12 with state, local and federal funds.

- 132 -
11 Funding Timeline for Project Implementation Costs
Along the Red River of the North and Tributaries

- 133 -

- 134 -

- 135 -
12 Red River Basin Commission Long Term Flood
Solutions Implementation Table
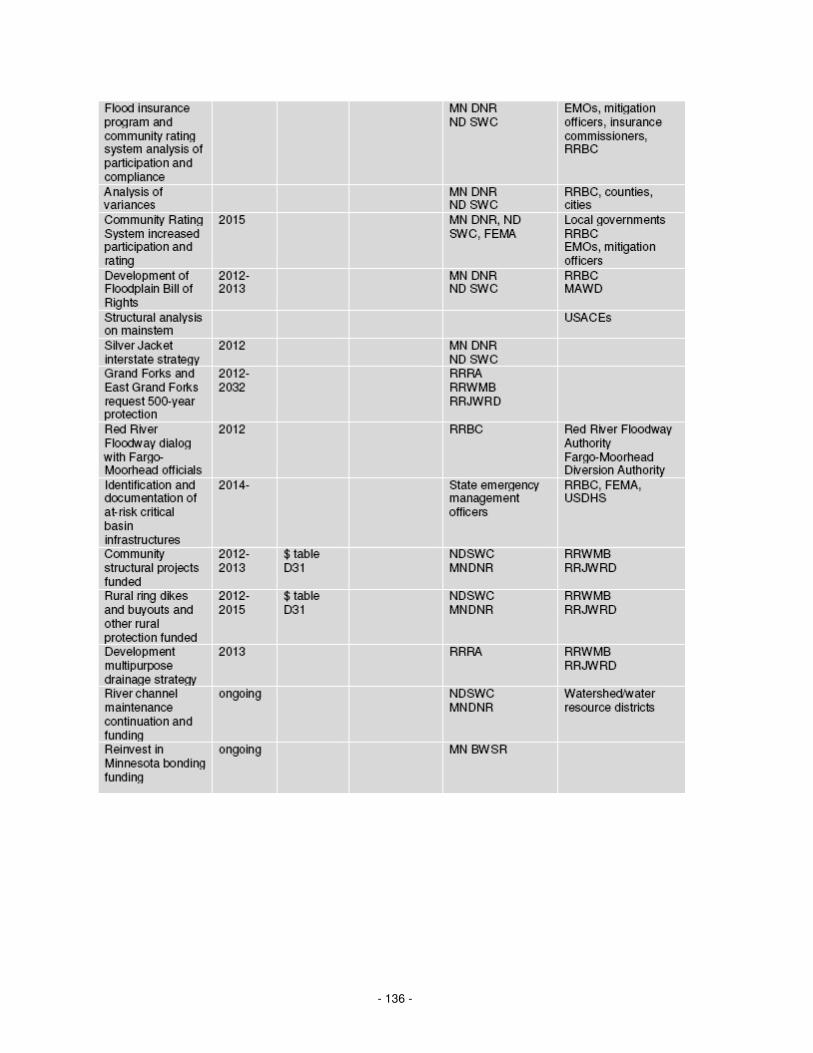
- 136 -

- 137 -

- 138 -
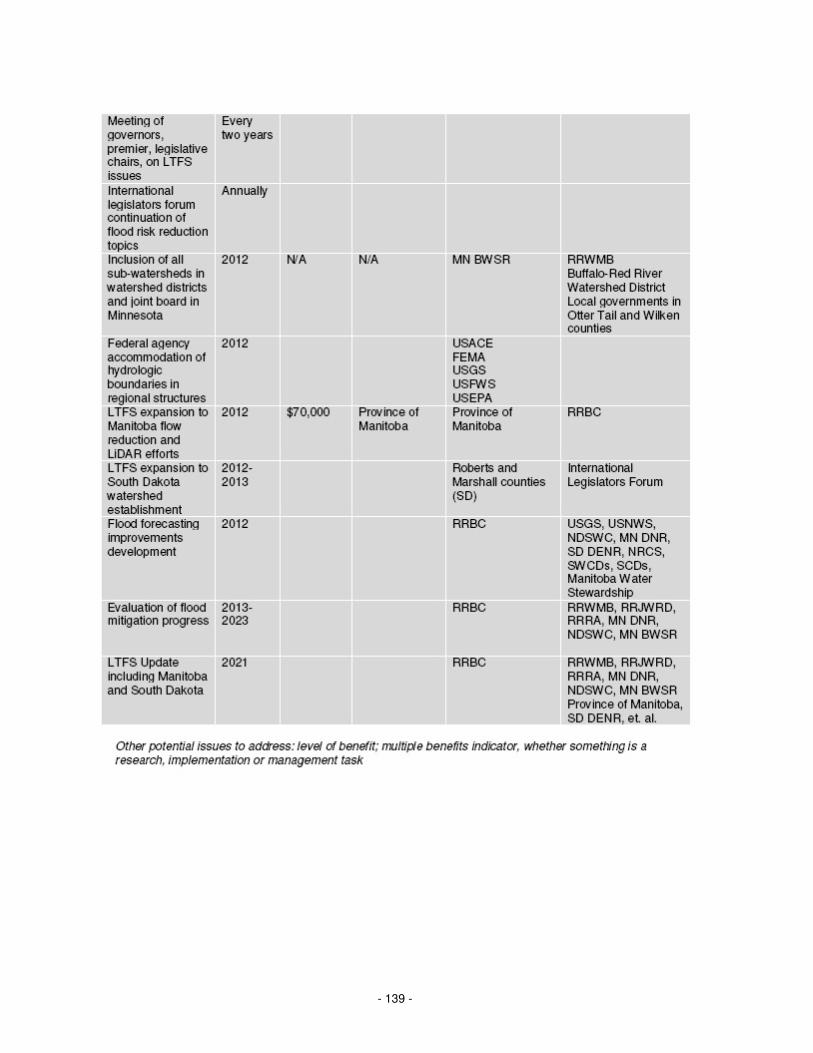
- 139 -