Long-term damage from the Great Recession in OECD countries · Long-term damage from the Great...
12
Long-term damage from the Great Recession in OECD countries Laurence Ball* Department of Economics, Johns Hopkins University, Baltimore, MD, USA This paper estimates the long-term effects of the global recession of 2008–2009 on output in 23 countries. I measure these effects by comparing current estimates of potential output from the OECD and IMF to the path that potential was following in 2007, according to estimates at the time. The losses in potential output range from almost nothing in Australia and Switzerland to more than 30 percent in Greece, Hungary, and Ireland; the average loss, weighted by economy size, is 8.4 percent. Most countries have experienced strong hysteresis effects: shortfalls of actual output from pre-recession trends have reduced potential output almost one-for-one. In the hardest-hit economies, the current growth rate of potential is depressed, implying that the extent of lost potential is growing over time. Keywords: Great Recession, hysteresis, potential output JEL codes: E32, E65, E66 1 INTRODUCTION According to textbooks in macroeconomics, a fall in aggregate demand causes a recession in which output drops below potential output – the normal level of production given the economy’s resources and technology. This effect is temporary, however. A recession is fol- lowed by a recovery period in which output returns to potential, and potential itself is not affected significantly by the recession. This textbook theory has been called into question by, amongst others, Cerra/Saxena (2008), IMF (2009), and Reinhart/Rogoff (2009). These studies examine deep recessions around the world and find highly persistent effects on output. Haltmaier (2012) and Reifschneider et al. (2013) argue that these effects occur because a recession reduces an economy’s potential output. Potential output falls because a recession reduces capital accu- mulation, leaves scars on workers who lose their jobs, and disrupts the economic activities that produce technological progress. Some economists use the term ‘hysteresis’ for these long-term effects of recessions (Blanchard/Summers 1986). Experience since the global financial crisis and Great Recession of 2008–2009 has strengthened the evidence for long-term effects of recessions. Reinhart/Rogoff (2014) point out that output in many countries is still highly depressed in 2014, with authorities such as the IMF forecasting weak recoveries in the next 5 years. As Summers (2014) puts it: ‘This financial crisis has confirmed the doctrine of hysteresis more strongly than anyone might have supposed.’ This paper uses OECD estimates of potential output in 23 countries to quantify the long-term damage from the Great Recession. For each country, I take the path that potential * I am grateful for excellent research assistance from Daniel Garcia Molina and for suggestions from Daniel Leigh. European Journal of Economics and Economic Policies: Intervention, Vol. 11 No. 2, 2014, pp. 149–160 © 2014 The Author Journal compilation © 2014 Edward Elgar Publishing Ltd The Lypiatts, 15 Lansdown Road, Cheltenham, Glos GL50 2JA, UK and The William Pratt House, 9 Dewey Court, Northampton MA 01060-3815, USA Downloaded from Elgar Online at 05/16/2018 10:59:03PM via free access
Transcript of Long-term damage from the Great Recession in OECD countries · Long-term damage from the Great...

Long-term damage from the Great Recessionin OECD countries
Laurence Ball*Department of Economics, Johns Hopkins University, Baltimore, MD, USA
This paper estimates the long-term effects of the global recession of 2008–2009 on output in 23 countries.I measure these effects by comparing current estimates of potential output from the OECD and IMF tothe path that potential was following in 2007, according to estimates at the time. The losses in potentialoutput range from almost nothing in Australia and Switzerland to more than 30 percent in Greece,Hungary, and Ireland; the average loss, weighted by economy size, is 8.4 percent. Most countrieshave experienced strong hysteresis effects: shortfalls of actual output from pre-recession trends have reducedpotential output almost one-for-one. In the hardest-hit economies, the current growth rate of potential isdepressed, implying that the extent of lost potential is growing over time.
Keywords: Great Recession, hysteresis, potential output
JEL codes: E32, E65, E66
1 INTRODUCTION
According to textbooks in macroeconomics, a fall in aggregate demand causes a recessionin which output drops below potential output – the normal level of production given theeconomy’s resources and technology. This effect is temporary, however. A recession is fol-lowed by a recovery period in which output returns to potential, and potential itself is notaffected significantly by the recession.
This textbook theory has been called into question by, amongst others, Cerra/Saxena(2008), IMF (2009), and Reinhart/Rogoff (2009). These studies examine deep recessionsaround the world and find highly persistent effects on output. Haltmaier (2012) andReifschneider et al. (2013) argue that these effects occur because a recession reduces aneconomy’s potential output. Potential output falls because a recession reduces capital accu-mulation, leaves scars on workers who lose their jobs, and disrupts the economic activitiesthat produce technological progress. Some economists use the term ‘hysteresis’ for theselong-term effects of recessions (Blanchard/Summers 1986).
Experience since the global financial crisis and Great Recession of 2008–2009 hasstrengthened the evidence for long-term effects of recessions. Reinhart/Rogoff (2014)point out that output in many countries is still highly depressed in 2014, with authoritiessuch as the IMF forecasting weak recoveries in the next 5 years. As Summers (2014) putsit: ‘This financial crisis has confirmed the doctrine of hysteresis more strongly than anyonemight have supposed.’
This paper uses OECD estimates of potential output in 23 countries to quantify thelong-term damage from the Great Recession. For each country, I take the path that potential
* I am grateful for excellent research assistance from Daniel Garcia Molina and for suggestionsfrom Daniel Leigh.
European Journal of Economics and Economic Policies: Intervention, Vol. 11 No. 2, 2014, pp. 149–160
© 2014 The Author Journal compilation © 2014 Edward Elgar Publishing LtdThe Lypiatts, 15 Lansdown Road, Cheltenham, Glos GL50 2JA, UK
and The William Pratt House, 9 Dewey Court, Northampton MA 01060-3815, USADownloaded from Elgar Online at 05/16/2018 10:59:03PMvia free access
output was following before the financial crisis, according to OECD estimates fromDecember 2007, and extrapolate this path through 2015. I compare this pre-crisis trend toestimates of potential output in the most recent vintage of OECD data (May 2014), andinterpret the differences as effects of the recession. To check robustness, I do a similar exerciseusing IMF estimates of potential output from October 2007 and from April 2014.
I find that the loss in potential output from the Great Recession varies greatly acrosscountries, but is large in most cases. Based on current forecasts for 2015, the loss rangesfrom almost nothing in Switzerland and Australia to over 30 percent of potential output inGreece, Hungary, and Ireland. The average loss for the 23 countries, weighted by the sizeof their economies, is 8.4 percent.
The analysis also yields two related results. First, in most countries the loss of potentialoutput is almost as large as the shortfall of actual output from its pre-crisis trend. Thisfinding implies that hysteresis effects have been very strong during the Great Recession.
Second, in the countries hit hardest by the recession, the estimated growth rate of poten-tial output is significantly lower today than it was before 2008. This growth slowdownmeans that the level of potential output is likely to fall even farther below its pre-crisistrend in the years to come.
2 METHODOLOGY
I examine 23OECD countries that meet two criteria: (1) the population exceeds one million;and (2) the OECD published estimates of the country’s potential output in its EconomicOutlooks for both December 2007 and May 2014. The 23 countries include 20 thathave belonged to the OECD since the 1960s or 1970s, plus three that joined in the1990s: the Czech Republic, Hungary, and Poland.1
Beffy et al. (2006) describe the OECD’s method for estimating potential output, whichis based on a production function. OECD economists estimate the long-run trends in laborinput, the capital stock, and total factor productivity. The trend in labor input is determinedby trends in the labor force, unemployment, and hours of work. The various trends areplugged into the production function to determine the path of potential output.
I take annual series for output, Y, and potential output, Y*, from the OECD EconomicOutlook forMay 2014. These series include forecasts of Y and Y* through 2015. To assess thedamage from the Great Recession, I also need estimates of the levels that potential outputwould have attained if not for the recession. To produce these estimates, which I denoteby Y**, I examine the paths for potential output that countries were following as of 2007.
Specifically, the Economic Outlook for December 2007 includes series for potentialoutput through 2009. I take these pre-crisis data as estimates of Y**, and extend the seriesbeyond 2009 with log-linear extrapolation. Letting y** denote the log of Y**, I computethe average annual change in y** from 2000 to 2009, and assume the change in y** isconstant at that level from 2009 to 2015.2
Figure 1 illustrates this procedure for the United States. The figure shows the logs of Y,Y*, and Y**, with logs again denoted by lower-case y’s. In the December 2007 data, the
1. I exclude one country that meets the two criteria: Norway. The OECD series for Norway’spotential output is volatile, making it difficult to project the pre-crisis path of potential into thefuture. This problem may reflect the large share of oil in Norway’s output.2. The base years for the output series differ across countries, and they differ between theDecember 2007 andMay 2014 Outlooks. For each country, I make the two vintages of data consistentby multiplying the December 2007 series for output and potential output by a ratio: (output in 2000 inthe May 2014 data)/(output in 2000 in the December 2007 data).
150 European Journal of Economics and Economic Policies: Intervention, Vol. 11 No. 2
© 2014 The Author Journal compilation © 2014 Edward Elgar Publishing Ltd
Downloaded from Elgar Online at 05/16/2018 10:59:03PMvia free access

change in y** is almost constant from 2000 to 2009, which implies that the path of y** inthe figure is close to a straight line. In extrapolating the data, I essentially extend thestraight line beyond 2009.
In 2013, the difference between y** and y* in the United States was 0.048, and the dif-ference between y* and y was 0.036. The difference between the levels of Y** and Y* – theloss of potential output relative to its pre-crisis path – was 4.7 percent of Y**. The differ-ence between Y* and Y – the current gap between potential and actual output – was3.4 percent of Y**. According to current OECD forecasts, the loss of potential outputwill grow to 5.3 percent in 2015 while the output gap will fall to 1.9 percent. (I computeexact percentage losses because, for some countries considered below, the losses are largeenough to make approximation by log differences inaccurate.)
As a robustness check, I also estimate losses in potential output with data from the IMF’sWorld Economic Outlook, using data from April 2014 on actual and potential output anddata from October 2007 on the pre-crisis path of potential. The series in the 2007 WEOend in 2008, so I extrapolate y** over 2009–2015 based on its path over 2000–2008. TheWEO data are available for 17 of the 23 countries in the OECD sample. For the UnitedStates, the loss of potential output is 7.7 percent in 2015, somewhat higher than the esti-mate based on OECD data.
For the United States, several other studies estimate the loss of potential output sincethe onset of the financial crisis. Fernald (2012) estimates a loss of potential of 5 percent in2011; Reifschneider et al. (2013) estimate 6 percent in the first quarter of 2013; and CBO(2014) predicts a loss of 7.3 percent in 2017. My estimates of lost potential in the US areabout the same magnitude as previous estimates.3
-0.5
0.0
0.5
1995 2000 2005 2010 2015
y y*y**, 1995–2009 y**, 2010–2015
Note: y** is normalized to zero in 2000.Sources: y and y*: OECD Economic Outlook May 2014. y**, 1995–2009: OECD Economic OutlookDecember 2007. y**, 2010–2015: extrapolated from y**, 2000–2009.
Figure 1 Long-term damage in the United States
3. The CBO says it has reduced its forecast of potential output in 2017 based on reassessments oflong-run trends in employment and productivity, and that most of this revision is not a result of theGreat Recession. Ball et al. (2014) dispute the CBO’s interpretation of its forecast revision.
Long-term damage from the Great Recession in OECD countries 151
© 2014 The Author Journal compilation © 2014 Edward Elgar Publishing Ltd
Downloaded from Elgar Online at 05/16/2018 10:59:03PMvia free access

3 RESULTS
Here I estimate the loss of potential output in each of the 23 countries in my sample.I also compute the average loss across countries weighted by the size of their economies,as measured by Y** in 2015.4
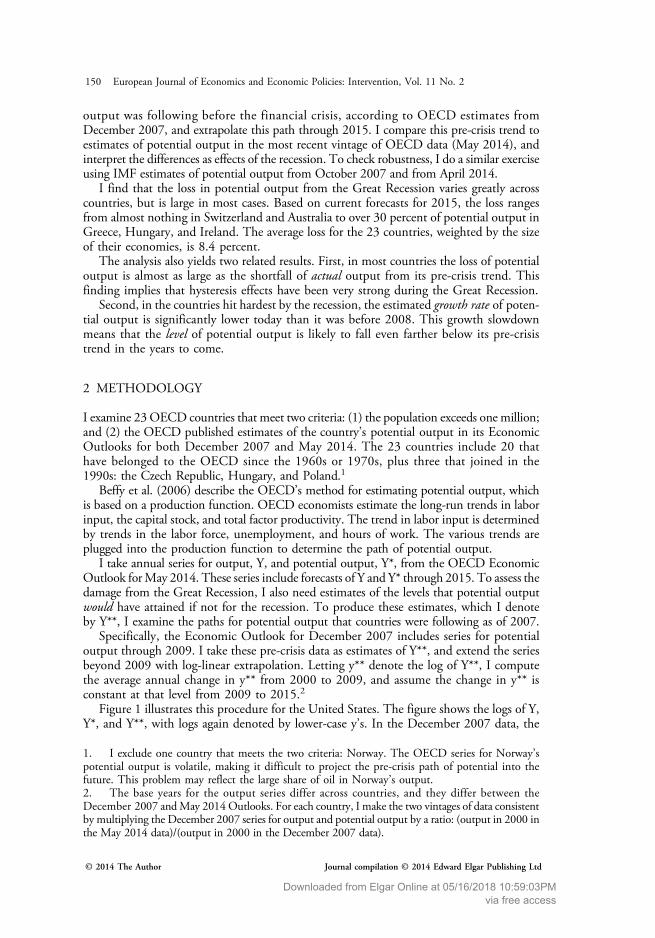
For each country, Figure 2 shows the paths of y, y*, and y**. In most cases, as in theUnited States, the path of y** is close to a straight line. Table 1 gives summary statistics,focusing on losses in 2013 and forecast losses in 2015. Several points emerge from the results.
3.1 Lost potential
The damage from the Great Recession varies greatly across countries. For 2015, the lossesof potential output range from approximately zero in Switzerland and less than 2 percentin Australia to more than 30 percent in Greece, Hungary, and Ireland. The US loss of5.3 percent is lower than most. Figure 3 captures this cross-country variation in a bar graph.
For the entire sample, the weighted average of the loss in potential output is 7.2 percentin 2013 and rises to 8.4 percent in 2015. Measured in 2015 US dollars, the 8.4 percent lossfor the 23 countries adds up to $4.3 trillion.
The IMF data produce estimated losses that are similar to those from the OECD data.Figure 4 illustrates this point by comparing the 2015 losses of potential based on the twosources, for the 17 countries covered by both. The majority of countries fall just above the45 degree line, indicating slightly larger losses in the IMF data.
1995 2000 2005 2010 2015
Australia
1995 2000 2005 2010 2015
Austria
1995 2000 2005 2010 2015
Belgium
−0.5
0.0
0.5
−0.5
0.0
0.5
−0.5
0.0
0.5
−0.5
0.0
0.5
1995 2000 2005 2010 2015
Canada
Figure 2 Long-term damage in 23 countries
4. Each country’s weight is proportional to the product of (2015 nominal GDP in dollars) and(Y**/Y). Nominal GDP in dollars is taken from the April 2014 WEO, because the OECD does notreport this variable.
152 European Journal of Economics and Economic Policies: Intervention, Vol. 11 No. 2
© 2014 The Author Journal compilation © 2014 Edward Elgar Publishing Ltd
Downloaded from Elgar Online at 05/16/2018 10:59:03PMvia free access

-0.5
0.0
0.5
-0.5
0.0
0.5
-0.5
0.0
0.5
-0.5
0.0
0.5
1995 2000 2005 2010 2015
Czech Republic
1995 2000 2005 2010 2015
Denmark
1995 2000 2005 2010 2015
Finland
1995 2000 2005 2010 2015
France
−0.5
0.0
0.5
−0.5
0.0
0.5
−0.5
0.0
0.5
−0.5
0.0
0.5
1995 2000 2005 2010 2015
Germany
1995 2000 2005 2010 2015
Greece
1995 2000 2005 2010 2015
Hungary
1995 2000 2005 2010 2015
Ireland
Figure 2 (Continued)
Long-term damage from the Great Recession in OECD countries 153
© 2014 The Author Journal compilation © 2014 Edward Elgar Publishing Ltd
Downloaded from Elgar Online at 05/16/2018 10:59:03PMvia free access

-0.5
0.0
0.5
1995 2000 2005 2010 2015
Italy
-0.5
0.0
0.5
1995 2000 2005 2010 2015
Japan
-0.5
0.0
0.5
1995 2000 2005 2010 2015
Netherlands
-0.5
0.0
0.5
1995 2000 2005 2010 2015
New Zealand
-0.5
0.0
0.5
1995 2000 2005 2010 2015
Poland
-0.5
0.0
0.5
1995 2000 2005 2010 2015
Portugal
-0.5
0.0
0.5
1995 2000 2005 2010 2015
Spain
-0.5
0.0
0.5
1995 2000 2005 2010 2015
Sweden
Figure 2 (Continued)
154 European Journal of Economics and Economic Policies: Intervention, Vol. 11 No. 2
© 2014 The Author Journal compilation © 2014 Edward Elgar Publishing Ltd
Downloaded from Elgar Online at 05/16/2018 10:59:03PMvia free access

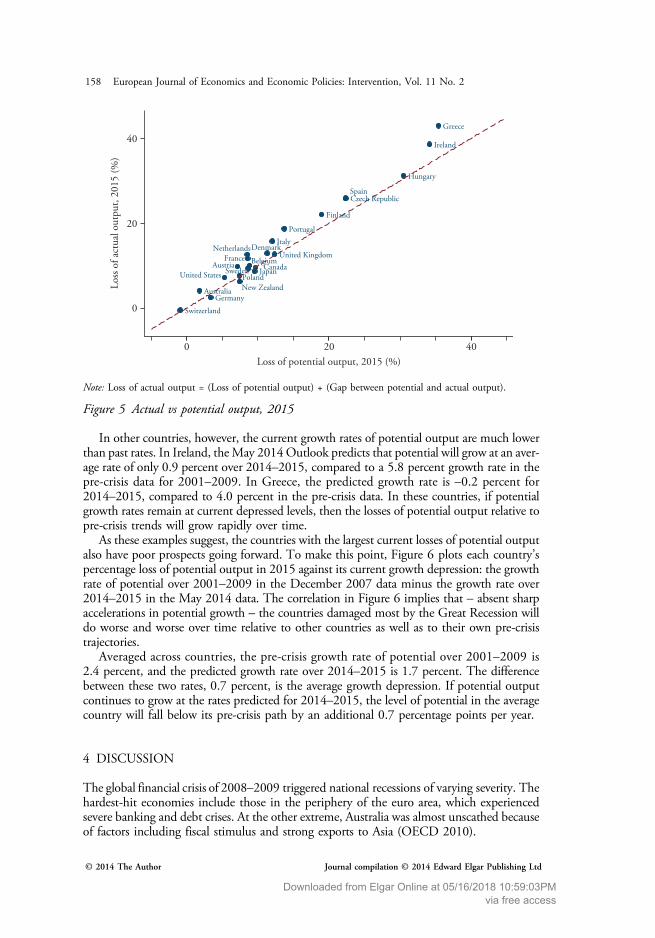
3.2 Actual vs potential output
In most countries, the deviations of potential output from its pre-crisis path are smallerthan the deviations of actual output from the same path, but only by modest amounts.We can see this in Figure 2: for most countries, the line for y* is not far above the linefor y. Figure 5 makes this point by plotting each country’s percentage deviation of Y* fromY** against its deviation of Y from Y**, both in 2015. In this graph, many countries areclose to the 45-degree line.
According to these results, hysteresis has been remarkably strong during the GreatRecession. In many countries, as the recession has pushed actual output below its pre-cri-sis trend, the effect on estimated potential output has been almost one-for-one.
Averaging across the 23 countries, actual output, Y, is 9.74 percent below Y** in 2013.This deviation from the pre-crisis trend is the sum of a 7.18 percent loss of potential out-put and a 2.56 percent gap between the current levels of potential and actual output (bothmeasured as percentages of Y**). In 2015, the deviation of Y from Y** is 9.87 percent,split into an 8.38 percent loss of potential and a 1.49 percent gap between potentialand actual output.
3.3 Prospects for the future
In some countries, potential output has fallen significantly below its pre-crisis path, butthe current growth rate of potential is not far from its old normal. In the United States,for example, the May 2014 OECD Outlook predicts that potential output will grow at anaverage rate of 2.23 percent over 2014–2015; this growth rate is only modestly lower than
-0.5
0.0
0.5
1995 2000 2005 2010 2015
Switzerland
-0.5
0.0
0.5
1995 2000 2005 2010 2015
United Kingdom
-0.5
0.0
0.5
1995 2000 2005 2010 2015
United States
Figure 2 (Continued)
Long-term damage from the Great Recession in OECD countries 155
© 2014 The Author Journal compilation © 2014 Edward Elgar Publishing Ltd
Downloaded from Elgar Online at 05/16/2018 10:59:03PMvia free access
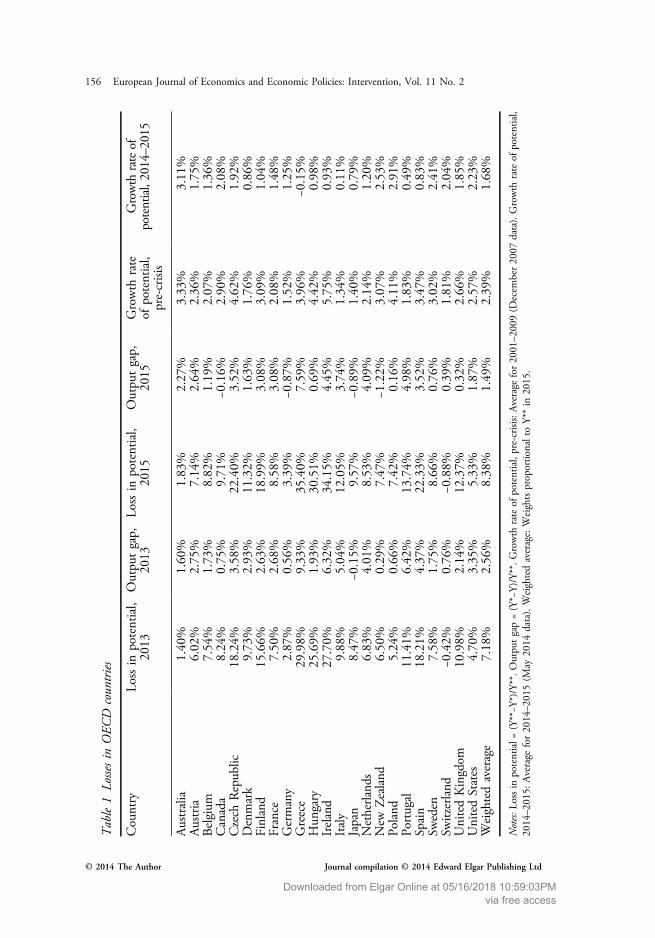
Table1
Lossesin
OEC
Dcountries
Country
Lossin
potential,
2013
Outpu
tgap,
2013
Lossin
potential,
2015
Outpu
tgap,
2015
Growth
rate
ofpotential,
pre-crisis
Growth
rateof
potential,2014–2015
Australia
1.40%
1.60%
1.83%
2.27%
3.33%
3.11%
Austria
6.02%
2.75%
7.14%
2.64%
2.36%
1.75%
Belgium
7.54%
1.73%
8.82%
1.19%
2.07%
1.36%
Canada
8.24%
0.75%
9.71%
−0.16%
2.90%
2.08%
Czech
Repub
lic18.24%
3.58%
22.40%
3.52%
4.62%
1.92%
Denmark
9.73%
2.93%
11.32%
1.63%
1.76%
0.86%
Finland
15.66%
2.63%
18.99%
3.08%
3.09%
1.04%
France
7.50%
2.68%
8.58%
3.08%
2.08%
1.48%
Germany
2.87%
0.56%
3.39%
−0.87%
1.52%
1.25%
Greece
29.98%
9.33%
35.40%
7.59%
3.96%
−0.15%
Hun
gary
25.69%
1.93%
30.51%
0.69%
4.42%
0.98%
Ireland
27.70%
6.32%
34.15%
4.45%
5.75%
0.93%
Italy
9.88%
5.04%
12.05%
3.74%
1.34%
0.11%
Japan
8.47%
−0.15%
9.57%
−0.89%
1.40%
0.79%
Netherland
s6.83%
4.01%
8.53%
4.09%
2.14%
1.20%
New
Zealand
6.50%
0.29%
7.47%
−1.22%
3.07%
2.53%
Poland
5.24%
0.66%
7.42%
0.16%
4.11%
2.91%
Portugal
11.41%
6.42%
13.74%
4.98%
1.83%
0.49%
Spain
18.21%
4.37%
22.33%
3.52%
3.47%
0.83%
Sweden
7.58%
1.75%
8.66%
0.76%
3.02%
2.41%
Switzerland
−0.42%
0.76%
−0.88%
0.39%
1.81%
2.04%
UnitedKingdom
10.98%
2.14%
12.37%
0.32%
2.66%
1.85%
UnitedStates
4.70%
3.35%
5.33%
1.87%
2.57%
2.23%
Weightedaverage
7.18%
2.56%
8.38%
1.49%
2.39%
1.68%
Notes:L
ossin
potential=
(Y**−Y
*)/Y**.O
utpu
tgap=(Y*−Y)/Y**.G
rowth
rateof
potential,pre-crisis:A
verage
for20
01–2009
(Decem
ber2007
data).Growth
rateof
potential,
2014–2015:Average
for2014–20
15(M
ay20
14data).Weightedaverage:Weightsproportio
nalto
Y**
in20
15.
156 European Journal of Economics and Economic Policies: Intervention, Vol. 11 No. 2
© 2014 The Author Journal compilation © 2014 Edward Elgar Publishing Ltd
Downloaded from Elgar Online at 05/16/2018 10:59:03PMvia free access
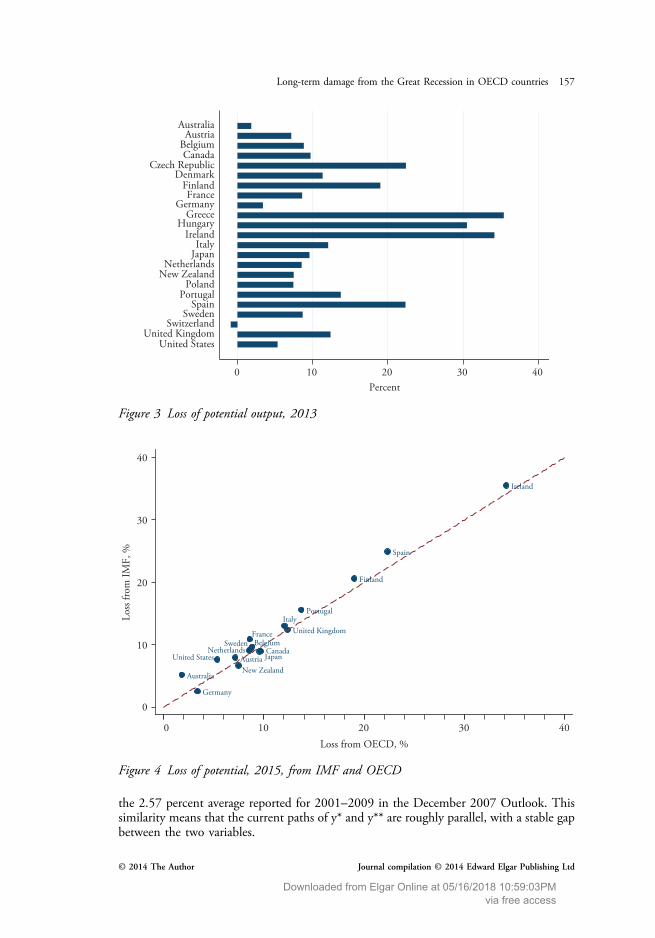
the 2.57 percent average reported for 2001–2009 in the December 2007 Outlook. Thissimilarity means that the current paths of y* and y** are roughly parallel, with a stable gapbetween the two variables.
0 10 20 30 40Percent
United StatesUnited Kingdom
SwitzerlandSweden
SpainPortugal
PolandNew ZealandNetherlands
JapanItaly
IrelandHungary
GreeceGermany
FranceFinland
DenmarkCzech Republic
CanadaBelgiumAustria
Australia
Figure 3 Loss of potential output, 2013
Australia
Austria
BelgiumCanada
Finland
France
Germany
Ireland
Italy
JapanNetherlands
New Zealand
Portugal
Spain
Sweden
United Kingdom
United States
0
10
20
30
40
Loss
from
IMF,
%
0 10 20 30 40Loss from OECD, %
Figure 4 Loss of potential, 2015, from IMF and OECD
Long-term damage from the Great Recession in OECD countries 157
© 2014 The Author Journal compilation © 2014 Edward Elgar Publishing Ltd
Downloaded from Elgar Online at 05/16/2018 10:59:03PMvia free access
In other countries, however, the current growth rates of potential output are much lowerthan past rates. In Ireland, theMay 2014Outlook predicts that potential will grow at an aver-age rate of only 0.9 percent over 2014–2015, compared to a 5.8 percent growth rate in thepre-crisis data for 2001–2009. In Greece, the predicted growth rate is –0.2 percent for2014–2015, compared to 4.0 percent in the pre-crisis data. In these countries, if potentialgrowth rates remain at current depressed levels, then the losses of potential output relative topre-crisis trends will grow rapidly over time.
As these examples suggest, the countries with the largest current losses of potential outputalso have poor prospects going forward. To make this point, Figure 6 plots each country’spercentage loss of potential output in 2015 against its current growth depression: the growthrate of potential over 2001–2009 in the December 2007 data minus the growth rate over2014–2015 in the May 2014 data. The correlation in Figure 6 implies that – absent sharpaccelerations in potential growth – the countries damaged most by the Great Recession willdo worse and worse over time relative to other countries as well as to their own pre-crisistrajectories.
Averaged across countries, the pre-crisis growth rate of potential over 2001–2009 is2.4 percent, and the predicted growth rate over 2014–2015 is 1.7 percent. The differencebetween these two rates, 0.7 percent, is the average growth depression. If potential outputcontinues to grow at the rates predicted for 2014–2015, the level of potential in the averagecountry will fall below its pre-crisis path by an additional 0.7 percentage points per year.
4 DISCUSSION
The global financial crisis of 2008–2009 triggered national recessions of varying severity. Thehardest-hit economies include those in the periphery of the euro area, which experiencedsevere banking and debt crises. At the other extreme, Australia was almost unscathed becauseof factors including fiscal stimulus and strong exports to Asia (OECD 2010).
Australia
Austria BelgiumCanada
Denmark
Finland
France
Germany
Greece
Hungary
Ireland
Italy
Japan
Netherlands
New ZealandPoland
Portugal
Spain
Sweden
Switzerland
United Kingdom
United States
0
20
40
Loss
of a
ctua
l out
put,
2015
(%)
0 20 40Loss of potential output, 2015 (%)
Czech Republic
Note: Loss of actual output = (Loss of potential output) + (Gap between potential and actual output).
Figure 5 Actual vs potential output, 2015
158 European Journal of Economics and Economic Policies: Intervention, Vol. 11 No. 2
© 2014 The Author Journal compilation © 2014 Edward Elgar Publishing Ltd
Downloaded from Elgar Online at 05/16/2018 10:59:03PMvia free access

This paper finds that the recent recessions have had dire effects on economies’ produc-tive capacity, as measured by OECD and IMF estimates of potential output. In mostcountries, the fall in potential relative to its pre-crisis trend has been almost as large asthe fall in actual output. Consequently, the countries with the deepest recessions havealso experienced the greatest long-term damage.
If we aggregate the 23 countries in my sample, the loss of potential output relative to itspre-crisis path is 8.4 percent in 2015. To appreciate the size of this loss, note that Germanyaccounts for 8.2 percent of the aggregate economy. The total damage from the Great Reces-sion is slightly larger than the loss of Germany’s entire economy from global production.
Through what mechanisms do recessions reduce potential output? This question isaddressed for past financial crises by IMF (2009) and for the recent US experience byReifschneider et al. (2013), Hall (2014), and Yang (2014). While the results vary, it appearsthat recessions sharply reduce capital accumulation; have long-term effects on employment(largely through lower labor force participation); and may slow the growth of total factorproductivity. This last effect is poorly understood; one possible factor is a decrease in theformation of businesses with new technologies (Fort et al. 2013; Reifschneider et al.2013). A better understanding of hysteresis mechanisms is a high priority for research.
Another pressing question is whether hysteresis effects are reversible. Some researchers sug-gest that these effects are asymmetric; for example, Reifschneider et al. (2013) assume that arecession causes a persistent fall in labor force participation and rise in unemployment, butstrong output growth does not have the opposite effects. If this view is correct, then macro-economic policymakers cannot repair the long-term damage from the Great Recession.
On the other hand, provided policymakers can somehow create a strong economic expan-sion, hysteresis might work in reverse. Procyclical investment could increase the capital stock;plentiful job opportunities could increase workers’ attachment to the labor force; and so on.My past research (Ball 1999; 2009) suggests that hysteresis in the unemployment rate works
Australia AustriaBelgiumCanada
Czech Republic
Denmark
Finland
FranceGermany
Greece
Hungary
Ireland
Italy
JapanNetherlands
New Zealand
Poland Portugal
Spain
Sweden
Switzerland
United Kingdom
United States0
2
4
6
Gro
wth
dep
ress
ion,
201
4–20
15 (p
erce
ntag
e pt
s)
0 10 20 30 40Loss of potential output, 2015 (%)
Note: Growth depression = (Average growth rate of potential over 2001–2009, from Dec 2007 data) – (Averagegrowth rate of potential over 2014–2015, from May 2014 data).
Figure 6 Lost potential vs current growth depression
Long-term damage from the Great Recession in OECD countries 159
© 2014 The Author Journal compilation © 2014 Edward Elgar Publishing Ltd
Downloaded from Elgar Online at 05/16/2018 10:59:03PMvia free access

in reverse; in the United Kingdom, for example, economic booms in the late 1980s and1990s reduced the natural rate of unemployment. Today, a strong expansion could pushemployment and potential output back toward their pre-crisis paths. Failing that, the expan-sion might at least reverse declines in the growth rate of potential, so the damage from theGreat Recession does not continue to grow.
REFERENCES
Ball, Laurence (1999): Aggregate demand and long-run unemployment, in: Brookings Papers on EconomicActivity, 1999(2), 189–236.
Ball, Laurence (2009): Hysteresis: old and new evidence, in: Fuhrer, Jeff, Kodrzycki, Yolanda K.,Little, Jane Sneddon, Olivei, Giovanni P. (eds), Understanding Inflation and the Implicationsfor Monetary Policy: A Phillips Curve Retrospective, Cambridge, MA: MIT Press, 361–382.
Ball, Laurence, DeLong, Brad, Summers, Larry (2014): Fiscal policy and full employment, FullEmployment Project, Center for Budget and Policy Priorities, April.
Beffy, Pierre-Olivier, Ollivaud, Patrice, Richardson, Pete, Sedillot, Franck (2006): NewOECDmeth-ods for supply-side and medium-term assessments: a capital services approach, OECD EconomicDepartment Working Paper #482, July.
Blanchard, Olivier J., Summers, Lawrence H. (1986): Hysteresis and the European unemploymentproblem, in: NBER Macroeconomics Annual, Cambridge, MA: MIT Press, 15–90.
CBO (Congressional Budget Office) (2014): Revisions to CBO’s projection of potential outputsince 2007, Report, February.
Cerra, Valerie, Saxena, Sweta Chaman (2008): Growth dynamics: the myth of economic recovery,in: American Economic Review, 98(1), 439–457.
Fernald, John (2012): Productivity and potential output before, during, and after the great recession,Federal Reserve Bank of San Francisco Working Paper #2012-18, September.
Fort, Teresa C., Haltiwanger, John, Jarmin, Ron S., Miranda, Javier (2013): How firms respond tobusiness cycles: the role of firm age and firm size, NBER Working Paper #19134, June.
Hall, Robert E. (2014): Quantifying the lasting harm to the U.S. economy from the financial crisis,in: NBER Macroeconomics Annual, Cambridge, MA: MIT Press (forthcoming).
Haltmaier, Jane (2012): Do recessions affect potential output? International Finance DiscussionPaper #1066, Federal Reserve Board, December.
IMF (International Monetary Fund) (2009): What’s the damage? Medium-term output dynamicsafter financial crises, in: World Economic Outlook, Washington, DC: International MonetaryFund, 121–150.
OECD (Organisation for Economic Co-operation and Development) (2010): Economic Survey ofAustralia, Paris: OECD.
Reifschneider, Dave, Wascher, William L., Wilcox, David (2013): Aggregate supply in the UnitedStates: recent developments and implications for the conduct of monetary policy, 14th JacquesPolak Annual Research Conference, Washington, DC, November.
Reinhart, Carmen M., Rogoff, Kenneth S. (2009): The aftermath of financial crises, in: AmericanEconomic Review, 99(2), 466–472.
Reinhart, Carmen M., Rogoff, Kenneth S. (2014): Recovery from financial crises: evidence from100 episodes, in: American Economic Review, 104(5), 50–55.
Summers, Lawrence H. (2014): Speech at the Center for Budget and Policy Priorities Event on FullEmployment, Washington, DC, 2 April.
Yang, David (2014): unpublished analysis at Harvard University.
160 European Journal of Economics and Economic Policies: Intervention, Vol. 11 No. 2
© 2014 The Author Journal compilation © 2014 Edward Elgar Publishing Ltd
Downloaded from Elgar Online at 05/16/2018 10:59:03PMvia free access