Long-term Care Liability Impact and Concerns of the Current Marketplace Michael R. Walton AMWINS...
38
Long-term Care Liability Impact and Concerns of the Current Marketplace Michael R. Walton AMWINS HealthCare American Wholesale Insurance Group March 11, 2003
-
Upload
shona-cooper -
Category
Documents
-
view
218 -
download
2
Transcript of Long-term Care Liability Impact and Concerns of the Current Marketplace Michael R. Walton AMWINS...

Long-term Care Liability Impact and Concerns of the Current Marketplace
Michael R. Walton
AMWINS HealthCareAmerican Wholesale Insurance Group
March 11, 2003

Impact of Current Marketplaceon Long-term Care Providers
Huge premium increases and risk retention requirements have added financial pressures to an industry segment that is already strained financially.
Facilities are “going bare”, self insuring and/or reducing limits of coverage.
Higher premiums and claims costs take money from operations, including quality improvement and risk management activities.
Liability Insurance Availability and Affordability Issues are Severe –Insurance Company Concerns
Historic Underwriting Results Reported Loss and Litigation Trends Aggressiveness of plaintiffs’ attorneys in
soliciting cases Frequent negative press coverage of LTC Extraordinary Jury Awards Political and Public Scrutiny of Eldercare Availability of Government and Proprietary
“Quality” Performance Data/Web Sites/Rankings
Claims Defense Capabilities

Company Concerns -Reported LTC Liability Trends
Trends 1995 – 2001 (FHCA Study) Increased Frequency of Claims (Litigation)
FL 233% > (28/1k beds) - Other 25% (6.7/1k beds)
Increased Severity of Claims FL 210% - Other 140% FL $455,000.Avg. - Other $156,000. Avg.
Multi-million Dollar Jury Awards Numerous and Unpredictable
Loss Cost / Bed in 2000 FL $12,700. - Other States $1,050.
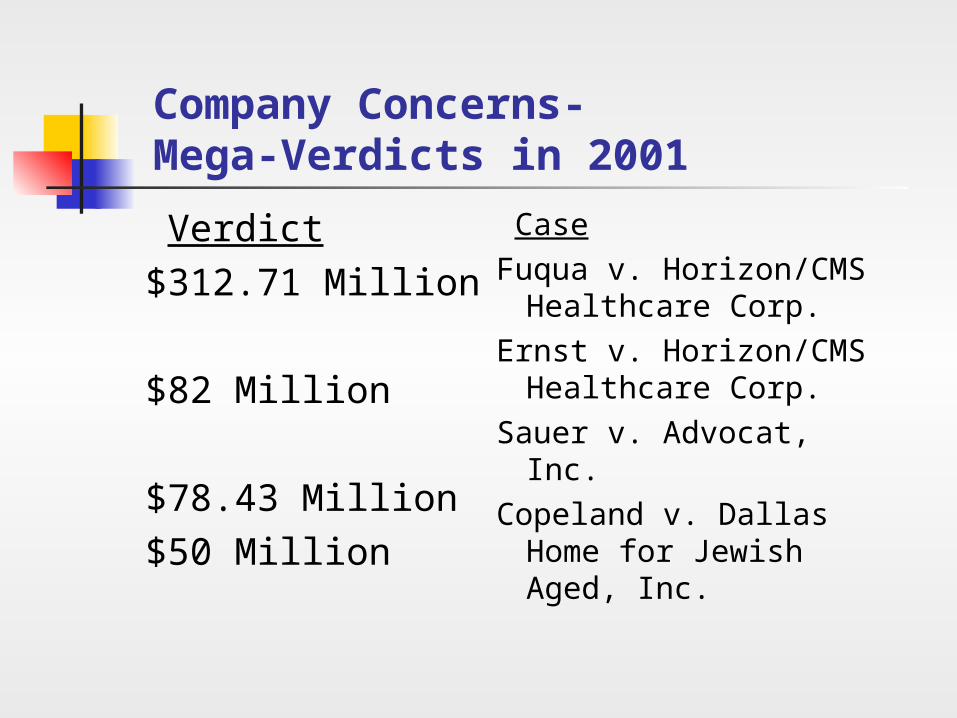
Company Concerns-Mega-Verdicts in 2001
Verdict$312.71 Million
$82 Million
$78.43 Million$50 Million
CaseFuqua v. Horizon/CMS
Healthcare Corp. Ernst v. Horizon/CMS
Healthcare Corp.Sauer v. Advocat, Inc.Copeland v. Dallas
Home for Jewish Aged, Inc.
Insurance Industry Reaction
Data is Data “Broad Brush” Application Require Risk Retention / Deductibles Move from Occurrence to Claims Made Only Insure “The Best” Nursing Facilities Ultra-conservative Underwriting Practices
Examining LTC Liability Insurance Underwriting Procedures
Past “Soft Market” Underwriting Completed Application 5 Years Loss Data Competitive Premium/Coverage
Information Written & Onsite Risk Surveys (Maybe)
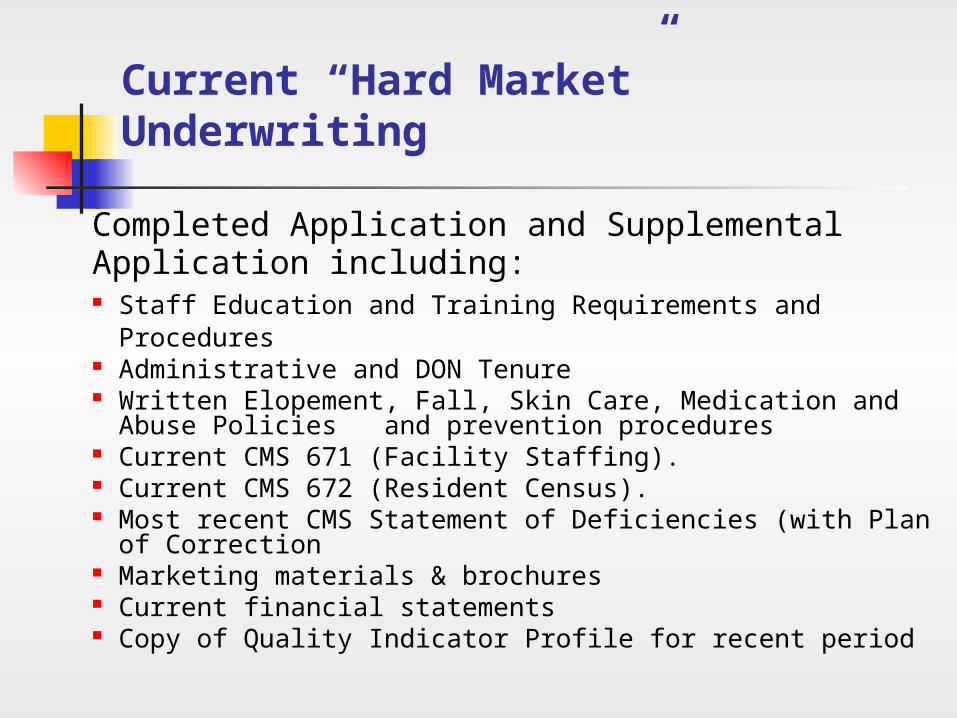
Current “Hard Market” Underwriting
Completed Application and Supplemental Application including: Staff Education and Training Requirements and Procedures Administrative and DON Tenure Written Elopement, Fall, Skin Care, Medication and Abuse
Policies and prevention procedures Current CMS 671 (Facility Staffing). Current CMS 672 (Resident Census). Most recent CMS Statement of Deficiencies (with Plan of
Correction Marketing materials & brochures Current financial statements Copy of Quality Indicator Profile for recent period
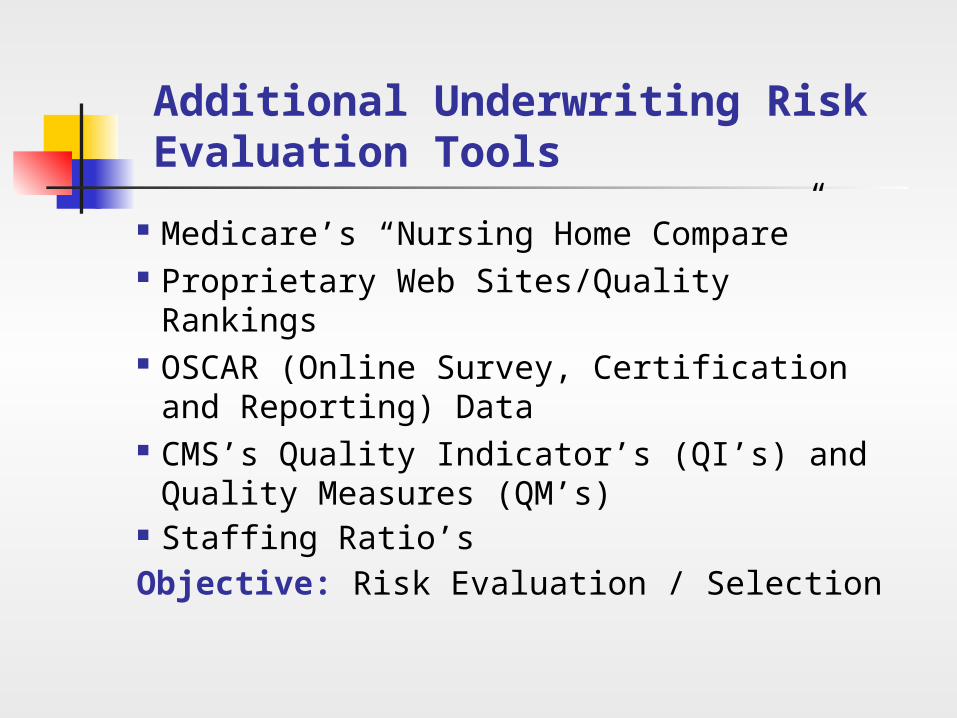
Additional Underwriting Risk Evaluation Tools
Medicare’s “Nursing Home Compare” Proprietary Web Sites/Quality
Rankings OSCAR (Online Survey, Certification
and Reporting) Data CMS’s Quality Indicator’s (QI’s) and
Quality Measures (QM’s) Staffing Ratio’sObjective: Risk Evaluation / Selection
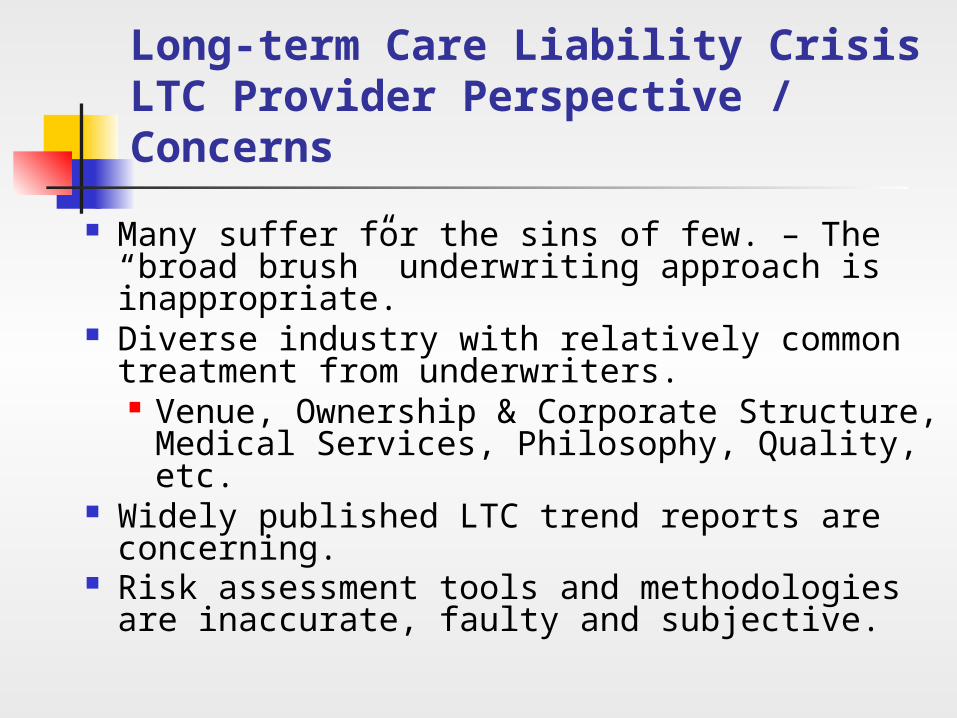
Long-term Care Liability CrisisLTC Provider Perspective / Concerns
Many suffer for the sins of few. – The “broad brush” underwriting approach is inappropriate.
Diverse industry with relatively common treatment from underwriters. Venue, Ownership & Corporate Structure,
Medical Services, Philosophy, Quality, etc. Widely published LTC trend reports are
concerning. Risk assessment tools and methodologies
are inaccurate, faulty and subjective.

The “broad brush” underwriting approach is inappropriate.
Set base rates according to geographical location, facility size, and percentage of more acute residents – minimal or no consideration toward level of quality care or type of ownership.
Common sense suggests that facilities rendering high quality care have lower risk than those rendering poor care – reluctance to commit to estimates of proportional risk.
We are in a “seller’s market”. $$

Widely published LTC liability trend reports are concerning.
Consider the 2001 FHCA Study Approx. 20% of nursing home beds in U.S.
(336,000) of which 33,000 were in FL This study segregated FL, TX & CA from “all
other” States Consider the 2002 AHCA Study
Approx. 25% nursing home beds in U.S. (440,000)
This study segregated GA, WV, TX, FL, CA, AR, MS and AL from “all other” States
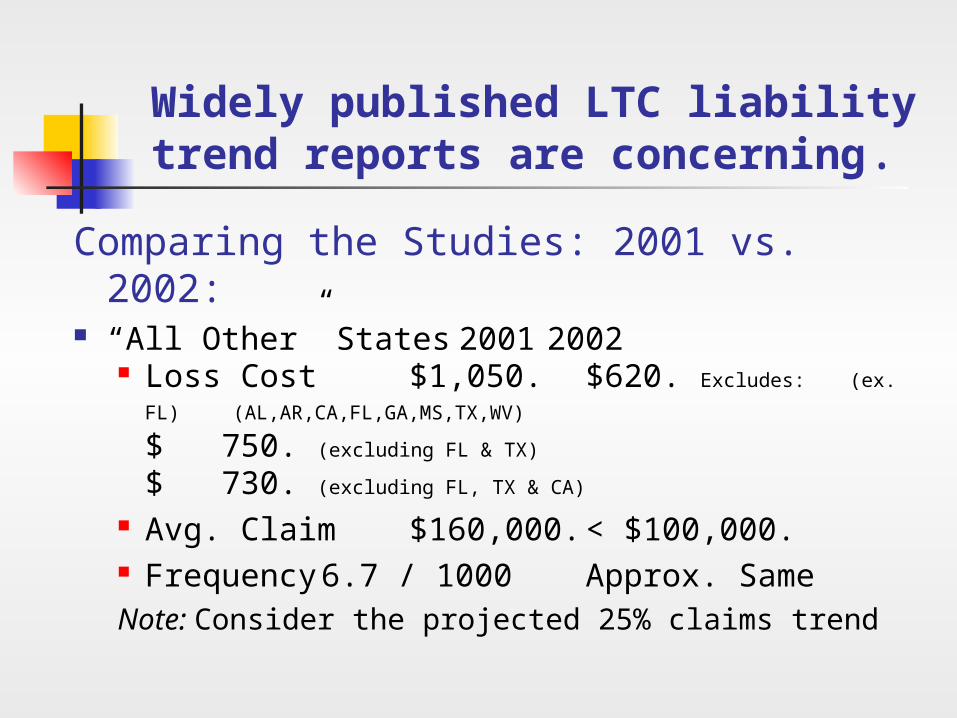
Widely published LTC liability trend reports are concerning.
Comparing the Studies: 2001 vs. 2002: “All Other” States 2001 2002
Loss Cost $1,050. $620. Excludes:
(ex. FL)(AL,AR,CA,FL,GA,MS,TX,WV)
$ 750. (excluding FL & TX)
$ 730. (excluding FL, TX & CA)
Avg. Claim $160,000. < $100,000. Frequency 6.7 / 1000 Approx. SameNote: Consider the projected 25% claims trend

Widely published LTC liability trend reports are concerning.
What segment of the nursing home industry dominated the data used in the studies?
The segregated States: AL – 78% For-profit 63% Multi-facility Ownership AR – 79% For-profit 60% Multi-facility Ownership CA – 75% For-profit 63% Multi-facility Ownership FL – 76% For-profit 70% Multi-facility Ownership GA – 75% For-profit 74% Multi-facility Ownership MS – 73% For-profit 61% Multi-facility Ownership TX – 81% For-profit 72% Multi-facility Ownership
National Average: 65% For-profit 55% Multi-facility Ownership
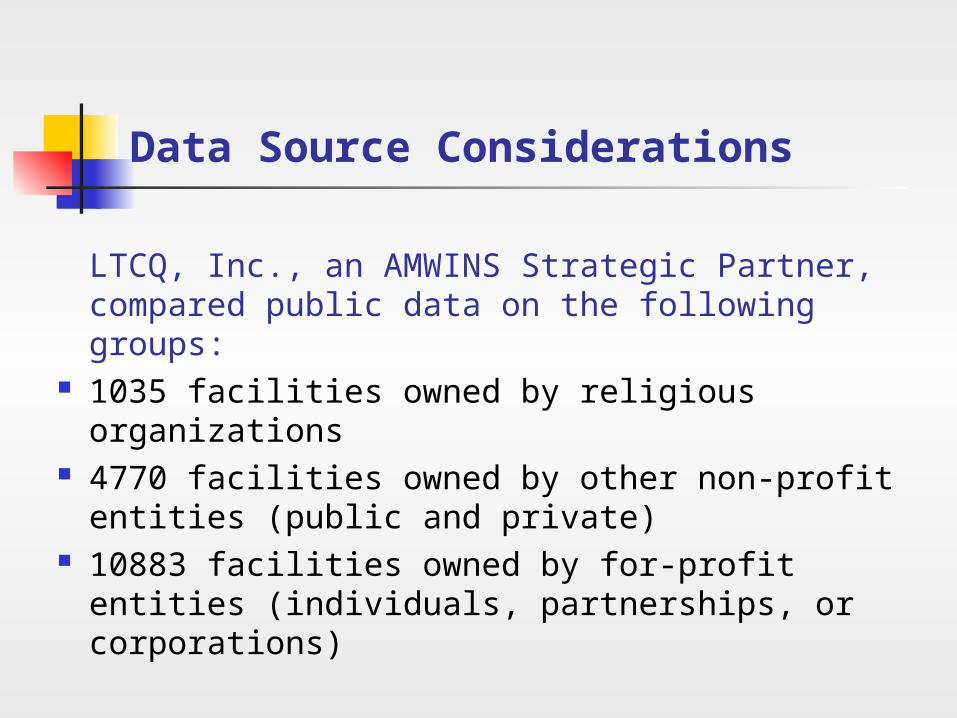
Data Source Considerations
LTCQ, Inc., an AMWINS Strategic Partner, compared public data on the following groups:
1035 facilities owned by religious organizations
4770 facilities owned by other non-profit entities (public and private)
10883 facilities owned by for-profit entities (individuals, partnerships, or corporations)

Consider quality performance by type of ownership - Deficiencies
Severity-Adjusted Deficiency Counts
6.9
2.0
4.7
1.8
4.4
1.7
0
1
2
3
4
5
6
7
8
Health Safety
Ownership
Avera
ge N
um
ber
of
Defi
cie
ncie
s
For Profit Other Non-Profit Religious
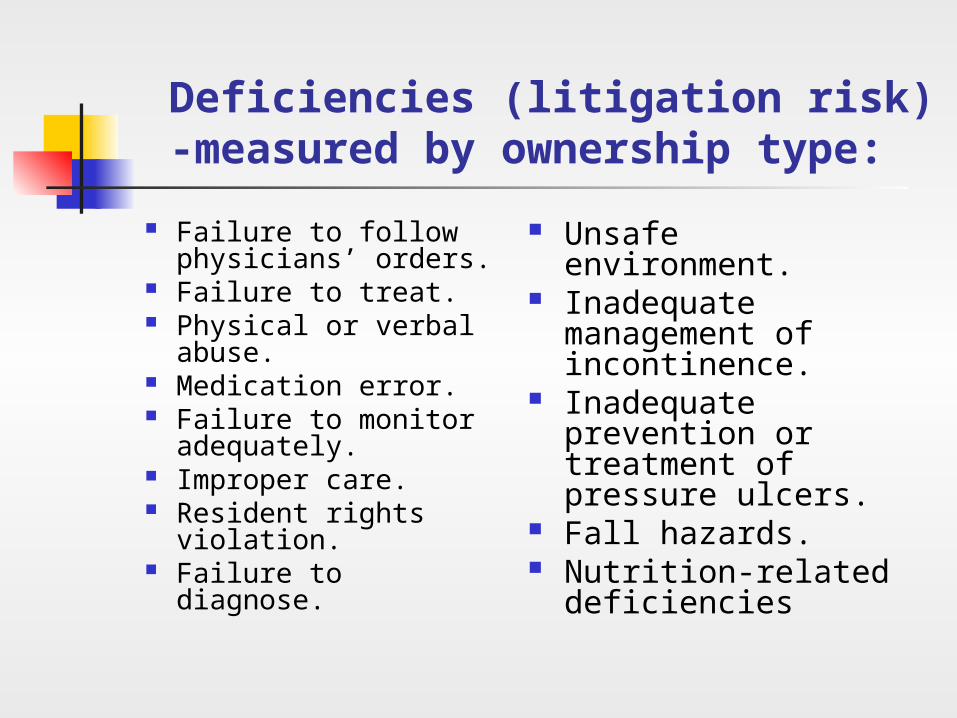
Deficiencies (litigation risk) -measured by ownership type:
Failure to follow physicians’ orders.
Failure to treat. Physical or verbal
abuse. Medication error. Failure to monitor
adequately. Improper care. Resident rights
violation. Failure to diagnose.
Unsafe environment. Inadequate
management of incontinence.
Inadequate prevention or treatment of pressure ulcers.
Fall hazards. Nutrition-related
deficiencies
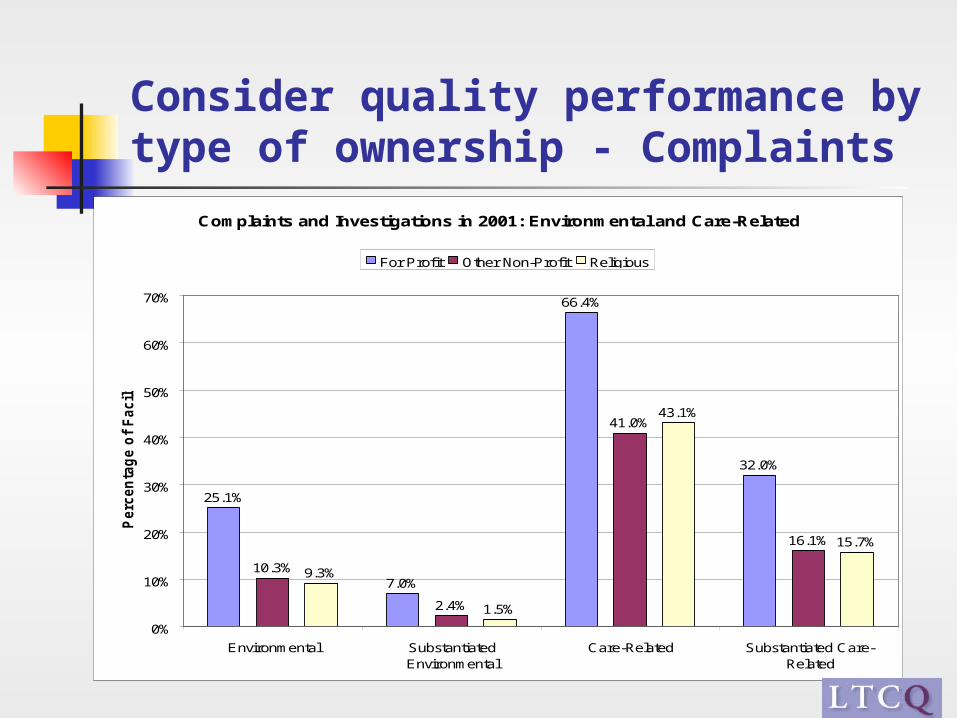
Consider quality performance by type of ownership - Complaints
Complaints and Investigations in 2001: Environmental and Care-Related
25.1%
7.0%
66.4%
32.0%
10.3%
2.4%
41.0%
16.1%
9.3%
1.5%
43.1%
15.7%
0%
10%
20%
30%
40%
50%
60%
70%
Environmental SubstantiatedEnvironmental
Care-Related Substantiated Care-Related
Perc
en
tag
e o
f F
acil
itie
s
For Profit Other Non-Profit Religious
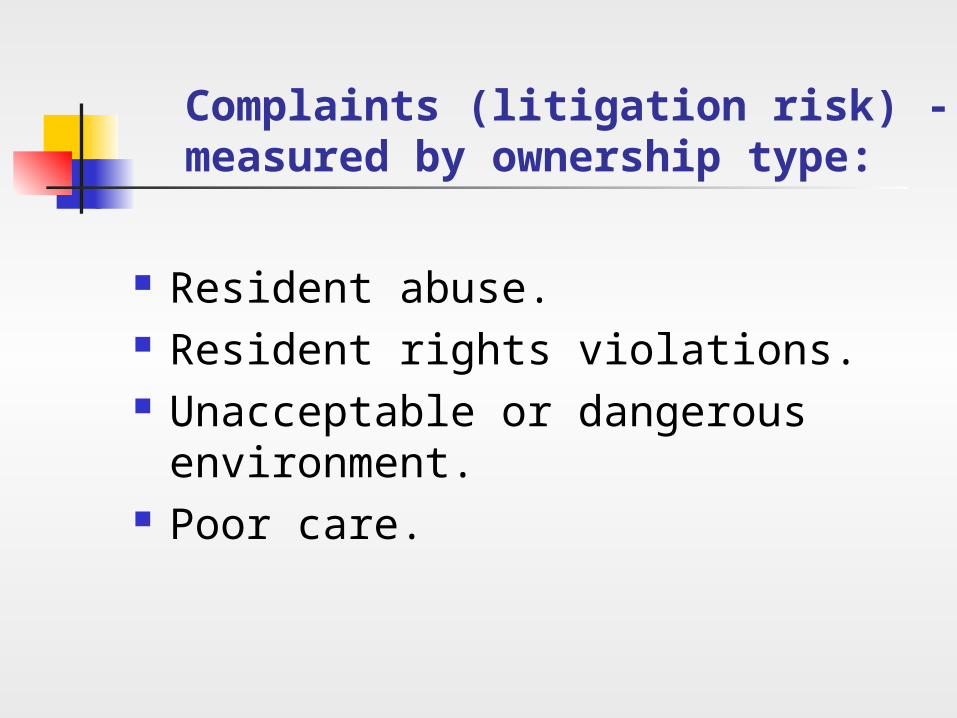
Complaints (litigation risk) -measured by ownership type:
Resident abuse. Resident rights violations. Unacceptable or dangerous
environment. Poor care.
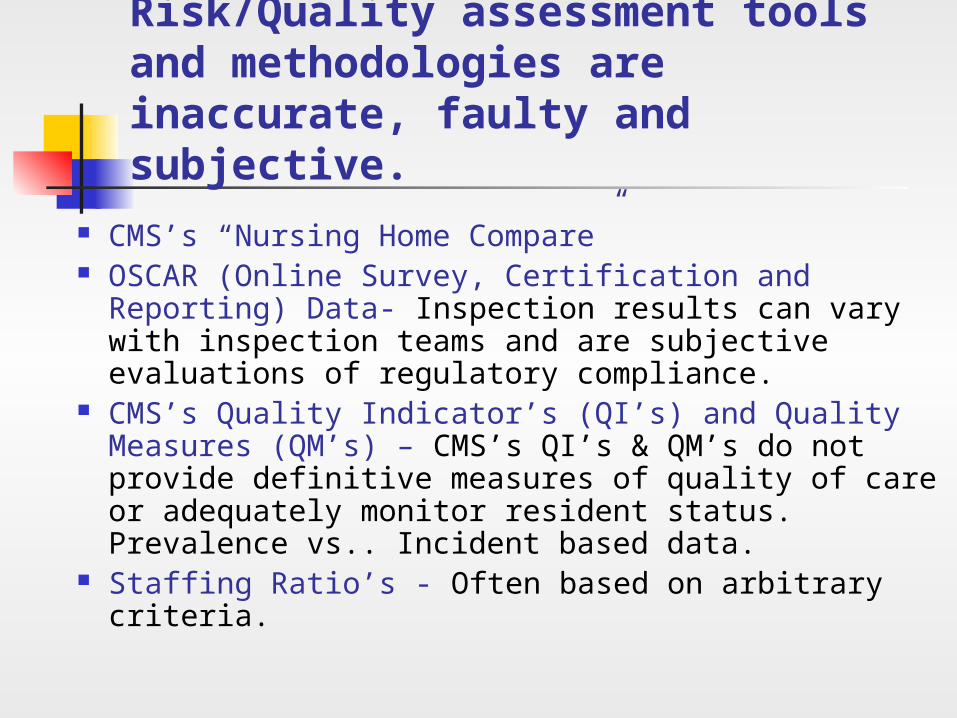
Risk/Quality assessment tools and methodologies are inaccurate, faulty and subjective.
CMS’s “Nursing Home Compare” OSCAR (Online Survey, Certification and
Reporting) Data- Inspection results can vary with inspection teams and are subjective evaluations of regulatory compliance.
CMS’s Quality Indicator’s (QI’s) and Quality Measures (QM’s) – CMS’s QI’s & QM’s do not provide definitive measures of quality of care or adequately monitor resident status. Prevalence vs.. Incident based data.
Staffing Ratio’s - Often based on arbitrary criteria.
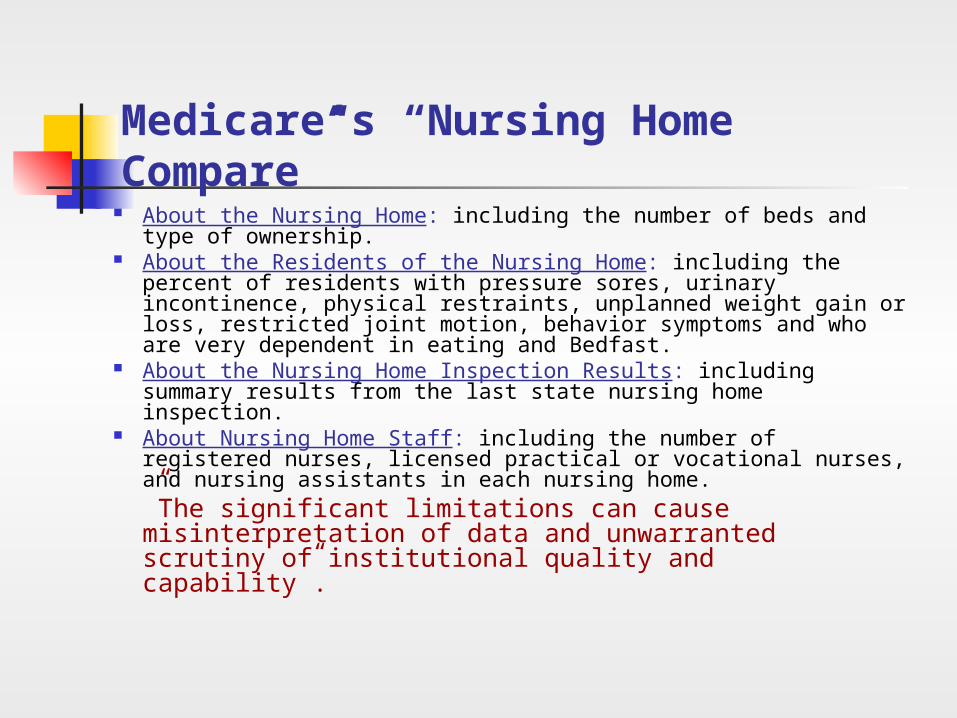
About the Nursing Home: including the number of beds and type of ownership.
About the Residents of the Nursing Home: including the percent of residents with pressure sores, urinary incontinence, physical restraints, unplanned weight gain or loss, restricted joint motion, behavior symptoms and who are very dependent in eating and Bedfast.
About the Nursing Home Inspection Results: including summary results from the last state nursing home inspection.
About Nursing Home Staff: including the number of registered nurses, licensed practical or vocational nurses, and nursing assistants in each nursing home. ”The significant limitations can cause misinterpretation of data and unwarranted scrutiny of institutional quality and capability”.
Medicare’s “Nursing Home Compare”


Concerns with OSCAR (Online Survey, Certification and Reporting) Data
Data Accuracy Size Bias Geographic Bias Ownership Bias Payer Bias Case Mix Bias
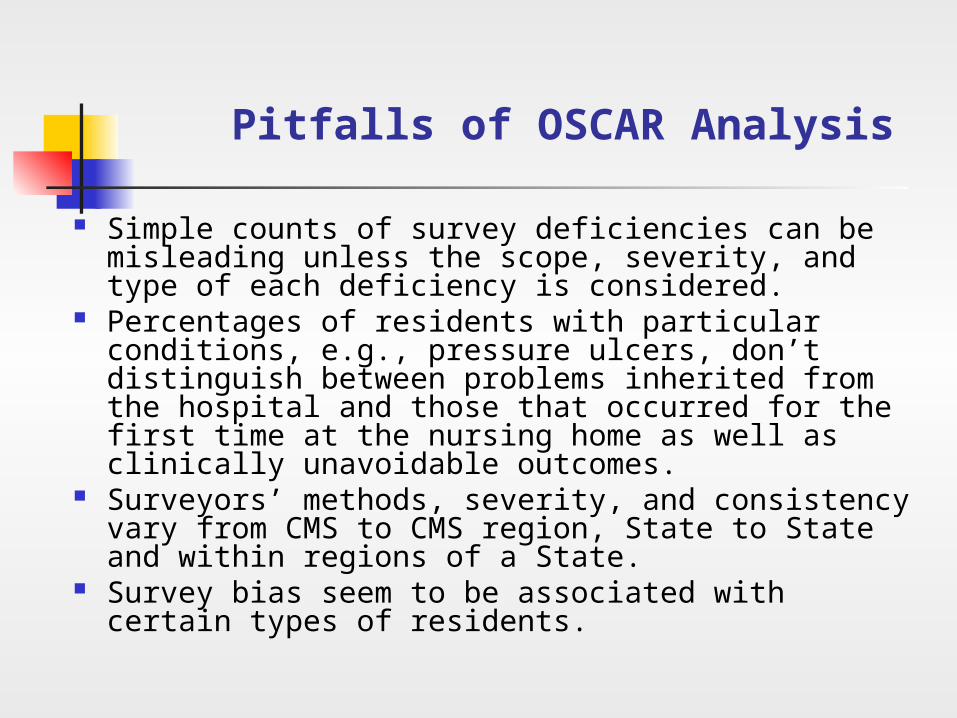
Pitfalls of OSCAR Analysis
Simple counts of survey deficiencies can be misleading unless the scope, severity, and type of each deficiency is considered.
Percentages of residents with particular conditions, e.g., pressure ulcers, don’t distinguish between problems inherited from the hospital and those that occurred for the first time at the nursing home as well as clinically unavoidable outcomes.
Surveyors’ methods, severity, and consistency vary from CMS to CMS region, State to State and within regions of a State.
Survey bias seem to be associated with certain types of residents.

Concerns with OSCAR data: Accuracy
In a recent analysis of 16,698 OSCAR assessments: 6% of facilities report total census numbers not
equal the total number of residents calculated from other OSCAR items.
One item inquires how many residents with pressure ulcers at survey also had pressure ulcers at admission. 7% of facilities reported a greater number of residents than logically possible.
10% of facilities had unlikely ADL dependency relationships (where eating > dressing)
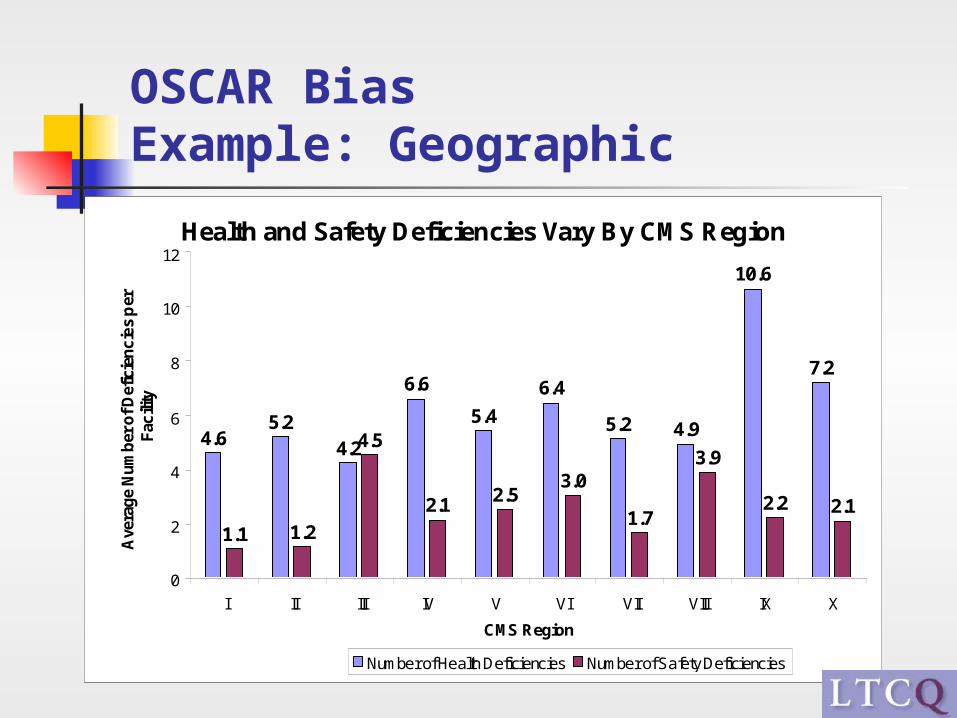
OSCAR Bias Example: Geographic
Health and Safety Deficiencies Vary By CMS Region
4.65.2
4.2
6.6
5.4
6.4
5.2 4.9
10.6
7.2
1.1 1.2
4.5
2.1 2.53.0
1.7
3.9
2.2 2.1
0
2
4
6
8
10
12
I II III IV V VI VII VIII IX X
CMS Region
Ave
rag
e N
um
ber
of
Def
icie
nc
ies
per
F
acili
ty
Number of Health Deficiencies Number of Safety Deficiencies
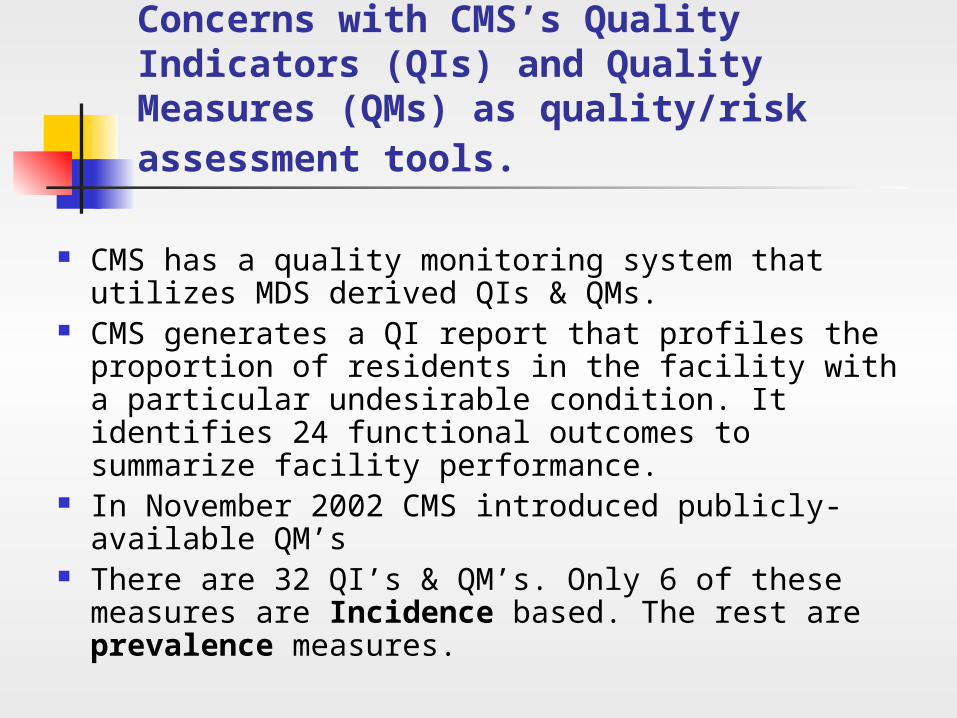
Concerns with CMS’s Quality Indicators (QIs) and Quality Measures (QMs) as quality/risk assessment tools.
CMS has a quality monitoring system that utilizes MDS derived QIs & QMs.
CMS generates a QI report that profiles the proportion of residents in the facility with a particular undesirable condition. It identifies 24 functional outcomes to summarize facility performance.
In November 2002 CMS introduced publicly-available QM’s
There are 32 QI’s & QM’s. Only 6 of these measures are Incidence based. The rest are prevalence measures.

Prevalence and Incidence Measurements
Prevalence:How you look at one point in time. The status of your residents according to one data point (MDS assessment).
Incidence:How you look at one point in time compared to previous point in time. The status of your residents according to two data points (MDS assessment).
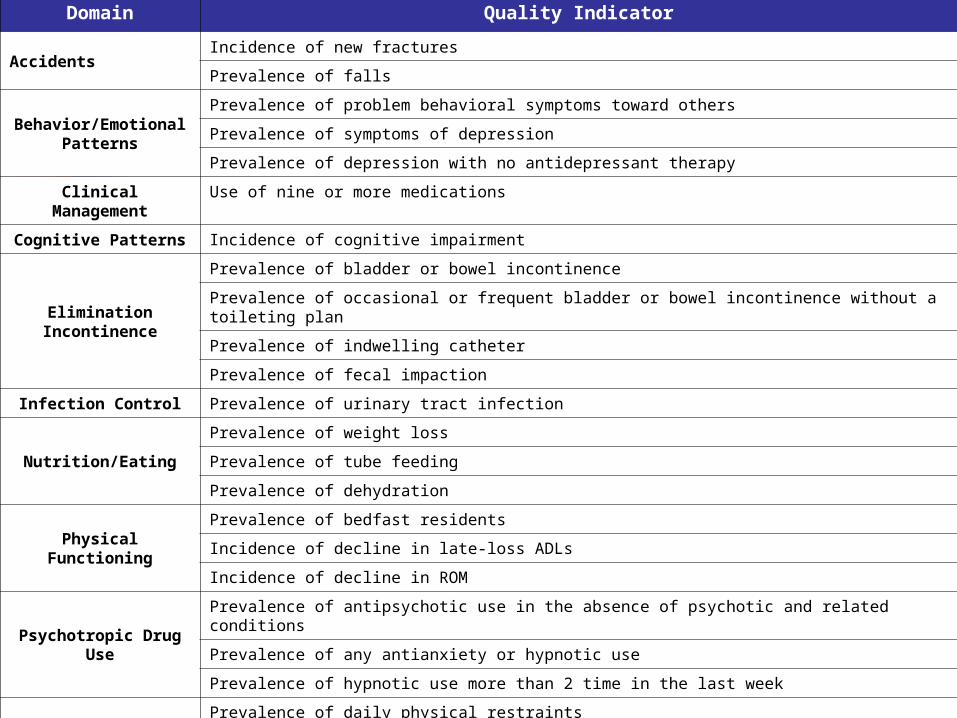
Domain Quality Indicator
AccidentsIncidence of new fractures
Prevalence of falls
Behavior/Emotional Patterns
Prevalence of problem behavioral symptoms toward others
Prevalence of symptoms of depression
Prevalence of depression with no antidepressant therapy
Clinical Management Use of nine or more medications
Cognitive Patterns Incidence of cognitive impairment
EliminationIncontinence
Prevalence of bladder or bowel incontinence
Prevalence of occasional or frequent bladder or bowel incontinence without a toileting plan
Prevalence of indwelling catheter
Prevalence of fecal impaction
Infection Control Prevalence of urinary tract infection
Nutrition/Eating
Prevalence of weight loss
Prevalence of tube feeding
Prevalence of dehydration
Physical Functioning
Prevalence of bedfast residents
Incidence of decline in late-loss ADLs
Incidence of decline in ROM
Psychotropic Drug Use
Prevalence of antipsychotic use in the absence of psychotic and related conditions
Prevalence of any antianxiety or hypnotic use
Prevalence of hypnotic use more than 2 time in the last week
Quality of LifePrevalence of daily physical restraints
Prevalence of little or no activity
Skin Care Prevalence of stage 1-4 pressure ulcers
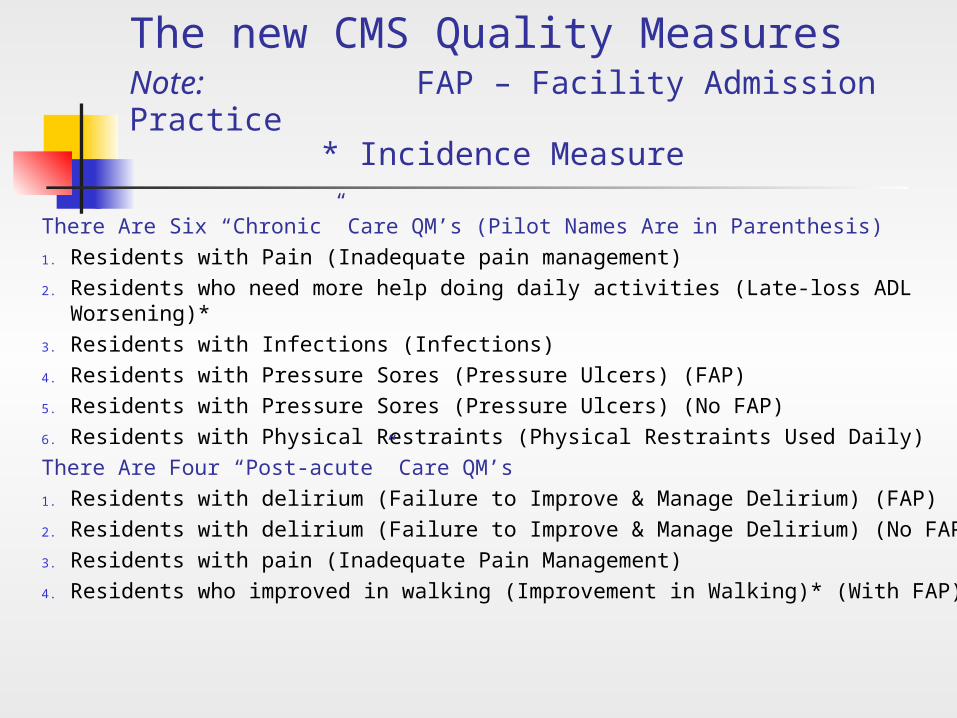
The new CMS Quality MeasuresNote: FAP – Facility Admission Practice
* Incidence Measure
There Are Six “Chronic” Care QM’s (Pilot Names Are in Parenthesis)1. Residents with Pain (Inadequate pain management)2. Residents who need more help doing daily activities (Late-loss ADL
Worsening)*3. Residents with Infections (Infections)4. Residents with Pressure Sores (Pressure Ulcers) (FAP)5. Residents with Pressure Sores (Pressure Ulcers) (No FAP)6. Residents with Physical Restraints (Physical Restraints Used Daily)There Are Four “Post-acute” Care QM’s1. Residents with delirium (Failure to Improve & Manage Delirium) (FAP)2. Residents with delirium (Failure to Improve & Manage Delirium) (No FAP)3. Residents with pain (Inadequate Pain Management)4. Residents who improved in walking (Improvement in Walking)* (With FAP)

How good is the Data?MDS Data Quality
Reliability and validity studies Reliability in the workforce
Lack of training Facility staff turnover Usability of the MDS Surveyor training
MDS data integrity
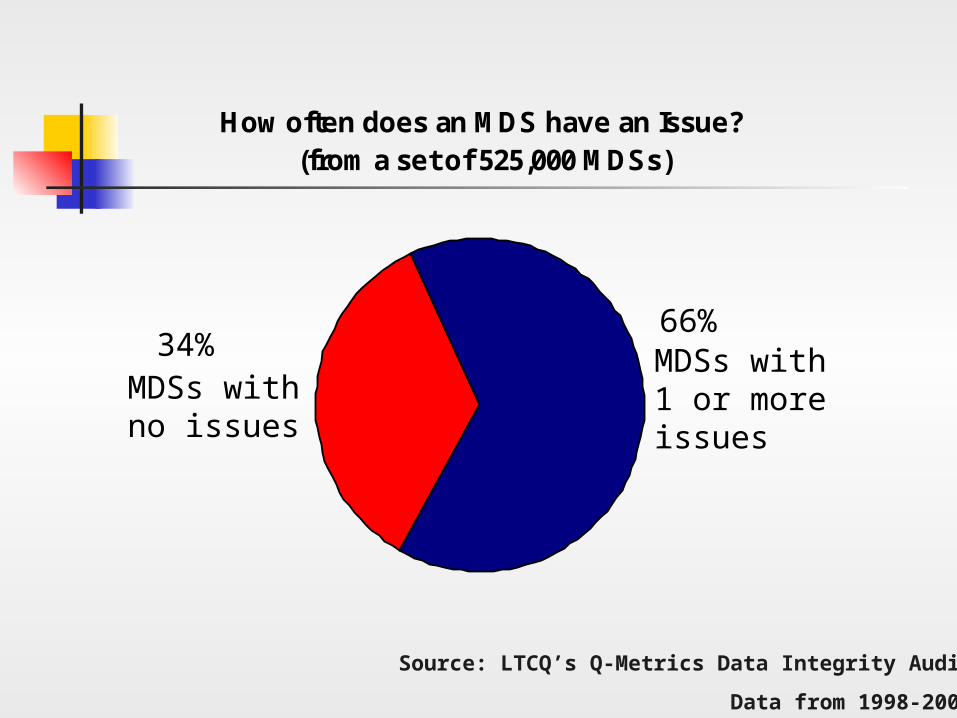
How often does an MDS have an Issue?(from a set of 525,000 MDSs)
MDSs withno issues
MDSs with1 or moreissues
34%66%
Source: LTCQ’s Q-Metrics Data Integrity Audit
Data from 1998-2000

Consideration
The combination of standardization, electronic transmission, and compulsory submission makes the MDS the most advanced electronic medical record in all of American health care.
Data accuracy, interpretation and application is critical to its value.

Are there better ways to measure quality and risk? Yes: OSCAR analysis can be improved
by using geographical adjustment, severity-adjustment, focus on litigation risks, and other methods.
Yes: MDS data quality can be improved with staff training, use of auditing tools and feedback to facilities.
Yes: Quality can be measured with valid, incidence-based risk-adjusted tools.
Yes: The risk of many adverse events can be modeled if good data are available on risk factors.
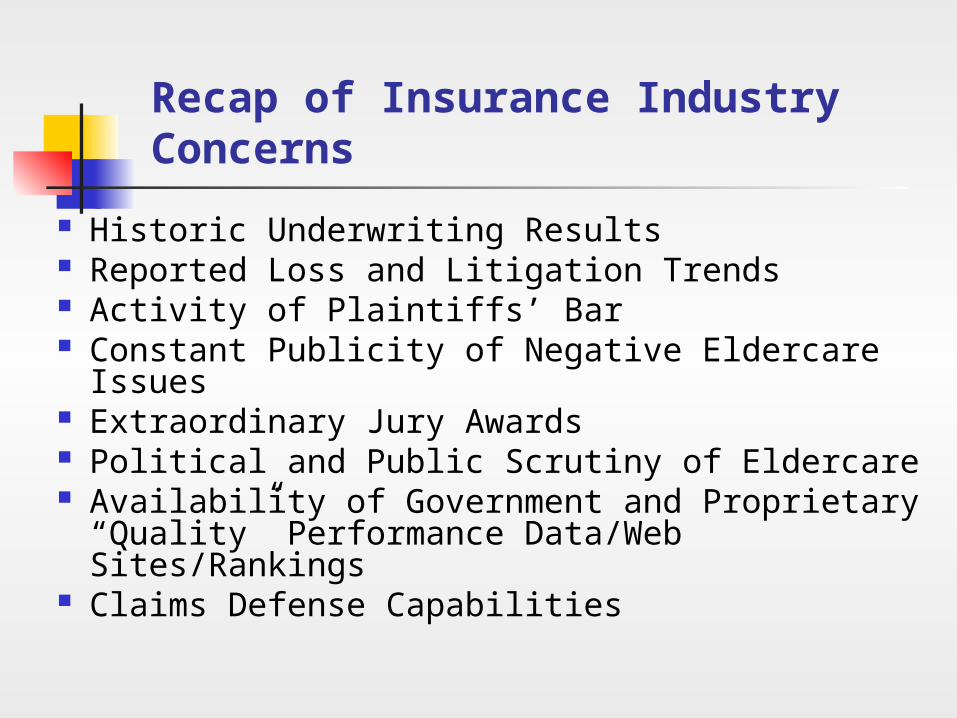
Recap of Insurance Industry Concerns
Historic Underwriting Results Reported Loss and Litigation Trends Activity of Plaintiffs’ Bar Constant Publicity of Negative Eldercare Issues Extraordinary Jury Awards Political and Public Scrutiny of Eldercare Availability of Government and Proprietary
“Quality” Performance Data/Web Sites/Rankings
Claims Defense Capabilities
Are there Solutions? Opportunities?
Absolutely!Utilize advanced methods of assessing, managing, and defending long-term care quality and associated risk.
Long-term Care Providers / Clinicians Insurance Providers Defense Council Risk Managers Insurance Brokers and Consultants Consumers