Long-Term Care in Motion: 2007 Annual Report of Wisconsin ... · 2007 Annual Report of...
72
Long-Term Care in Motion: 2007 Annual Report of Wisconsin’s Managed Long-Term Care Programs STATE OF WISCONSIN C H O I C E ACCESS COST-EFFECTIVE QUALITY
Transcript of Long-Term Care in Motion: 2007 Annual Report of Wisconsin ... · 2007 Annual Report of...

Long-Term Care in Motion: 2007 Annual Report of Wisconsin’s Managed Long-Term Care Programs
STATE OF WISCONSIN
CHOICE
ACCESS
COST-EFFECTIVE
QUALITY
2
Table of Contents
Executive Summary.............................................................................................................4-5 Introduction..........................................................................................................................6-7
Figure 1: Managed Long-term Care Service Areas, 2007 .................................................... 8 Services Provided by the Family Care Programs .................................................................. 9 Figure 2: Explanation of Benefit Packages of the Three Programs ....................................... 10 Expansion of Family Care ..................................................................................................... 11 Table 1: Number of Members in 2007 by County .................................................................. 11 Figure 3: Managed Long-Term Care Implementation, 2008................................................. 12
2007 Highlights....................................................................................................................13 Section 1: Member Profile ...................................................................................................14
Figure 4: Total Active Members by Target Group................................................................. 14 Table 2: Members Active on December 31, 2007, by Target Group..................................... 15 Table 3: Members Active on December 31, 2007, by Age Group......................................... 15 Figure 5: Members by Age Range........................................................................................ 15 Member Profile: Current Living Arrangements ...................................................................... 16 Figure 6: Living Arrangement for all Members Active on December 31, 2007...................... 16 Member Story: Earl and Alyce’s Story from Community Health Partnership (CHP) .............. 17 Member Profile: Health Status............................................................................................... 18 Figure 7: Multiple Health Diagnoses among Members Active on December 31, 2007 ......... 18 Table 4: Most Common Health Diagnoses for Members on December 31, 2007 ................. 19 Member Profile: Employment Status ..................................................................................... 20 Figure 8: Employment Status of Members Active on December 31, 2007 ........................... 20 Member Story: “Bob’s Story” from La Crosse County Care Management Organization........ 20
Section 2: Services Provided...............................................................................................21 Table 5: Number of Members who Received Care Management Services during 2007
by MCO.................................................................................................................... 21 Figure 9: Members who Received Care Management by Target Group during 2007........... 22 Member Story: Desiree’s Story from Community Health Partnership .................................... 23 Table 6a: Top services Provided to Family Care Members during 2007 .............................. 25 Table 6b: Top services Provided to Family Care Partnership Members during 2007 ............ 25 Living Situations .................................................................................................................... 26 Table 7: Use of Purchased Residential Services during 2007............................................... 26 Table 8: Nursing Home Stays of 90 days or Longer for Members with Low Care Needs ...... 26 Coordination of Health Services and Long-Term Care .......................................................... 27 Use of Informal Supports....................................................................................................... 28 Table 9: Use of Informal Supports with Members who Have at Least One ADL
during 2007 ............................................................................................................. 28 Table 10: Use of Informal Supports with Members who Have at Least one IADL
during 2007 ........................................................................................................... 29 Self-Direction of Services within Family Care Programs ....................................................... 30 Member Story: “Barbara’s Story” from Community Care, Inc. ............................................... 31
3
Section 3: Results................................................................................................................32 Figure 10: Personal Experience Outcomes of Wisconsin’s Long-Term Care Programs....... 32 Indicators Related to Health Status ....................................................................................... 33 Table 11: Preventable ER visits ............................................................................................ 33 Table 12: Preventable Hospital Admissions .......................................................................... 33 Table 13: Proportion of Members with Current Immunizations.............................................. 34 Figure 11: Percent of Family Care Partnership Members Who Had a Flu Immunization
during 2007 .................................................................................................................. 35 Member Story: Char’s Story from Community Care of Central Wisconsin............................. 35 Indicators Related to Functional Status ................................................................................. 36 Table 14: One-Year Changes in Need for Assistance with Activities of Daily Living by
Target Group and Program ........................................................................................... 36 Table 15: One-year changes in Need for Assistance with Instrumental Activities of Daily
Living by Target Group and Program........................................................................... 37 Desired Living Arrangements ................................................................................................ 38 Table 16: Percent of Members by Current and Preferred Living Situation on
December 31, 2007 ..................................................................................................... 38 Changes in Members’ Employment Status............................................................................ 39 Table 17: Changes for Employed Status of Family Care Program Members during 2007 .... 39 Members’ Satisfaction ........................................................................................................... 40 Satisfaction Surveys.............................................................................................................. 40 Disenrollment for Reasons Other than Death or Loss of Eligibility ........................................ 41 Table 18: Members who Left the Program during 2007 ........................................................ 41
Appendix 1— Footnotes, Information on Data Used in Report, and Sources of Additional Information ..................................................................................42 Appendix 2 —Focus on the Frail Elder Target Group..........................................................44 Appendix 3—Focus on the Developmental Disabilities Target Group.................................51 Appendix 4—Focus on the Physical Disabilities Target Group ...........................................57 Appendix 5—Additional Data on Members with Mental Health/Substance Abuse Issues ..65 List of Current Family Care, Partnership and PACE Managed Care Organizations ..........71
4
Executive Summary
Welcome to the first annual report to the public on the managed long-term care programs in Wisconsin. We are eager for you to read this report and learn how Family Care Programs are providing long-term care options to Wisconsin’s frail elders and residents with developmental and physical disabilities. The programs described in this annual report — Family Care, Family Care Partnership and PACE — provide care management and other Medicaid-funded in-home and residential long-term care services to adults with physical or developmental disabilities and to frail elders, along with some additional Medicaid-funded health care services. The Family Care Partnership and the PACE programs also provide Medicare-funded health care and long-term care services to their members. Wisconsin has long been recognized as a national leader in developing flexible and creative community supports for older persons and persons with disabilities. With the extensive involvement of citizens with physical disabilities, developmental disabilities or those who are elderly and their representatives, the Wisconsin Department of Health Services developed a long-term care system that was piloted and demon-strated by county and private agency Managed Care Organizations (MCOs) in a limited number of Wis-consin counties in the late 1990’s. The Family Care programs were developed with four specific goals:
• Provide people with improved options from which to choose where they live and what kinds of services and supports they receive to meet their needs;
• Improve access to services • Improve quality through a focus on health and social outcomes and • Create a cost-effective system for the future.
2007 was the first year for Family Care expansion. The expansion goal is to have the Family Care pro-grams available to every eligible resident of the state. This annual report focuses on the activities and the quality care that the members of the managed long-term care programs are receiving. This report includes:
• Description of the programs’ current population (members active on December 31, 2007); • Details on the types and amounts of services delivered to Family Care members between Janu-
ary 1, 2007 and December 31, 2007; and • Review of some of the key results for members during one year in Family Care.
During the development of Family Care, one of the most frequently repeated comments from advocates and people with physical disabilities, developmental disabilities or those who are elderly was that people wanted to remain in their own home as long as possible. This is consistent with current public policy that with proper supports, frail elders, people with developmental disabilities and people with physical dis-abilities can live in their own homes and experience an improved quality of life. The Family Care Pro-grams have focused on providing services that enable people to remain in their own homes and allows people who are hospitalized or in a nursing home to return home more quickly. This is accomplished by the interdisciplinary team following the member wherever they are being served. The report will provide data on how the Family Care programs have provided members with improved options from which to choose where to live. The data in the reports highlights that the majority of the Family Care programs’ members prefer to live in their homes and 97% of the members who are currently living in their homes, list their home as their preferred living setting. Across the Family Care programs, 82% of the members are living in their preferred living setting.
5
The report also highlights that the members in the Family Care programs have more access to visit their primary care physicians, allowing for prevention and early intervention health care services to be pro-vided. Providing preventable and early intervention health care services reduces the amount of high-cost preventable emergency room visits. The available data from the Family Care programs reports that only a small percent of members went to the emergency room or were admitted into a hospital for a preventable condition for which good outpatient care can potentially prevent the need for hospitalization, or for which early intervention can prevent complications or more severe disease. Along with descriptions of the programs’ members, services and results, this report includes stories and quotes from actual members. The MCOs that administer Family Care programs contributed stories about their members, and the members themselves provided comments in satisfaction surveys. These stories and quotes are real, and show how Family Care programs are improving member’s lives. The 2007 year was a successful one on many levels but most importantly staff from the Department of Health Services and the Managed Care Organizations worked together to provide quality managed long-term care programs to over 13,000 members. We expect to release the annual report describing 2008 activities and accomplishments in Spring 2009, and annually thereafter. We believe these annual reports will provide Family Care stakeholders with the information they need to remain informed participants in helping to pursue the important missions of these programs.
6
The three managed-care programs included in this report—Family Care, Family Care Partnership and PACE (Program for All-Inclusive Care for the Elderly)—focus on achieving four specific goals:
Provide people with improved options from which to choose where they live and what kinds of services and supports they receive to meet their needs;
Improve access to services; Improve quality through a focus on health and social outcomes; and Create a cost-effective system for the future.
The Family Care programs serve members who meet the nursing home level of care. This means that a member’s health care needs usually require nursing home placement, although the majority of the mem-bers were not admitted into a nursing home during 2007. Members must be eligible for Medicaid and meet one or more of Family Care’s target groups. The three target groups are:
Frail Elderly (65 years or older, except in Milwaukee County1) Adults with Physical Disabilities (18 or older) Adults with Developmental Disabilities (18 or older)
In the body of this report, most tables present information for the programs’ membership as a whole. In-formation targeted specifically on each of the three target groups is included in appendices. While the Family Care programs are not designed as mental health or substance abuse treatment programs, and indi-viduals are not eligible for the program if they do not meet statutory criteria for one of the three target groups above, a final appendix focuses on those members who also have mental health and substance abuse issues. A short history of long-term care options in Wisconsin Wisconsin began innovating with long-term care options in 1981, with the inception of the Community Options Program. Over the next decade, the Department created additional fee-for-service home- and community-based services programs for frail elders and adults with disabilities. This decade also saw the development of the first managed-care program of long-term care services, the Program of All Inclusive Care for the Elderly (PACE), which served frail elders in Milwaukee County. In the early 1990’s, the De-partment worked with the University of Wisconsin and other leaders in the state’s disability community to develop a demonstration program to explore the possibilities of integrating the delivery of Medicaid- and Medicare-funded long-term care and medical care for frail elders and adults with physical disabilities. This program ‘Partnership,’ began operations in 1995, and operated at four sites.
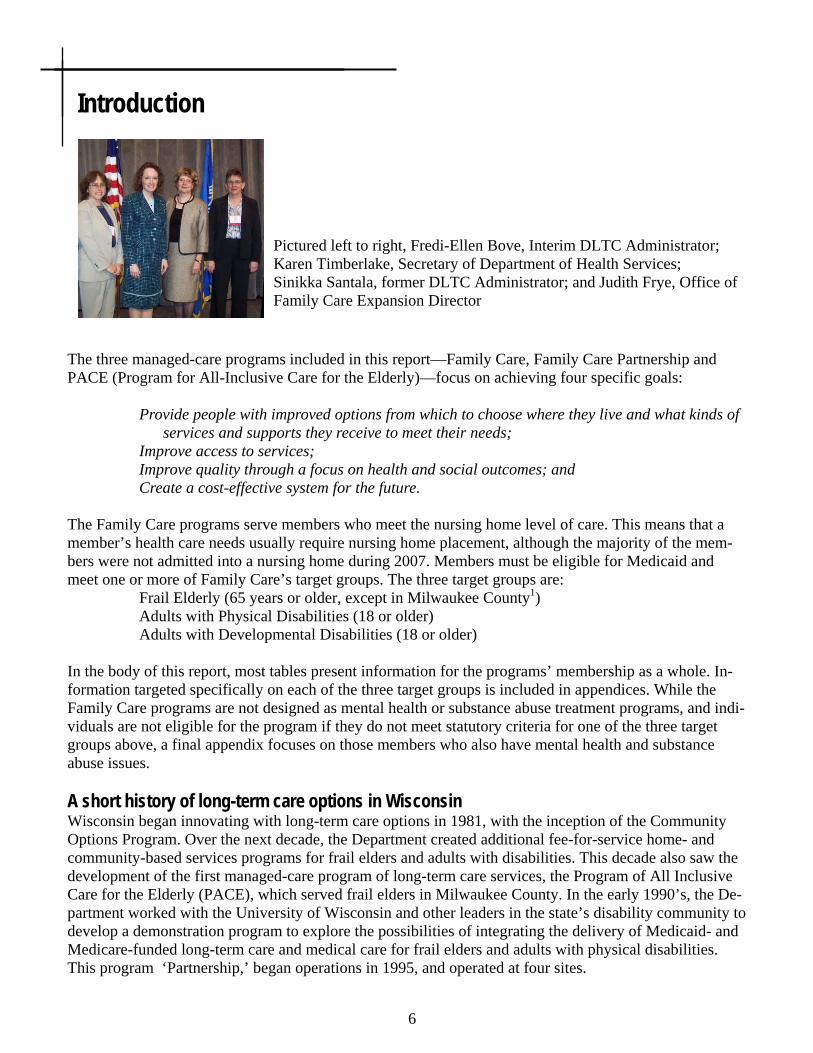
Introduction
Pictured left to right, Fredi-Ellen Bove, Interim DLTC Administrator; Karen Timberlake, Secretary of Department of Health Services; Sinikka Santala, former DLTC Administrator; and Judith Frye, Office of Family Care Expansion Director

7
Still, by the early 1990’s, Wisconsin was spending 50% more than the national average for each Medi-caid-eligible elderly person. Access, choice and quality in the home and community-based services were not consistent from county to county, for both elders and adults with disabilities. Entitlement to nursing-facility care and long waiting lists for community care kept many eligible people inside nursing facilities or waiting with their families with inadequate care. When individuals did obtain services, the choice of services was often dictated by a confusing and intimi-dating system of public programs. More than 40 public programs provide funding for long-term care, each with a different set of eligibility criteria and covered services. Responsibility and authority for the evalua-tion, delivery and payment of long-term care services was fragmented—resulting in inconsistency, some-times-conflicting rules, and incentives for cost shifting. Decisions on whether to authorize individual ser-vices for individual people were often reviewed, or even made, at the state level rather than close to con-sumers. To address access and information issues, the Long-Term Care Redesign Task Force in 1998 proposed the creation of Aging and Disability Resources Centers (ADRCs) to inform individuals seeking long-term care about their options and to help them get enrolled with those programs they choose. By November 2008, 28 ADRCs were operating to serve the people of 38 counties. The Task Force also recommended creation of a system of managed long-term care, in which managed-care organizations (MCOs) would deliver a well-coordinated package of services, drawn from an exten-sive array of benefits, for every frail elder or adult with physical or development disabilities needing long-term care. This report describes the current state and performance of those programs—the Family Care Programs. The Family Care Programs—PACE, Partnership, and Family Care—differ from traditional home and community-based long-term care programs in several ways. The Family Care Programs provide long-term care where the member lives. Members do not lose their relationship with their care management team when they enter a nursing facility. The team continues to monitor the quality of care and helps the mem-ber return to the community, if the member wants to return. The managed-care payment arrangement is also different than the fee-for-service system. Fee-for-service programs pay providers based on the amount or cost of service provided, which creates a built-in incen-tive for providers to provide more, or more expensive care and which minimizes or eliminates financial incentives for preventive care, effective care, or economical services. In managed care programs, the State Medicaid program provides the MCO with a flat monthly payment for every member—or ‘capitated rate.’ This amount is more than the cost of some member’s services, but less than the cost of other member’s services, but the total amount paid to the MCO is actuarially determined to be sufficient for cost-effective care. This payment system transfers financial risk from the State, which cannot determine cost-effectiveness of each purchase decision on the basis of the member’s individual circumstances, to the MCO, which can. This payment arrangement provides incentive for the MCO to create care plans that are both effective—so that the MCO can prevent the need for additional, avoidable, or unnecessary ser-vices—and economical. 1 Milwaukee County serves frail elders, only (age 60 or older)
8
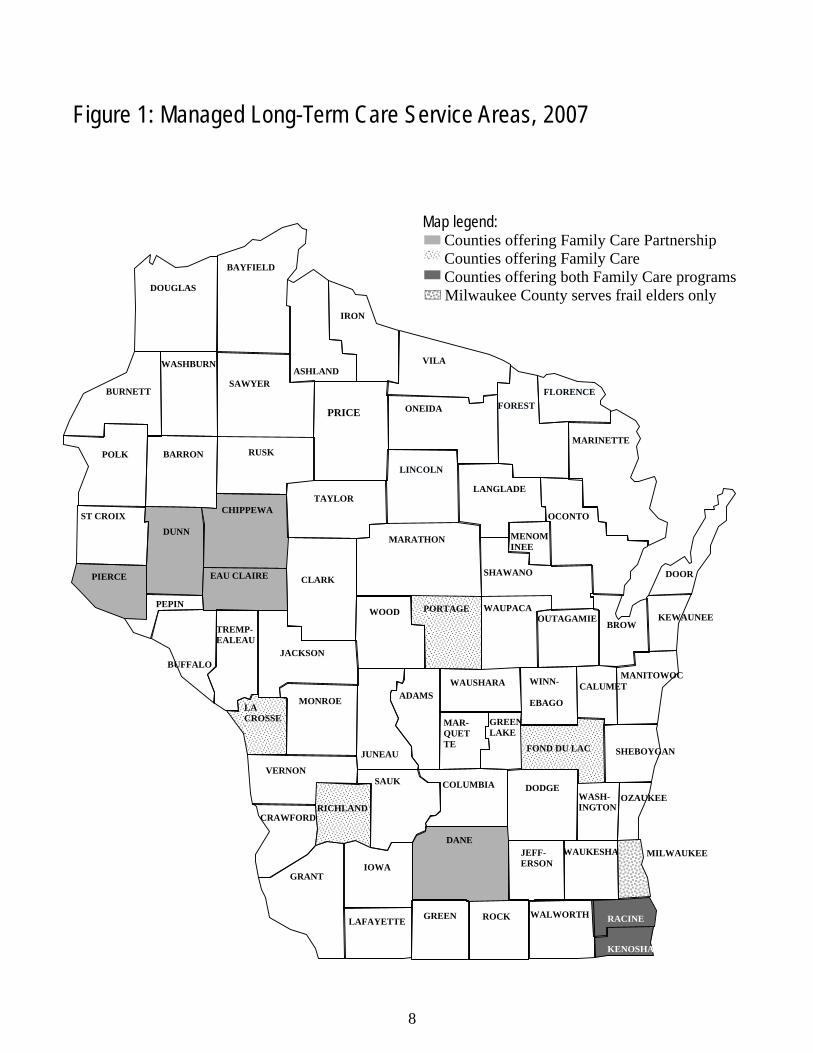
Figure 1: Managed Long-Term Care Service Areas, 2007
ADAMS
ASHLAND
BARRON
BAYFIELD
BROW
BUFFALO
BURNETT
CHIPPEWA
COLUMBIA CRAWFORD
DANE DODGE
DOOR
DOUGLAS
DUNN EAU CLAIRE
FLORENCE
FOND DU LAC
FOREST
GRANT GREEN
IOWA
IRON
JACKSON
JUNEAU
KEWAUNEE
LANGLADE LINCOLN
MANITOWOC
MARATHON
MARINETTE
MILWAUKEE
MONROE
ONEIDA
OZAUKEE
PEPIN PIERCE
POLK
PORTAGE
RACINE
RICHLAND
ROCK
RUSK
ST CROIX
SAUK
SAWYER
SHAWANO
TAYLOR
VERNON
VILA
WALWORTH
WASHBURN
WAUKESHA
WAUPACA
WAUSHARA WINN-
EBAGO
WOOD
CALUMET MAR- QUETTE
TREMP- EALEAU
JEFF-ERSON
LAFAYETTE
LA CROSSE GREEN
LAKE
MENOM INEE
OUTAGAMIE
OCONTO
CLARK
SHEBOYGAN
PRICE
WASH-INGTON
5-09 FC
KENOSHA
Map legend: Counties offering Family Care Partnership Counties offering Family Care Counties offering both Family Care programs Milwaukee County serves frail elders only

9
Services Provided by the Family Care Programs The Department contracts with the Family Care MCOs to provide Medicaid-funded long-term care ser-vices arranged by an interdisciplinary care team. In addition, FC-Partnership, formerly known as the Wis-consin Partnership Program, and PACE provide their members with Medicare and Medicaid-funded health and long-term support services in a single comprehensive health plan. Figure 2 includes information on the benefit packages of the three programs.
The Family Care programs are Wisconsin’s flexible health and long-term care programs. The programs are voluntary and offer increased consumer choice, improved access to services, and improved quality through a focus on health and personal outcomes. Long-term care consists of services and supports that people need to meet their daily needs. These services and supports include: assistance with activities of daily living such as eating, bathing, or using the telephone; home visits from nurses; home-delivered meals; home modifications; nursing home care; and case management. Many Wisconsinites take advan-tage of these supports and services, but over 11,000 others are waiting to receive them. The services and supports that the members receive from the MCO are selected to help the member achieve his/her desired results, or ‘outcomes.’ The outcomes of long-term care can be put into three gen-eral categories: clinical outcomes, functional outcomes, and personal-experience outcomes. Neither clinical nor functional outcomes are unique to long-term care. Clinical outcomes are results that can be measured in terms of improving or maintaining health. Getting high blood pressure under control, healing from a broken hip, or staying healthy through flu season are examples of clinical outcomes. Func-tional outcomes are results that can be measured in terms of improving or maintaining a person’s ability to do things safely and independently. Functional outcomes include some basic activities of daily living, such as bathing and eating, and other more complex activities, such as getting and keeping a job. Personal-experience outcomes are less familiar as the identified purpose of programs such as Family Care than are clinical or functional outcomes. Because the quality of long-term care affects people day in and day out for their entire lives, it affects nearly everything about member’s quality of life—where they live, in which social activities they can participate, how and when they go to church or shopping—just about everything. Personal-experience outcomes are subjective and more difficult to measure than clinical or functional outcomes. For example, a clinician can determine by observation whether a person has achieved the functional outcome of being able independently to ride a bus, but only the person can say where he or she wants to go, when, and whether the outing contributed to the quality of his or her life. From the initial assessment, in which care managers begin to understand the outcomes that each member considers important to his or her quality of life, through quality reviews that attempt to determine whether services were successful, all activities in Family Care are intended to support one or more outcomes for the members. More information on outcomes is included in Section 3 of this report, Results.

10
Figu
re 2
: Exp
lanat
ion o
f Ben
efit P
acka
ges o
f the
Thr
ee P
rogr
ams
Fam
ily C
are
Team
coo
rdin
ates
cov
ered
ser-
vice
s with
prim
ary
and
acut
e he
alth
car
e an
d ot
her s
ervi
ces n
ot c
over
ed b
y Fa
mily
Car
e.
Fam
ily C
are P
artn
ersh
ip &
PAC
E (P
rogr
am o
f All I
nclu
sive C
are f
or th
e Eld
erly)
(T
he di
ffere
nce b
etwee
n PAC
E &
Partn
ersh
ip is
that P
artne
rship
has a
drug
co-p
ay &
PAC
E do
es no
t. Fa
mily
Car
e Me
dica
id C
ard
Serv
ices -
Acu
te/
Prim
ary
Medi
care
Car
d Se
rvice
s H
ome
and
Com
mun
ity B
ased
Me
dica
id C
ard
Serv
ices -
LTC
ser-
vices
Ad
aptiv
e Aids
(gen
eral
and v
ehicl
e)
Adult
Day
Car
e Ca
re/C
ase M
anag
emen
t (inc
luding
Ass
essm
ent
and C
ase P
lannin
g)
Comm
unica
tion A
ids/In
terpr
eter S
ervic
es
Comm
unity
Sup
port
Prog
ram
Cons
umer
Edu
catio
n and
Tra
ining
Co
unse
ling a
nd T
hera
peuti
c Res
ource
s Da
ily Li
ving S
kills
Train
ing
Day S
ervic
es/T
reatm
ent
Home
Mod
ificati
ons
Hous
ing C
ouns
eling
Me
als: h
ome d
elive
red
Perso
nal E
merg
ency
Res
pons
e Sys
tem S
ervic
es
Prev
ocati
onal
Servi
ces
Reloc
ation
Ser
vices
Re
siden
tial S
ervic
es: C
ertifi
ed R
eside
ntial
Care
Ap
artm
ent C
omple
x (RC
AC)
Comm
unity
-Bas
ed R
eside
ntial
Facil
ity (C
BRF)
Ad
ult F
amily
Hom
e Re
spite
Car
e (for
care
give
rs an
d mem
bers
in no
n-ins
titutio
nal a
nd in
stitut
ional
settin
gs)
Supp
orted
Emp
loyme
nt Su
ppor
tive H
ome C
are
Voca
tiona
l Futu
res P
lannin
g
Alco
hol a
nd O
ther D
rug A
buse
Day
Tre
atmen
t Se
rvice
s (in
all se
ttings
) Du
rable
Med
ical E
quipm
ent, e
xcep
t for h
earin
g aid
s and
pros
thetic
s (in
all se
ttings
) Ho
me H
ealth
Me
dical
Supp
lies
Menta
l Hea
lth D
ay T
reatm
ent S
ervic
es (in
all s
et-tin
gs)
Menta
l Hea
lth S
ervic
es, e
xcep
t thos
e pro
vided
by a
phys
ician
or on
an in
patie
nt ba
sis
Nursi
ng F
acilit
y (all
stay
s inc
luding
Inter
media
te Ca
re F
acilit
y for
Peo
ple w
ith M
ental
Reta
rda-
tion (
ICF/
MR) a
nd In
stitut
ion fo
r Men
tal D
is-ea
se)
Nursi
ng S
ervic
es (in
cludin
g res
pirato
ry ca
re, in
ter-
mitte
nt an
d priv
ate du
ty nu
rsing
) and
Nur
sing
Servi
ces
Occu
patio
nal T
hera
py (in
all s
etting
s exc
ept fo
r inp
atien
t hos
pital)
Pe
rsona
l Car
e Ph
ysica
l The
rapy
(in al
l sett
ings e
xcep
t for in
patie
nt ho
spita
l) Sp
ecial
ized M
edica
l Sup
plies
Sp
eech
and L
angu
age P
atholo
gy S
ervic
es (in
all
settin
gs ex
cept
for in
patie
nt ho
spita
l) Tr
ansp
ortat
ion: S
elect
Medic
aid co
vere
d (i.e
., Me
dicaid
cove
red T
rans
porta
tion S
ervic
es
exce
pt Am
bulan
ce an
d tra
nspo
rtatio
n by c
om-
mon c
arrie
r) an
d non
-Med
icaid
cove
red.
Phys
ician
servi
ces
Labo
rator
y and
x-ra
y ser
vices
Inp
atien
t hos
pital
Outpa
tient
hosp
ital s
ervic
es
EPSD
T (u
nder
21)
Fami
ly pla
nning
servi
ces a
nd su
pplie
s Fe
dera
lly-q
ualifi
ed he
alth c
enter
servi
ces
Rura
l hea
lth cl
inic s
ervic
es
Nurse
midw
ife se
rvice
s Ce
rtified
nurse
prac
tition
er se
rvice
s Me
dical
care
or re
media
l car
e fur
nishe
d by l
i-ce
nsed
prac
tition
ers u
nder
state
law
Pres
cribe
d dru
gs
Diag
nosti
c, sc
reen
ing, p
reve
ntive
and r
ehab
ilitati
on
servi
ces
Clini
c ser
vices
Pr
imar
y car
e cas
e man
agem
ent s
ervic
es
Denta
l ser
vices
, den
tures
Ph
ysica
l ther
apy a
nd re
lated
servi
ces
Pros
thetic
devic
es, e
yegla
sses
TB
–rela
ted se
rvice
s Ot
her s
pecif
ic me
dical
and r
emed
ial ca
re
Inpati
ent m
ental
healt
h Ch
iropr
actic
servi
ces
Podia
try se
rvice
s Ou
tpatie
nt me
ntal h
ealth
Ou
tpatie
nt su
bstan
ce ab
use
Outpa
tient
surg
ery
Ambu
lance
servi
ces
Emer
genc
y car
e Ur
gent
care
Di
agno
stic s
ervic
es
Outpa
tient
pres
cripti
on dr
ugs
Hear
ing se
rvice
s Vi
sion s
ervic
es
Medic
are P
art A
(Hos
pital)
Me
dicar
e Par
t B (M
edica
l) Me
dicar
e Par
t D (P
resc
riptio
n Dru
gs)
Ambu
lance
servi
ces
Ambu
lator
y sur
gical
cente
rs An
esthe
sia
Bloo
d Bo
ne m
ass m
easu
reme
nt Du
rable
med
ical e
quipm
ent, s
uppli
es an
d pro
sthet-
ics
Card
iac re
hab
Chiro
prac
tic se
rvice
s Di
abete
s sup
plies
Di
agno
stic t
ests,
x-ra
ys an
d lab
servi
ces
Phys
ician
servi
ces
Emer
genc
y and
urge
nt ca
re se
rvice
s Ho
me he
alth c
are i
n cer
tain s
ituati
ons
Hosp
ice ca
re
Inpati
ent h
ospit
al ca
re
Inpati
ent m
ental
healt
h car
e Ou
tpatie
nt me
ntal h
ealth
care
Ou
tpatie
nt ho
spita
l ser
vices
, inclu
ding o
utpati
ent
surg
ery
Limite
d skil
led nu
rsing
facil
ity ca
re
Phys
ical/s
peec
h/occ
upati
onal
thera
py
Podia
try se
rvice
s Pr
escri
ption
drug
s, inc
luding
drug
s cov
ered
unde
r Me
dicar
e Par
t A, P
art B
, and
Par
t D
Partn
ersh
ip h
as a
small
dru
g co
-pay
, PA
CE h
as n
o co
-pay
Ce
rtain
prev
entiv
e tes
ts Ce
rtain
denta
l, hea
ring a
nd vi
sion s
ervic
es
Resp
ite ca
re
Subs
tance
abus
e tre
atmen
t (ou
tpatie
nt)

11
“Since I’ve been a member of CHP I have a calmer life, and better overall health. My seizures have been reduced to one or two in 7.5 years. I have less panic attacks.” • Response from the 2007 Member Satisfaction Survey
County Family Care Partnership/PACE
Chippewa 333 Dane 1,213 Dunn 301 Eau Claire 987 Fond du Lac 1,194 Kenosha 827 15 La Crosse 2,073 Milwaukee 7,545 1,122 Portage 1,095 Racine 752 154 Richland 423 Total 13,909 4,125
Table 1: Number of Members in 2007 by County
Expansion of Family Care Beginning in January 1999, Partnership sites offered services in Eau Claire, Dunn, Chippewa, Dane, and Milwaukee counties. The five Family Care pilot counties—Fond du Lac, La Crosse, Milwaukee, Portage, and Richland—began serving members in 2000 and 2001. In Governor Doyle’s 2006 State of the State Address, he announced his goal to expand the Family Care program statewide over the next five years. Planning for expansion began immediately; ten consortia of counties and their planning partners were awarded expansion planning grants in early 2006. In 2007, Kenosha and Racine were the first two expansion counties; their addition increased the total number of counties in which Family Care programs operate to eleven and enroll-ment in the programs had grown to over 13,000 members. Table 1 shows the enrollment breakdown by county. When Family Care programs are in all 72 counties, they are ex-pected to serve more than 53,000 members. Since then, Family Care has steadily grown in Wisconsin. By the end of 2008, residents in 25 counties containing 46 per-cent of Wisconsin’s eligible people will have access to Fam-ily Care programs. As the Family Care programs expand statewide, eligible county residents will be able to enroll in a program. With each expansion county, the first priority is to provide services to existing waiver clients and then end the waitlist within the first 24 months. Family Care programs help members live more independ-ently and access the services and supports they need, and members tell the Department it improves their overall quality of life. We are excited to offer these programs to Wisconsin residents and look forward to the day when these programs are available statewide, without waiting, to all eligible Wis-consin residents.

12
ADAMS
ASHLAND
BARRON
BAYFIELD
BROWN BUFFALO
BURNETT
CHIPPEWA
COLUMBIA CRAWFORD
DANE DODGE
DOOR
DOUGLAS
DUNN EAU CLAIRE
FLORENCE
FOND DU LAC
FOREST
GRANT GREEN
IOWA
IRON
JACKSON
JUNEAU
KEWAUNEE
LANGLADE LINCOLN
MANITOWOC
MARATHON
MARINETTE
MILWAUKEE
MONROE
ONEIDA
OZAUKEE
PEPIN PIERCE
POLK
PORTAGE
RACINE
RICHLAND
ROCK
RUSK
ST CROIX
SAUK
SAWYER
SHAWANO
TAYLOR
VERNON
VILA
WALWORTH
WASHBURN
WAUKESHA
WAUPACA
WAUSHARA WINN-
EBAGO
WOOD
CALUMET MAR- QUETTE
TREMP- EALEAU
JEFF-ERSON
LAFAYETTE
LA CROSSE
GREEN LAKE
MENOM INEE
OUTAGAMIE
OCONTO
CLARK
SHEBOYGAN
PRICE
WASH-INGTON
5-09 FC
KENOSHA
Map legend: Counties offering Family Care Partnership Counties offering Family Care Counties offering both Family Care programs Milwaukee County serves frail elders only
Figure 3: Managed Long-Term Care Implementation, 2008

13
2007 Highlights
The Family Care programs have been serving Wisconsinites for approximately 13 years. 2007 was the first year of expansion activities and brought about many quality initiatives. Kenosha and Racine were the first two expansion counties in 2007. Their addition increased the total number of counties in which Fam-ily Care programs operated to eleven. Family Care programs will serve over 53,000 members when they are operating in all 72 counties. As the Family Care Programs expand statewide, eligible county residents will be able to enroll in a pro-gram. With each expansion county, the first priority is to provide services to existing waiver clients and then end the waitlist within the first 24 months. During the first twelve months in operation, the Managed Care Organization (MCO) in Kenosha and Racine Counties served:
• 202 individuals from the counties’ waitlists; • 1,184 individuals who were previous county waiver clients; • 173 individuals who were Medicaid fee-for-service only clients; and • 71 individuals who were previously not receiving any public long-term care services.
The MCO in Kenosha and Racine Counties is on target to end the county waitlist by the end of 2009. Highlights of improvement initiatives:
• In 2006, the first Pay for Performance (P4P) initiative began. The P4P initiative attempts to reim-burse or reward the managed care organizations for meeting specific quality standards. The 2006 Diabetes Pay for Performance was concluded and evaluated in 2007. The P4P concluded with all participating Family Care managed care organizations achieving the target level of hemoglobin HA1-c tests for their members with diabetes. Eighty-eight percent of all diabetics in Family Care received hemoglobin HA1-c tests, which is consistent with the rate of testing among all Wiscon-sin Medicaid managed care organizations. Diabetes was selected for the first P4P because diabe-tes is a major health issue that impacts roughly one-third of total Family Care membership. The Diabetes P4P evaluation also provided evidence that all participating Family Care managed care organizations improved the control of diabetes among their members with diabetes enrolled for two or more years. Also, three of the five participating Family Care managed care organizations saw reductions in avoidable hospitalizations and emergency room visits among their diabetic members.
• In December 2006, DHS awarded a contract to the University of Wisconsin-Madison to develop
a tool for interviewing people to identify their individually-desired outcomes and for assessing whether they are present, supported and achieved. This project is known as the PEONIES Project (PEONIES stands for Personal Experience Outcomes iNtegrated Interview and Evaluation Sys-tem). When completed, the PEONIES interview tool will be used by DHS’ external quality re-viewers and will be made available for use by managed care organizations and long-term care waiver programs.
• In May 2007, the Managed Care and Employment Task Force (MCETF) was convened by the
Division of Long-Term Care and charged with recommending a comprehensive strategy to ex-pand work options for adults who rely on the community-based, long-term care system. The Task Force, composed of 28 members representing a wide range of interests and expertise, analyzed the challenges and identified best practices from Wisconsin and elsewhere for overcoming these challenges. Among the best practices used consistently in other high-performing states is the exis-tence of a state long-term care agency policy on employment.

14
Section 1: Member Profile
To be a member of a Family Care program, a person must have a disability: a significant limitation in his or her ability to perform basic activities of daily living. Eligibility for Family Care programs is limited to three ‘target groups’ or categories of people with disabilities: frail elders, adults with physical disabilities, and adults with developmental disabilities. 1Not all people with disabilities are eligible for Family Care Programs: for example, the Program does not serve children under the age of 18. Although the Family Care Programs do not serve the mental illness target group, up to two-thirds of the Family Care members have a mental illness but their main diagnosis is within one of the three target groups.
Frail elders are individuals 65 and older who have serious and long-lasting physical health problems or dementia. Conditions that are common among Family Care’s frail elders are diabetes, disabling arthritis, congestive heart failure, cancer, Alzheimer’s, and the effects of a stroke. The person must be unable, without help from another person, to perform one or more necessary activities of daily living such as dressing, bathing, eating, toileting, mobility, ability to cook meals, manage medications or manage money.
Family Care members with physical disabilities are adults who have a physical problem or condition that significantly limits their ability to care for themselves. Typical disabling conditions include amputations or paralysis as a result of accidents or disease; multiple sclerosis, chronic obstructive pulmonary disease and traumatic brain injuries. As with the frail elders, the person must need help from another person to complete one or more activities necessary for daily life.
Family Care members with developmental disabilities are adults who had onset of the disabling condi-tion before the age of 22 and have severe cognitive or physical functioning that significantly limits their ability to care for themselves. Some common disabling conditions include intellectual disability, cerebral palsy and epilepsy. The person must also have substantial functional limitations in at least three of the fol-lowing areas: learning, use of language, self-direction, mobility, self-care (bathing, dressing, eating, etc.) or the ability to live independently without help from anther person.
Finally, Family Care Program members are all financially eligible for Medical Assistance. That is, people are eligible for Family Care Programs only when they lack the financial resources to be able to afford the medical care that they need. Many Family Care Program members ‘spend down’ to Medicaid eligibility by paying for their own health and long-term care until they exhaust their private funds and became eligi-ble for Medicaid.
PD 21%
Frail Elders 64%
DD 15%
Figure 4: Total Active Members by Target Group
2Precise requirements for functional eligibility for Family Care can be found in Wisconsin statutes s.15.197(4)(a) 2 and s.15.197(4)(a)1, and in Wisconsin Administrative Code HFS 10.13(25m).

15
Table 2: Members Active on December 31, 2007, by Target Group
Table 3: Members Active on December 31, 2007, by Age Group
MCO and Program Frail Elder
Members with
Developmental Disabilities
Members with
Physical Disabilities
Milwaukee - Family Care 5,418 203 790 Fond du Lac - Family Care 485 374 169 Portage - Family Care 472 265 215 Richland - Family Care 177 117 81 La Crosse - Family Care 696 581 543 CCI - Family Care 420 718 326 CCI - Partnership/PACE 822 19 261 Care Wisconsin - Partnership 611 7 79
CHP - Partnership 878 62 473
CLA—Partnership 30 7 331
All MCOs 10,009 2,353 3,268
Age Range No. of Family Care Members
No. of Partnership Members Total
18-25 477 27 504
26-44 1,129 166 1295
45-64 2,509 1,012 3521
65-74 2,659 727 3386
75-84 2,880 881 3761
85+ 2,421 778 3199
Total 12,075 3,591 15,666
18 - 25 3 %
26 - 44 8 %
45 - 64 22 %
65 - 74 22 %
75 - 84 24 %
85+ 20 %
Figure 5: Members by Age Range
Source: Each member’s most recently completed functional screen as of December 31, 2007. Note: The Milwaukee County Family Care Program, operated by the county’s Department of Aging, serves people with dis-abilities over the age of 60, while other MCOs serve adults 18 and older, considering those 65 and older to be frail elders. For comparability within this table, frail elders in all MCOs are those who are 65 and older, and Milwaukee members between the ages of 60 and 64 are reported as members with either developmental or physical disabilities.
Source: DHS enrollment records.

16
Member Profile: Current Living Arrangement The proportion of active members who were living outside residential care facilities confirms the national and Wisconsin public policy that with proper supports, frail elders, people with developmental disabilities and people with physical disabilities can live in their own homes and experience an improved quality of life and life choices. The Managed Care Organizations work to assist members who prefer to live in a home setting by providing the right services and supports to maintain the desired living arrangement.
Figure 6 displays the percentages of members by living arrangement on December 31, 2007.
In 2007, Partnership had a higher percentage of members in home settings because, unlike Family Care, the program could request not to enroll individuals who were currently residing in nursing homes or other residential settings. This Medicaid regulation was changed on January 1, 2008, and in future years, the mix of living arrangements used by the two programs’ memberships will likely become more similar.
• A ‘home setting’ is the member’s own home or apartment, or the home or apartment of the member’s family
• ‘Residential’ is an adult family home, a residential-care apartment complex, or a community-based residential facility, as these facilities are defined in Wisconsin Administrative Code.
• ‘Institutional’ is a nursing home, an intermediate care facility for people with developmental disabili-ties, or a swing bed.
• The ‘Other’ category includes settings such as temporary living arrangements, hospices, jails, or homeless shelters. Due to uncertainty regarding the nature of certain living arrangements, occasionally screeners inflate the number of people reported to be living in these ‘other’ arrangements.
Figure 6: Living Arrangement for all Members Active on December 31, 2007
Home setting 63 %
Residential 22%
Other 5 %
Institutional 10 %
Home setting 78 %
Residential 8 %
Other 6 %
Institutional 8 %
Partnership Members Family Care Members
Source: Each member’s most recently completed functional screen.

17
Member Story: Earl and Alyce’s story from Community Health Partnership (CHP) Reprinted in part, with permission from Community Health Partnership’s Empowering People to Live Independently.
Like many farmers, Alyce and Earl figured they would rely on Social Security to pay for their medical needs in their retirement years, and use income from the sale of the land to meet other expenses.
It hasn’t worked out that way however. Alyce has diabe-tes, and Earl takes medications to slow the progress of his memory loss and confusion. Both have hearing prob-lems.
“Our Social Security wasn’t covering our medical needs. We didn’t have enough to live on,” explains Alyce. In 2001, one of their daughters helped them contact Com-munity Health Partnership representatives. “We qualified
and we joined,” says Alyce.
Although financial concerns first brought them to CHP, other services help them continue to live inde-pendently in the farmhouse they’ve shared for some 60 years. Alyce welcomes the help cleaning the house every other week. At age 84, she says she doubts she could do the job herself. CHP staff members help them coordinate their medical care and provide some in-home services, such as checks of Earl’s memory, trimming toenails, checking blood pressure, and reviewing medications. Alyce is grateful that CHP handles their medical paperwork and keeps them notified of changes in Medicare and other pro-grams. “We don’t have to worry about it,” says Earl.
CHP also has arranged for Earl and Alyce to have access to a personal emergency alert response system. If they have a health care emergency, they can push a button and a message is relayed to personnel at a medical call center. If they are not able to communicate with a responder, their children are notified.
As Earl’s memory loss progressed, Alyce realized she needed to learn how to better care for him—and herself. She attended a caregiver’s workshop put on by CHP staff. “It was a good learning session for me,” says Alyce.

18
Member Profile: Health Status The Family Care programs are entitlement programs, which means an eligible person cannot be denied enrollment into a MCO due to health reasons or capacity issues. Also a current member cannot be encour-aged to leave the program due to health reasons. Frail elders and adults with physical or developmental disabilities present a wide variety of sometimes-complex medical conditions. While every member is unique, a few common medical conditions can be found among Family Care members. Two examples that describe members with physical disabilities in-clude, younger adult men who experienced severe trauma from motor vehicle accidents or other mishaps. These members may have a spinal cord injury and paralysis, often conditions are accompanied with de-pression. The other example for members with physical disabilities are middle-aged women with a com-plex mix of auto-immune, metabolic, and nervous-system disorders, frequently accompanied by depres-sion. Two examples for members with developmental disabilities, include the middle-aged relatively physically healthy individuals with disorders such as Down’s Syndrome who need continual support with the activi-ties of daily living. Another example would include members with developmental disabilities who have very complex disabilities that significantly impair their physical health and require near-total care. Finally, the frail elders among Family Care members include individuals of extremely advanced age—in 2007, 46 Family Care and 15 FC-Partnership members were 100 or older—whose physical health needs are continuous and often complex. Other elders in Family Care are younger—still in their 60’s—but im-paired by varying degrees of irreversible dementia. The majority of member have more than one health diagnosis as detailed in Figure 7. While the diagnoses listed below were not necessarily the conditions that made the members eligible for a Family Care pro-gram, the MCOs are responsible for providing the proper services and supports to help the member con-trol his/her health and remain as active and healthy as possible.
5-9 diagnoses 38%
0-4 diagnoses 20%
10+ diagnoses 42%
5-9 diagnoses 20%
0-4 diagnoses
10+ diagnoses 77%
Source: Each member’s most recently completed functional screen as of December 31, 2007.
Figure 7: Multiple Health Diagnoses Among Members Active on December 31, 2007.
Family Care Family Care Partnership
Table 4 lists the most common diagnoses for members active in December 2007. The most common diag-nosis, affecting almost two-thirds of Family Care members, was hypertension. For more specific diagno-sis breakdowns see the appendix for each target group.

19
Table 4: Most Common Health Diagnoses for Members on December 31, 2007 Diagnoses affecting 10% or more of Family Care and/or Family Care Partnership members List is alphabetical.
Common Health Diagnoses FC FC-Partnership Allergies 17.9% 27.1% Alzheimer Other Dementia 23.9% 26.5% Anemia/Coagulation Defects 16.8% 33.8% Angina/Coronary Artery Disease 23.4% 37.5% Anxiety Disorder 19.5% 34.2% Arthritis 55.3% 66.3% Asthma 24.8% 38.6% Blood/Lymph Disorders 14.8% 36.1% Cancer 11.1% 14.4% Cerebral Vascular Accident 16.4% 19.1% Chronic Pain/Fatigue 35.6% 50.1% Congestive Heart Failure 16.8% 25.1% Dehydration/Fluid Imbalance 4.5% 12.3% Depression 34.6% 55.2% Diabetes Mellitus 32.7% 39.1% Digestive Disorders3 43.9% 72.3% Disorders GU System 21.5% 41.8% Heart Rate Disorders 14.4% 25.3% Hip/Bone Fracture 28.5% 39.0% Hypertension 62.7% 76.9% Hypo/HyperThyroidism 16.9% 21.5% Intellectual Disability 18.2% 1.5% Nerve Disorders4 20.8% 39.4% Nutritional Imbalances 40.0% 65.3% Osteoporosis 15.8% 28.7% Other Diagnoses 19.4% 47.4% Other Heart Conditions 11.2% 22.3% Other Mental Illness 8.6% 12.0% Other Sensory Disorders 14.2% 21.4% Renal Failure/Kidney Disease 12.0% 27.0% Respiratory Disorder 15.6% 29.5% Skin Diseases 6.8% 20.3% Urinary Tract Infection 8.2% 15.1% Visual Impairment5 36.0% 49.1% Source: Each member’s most recently completed functional screen as of December 31, 2007. Footnotes on page 42.
20
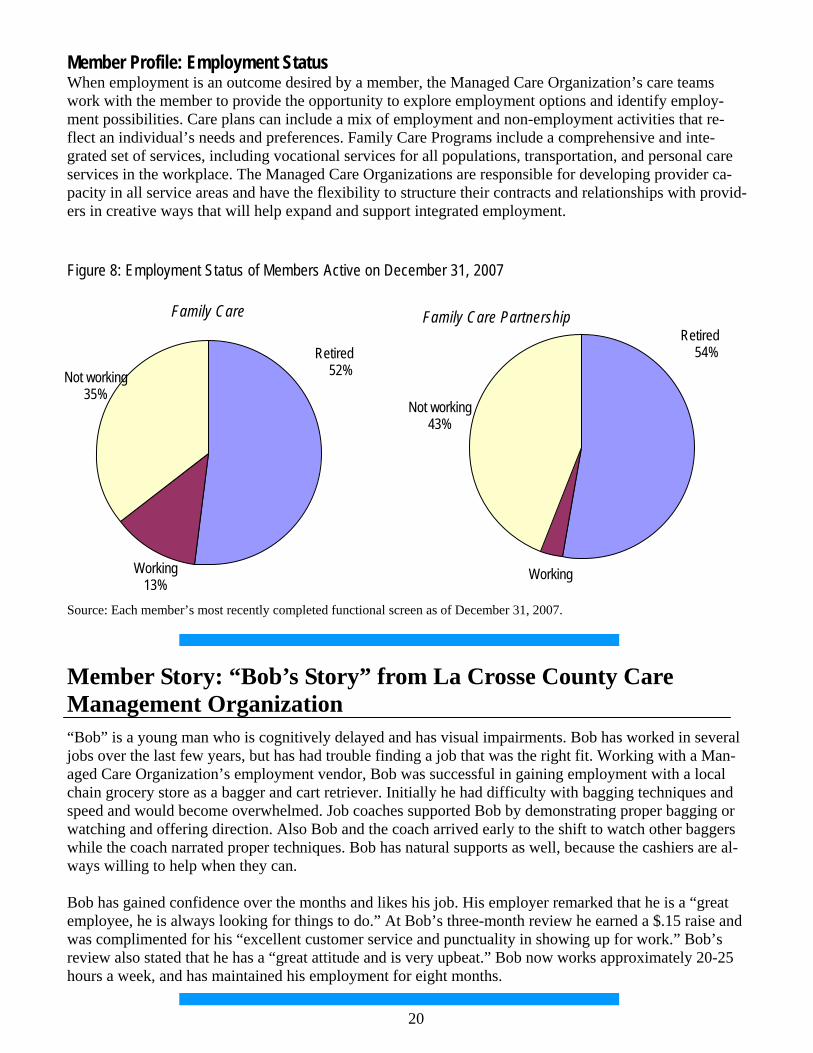
Member Story: “Bob’s Story” from La Crosse County Care Management Organization
“Bob” is a young man who is cognitively delayed and has visual impairments. Bob has worked in several jobs over the last few years, but has had trouble finding a job that was the right fit. Working with a Man-aged Care Organization’s employment vendor, Bob was successful in gaining employment with a local chain grocery store as a bagger and cart retriever. Initially he had difficulty with bagging techniques and speed and would become overwhelmed. Job coaches supported Bob by demonstrating proper bagging or watching and offering direction. Also Bob and the coach arrived early to the shift to watch other baggers while the coach narrated proper techniques. Bob has natural supports as well, because the cashiers are al-ways willing to help when they can. Bob has gained confidence over the months and likes his job. His employer remarked that he is a “great employee, he is always looking for things to do.” At Bob’s three-month review he earned a $.15 raise and was complimented for his “excellent customer service and punctuality in showing up for work.” Bob’s review also stated that he has a “great attitude and is very upbeat.” Bob now works approximately 20-25 hours a week, and has maintained his employment for eight months.
Member Profile: Employment Status When employment is an outcome desired by a member, the Managed Care Organization’s care teams work with the member to provide the opportunity to explore employment options and identify employ-ment possibilities. Care plans can include a mix of employment and non-employment activities that re-flect an individual’s needs and preferences. Family Care Programs include a comprehensive and inte-grated set of services, including vocational services for all populations, transportation, and personal care services in the workplace. The Managed Care Organizations are responsible for developing provider ca-pacity in all service areas and have the flexibility to structure their contracts and relationships with provid-ers in creative ways that will help expand and support integrated employment.
Working
Retired 54%
Not working 43%
Working 13%
Retired 52% Not working
35%
Figure 8: Employment Status of Members Active on December 31, 2007
Family Care Family Care Partnership
Source: Each member’s most recently completed functional screen as of December 31, 2007.

21
“I receive great medical service and I’m able to stay at home with my sister. I’m able to live independently.” • Response from the 2007
Member Satisfaction Survey
MCO and Program Frail Elder
Members with Developmental
Disabilities
Members with Physical
Disabilities Milwaukee - Family Care 6,485 214 829 Fond du Lac - Family Care 601 385 202 Portage - Family Care 564 286 244 Richland - Family Care 211 121 91 La Crosse - Family Care 836 601 629 CCI - Family Care 491 724 350 CCI - Partnership/PACE 1,101 15 165 Elder Care - Partnership 698 8 89
CHP - Partnership 1,019 68 530 All MCOs 13,077 2,218 2,674
CLA - Partnership 28 10 374
Section 2: Services Provided
Table 5: Number of Members who Received Care Management Services during 2007 by MCO
The Family Care Programs are designed to provide cost-effective coordination of long-term care services and health care by providing members access to a single flexible benefit package that includes a large number of health and long-term care services, which otherwise would be available only through separate programs. Every Managed Care Organization can offer its members access to residential long-term care, the same type of long-term care services as those offered by the Home and Community-Based Waivers, and the same wide variety of supports as those offered by the state-funded Community Options Program. The Partnership and PACE Programs provide its members with acute and primary health care services, such as physician visits, emergency room services and hospital services, while the Family Care Program coordinates its members’ long-term care with the health care that the members receive from fee-for-service providers. Managed Care Organizations receive a monthly per person payment, called capitation, to manage and purchase care for their members. The Managed Care Organizations assign a care team to each member. In Family Care, the care team in-cludes the member and anyone else the member chooses, which could be a guardian, a family member or friend, or a professional ombudsman or advocate. The team also includes at least a registered nurse and a care manager assigned by the MCO. Other professionals such as an occupational or physical therapist, or mental health specialist, may be involved, depending on the member’s needs.
Source: Encounter data submitted by each MCO

22
In Partnership and PACE, the care team is the same as in Family Care, but also includes an assigned MCO nurse practitioner and the member’s primary care doctor. Usually the nurse practitioner communi-cates with the doctor, who may or may not attend the care plan meetings.
The job of the Family Care Programs care team is to work with the member to: • Identify the clinical, functional and personal experience outcomes the member needs and wants. • Develop a service plan that outlines the services and other help the member needs to achieve those
outcomes. • Make sure the services in the plan are actually provided. • Make sure the plan continues to work for the member.
The first step the member’s care team completes is an assessment. The assessment is an ongoing process of identifying the real-life personal outcomes that matter to the member and his/her unique strengths and needs for support. During this process the member will tell his/her care team:
• What kind of life the member wants to live, • Whether the member wants to live at home or in a different living situation, and • What kind of support is needed to live the member’s desired life.
“I have freedom from serious financial concerns and availability of medi-cations. I have a more fulfilling life. I can get around easier with support from the program. My health has improved....” • Response from the 2007 Member Satisfaction Survey
PD 15%
Frail Elders 73%
DD 12%
Figure 9: Members who Received Care Management by Target Group during 2007
Source: Encounter data submitted by each MCO Note: The number of members who received care management at any time during 2007 is larger than the number of members who were active on December 31, 2007, shown on previous tables, due to natural turnover—deaths and disenrollments.

23
Member Story: Desiree’s story from Community Health Partnership Reprinted in part, with permission from Community Health Partnership’s Empowering People to Live Independently.
It was November 20, 2001. Desiree went to bed with what she thought was the flu. When she woke up the next day, she was totally paralyzed and unable to speak. Local doctors ordered her to be air transported to Mayo Clinic in Roches-ter, MN, where she was a patient for approximately a month. After numerous medical tests, a specialist diagnosed her as having an autoimmune disorder of unknown case similar to only four known cases in the U.S. Following her stay at Mayo Clinic, she was in medical and rehabilitation facilities for about a year. At age 25, Desiree is still recovering. She has trouble maintaining her balance and can lift only about 15 pounds. Her stamina is very limited. With the help of Community Health Partnership, Inc. (CHP) she lives independently in a small apartment. Without CHP’s help, she says she would “probably be bankrupt and
not walking.” Because of CHP, she is able to get the pharmaceutical prescriptions she needs. She success-fully completed a smoking cessation program and is benefiting from rehabilitation therapy. CHP helps her coordinate her health services, arranges transportation, helps her clean and maintain her apartment and serves as an information source. Doctors have told Desiree that her recovery will take at least five years from the onset of the disorder and she’s working hard to regain 100 percent of her mobility and strength. She receives physical therapy and is dedicated to a specialized exercise routine she can do in her apartment. Members of her CHP team are accompanying her on outings so she can practice negotiating street curbs, reaching for items in a store, and pushing a shopping cart. It all works toward her goal of increasing her level of independence.
To complete the assessment, the care team must first know about the member’s current situation, where the member lives, activities during the day and the health situation of the member. After the assessment is completed the care team will develop a member-centered plan and help the member move towards his/her personal outcomes. The plan must be clear about:
• What services and supports are needed to achieve the member’s personal outcomes, • Who is going to provide the member with each service or support, and • When each service or support will be provided.
The member-centered plan should be both reasonable and effective. The care team will work with the member to find the best provider for each service or support. The provider could include a nurse, home health worker, or the member may do the activity by his/herself or with help from family or friends.
The Managed Care Organizations are responsible for helping members achieve their personal outcomes and for considering cost when deciding on services and providers. The care team and member will work through a series of questions to help identify the member’s personal outcomes and to match the outcomes with the right services and supports. This process will find the most effective and cost-effective way to help the member achieve his/her personal outcomes.
The member-centered plan should be both reasonable and effective. Table 5 (on page 22) details the total number of members in 2007 that received the basic service of care management by MCO.

24
Table 6a: Top Services Provided to Family Care Members during 2007 The following tables contain information about the services provided to the 13,924 members for whom expenditures were reported for calendar year 2007.
Source: Encounter data submitted by each MCO The distribution of services provided by Family Care Partnership from January 1, 2007 through December 31, 2007 utilizes the common procedure and revenue codes within the encounter coding system. The distribution of service expenditures correlates only partially with the distribution of members who received these services during the year. Expenditure levels are explainable by the duration and quantities of providing the services to MCO members, and to the per-unit costs of the services.
Number of Members Served
Percent of Members Served
Expenditures Percent of Expenditures
Adult Day Care 980 7.0% $4,648,901 1.4% Case Management 13,924 100.0% $48,472,175 15.1% CBRF, AFH, RCAC 4,546 32.6% $110,827,374 34.5% Community Support 22 0.2% $126,779 0.0% Counseling and Therapeutic Resources 3,770 27.1% $2,365,179 0.7%
Daily Living Skills Training 803 5.8% $4,592,115 1.4% Day Center Services Treatment 705 5.1% $5,248,450 1.6%
Day Treatment -Medical 53 0.4% $109,930 0.0% Energy/Housing Assistance 330 2.4% $187,541 0.1% Equipment and Supplies 9,948 71.4% $9,833,388 3.1% Financial Management 2,234 16.0% $1,433,517 0.4% Home Health/Nursing 2,354 16.9% $15,704,649 4.9%
Meals 3,008 21.6% $4,376,918 1.4%
Nursing Home/ICF-MR 2,452 17.6% $44,485,067 13.9%
Other LTC Services 795 5.7% $408,376 0.1%
Pre-Vocational 748 5.4% $4,850,526 1.5%
Recreational Activities 234 1.7% $58,103 0.0%
Respite 667 4.8% $2,067,982 0.6%
Supported Employment 654 4.7% $3,209,535 1.0%
Supportive Home Care 7,271 52.2% $50,333,821 15.7%
Transportation 6,964 50.0% $7,661,186 2.4%
Total unduplicated 13,924 Total $321,001,511 100.0%

25
Table 6b: Top Services Provided to Family Care Partnership Members during 2007 The following tables contain information about the services provided to the 4,105 members for whom expenditures were reported for calendar year 2007.
Notes: *Consumer Directed Supports started in Partnership in late 2007 & has minimal history. A portion of some long-term care services are paid as an acute care service. A good example is a nursing home stay for reha-bilitation. A portion of some acute care services are paid as long-term care services. A good example is the inpatient hospital deductible.
Long-Term Care Services Number of Members Served
Percent of Members Served Expenditures Percent of
Expenditures
Adult Day Care/Day Center 1,077 26.2% $6,670,614 3.7% Case Management 4,105 100.0% $18,767,402 10.3% CBRF, AFH, GH 574 14.0% $17,327,205 9.6% Consumer Directed Supports* 125 3.0% Equipment & Supplies 2,365 57.6% $6,047,521 3.3% Home Health/Nursing 562 13.7% $1,343,993 0.7% Meals 738 18.0% $303,182 0.2% Nursing Home 875 21.3% $19,948,687 11.0% Other LTC Services 4,105 100.0% $17,665,068 9.7% Recreational Activities 212 5.2% $210,057 0.1% Respite 14 0.3% $24,535 0.0% Supportive Home Care 630 15.3% $1,738,543 1.0% Transportation 3,350 81.6% $6,472,835 3.6% Total LTC Service Costs $96,519,642 Acute Care Services Anesthesia 4,009 97.7% $6,172,909 3.4% Dental 2,613 63.7% $1,461,336 0.8% E&M Care (Office calls, NH, Hosp Visits) 3,944 96.1% $5,755,232 3.2% ER 1,853 45.1% $2,253,212 1.2% Inpatient Hospital 1,298 31.6% $22,969,200 12.7% Medications 4,039 98.4% $18,374,774 10.1% MH & AODA Outpatient Therapy 1,184 28.8% $993,525 0.5% Nutrition Intervention/Counseling 1,215 29.6% $471,550 0.3% Physician Pathology & Lab 3,850 93.8% $1,706,142 0.9% Physician Radiology 3,337 81.3% $3,133,060 1.7% Physician Surgery 4,046 98.6% $10,250,411 5.7% Physician/other medical services 4,105 100.0% $11,270,187 6.2% Total Acute Care Service Costs $84,811,538
26
Living Situations The Family Care Programs support the current public policy that with proper supports, frail elders, people with developmental disabilities and people with physical disabilities can live in their own homes and ex-perience an improved quality of life and life choices. Living at home is not possible or preferred by all the Family Care Program members but the MCOs will work with members who have identified living at home as a personal outcome. The care team and member will work to find services and support to help the member live as independently as possible.
Table 7 details the percentage of eligible days in natural settings (non-purchased home or apartment) ver-sus the percent of days members spent in purchased residential settings (AFH, RCAC, CBRF, ICF-MR, nursing homes and other institutions). On average, the Family Care members spent 65% of eligible days in natural settings ver-sus purchased residential care during 2007. There are variations between the MCOs, which can be due to the differences in mem-bers, member preferences and availability of providers in their area. Table 8 illustrates one way that utilization of residential services can be reviewed. Mem-bers with relatively low care needs can al-most always be served in community set-tings, and yet a small number can be ob-served with relatively lengthy (90 days or longer) stays in nursing facilities. Informa-tion like this helps the Department and the MCOs study and manage utilization of such services. For all Family Care Programs, the majority of the members were never admitted into a nursing home during 2007. Nursing homes are an important part of the long-term care system for short-term stays, rehabilitation services and members who have complex needs that cannot be safely provided for at home, and people who prefer to live in a nursing home. The Family Care Programs provide wellness and prevention services and supports to reduce the need for nursing home stays or reduce the amount of days of a stay.
Table 7: Use of Purchased Residential Services during 2007 Percent of Total Member-Days Spent in Residential Settings
Family Care Percent of Total Eligible Days
Natural (non-purchased) residential settings 65.2% Group residences 26.7% Nursing facilities 8.2% Total 100.0% FC-Partnership Natural (non-purchased) residential settings 78.9% Group residences 14.0% Nursing facilities 7.1% Total 100.0%
Source: Encounter data submitted by each MCO.
Family Care Percent of Members in Target Group
Frail Elders 1.0% Members with Developmental Disabilities 0.2% Members with Physical Disabilities 0.5% FC-Partnership Frail Elders 0.4% Members with Developmental Disabilities 0.0% Members with Physical Disabilities 0.3%
Table 8: Nursing Facility Stays of 90 Days or Longer for Mem-bers by Target Group with Low Care Needs
Source: Encounter data submitted by each MCO and member’s Functional Screen data.

27
“I have a team helping me with my medical problems. They are always there to answer questions or concerns that I have. They help me to stay at home and provide help with transportation, medications, and a nurse visits me often.” • Response from the 2007 Member Satisfaction Survey
Coordination of Health Services and Long-Term Care Another service provided to members by the MCOs is coordinating primary health care with long-term care. Family Care Partnership MCOs provide both Medicare and Medicaid primary, acute, and long-term care for their members. A nurse practitioner is on every member’s care-management team and provides some medical care and acts as a liaison with the primary care physician. In Family Care, which does not di-rectly provide primary or acute medical care, nurses are assigned to each care-management team and co-ordinate care with the members’ medical-care providers. Care team members often accompany the mem-ber to see their physician. This helps the member follow medical recommendations. In addition to assur-ing that people get the health and long-term care services in the Family Care benefit package, the care teams also help members coordinate all their health care, including, if needed, helping members get to and communicate with their physicians and helping them manage their treatments and medications. An in-depth study of Family Care (not Family Care Partnership) that was conducted in 2005 compared member’s health status, health care costs and long-term care costs to those of a carefully matched com-parison groups of similar individuals receiving fee-for-service Medicaid services in the remainder of the state. The study, which is too costly to update every year, found that Family Care members visited their primary care physicians significantly more frequently than members of the non-Family Care comparison group. The study also found lower rates of hospitalization and nursing-home utilization, and suggested that the more frequent physician visits increased opportunities for prevention and early intervention health care services. A good example of coordinating health care is how care teams work with the members to coordinate in-fluenza and pneumonia vaccinations. These vaccinations are important because the members served in the Family Care Programs are at higher risk for having medical complications from influenza and pneumonia. The Family Care Partnership benefit package includes primary and acute health care services, and the doctor on the member’s care team will recommend vaccinations for appropriate members. In the Family Care Partnership Program 63.7% of the members visit a dental office at least once a year and 96.1% see their primary care physician at least once a year.

28
Program and Target Group No. of Members
with at Least One ADL Limitation
No. of Members with at Least One ADL Limitation and at Least One ADL
Informal Support
Percent of Members With at Least One
Informal Support
Family Care 11,639 3,674 31.6% Frail Elders 8,937 2,490 27.9%
Members with Developmental Disabilities 1,535 595 38.8%
Members with Physical Disabilities 1,167 589 50.5% FC-Partnership 3,161 1,424 45.0% Frail Elders 2,231 970 43.5%
Members with Developmental Disabilities 71 36 50.7%
Members with Physical Disabilities 859 418 48.7%
Table 9: Use of Informal Supports with Members who Have at Least One Limited ADL during 2007
Use of Informal Supports The member’s individual service plan includes who will provide the member needed services and sup-ports. Providers may include the member, family, friends and other providers of informal supports. Infor-mal supports are provided by unpaid caregivers, such as family, friends and neighbors. Informal supports services are an important part of a member’s individual service plan. Most of us have informal supports. We have a neighbor who uses his snow blower to clear our driveway or a friend who brings a hot meal over when we do not feel well. People who provide informal supports help us feel connected to the community and add a social component to our life. However, people who provide informal supports can become “burned out” if they are not supported. The Family Care Pro-grams’ staff monitor the informal support people and watch for signs of caregiver “burn out”. Program staff arrange respite care or increase the amount of personal care given by Program staff to ease the bur-den and give support to the people who provide informal supports. As the baby boomer population ages and needs more assistance, people who provide informal supports will become even more important and integral to helping people remain in their homes. Because the arrangement and maintenance of informal supports is an objective of the Family Care and Partnership programs, observing changes in members’ reliance on informal supports over time can help to assess the success of the program in this area.
Source: Members Functional Screen data

29
“Our financial stress is eased. We have health care when we need it. We have support for every area of our lives. We have been able to live in a safe place and be together.” • Response from the 2007 Member
Satisfaction Survey
Program and Target Group No. of Members
with at Least One IADL Limitation
No. of Members With at Least One
IADL Limitation and at Least One IADL Informal Support
Percent of Members With at
Least One Informal Support
Family Care 13,460 8,715 64.7% Frail Elders 9,960 6,714 67.4% Members with Developmental Disabilities 2,113 1,097 51.9%
Members with Physical Disabilities 1,387 904 65.2% FC-Partnership 4,066 2,934 72.2% Frail Elders 2,837 2,194 77.3%
Members with Developmental Disabilities 100 67 67.0% Members with Physical Disabilities 1,129 673 59.6%
Table 10: Use of Informal Supports with Members who Have at Least One Limited IADL During 2007
Source: Members Functional Screen data

30
“My father is able to stay with me, because of Care WI. He goes to day care, has socialization, excellent health care and I have a support team to help with the increasing needs of my dad, making sure he's as happy and healthy as possible.” • Response from the 2007 Member Satisfaction Survey
Self-direction of Services within Family Care Programs Individuals with disabilities (or their guardians, when they have guardians) can participate in the planning and directing of their services in a variety of ways. All Family Care members exercise ‘self-determination’ in that they participate in the development of the goals of the care plan, choice of the ser-vices, and evaluation of whether the services are successful. Beyond that, some prefer to exercise greater control, such as by participating in the training of newly-assigned personal care aides.
Some members or their guardians prefer to handle even more responsibility for planning and managing their services, such as by recruiting and selecting staff, handling scheduling, or even managing payroll and benefits bookkeeping and reporting. These higher levels of member control of services are called ‘self-direction,’ and within Family Care, the member can choose to self-direct only some services, while choosing to rely on the MCO to manage others. Though frequently used for in-home care, self-direction can also be used outside of the home for services such as transportation and personal care at the member’s work place. For example, a member could choose to self-direct personal-care services that help him/her to stay home or to find and keep a job, and choose to rely on the care team to manage services such as pro-curement and maintenance of durable medical equipment.
In 2007, the period covered by this report, Family Care MCOs (but not FC Partnership MCOs) were re-quired to offer their members the services of a fiscal intermediary or a co-employment agency to assist them in directing the more administrative or managerial aspects of care planning. This agent assists the members in independently carrying out tasks such as the recruiting, hiring, training, supervising and firing of his/her direct care workers.
Since then, the services of fiscal intermediaries and co-employment agencies have been added to the FC Partnership benefit package and are offered to all members. However, since they were not a required ser-vice in 2007, the FC Partnership MCOs did not report them in the data they submitted to the Department, and so no information is available to include in this report. (The annual report for 2008 will include this information.)
In addition, 2008 saw the creation of a separate program, IRIS (Include, Respect, I Self-direct), for indi-viduals who prefer to exercise the greatest degree of self-direction, with no involvement of an MCO at all. IRIS is not a managed-care program, and will not be covered in this report.

31
Member Story: “Barbara’s Story” from Community Care, Inc. Meet Barbara, a member of Community Care’s Family Care program. For a woman who cannot use her arms and has very limited use of her legs, she is amazingly independent. Barbara attributes her upbringing and the services she receives with empowering her to live on her own.
Although Barbara has lived with cerebral palsy her entire life, her parents never let it be an excuse or an obstacle. “I was never treated differently from my brother. They didn’t deny things were more challeng-ing for me, but it didn’t make a difference. When I needed or wanted to do something, my mom would figure out how I could do it on my own.”
Barbara’s family owned a hardware store in Racine County. Her job was to take care of the accounts’ re-ceivable. “Mom would put it all out in front of me. I would type with a stick in my mouth.” Barbara’s dad had a house designed and built with her in mind. She lived there with her parents while they were living, and it is still her home today.
After an illness in 2002, Barbara spent ten months in a nursing home, where she was evaluated as a good candidate to live at home. Barbara moved back into the home with her mother. Upon her return home, Barbara began receiving long-term care services through Racine County and its service provider.
Barbara’s mother died in 2006, the year Barbara turned 60, and Barbara found herself on her own with many new responsibilities to learn. “I had to learn to be a homeowner and all that entails,” she says.
Community Care, as the state’s new contracted managed long-term care provider, began providing Family Care services in Racine in 2007. County clients like Barbara began receiving services through Commu-nity Care. Barbara became a Community Care participant in July and was able to continue working with the service provider she had been working with since 2002. “The transition has been very smooth,” says Barbara. “The people I’m working with are all wonderful,” she says.
During the day, Barbara receives help in the morning to get ready for the day and throughout the day with her meals.
Through Community Care, Barbara was also able to tackle a major obstacle to independence – nighttime. “I need extra help at night because in bed I’m a prisoner. I have no ability to move. If I get cold, I can’t put on an extra cover. If I’m hot, I can’t kick off the sheets. I can’t get up to get a drink of water.”
Community Care helped Barbara develop a care plan that used the Self-Directed Supports option through which she could pay friends to stay overnight. She chose three friends who all have nursing home experi-ence. Two of them are certified nursing assistants. “I’m an employer now,” she says.
"With support, I can live on my own," says Barbara. “Everything may take a little longer when I’m on my own, but it will get done.” When life looks challenging and Barbara needs courage, she tells herself, “You know you can do it.” And she has proven that she can.

32
Section 3: Results
Family Care services are provided not because there is a ‘slot’ available, but because the services are ex-pected to achieve or support results—or outcomes—that are desired by the member. The program meas-ures quality and success through three types of member outcomes: Clinical outcomes, such as recovering from a specific illness, getting a medical condition under control,
managing risk and preventing deterioration, and other health and safety outcomes; Functional outcomes, such as developing or recovering the ability to perform certain activities of daily
life, or finding and keeping desired employment; and Personal experience outcomes, which are quality-of-life circumstances unique to each member. When
working on members’ care plans or assessing performance, care managers and quality reviewers ex-plore personal-experience outcomes with the member in twelve general areas, shown in Figure 10.
Figure 10: Personal Experience Outcomes of Wisconsin Long-Term Care Programs
I decide where and with whom I live. I make decisions regarding my supports and services. I decide how I spend my day. I have relationships with family and friends I care about. I do things that are important to me. I am involved in my community. My life is stable. I am respected and treated fairly. I have privacy. I have the best possible health. I feel safe. I am free from abuse and neglect.

33
Family Care Percent of Members in
Target Group with Preventable ER Visit
Frail Elders 1.9% Members with Developmental Disabilities 1.4% Members with Physical Disabilities 4.6% FC Partnership Frail Elders 17.6% Members with Physical Disabilities 20.5%
Table 11: Preventable Emergency Room (ER) Visits
Family Care Percent of Members in
Target Group with Preventable Hospital
Admission
Frail Elders 5.5% Members with Developmental Disabilities 0.9% Members with Physical Disabilities 5.4% FC Partnership Frail Elders Members with Developmental Disabilities Members with Physical Disabilities
Table 12: Preventable Hospital Admissions
Indicators related to Health Status Ambulatory care sensitive conditions (ACSCs) are conditions for which good outpatient care can poten-tially prevent the need for hospitalization, or for which early intervention can prevent complications or more severe disease. These conditions provide insight into the quality of the health care system outside the hospital setting. Some common ACSCs include asthma, bacterial pneumonia, urinary tract infection and long- and short-term complications from diabetes. The list of ACSC’s was developed by the federal Department of Health and Human Services’ Agency for Healthcare Research & Quality and is used na-tionwide as an indicator of quality of healthcare.
The tables below detail the percent of members by target group that either went to an emergency room or were admitted into a hospital due to a preventable health issue. An example of a preventable event is when a person with diabetes is admitted into the hospital for an unexpected toe amputation. If a person with diabetes receives regular care, preventive education and maintains good blood sugar control can re-duce an individual’s risk of serious health complications.
Source: MMIS claims data. The Medicare admissions are included only in the FC Partnership numbers.
Source: MMIS claims data for Family Care.

34
Table 13: Immunizations – Influenza and Pneumonia Vaccinations for Active Family Care Members on December 31, 2007
“My team has helped me through some of the hardest times I have ever had to deal with, and I don't know if I would be here, if they were not helping me to overcome my physical and emotional problems at the times.” • Response from the 2007 Member Satisfaction Survey
Family Care MCOs Frail Elders
Members with Developmental
Disabilities
Members with Physical
Disabilities Milwaukee
Influenza Immunization 75.6% Pneumonia Immunization 70.7%
Fond du Lac Influenza Immunization 84.6% 64.1% 64.3% Pneumonia Immunization 53.2% 12.8% 36.2%
Portage Influenza Immunization 78.2% 58.3% 60.7% Pneumonia Immunization 45.5% 20.3% 31.8%
Richland - Family Care Influenza Immunization 88.1% 69.3% 81.3% Pneumonia Immunization 69.1% 39.6% 57.8%
La Crosse - Family Care Influenza Immunization 64.0% 52.3% 55.3% Pneumonia Immunization 69.9% 34.6% 57.8%
CCI - Family Care Influenza Immunization 34.3% 36.9% 26.2% Pneumonia Immunization 9.2% 8.1% 12.0%
All Family Care MCOs Influenza Immunization 73.9% 52.4% 53.9% Pneumonia Immunization 66.2% 22.1% 43.7%
Source: Data compiled by External Quality Review Organization
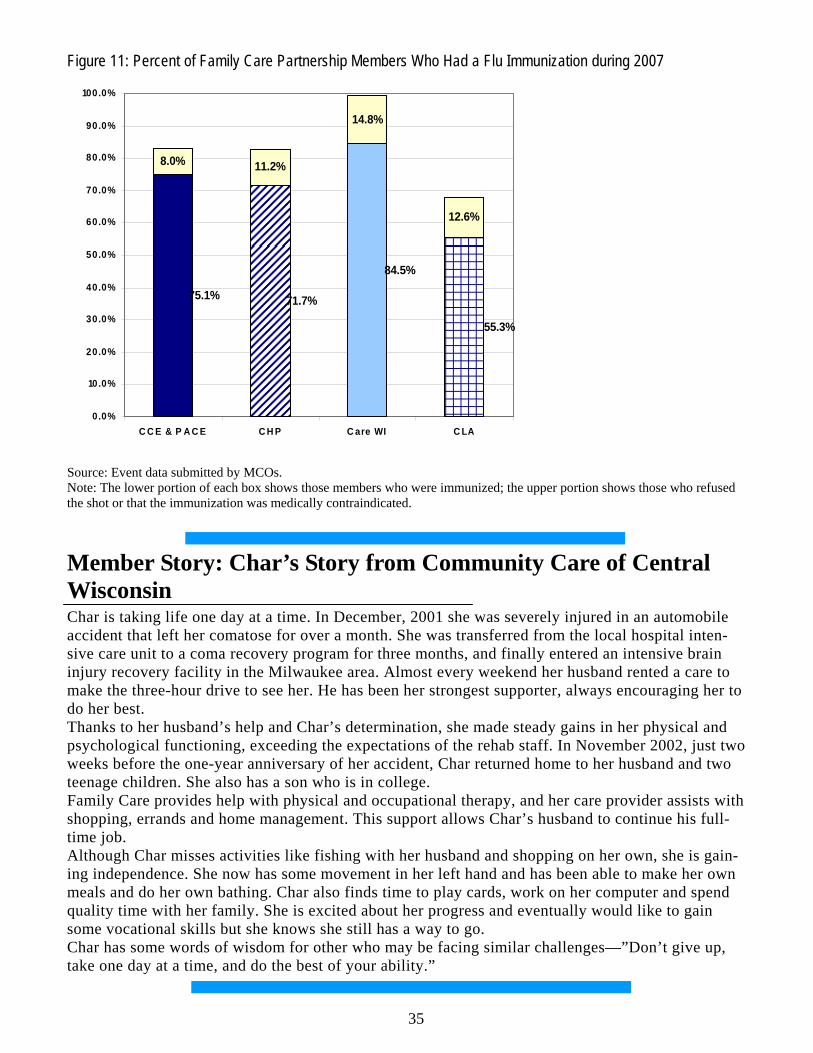
35
Source: Event data submitted by MCOs. Note: The lower portion of each box shows those members who were immunized; the upper portion shows those who refused the shot or that the immunization was medically contraindicated.
Member Story: Char’s Story from Community Care of Central Wisconsin Char is taking life one day at a time. In December, 2001 she was severely injured in an automobile accident that left her comatose for over a month. She was transferred from the local hospital inten-sive care unit to a coma recovery program for three months, and finally entered an intensive brain injury recovery facility in the Milwaukee area. Almost every weekend her husband rented a care to make the three-hour drive to see her. He has been her strongest supporter, always encouraging her to do her best. Thanks to her husband’s help and Char’s determination, she made steady gains in her physical and psychological functioning, exceeding the expectations of the rehab staff. In November 2002, just two weeks before the one-year anniversary of her accident, Char returned home to her husband and two teenage children. She also has a son who is in college. Family Care provides help with physical and occupational therapy, and her care provider assists with shopping, errands and home management. This support allows Char’s husband to continue his full-time job. Although Char misses activities like fishing with her husband and shopping on her own, she is gain-ing independence. She now has some movement in her left hand and has been able to make her own meals and do her own bathing. Char also finds time to play cards, work on her computer and spend quality time with her family. She is excited about her progress and eventually would like to gain some vocational skills but she knows she still has a way to go. Char has some words of wisdom for other who may be facing similar challenges—”Don’t give up, take one day at a time, and do the best of your ability.”
8.0% 11.2%
14.8%
12.6%
84.5%
75.1% 71.7%
55.3%
0.0%
10.0%
20.0%
30.0%
40.0%
50.0%
60.0%
70.0%
80.0%
90.0%
100.0%
C C E & P A C E C H P C are WI C LA
Figure 11: Percent of Family Care Partnership Members Who Had a Flu Immunization during 2007

36
Indicators related to Functional Status Every Family Care member enters the program with a certain number of impaired activities of daily living (ADLs) or instrumental activities of daily living (IADLs. ADLs are:
• Bathing • Dressing • Eating • Moving around in one’s home • Using the toilet • Moving between surfaces, such as from a chair to a bed.
IADLs are:
• preparing meals • managing and taking medications • managing money
The MCOs’ services are intended to reduce or delay any unavoidable deterioration in each member’s functional abilities and to, whenever possible, help members to recover or improve their abilities. Tables 14 and 15 show the proportion of Family Care members whose abilities improved during 2007 and the proportion whose abilities deteriorated.
Program and Target Group Percent of Members
with Fewer ADLs Limitations
Percent of Members with No Change in ADLs Limitations
Percent of Members with More ADLs
Limitations
Family Care 14.7% 61.0% 24.3%
Frail Elders 16.0% 55.9% 28.1%
Members with Developmental Disabilities 8.3% 77.8% 13.9%
Members with Physical Disabilities 17.1% 64.9% 18.0%
FC-Partnership 18.9% 53.5% 27.6%
Frail Elders 17.2% 53.5% 29.4%
Members with Developmental Disabilities 14.5% 61.8% 23.7%
Members with Physical Disabilities 24.0% 52.7% 23.3%
Table 14: One-Year Changes in Need for Assistance with Activities of Daily Living by Target Group and Program ADLs (Eating, bathing, toileting, dressing, transferring and mobility)
Source: Functional screens submitted for each member during 2007, compared with functional screens from one year earlier.
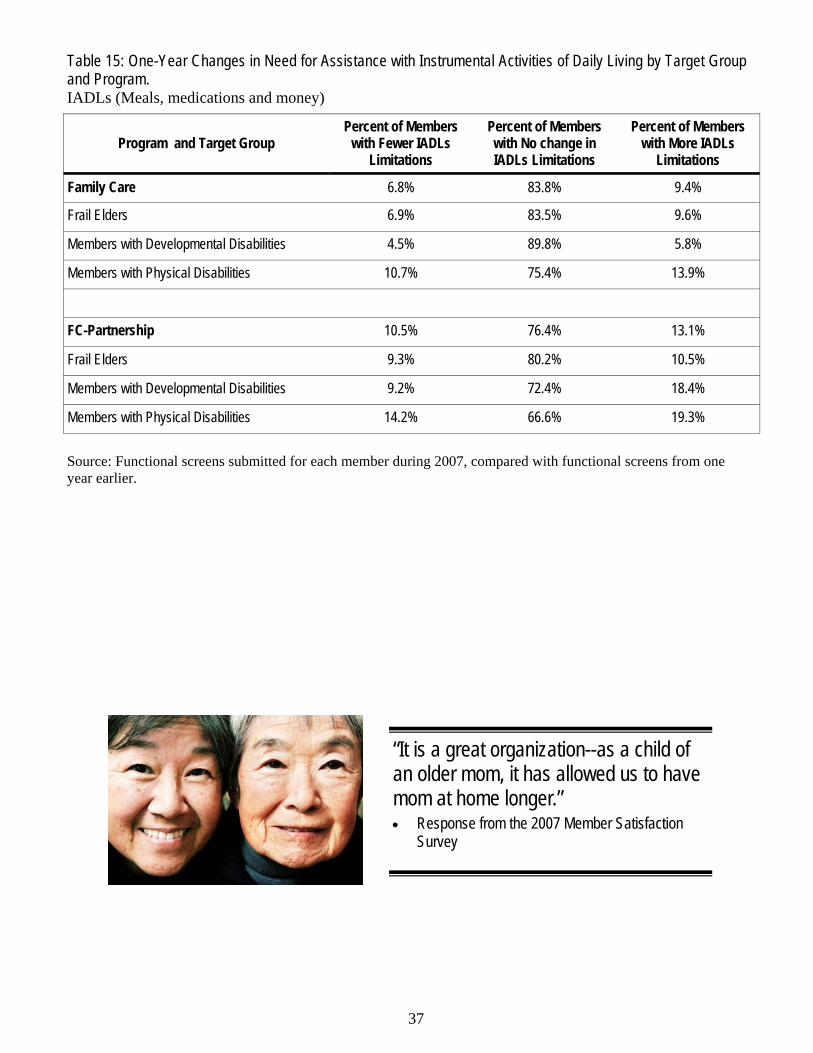
37
“It is a great organization--as a child of an older mom, it has allowed us to have mom at home longer.” • Response from the 2007 Member Satisfaction
Survey
Program and Target Group Percent of Members
with Fewer IADLs Limitations
Percent of Members with No change in IADLs Limitations
Percent of Members with More IADLs
Limitations
Family Care 6.8% 83.8% 9.4%
Frail Elders 6.9% 83.5% 9.6%
Members with Developmental Disabilities 4.5% 89.8% 5.8%
Members with Physical Disabilities 10.7% 75.4% 13.9%
FC-Partnership 10.5% 76.4% 13.1%
Frail Elders 9.3% 80.2% 10.5%
Members with Developmental Disabilities 9.2% 72.4% 18.4%
Members with Physical Disabilities 14.2% 66.6% 19.3%
Table 15: One-Year Changes in Need for Assistance with Instrumental Activities of Daily Living by Target Group and Program. IADLs (Meals, medications and money)
Source: Functional screens submitted for each member during 2007, compared with functional screens from one year earlier.

38
Table 16: Percent of Members by Current and Preferred Living Situation on December 31, 2007
Family Care Partnership Preferred Residence
Current Residence Prefers to live in Home Setting
Prefers to live in Residential
Prefers to live in Institutional
Prefers to live in Other setting
Currently lives in Home Setting 97% 0% 0% 3%
Currently lives in Residential 24% 64% 0% 11%
Currently lives in Institutional 35% 9% 28% 27%
Currently lives in Other setting 24% 19% 0% 57%
Total Percent of members cur-rently living in preferred setting 97% 64% 28% 57%
Family Care Preferred Residence
Current Residence Prefers to live in Home Setting
Prefers to live in Residential
Prefers to live in Institutional
Prefers to live in Other setting
Currently lives in Home Setting 97% 1% 0% 2%
Currently lives in Group Setting 13% 74% 0% 13%
Currently lives in Nursing facility 29% 12% 38% 21%
Currently lives in Other setting 30% 29% 0% 40%
Total Percent of members cur-rently living in preferred setting 97% 74% 38% 40%
Desired Living Arrangements A primary goal of the Family Care programs is giving people better choices about where they want to live. As stated earlier, the current public policy is that most people can remain living in their homes if pro-vided with the proper services and supports. The membership of the Family Care programs reflect the trend that most people would like to remain in their home. Table 16 shows the current and preferred living arrangements of active members in the Family Care programs.
The table includes data on where the member is currently living and the member preferred living setting. The shaded boxes designated that percent of member who are currently living in their preferred living set-ting for each residence choice. Overall, 83.2% of the Family Care members and 82.3% of the FC-Partnership members are living in their preferred living arrangement.
Source: Each member’s most recently completed functional screen, as of December 31, 2007.

39
Table 17: Changes for Employment Status of Family Care Program Members during 2007
Year-later Employment Status of Unemployed Members who Desired Employment on Earlier Screen
Family Care Total (N=342)
FC-Partnership Total (N=113)
Now Have a Job, Satisfied 14.6% 1.8%
No Longer Desire Employment, Satisfied 21.9% 23.9%
Not Satisfied: Still Unemployed or Employed in an Unsatisfactory Job 63.5% 74.3%
Total 100.0% 100.0%
Year-later Employment Status of Members who were Employed and Satisfied With Job on Earlier Screen
Family Care Total (N=929)
FC-Partnership Total (N=56)
No Change: Still Employed in Desired Job 87.1% 69.6%
Now Retired or Unemployed but Satisfied 5.9% 23.2%
Now Out of a Job or Desiring a Different One 7.0% 7.1%
Total 100.0% 100.0%
Changes in Members’ Employment Status The Managed Care Organization’s care teams provide services to help members achieve their employ-ment objectives. Services such as daily living skills training, day treatment, pre-vocational services and supported employment are included in the Family Care benefit package. Other Family Care services such as transportation and personal care also help people meet their employment goals. Supporting frail elders and adults with physical and developmental disabilities with their employment goals is a challenge to long-term care programs, and there is room for improvement in the employment rates among members. Historically, in Wisconsin and across the nation, participation in employment and particularly integrated employment, among working age adults with disabilities has been limited. Cur-rently, most working age adults with disabilities served by the public long-term care system in Wisconsin are unemployed or employed in non-integrated settings. The Wisconsin’s Medicaid Infrastructure Grant (MIG) program “Pathways to Independence”, is working to develop alternative strategies and better practices that strengthen and add capacity to the rehabilitation, workforce, education, and Medicaid systems.
Year-later Employment Status of Retired Members on Earlier Screen Family Care
Total (N=4077) FC-Partnership Total (N=1259)
No Change: Still Retired and Satisfied 99.1% 99.1%
Now Have Employment and Satisfied 0.1% 0.2% Not Satisfied: Still Retired but Desiring Employment 0.8% 0.7% Total 100.0% 100.0%
Source: Functional screen created for each member during 2007, compared with functional screens from one year earlier. Note: Employment information collected from the screener may include errors. The member is answering questions regarding employment and desire of employment without full knowledge of ramifications.
40
Members’ Satisfaction Although it is not an ‘outcome’ in the same sense as the clinical or functional well-being of the members, members’ satisfaction with the program is an important indicator of the programs’ success. Member satis-faction can be observed in at least two measures: satisfaction surveys and the rate at which members choose to leave the program. Beginning in 2008 a member satisfaction survey will be conducted in both Family Care and Family Care Partnership.
Satisfaction Surveys DHS staff randomly selected and mailed surveys to more than 1100 Partnership and PACE members with at least 6 months enrollment during 2007. 662 surveys were returned, resulting in a 60% return rate. The survey had 23 questions. Overall the responses were very positive. More than 95% of those who answered the survey were “always/very” or “usually” satisfied in the following areas:
• The services of the member’s main physician; • Team treats member with respect; • Team involves the member in making decisions; • The member’s health related concerns are addressed to the extent that the member wants; • The member is able to live where and with whom the member wants; • The member has people who care about and are involved in the member’s life; • The member has privacy when they want it; • The member knows whom to contact for questions; • Team listens and understands the member’s concern; • Team follows through with questions or requests, and • Team answers questions promptly.
90 to 95% of those who answered the survey were “always/very” or “usually” satisfied with the following services:
• Access to the member’s main physician; • Care from the dentist; • Day Center; • In-home services; • Transportation, and • Over all experience with the Partnership or PACE Programs.
The only two questions that received below a 90% satisfaction score included:
• 75% of the members were “always” or “usually” able to see their dentist as often as they thought they should, and
• 89% of the members “always” or “usually” had opportunities for social and recreational activi-ties in the community as often as they wanted.
The full survey and summary is posted on the Department’s website at: http://dhs.wisconsin.gov/wipartnership/pdf-wpp/2007membrsatsurvy.pdf

41
Table 18: Members who chose to leave the program during calendar year 2007 Left the program means members who left the program and did not come back within a 3-month time period.
MCO and Program
Members Served in Calendar Yr.
2007
No. of Members who chose to leave program
% of Members who chose to leave program
Milwaukee - Family Care 7,528 243 3.2% Fond du Lac - Family Care 1,188 52 4.4% Portage - Family Care 1,094 44 4.0% Richland - Family Care 423 11 2.6% La Crosse - Family Care 2,066 103 5.0% CCI - Family Care 1,565 27 1.7% CCI - Partnership/PACE 1,281 23 1.8% Care Wisconsin - Partnership 795 12 1.5%
CHP - Partnership 1,617 25 1.5% CLA - Partnership 412 13 3.2%
All MCOs 17,969 553 3.1%
Disenrollment for Reasons Other than Death or Loss of Eligibility
Table 18 details the number of Family Care program members who chose to leave the program during 2007. There are a variety of reasons for a member to leave the program, such as, they moved out of State, or they have chosen another program to receive their services from. Overall there is a small percent of eli-gible members who choose to leave a Family Care program.
Source: MMIS eligibility data.
“I got involved with the program before I was released from the care facility I was in after I had a stroke. So since my stroke I've always had their help. Without a doubt, they have made my life a lot easier. I have independence and can stay in my home!” • Response from the 2007 Member Satisfaction Survey
42
Footnotes: 1 Milwaukee County serves frail elders, only (age 60 or older)
2Precise requirements for functional eligibility for Family Care can be found in Wisconsin statutes s.15.197(4)(a) 2 and s.15.197(4)(a)1, and in Wisconsin Administrative Code HFS 10.13(25m).
3Digestive disorders: examples of common diagnoses include dysphagia (difficulty swallowing), gall-stones, gastroesophageal reflux (GERD), gastroenteritis, GI bleed, hernia, hemorrhoids, irritable bowel syndrome (IBS), soft palate deformity, pancreatitis, ulcers.
4Nerve disorders: examples of common diagnoses include anoxic brain syndrome (lack of oxygen at birth), apraxia (disorder of movement planning), bacterial meningitis, brain aneurysm, brain tumor, cere-bellar ataxia, cerebral aneurysm, encephalitis, fetal alcohol syndrome, hydrocephalus.
5Visual impairment: examples of common diagnoses include cataracts, diabetic Retinopathy, glaucoma, lens implant, macular degeneration, retinal keratosis.
Information on the data: The following pages provide a description of the program’s current members. The data that were used to produce the information that is included in this section came from the Department’s administrative data systems, primarily MMIS. Another major source for information presented here is the Long-Term Care Functional Screen, which provides a wide range of data on member demographics, functional needs and health status. Most of the data used here resides on several universes in the MEDS data warehouse. These universes are databases, or logical configurations of Oracle tables that were designed to meet specific research needs and purposes. In comparing several tables, readers may note that the total number of cases varies amount tables, even sometimes when it seems as if the ‘N’ should be the same. This variation results from several factors: • Missing data. Most tables presented in this report are the products of matching and analyzing multiple
administrative data sources. When certain data are missing from any of the data sources used in such analysis, any attempt to offer different views of even a similar phenomenon will frequently result in a somewhat different population size (N), or in a different count of the characteristics being analyzed.
• Reporting lag and database updates. Late reporting (lag) effects data completeness at any given point in time. Since the analyses presented here were performed over several months, some discrepancies in the number of cases and the data associated with them can occur. The same holds true for the updating of the administrative databases in the MEDS data warehouse. Since these databases are updated on different schedules, certain discrepancies are possible as well.
• Data instability. The correction and adjustment of various data on the administrative database is com-mon and can result in certain data fluctuations over time. The eligibility data, which are the primary source for identifying Family Care members and is the starting point to form any analysis, is a pri-mary example of data instabilities. On different days the eligibility databases can yield different num-bers of eligible members for the same focal date.
Appendix 1

43
List of Acronyms/Abbreviations: ADL – Activities of Daily Living ADRC – Aging and Disability Resource Center DHS – Department of Health Services EQRO – External Quality Review Organization IADL – Instrumental Activities of Daily Living Family Care Programs – refers to Family Care, Family Care Partnership and PACE MCO – Managed Care Organization Sources of Additional Information
• For additional information specific to a MCO, contact the MCO. Contact information is listed on page 75.
• External Quality Review Reports by State Fiscal year are located on the MetaStar website: http://www.metastar.com/web/
• In 2008, public fiscal reporting will be available on the Family Care Programs. • In 2008, the public report will feature articles about the MCO’s Program Improvement Projects
(PIPs) and other quality improvement projects. Comments and suggestions regarding the content of this report can be submitted to Karen McKim, Qual-ity/Research Team Manager ([email protected]).

44
Appendix 2—Focus on the Frail Elder Target Group
Table 19: Frail Elder Membership by MCO on December 31, 2007
Source: Each member’s most recently completed functional screen as of December 31, 2007. Note: The Milwaukee County Family Care program, operated by the county’s Department of Aging, serves people with disabilities over the age of 60, while other MCOs serve adults 18 and older, considering those 65 and older to be frail elders. For comparability within this table, frail elders in all MCOs are those who are 65 and older, and Milwaukee members between the ages of 60 and 64 are reported as members with either developmental or physical disabilities.
MCO and Program Frail Elder
Proportion of Total MCO
Membership
Milwaukee - Family Care 5,418 84.5% Fond du Lac - Family Care 485 47.2% Portage - Family Care 472 49.6% Richland - Family Care 177 47.2% La Crosse - Family Care 696 38.2% CCI - Family Care 420 28.7% CCI - Partnership & PACE 822 74.6% Care Wisconsin - Partnership 611 87.7% CLA - Partnership 30 8.2% CHP - Partnership 878 62.1% All MCOs 10,009 64.0%

45
Family Care Partnership Preferred Residence
Current Residence Prefers to live in Home Setting
Prefers to live in Residential
Prefers to live in Institutional
Prefers to live in Other setting
Currently lives in Home Setting 96% 0% 0% 4%
Currently lives in Residential 22% 65% 0% 13%
Currently lives in Institutional 31% 8% 30% 30%
Currently lives in Other setting 19% 19% 1% 61%
Total Percent of members cur-rently living in preferred setting 96% 65% 30% 61%
Table 20: Current and Preferred Living Situation for Frail Elder Members All Members Active on December 31, 2007.
Family Care Preferred Residence
Current Residence Prefers to live in Home Setting
Prefers to live in Residential
Prefers to live in Institutional
Prefers to live in Other setting
Currently lives in Home Setting 98% 1% 0% 1%
Currently lives in Group Setting 13% 78% 0% 9%
Currently lives in Nursing facility 28% 11% 39% 22%
Currently lives in Other setting 29% 29% 1% 42%
Total Percent of members cur-rently living in preferred setting 98% 78% 39% 42%
Source: Each member’s most recently completed functional screen, as of December 31, 2007.

46
Table 21: Most Common Health Diagnoses Among Frail Elder Members on December 31, 2007 Diagnoses affecting 10% or more of Family Care and/or Family Care Partnership members List is alphabetical.
Common Health Diagnosis FC FC-Partnership Allergies 30.2% 18.0% Alzheimer's Disease 10.6% 31.7% Anemia/Coagulation Defects 38.0% 21.2% Angina/Coronary Artery Disease 44.2% 30.3% Anxiety Disorder 31.4% 19.7% Arthritis 74.9% 69.9% Asthma 36.1% 28.1% Blood/Lymph Disorders 41.6% 18.4% Cancer 17.3% 14.3% Cerebral Vascular Accident 21.0% 20.7% Chronic Pain/Fatigue 46.4% 41.3% Congestive Heart Failure 29.9% 21.9% Dehydration/Fluid Imbalance 13.7% 5.6% Depression 50.8% 35.9% Diabetes Mellitus 37.8% 38.2% Digestive Disorders3 77.1% 50.1% Disorders GU System 46.4% 26.0% Heart Rate Disorders 31.0% 18.5% Hip Fracture/Replacement 10.7% 34.2% Hypertension 83.5% 77.4% Hypo/HyperThyroidism 23.4% 18.6% Nerve Disorders4 38.9% 22.8% Nutritional Imbalances 69.6% 47.9% Osteoporosis 34.8% 19.9% Other Diagnoses 44.3% 19.9% Other Heart Conditions 25.2% 13.3% Other Sensory Disorders 25.7% 17.0% Pneumonia/Bronchitis/Flu 10.5% NA Renal Failure/Kidney Disease 32.5% 14.6% Respiratory Disorder 16.7% 17.8% Skin Diseases 21.5% 6.9% Urinary Tract Infection 16.7% 10.2% Visual Impairment5 60.6% 45.8%
Source: Each member’s most recently completed functional screen as of December 31, 2007.

47
Table 22: Multiple Diagnoses Among Frail Elder Members on December 31, 2007
MCO and Program Family Care FC-Partnership
0-4 Diagnoses 16.0% 1.2% 5-9 Diagnoses 38.3% 18.2% 10+ Diagnoses 45.7% 80.6%
Total 100.0% 100.0%
Family Care No. of Frail Elder
Members Percent of Frail Elder
Members
Retired 6,133 70.8%
Working 163 1.9% Not Working 2361 27.3%
FC-Total 8,657 100.0% FC-Partnership
Retired 1,854 74.9% Working 31 1.3%
Not Working 589 23.8%
FC-Partnership Total 2,474 100.0%
Table 23: Employment Status Among Frail Elder Members on December 31, 2007
Source: Each member’s most recently completed functional screen as of December 31, 2007.
Source: Each member’s most recently completed functional screen as of December 31, 2007.

48
Number of Members Served
Percent of Members Served
Expenditures Percent of Expenditures
Adult Day Care 888 8.7% $4,264,905 1.9% Case/Care Management 10,172 100.0% $36,598,365 15.9% CBRF, AFH, RCAC 3,329 32.7% $75,032,536 32.6% Community Support Program 8 0.1% $27,298 0.0% Counseling and Therapeutic Resources 2,768 27.2% $1,481,261 0.6% Daily Living Skills Training 150 1.5% $1,083,878 0.5% Day Center Services 197 1.9% $1,564,348 0.7% Day Treatment Medical 21 0.2% $65,954 0.0% Energy/Housing 272 2.7% $152,785 0.1% Equipment and Supplies 7,765 76.3% $7,054,061 3.1% Financial Management services 1,466 14.4% $1,193,324 0.5% Home Health/Nursing 1,647 16.2% $9,960,313 4.3% Meals 2,663 26.2% $4,101,278 1.8% Nursing Home/ICF-MR 2,035 20.0% $40,506,230 17.6% Other LTC Services 575 5.7% $240,041 0.1% Pre-Vocational Training 89 0.9% $260,160 0.1% Recreational Activities 51 0.5% $14,289 0.0% Respite 202 2.0% $547,921 0.2% Supported Employment 95 0.9% $736,469 0.3% Supportive Home Care 5,758 56.6% $40,549,564 17.6% Transportation 5,196 51.1% $4,611,608 2.0% Total Unduplicated 10,172 $230,046,600
Source: Encounter data submitted by each MCO The distribution of services provided by Family Care Programs from January 1, 2007 through December 31, 2007 utilizes the common procedure and revenue codes within the encounter coding system. The distribution of service expenditures correlates only partially with the distribution of members who received these services during the year. Expenditure levels are explainable by the duration and quantities of providing the services to MCO members, and to the per-unit costs of the services.
Table 24a: Top Services Provided to Frail Elder Family Care Members during 2007

49
Table 24b: Top Services Provided to Frail Elder Family Care Partnership Members during 2007
Long-Term Care Services Number of Members Served
Percent of Members Served Expenditures Percent of
Expenditures
Adult Day Care/Day Center 1,062 32.9% $6,573,962 4.3% Case Management 3,225 100.0% $16,220,957 10.7% CBRF, AFH, GH 545 16.9% $16,460,845 10.8% Consumer Directed Supports* Equipment & Supplies 2,002 62.1% $5,030,149 3.3% Home Health/Nursing 418 13.0% $588,557 0.4% Meals 571 17.7% $252,992 0.2% Nursing Home 792 24.6% $18,211,855 12.0% Other LTC Services 3,225 100.0% $13,878,159 9.1% Recreational Activities 108 3.3% $176,763 0.1% Respite 11 0.3% $16,535 0.0% Supportive Home Care 547 17.0% $1,439,921 0.9% Transportation 2,795 86.7% $5,605,684 3.7%
Total LTC Service Costs $84,456,379 Acute Care Services Anesthesia 3,225 100.0% $4,872,843 3.2% Dental 2,291 71.0% $1,146,110 0.8% E&M Care (Office calls, NH, Hosp Visits) 3,225 100.0% $4,983,416 3.3% ER 1,495 46.4% $1,817,891 1.2% Inpatient Hospital 1,065 33.0% $18,279,888 12.0% Medications 3,225 100.0% $13,887,430 9.1% MH & AODA Outpatient Therapy 869 26.9% $666,799 0.4% Nutrition Intervention/Counseling 1,199 37.2% $464,238 0.3% Physician Pathology & Lab 3,225 100.0% $1,450,870 1.0% Physician Radiology 2,803 86.9% $2,674,100 1.8% Physician Surgery 3,225 100.0% $8,290,503 5.4% Physician/other medical services 3,225 100.0% $7,530,863 4.9%
Total Acute Care Service Costs $66,064,951 Total Acute & LTC Service Costs $150,521,330
Notes: *Consumer Directed Supports started in Partnership in late 2007 & has minimal history. A portion of some long-term care services are paid as an acute care service. A good example is a nursing home stay for reha-bilitation. A portion of some acute care services are paid as long-term care services. A good example is the inpatient hospital deductible.

50
Table 25: Use of Purchased Residential Services for Frail Elders during 2007 Percent of total member-days spent in residential settings
Family Care Percent of Total Eligible Days
Natural (non-purchased) residential settings 63.2% Group residences 26.8% Nursing facilities 10.0% Total 100.0% FC-Partnership Natural (non-purchased) residential settings 77.5% Group residences 15.0% Nursing facilities 7.5% Total 100.0%
Table 26: Changes in Employment Status during 2007 (Refers to Table 17 in main report)
Year-later Employment Status of Unemployed Members who Desired Employment on Earlier Screen
Family Care FE (N=36)
FC-Partnership FE (N=11)
Now Have a Job, Satisfied 5.6% 0.0%
No Longer Desire Employment, Satisfied 33.3% 27.3% Not Satisfied: Still Unemployed or Employed in an Unsatisfactory Job 61.1% 72.7% Total 100.0% 100.0%
Year-later Employment Status of Retired Members on Earlier Screen Family Care FE (N=3992)
FC-Partnership FE (N=1215)
No Change: Still Retired and Satisfied 99.1% 99.1%
Now Have Employment and Satisfied 0.1% 0.2% Not Satisfied: Still Retired but Desiring Employment 0.8% 0.7% Total 100.0% 100.0%
Year-later Employment Status of Members who were employed and satisfied with job on Earlier Screen
Family Care FE (N=125)
FC-Partnership FE (N=18)
No Change: Still Employed in Desired Job 82.4% 77.8%
Now Retired or Unemployed but Satisfied 15.2% 22.2%
Now Out of a Job or Desiring a Different One 2.4% 0.0% Total 100.0% 100.0%
Source: Functional screen completed for each member during 2007, compared with functional screens from one year earlier. Note: The information is collected from the screener and may include errors. The member is answering questions regarding employment and desire of employment without full knowledge of ramifications.
Source: Encounter data submitted by each MCO.
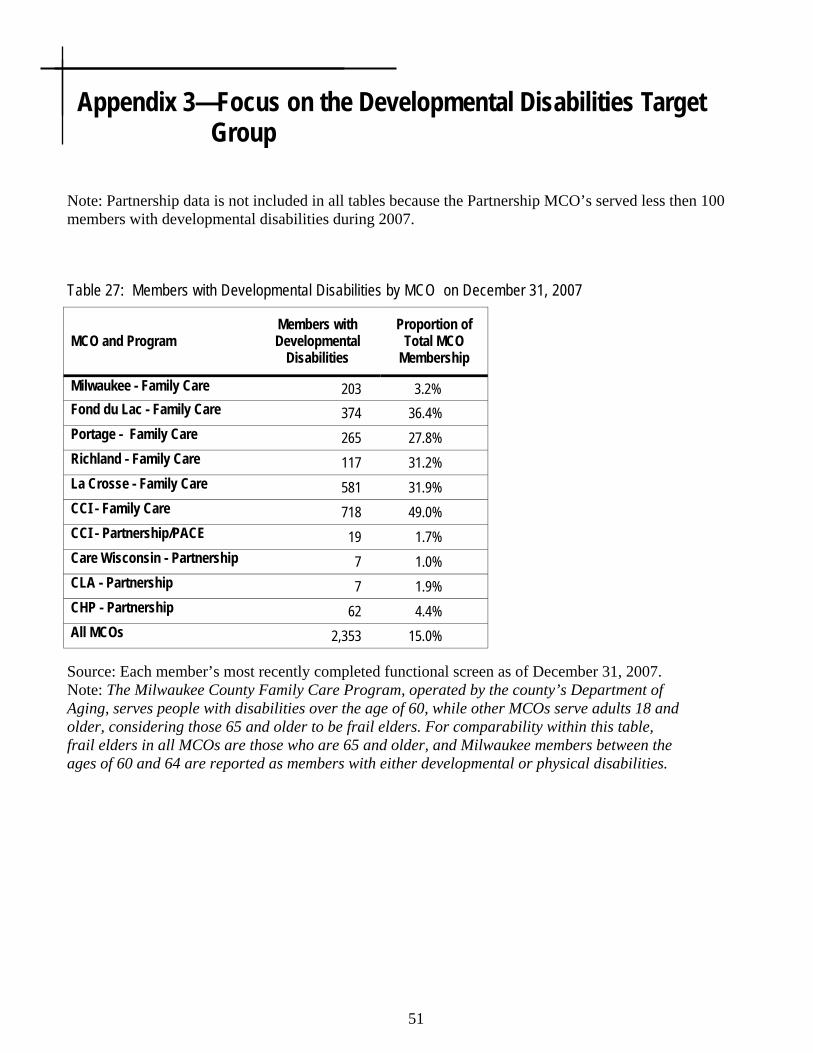
51
Appendix 3—Focus on the Developmental Disabilities Target Group
Source: Each member’s most recently completed functional screen as of December 31, 2007. Note: The Milwaukee County Family Care Program, operated by the county’s Department of Aging, serves people with disabilities over the age of 60, while other MCOs serve adults 18 and older, considering those 65 and older to be frail elders. For comparability within this table, frail elders in all MCOs are those who are 65 and older, and Milwaukee members between the ages of 60 and 64 are reported as members with either developmental or physical disabilities.
Table 27: Members with Developmental Disabilities by MCO on December 31, 2007
MCO and Program Members with Developmental
Disabilities
Proportion of Total MCO
Membership
Milwaukee - Family Care 203 3.2% Fond du Lac - Family Care 374 36.4% Portage - Family Care 265 27.8% Richland - Family Care 117 31.2% La Crosse - Family Care 581 31.9% CCI - Family Care 718 49.0% CCI - Partnership/PACE 19 1.7% Care Wisconsin - Partnership 7 1.0% CLA - Partnership 7 1.9% CHP - Partnership 62 4.4% All MCOs 2,353 15.0%
Note: Partnership data is not included in all tables because the Partnership MCO’s served less then 100 members with developmental disabilities during 2007.

52
Family Care Partnership Preferred Residence
Current Residence Prefers to live in Home Setting
Prefers to live in Residential
Prefers to live in Institutional
Prefers to live in Other setting
Currently lives in Home Setting 96% 0% 0% 4%
Currently lives in Residential 43% 57% 0% 0%
Currently lives in Institutional 67% 0% 33% 0%
Currently lives in Other setting 100% 0% 0% 0%
Total Percent of members cur-rently living in preferred setting 96% 57% 33% 0%
Table 28: Current and Preferred Living Situation for Members with Developmental Disabilities All Members Active on December 31, 2007.
Family Care Preferred Residence
Current Residence Prefers to live in Home Setting
Prefers to live in Residential
Prefers to live in Institutional
Prefers to live in Other setting
Currently lives in Home Setting 92% 1% 0% 7%
Currently lives in Group Setting 11% 65% 0% 25%
Currently lives in Nursing facility 27% 27% 19% 27%
Currently lives in Other setting 36% 43% 0% 21%
Total Percent of members cur-rently living in preferred setting 92% 65% 19% 21%
Source: Each member’s most recently completed functional screen, as of December 31, 2007.

53
Table 29: Most Common Health Diagnoses Among Members with Developmental Disabilities on December 31, 2007 Diagnoses affecting 10% or more of Family Care and/or Family Care Partnership members List is alphabetical. Common Health Diagnosis FC FC-Partnership Allergies 17.6% 16.9% Anemia/Coagulation Defects 2.9% 20.2% Angina/Coronary Artery Disease 1.3% 12.4% Anxiety Disorder 15.3% 42.7% Arthritis 8.0% 33.7% Asthma 9.1% 29.2% Behavioral Diagnoses 10.6% 9.0% Blood/Lymph Disorders 2.1% 15.7% Brain Injury Onset age 22 5.5% 11.2% Cerebral Palsy 16.7% 19.1% Chronic Pain/Fatigue 7.1% 38.2% Contractures/Connective Tissue 4.1% 12.4% Depression 16.8% 57.3% Diabetes Mellitus 9.2% 30.3% Heart Rate Disorders 2.2% 13.5% Digestive Disorders3 20.7% 51.7% Disorders GU System 5.9% 32.6% Hip/Bone Fracture 10.5% 3.4% Hypertension 13.4% 50.6% Hypo/HyperThyroidism 10.9% 16.9% Intellectual Disability 81.6% 32.6% Nerve Disorders4 7.7% 36.0% Nutritional Imbalances 11.9% 51.7% Osteoporosis 3.2% 16.9% Other Brain Disorders 5.7% 20.2% Other Diagnoses 12.5% 58.4% Other Heart Conditions 5.4% 18.0% Other Mental Illness 13.9% 21.3% Other Sensory Disorders 6.7% 11.2% Otherwise Meets State/Fed DD 9.9% 34.8% Respiratory Disorder 6.4% 10.1% Seizure Disorder After age 22 2.8% 11.2% Seizure Disorder Onset age 22 23.9% 30.3% Skin Diseases 6.9% 21.3% Urinary Tract Infection 1.6% 10.1% Visual Impairment5 8.5% 20.2%
Source: Each member’s most recently completed functional screen as of December 31, 2007.

54
Table 30: Multiple Diagnoses Among Members with Developmental Disabilities on December 31, 2007
MCO and Program Family Care FC-Partnership
0-4 Diagnoses 50.4% 4.5% 5-9 Diagnoses 33.6% 37.1% 10+ Diagnoses 16.0% 58.4%
Total 100.0% 100.0%
Family Care
No. of Members with Developmental
Disabilities
Percent of Members with Developmental
Disabilities
Retired 31 1.5%
Working 1,199 58.3% Not Working 825 40.1%
FC-Total 2,055 100.0% FC-Partnership
Retired 5 5.6% Working 13 14.4%
Not Working 72 80.0%
FC-Partnership Total 90 100.0%
Table 31: Employment Status Among Members with Developmental Disabilities on December 31, 2007
Source: Each member’s most recently completed functional screen as of December 31, 2007.
Source: Each member’s most recently completed functional screen as of December 31, 2007.

55
Number of Members Served
Percent of Members Served
Expenditures Percent of Expenditures
Adult Day Care 49 2.3% $246,094 0.4% Case/Care Management 2,129 100.0% $6,310,383 9.6% CBRF. AFH, RCAC 955 44.9% $30,575,138 46.7% Community Support Program 4 0.2% $20,359 0.0% Counseling and Therapeutic Resources 407 19.1% $347,864 0.5% Daily Living Skills Training 534 25.1% $3,008,772 4.6% Day Center Services 486 22.8% $3,629,144 5.5% Day Treatment Medical 15 0.7% $22,550 0.0% Energy/Housing 15 0.7% $8,083 0.0% Equipment and Supplies 932 43.8% $1,073,170 1.6% Financial Management services 521 24.5% $171,670 0.3% Home Health/Nursing 262 12.3% $2,635,862 4.0% Meals 54 2.5% $39,799 0.1% Nursing Home/ICF-MR 146 6.9% $1,407,666 2.2% Other LTC Services 102 4.8% $71,484 0.1% Pre-Vocational Training 610 28.7% $4,357,521 6.7% Recreational Activities 126 5.9% $30,354 0.0% Respite 398 18.7% $1,316,097 2.0% Supported Employment 533 25.0% $2,409,374 3.7% Supportive Home Care 558 26.2% $5,327,419 8.1% Transportation 1,115 52.4% $2,434,602 3.7% Total Unduplicated 2,129 $65,443,413
Table 32: Top Services Provided to Family Care Members with Developmental Disabilities during 2007
Source: Encounter data submitted by each MCO The distribution of services provided by Family Care Programs from January 1, 2007 through December 31, 2007 utilizes the common procedure and revenue codes within the encounter coding system. The distribution of service expenditures correlates only partially with the distribution of members who received these services during the year. Expenditure levels are explainable by the duration and quantities of providing the services to MCO members, and to the per-unit costs of the services.

56
Table 33: Use of Purchased Residential Services for Members with Developmental Disabilities during 2007 Percent of Total Member-Days Spent in Residential Settings
Family Care Percent of Total Eligible Days
Natural (non-purchased) residential settings 61.2% Group residences 37.4% Nursing facilities 1.4% Total 100.0%
Table 34: Changes in Employment Status for members with Developmental Disabilities during 2007 (Refers to Tables 17 in main report)
Year-later Employment Status of Unemployed Members who Desired Employment on Earlier Screen
Family Care DD (N=182)
FC-Partnership DD (N=13)
Now Have a Job, Satisfied 24.7% 15.4%
No Longer Desire Employment, Satisfied 13.2% 23.1%
Not Satisfied: Still Unemployed or Employed in an Unsatisfactory Job 62.1% 61.5% Total 100.0% 100.0%
Year-later Employment Status of Retired Members on Earlier Screen Family Care DD (N=25)
FC-Partnership DD (N=1)
No Change: Still Retired and Satisfied 100.0% 100.0%
Now Have Employment and Satisfied 0.0% 0.0% Not Satisfied: Still Retired but Desiring Employment 0.0% 0.0% Total 100.0% 100.0%
Year-later Employment Status of Members who were employed and satisfied with job on Earlier Screen
Family Care DD (N=718)
FC-Partnership DD (N=5)
No Change: Still Employed in Desired Job 88.9% 20.0%
Now Retired or Unemployed but Satisfied 3.8% 40.0%
Now Out of a Job or Desiring a Different One 7.4% 40.0% Total 100.0% 100.0%
Source: Encounter data submitted by each MCO.
Source: Functional screen completed for each member during 2007, compared with functional screens from one year earlier. Note: The information is collected from the screener and may include errors. The member is answering questions regarding employment and desire of employment without full knowledge of ramifications.

57
Appendix 4—Focus on Physical Disabilities Target Group
Table 35: Members with Physical Disabilities by MCO on December 31, 2007
MCO and Program Members
with Physical
Disabilities
Proportion of Total MCO
Membership
Milwaukee - Family Care 790 12.3% Fond du Lac - Family Care 169 16.4% Portage - Family Care 215 22.6% Richland - Family Care 81 21.6% La Crosse - Family Care 543 29.8% CCI - Family Care 326 22.3% CCI - Partnership/PACE 261 23.7% Care Wisconsin - Partnership 79 11.3% CLA - Partnership 331 89.9% CHP - Partnership 473 33.5% All MCOs 3,269 21.0%
Source: Each member’s most recently completed functional screen as of December 31, 2007. Note: The Milwaukee County Family Care Program, operated by the county’s Department of Aging, serves people with disabilities over the age of 60, while other MCOs serve adults 18 and older, considering those 65 and older to be frail elders. For comparability within this table, frail elders in all MCOs are those who are 65 and older, and Milwaukee members between the ages of 60 and 64 are reported as members with either developmental or physical disabilities.

58
Family Care Partnership Preferred Residence
Current Residence Prefers to live in Home Setting
Prefers to live in Residential
Prefers to live in Institutional
Prefers to live in Other setting
Currently lives in Home Setting 99% 0% 0% 1%
Currently lives in Residential 31% 62% 3% 5%
Currently lives in Institutional 69% 14% 10% 7%
Currently lives in Other setting 54% 18% 0% 29%
Total Percent of members cur-rently living in preferred setting 99% 62% 10% 29%
Table 36: Current and Preferred Living Situation for Members with Physical Disabilities All Members Active on December 31, 2007.
Family Care Preferred Residence
Current Residence Prefers to live in Home Setting
Prefers to live in Residential
Prefers to live in Institutional
Prefers to live in Other setting
Currently lives in Home Setting 99% 0% 0% 0%
Currently lives in Group Setting 26% 67% 0% 7%
Currently lives in Nursing facility 54% 11% 28% 7%
Currently lives in Other setting 57% 25% 0% 18%
Total Percent of members cur-rently living in preferred setting 99% 67% 28% 18%
Source: Each member’s most recently completed functional screen as of December 31, 2007.

59
Table 37: Most Common Health Diagnoses Among Members with Physical Disabilities on December 31, 2007 Diagnoses affecting 10% or more of Family Care and/or Family Care Partnership members List is alphabetical.
Common Health Diagnosis FC FC-Partnership Alcohol or Drug Abuse 12.0% 16.5% Allergies 18.4% 20.5% Anemia/Coagulation Defects 10.5% 24.9% Angina/Coronary Artery Disease 13.3% 23.4% Anxiety Disorder 25.7% 40.3% Arthritis 34.5% 48.6% Asthma 27.9% 45.5% Blood/Lymph Disorders 10.8% 24.6% Brain Injury After age 22 5.6% 2.7% Cerebral Vascular Accident 11.9% 15.7% Chronic Pain/Fatigue 42.7% 60.3% Congestive Heart Failure 7.6% 14.7% Depression 54.5% 65.9% Diabetes Mellitus 33.5% 43.0% Digestive Disorders3 40.5% 62.5% Disorders GU System 16.4% 31.5% Heart Rate Disorders 7.1% 12.3% Hip/Bone Fracture 19.3% 3.8% Hypertension 44.6% 63.2% Hypo/HyperThyroidism 15.3% 17.1% Nerve Disorders4 28.1% 41.1% Nutritional Imbalances 33.0% 56.3% Osteoporosis 9.0% 14.7% Other Diagnoses 27.7% 54.3% Other Heart Conditions 7.0% 15.8% Other Mental Illness 12.0% 18.5% Other Sensory Disorders 7.4% 11.7% Renal Failure/Kidney Disease 10.7% 15.3% Reproductive System Disorders 3.7% 10.0% Respiratory Disorder 16.5% 25.1% Skin Diseases 6.5% 17.2% Urinary Tract Infection 5.3% 11.8% Visual Impairment5 15.1% 23.4%
Source: Each member’s most recently completed functional screen as of December 31, 2007.

60
Table 38: Multiple Diagnoses Among Members with Physical Disabilities on December 31, 2007
MCO and Program Family Care FC-Partnership 0-4 Diagnoses 33.6% 7.3% 5-9 Diagnoses 32.8% 32.0% 10+ Diagnoses 33.6% 60.7%
Total 100.0% 100.0%
Family Care No. of Members with Physical Disabilities
Percent of Members with
Physical Disabilities
Retired 93 7.0%
Working 163 12.0% Not Working 1082 81.0%
FC-Total 1,338 100.0% FC-Partnership
Retired 85 8.4% Working 62 6.1%
Not Working 869 85.5%
FC-Partnership Total 1,016 100.0%
Table 39: Employment Status Among Members with Physical Disabilities on December 31, 2007
Source: Each member’s most recently completed functional screen as of December 31, 2007.
Source: Each member’s most recently completed functional screen as of December 31, 2007.

61
Number of Members Served
Percent of Members Served
Expenditures Percent of Expenditures
Adult Day Care 39 2.5% $111,777 0.5% Case/Care Management 1,544 100.0% $5,375,799 22.0% CBRF, AFH, RCAC 251 16.3% $4,891,778 20.0% Community Support Program 10 0.6% $79,120 0.3% Counseling and Therapeutic Resources 591 38.3% $526,637 2.2% Daily Living Skills Training 119 7.7% $494,228 2.0% Day Center Services 37 2.4% $72,499 0.3% Day Treatment Medical 17 1.1% $21,519 0.1% Energy/Housing 42 2.7% $26,512 0.1% Equipment and Supplies 1,220 79.0% $1,693,687 6.9% Financial Management services 236 15.3% $61,194 0.2% Home Health/Nursing 437 28.3% $3,019,663 12.3% Meals 284 18.4% $229,048 0.9% Nursing Home/ICF-MR 260 16.8% $2,397,516 9.8% Other LTC Services 111 7.2% $92,063 0.4% Pre-Vocational Training 49 3.2% $218,490 0.9% Recreational Activities 56 3.6% $13,410 0.1% Respite 66 4.3% $198,016 0.8% Supported Employment 22 1.4% $47,369 0.2% Supportive Home Care 917 59.4% $4,316,930 17.6% Transportation 633 41.0% $599,694 2.4% Total Unduplicated 1,544 $24,486,959
Table 40a: Top Services Provided to Family Care Members with Physical Disabilities during 2007
Source: Encounter data submitted by each MCO The distribution of services provided by Family Care Programs from January 1, 2007 through December 31, 2007 utilizes the common procedure and revenue codes within the encounter coding system. The distribution of service expenditures correlates only partially with the distribution of members who received these services during the year. Expenditure levels are explainable by the duration and quantities of providing the services to MCO members, and to the per-unit costs of the services.

62
Table 40b: Top Services Provided to Family Care Partnership Members with Physical Disabilities during 2007
Long-Term Care Services Number of Members Served
Percent of Members Served Expenditures Percent of
Expenditures
Adult Day Care/Day Center 15 1.7% $96,652 0.3% Case Management 880 100.0% $2,546,445 8.9% CBRF, AFH, GH 29 3.3% $648,653 2.3% Consumer Directed Supports* Equipment & Supplies 363 41.3% $1,017,372 3.5% Home Health/Nursing 144 16.4% $755,436 2.6% Meals 167 19.0% $50,190 0.2% Nursing Home 83 9.4% $1,736,832 6.1% Other LTC Services 880 100.0% $3,786,909 13.2% Recreational Activities 104 11.8% $33,294 0.1% Respite 3 0.3% $8,000 0.0% Supportive Home Care 171 19.4% $757,744 2.6% Transportation 555 63.1% $867,151 3.0%
Total LTC Service Costs $12,304,678 Acute Care Services
Anesthesia 636 72.3% $1,300,066 4.5% Dental 322 36.6% $315,226 1.1% E&M Care (Office calls, NH, Hosp Visits) 621 70.6% $771,816 2.7% ER 358 40.7% $435,321 1.5% Inpatient Hospital 233 26.5% $4,689,312 16.3% Medications 643 73.1% $4,487,344 15.6% MH & AODA Outpatient Therapy 315 35.8% $326,726 1.1% Nutrition Intervention/Counseling 16 1.8% $7,312 0.0% Physician Pathology & Lab 588 66.8% $255,272 0.9% Physician Radiology 534 60.7% $458,960 1.6% Physician Surgery 633 71.9% $1,959,908 6.8% Physician/other medical services 880 100.0% $3,739,324 13.0%
Total Acute Care Service Costs $18,746,587 Total Acute and LTC Service Costs $31,051,265
Notes: *Consumer Directed Supports started in Partnership in late 2007 & has minimal history. A portion of some long-term care services are paid as an acute care service. A good example is a nursing home stay for reha-bilitation. A portion of some acute care services are paid as long-term care services. A good example is the inpatient hospital deductible.
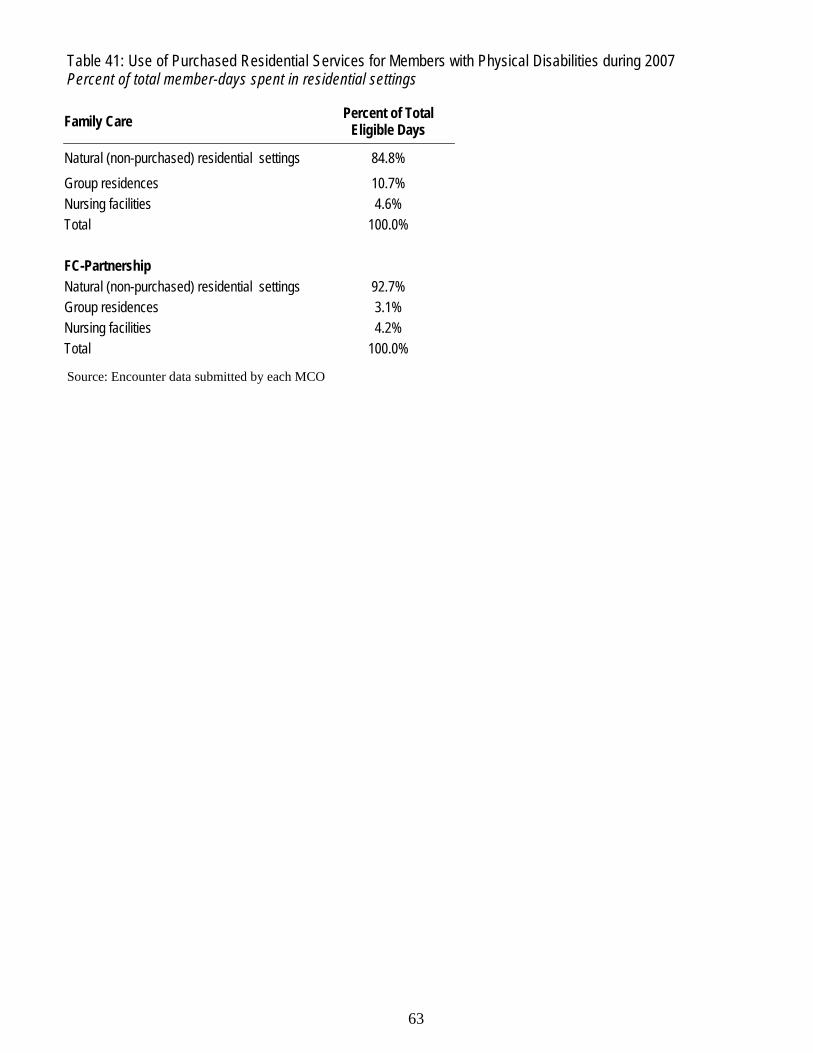
63
Table 41: Use of Purchased Residential Services for Members with Physical Disabilities during 2007 Percent of total member-days spent in residential settings
Family Care Percent of Total Eligible Days
Natural (non-purchased) residential settings 84.8% Group residences 10.7% Nursing facilities 4.6% Total 100.0% FC-Partnership Natural (non-purchased) residential settings 92.7% Group residences 3.1% Nursing facilities 4.2% Total 100.0%
Source: Encounter data submitted by each MCO
64
Table 42: Changes in Employment Status for Members with Physical Disabilities during 2007 (Refers to Table 17 in main report)
Year-later Employment Status of Unemployed Members who Desired Employment on Earlier Screen
Family Care PD (N=124)
FC-Partnership PD (N=89)
Now Have a Job, Satisfied 2.4% 0.0%
No Longer Desire Employment, Satisfied 31.5% 23.6%
Not Satisfied: Still Unemployed or Employed in an Unsatisfactory Job 66.1% 76.4% Total 100.0% 100.0%
Year-later Employment Status of Retired Members on Earlier Screen Family Care
PD(N=60) FC-Partnership
PD (N=43)
No Change: Still Retired and Satisfied 98.3% 100.0%
Now Have Employment and Satisfied 1.7% 0.0% Not Satisfied: Still Retired but Desiring Employment 0.0% 0.0% Total 100.0% 100.0%
Year-later Employment Status of Members who were employed and satisfied with job on Earlier Screen
Family Care PD (N=86)
FC-Partnership PD (N=33)
No Change: Still Employed in Desired Job 79.1% 72.7%
Now Retired or Unemployed but Satisfied 10.5% 21.2%
Now Out of a Job or Desiring a Different One 10.5% 6.1% Total 100.0% 100.0%
Source: Functional screen completed for each member during 2007, compared with functional screens from one year earlier. Note: The information is collected from the screener and may include errors. The member is answering questions regarding employment and desire of employment without full knowledge of ramifications.

65
Appendix 5—Additional Data on Members with Mental Health/ Substance Abuse Issue
Table 43: Family Care Members by Target Group with Mental Health and Substance Abuse Diagnoses on December 31, 2007
Frail Elder Members with Developmental
Members with Physical
Anxiety 2,480 348 750
Depression 4,366 392 1,393
Bipolar 316 72 177
Schizophrenia 698 139 135
Other MH 812 301 348
SA 614 56 326
Behavioral 140 223 71
All 9,426 1,531 3,200
Note: Members are counted in the totals for each diagnosis they have, and members may have more than one listed diagnosis.
While the statutes governing Family Care programs limit eligibility to frail elders and to those adults who have a physical disability or a developmental disability, many individuals with these disabilities, just like people without disabilities, also experience issue with mental health or with substance abuse.
Some mental health or substance abuse issues are more prevalent among people with disabilities than in the general population. For example, major depressive disorder affects approximately 6.7 percent of the U.S. population age 18 and older at any given time, but 19.2 percent of the individuals who enrolled in Family Care during 2007 reported a diagnosis of depression at the time of their enrollment.
In addition to the disabilities that qualified them for Family Care membership, more than six percent of the new enrollees had relatively manageable chronic mental illnesses such as schizophrenia and bipolar disorder, while 10.5 percent had harder-to-manage diagnoses such as personality disorders or serious sub-stance abuse issues.
For these reasons and others, it is sometimes useful to look specifically at the subgroup of Family Care members with mental health or substance abuse issues. Table 43 show the number of members in each pro-grams’ three target groups who also have mental health (MH) or substance abuse (SA) issues.

66
Family Care Partnership Preferred Residence
Current Residence Prefers to live in Home Setting
Prefers to live in Residential
Prefers to live in Institutional
Prefers to live in Other setting
Currently lives in Home Setting 97% 0% 0% 3%
Currently lives in Residential 22% 45% 0% 34%
Currently lives in Institutional 38% 9% 27% 26%
Currently lives in Other setting 64% 18% 9% 9%
Total Percent of members cur-rently living in preferred setting 97% 45% 27% 9%
Table 44: Current and Preferred Living Situation for Members with Mental Health/Substance Abuse All Members Active on December 31, 2007.
Family Care Preferred Residence
Current Residence Prefers to live in Home Setting
Prefers to live in Residential
Prefers to live in Institutional
Prefers to live in Other setting
Currently lives in Home Setting 98% 1% 0% 1%
Currently lives in Group Setting 15% 66% 0% 18%
Currently lives in Nursing facility 27% 12% 39% 21%
Currently lives in Other setting 77% 8% 0% 14%
Total Percent of members cur-rently living in preferred setting 98% 66% 39% 14%
Source: Each member’s most recently completed functional screen as of December 31, 2007.

67
Table 45a: Most Common Health Diagnoses Among Members with Mental Health/Substance Abuse on December 31, 2007 Diagnoses affecting 10% or more of Family Care and/or Family Care Partnership members List is alphabetical.
Common Health Diagnosis FC FC-Partnership Allergies 19.8% 29.1% Alzheimer Other Dementia 28.6% 28.0%
Anemia/Coagulation Defects 18.0% 35.3%
Angina/Coronary Artery Disease 24.4% 37.9% Arthritis 55.8% 67.4% Asthma 28.5% 42.8% Blood/Lymph Disorders 15.6% 36.0% Cancer 10.9% 14.6% Cerebral Vascular Accident 16.3% 19.3% Chronic Pain/Fatigue 38.4% 55.1% Congestive Heart Failure 16.8% 24.6% Dehydration/Fluid Imbalance 5.3% 13.6% Diabetes Mellitus 33.4% 38.5% Digestive Disorders3 49.8% 76.7% Disorders GU System 23.8% 43.9% Heart Rate Disorders 14.9% 24.7% Hip/Bone Fracture 30.3% 40.6% Hypertension 63.4% 76.2% Hypo/HyperThyroidism 18.9% 21.7% Intellectual Disability 17.0% 1.6% Nerve Disorders4 23.2% 42.0% Nutritional Imbalances 42.8% 66.0% Osteoporosis 17.4% 29.7% Other Heart Conditions 11.3% 22.7% Other Infectious Diseases 4.0% 10.5% Other Sensory Disorders 13.8% 21.7% Renal Failure/Kidney Disease 11.4% 25.5% Reproductive System Disorders 4.6% 10.1% Respiratory Disorders 17.5% 31.5% Skin Diseases 7.7% 21.4% Urinary Tract Infection 9.4% 16.4% Visual Impairment5 34.5% 48.2%
Source: Each member’s most recently completed functional screen as of December 31, 2007.

68
Table 46: Multiple Diagnoses Among Members with Mental Health/Substance Abuse on December 31, 2007
MCO and Program Family Care FC-Partnership
0-4 Diagnoses 10.4% 1.3% 5-9 Diagnoses 41.7% 17.3% 10+ Diagnoses 47.9% 81.5%
Total 100.0% 100.0%
Family Care No. of Members
with MH/SA Percent of
Members with MH/SA FC-Partnership
No. of Members with MH/SA
Percent of Members with
MH/SA
Retired 3222 49.9% Retired 1194 50.5%
Working 686 10.6% Working 68 2.9% Not Working 2552 39.5% Not Working 1103 46.6%
FC-Total 6,460 100.0% FC-Partnership Total 2,365 100.0%
Table 47: Employment Status Among Members with Mental Health/Substance Abuse on December 31, 2007
MCO and Program Anxiety Depression Bipolar Schizophrenia Other MH Substance Abuse Behavioral
Milwaukee - Family Care 19.8% 36.0% 3.0% 7.7% 7.8% 6.1% 1.3% Fond du Lac - Family Care 24.8% 35.6% 2.6% 5.5% 9.5% 5.0% 5.1% Portage - Family Care 19.0% 38.6% 4.4% 3.9% 6.4% 3.6% 5.9% Richland - Family Care 22.4% 37.2% 5.4% 4.3% 8.1% 5.9% 1.6% La Crosse - Family Care 18.8% 37.4% 3.7% 4.8% 11.1% 6.5% 3.9% CCI - Family Care 15.8% 22.4% 4.0% 7.7% 9.7% 2.9% 5.6% CCI - Partnership/PACE 27.3% 52.7% 4.0% 7.5% 9.3% 11.4% 2.5% Care Wisconsin - Partnership 34.9% 54.6% 4.0% 3.7% 5.7% 7.8% 1.1% CLA - Partnership 28.5% 59.0% 4.6% 3.0% 10.9% 15.2% 1.1% CHP - Partnership 40.8% 56.6% 4.8% 3.7% 17.6% 7.5% 3.4% All MCOs 23.0% 39.5% 3.6% 6.2% 9.4% 8.8% 2.8%
Table 45b: Percentage of Family Care Members with Mental Health and Substance Abuse Diagnoses on December 31, 2007
Note: Members are counted in the totals for each diagnosis they have, and members may have more than one listed diagnosis.
Source: Each member’s most recently completed functional screen as of December 31, 2007.
Source: Each member’s most recently completed functional screen as of December 31, 2007.

69
Number of Members Served
Percent of Members Expenditures Percent of
Expenditures
Adult Day Care 521 7.1% $2,488,243 1.3% Case/Care Management 7,330 100.0% $28,207,778 14.8% CBRF, AFH, RCAC 2,821 38.5% $72,747,626 38.2% Community Support Program 18 0.2% $98,477 0.1% Counseling and Therapeutic Resources 2,251 30.7% $1,512,872 0.8% Daily Living Skills Training 435 5.9% $2,576,010 1.4% Day Center Services 372 5.1% $2,750,155 1.4% Day Treatment Medical 51 0.7% $109,214 0.1% Energy/Housing 192 2.6% $105,399 0.1% Equipment and Supplies 5,235 71.4% $5,118,835 2.7% Financial Management services 1,496 20.4% $1,025,168 0.5% Home Health/Nursing 1,201 16.4% $6,629,644 3.5% Meals 1,510 20.6% $2,230,699 1.2% Nursing Home/ICF-MR 1,503 20.5% $31,756,357 16.7% Other LTC Services 503 6.9% $292,628 0.2% Pre-Vocational Training 370 5.0% $2,114,672 1.1% Recreational Activities 131 1.8% $24,432 0.0% Respite 332 4.5% $1,071,210 0.6% Supported Employment 293 4.0% $1,265,199 0.7% Supportive Home Care 3,596 49.1% $24,625,104 12.9% Transportation 3,851 52.5% $3,808,479 2.0% Total Unduplicated 7,330 $190,558,212
Table 48a: Top Services Provided to Family Care Members with Mental Health/Substance Abuse during 2007
Table 48b: Top Services Provided to Family Care Partnership Members with Mental Health/Substance Abuse during 2007
Source: Encounter data submitted by each MCO The distribution of services provided by Family Care Programs from January 1, 2007 through December 31, 2007 utilizes the common procedure and revenue codes within the encounter coding system. The distribution of service expenditures correlates only partially with the distribution of members who received these services during the year. Expenditure levels are explainable by the duration and quantities of providing the services to MCO members, and to the per-unit costs of the services.

70
Table 49: Use of Purchased Residential Services for Members with Mental Health/Substance Abuse during 2007 Percent of Total Member-Days Spent in Residential Settings
Family Care Percent of Total Eligible Days
Natural (non-purchased) residential settings 57.6% Group residences 31.6% Nursing facilities 10.7% Total 100.0% FC-Partnership Natural (non-purchased) residential settings Group residences Nursing facilities Total 100.0%
Table 50: Changes in Employment Status for Members with Mental Health/Substance Abuse during 2007 (Refers to Table 17 in main report)
Year-later Employment Status of Unemployed Members who Desired Employment on Earlier Screen
Family Care PD (N=210)
FC-Partnership MH/SA (N=81)
Now Have a Job, Satisfied 12.4% 2.5%
No Longer Desire Employment, Satisfied 26.7% 23.5%
Not Satisfied: Still Unemployed or Employed in an Unsatisfactory Job 61.0% 74.1% Total 100.0% 100.0%
Year-later Employment Status of Retired Members on Earlier Screen
Family Care MH/SA
(N=2093) FC-Partnership MH/SA (N=780)
No Change: Still Retired and Satisfied 98.9% 99.0%
Now Have Employment and Satisfied 0.1% 0.1% Not Satisfied: Still Retired but Desiring Employment 0.9% 0.9% Total 100.0% 100.0%
Year-later Employment Status of Members who were employed and satisfied with job on Earlier Screen
Family Care MH/SA (N=420)
FC-Partnership MH/SA (N=37)
No Change: Still Employed in Desired Job 81.4% 64.9%
Now Retired or Unemployed but Satisfied 9.3% 24.3%
Now Out of a Job or Desiring a Different One 9.3% 10.8% Total 100.0% 100.0%
Source: Encounter data submitted by each MCO
Source: Functional screen completed for each member during 2007, compared with functional screens from one year earlier. Note: The information is collected from the screener and may include errors. The member is answering questions regarding employment and desire of employment without full knowledge of ramifications.
71
List of Current Family Care, Partnership and PACE Managed Care Organizations and Contact Information Listed alphabetically by managed care organization corporate name. Information compiled on November 7, 2008
Care Wisconsin, Inc. 2802 International Lane
Madison WI 53704 Corporate: 608-240-0020
General Info: 800-963-0035 Member Services: 800-963-0035
TTY: WI Relay 711 24-Hour: 800-963-0035
Counties served: Columbia, Dane, Dodge, Jefferson, Green Lake, Marquette, Sauk, Wal-worth, Washington, Wau-kesha, Waushara
www.carewisc.org
Community Care of Central Wisconsin
3349 Church Street Suite 1 Stevens Point WI 54481
Corporate: 715-345-5968 General Info: 877-622-6700
Member Services: TTY: 715-344-2140
24-Hour: 715-345-5968
County served: Portage www.communitycareofcentralwisconsin.org
Community Care, Inc. 1555 S. Layton Blvd
Milwaukee WI 53215 Corporate: 414-385-6600
General Info: 866-992-6600 Member Services: 866-992-6600
TTY: 866-288-9909 24-Hour: 866-992-6600
Counties served: Kenosha, Milwaukee, Ozaukee, Racine, Washington, Sheboygan and Waukesha
www.cco-cce.org
Community Health Partnership 2240 East Ridge Center Eau Claire WI 54701
Corporate: 715-838-2900 General Info: 800-842-1814
Member Services: 800-842-1814 TTY: 715-838-2900
24-Hour: 800-842-1814
Counties served: Chippewa, Dunn, Eau Claire, Pierce, St Croix
www.communityhealthpartnership.com
Creative Care Options of Fond du Lac County 50 North Portland Street
Fond du Lac WI 54935-3412 Corporate: 920-906-5100
General Info: 877-227-3335 Member Services: 920-906-5100
TTY: 800-947-3529 24-Hour: 920-906-5177
County served: Fond du Lac www.fdlco.wi.gov
Milwaukee County Department of Aging
310 W. Wisconsin Avenue, 6th Floor East Milwaukee WI 53203
Corporate: 414-289-5950 General Info: 866-229-9695
Member Services: TTY: 414-289-8584 24-Hour: 414-289-6874
County served: Milwaukee www.county.milwaukee.gov/Familycare
Southwest Family Care Alliance (previously Richland County)
1900 Hwy. 14 East PO Box 111
Richland Center WI 53581 Corporate: 608-647-4729
General Info: 608-647-4729 Member Services:
TTY: 800-947-3529 24-Hour:
County served: Richland www.familycarealliance.org
Western Wisconsin Cares
1407 Saint Andrew St., Suite 100 La Crosse WI 54603
Corporate: 608-785-6266 General Info: 608-785-6266
Member Services: TTY: 608-785-9787 24-Hour:
County served: La Crosse www.wwcares.org

72
Wisconsin Department of Health Services Division of Long Term Care Office of Family Care Expansion P.O. Box 7851 Madison, Wisconsin 53707-7851 dhs.wisconsin.gov/LTCare December, 2008
Family Care Vision The result of Family Care expansion will be a complete rebalancing of Wisconsin’s long-term care system.
Aging and disability resource centers will endeavor to keep individuals financially inde-pendent and physically healthy by informing people of the long-term care service options available to them, providing healthy aging and prevention programs and if they need as-sistance, informing them of the publicly-funded long-term care programs that can help them.
The resource centers will help people through eligibility and enrollment in those pro-grams.
Every Wisconsin citizen who needs long-term care will have equal access to in-home ser-vices and institutional care and everything in-between with no waiting.
For every eligible person, self-directed options will be available – either within a managed care organization or through IRIS, our self-directed supports waiver.
Our contracts with managed care organizations and our monitoring will focus on perform-ance in achieving enrollees’ quality of life outcomes, including health and safety, commu-nity integration and self-determination and choice as well as fiscal integrity and cost ef-fectiveness.