
Long-Term Care: Consumers, Providers, and Financing
61
Long-Term Care: CONSUMERS, PROVIDERS, AND FINANCING A CHART BOOK Jane Tilly, Susan Goldenson, and Jessica Kasten URBAN INSTITUTE MARCH 2001
Transcript of Long-Term Care: Consumers, Providers, and Financing

Long-Term Care: CONSUMERS,
PROVIDERS,
AND FINANCING
A CHART BOOK
Jane Tilly, Susan Goldenson, and Jessica Kasten
URBAN INSTITUTE
MARCH 2001

2
URBAN INSTITUTE
2100 M Street NW
Washington, DC 20037
Phone (202) 261-5709
Fax (202) 728-0232
www.urban.org
The Urban Institute is a nonprofit, nonpartisan research and
educational organization that examines the social, economic,
and governance challenges facing the nation.
This report is available on the Urban Institute Web site or
by calling the Urban Institute Office of Public Affairs at
(202) 261-5709.
The views expressed in this report are those of the authors
and do not necessarily reflect the views of the Urban Institute,
its trustees, or its sponsors.

3
Long-Term Care:
Dear Reader:
Long-term care affects people of all ages. It refers to a wide range of supportive and health
services for those who are too ill or frail to care for themselves. The importance of long-term
care services to the public is growing for two major reasons. First, advances in medical care
are enabling those with disabilities who receive long-term care services to live longer. Second,
in coming decades long-term care services will be in greater demand due to the growing
population of older people, especially those in the oldest age categories.
Over the next several years, Congress may be called upon to address many unresolved
long-term care issues such as:• whether to offer more assistance to families and other unpaid caregivers, who provide
the bulk of long-term care assistance to people with disabilities;• whether to expand home and community-based services—the type of care that people
with disabilities tend to prefer over institutional care; and• how to combine public and private sources of financing for long-term care in ways that
are effective, equitable, and economical.
To give Congress the background information necessary to address some of these issues,
the Congressional Research Service (CRS) contracted with the Urban Institute to prepare,
in collaboration with CRS, a chart book on long-term care. The CRS report to Congress,
Long-Term Care Chart Book: Persons Served, Payors, and Spending, by Carol O’Shaughnessy,
Rachel Kelly, Gary Sidor, Susan Goldenson, Jessica Kasten, and me, was completed in May 2000.
This chart book is adapted from that report, and provides for the first time to the general
public recent and relevant federal and state data on long-term care consumers—children,
people with mental retardation or developmental disabilities, adults and older adults—paid
and unpaid providers, and public and private financing. As public debate over long-term care
policy unfolds, this chart book offers a comprehensive and easy to understand guide to the
demographic and financial landscape of long-term care services. We hope you find it useful.
Sincerely,
Jane Tilly, Dr. P.H.
Urban Institute
March 2001

4
Urban Institute authors would like to acknowledge and thank
CRS colleagues who co-authored the chart book for Congress,
specifically Carol O’Shaughnessy, Rachel Kelly, and Gary Sidor.
They would also like to thank those who provided data, com-
mented on presentation, and provided valuable insight: Bill
Marton, John Drabek, Mary Harahan,* and John Cutler, of the
Office of the Assistant Secretary for Planning and Evaluation,
U.S. Department of Health and Human Services
(OASPE/DHHS); Joshua Wiener and Korbin Liu of the Urban
Institute; Linda Frisch and Helen Lazenby of the Health Care
Financing Administration (HCFA); John Fleishman of the
Agency for Healthcare Research and Quality, DHHS; Ron
Manderscheid of the Substance Abuse and Mental Health
Services Administration, DHHS; Charlene Harrington of the
Department of Social and Behavioral Sciences, University of
California, San Francisco; K.C. Lakin of the Institute on
Community Integration, University of Minnesota; Susan
Coronel of the Health Insurance Association of America
(HIAA), and Marc Cohen of LifePlans, Inc.
Production of the chart book for Congress was made
possible in part through a grant from the Retirement Research
Foundation. The Retirement Research Foundation of Chicago,
founded by John D. McArthur, is one of the nation’s largest
foundations devoted solely to serving the needs of elderly
Americans and improving their quality of life. The Foundation
awards approximately $9 million in grants annually for
direct services and policy and medical research that support
independent living for older adults at home or in residential
settings; improve the quality of care at nursing homes; attract
and train skilled professionals to serve older adults; increase
understanding of the aging process and age-associated diseases;
and educate policymakers about the needs and capacities of
America’s seniors.
ACKNOWLEDGMENTS
This chart book was produced by the Urban Institute’s
Office of Public Affairs with generous support from Aetna Inc.,
a Fortune 50 company that provides more than 45 million
people worldwide with quality products, services, and
information. Aetna is the leading health and related benefits
organization, with 19.4 million health members, 14.6 million
dental members, and 11.5 million group insurance members,
including long-term care. Information about Aetna Inc. is
available at www.aetna.com.
*formerly of DHHS

5
CONTENTS
ACKNOWLEDGMENTS 4
DATA SOURCES 6
OVERVIEW 7
HELPFUL DEFINITIONS 8
CONSUMERS 9
Children 10
People with Mental Retardation/Developmental Disabilities 11
Adults 14
Older Adults 19
Trends in the Aging Population 20
PROVIDERS 23
Unpaid Caregivers 24
Home Health Care 27
Adult Day Services Programs 28
Institutional Settings 29
FINANCING 31
Overall Spending 34
Medicare 39
Medicaid 41
Medicaid Waivers for Home and
Community-Based Services 45
Private Long-Term Care Insurance 51
ADDITIONAL RESOURCES 56
ABOUT THE AUTHORS 59

6
DATA SOURCES
Data for the chart book have been culled from a wide
range of surveys and special studies. Data on persons
receiving care were drawn primarily from the 1994
National Health Interview Survey (NHIS) Disability
Supplement and the 1994 National Long-Term Care
Survey (NLTCS), and the Medical Expenditure Panel
Survey (MEPS).*
Data on long-term care expenditures were drawn
primarily from the Office of the Actuary, HCFA,
and special analyses. The Lewin Group drew
projections of future expenditures for long-term
care from special analyses for the Department of
Health and Human Services, Office of the Assistant
Secretary for Planning and Evaluation (DHHS/ASPE).
*As presented in W.D. Spector, et. al., The Characteristics of Long-Term Care Users, Agency for Healthcare Research and Quality,U.S. DHHS, 2000.

OVERVIEW
7
Long-Term Care:
The need for long-term care assistance affects people of all
ages, not just elderly populations. Accordingly, this chart book
provides relevant information on long-term care assistance for
all people with disabilities, using a variety of state and federal
data sources. Using this chart book, policymakers, researchers,
advocates, and practitioners will be able to understand the
scope of the long-term care system.
Information is organized into three major categories:
consumers, providers, and financing.
CONSUMERS
Children and adults with disabilities all use long-term care
services and are profiled in this chart book. Consumer profiles
are organized by age of children, presence of mental retardation
or developmental disability, age of adults. The chart book pays
special attention to the aging population due to its growing
impact on the demand for long-term care services.
PROVIDERS
Consumers receive long-term care services through a variety
of community-based and institutional care providers. This chart
book profiles services delivered by family and friends, or unpaid
caregivers, as well as services delivered by paid home health care
providers, adult day services programs, nursing homes, and
assisted living facilities.
FINANCING
Sources of public and private spending on long-term care
services include out-of-pocket spending and a variety of state
and federal programs. This chart book specifically illustrates
spending through Medicare, Medicaid and its waiver program
for home- and community-based services, and private long-
term care insurance.

8
HELPFUL DEFINITIONS
Activities of Daily Living, or ADLs, are activities necessary to carry out basic human functions, such as
bathing, dressing, eating, getting around inside the home, toileting, and transferring from a bed to a chair.
Instrumental Activities of Daily Living, or IADLs, are tasks necessary for independent community living,
including shopping, light housework, telephoning, money management, and meal preparation. IADLs are
sometimes used to measure a person’s need for assistance as a result of mental or cognitive disabilities.
Mental Retardation (MR) refers to low intellectual functioning and significant limitation in adaptive skills
(such as communication, self-care, direction, home and community living, social skills, health and safety,
and functional activities), which is present from childhood.
Developmental Disabilities (DD) are severe impairments due to physical or mental disabilities that are
manifested before the age of 22, will continue indefinitely, and result in substantial functional limitations
in major life activities.
Mental Disorder refers to 1) having a specific mental or emotional disorder within the past 12 months for
at least two weeks, having an occurrence of specific mental health symptoms such as frequent depression, or
using prescription medication for an ongoing mental or emotional condition during the past 12 months, and
2) a condition that seriously interferes with the ability to work, attend school, or manage day-to-day activities.
Those with mental disorders due to substance abuse are categorized differently.
Difficulty in learning includes having significant problems at school understanding materials, paying
attention in class, controlling behavior, or having a problem or delay in mental development, a problem
or delay in emotional development, or a reported learning disability.
Difficulty with communication includes difficulty for 12 months or more communicating with persons,
family or non-family, difficulty understanding others, or having a problem or delay in speech development.
Difficulty with mobility includes difficulty getting around the home and use of special equipment for a
period of 12 months or more, or having a physical delay.
Difficulty with self-care is defined as having difficulty for 12 months or more with bathing, dressing, eating,
or toileting.
Serious emotional disturbances are found in children who in the past 12 months have had a diagnosable
mental, behavioral, or emotional disorder that substantially interfered with their ability to participate in
family, school, or community activities. Substantial and extreme functional impairment are determined
by scores on a global functioning assessment scale.

CONSUMERS
9
Long-Term Care:
The need for long-term care is contingent on a person’s need
for assistance with activities of daily living (ADLs) necessary
for basic human functions, and/or instrumental activities of
daily living (IADLs), necessary for independent community
living. People of all ages and levels of disability have long-term
care needs:
Children.1 About 459,000 children ages 5 to 17 living in the
community have difficulty performing some activities of daily
living, or ADLs, and are likely to need long-term care assistance.
As parental education levels and income rise, the prevalence of
children with difficulty performing everyday activities (learning,
communication, mobility, and self-care) decreases. Boys are
almost twice as likely to have difficulty performing everyday
activities as girls. Between 9 and 13 percent of children ages 9
to 17 have serious emotional disturbances with substantial
functional impairment. Between 5 and 9 percent of children
ages 9 to 17 have serious emotional disturbances with extreme
functional impairment.
People with Mental Retardation/Developmental Disabilities
(MR/DD). Many people with MR/DD can live in their commu-
nity with their families or others who provide care, with appro-
priate supports. In the last two decades, proportionately more
people with MR/DD live in community-based settings. Others
may require more intensive care, due to the severity of their
disabilities, and live in institutional settings that offer more
comprehensive, continual care. Children with developmental
disabilities before the age of 5 have substantial developmental
delay or conditions that are very likely to result in develop-
mental delays without provision of services.
Adults. Individuals who are older than 18 and in receipt of
hands-on assistance, supervision, or standby help with one or
more ADLs or IADLs due to a physical, mental, or emotional
problem are defined as adults who need long-term care services.
About 9 million adults received long-term care assistance either
in community settings or in nursing homes in 1994. Over 80
percent of adults who receive long-term care assistance reside
in the community, not in institutions.
Older Adults. Individuals age 65 and over, defined as older
adults, who need human assistance or standby help with one
or more ADLs or IADLs need long-term care assistance. Older
adults are more likely to receive long-term care assistance in
the community than in nursing homes.
The Aging Population. The aging of the baby boom generation
will have a dramatic impact on long-term care services in the
future. Over time, the demand for long-term care services
will grow because the older population is growing rapidly.
1America’s Children: Key National Indicators of Well-being, Federal InteragencyForum on Child and Family Statistics, 1999; and R.M. Friedman, et al.,“Prevalence of Serious Emotional Disturbance: an Update,” Mental Health,United States, Substance Abuse and Mental Health Services Administration,U.S. Department of Health and Human Services, 1998.

0.9 (likely to need long-term care assistance)
1.3
5.5
10.6
12.3
self-care
mobility
communication
learning
one or more activities
10
CONSUMERS
CHILDREN
Of the 51 million children age 5 through 17 in 1994, less than 1 percent are likely toneed long-term assistance.
PERCENTAGE OF CHILDREN AGE 5 THROUGH 17 IN 1994 WHO HAD DIFFICULTY WITH ACTIVITY
Source: Urban Institute, 2001. Based on America’s Children: Key National Indicators of Well-being, Federal InteragencyForum on Child and Family Statistics, 1999.

underage 17 59%
age 65 or older
3%
age 17 to 6438%
11
CONSUMERS
PEOPLE WITH MENTAL RETARDATION/DEVELOPMENTALDISABILITIES (MR/DD)
Most people with MR/DD are under the age of 17.
ESTIMATED POPULATION WITH MR/DD IN 1994/95: 3.8 MILLION
Source: Urban Institute, 2001. Based on S. A. Larson and L. Anderson, Excerpts from an Analysis of the 1994 and 1995NHIS-DS, Research and Training Center on Community Living, University of Minnesota, 2000.

54.1
6.92.5
1977 1991 1998
12
CONSUMERS
PEOPLE WITH MENTAL RETARDATION/DEVELOPMENTALDISABILITIES (MR/DD)
The number of younger people with MR/DD who receive care in large state institutions(16 or more beds) has dramatically declined.
THOUSANDS OF PEOPLE AGE 21 AND YOUNGER WITH MR/DD LIVING IN LARGE STATE INSTITUTIONS
Source: Urban Institute, 2001. Based on R. Prouty et al., Residential Services for Persons with Developmental Disabilities:Status and Trends through 1998, Institute on Community Integration, University of Minnesota, May 1999.

1987 (255,673 total residents)
1998 (344,162 total residents)
27.419
53.658.8
15.725.6
1 to 6 residents 7 to 15 residents 16 or more residents
13
CONSUMERS
PEOPLE WITH MENTAL RETARDATION/DEVELOPMENTALDISABILITIES (MR/DD)
In 1998, more than half of people with MR/DD were living in small group residences.
PERCENTAGE OF PEOPLE WITH MR/DD IN RESIDENTIAL SETTINGS
NOTE: Percentages do not sum to 100 due to rounding.
Source: Urban Institute, 2001. Based on R. Prouty et al., Residential Services for Persons with Developmental Disabilities:Status and Trends through 1998, Institute on Community Integration, University of Minnesota, May 1999.

5.3
32
17.2
1.6
12.5
6.5
generalpopulation
168.2 million
mental oremotional problem
8.2 million
substance abusedisorder
1.2 million
1 or more IADL limitation
1 or more ADL limitation
14
CONSUMERS
ADULTS
Adults age 18 through 69 with mental/emotional problems or substance abuse disordersare more likely to have limitations in instrumental activities of daily living (IADLs) thanthe general population.
PERCENTAGE OF ADULTS AGE 18 THROUGH 69 IN 1994
Source: Urban Institute, 2001. Based on A.G. Willis, et al., “Mental Illness and Disability in the U.S. Adult HouseholdPopulation, in Mental Health,” United States, 1998, SAMHSA, DHHS, 1998.

15
CONSUMERS
age 18through 64
47%3.4 million
age 65 andolder
53%3.9 million
ADULTS
Over 80 percent of all people receiving any long-term care assistance receive it incommunity settings.
ADULTS RECEIVING LONG-TERM CARE ASSISTANCE IN THE COMMUNITY IN 1994: 7.3 MILLION
NOTE: People age 65 or older receiving long-term care assistance are those who receive human assistance or stand-byhelp with one or more ADLs or IADLs. People between the ages of 18 and 64 receiving long-term care assistance arethose who receive human help for IADLs and ADLs.
Source: Urban Institute, 2001. Based on 1994 National Health Interview Survey, Disability Supplement, from W. Spector,J. Fleishman, L. Pezzin, and B. Spillman, in The Characteristics of Long-Term Care Users, Agency for Healthcare Researchand Quality, U.S. DHHS, 2000.

16
CONSUMERS
IADLsonly
56%
3 to 6ADLs
17%
1 or 2ADLs
27%
1.9 million
918,000
578,000
ADULTS
About 25 percent of adults of all ages receiving long-term care assistance in thecommunity have severe impairments and receive assistance with 3 to 6 activities of daily living (ADLs).
SEVERITY OF DISABILITY AMONG ADULTS AGE 18 THROUGH 64 RECEIVING LONG-TERM CAREASSISTANCE IN THE COMMUNITY IN 1994: 3.4 MILLION
NOTE: People between the ages of 18 and 64 receiving long-term care assistance are those who receive human help forIADLs and ADLs.
Source: Urban Institute, 2001. Based on 1994 National Health Interview Survey, Disability Supplement, and 1994National Long-Term Care Survey, from W. Spector, J. Fleishman, L. Pezzin, and B. Spillman, in The Characteristics of Long-Term Care Users, Agency for Healthcare Research and Quality, U.S. DHHS, 2000.

IADLsonly
39%
3 to 6ADLs
1 or 2ADLs
31%
1.5 million
1.2 million
1.2 million
56%
17
CONSUMERS
ADULTS
About 47 percent of adults of all ages receiving long-term care assistance in thecommunity receive assistance with instrumental activities of daily living (IADLs).
SEVERITY OF DISABILITY AMONG ADULTS AGE 65 AND OLDER RECEIVING LONG-TERM CAREASSISTANCE IN THE COMMUNITY IN 1994: 3.9 MILLION
NOTE: People age 65 or older receiving long-term care assistance are those who receive human assistance or stand-byhelp with one or more ADLs or IADLs.
Source: Urban Institute, 2001. Based on 1994 National Health Interview Survey, Disability Supplement, and 1994National Long-Term Care Survey, from W. Spector, J. Fleishman, L. Pezzin, and B. Spillman, in The Characteristics of Long-Term Care Users, Agency for Healthcare Research and Quality, U.S. DHHS, 2000.

18
CONSUMERS
age 18through 64
age 65and older
1,425,000
138,0009%
91%
ADULTS
Most adults who live in nursing homes are age 65 and older.
NURSING HOME RESIDENTS IN 1994: 1.6 MILLION
NOTE: These numbers do not include adults with MR/DD or mental illness who live in institutions other than nursinghomes.
Source: Urban Institute, 2001. Based on 1996 Medical Expenditure Panel Survey from W. Spector, J. Fleishman,L. Pezzin, and B. Spillman, in The Characteristics of Long-Term Care Users, Agency for Healthcare Research and Quality,U.S. DHHS, 2000.

19
CONSUMERS
7
15
29
15
23
age 65 through 7418.6 million
age 75 through 84 age 85 and older
in the community
in nursing homes
10.9 million 3.6 million
OLDER ADULTS
Over half the population age 85 and older received long-term care assistance in 1994,compared to only 12 percent of adults age 65 to 85.
PERCENTAGE OF OLDER ADULTS RECEIVING LONG-TERM CARE ASSISTANCE IN 1994
NOTE: Nursing home data do not include older adults with MR/DD or mental illness who live in institutions otherthan nursing homes. People age 65 and older receiving long-term care assistance are those who receive human assis-tance or stand-by help with one or more ADLs or IADLs.
Source: Urban Institute, 2001. Based on 1994 National Long-term Care Survey from W. Spector, J. Fleishman,L. Pezzin, and B. Spillman, in The Characteristics of Long-Term Care Users, Agency for Healthcare Research and Quality,U.S. DHHS, 2000.

20
CONSUMERS
65-69
70-74
75-79
80-84
85+
2000 2005 2010 2015 2020 2025 2030 2035 2040 2045 2050
35.5 35.6 38.845.0
52.660.9
67.1 70.0 72.1 75.1 76.1
TRENDS IN THE AGING POPULATION
The aging of the baby boom generation will increase the demand for long-term careservices. By 2011, the first group of baby boomers will turn 65. By 2031, all babyboomers will be over age 65 and the oldest will turn 85.
MILLIONS OF OLDER ADULTS BY AGE
NOTE: The projections of the number of people in the general population age 65 and older assume reductions inmortality of 0.6 percent a year.
Source: Urban Institute, 2001. Based on The Long-Term Care Financing Model. Prepared by The Lewin Group, Inc.,for the Office of the Assistant Secretary for Planning and Evaluation, DHHS, 2000.

21
CONSUMERS
1996-2000 2000-04 2005-09 2010-14 2015-19 2020-24 2025-29 2030-34 2035-39 2040-44 2045-49
IADL only 1 ADL 2 or more ADLs
5.2 5.5 5.7 6.3 6.8 7.48.1 8.8
9.6 10.0 10.1
TRENDS IN THE AGING POPULATION
Over the next 25 years, the number of older adults with at least two limitations inactivities of daily living (ADLs) is projected to grow by one-third.
MILLIONS OF OLDER ADULTS WITH LIMITATIONS
NOTE: The projections assume reductions in mortality of 0.6 percent a year and a reduction of 0.6 percent a year in disability rates.
Source: Urban Institute, 2001. Based on The Long-Term Care Financing Model. Prepared by The Lewin Group, Inc.,for the Office of the Assistant Secretary for Planning and Evaluation, DHHS, 2000.

22
CONSUMERS
2000 2020 2050
home care
institutional care
5.4
2.0
7.2
2.6
10.5
4.5
TRENDS IN THE AGING POPULATION
The older populations receiving home care and institutional care are expected to grow inthe next 50 years.
MILLIONS OF OLDER ADULTS AGE 85 AND OLDER RECEIVING CARE
NOTE: The projections of the number of people in the general population age 65 and older, the segment of thispopulation with disabilities, and the number using institutional and home care assume reductions in mortality of0.6 percent a year and a reduction of 0.6 percent a year in disability rates as well as current age- and gender-specific use rates for institutional and home care services.
Source: Urban Institute, 2001. Based on The Long-Term Care Financing Model. Prepared by The Lewin Group, Inc.,for the Office of the Assistant Secretary for Planning and Evaluation, DHHS, 2000.

23
PROVIDERS
Long-Term Care:
A variety of providers in community-based and institutional
settings offer long-term care services:
COMMUNITY-BASED CAREGIVERS
Unpaid Caregivers. Most adults receiving long-term care
assistance in the community rely exclusively on unpaid
caregivers—predominantly family or friends—to meet their
long-term care needs. Most of these caregivers are women.
Paid care is used less frequently.
Home Health Care. Home health care is a rapidly growing
sector of the health care industry. It is provided to persons in
their place of residence to promote, maintain, or restore health
and to maximize their independence. Advances in technology
now allow complex illnesses, once treated only in hospitals, to
be treated at home.
Adult Day Services Programs. Adult day services programs
provide health and social services on a part-time basis in a
group setting to people with physical, emotional, or mental
disabilities. Services generally provided to participants include
nursing, social services, personal care, rehabilitation therapies,
meals, counseling, and transportation. Most participants live
with a spouse, adult children, or other family members or
friends; about one-quarter live alone. Over half of the partici-
pants have cognitive impairments, and over 40 percent require
assistance with three or more ADLs.
INSTITUTIONAL SETTINGS
Nursing homes. Nursing homes serve residents with ADL
and IADL limitations, as well as those with cognitive
impairments. About 1.4 million people age 65 and older live
in nursing homes, compared to about 138,000 people age
18 through 64. The average age of a resident in 1997 was 81.
Nursing homes provide nursing, related services, food and
shelter to residents. They have three or more beds that routinely
provide nursing services, and may be free-standing or part
of a larger facility. Nursing homes that receive Medicaid and
Medicare reimbursement are subject to federal laws and
regulations regarding quality of care.
Assisted Living Facilities (ALFs). Like nursing homes,
ALFs serve residents with limitations in ADLs and IADLs,
and cognitive impairments. These facilities represent a fast-
growing housing and service option for people with disabilities.
ALFs generally offer 24-hour staff supervision, housekeeping,
meals, personal assistance, medication reminders, and nursing
staff. They are not subject to federal laws or regulations.
24
unpaidcaregivers
onlypaid andunpaid
caregivers
unknown17%
paidcaregivers
only
6%
6%
71%
PROVIDERS
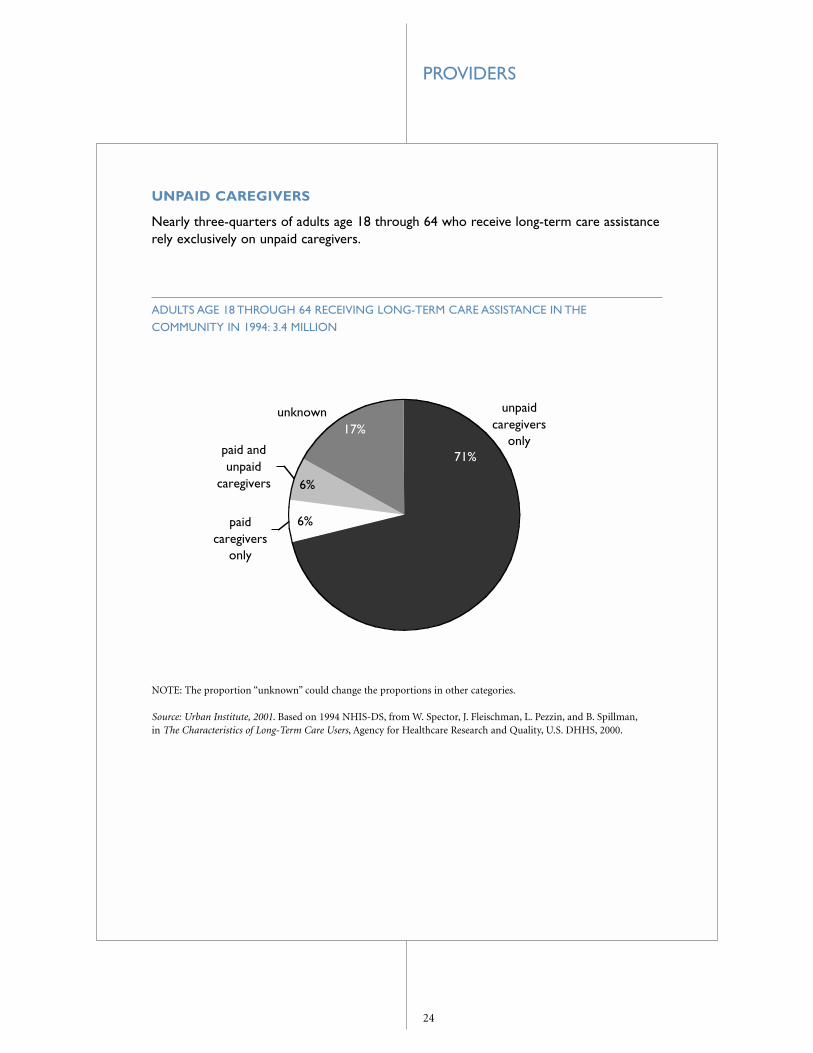
UNPAID CAREGIVERS
Nearly three-quarters of adults age 18 through 64 who receive long-term care assistancerely exclusively on unpaid caregivers.
ADULTS AGE 18 THROUGH 64 RECEIVING LONG-TERM CARE ASSISTANCE IN THECOMMUNITY IN 1994: 3.4 MILLION
NOTE: The proportion “unknown” could change the proportions in other categories.
Source: Urban Institute, 2001. Based on 1994 NHIS-DS, from W. Spector, J. Fleischman, L. Pezzin, and B. Spillman,in The Characteristics of Long-Term Care Users, Agency for Healthcare Research and Quality, U.S. DHHS, 2000.

25
paidcaregivers
only
7%
paid andunpaid
caregivers36%
unpaidcaregivers
only
57%
PROVIDERS
UNPAID CAREGIVERS
Adults age 65 and older are more likely than younger adults to receive care from bothpaid and unpaid caregivers.
ADULTS AGE 65 AND OLDER RECEIVING LONG-TERM CARE ASSISTANCE IN THE COMMUNITYIN 1994: 3.9 MILLION
Source: Urban Institute, 2001. Based on 1994 National Long-Term Care Survey, from W. Spector, J. Fleishman,L. Pezzin, and B. Spillman, in The Characteristics of Long-Term Care Users, Agency for Healthcare Research and Quality,U.S. DHHS, 2000.

26
adultchildren
41%
non-relatives
9%spouse
24%
otherrelatives
26%
PROVIDERS
UNPAID CAREGIVERS
Adult children and spouses make up the majority of unpaid caregivers of older adultsreceiving long-term care assistance in the community.
RELATIONSHIP OF UNPAID CAREGIVERS TO ADULTS AGE 65 AND OLDER IN 1994
Source: Urban Institute, 2001. Based on 1994 National Long-Term Care Survey, from W. Spector, J. Fleishman,L. Pezzin, and B. Spillman, in The Characteristics of Long-Term Care Users, Agency for Healthcare Research and Quality,U.S. DHHS, 2000.

27
1.2
1.9
2.4
1992 1994 1996
PROVIDERS
HOME HEALTH CARE
The number of home health care patients doubled between 1992 and 1996.*
MILLIONS OF HOME HEALTH CARE PATIENTS
*Some estimates show a decline in the number of patients in recent years due to the impact of the Balanced Budget Actof 1997.
NOTE: Patients are current patients as of the date of the survey.
Source: Urban Institute, 2001. From B. Haupt, An Overview of Home Health and Hospice Care Patients: 1996 NationalHome and Hospice Care Survey, National Center for Health Statistics (NCHS), DHHS, 1998 and G.W. Strahan, AnOverview of Home Health and Hospice Care Patients: 1994 National Home and Hospice Care Survey, NCHS, DHHS, 1996(and similar survey for 1992 data). Data are from the NCHS surveys of home and hospice care agencies. Patients arecurrent patients as of the date of the survey.

28
2,100
4,000
1989 1997
NUMBER OF ADULT DAY SERVICES PROGRAMS
PROVIDERS
ADULT DAY SERVICES PROGRAMS
The average age of participants in adult day services programs is 76; two-thirds of participants are women.
NUMBER OF ADULT DAY SERVICES PROGRAMS
Source: Urban Institute, 2001. Based on National Council on Aging, National Adult Day Services Association (NADSA),1997 and www.ncoa.org/nadsa/ADS_factsheets.htm. The NADSA surveyed more than 4,000 adult day service programsand received 1,699 valid responses. The data reflect these responses and responses from a similar 1989 survey, and donot represent the entire industry.

29
11,500 assisted livingfacilities in 1998
1.6
0.52
17,000 nursinghomes in 1997
PROVIDERS
INSTITUTIONAL SETTINGS
Nursing homes, primarily serving older adults, had an average bed size of 107 in 1997.Assisted living facilities, serving people of all ages, had an average bed size of 53 in 1998.
MILLIONS OF RESIDENTS IN LONG-TERM CARE FACILITIES
Source: Urban Institute, 2001. From NCHS, DHHS, Advance Data, No. 311, March 1, 2000, An Overview of NursingHome Facilities: Data from the 1997 National Nursing Home Survey. C. Hawes, et al., A National Study of Assisted Livingfor the Frail Elderly: Results of a National Survey of Facilities, OASPE, Office of Disabilities, Aging, and Long-term CarePolicy, DHHS, December 1999. To be included in the survey’s nationally representative sample of 2,945 assisted livingfacilities (ALFs), facilities had to serve older adults, have more than 10 beds, and indicate that they were ALFs or thatthey provided 24-hour staff oversight as well as housekeeping, meals, and assistance with medications, bathing, anddressing.

30
7183
3424
cognitiveimpairment
need help with3 or more ADLs
nursing homes, 1996 ALFs, 1998
PROVIDERS
INSTITUTIONAL SETTINGS
Assisted living facilities (ALFs) are generally not able to care for residents who needskilled nursing care.
PERCENTAGE OF RESIDENTS IN INSTITUTIONAL SETTINGS
Source: Urban Institute, 2001. Based on C. Hawes, et al., A National Study of Assisted Living for the Frail Elderly: Resultsof a National Survey of Facilities, OASPE, DHHS, 1999. Hawes used nursing home data from the nursing home compo-nent of the Medical Expenditure Panel Survey (MEPS) as presented in N. Krauss and B. Altman, Characteristics ofNursing Home Residents 1996, 1998 MEPS Research Findings No. 5, DHHS, Agency for Healthcare Research Quality,1998.

31
Long-Term Care: FINANCING
Long-term care services are financed through sources including
out-of-pocket spending, Medicare, Medicaid, the Medicaid
home and community-based services waiver program, and
private long-term care insurance.
Overall Spending. The Health Care Financing Administration
(HCFA) estimates that in 1998 over $117 billion—almost 12
percent of U.S. personal health expenditures—was spent on
nursing facility care, including care in intermediate facilities
for the mentally retarded (ICFs/MR), and home health care
services not affiliated with hospitals. Medicaid and out-of-
pocket spending—the two major sources of long-term care
financing—make up nearly half the amount.
Out-of-pocket spending represented almost 30 percent of
total long-term care spending on nursing facilities and home
health care in 1998—about $35 billion. A recent survey by
AARP indicated that 39 states reported one or more state-only
funded home and community-based services programs for the
elderly: total state spending for these programs was more than
$1.2 billion in 1996.2
Medicare. In 1998, Medicare funded 17.8 percent of long-term
care spending. Medicare is not intended to be a primary long-
term care funding source, and is not intended to support people
in need of assistance with only ADLs and/or IADLs. It covers
a limited amount of long-term care services in a skilled nursing
facility that follow a three-day hospital stay, and offers a home
health benefit for those with medically related needs. Medicare’s
coverage of skilled nursing home care is limited to up to 100
days, following hospitalization, for persons who need continued
skilled nursing care and/or skilled rehabilitation on a daily
basis. Home health visits are limited to people who need skilled
nursing care on a part-time or intermittent basis, or physical
or speech therapies. Medicare is the largest public payor of
home health care. Skilled nursing facility and home health care
represented 10 percent of total Medicare spending in 1998.
Medicaid. Medicaid spending on long-term care includes
spending for institutional nursing facilities, ICFs/MR, and
home and community care. Half of all Medicaid spending on
long-term care pays for nursing home care.
Medicaid paid about $59 billion for institutional and home
and community-based services in 1997.3 Of this amount, 73
percent was spent for care in nursing homes and in ICFs/MR.
The balance was spent on home and community-based services,
such as home health, case management, personal care, and
respite services for caregivers.
Medicaid spending almost doubled from 1991 to 1997, with
an increase in the share devoted to home and community-based
services and a decline in the share devoted to ICFs/MR. This
shift reflects, in part, greater state use of Medicaid waivers for
home and community-based services.
While most states’ Medicaid programs devote the majority
of their public funding for people with MR/DD to institutions,
many states allocate most of their funding to home and com-
munity-based services. The trend toward de-institutionalizing
people with MR/DD in favor of care in community-based
settings began during the 1970s.
Medicaid Home and Community-Based Services Waiver
Program. Medicaid law allows HCFA to waive certain
requirements so that states may offer a broad range of home
and community-based services to persons who would otherwise
need institutional care.4 States can define the specific popula-
tions with disabilities and services to be covered, which include
case management, respite services for caregivers, habilitation
(assistance in developing skills necessary to residing successfully
in home and community-based settings), and personal care
services.
3Based on data from HCFA Form 64 reports.
4Statutory requirements that may be waived are: requirements that Medicaidservices be available throughout the state, and that any covered services be equalin amount, duration, and scope for certain recipients.
2E. Kassner, and Williams, Taking Care of Their Own: State-funded Home andCommunity-based Care Programs for Older Persons, AARP, 1997.

32
FINANCING
Waivers are one of the most important funding sources
for home and community-based care for persons of all ages.
Services most frequently provided by states are case manage-
ment (arrangement of services under a plan of care for each
individual); respite (part-time relief for caregivers); habilitation
(assistance to help people reside successfully in the communi-
ty); and personal care services.5
Medicaid waiver program spending nearly quadrupled in five
years, growing from $2.2 billion in 1992 to almost $8 billion in
1997. More than three-quarters of this spending is devoted to
services for people with MR/DD, and another 20 percent is for
the aged and other people with disabilities. The number of
recipients of these services more than doubled, rising from
236,000 in 1992 to 562,000 in 1997.
Private Long-Term Care Insurance. The private long-term care
insurance market has grown substantially over the last decade.
The size of the market may grow even larger if policies are
purchased at earlier ages when premiums are lower, or if
government subsidies are offered.
The vast majority of policies (80 percent) sold has been sold
through individual and group association markets. The balance
has been sold through employer-sponsored life insurance
markets.
According to the Health Insurance Association of America,
growth in the number of policies purchased averaged about
21 percent per year between 1987 and 1997. Yet, according to
HCFA data, payments from private health insurance represent-
ed only about 7 percent of total long-term care expenditures
in 1998.
Purchasers of private long-term care insurance who are age
55 or older are on average better off financially than their peers
in the general population. Some experts estimate that over the
next 20 years, between 10 and 35 percent of retirees will have
the financial resources necessary to pay for long-term care
policies.6 In turn, others argue that the private market may be
an option for only those with middle and upper incomes.7
Other Federal Sources. A variety of other federal programs
support long-term care services that are not specifically
illustrated in this chart book but are summarized in a table
in this section.
These sources include the Older Americans Act and the
Social Services Block Grant Program (SSBG), which both
fund home and community-based services. Various housing
programs, including Section 202 housing for the elderly,
Section 811 housing for the disabled, congregate housing,
and the newly authorized assisted living programs, administered
by the U.S. Department of Housing and Urban Development,
finance supported living arrangements for people with
disabilities.
Many states supplement federal Supplemental Security
Income cash welfare payments to low-income elderly and
disabled people to help pay for home and community-based
services, or to help pay for non-medical residential services,
such as board and care homes. Certain programs authorized
under the Rehabilitation Act of 1973 provide a range of sup-
portive services to people with disabilities. The Department
of Veterans Affairs (DVA) provides a wide range of long-term
care services to the nation’s veterans, including nursing home,
domiciliary, home health care, and assistance to caregivers.
Tax benefits for long-term care include a limited deduction
for long-term care expenses and insurance premiums, tax-
exempt insurance benefits, and the dependent care tax credit.
5CRS analysis of the American Public Human Services Association (APHSA)1915(c) waiver database, 1998.
6M.A. Cohen and A.K. Nanda Kumar, “The Changing Face of Long-Term CareInsurance in 1994,” Inquiry, 34, Spring 1997, p. 50-61, and J. Wiener, et al.Sharing the Burden: Strategies for Public and Private Long-Term Care Insurance.Brookings Institution, 1994.
7Ibid., M.A. Cohen

33
FINANCING
FEDERAL PROGRAMS FOR PEOPLE WITH DISABILITIES
Eligibility Services Administration
Medicaid Children and adults who Nursing facility, home State
are blind, disabled, and/or health care, personal
age 65 and older who meet care services, and
income and asset tests adult day care
Medicaid Waivers Children and adults who are Wide array of non-medical State
blind, disabled, and/or age 65 support services excluding
and older who meet income room and board
and asset tests who would
otherwise be in an institution
Medicare Adults age 65 and older and Short-term skilled Federal
certain younger people with nursing facility and
disabilities home health care
Social Services Block Grant Determined by states Wide array of special State
support and home
and community-based
services
Older Americans Act of 1965 Adults age 60 and older Include nutrition, home State
care, adult day services,
respite, transportation, and
preventive health services
Supplemental Security Income Children and adults who are Cash payments can State
blind, disabled, and/or 65 be used for services
and older who meet state
income and asset tests
Rehabilitation Act of 1973 Adults who have a physical or Include vocational State
mental impairment that results rehabilitation, employment
in a substantial impediment to training, education, and
employment who can benefit independent living services
from vocational rehabilitative
services
Supportive Housing and Congregate Certain adults with disabilities Variety of supportive Federal
Housing Services Act of 1978 housing options
Department of Veterans Affairs Based on statutory priorities, Range of institutional, Federal
including service-connected residential, and
disabilities and other factors supportive services
Source: Prepared by the Congressional Research Service, 2000. Urban Institute, 2001

34
11.5%
12.0%
16.5%
22.5%
37.6%
long-termcare
prescriptiondrugs/othermedical non-durables
other
physicianservices
hospital care
FINANCING
OVERALL SPENDING
Out of all U.S. personal health spending, $117 billion was spent on long-term careservices in 1998.
PERSONAL HEALTH SPENDING IN THE UNITED STATES IN 1998: $1.02 TRILLION
NOTE: Percentages do not sum to 100 due to rounding. Although the data capture most long-term care spending,some expenditures, such as those on Medicaid home and community-based services waivers, are not included.
Source: Urban Institute, 2001. Based on Office of the Actuary, National Health Statistics Group, Personal Health CareExpenditures, HCFA, DHHS, 2000.

35
6.3%
17.8%
7.4%
29.5%
39.0%
otherprivate health
insurance
Medicare
out-of-pocket
Medicaid
FINANCING
OVERALL SPENDING
Medicaid is the primary funding source for long-term care services.
SOURCES OF LONG-TERM CARE FINANCING IN 1998
Source: Urban Institute, 2001. Based on Office of the Actuary, National Health Statistics Group, Personal Health CareExpenditures, HCFA, DHHS, 2000. Long-term care expenditures include spending on nursing homes, ICF/MR, andcertain home health services supplied by agencies not affiliated with institutions. Although the data capture most long-term care spending, some expenditures, such as those through Medicaid home and community-based services waivers,are not included.

36
4.1%5.4%
11.8%
32.5%
46.2%
other private healthinsurance
Medicare
out-of-pocket
Medicaid
FINANCING
OVERALL SPENDING
Spending for nursing homes and intermediate care facilities for the mentally retarded(ICFs/MR) represents 75 percent of all long-term care spending.
SPENDING FOR NURSING HOMES AND ICFs/MR IN 1998: $87.8 BILLION
NOTE: Nursing home expenditures include spending on nursing homes and ICFs/MR that are not affiliated withinstitutions or hospitals. Although the data capture most long-term care spending, some expenditures are not included.
Source: Urban Institute, 2001. Based on Office of the Actuary, National Health Statistics Group, Personal Health CareExpenditures, HCFA, DHHS, 2000.

37
13.0%
13.7%
35.6%
20.5%
17.1%
other
private healthinsurance
Medicare
out-of-pocket
Medicaid
FINANCING
OVERALL SPENDING
Spending for home health care represented one-quarter of all long-term care spending in 1998.
SPENDING FOR HOME HEALTH CARE IN 1998: $29.3 BILLION
NOTE: Home health expenditures are from data supplied by agencies that are not affiliated with institutions such as hospitals. Although the data capture most spending, some expenditures, such as those on Medicaid home andcommunity-based service waivers, are not included.
Source: Urban Institute, 2001. Based on Office of the Actuary, National Health Statistics Group,Personal Health Care Expenditures, HCFA, DHHS, 2000.

38
2000 2025 2050
$98.1
$207.9
$379.5
Medicaid
Medicare
other payers
private long-term care insurance
family resources
FINANCING
OVERALL SPENDING
Spending on institutional and home care for adults age 65 and older is projected to morethan double from 2000 to 2025, and to nearly quadruple by 2050.
BILLIONS OF 1999 DOLLARS PROJECTED TO BE SPENT
NOTE: The projected expenditure increases assume reductions in mortality of 0.6 percent a year and 0.6 percent a year in disability rates in the older population, current age- and sex-specific use rates for institutional and home care services, static public policies, and a real inflation rate of 1.2 percent for long-term care services.
Source: Urban Institute, 2001. Based on The Long-Term Care Financing Model. Prepared by The Lewin Group, Inc., forOASPE, DHHS, 2000.

39
4.9%4.9%
7.8%
23.5%58.9%
homehealth skilled nursing
home
other
physicianshospital
FINANCING
MEDICARE
Home health care and skilled nursing facility care represented about 10 percent of allMedicare personal health care spending in 1998.
MEDICARE PERSONAL HEALTH CARE SPENDING IN 1998: $210.5 BILLION
NOTE: Home health expenditures declined in recent years due to the impact of the Balanced Budget Act of 1997, andfraud and abuse initiatives. Medicare nursing home expenditures include spending on skilled nursing homes that arenot affiliated with institutions such as hospitals. Medicare home health expenditures are from data supplied by agenciesthat are not affiliated with institutions such as hospitals.
Source: Urban Institute, 2001. Based on data from the Office of the Actuary, National Health Statistics Group, PersonalHealth Care Expenditures, HCFA, DHHS, 1998.

40
$0
$2
$4
$6
$8
$10
$12
$14
1990 1991 1992 1993 1994 1995 1996 1997 1998
billions in Medicare spending
home health care
skilled nursing facility
$3 billion
$1.7 billion
$10.4 billion
FINANCING
MEDICARE
Between 1990 and 1998, Medicare spending for skilled nursing facility care increasedmore than 500 percent. Spending for home health care increased by 250 percent.
TRENDS IN MEDICARE SPENDING BY TYPE OF CARE
NOTE: Home health expenditures declined in recent years due to the impact of the Balanced Budget Act of 1997, andfraud and abuse initiatives. Medicare nursing home expenditures include spending on skilled nursing homes that arenot affiliated with institutions such as hospitals. Medicare home health expenditures are from data supplied by agenciesthat are not affiliated with institutions such as hospitals.
Source: Urban Institute, 2001. Based on data from the Office of the Actuary, National Health Statistics Group, HCFA,DHHS, 1990-1997.

41
1990 199760.5
25.3
13.6
0.7
56.2
16.6
24.4
3.1
nursing homes ICFs/MR home andcommunity-
based services
other
FINANCING
MEDICAID
In 1990, total Medicaid spending on long-term care amounted to $30.3 billion.By 1997 the amount had grown to $58.7 billion.
PERCENTAGE OF TOTAL MEDICAID SPENDING ON LONG-TERM CARE
NOTE: Medicaid expenditures include spending for nursing facilities, ICFs/MR, and home care including Medicaidhome and community-based waivers and personal care.
Source: Urban Institute, 2001. Based on data from HCFA-64 reports.

42
40 to 49 50 to 59 60 to 69 70 to 79 80 to 89 90 to 99
FINANCING
MEDICAID
States’ Medicaid spending tends to focus on institutional long-term care. In all but twostates—Oregon and Vermont—most Medicaid long-term care expenditures are forinstitutions.
PERCENTAGE OF MEDICAID DOLLARS SPENT BY STATES ON LONG-TERM INSTITUTIONALCARE, FY 1998
NOTE: Arizona provides most of its long-term care services through a prepaid plan, spending for which is not reportedin HCFA-64 reports. This map does not reflect all of Arizona’s spending on long-term care services. Institutional long-term care includes nursing facilities and intermediate care facilities for the mentally retarded. HCBS expendituresare comprised of HCBS for frail elderly (home and community-based care for the functionally disabled elderly),home/community-based waiver services, community supported living arrangement programs, and hospice benefits.
Source: Urban Institute, 2001. Based on data from HCFA-64 reports.

43
Under $50 $50 to $99 $100 to $149 $150 to $199 $200 to $299 $300 to $450
FINANCING
MEDICAID
Per capita Medicaid spending on long-term institutional care varies tremendously bystate. In 1998, per capita spending was less than $50 in two states, while it rangedbetween $300 and $450 in two other states and the District of Columbia.
PER CAPITA MEDICAID LONG-TERM CARE INSTITUTION EXPENDITURES BY STATEPOPULATION, FY 1998
NOTE: Arizona provides most of its long-term care services through a prepaid plan, spending for which is not reported in HCFA-64 reports. This map does not reflect all of Arizona’s spending on long-term care services.Institutional long-term care includes nursing facilities and intermediate care facilities for the mentally retarded.
Source: Urban Institute, 2001. Based on data from HCFA-64 reports.

44
Under 49 50 to 59 60 to 69 70 to 79 80 to 89 90 to 100
FINANCING
MEDICAID
Nationally, 72 percent of total public spending on MR/DD (mental retardation/develop-mental disabilities) services is for services delivered in the home and community.
PERCENTAGE OF TOTAL PUBLIC SPENDING ON MR/DD SERVICES IN THE COMMUNITY,BY STATE IN 1998
NOTE: Institutional spending includes those serving 16 or more people and does not include nursing homes.Community services includes residential programs for 15 or fewer persons and non-residential community services as well as family support, supported employment, and supported living/personal assistance.
Source: Urban Institute, 2001. Based on Braddock, Hemp, Parish, and Rizzolo, The State of the States in DevelopmentalDisabilities: 2000 Study Summary, Department of Disability and Human Development, University of Illinois at Chicago.

45
other1.2%
children(special care)
0.8%
76.7%
MR/DD
aged anddisabled 21.3%
FINANCING
MEDICAID WAIVERS FOR HOME AND COMMUNITY-BASED SERVICES
Medicaid waiver spending grew by almost 260 percent between 1992 and 1997.
MEDICAID WAIVER SPENDING IN 1997: $7.9 BILLION
NOTE: The “other” category in this chart includes people with AIDS and AIDS-related complex, people with mentaldisabilities, and people with traumatic brain or head injuries. The “aged and disabled” population includes people age65 and older, and people between ages 18 and 64 with disabilities.
Source: Urban Institute, 2001. Based on C. Harrington, et al. 1915(c) Medicaid Home and Community-Based WaiverParticipants, Services, and Expenditures, 1992-1997. Department of Social and Behavioral Sciences, University ofCalifornia at San Francisco, March 2000.

46
8,108
216,570
3,072
326,615
15,253
58,150
1,631
167,779
other
MR/DD
children(special care)
aged anddisabled
1992 (236,000 total recipients)1997 (562,000 total recipients)
FINANCING
MEDICAID WAIVERS FOR HOME AND COMMUNITY-BASED SERVICES
The number of people served in the waiver program grew by nearly 140 percent in five years.
TYPES OF MEDICAID WAIVER RECIPIENTS
NOTE: The “other” category in this chart includes people with AIDS and AIDS-related complex, people with mentaldisabilities, and people with traumatic brain or head injuries. The “aged and disabled” population includes people age65 and older, and people between ages 18 and 64 with disabilities.
Source: Urban Institute, 2001. Based on 1915(c) Medicaid Waiver Program Data from HCFA Form 372 reports,collected from states in C. Harrington, H. Carillo, V. Wellin, F. Norwood, and N. Miller, 1915(c) Medicaid Home and Community-Based Waiver Participants, Services, and Expenditures, 1992-97, Department of Social and BehavioralSciences, University of California at San Francisco, November 1999. Harrington et al. collected HCFA Form 372s fromstates for the years 1992 and 1997. In a few states, the states or the researchers estimated the numbers because data werenot available. Edits were made to correct state calculations or to identify missing data. No effort was made to estimatemissing service expenditure data.

47
$29,192
$27,859
$20,067
$9,092
$7,363
$5,388
$3,633
$2,760
$10,140
$24,510
$24,176
$7,807
$16,278
$3,953
$4,821
$2,201
traumaticbrain/head injury
MR/DD
children(special care)
disabled/physicallydisabled
mental health
aged/disabled
AIDS/AIDS-relatedcomplex
aged
1992
1997
FINANCING
MEDICAID WAIVERS FOR HOME AND COMMUNITY-BASED SERVICES
In 1997, average annual spending per waiver recipient ranged from about $2,800 to $29,200.
AVERAGE ANNUAL MEDICAID WAIVER SPENDING PER TYPE OF RECIPIENT
Source: Urban Institute, 2001. Based on 1915(c) Medicaid Waiver Program Data from HCFA Form 372 reports,collected from states in C. Harrington, H. Carillo, V. Wellin, F. Norwood, and N. Miller, 1915(c) Medicaid Home andCommunity-Based Waiver Participants, Services, and Expenditures, 1992-97, Department of Social and BehavioralSciences, University of California at San Francisco, November 1999. Harrington et al. collected HCFA Form 372s fromstates for the years 1992 and 1997. In a few states, the states or the researchers estimated the numbers because data werenot available. Edits were made to correct state calculations or to identify missing data. No effort was made to estimatemissing service expenditure data.

48
otherresidence
2.1%
8.1%
foster home
person's ownhome
15.0%
33.6%
41.2%
family home
residentialfacility
FINANCING
MEDICAID WAIVERS FOR HOME AND COMMUNITY-BASED SERVICES
The waiver program has significantly expanded service options for people with mentalretardation/developmental disabilities (MR/DD).
SERVICE LOCATIONS FOR MEDICAID WAIVER RECIPIENTS WITH MR/DD IN 1998
NOTE: Data on the MR/DD population that Prouty et al. report come from annual surveys of each state’s MR/DDprograms and administrators of all large (16 or more residents) state MR/DD facilities. A residential facility is a place of residence owned, rented, or managed by an agency, in which staff provide care, instruction, supervision, and supportto residents with MR/DD.
Source: Urban Institute, 2001. Based on R. Prouty et al., Residential Services for Persons with Developmental Disabilities:Status and Trends through 1998, Institute on Community Integration, University of Minnesota, May 1999.

49
0
80,000
160,000
240,000
1993 1994 1995 1996 1997 1998
86,600
148,700
239,000
124,300ICFs/MR residents
Home and community-based serviceswaiver recipientswith MR/DD
Individuals
FINANCING
MEDICAID WAIVERS FOR HOME AND COMMUNITY-BASED SERVICES
A 16 percent drop in the use of intermediate care facilities (ICFs/MR) has accompanied a 175 percent jump in the use of the waiver program by people with mentalretardation/developmental disabilities (MR/DD).
CHANGE IN THE USE OF LONG-TERM CARE SERVICES BY PEOPLE WITH MR/DD
Source: Urban Institute, 2001. Based on R. Prouty et al., Residential Services for Persons with Developmental Disabilities:Status and Trends through 1998, Institute on Community Integration, University of Minnesota, May 1999.

50
$30,782
$78,369
home and community-based services waivers
ICF/MR
FINANCING
MEDICAID WAIVERS FOR HOME AND COMMUNITY-BASED SERVICES
Spending on a person receiving services through home and community-based serviceswaivers is much lower than spending on an individual in an intermediate care facility forthe mentally retarded (ICF/MR).
ANNUAL SPENDING ON SERVICES FOR A PERSON WITH MR/DD IN 1998
Source: Urban Institute, 2001. Based on R. Prouty et al., Residential Services for Persons with Developmental Disabilities:Status and Trends through 1998, Institute on Community Integration, University of Minnesota, May 1999.

51
1987 1988 1989 1990 1991 1992 1993 1994 1995 1996 1997 1998
815,000policiessold
5,842,000policies sold byJune 30, 1998
FINANCING
PRIVATE LONG-TERM CARE INSURANCE
Between 1987 and 1998, 119 companies sold over 5.8 million long-term care insurance policies.
CUMULATIVE NUMBER OF LONG-TERM CARE INSURANCE POLICIES SOLD
NOTE: The cumulative number of policies sold does not equal the number of policies in force.
Source: Urban Institute, 2001. Based on Health Insurance Association of America (HIAA), Long-Term Care Insurance in 1987-1998, March 2000. The HIAA data came from an annual written survey of all known long-term care insurancesellers in the individual and group association, employer-sponsored, and riders to life insurance markets. Eachparticipating firm was asked to send HIAA a copy of its most recent policy and marketing materials.

52
1988 1989 1990 1991 1992 1993 1994 1995 1996 1997
315,000 new policies sold in1988
500,000
420,000
582,000 newpolicies sold in1997
FINANCING
PRIVATE LONG-TERM CARE INSURANCE
The number of new long-term care insurance policies sold each year has been on therise. Life Plans, Inc., estimates that between 55 and 65 percent of policies sold were stillin effect in 1998.
GROWTH IN SALES OF NEW LONG-TERM CARE INSURANCE POLICIES
Source: Urban Institute, 2001. Based on data in Health Insurance Association of America, Long-Term Care Insurance in 1987-1998, March 2000. The HIAA data came from an annual written survey of all known long-term care insurancesellers in the individual and group association, employer-sponsored, and riders to life insurance markets. Eachparticipating firm was asked to send HIAA a copy of its most recent policy and marketing materials.

53
$7,022
$2,305
$1,110
$770
$5,880
$1,850
$888
$595
$4,779
$1,232
$485
$357
$4,100
$1,007
$385
$274
age 79
age 65
age 50
age 40
base plannonforfeitureinflationnonforfeiture and inflation
FINANCING
PRIVATE LONG-TERM CARE INSURANCE
A non-forfeiture benefit protects the policyholder’s investment if he or she decides to drop the policy.Without inflation protection, the purchasing power of a policy erodesover time. Both protections boost policy premiums.
AVERAGE ANNUAL PREMIUMS FOR LEADING LONG-TERM CARE INSURANCE SELLERS IN 1997
NOTE: Premiums are generally for policies that provide: $100 a day in nursing and home care; at least $80 a day in assisted living facility care; at least $50 a day in home care; four years of coverage and a 20-day elimination, ordeductible, period.
Source: Urban Institute, 2001. Based on Health Insurance Association of America, Long-Term Care Insurance in 1987-1998. March, 2000. The data come from an annual written survey of all known long-term care insurance sellers in the individual and group association, employer-sponsored, and riders to life insurance markets. Each participatingfirm was asked to send a copy of its most recent policy and marketing materials.

54
less than $20,000
$50,000 and over
$35,000 to $49,999
$25,000 to $34,999
$20,000 to $24,999
21.%
20%
18%
24%
16%
FINANCING
PRIVATE LONG-TERM CARE INSURANCE
Purchasers of private long-term care insurance age 55 and older tend to have higher incomes.
ANNUAL INCOMES OF INDIVIDUAL PURCHASERS OF LONG-TERM CARE INSURANCE AGE 55AND OLDER IN 1994
Source: Urban Institute, 2001. Based on M.A. Cohen and A. K. N. Kumar, “The Changing Face of Long-Term CareInsurance in 1994: Profiles and Innovations in a Dynamic Market,” Inquiry, 34, Spring 1997, p. 50-61. Data reportedcome from a survey of individual purchasers and non-purchasers of long-term care insurance from nine companiesrepresenting more than 65 percent of total individual sales in 1994. Response rates were 63 percent for purchasers and 38 percent for non-purchasers. Data on the general population came from a survey of a representative sample of persons age 55 and over.

55
10%
13%
10%
8% 41%
18%
less than $20,000
$20,000 to$29,999
$30,000 to$49,999
$50,000 to$74,999
$75,000to $99,999 $100,000
and over
FINANCING
PRIVATE LONG-TERM CARE INSURANCE
Purchasers of private long-term care insurance age 55 and older tend to have moreliquid assets.
LIQUID ASSETS OF INDIVIDUAL PURCHASERS OF LONG-TERM CARE INSURANCE AGE 55 ANDOLDER IN 1994
Source: Urban Institute, 2001. Based on M.A. Cohen and A. K. N. Kumar, “The Changing Face of Long-Term CareInsurance in 1994: Profiles and Innovations in a Dynamic Market,” Inquiry, 34, Spring 1997, p. 50-61. Data reported come from a survey of individual purchasers and non-purchasers of long-term care insurance from nine companiesrepresenting more than 65 percent of total individual sales in 1994. Response rates were 63 percent for purchasers and 38 percent for non-purchasers. Data on the general population came from a survey of a representative sample of persons age 55 and over.

56
ADDITIONAL RESOURCES
This chart book highlights the three major components of
long-term care services: consumers, providers, and financing.
For more information on issues related to long-term care
and disabled and elderly populations, consider the following
resources available from the Urban Institute Publications
Sales Office and Web site. Resources are listed in reverse
chronological order.
Consumer-Directed Home and Community Services:
Policy Issues
By Jane Tilly and Joshua M. Wiener, January 2001
An examination of eight states’ consumer-directed home
and community services for older persons and their policy
implications.
Consumer-Directed Home and Community Services
Programs in Five Countries: Policy Issues for Older
People and Government
By Jane Tilly, Joshua M. Wiener, Alison Evans Cuellar,
October 2000
An analysis of the development, design, and experience of
consumer-directed home care programs in Austria, Germany,
France, the Netherlands, and the United States (US). The US
states included in this study are California, Colorado, Kansas,
Maine, Michigan, Oregon, Washington, and Wisconsin.
State Welfare to Work Policies for People with Disabilities:
Implementation Challenges and Considerations
By Pamela A. Holcomb and Terri S. Thompson, August 2000
A report on key operational issues associated with serving
welfare recipients with disabilities.
Parental Care at Midlife: Balancing Work
and Family Responsibilities Near Retirement
By Richard W. Johnson and Anthony T. Lo Sasso, March 2000
A report on findings from a recent Urban Institute study of
the characteristics of persons in their fifties and early sixties
who provide care to their elderly parents and the trade-offs
that families face when they divide their time between
the provision of informal care and paid work.
The Trade-Off between Hours of Paid Employment
and Time Assistance to Elderly Parents at Midlife
By Richard W. Johnson and Anthony T. Lo Sasso, February 2000
A study that shows that although the family has traditionally
been the primary caregiver for the frail elderly, the rising
labor force participation rates of married women may
interfere with their historical caregiving responsibilities.
Long-Term Care for the Elderly in the District of Columbia:
Issues and Prospects
By Joshua M. Wiener and David G. Stevenson, May 1999
An examination of the challenges facing the District of
Columbia in organizing, financing, and assuring quality in
long-term care for the elderly. The paper analyzes issues related
to long-term care policy development and implementation,
home and community-based services, and nursing homes.

57
ADDITIONAL RESOURCES
Controlling the Supply of Long-Term Care Providers
at the State Level
By Joshua M. Wiener, David G. Stevenson, and
Susan M. Goldenson, December 1998
An analysis of the use of certificate of need (CON) programs
and moratoria as a long-term care cost-control strategy
across 13 states: Alabama, California, Colorado, Florida,
Massachusetts, Michigan, Minnesota, Mississippi, New
Jersey, New York, Texas, Washington, and Wisconsin.
State Welfare-to-Work Policies for People with Disabilities:
Changes Since Welfare Reform
By Terri S. Thompson, Pamela A. Holcomb, Pamela Loprest,
and Kathleen Brennan, December 1998
A new national study that finds that most states are
beginning to require participation in welfare-to-work
programs by individuals who previously had been exempt
due to a disability.
Long-Term Care for the Elderly: Profiles of Thirteen States
By Joshua M. Wiener and David G. Stevenson, August 1998
An examination of long-term care for the elderly in
13 states: Alabama, California, Colorado, Florida,
Massachusetts, Michigan, Minnesota, Mississippi,
New Jersey, New York, Texas, Washington, and Wisconsin;
with particular attention to efforts to control the rate
of increase in Medicaid long-term care expenditures
for the elderly.
Policy Challenges Posed by the Aging of America
By Len Burman, Rudolph Penner, Gene Steuerle, Eric Toder,
Marilyn Moon, Larry Thompson, Michael Weisner, and
Adam Carasso, May 1998
A discussion paper that outlines one of the nation’s greatest
challenges as it moves into the 21st century. Topics include
the dramatic demographic shift already taking place, economic
policies affecting Social Security and Medicare, and the need
for additional research.
Can Private Insurance Solve the Long-Term Care
Problems of the Baby Boom Generation?
Testimony by Joshua M. Wiener, presented at a hearing held
by the Special Committee on Aging, United States Senate,
Washington, D.C., March 9, 1998.
An argument that serious long-term care reform that seeks
to make life better for the great majority of the elderly will
require expansions of public programs—Medicare, Medicaid,
and others—that currently are the major source of third-party
funding.
State Level Databook on Health Care Access and Financing
By David W. Liska, Niall J. Brennan, and Brian K. Bruen, Third
Edition, 1998
A comprehensive picture of the current health system at
the state level, including state-level data on the insurance
coverage of different groups of people; the characteristics of
the uninsured; Medicaid enrollees and expenditures; health
status; health care costs, access, and utilization; and state-
specific demographics and economic profiles. It also reports
totals for the entire United States and averages for nine
Census regions.
58
ADDITIONAL RESOURCES
Long-Term Care for the Elderly and State Health Policy
By Joshua M. Wiener and David G. Stevenson, November 1997
A discussion of three broad strategies that states could use to
control spending for Medicaid long-term care services for the
elderly, including an overview of utilization and expenditures
patterns associated with long-term care for the elderly.
Supplemental Security Income for Children
with Disabilities: Part of the Federal Safety Net
By Pamela J. Loprest, July 1997
A brief that estimates, by state, the number of children
in low-income families likely to lose cash benefits from
Supplemental Security Income (SSI) under the 1996 welfare
reform law. The estimates highlight the potential fiscal risks
states face as low-income families lose federal SSI benefits
and need replacement income to fill the gap.
Profile of Disability among AFDC Families
By Pamela J. Loprest and Gregory P. Acs, 1996
An assessment of the extent to which women and families
receiving Aid to Families with Dependent Children had
a limited ability to work due to their own disabilities
or those of their children.

59
ABOUT THE AUTHORS
Long-Term Care: Consumers, Providers, and Financing—A Chart
Book, is based on Long-Term Care Chart Book: Persons Served,
Payors, and Spending, a report to Congress that was written by
the following authors.
Jane Tilly is a senior research associate in the Urban Institute’s
Health Policy Center. She holds a B.A. from State University
of New York at Geneseo, an M.P.A. from the University of Texas
at Austin, and is a doctor of public health in the University of
Michigan School of Public Health in Ann Arbor.
Susan Goldenson is a healthcare specialist at William M.
Mercer, Inc. Her research focuses on health care and group
employee benefits’ issues including health plan design, cost
trends, and insurance coverage. Prior to coming to Mercer,
Susan was a research associate at the Urban Institute’s Health
Policy Center where she focused on long-term care issues and
state Medicaid managed care evaluations. Ms. Goldenson
earned a B.S. from Cornell University and an M.P.P. from
Duke University’s Terry Sanford Institute of Public Policy.
Jessica Kasten has been working in health care financing
for over thirteen years, specializing in government programs.
She received a master’s degree in Public Policy from the Robert
M. La Follette Institute at the University of Wisconsin-Madison.
While at the Urban Institute, Jessica worked mainly on
Medicaid and Medicare managed care, and long-term care
studies. She currently works at the Health Care Financing
Administration’s Office of Legislation on Medicaid managed
care, waiver, and nursing home issues.
Carol O’Shaughnessy is a specialist in Social Legislation in the
Domestic Social Policy Division of the Congressional Research
Service. She holds a B.A. from Dunbarton College of the Holy
Cross and an M.A. in Medical Sociology from the Catholic
University of America.
Rachel Kelly is an analyst in social legislation in the Domestic
Social Policy Division of the Congressional Research Service.
She holds a B.S. in Industrial and Labor Relations from Cornell
University and an M.P.P. from the University of Chicago.
Gary Sidor is a technical information specialist in the Domestic
Social Policy Division of the Congressional Research Service.
He holds a B.A. in Government from Wesleyan University.

60
URBAN INSTITUTE
2100 M Street NW
Washington, DC 20037
Phone (202) 261-5709
Fax (202) 728-0232
www.urban.org
This report is available on the Urban Institute Web site or
by calling the Urban Institute Office of Public Affairs at
(202) 261-5709.
Credits
Chart adaptation: Renu Shukla
Design: Diane Buric Design and Illustration
Printing: Westland Printers

URBAN INSTITUTE
2100 M Street, N.W.
Washington, D.C. 20037
Phone: (202) 261-5709
Fax: (202) 728-0232
E-mail: [email protected]
Web: www.urban.org