
Long Noncoding RNAs Expression Patterns Associated … · Long Noncoding RNAs Expression Patterns...
10
Long Noncoding RNAs Expression Patterns Associated with Chemo Response to Cisplatin Based Chemotherapy in Lung Squamous Cell Carcinoma Patients Zhibo Hou 1,2 , Chunhua Xu 1,2 , Haiyan Xie 1,2 , Huae Xu 3 , Ping Zhan 1,2 , Like Yu 1,2 *, Xuefeng Fang 4 * 1 First Department of Respiratory Medicine, Nanjing Chest Hospital, Medicine School of Southeast University, Nanjing, Jiangsu, China, 2 Clinical Center of Nanjing Respiratory Diseases and Imaging, Nanjing, Jiangsu, China, 3 Department of Pharmacy, The First Affiliated Hospital of Nanjing Medical University, Nanjing, Jiangsu, China, 4 Department of Medical Oncology, Second Affiliated Hospital, Zhejiang University College of Medicine, Hangzhou, Zhejiang, China Abstract Background: There is large variability among lung squamous cell carcinoma patients in response to treatment with cisplatin based chemotherapy. LncRNA is potentially a new type of predictive marker that can identify subgroups of patients who benefit from chemotherapy and it will have great value for treatment guidance. Methods: Differentially expressed lncRNAs and mRNA were identified using microarray profiling of tumors with partial response (PR) vs. with progressive disease (PD) from advanced lung squamous cell carcinoma patients treated with cisplatin based chemotherapy and validated by quantitative real-time PCR (qPCR). Furthermore, the expression of AC006050.3-003 was assessed in another 60 tumor samples. Results: Compared with the PD samples, 953 lncRNAs were consistently upregulated and 749 lncRNAs were downregulated consistently among the differentially expressed lncRNAs in PR samples (Fold Change$2.0-fold, p ,0.05). Pathway analyses showed that some classical pathways, including ‘‘Nucleotide excision repair,’’ that participated in cisplatin chemo response were differentially expressed between PR and PD samples. Coding-non-coding gene co-expression network identified many lncRNAs, such as lncRNA AC006050.3-003, that potentially played a key role in chemo response. The expression of lncRNA AC006050.3-003 was significantly lower in PR samples compared to the PD samples in another 60 lung squamous cell carcinoma patients. Receiver operating characteristic curve analysis revealed that lncRNA AC006050.3-003 was a valuable biomarker for differentiating PR patients from PD patients with an area under the curve of 0.887 (95% confidence interval 0.779, 0.954). Conclusions: LncRNAs seem to be involved in cisplatin-based chemo response and may serve as biomarkers for treatment response and candidates for therapy targets in lung squamous cell carcinoma. Citation: Hou Z, Xu C, Xie H, Xu H, Zhan P, et al. (2014) Long Noncoding RNAs Expression Patterns Associated with Chemo Response to Cisplatin Based Chemotherapy in Lung Squamous Cell Carcinoma Patients. PLoS ONE 9(9): e108133. doi:10.1371/journal.pone.0108133 Editor: Vinod Scaria, CSIR Institute of Genomics and Integrative Biology, India Received April 14, 2014; Accepted August 21, 2014; Published September 24, 2014 Copyright: ß 2014 Hou et al. This is an open-access article distributed under the terms of the Creative Commons Attribution License, which permits unrestricted use, distribution, and reproduction in any medium, provided the original author and source are credited. Data Availability: The authors confirm that all data underlying the findings are fully available without restriction. All relevant data are within the paper and its Supporting Information files, or in a public repository(GEO series accession number GSE59245 (http://www.ncbi.nlm.nih.gov/geo/query/acc.cgi?acc = GSE59245). The following link has been created to allow review of record GSE59245 while it remains in private status: http://www.ncbi.nlm.nih.gov/geo/query/acc. cgi?token = wvkbmgwwlbibxex&acc = GSE59245. Funding: This study was supported by the National Natural Science Foundation of China (No. 81101580), the Major Project of Nanjing Medical Science and Technique Development Fund (No. ZDX12013), the General Project of Nanjing Medical Science and Technology Development Fund (No. YKK13090) and Young Professional Personnel Training Fund of Nanjing Chest Hospital. The funders had no role in study design, data collection and analysis, decision to publish, or preparation of the manuscript. Competing Interests: The authors have declared that no competing interests exist. * Email: [email protected] (LY); [email protected] (XF) Background Lung cancer is a leading cause of cancer-related deaths worldwide, with non-small cell lung cancer (NSCLC) accounts for approximately 85% of all cases [1]. Most NSCLC patients are diagnosed at an advanced stage and have a 5-year survival rate of less than 20% [1]. Squamous cell carcinoma (SCC) is the second most common type of lung cancer, accounting for over 30% of NSCLC [2]. Encouraging new targeted agents have afforded benefits to lung adenocarcinoma (ADC) patients. Unfortunately, targeted agents developed for lung ADC are largely ineffective against lung SCC. Currently, the standard treatment for lung SCC remains a doublet of cisplatin plus one of the new agents other than pemetrexed [3–5]. However, there is large variability among individuals in response to treatment with cisplatin based chemo- therapy [6,7]. This highlights the importance of exploring new biomarkers that can predict cisplatin-based treatment efficacy for lung SCC. Human genome is comprised of ,1.2% protein coding genes and that ,90% of the genome is transcribed as non-coding RNA (ncRNA)[8]. The ncRNAs can be divided into two major classes: small noncoding RNAs (,200 bp), such as microRNA, and long PLOS ONE | www.plosone.org 1 September 2014 | Volume 9 | Issue 9 | e108133
Transcript of Long Noncoding RNAs Expression Patterns Associated … · Long Noncoding RNAs Expression Patterns...
Long Noncoding RNAs Expression Patterns Associatedwith Chemo Response to Cisplatin Based Chemotherapyin Lung Squamous Cell Carcinoma PatientsZhibo Hou1,2, Chunhua Xu1,2, Haiyan Xie1,2, Huae Xu3, Ping Zhan1,2, Like Yu1,2*, Xuefeng Fang4*
1 First Department of Respiratory Medicine, Nanjing Chest Hospital, Medicine School of Southeast University, Nanjing, Jiangsu, China, 2 Clinical Center of Nanjing
Respiratory Diseases and Imaging, Nanjing, Jiangsu, China, 3 Department of Pharmacy, The First Affiliated Hospital of Nanjing Medical University, Nanjing, Jiangsu, China,
4 Department of Medical Oncology, Second Affiliated Hospital, Zhejiang University College of Medicine, Hangzhou, Zhejiang, China
Abstract
Background: There is large variability among lung squamous cell carcinoma patients in response to treatment with cisplatinbased chemotherapy. LncRNA is potentially a new type of predictive marker that can identify subgroups of patients whobenefit from chemotherapy and it will have great value for treatment guidance.
Methods: Differentially expressed lncRNAs and mRNA were identified using microarray profiling of tumors with partialresponse (PR) vs. with progressive disease (PD) from advanced lung squamous cell carcinoma patients treated with cisplatinbased chemotherapy and validated by quantitative real-time PCR (qPCR). Furthermore, the expression of AC006050.3-003was assessed in another 60 tumor samples.
Results: Compared with the PD samples, 953 lncRNAs were consistently upregulated and 749 lncRNAs were downregulatedconsistently among the differentially expressed lncRNAs in PR samples (Fold Change$2.0-fold, p ,0.05). Pathway analysesshowed that some classical pathways, including ‘‘Nucleotide excision repair,’’ that participated in cisplatin chemo responsewere differentially expressed between PR and PD samples. Coding-non-coding gene co-expression network identified manylncRNAs, such as lncRNA AC006050.3-003, that potentially played a key role in chemo response. The expression of lncRNAAC006050.3-003 was significantly lower in PR samples compared to the PD samples in another 60 lung squamous cellcarcinoma patients. Receiver operating characteristic curve analysis revealed that lncRNA AC006050.3-003 was a valuablebiomarker for differentiating PR patients from PD patients with an area under the curve of 0.887 (95% confidence interval0.779, 0.954).
Conclusions: LncRNAs seem to be involved in cisplatin-based chemo response and may serve as biomarkers for treatmentresponse and candidates for therapy targets in lung squamous cell carcinoma.
Citation: Hou Z, Xu C, Xie H, Xu H, Zhan P, et al. (2014) Long Noncoding RNAs Expression Patterns Associated with Chemo Response to Cisplatin BasedChemotherapy in Lung Squamous Cell Carcinoma Patients. PLoS ONE 9(9): e108133. doi:10.1371/journal.pone.0108133
Editor: Vinod Scaria, CSIR Institute of Genomics and Integrative Biology, India
Received April 14, 2014; Accepted August 21, 2014; Published September 24, 2014
Copyright: � 2014 Hou et al. This is an open-access article distributed under the terms of the Creative Commons Attribution License, which permits unrestricteduse, distribution, and reproduction in any medium, provided the original author and source are credited.
Data Availability: The authors confirm that all data underlying the findings are fully available without restriction. All relevant data are within the paper and itsSupporting Information files, or in a public repository(GEO series accession number GSE59245 (http://www.ncbi.nlm.nih.gov/geo/query/acc.cgi?acc = GSE59245).The following link has been created to allow review of record GSE59245 while it remains in private status: http://www.ncbi.nlm.nih.gov/geo/query/acc.cgi?token = wvkbmgwwlbibxex&acc = GSE59245.
Funding: This study was supported by the National Natural Science Foundation of China (No. 81101580), the Major Project of Nanjing Medical Science andTechnique Development Fund (No. ZDX12013), the General Project of Nanjing Medical Science and Technology Development Fund (No. YKK13090) and YoungProfessional Personnel Training Fund of Nanjing Chest Hospital. The funders had no role in study design, data collection and analysis, decision to publish, orpreparation of the manuscript.
Competing Interests: The authors have declared that no competing interests exist.
* Email: [email protected] (LY); [email protected] (XF)
Background
Lung cancer is a leading cause of cancer-related deaths
worldwide, with non-small cell lung cancer (NSCLC) accounts
for approximately 85% of all cases [1]. Most NSCLC patients are
diagnosed at an advanced stage and have a 5-year survival rate of
less than 20% [1]. Squamous cell carcinoma (SCC) is the second
most common type of lung cancer, accounting for over 30% of
NSCLC [2]. Encouraging new targeted agents have afforded
benefits to lung adenocarcinoma (ADC) patients. Unfortunately,
targeted agents developed for lung ADC are largely ineffective
against lung SCC. Currently, the standard treatment for lung SCC
remains a doublet of cisplatin plus one of the new agents other
than pemetrexed [3–5]. However, there is large variability among
individuals in response to treatment with cisplatin based chemo-
therapy [6,7]. This highlights the importance of exploring new
biomarkers that can predict cisplatin-based treatment efficacy for
lung SCC.
Human genome is comprised of ,1.2% protein coding genes
and that ,90% of the genome is transcribed as non-coding RNA
(ncRNA)[8]. The ncRNAs can be divided into two major classes:
small noncoding RNAs (,200 bp), such as microRNA, and long
PLOS ONE | www.plosone.org 1 September 2014 | Volume 9 | Issue 9 | e108133

noncoding RNAs (lncRNAs;.200 bp) according to their tran-
script size. lncRNAs can be classified into exonic lncRNAs,
intronic lncRNAs, intergenic lncRNAs (also known as large
intergenic non-coding RNAs, lincRNAs) and overlapping
lncRNAs in accordance with their location relative to the
protein-coding transcripts[9]. LncRNAs have been implicated in
carcinogenesis and cancer progression [10–15]. lncRNAs can act
as tumor oncogenes or tumor suppressors just like protein coding
genes or miRNA.
Recent studies suggest that lncRNAs also play a significant role
in chemotherapy sensitivity and some lncRNAs has now been
associated with chemotherapy sensitivity phenotypes in cancer.
The lnRNA H19 gene could induce P-glycoprotein expression and
MDR1-associated drug resistance in liver cancer cells through
regulation of MDR1 promoter methylation [16]. LncRNAs are
differently expressed between lung ADC A549 and A549/CDDP
cells, many of which could regulate cisplatin resistance through
different mechanisms. LnRNAAK126698 was found to confer
cisplatin resistance by targeting the Wnt pathway [17]. LncRNA
HOTAIR was observed to be significantly downregulated in
cisplatin-responding lung ADC tissues and contributes to cisplatin
resistance of lung ADC cells via regualtion of p21WAF1/CIP1
expression [18].
Owing to its possible effect on cisplatin resistance, we
anticipated whether lncRNAs might influence tumor response to
cisplatin based chemotherapy in lung SCC. The identification of
lncRNAs that predict either sensitivity or resistance to cisplatin
based chemotherapy is of great importance to individualized
treatment of lung SCC.
In this study, we profiled lncRNA and mRNA expression in
lung SCC patients having either partial response or progressive
disease after cisplatin based chemotherapy. An integrative analysis
combining lncRNA and mRNA changes within co-expression
networks was performed to explore genes that may be related to
cisplatin sensitivity in lung SCC. Several of different expressions of
lncRNAs and mRNA were further validated by quantitative real-
time PCR (qPCR) in lung SCC tissue samples. lncRNAs
expression profiles may provide new molecular biomarkers for
predicting responding to cisplatin based chemotherapy of lung
SCC.
Methods
Patient SamplesAll collected snap-frozen tissue samples used in this study were
obtained by biopsy through bronchoscope or percutaneous lung
biopsy under computerized tomography scan from primary sites of
advanced stage lung SCC patients at Nanjing Chest Hospital and
Second Affiliated Hospital of Zhejiang University College of
Medicine during January 2009 and January 2013. All patients
were histopathologically diagnosed by at least two independent
senior pathologists. All of the tumors were unresectable and no
patient underwent radiotherapy or chemotherapy prior to biopsy.
Front-line chemotherapy comprised cisplatin 75 mg/m2 on days
1, and gemcitabine 1000 mg/m2 on days 1, 8, or docetaxel
75 mg/m2 on days 1 every 21 days for a maximum of 4 cycles.
Response to therapy was defined by thoracic computerized
tomography scan according to Response Evaluation Criteria In
Solid Tumors (RECIST 1.1) [19]. Objective tumor response for
target lesions are classed as: complete Response (CR), partial
response (PR), progressive disease (PD), and stable disease (SD). In
this study, PR was considered as sensitive and PD was considered
as resistant. Tissue samples were obtained after patients’ written
informed consent under a general tissue collection protocol
approved by The Research Ethics Committee of the Nanjing
Chest Hospital and The Research Ethics Committee of Second
Affiliated Hospital of Zhejiang University College of Medicine.
LncRNA microarray and Computational AnalysisSamples. Total RNA was extracted with TRIzol reagent
(Invitrogen, Carlsbad, CA, USA) according to the manufacturer’s
protocol. RNA quantity and quality were measured by NanoDrop
ND-1000 spectrophotometer (PeqLab, Erlangen, Germany). Total
RNA integrity was assessed by Agilent 2100 Bioanalyzer (Agilent
Technologies, Santa Clara, USA).
RNA microarray. The Arraystar Human LncRNA Array
v3.0 (Arraystar, Rockville, MD) was designed for profiling both
lncRNAs and protein-coding RNAs in human genome. 33,045
lncRNAs were collected from the authoritative data sources
including RefSeq, UCSC Knowngenes, Ensembl and many
related literatures.
RNA labeling and array hybridizationSample labeling and array hybridization were performed
according to the Agilent One-Color Microarray-Based Gene
Expression Analysis protocol (Agilent Technologies, Santa Clara,
USA) with minor modifications. Briefly, mRNA was purified from
total RNA after removal of rRNA using mRNA-ONLY Eukary-
otic mRNA Isolation Kit (Epicentre Biotechnologies, Madison,
Wisconsin, USA). Then, each sample was amplified and
transcribed into fluorescent cRNA along the entire length of the
transcripts without 39 bias utilizing a random priming method.
The labeled cRNAs were purified by RNeasy Mini Kit (Qiagen,
Inc., Valencia, CA). The concentration and specific activity of the
labeled cRNAs (pmol Cy3/mg cRNA) were measured by
NanoDrop ND-1000. 1 mg of each labeled cRNA was fragmented
by adding 5 ml 10 6 Blocking Agent and 1 ml of 25 6Fragmentation Buffer, then heated the mixture at 60uC for
30 min, finally 25 ml 2 6 GE Hybridization buffer was added to
dilute the labeled cRNA. 50 ml of hybridization solution was
dispensed into the gasket slide and assembled to the LncRNA
expression microarray slide. The slides were incubated for
17 hours at 65uC in an Agilent Hybridization Oven. The
hybridized arrays were washed, fixed and scanned with using
the Agilent DNA Microarray Scanner (part number G2505C).
Data analysis. Agilent Feature Extraction software (version
11.0.1.1) was used to analyze acquired array images. Quantile
normalization and subsequent data processing were performed
with using the GeneSpring GX v11.5.1 software package (Agilent
Technologies, Santa Clara, USA). After quantile normalization of
the raw data, lncRNAs and mRNAs that at least 10 out of 10
samples have flags in Present or Marginal ("All Targets Value")
were chosen for further data analysis. Differentially expressed
lncRNAs and mRNAs with statistical significance between the two
groups were identified through Volcano Plot filtering. Log fold-
change means log2 value of absolute fold-change. Fold-change and
p value are calculated from the normalized expression. Hierarchical
Clustering was performed using the Agilent GeneSpring GX
software (version 11.5.1). The microarray data have been deposited
in National Center for Biotechnology Information (NCBI) Gene
Expression Omnibus (GEO) database and are accessible through
GEO series accession number GSE59245 (http://www.ncbi.nlm.
nih.gov/geo/query/acc.cgi?acc=GSE59245).
qPCRThe expression of lncRNA or mRNA was detected by qPCR.
The primers are listed as Table S1. b-actin was used as an internal
control. The primers for b-actin were as follows: the forward
LncRNAs and Cisplatin Chemo Response
PLOS ONE | www.plosone.org 2 September 2014 | Volume 9 | Issue 9 | e108133

primer 59-AGCGAGCATCCCCCAAAGTT-39 and the reverse
primer 59-GGGCACGAAGGCTCATCATT-39. qPCR was per-
formed using the SYBR Green (TaKaRa Bio Inc., Dalian, China)
dye detection method on ABI PlusOne PCR instrument under
default conditions: 95uC for 10 sec, and 40 cycles of 95uC for 5 s
and 55uC for 31 S. Relative gene expression levels were analyzed
by the 22DCt method, where DCt = Cttarget2 Ctb-actin [20].
Functional group analysisBase on the latest KEGG (Kyoto Encyclopedia of Genes and
Genomes) database (http://www.genome.jp/kegg/), we provide
pathway analysis for differentially expressed mRNAs. This analysis
allows us to determine the biological pathway that there is a
significant enrichment of differentially expressed mRNAs. The p-
value (EASE-score, Fisher-P value or Hypergeometric-P value)
denotes the significance of the Pathway correlated to the
conditions. The recommend p-value cut-off is 0.05.
Construction of the Coding-non-coding Gene Co-expression Network
Gene co-expression network was constructed according to the
specific expression lncRNAs and mRNAs [21]. The median gene
expression value was used to represent the expression of the same
coding gene with different transcripts. The primary lncRNA
expression value was adopted with no particular processing. To
normalize signal intensity of specific expression genes, we remove
the subset of data that shown the differential expression of lncRNA
and mRNA according to the primary lists from the microarray
results. Pearson correlation coefficient (PCC) was calculated and
the R value was used to compute the correlation coefficient of the
PCC between lncRNAs and coding genes. LncRNAs and mRNAs
with Pearson correlation coefficients not less than 0.99 were
selected as significant correlation pairs to draw the co-expression
network using Cytoscape. In the network, a regular hexagon node
represents lncRNA, circular node represents the coding gene. A
brown node represents an over-regulated lncRNA or mRNA and
a blue node represents an under-regulated lncRNA or mRNA.
The solid lines indicate a positive correlation and the dashed line
indicates a negative correlation.
Statistical AnalysisThe GraphPad Prism 6.0 (GraphPad Software, LaJolla, CA)
was used for statistical analysis. Data are expressed as the means 6
SD. For a single comparison of 2 groups, Student’s t test was used.
Differences were considered statistically significant at P,0.05. A
receiver operating characteristic (ROC) curve was performed by
MedCalc software (version 11.4; Broekstraat, Mariakerke, Bel-
gium).
Results
Differentially expressed lncRNAsWe profiled the expression of lncRNAs in tumors from patients
with advanced SCC subsequently treated with cisplatin based
chemotherapy. Five patients experienced PR and five patients
experienced PD according to the RECIST criteria. The basic
information of the ten patients was shown in Table S2. The
expression profiles of lncRNAs in two groups were shown by
calculating log fold change PR/PD, positive value indicates
upregulation and negative value indicates downregulation. Differ-
entially expressed lncRNAs with statistical significance were
identified by a Volcano Plot filtering between PR and PD groups
(Fold Change cut-off: 2.0, P-value,0.05). Compared with the PD
samples, 953 lncRNAs were consistently upregulated, and 749
lncRNAs were downregulated consistently among the differentially
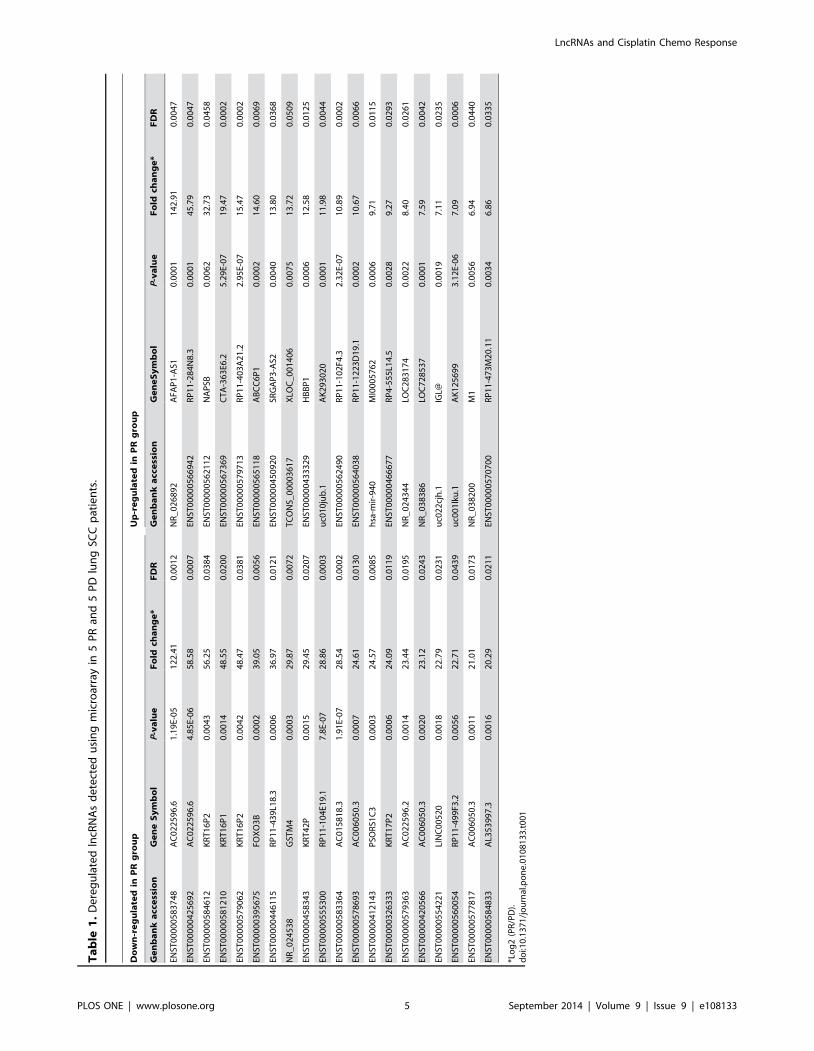
expressed lncRNAs in PR samples. Hierarchical clustering analysis
was used to arrange samples into groups based on their expression
levels (Figure 1A). The expression levels of the 20 top ranked
lncRNAs in the different samples (PR vs. PD) are listed in Table 1.
LncRNA Classification and Subgroup AnalysisEnhancer lncRNAs profiling. LncRNAs with enhancer-like
function are identified using GENCODE annotation of the human
genes [22], [23]. The consideration of selection of lncRNAs with
enhancer-like function exclude transcripts mapping to the exons
and introns of annotated protein coding genes, the natural
antisense transcripts, overlapping the protein coding genes and
all known transcripts. Fifty-one differentially expressed enhancer-
like lncRNAs and their nearby coding genes (distance, 300 kb)
were showed in Table S3.
HOX cluster profiling. In current study, the profiling data
of all probes targeting 407 discrete transcribed regions in the four
human HOX loci for both lncRNAs and coding transcripts was
presented in the Table S4[24]. These data suggested that 30
coding transcripts could be detected in SCC tissues with 17 of
them differentially expressed. Then, about 34 lncRNAs tran-
scribed were detected in SCC tissues and 18 of them were found
differently expressed in human HOX loci.
LincRNAs profiling. lincRNAs are a subtype of lncRNAs,
which are transcribed from intergenic regions [2]. Previous studies
found that lincRNAs could regulate the expression of neighbour-
ing genes and distant genomic sequences, thus play key roles in
certain biological processes [25,26]. All probes for lincRNAs in
microarray were calculated by genomic coordinates [13,27]. 405
differentially expressed lincRNAs and nearby coding gene pairs
(distance ,300 kb) between PR and PD groups were showed in
Table S5.
Differentially expressed mRNAsFrom the mRNA expression profiling data, a total of 16,851
mRNAs were identified in the samples through microarray
analysis. Compared with PD group, 1223 mRNAs were consis-
tently upregulated, and 1947 mRNAs were consistently downreg-
ulated in PR group. The expression levels of the 20 top ranked
mRNAs in the different samples (PR vs. PD) are listed in Table 2.
The Hierarchical clustering analysis indicated the relationships
among the mRNA expression patterns that were present in the
samples (Figure 1B).
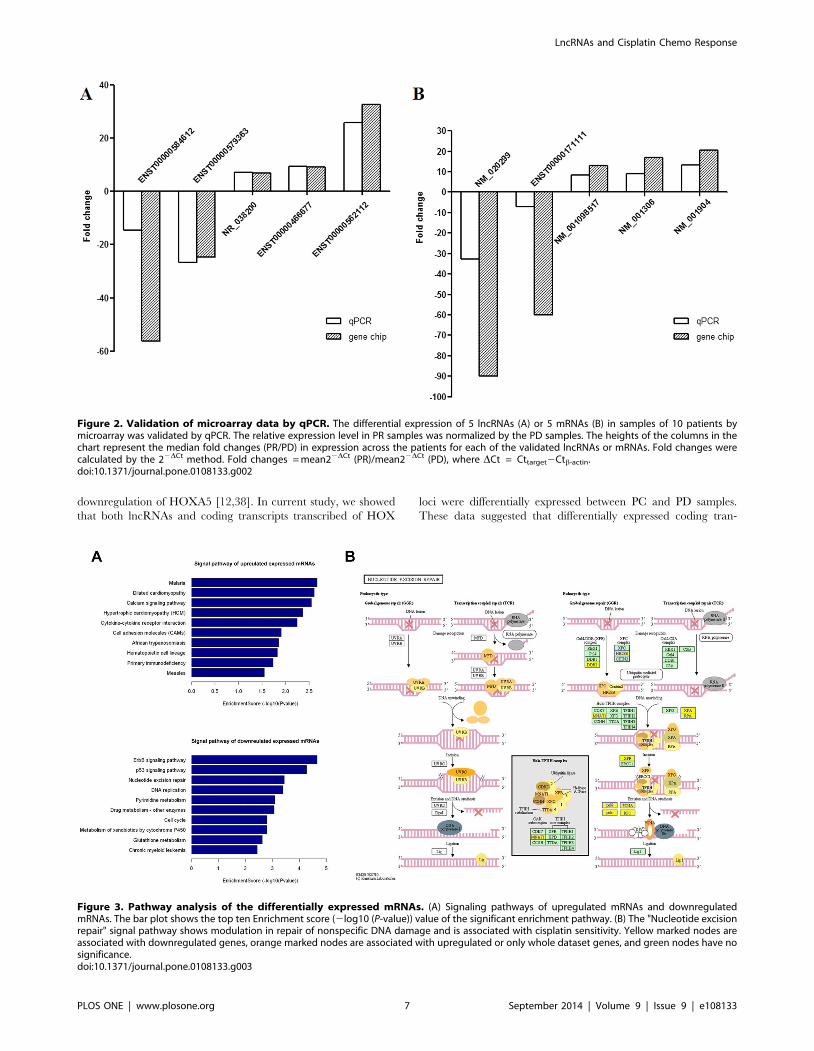
Validation of the microarray data using qPCRFive lncRNAs (ENST00000584612, ENST00000579363,
NR_038200, ENST00000466677 and ENST00000562112) and
five mRNAs (NM_020299, ENST00000171111, NM_001098517,
NM_001306 and NM_001904) were randomly selected to validate
the microarray consistency by using qPCR. The results demon-
strated that lncRNA ENST00000584612 and ENST00000579363
were downregulated and that NR_038200, ENST00000466677
and ENST00000562112 were upregulated in the PR samples
compared with PD samples (Figure 2A). For mRNA, NM_020299
and ENST00000171111 were downregulated and that
NM_001098517, NM_001306 and NM_001904 were upregu-
lated in the PR samples compared with PD samples (Figure 2B).
These above qPCR results are consistent with microarray data.
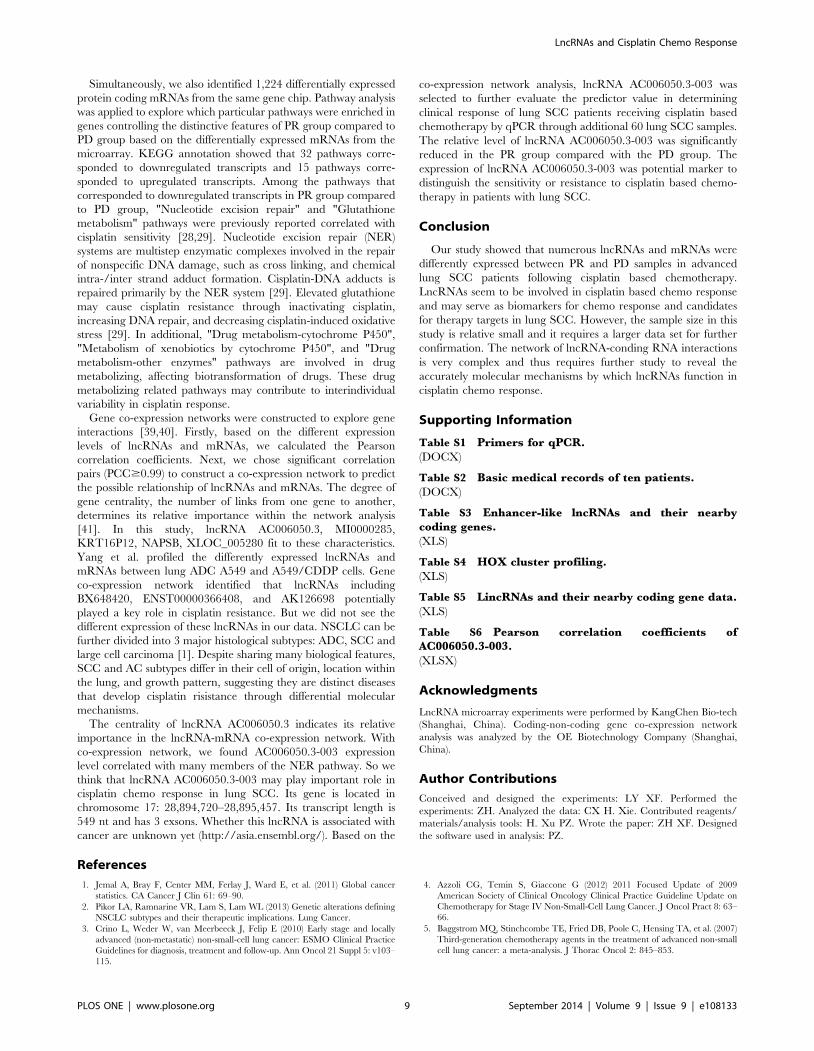
Pathway analysisPathway analysis indicated that 32 pathways corresponded to
underregulated transcripts in PR group. Among the 32 pathways,
LncRNAs and Cisplatin Chemo Response
PLOS ONE | www.plosone.org 3 September 2014 | Volume 9 | Issue 9 | e108133

we found that several enriched networks including "Nucleotide
excision repair", "Glutathione metabolism", "Drug metabolism-
cytochrome P450", "Metabolism of xenobiotics by cytochrome
P450", "Drug metabolism-other enzymes" and "Calcium signaling
pathway" were associated with chemotherapeutic drugs metabo-
lism (Figure 3A). Of note, "Nucleotide excision repair" has been
reported intensively to be correlated with cisplatin sensitivity
(Figure 3B) [28,29]. Furthermore, Pathway analysis showed that
15 pathways corresponded to upregulated transcripts in PD group.
One of these pathways, the gene category "Calcium signaling
pathway", has been reported to be involved in the cisplatin
resistance [30,31] (Figure 3A).
Co-expression networkCoding-non-coding gene co-expression network analysis was
undertaken to explore which gene played a critical role in cisplatin
resistance. The more important role the gene played, the more
central the gene is within the network. Co-expression network was
constructed to cluster lncRNAs and coding mRNAs into
phenotypically relevant modules based on the correlation analysis
between the differential expressed lncRNAs and mRNAs (Fig-
ure 4). Among this co-expression network, 49 lncRNAs and 186
mRNAs composed the CNC network node. Two hundred and
thirty-five network nodes made associated 1063 network pairs (700
positive correlations and 363 negative correlations) of co-
expression lncRNAs and mRNAs. The results indicated that
many lncRNAs such as AC006050.3, NAPSB, KRT16P2,
XLOC_005280 and MI0000285 potentially play important role
in the network. AC006050.3 has 3 transcripts, such as
AC006050.3-001, AC006050.3-002, and AC006050.3-003. All
the 3 transcripts are downregulated in PR group compared to PD
group (Table 1). With co-expression network, lncRNA
AC006050.3-003 (ENST00000578693) expression level correlated
with many members of the NER pathway such as DDB2, POLE2
and MNAT1 (Table S6). LncRNA AC006050.3-003 might play
key role in cisplatin chemo response and was selected for further
study.
Potential predictor values of AC006050.3-003The expression of lncRNA AC006050.3-003 was next detected
by qPCR in the other 60 lung SCC patients received cisplatin
based chemotherapy (Figure 5A). The expression of lncRNA
AC006050.3-003 was significantly lower in PR samples compared
with the PD samples. These results indicated that lncRNA
AC006050.3-003 was aberrantly expressed between PC and PD
patients. We next performed an analysis to identify whether
lncRNA AC006050.3-003 expression could predict the effect of
cisplatin chemo response. As shown in Figure 5B, ROC curve
analysis revealed that lncRNA AC006050.3-003 was a valuable
biomarker for differentiating PR patients from PD patients with an
area under the curve (AUC) of 0.887 (95% confidence interval
0.779, 0.954). These results suggested that lower expression of
lncRNA AC006050.3-003 might correlate with sensitivity to
chemotherapy in lung SCC patients.
Discussion
In the present study, we performed lncRNA expression profiling
of tumor samples from patients with advanced lung SCC that
showed PR or PD, following cisplatin based chemotherapy. The
lncRNA profiling identified a set of differentially expressed
lncRNAs that were correlated with chemotherapy response. There
are 953 upregulated lncRNAs and 749 downregulated lncRNAs
that were significantly differentially expressed ($2.0-fold) in PR
group compared to PD group.
The qPCR results validate that expression of lncRNAs are
consistent with the data of microarray. There was distinctive
expression of lncRNAs between PR and PD samples. It was likely
to provide potential way to distinguish PR group from PD group
and provide new biomarkers to predict cisplatin sensitivity for lung
SCC individualized treatment. The differentially expressed
lncRNAs and nearby coding gene pairs identified here may
provide novel path for better understanding of the molecular basis
of cisplatin resistance in lung SCC.
The lncRNA expression microarray used in this study included
five subgroups: Enhancer lncRNAs, Rinn lincRNAs, HOX
cluster, lincRNAs nearby coding gene, and Enhancer lncRNAs
nearby coding gene. HOX lncRNAs and the lncRNAs with
enhancer-like function are two special subgroups of lncRNAs.
Previous studies have shown that there is deregulation of HOX
gene expression in various of cancers including lung cancer
[32,33]. HOX lncRNAs are intergenic and are transcribed in the
direction opposite to the HOX genes [34,35]. Many studies have
reported that HOX lncRNAs are implicated in transcriptional
regulation of neighboring HOX genes and found to involve in the
occurrence and development of cancers [10,14,36,37]. For
example, HOTAIR (Hox transcript antisense intergenic RNA) is
significantly upregulated in NSCLC tissues, and involves in
NSCLC cell proliferation and metastasis, partially via the
Figure 1. Heatmaps of lncRNA and mRNA expression patterns. RNA expression is depicted according to treatment response. (A) HierarchicalClustering for ‘‘Differentially expressed lncRNAs’’. (B) Hierarchical Clustering for ‘‘Differentially expressed mRNAs’’. ‘‘Red’’ indicates high relativeexpression, and ‘‘green’’ indicates low relative expression.doi:10.1371/journal.pone.0108133.g001
LncRNAs and Cisplatin Chemo Response
PLOS ONE | www.plosone.org 4 September 2014 | Volume 9 | Issue 9 | e108133
Ta
ble
1.
De
reg
ula
ted
lncR
NA
sd
ete
cte
du
sin
gm
icro
arra
yin
5P
Ran
d5
PD
lun
gSC
Cp
atie
nts
.
Do
wn
-re
gu
late
din
PR
gro
up
Up
-re
gu
late
din
PR
gro
up
Ge
nb
an
ka
cce
ssio
nG
en
eS
ym
bo
lP
-va
lue
Fo
ldch
an
ge
*F
DR
Ge
nb
an
ka
cce
ssio
nG
en
eS
ym
bo
lP
-va
lue
Fo
ldch
an
ge
*F
DR
ENST
00
00
05
83
74
8A
C0
22
59
6.6
1.1
9E-
05
12
2.4
10
.00
12
NR
_0
26
89
2A
FAP
1-A
S10
.00
01
14
2.9
10
.00
47
ENST
00
00
04
25
69
2A
C0
22
59
6.6
4.8
5E-
06
58
.58
0.0
00
7EN
ST0
00
00
56
69
42
RP
11
-28
4N
8.3
0.0
00
14
5.7
90
.00
47
ENST
00
00
05
84
61
2K
RT
16
P2
0.0
04
35
6.2
50
.03
84
ENST
00
00
05
62
11
2N
AP
SB0
.00
62
32
.73
0.0
45
8
ENST
00
00
05
81
21
0K
RT
16
P1
0.0
01
44
8.5
50
.02
00
ENST
00
00
05
67
36
9C
TA
-36
3E6
.25
.29
E-0
71
9.4
70
.00
02
ENST
00
00
05
79
06
2K
RT
16
P2
0.0
04
24
8.4
70
.03
81
ENST
00
00
05
79
71
3R
P1
1-4
03
A2
1.2
2.9
5E-
07
15
.47
0.0
00
2
ENST
00
00
03
95
67
5FO
XO
3B
0.0
00
23
9.0
50
.00
56
ENST
00
00
05
65
11
8A
BC
C6
P1
0.0
00
21
4.6
00
.00
69
ENST
00
00
04
46
11
5R
P1
1-4
39
L18
.30
.00
06
36
.97
0.0
12
1EN
ST0
00
00
45
09
20
SRG
AP
3-A
S20
.00
40
13
.80
0.0
36
8
NR
_0
24
53
8G
STM
40
.00
03
29
.87
0.0
07
2T
CO
NS_
00
00
36
17
XLO
C_
00
14
06
0.0
07
51
3.7
20
.05
09
ENST
00
00
04
58
34
3K
RT
42
P0
.00
15
29
.45
0.0
20
7EN
ST0
00
00
43
33
29
HB
BP
10
.00
06
12
.58
0.0
12
5
ENST
00
00
05
55
30
0R
P1
1-1
04
E19
.17
.8E-
07
28
.86
0.0
00
3u
c01
0ju
b.1
AK
29
30
20
0.0
00
11
1.9
80
.00
44
ENST
00
00
05
83
36
4A
C0
15
81
8.3
1.9
1E-
07
28
.54
0.0
00
2EN
ST0
00
00
56
24
90
RP
11
-10
2F4
.32
.32
E-0
71
0.8
90
.00
02
ENST
00
00
05
78
69
3A
C0
06
05
0.3
0.0
00
72
4.6
10
.01
30
ENST
00
00
05
64
03
8R
P1
1-1
22
3D
19
.10
.00
02
10
.67
0.0
06
6
ENST
00
00
04
12
14
3P
SOR
S1C
30
.00
03
24
.57
0.0
08
5h
sa-m
ir-9
40
MI0
00
57
62
0.0
00
69
.71
0.0
11
5
ENST
00
00
03
26
33
3K
RT
17
P2
0.0
00
62
4.0
90
.01
19
ENST
00
00
04
66
67
7R
P4
-55
5L1
4.5
0.0
02
89
.27
0.0
29
3
ENST
00
00
05
79
36
3A
C0
22
59
6.2
0.0
01
42
3.4
40
.01
95
NR
_0
24
34
4LO
C2
83
17
40
.00
22
8.4
00
.02
61
ENST
00
00
04
20
56
6A
C0
06
05
0.3
0.0
02
02
3.1
20
.02
43
NR
_0
38
38
6LO
C7
28
53
70
.00
01
7.5
90
.00
42
ENST
00
00
05
54
22
1LI
NC
00
52
00
.00
18
22
.79
0.0
23
1u
c02
2cj
h.1
IGL@
0.0
01
97
.11
0.0
23
5
ENST
00
00
05
60
05
4R
P1
1-4
99
F3.2
0.0
05
62
2.7
10
.04
39
uc0
01
lku
.1A
K1
25
69
93
.12
E-0
67
.09
0.0
00
6
ENST
00
00
05
77
81
7A
C0
06
05
0.3
0.0
01
12
1.0
10
.01
73
NR
_0
38
20
0M
10
.00
56
6.9
40
.04
40
ENST
00
00
05
84
83
3A
L35
39
97
.30
.00
16
20
.29
0.0
21
1EN
ST0
00
00
57
07
00
RP
11
-47
3M
20
.11
0.0
03
46
.86
0.0
33
5
*Lo
g2
(PR
/PD
).d
oi:1
0.1
37
1/j
ou
rnal
.po
ne
.01
08
13
3.t
00
1
LncRNAs and Cisplatin Chemo Response
PLOS ONE | www.plosone.org 5 September 2014 | Volume 9 | Issue 9 | e108133

Ta
ble
2.
De
reg
ula
ted
mR
NA
sd
ete
cte
du
sin
gm
icro
arra
yin
5P
Ran
d5
PD
lun
gSC
Cp
atie
nts
.
Do
wn
-re
gu
late
din
PR
gro
up
Up
-re
gu
late
din
PR
gro
up
Ge
nb
an
ka
cce
ssio
nG
en
eS
ym
bo
lP
-va
lue
Fo
ldch
an
ge
*F
DR
Ge
nb
an
ka
cce
ssio
nG
en
eS
ym
bo
lP
-va
lue
Fo
ldch
an
ge
*F
DR
NM
_2
07
39
2K
RT
DA
P5
.97
E-0
82
10
.97
5.9
2E-
05
ENST
00
00
03
04
74
9C
ST1
0.0
03
83
1.2
20
.02
44
NM
_0
03
12
5SP
RR
1B
9.7
2E-
05
13
8.3
40
.00
27
NM
_0
01
14
50
77
LRR
C1
0B
0.0
12
23
.30
0.0
48
0
ENST
00
00
03
68
75
0SP
RR
2E
0.0
04
51
27
.54
0.0
27
3N
M_
00
19
04
CT
NN
B1
2.1
1E-
05
20
.46
0.0
01
2
ENST
00
00
03
60
37
9SP
RR
2D
3.5
0E-
05
10
4.8
70
.00
15
NM
_0
01
00
82
19
AM
Y1
C0
.00
41
19
.80
0.0
25
5
NM
_0
05
98
8SP
RR
2A
0.0
05
19
3.7
30
.02
90
NM
_1
78
45
2D
NA
AF1
0.0
11
19
.07
0.0
45
3
NM
_0
20
29
9A
KR
1B
10
0.0
01
79
0.0
00
.01
49
NM
_0
25
24
4T
SGA
10
0.0
03
81
7.9
90
.02
46
ENST
00
00
03
68
78
9LC
E3E
3.9
3E-
05
86
.40
0.0
01
6N
M_
00
06
99
AM
Y2
A0
.00
65
17
.67
0.0
33
5
NM
_0
01
01
74
18
SPR
R2
B0
.00
09
88
5.0
20
.01
09
ENST
00
00
03
05
90
4D
YN
LRB
20
.00
99
17
.31
0.0
42
9
NM
_0
01
08
05
38
AK
R1
B1
50
.02
30
84
.25
0.0
23
0N
M_
00
13
06
CLD
N3
0.0
07
21
6.8
20
.03
54
NM
_0
32
33
0C
AP
NS2
0.0
06
66
9.8
70
.03
38
NM
_0
01
00
82
18
AM
Y1
B0
.00
65
15
.94
0.0
33
5
NM
_1
82
50
2T
MP
RSS
11
B4
.28
E-0
66
6.4
20
.00
05
NM
_1
47
16
9C
9o
rf2
40
.01
21
5.7
90
.04
73
NM
_0
01
01
44
50
SPR
R2
F0
.00
16
64
.79
0.0
14
8EN
ST0
00
00
37
91
33
C9
orf
24
0.0
11
15
.57
0.0
44
7
ENST
00
00
01
71
11
1K
EAP
10
.00
27
59
.87
0.0
19
9N
M_
02
46
87
ZB
BX
0.0
07
81
5.5
20
.03
71
NM
_0
02
63
8P
I30
.00
15
56
.93
0.0
14
1N
M_
15
27
84
CA
TSP
ERD
0.0
01
31
5.4
00
.01
28
NM
_0
12
39
7SE
RP
INB
13
0.0
00
59
50
.69
0.0
08
0N
M_
17
35
54
C1
0o
rf1
07
0.0
07
51
5.1
60
.03
65
NM
_0
05
21
8D
EFB
15
.29
E-0
74
7.2
90
.00
01
NM
_0
15
66
8R
GS2
20
.00
64
14
.08
0.0
33
2
ENST
00
00
03
68
73
3S1
00
A8
5.9
5E-
05
46
.06
0.0
02
1N
M_
00
19
35
DP
P4
0.0
02
01
3.5
20
.01
68
NM
_0
00
52
6K
RT
14
2.9
1E-
07
42
.90
0.0
00
1N
M_
00
10
98
51
7C
AD
M1
0.0
00
41
3.0
40
.00
62
NM
_0
04
98
8M
AG
EA1
7.8
6E-
07
38
.92
0.0
00
2N
M_
00
09
00
MG
P0
.00
02
10
.71
0.0
04
1
NM
_0
02
63
9SE
RP
INB
50
.00
82
37
.14
0.0
38
5EN
ST0
00
00
28
87
10
CC
DC
16
40
.01
11
10
.47
0.0
46
*Lo
g2
(PR
/PD
).d
oi:1
0.1
37
1/j
ou
rnal
.po
ne
.01
08
13
3.t
00
2
LncRNAs and Cisplatin Chemo Response
PLOS ONE | www.plosone.org 6 September 2014 | Volume 9 | Issue 9 | e108133
downregulation of HOXA5 [12,38]. In current study, we showed
that both lncRNAs and coding transcripts transcribed of HOX
loci were differentially expressed between PC and PD samples.
These data suggested that differentially expressed coding tran-
Figure 2. Validation of microarray data by qPCR. The differential expression of 5 lncRNAs (A) or 5 mRNAs (B) in samples of 10 patients bymicroarray was validated by qPCR. The relative expression level in PR samples was normalized by the PD samples. The heights of the columns in thechart represent the median fold changes (PR/PD) in expression across the patients for each of the validated lncRNAs or mRNAs. Fold changes werecalculated by the 22DCt method. Fold changes = mean22DCt (PR)/mean22DCt (PD), where DCt = Cttarget2Ctb-actin.doi:10.1371/journal.pone.0108133.g002
Figure 3. Pathway analysis of the differentially expressed mRNAs. (A) Signaling pathways of upregulated mRNAs and downregulatedmRNAs. The bar plot shows the top ten Enrichment score (2log10 (P-value)) value of the significant enrichment pathway. (B) The "Nucleotide excisionrepair" signal pathway shows modulation in repair of nonspecific DNA damage and is associated with cisplatin sensitivity. Yellow marked nodes areassociated with downregulated genes, orange marked nodes are associated with upregulated or only whole dataset genes, and green nodes have nosignificance.doi:10.1371/journal.pone.0108133.g003
LncRNAs and Cisplatin Chemo Response
PLOS ONE | www.plosone.org 7 September 2014 | Volume 9 | Issue 9 | e108133

scripts and lncRNAs transcribed of HOX loci were correlated with
cisplatin chemotherapy response in lung SCC. Our microarray
also displayed a portion of differentially expressed enhancer like
lncRNAs. LncRNAs with an enhancer-like function were identi-
fied in various human cell lines and were involved in cellular
differentiation. Depletion of a number of enhancer lncRNAs could
lead to decreased expression of their neighboring protein-coding
genes, such as TAL1, Snai1 and Snai2 [23]. To uncover the
precise mechanism by which enhancer lncRNAs function to
enhance gene expression has potential to overcome cisplatin
resistance.
Figure 4. LncRNA-mRNA-network was constructed based on the correlation analysis between the differential expressed lncRNAsand mRNAs. In the network, a regular hexagon node represents lncRNA, circular node represents the mRNA. A brown node represents anupregulated lncRNA or mRNA and a blue node represents a downregulated lncRNA or mRNA.doi:10.1371/journal.pone.0108133.g004
Figure 5. The expression of lncRNA AC006050.3-003 was validated by qPCR in samples of 60 patients with lung SCC stratifiedaccording to the chemo response (PR vs. PD) following cisplatin based chemotherapy. (A) lncRNA AC006050.3-003 was aberrantlyexpressed between PC and PD patients. The term 2-DCt was used to describe the relative expression level of lncRNA (DCt = Cttarget2Ct b-actin). ***P,0.001 for patients with PD versus patients with PR (Student’s t-test). (B) ROC analysis of the ability of lncRNA AC006050.3-003 levels to discriminatebetween PR and PD patients with lung SCC receiving cisplatin based chemotherapy.doi:10.1371/journal.pone.0108133.g005
LncRNAs and Cisplatin Chemo Response
PLOS ONE | www.plosone.org 8 September 2014 | Volume 9 | Issue 9 | e108133
Simultaneously, we also identified 1,224 differentially expressed
protein coding mRNAs from the same gene chip. Pathway analysis
was applied to explore which particular pathways were enriched in
genes controlling the distinctive features of PR group compared to
PD group based on the differentially expressed mRNAs from the
microarray. KEGG annotation showed that 32 pathways corre-
sponded to downregulated transcripts and 15 pathways corre-
sponded to upregulated transcripts. Among the pathways that
corresponded to downregulated transcripts in PR group compared
to PD group, "Nucleotide excision repair" and "Glutathione
metabolism" pathways were previously reported correlated with
cisplatin sensitivity [28,29]. Nucleotide excision repair (NER)
systems are multistep enzymatic complexes involved in the repair
of nonspecific DNA damage, such as cross linking, and chemical
intra-/inter strand adduct formation. Cisplatin-DNA adducts is
repaired primarily by the NER system [29]. Elevated glutathione
may cause cisplatin resistance through inactivating cisplatin,
increasing DNA repair, and decreasing cisplatin-induced oxidative
stress [29]. In additional, "Drug metabolism-cytochrome P450",
"Metabolism of xenobiotics by cytochrome P450", and "Drug
metabolism-other enzymes" pathways are involved in drug
metabolizing, affecting biotransformation of drugs. These drug
metabolizing related pathways may contribute to interindividual
variability in cisplatin response.
Gene co-expression networks were constructed to explore gene
interactions [39,40]. Firstly, based on the different expression
levels of lncRNAs and mRNAs, we calculated the Pearson
correlation coefficients. Next, we chose significant correlation
pairs (PCC$0.99) to construct a co-expression network to predict
the possible relationship of lncRNAs and mRNAs. The degree of
gene centrality, the number of links from one gene to another,
determines its relative importance within the network analysis
[41]. In this study, lncRNA AC006050.3, MI0000285,
KRT16P12, NAPSB, XLOC_005280 fit to these characteristics.
Yang et al. profiled the differently expressed lncRNAs and
mRNAs between lung ADC A549 and A549/CDDP cells. Gene
co-expression network identified that lncRNAs including
BX648420, ENST00000366408, and AK126698 potentially
played a key role in cisplatin resistance. But we did not see the
different expression of these lncRNAs in our data. NSCLC can be
further divided into 3 major histological subtypes: ADC, SCC and
large cell carcinoma [1]. Despite sharing many biological features,
SCC and AC subtypes differ in their cell of origin, location within
the lung, and growth pattern, suggesting they are distinct diseases
that develop cisplatin risistance through differential molecular
mechanisms.
The centrality of lncRNA AC006050.3 indicates its relative
importance in the lncRNA-mRNA co-expression network. With
co-expression network, we found AC006050.3-003 expression
level correlated with many members of the NER pathway. So we
think that lncRNA AC006050.3-003 may play important role in
cisplatin chemo response in lung SCC. Its gene is located in
chromosome 17: 28,894,720–28,895,457. Its transcript length is
549 nt and has 3 exsons. Whether this lncRNA is associated with
cancer are unknown yet (http://asia.ensembl.org/). Based on the
co-expression network analysis, lncRNA AC006050.3-003 was
selected to further evaluate the predictor value in determining
clinical response of lung SCC patients receiving cisplatin based
chemotherapy by qPCR through additional 60 lung SCC samples.
The relative level of lncRNA AC006050.3-003 was significantly
reduced in the PR group compared with the PD group. The
expression of lncRNA AC006050.3-003 was potential marker to
distinguish the sensitivity or resistance to cisplatin based chemo-
therapy in patients with lung SCC.
Conclusion
Our study showed that numerous lncRNAs and mRNAs were
differently expressed between PR and PD samples in advanced
lung SCC patients following cisplatin based chemotherapy.
LncRNAs seem to be involved in cisplatin based chemo response
and may serve as biomarkers for chemo response and candidates
for therapy targets in lung SCC. However, the sample size in this
study is relative small and it requires a larger data set for further
confirmation. The network of lncRNA-conding RNA interactions
is very complex and thus requires further study to reveal the
accurately molecular mechanisms by which lncRNAs function in
cisplatin chemo response.
Supporting Information
Table S1 Primers for qPCR.
(DOCX)
Table S2 Basic medical records of ten patients.
(DOCX)
Table S3 Enhancer-like lncRNAs and their nearbycoding genes.
(XLS)
Table S4 HOX cluster profiling.
(XLS)
Table S5 LincRNAs and their nearby coding gene data.
(XLS)
Table S6 Pearson correlation coefficients ofAC006050.3-003.
(XLSX)
Acknowledgments
LncRNA microarray experiments were performed by KangChen Bio-tech
(Shanghai, China). Coding-non-coding gene co-expression network
analysis was analyzed by the OE Biotechnology Company (Shanghai,
China).
Author Contributions
Conceived and designed the experiments: LY XF. Performed the
experiments: ZH. Analyzed the data: CX H. Xie. Contributed reagents/
materials/analysis tools: H. Xu PZ. Wrote the paper: ZH XF. Designed
the software used in analysis: PZ.
References
1. Jemal A, Bray F, Center MM, Ferlay J, Ward E, et al. (2011) Global cancer
statistics. CA Cancer J Clin 61: 69–90.
2. Pikor LA, Ramnarine VR, Lam S, Lam WL (2013) Genetic alterations defining
NSCLC subtypes and their therapeutic implications. Lung Cancer.
3. Crino L, Weder W, van Meerbeeck J, Felip E (2010) Early stage and locally
advanced (non-metastatic) non-small-cell lung cancer: ESMO Clinical Practice
Guidelines for diagnosis, treatment and follow-up. Ann Oncol 21 Suppl 5: v103–
115.
4. Azzoli CG, Temin S, Giaccone G (2012) 2011 Focused Update of 2009
American Society of Clinical Oncology Clinical Practice Guideline Update on
Chemotherapy for Stage IV Non-Small-Cell Lung Cancer. J Oncol Pract 8: 63–
66.
5. Baggstrom MQ, Stinchcombe TE, Fried DB, Poole C, Hensing TA, et al. (2007)
Third-generation chemotherapy agents in the treatment of advanced non-small
cell lung cancer: a meta-analysis. J Thorac Oncol 2: 845–853.
LncRNAs and Cisplatin Chemo Response
PLOS ONE | www.plosone.org 9 September 2014 | Volume 9 | Issue 9 | e108133
6. Schiller JH, Harrington D, Belani CP, Langer C, Sandler A, et al. (2002)
Comparison of four chemotherapy regimens for advanced non-small-cell lungcancer. N Engl J Med 346: 92–98.
7. Ardizzoni A, Boni L, Tiseo M, Fossella FV, Schiller JH, et al. (2007) Cisplatin-
versus carboplatin-based chemotherapy in first-line treatment of advanced non-small-cell lung cancer: an individual patient data meta-analysis. J Natl Cancer
Inst 99: 847–857.8. Bernstein BE, Birney E, Dunham I, Green ED, Gunter C, et al. (2012) An
integrated encyclopedia of DNA elements in the human genome. Nature 489:
57–74.9. Derrien T, Johnson R, Bussotti G, Tanzer A, Djebali S, et al. (2012) The
GENCODE v7 catalog of human long noncoding RNAs: analysis of their genestructure, evolution, and expression. Genome Res 22: 1775–1789.
10. Gupta RA, Shah N, Wang KC, Kim J, Horlings HM, et al. (2010) Long non-coding RNA HOTAIR reprograms chromatin state to promote cancer
metastasis. Nature 464: 1071–1076.
11. Gutschner T, Diederichs S (2012) The hallmarks of cancer: a long non-codingRNA point of view. RNA Biol 9: 703–719.
12. Nakagawa T, Endo H, Yokoyama M, Abe J, Tamai K, et al. (2013) Largenoncoding RNA HOTAIR enhances aggressive biological behavior and is
associated with short disease-free survival in human non-small cell lung cancer.
Biochem Biophys Res Commun 436: 319–324.13. Khalil AM, Guttman M, Huarte M, Garber M, Raj A, et al. (2009) Many
human large intergenic noncoding RNAs associate with chromatin-modifyingcomplexes and affect gene expression. Proc Natl Acad Sci U S A 106: 11667–
11672.14. Kogo R, Shimamura T, Mimori K, Kawahara K, Imoto S, et al. (2011) Long
noncoding RNA HOTAIR regulates polycomb-dependent chromatin modifi-
cation and is associated with poor prognosis in colorectal cancers. Cancer Res71: 6320–6326.
15. Bhan A, Mandal SS (2014) Long Noncoding RNAs: Emerging Stars in GeneRegulation, Epigenetics and Human Disease. ChemMedChem.
16. Tsang WP, Kwok TT (2007) Riboregulator H19 induction of MDR1-associated
drug resistance in human hepatocellular carcinoma cells. Oncogene 26: 4877–4881.
17. Yang Y, Li H, Hou S, Hu B, Liu J, et al. (2013) The noncoding RNA expressionprofile and the effect of lncRNA AK126698 on cisplatin resistance in non-small-
cell lung cancer cell. PLoS One 8: e65309.18. Liu Z, Sun M, Lu K, Liu J, Zhang M, et al. (2013) The Long Noncoding RNA
HOTAIR Contributes to Cisplatin Resistance of Human Lung Adenocarcinoma
Cells via downregualtion of p21(WAF1/CIP1) Expression. PLoS One 8: e77293.19. Eisenhauer EA, Therasse P, Bogaerts J, Schwartz LH, Sargent D, et al. (2009)
New response evaluation criteria in solid tumours: revised RECIST guideline(version 1.1). Eur J Cancer 45: 228–247.
20. Schmittgen TD, Livak KJ (2008) Analyzing real-time PCR data by the
comparative C(T) method. Nat Protoc 3: 1101–1108.21. Liao Q, Liu C, Yuan X, Kang S, Miao R, et al. (2011) Large-scale prediction of
long non-coding RNA functions in a coding-non-coding gene co-expressionnetwork. Nucleic Acids Res 39: 3864–3878.
22. Harrow J, Denoeud F, Frankish A, Reymond A, Chen CK, et al. (2006)GENCODE: producing a reference annotation for ENCODE. Genome Biol 7
Suppl 1: S4 1–9.
23. Orom UA, Derrien T, Beringer M, Gumireddy K, Gardini A, et al. (2010) Longnoncoding RNAs with enhancer-like function in human cells. Cell 143: 46-58.
24. Rinn JL, Kertesz M, Wang JK, Squazzo SL, Xu X, et al. (2007) Functional
demarcation of active and silent chromatin domains in human HOX loci by
noncoding RNAs. Cell 129: 1311–1323.
25. Huarte M, Guttman M, Feldser D, Garber M, Koziol MJ, et al. (2010) A large
intergenic noncoding RNA induced by p53 mediates global gene repression in
the p53 response. Cell 142: 409–419.
26. Guttman M, Donaghey J, Carey BW, Garber M, Grenier JK, et al. (2011)
lincRNAs act in the circuitry controlling pluripotency and differentiation.
Nature 477: 295–300.
27. Guttman M, Amit I, Garber M, French C, Lin MF, et al. (2009) Chromatin
signature reveals over a thousand highly conserved large non-coding RNAs in
mammals. Nature 458: 223–227.
28. Rosell R, Taron M, Barnadas A, Scagliotti G, Sarries C, et al. (2003) Nucleotide
excision repair pathways involved in Cisplatin resistance in non-small-cell lung
cancer. Cancer Control 10: 297–305.
29. Stewart DJ (2007) Mechanisms of resistance to cisplatin and carboplatin. Crit
Rev Oncol Hematol 63: 12-31.
30. Al-Bahlani S, Fraser M, Wong AY, Sayan BS, Bergeron R, et al. (2011) P73
regulates cisplatin-induced apoptosis in ovarian cancer cells via a calcium/
calpain-dependent mechanism. Oncogene 30: 4219–4230.
31. Shang X, Lin X, Manorek G, Howell SB (2013) Claudin-3 and claudin-4
regulate sensitivity to cisplatin by controlling expression of the copper and
cisplatin influx transporter CTR1. Mol Pharmacol 83: 85–94.
32. Calvo R, West J, Franklin W, Erickson P, Bemis L, et al. (2000) Altered HOX
and WNT7A expression in human lung cancer. Proc Natl Acad Sci U S A 97:
12776–12781.
33. Cantile M, Cindolo L, Napodano G, Altieri V, Cillo C (2003) Hyperexpression
of locus C genes in the HOX network is strongly associated in vivo with human
bladder transitional cell carcinomas. Oncogene 22: 6462–6468.
34. Mainguy G, Koster J, Woltering J, Jansen H, Durston A (2007) Extensive
polycistronism and antisense transcription in the mammalian Hox clusters. PLoS
One 2: e356.
35. Sessa L, Breiling A, Lavorgna G, Silvestri L, Casari G, et al. (2007) Noncoding
RNA synthesis and loss of Polycomb group repression accompanies the colinear
activation of the human HOXA cluster. RNA 13: 223–239.
36. Li D, Feng J, Wu T, Wang Y, Sun Y, et al. (2013) Long intergenic noncoding
RNA HOTAIR is overexpressed and regulates PTEN methylation in laryngeal
squamous cell carcinoma. Am J Pathol 182: 64–70.
37. Yang Z, Zhou L, Wu LM, Lai MC, Xie HY, et al. (2011) Overexpression of long
non-coding RNA HOTAIR predicts tumor recurrence in hepatocellular
carcinoma patients following liver transplantation. Ann Surg Oncol 18: 1243–
1250.
38. Liu XH, Liu ZL, Sun M, Liu J, Wang ZX, et al. (2013) The long non-coding
RNA HOTAIR indicates a poor prognosis and promotes metastasis in non-small
cell lung cancer. BMC Cancer 13: 464.
39. Prieto C, Risueno A, Fontanillo C, De las Rivas J (2008) Human gene
coexpression landscape: confident network derived from tissue transcriptomic
profiles. PLoS One 3: e3911.
40. Pujana MA, Han JD, Starita LM, Stevens KN, Tewari M, et al. (2007) Network
modeling links breast cancer susceptibility and centrosome dysfunction. Nat
Genet 39: 1338–1349.
41. Barabasi AL, Oltvai ZN (2004) Network biology: understanding the cell’s
functional organization. Nat Rev Genet 5: 101–113.
LncRNAs and Cisplatin Chemo Response
PLOS ONE | www.plosone.org 10 September 2014 | Volume 9 | Issue 9 | e108133


![Noncoding RNA Profiles in Tobacco- and Alcohol-Associated … · 2017. 5. 26. · Genes 2017, 8, 6 2 of 20 modifications, and the expression of noncoding RNAs (ncRNAs) [6,7]. Notably,](https://static.fdocuments.in/doc/165x107/5fd252b3d85b94246373e824/noncoding-rna-profiles-in-tobacco-and-alcohol-associated-2017-5-26-genes-2017.jpg)

