London Stock Exchange Group IR... · London Stock Exchange Group Investor Relations Presentation...
42
Page 1 London Stock Exchange Group Investor Relations Presentation June 2019
Transcript of London Stock Exchange Group IR... · London Stock Exchange Group Investor Relations Presentation...
Page 1
London Stock Exchange Group
Investor Relations Presentation
June 2019
London Stock Exchange Group Page 2
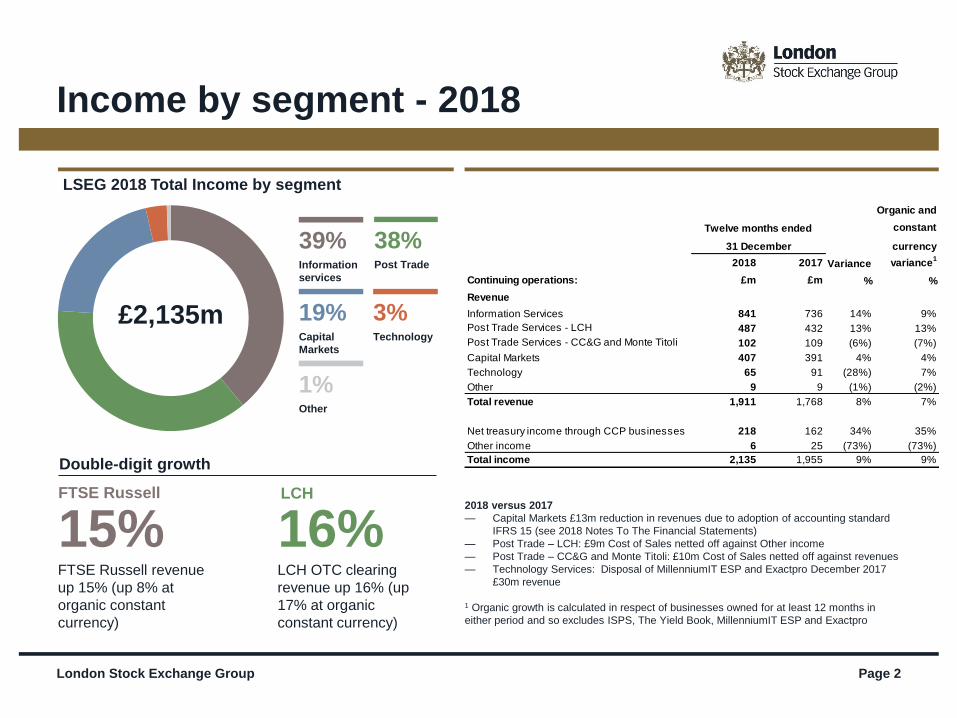
Income by segment - 2018
Double-digit growth
38%Post Trade
39%Information
services
£2,135m 19%Capital
Markets
3%Technology
1%Other
LSEG 2018 Total Income by segment
15%FTSE Russell revenue
up 15% (up 8% at
organic constant
currency)
16%LCH OTC clearing
revenue up 16% (up
17% at organic
constant currency)
FTSE Russell LCH2018 versus 2017
— Capital Markets £13m reduction in revenues due to adoption of accounting standard
IFRS 15 (see 2018 Notes To The Financial Statements)
— Post Trade – LCH: £9m Cost of Sales netted off against Other income
— Post Trade – CC&G and Monte Titoli: £10m Cost of Sales netted off against revenues
— Technology Services: Disposal of MillenniumIT ESP and Exactpro December 2017
£30m revenue
1 Organic growth is calculated in respect of businesses owned for at least 12 months in
either period and so excludes ISPS, The Yield Book, MillenniumIT ESP and Exactpro
Organic and
constant
currency
2018 2017 Variance variance1
Continuing operations: £m £m % %
Revenue
Information Services 841 736 14% 9%
Post Trade Services - LCH 487 432 13% 13%
Post Trade Services - CC&G and Monte Titoli 102 109 (6%) (7%)
Capital Markets 407 391 4% 4%
Technology 65 91 (28%) 7%
Other 9 9 (1%) (2%)
Total revenue 1,911 1,768 8% 7%
Net treasury income through CCP businesses 218 162 34% 35%
Other income 6 25 (73%) (73%)
Total income 2,135 1,955 9% 9%
Twelve months ended
31 December
London Stock Exchange Group Page 3
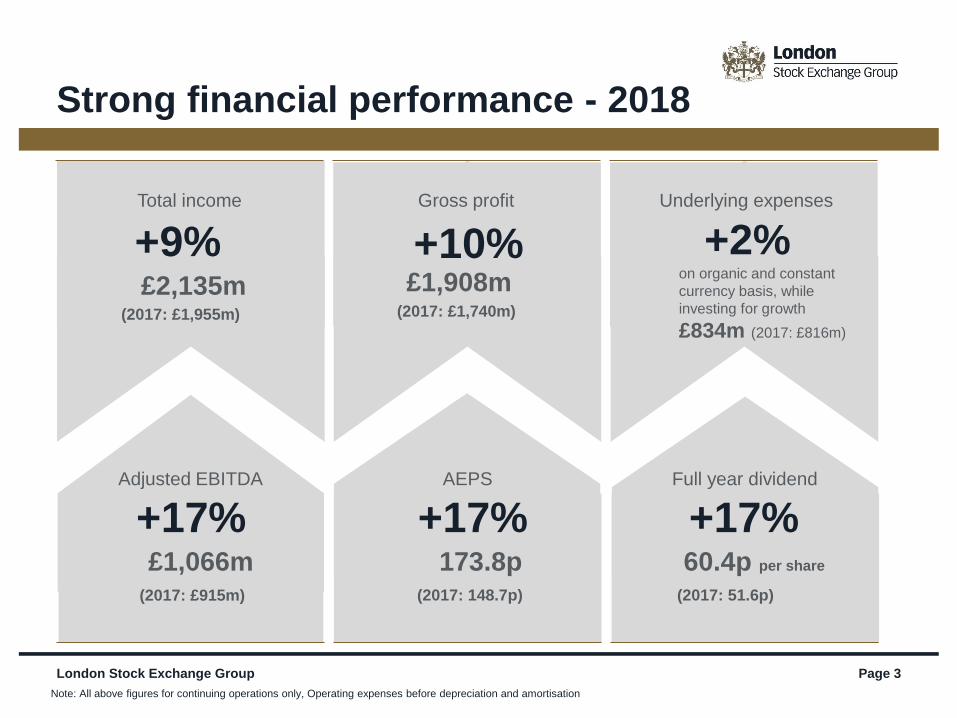
+17%
+9%
+17%
+10% +2%
+17%Adjusted EBITDA
Total income
AEPS
Gross profit Underlying expenses
Full year dividend
£1,066m
£2,135m
173.8p
£1,908mon organic and constant
currency basis, while
investing for growth
£834m (2017: £816m)
60.4p per share
(2017: £915m)
(2017: £1,955m)
(2017: 148.7p)
(2017: £1,740m)
(2017: 51.6p)
Note: All above figures for continuing operations only, Operating expenses before depreciation and amortisation
Strong financial performance - 2018
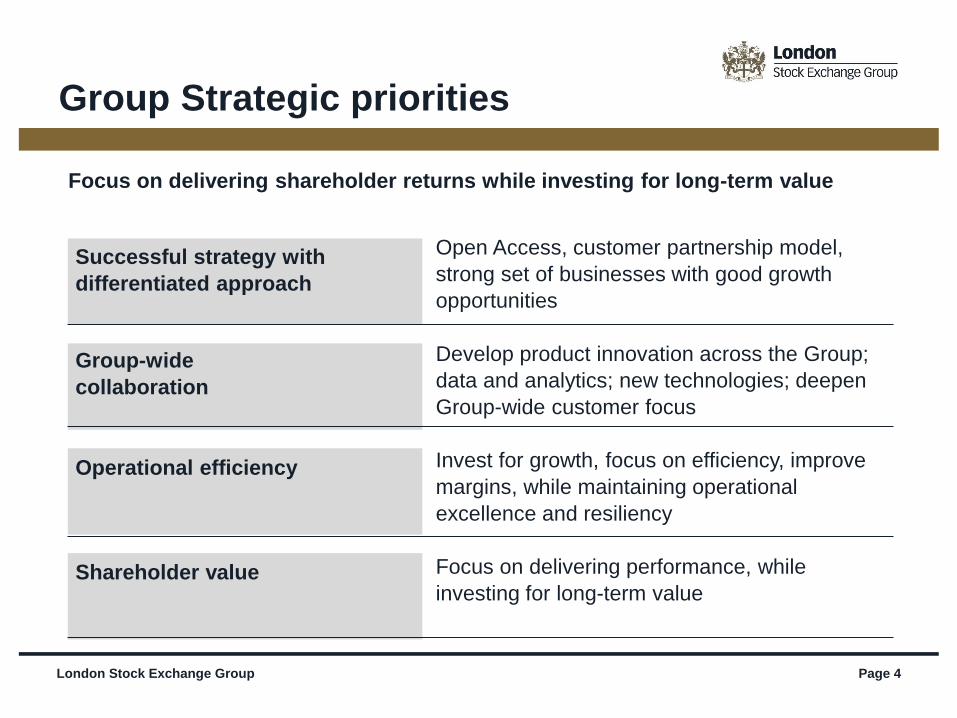
Group Strategic priorities
Successful strategy with
differentiated approach
Focus on delivering shareholder returns while investing for long-term value
Open Access, customer partnership model,
strong set of businesses with good growth
opportunities
Develop product innovation across the Group;
data and analytics; new technologies; deepen
Group-wide customer focus
Invest for growth, focus on efficiency, improve
margins, while maintaining operational
excellence and resiliency
Focus on delivering performance, while
investing for long-term value
Group-wide
collaboration
Operational efficiency
Shareholder value
London Stock Exchange Group Page 4
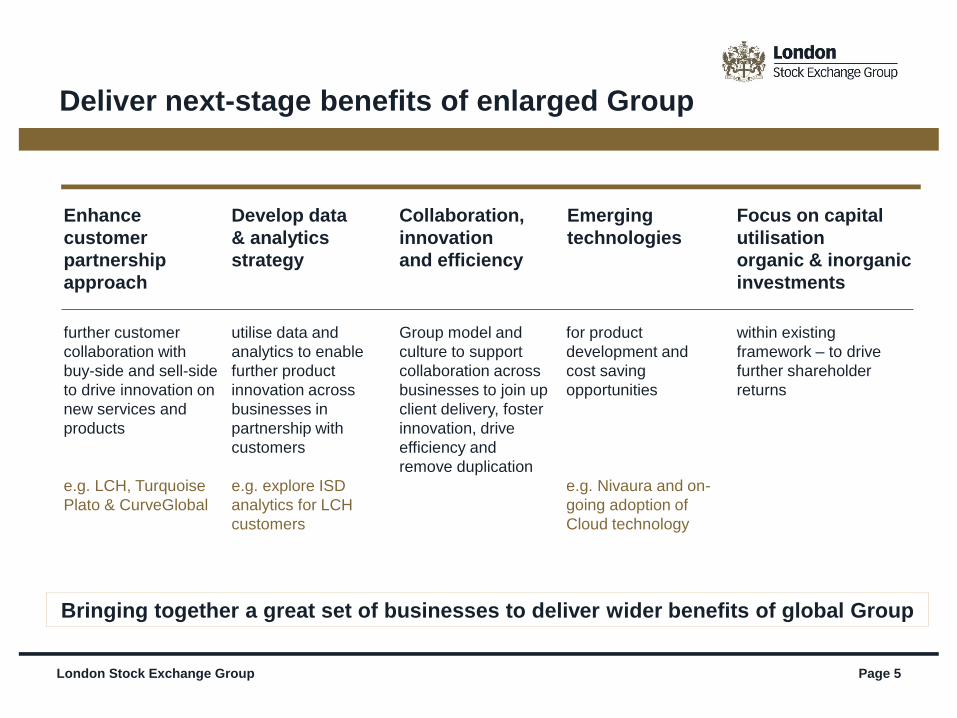
Deliver next-stage benefits of enlarged Group
Bringing together a great set of businesses to deliver wider benefits of global Group
Focus on capital
utilisation
organic & inorganic
investments
Enhance
customer
partnership
approach
Develop data
& analytics
strategy
Collaboration,
innovation
and efficiency
further customer
collaboration with
buy-side and sell-side
to drive innovation on
new services and
products
e.g. LCH, Turquoise
Plato & CurveGlobal
utilise data and
analytics to enable
further product
innovation across
businesses in
partnership with
customers
e.g. explore ISD
analytics for LCH
customers
Group model and
culture to support
collaboration across
businesses to join up
client delivery, foster
innovation, drive
efficiency and
remove duplication
Emerging
technologies
for product
development and
cost saving
opportunities
e.g. Nivaura and on-
going adoption of
Cloud technology
within existing
framework – to drive
further shareholder
returns
London Stock Exchange Group Page 5
London Stock Exchange Group Page 6
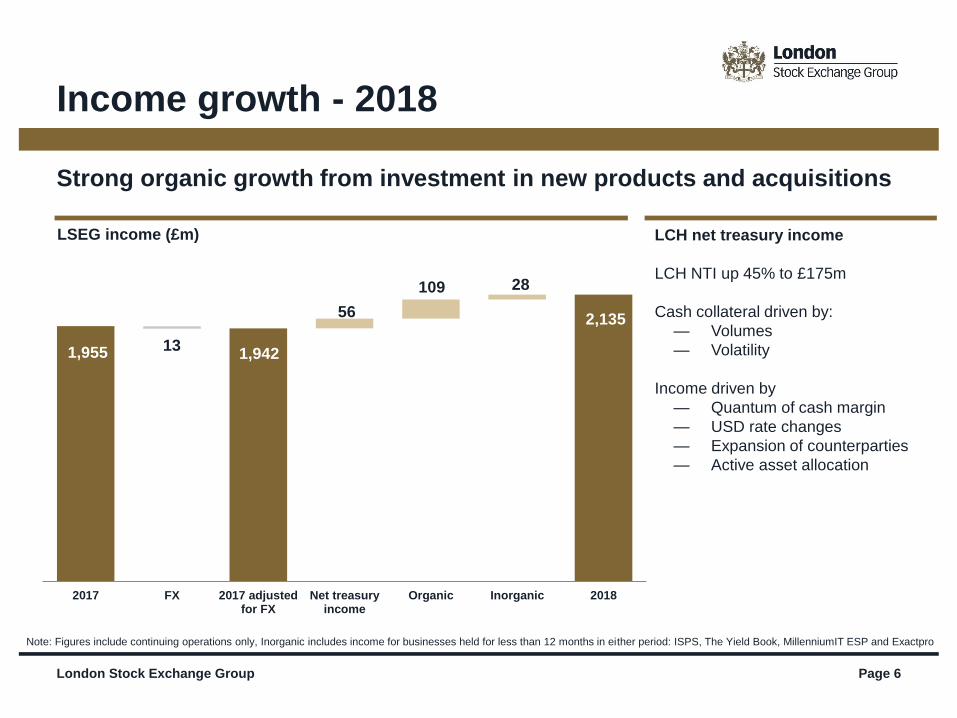
Income growth - 2018
Strong organic growth from investment in new products and acquisitions
LSEG income (£m)
Note: Figures include continuing operations only, Inorganic includes income for businesses held for less than 12 months in either period: ISPS, The Yield Book, MillenniumIT ESP and Exactpro
LCH net treasury income
LCH NTI up 45% to £175m
Cash collateral driven by:
— Volumes
— Volatility
Income driven by
— Quantum of cash margin
— USD rate changes
— Expansion of counterparties
— Active asset allocation
1,955 1,942
2,135 56
109 28
13
2017 FX 2017 adjustedfor FX
Net treasuryincome
Organic Inorganic 2018
London Stock Exchange Group Page 7
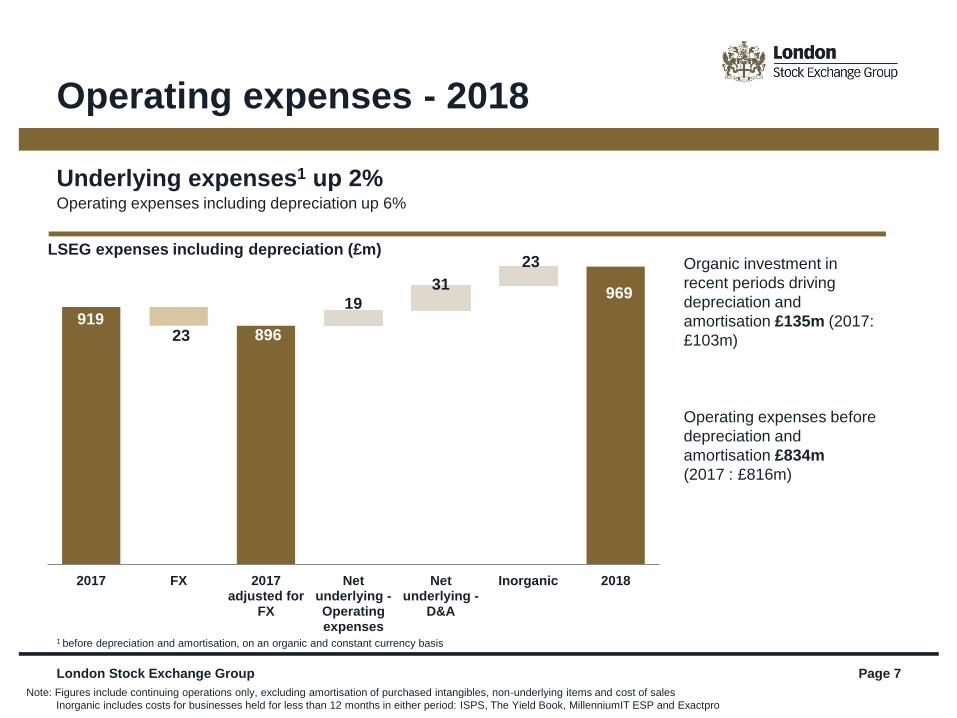
Underlying expenses1 up 2%Operating expenses including depreciation up 6%
LSEG expenses including depreciation (£m)
Operating expenses - 2018
Note: Figures include continuing operations only, excluding amortisation of purchased intangibles, non-underlying items and cost of sales
Inorganic includes costs for businesses held for less than 12 months in either period: ISPS, The Yield Book, MillenniumIT ESP and Exactpro
Organic investment in
recent periods driving
depreciation and
amortisation £135m (2017:
£103m)
Operating expenses before
depreciation and
amortisation £834m
(2017 : £816m)
1 before depreciation and amortisation, on an organic and constant currency basis
919 896
969 19
31
23
23
2017 FX 2017adjusted for
FX
Netunderlying -Operatingexpenses
Netunderlying -
D&A
Inorganic 2018
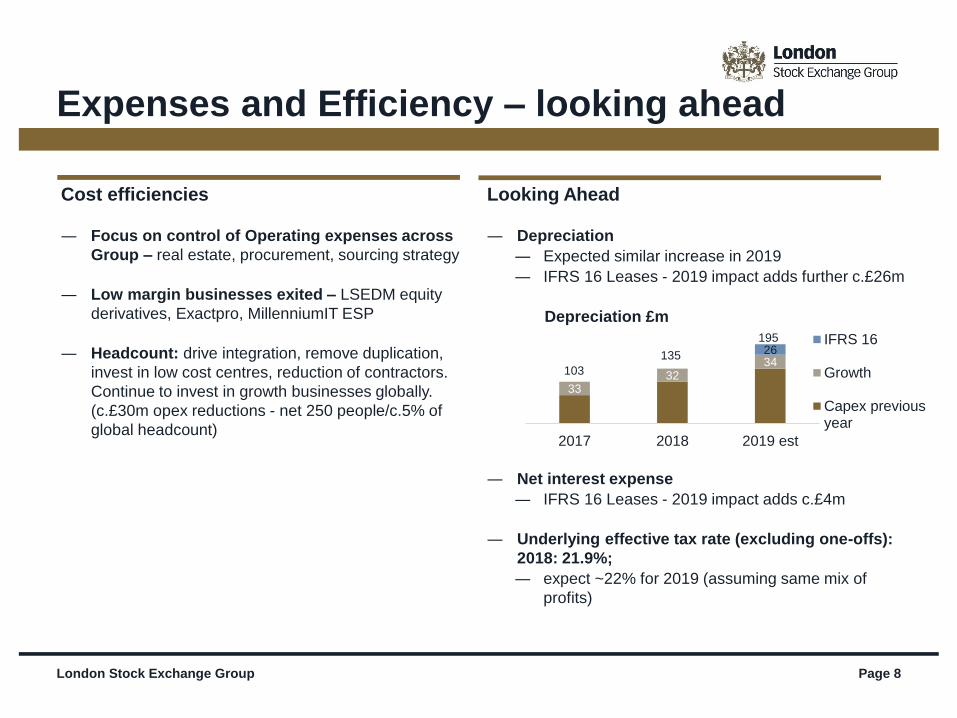
Looking Ahead
― Depreciation
― Expected similar increase in 2019
― IFRS 16 Leases - 2019 impact adds further c.£26m
― Net interest expense
― IFRS 16 Leases - 2019 impact adds c.£4m
― Underlying effective tax rate (excluding one-offs):
2018: 21.9%;
― expect ~22% for 2019 (assuming same mix of
profits)
Cost efficiencies
― Focus on control of Operating expenses across
Group – real estate, procurement, sourcing strategy
― Low margin businesses exited – LSEDM equity
derivatives, Exactpro, MillenniumIT ESP
― Headcount: drive integration, remove duplication,
invest in low cost centres, reduction of contractors.
Continue to invest in growth businesses globally.
(c.£30m opex reductions - net 250 people/c.5% of
global headcount)
3332
3426
103
135
195
2017 2018 2019 est
Depreciation £m
IFRS 16
Growth
Capex previousyear
London Stock Exchange Group Page 8
Expenses and Efficiency – looking ahead
London Stock Exchange Group Page 9
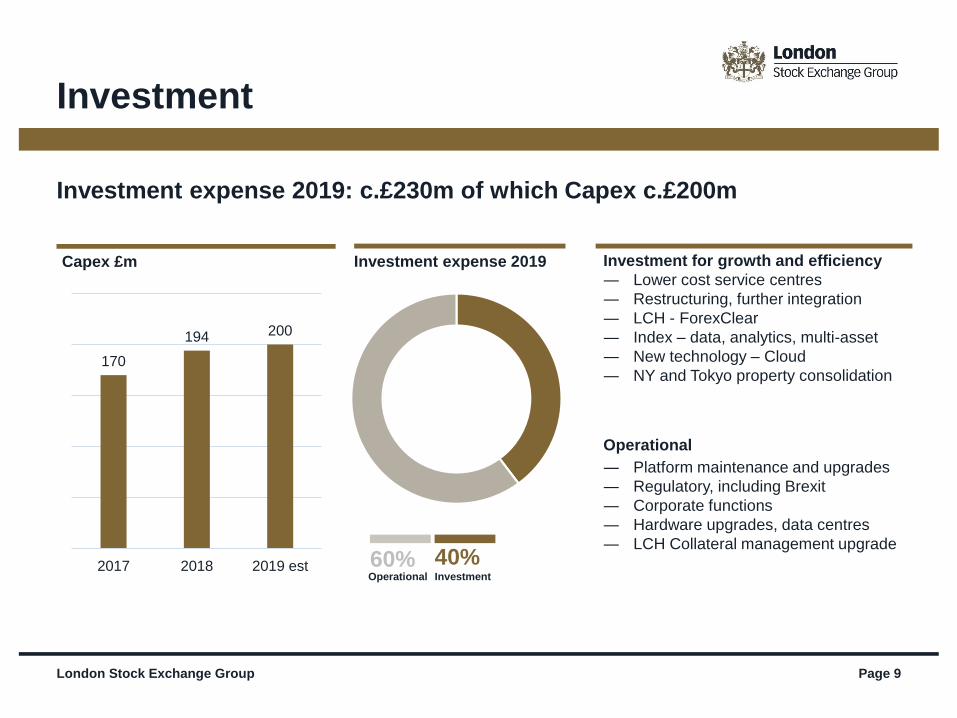
Investment expense 2019: c.£230m of which Capex c.£200m
170
194 200
2017 2018 2019 est
Capex £m Investment expense 2019 Investment for growth and efficiency
― Lower cost service centres
― Restructuring, further integration
― LCH - ForexClear
― Index – data, analytics, multi-asset
― New technology – Cloud
― NY and Tokyo property consolidation
Operational
― Platform maintenance and upgrades
― Regulatory, including Brexit
― Corporate functions
― Hardware upgrades, data centres
― LCH Collateral management upgrade40%Investment
60%Operational
Investment
London Stock Exchange Group Page 10
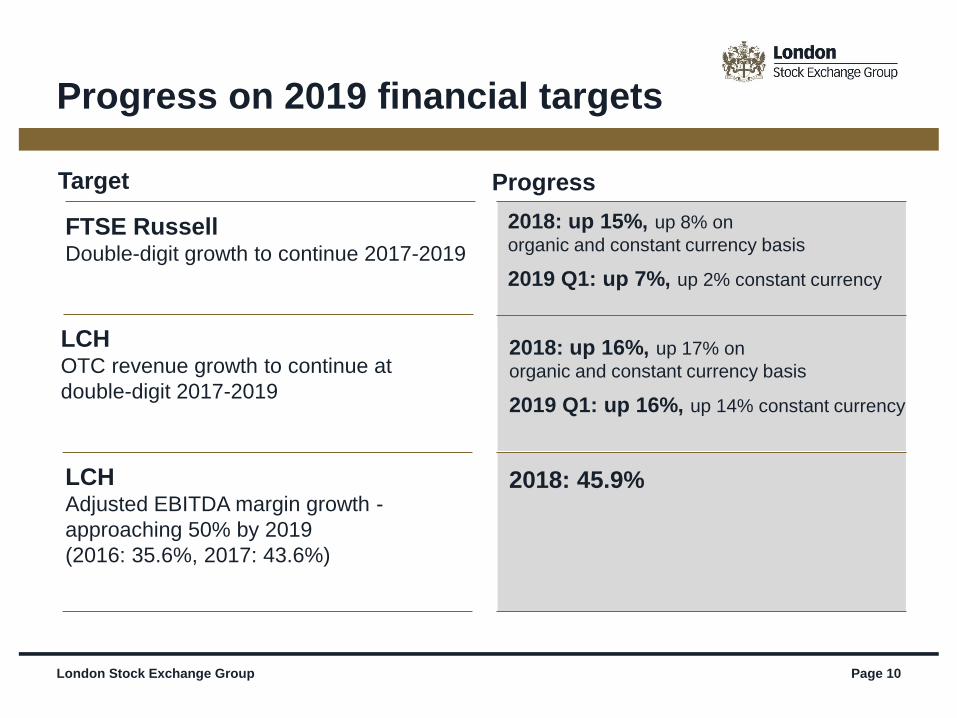
Progress on 2019 financial targets
LCHOTC revenue growth to continue at
double-digit 2017-2019
LCHAdjusted EBITDA margin growth -
approaching 50% by 2019
(2016: 35.6%, 2017: 43.6%)
FTSE RussellDouble-digit growth to continue 2017-2019
2018: up 15%, up 8% on
organic and constant currency basis
2019 Q1: up 7%, up 2% constant currency
2018: 45.9%
Target Progress
2018: up 16%, up 17% on
organic and constant currency basis
2019 Q1: up 16%, up 14% constant currency
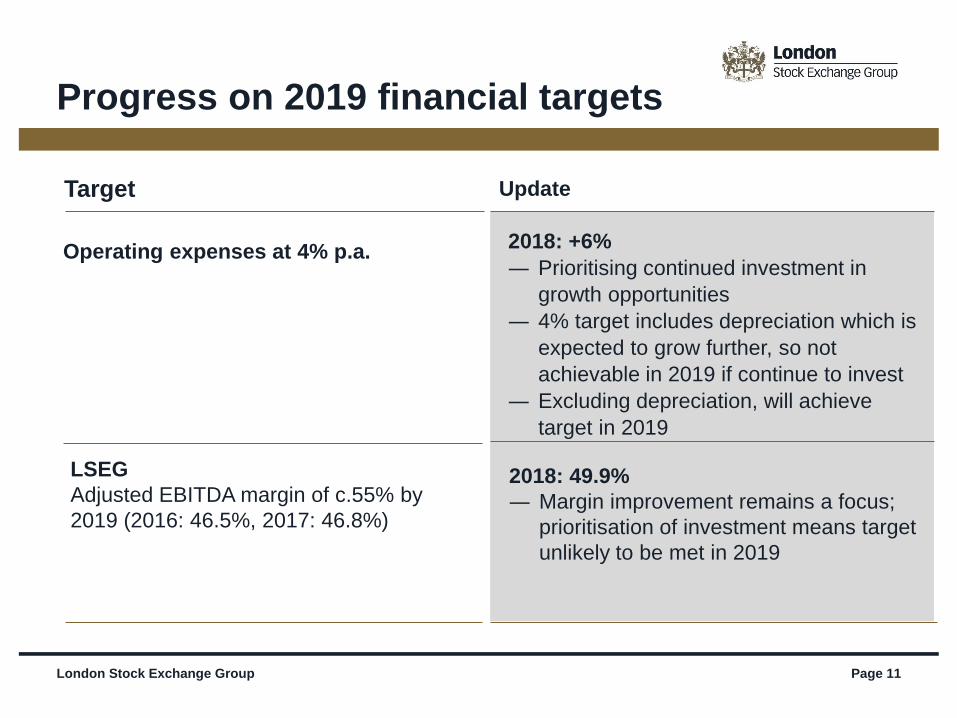
LSEG
Adjusted EBITDA margin of c.55% by
2019 (2016: 46.5%, 2017: 46.8%)
2018: 49.9%
― Margin improvement remains a focus;
prioritisation of investment means target
unlikely to be met in 2019
London Stock Exchange Group Page 11
Progress on 2019 financial targets
Target Update
Operating expenses at 4% p.a. 2018: +6%
― Prioritising continued investment in
growth opportunities
― 4% target includes depreciation which is
expected to grow further, so not
achievable in 2019 if continue to invest
― Excluding depreciation, will achieve
target in 2019
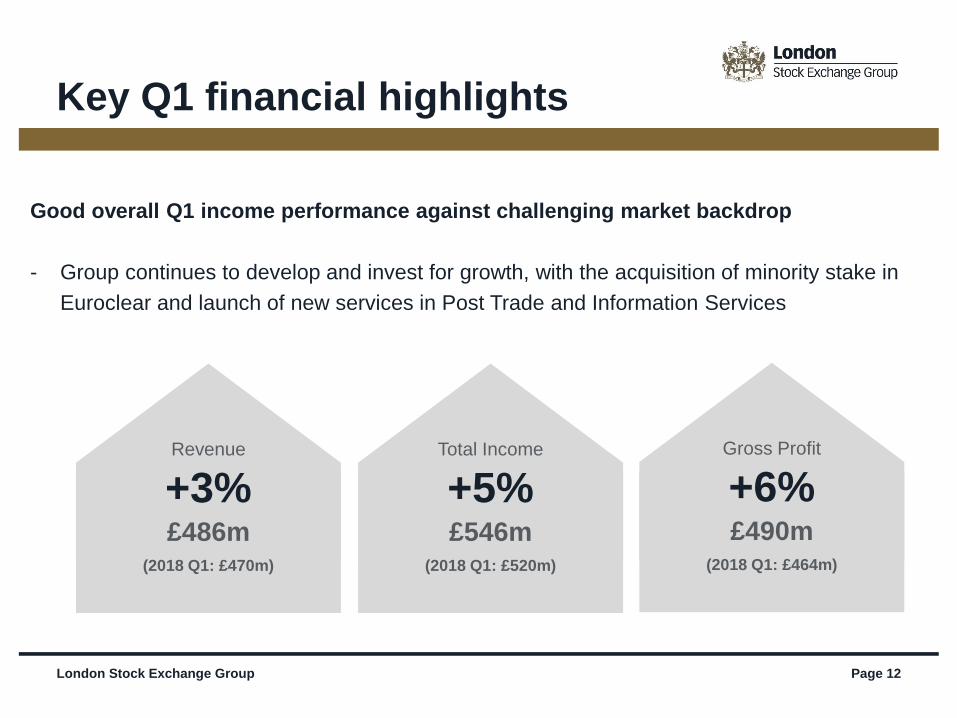
Key Q1 financial highlights
London Stock Exchange Group Page 12
Good overall Q1 income performance against challenging market backdrop
- Group continues to develop and invest for growth, with the acquisition of minority stake in
Euroclear and launch of new services in Post Trade and Information Services
+3%Revenue
£486m(2018 Q1: £470m)
+5%Total Income
£546m(2018 Q1: £520m)
+6%Gross Profit
£490m(2018 Q1: £464m)
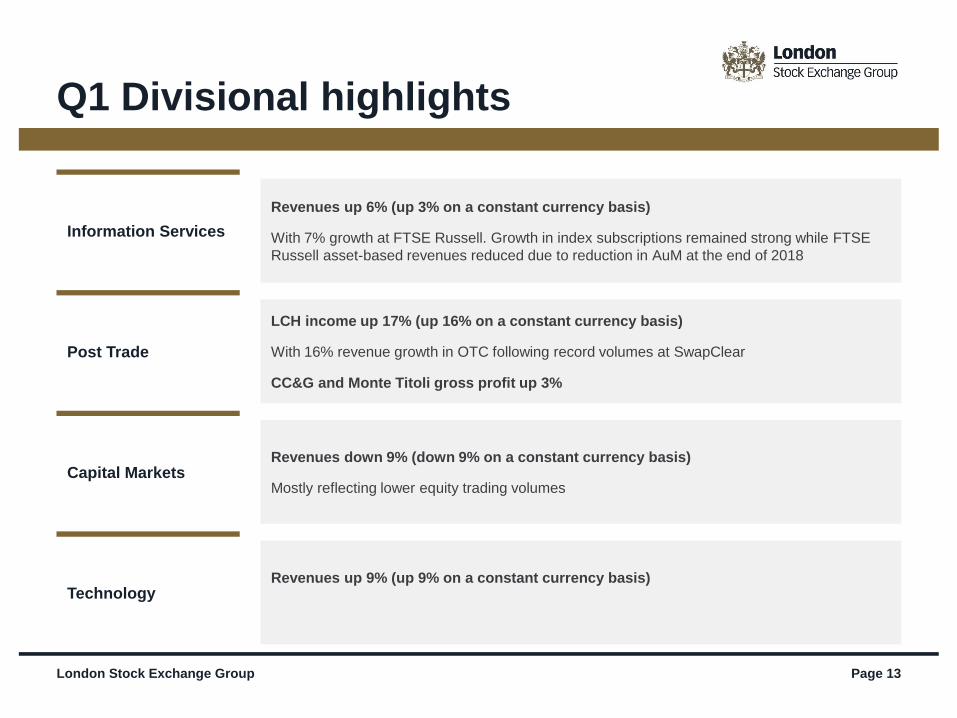
Q1 Divisional highlights
London Stock Exchange Group Page 13
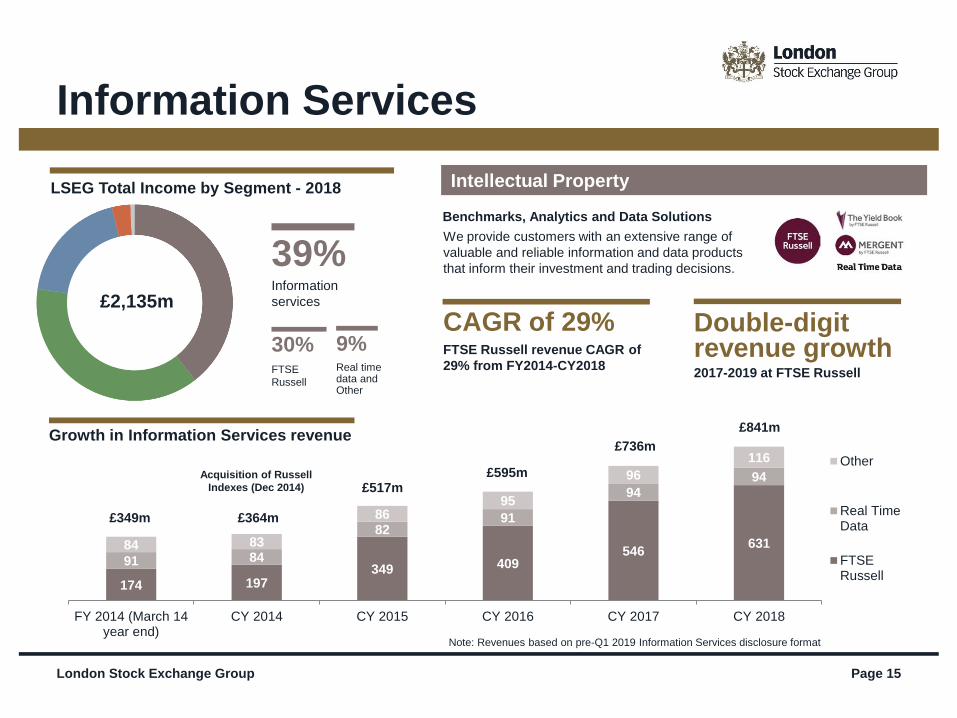
Information Services
Revenues up 6% (up 3% on a constant currency basis)
With 7% growth at FTSE Russell. Growth in index subscriptions remained strong while FTSE
Russell asset-based revenues reduced due to reduction in AuM at the end of 2018
Post Trade
LCH income up 17% (up 16% on a constant currency basis)
With 16% revenue growth in OTC following record volumes at SwapClear
CC&G and Monte Titoli gross profit up 3%
Capital MarketsRevenues down 9% (down 9% on a constant currency basis)
Mostly reflecting lower equity trading volumes
Technology Revenues up 9% (up 9% on a constant currency basis)

Page 14
Opportunities and development
174 197349 409
546631
91 84
8291
94
94
84 83
8695
96
116
FY 2014 (March 14year end)
CY 2014 CY 2015 CY 2016 CY 2017 CY 2018
Other
Real TimeData
FTSERussell
London Stock Exchange Group Page 15
Information Services
Intellectual Property
Benchmarks, Analytics and Data Solutions
LSEG Total Income by Segment - 2018
We provide customers with an extensive range of
valuable and reliable information and data products
that inform their investment and trading decisions.
Acquisition of Russell
Indexes (Dec 2014)
£364m£349m
£517m
£736m
£595m
Growth in Information Services revenue£841m
CAGR of 29% FTSE Russell revenue CAGR of
29% from FY2014-CY2018
Double-digit revenue growth2017-2019 at FTSE Russell
£2,135m
9%Real time data and Other
39%Information
services
30%FTSE
Russell
Note: Revenues based on pre-Q1 2019 Information Services disclosure format
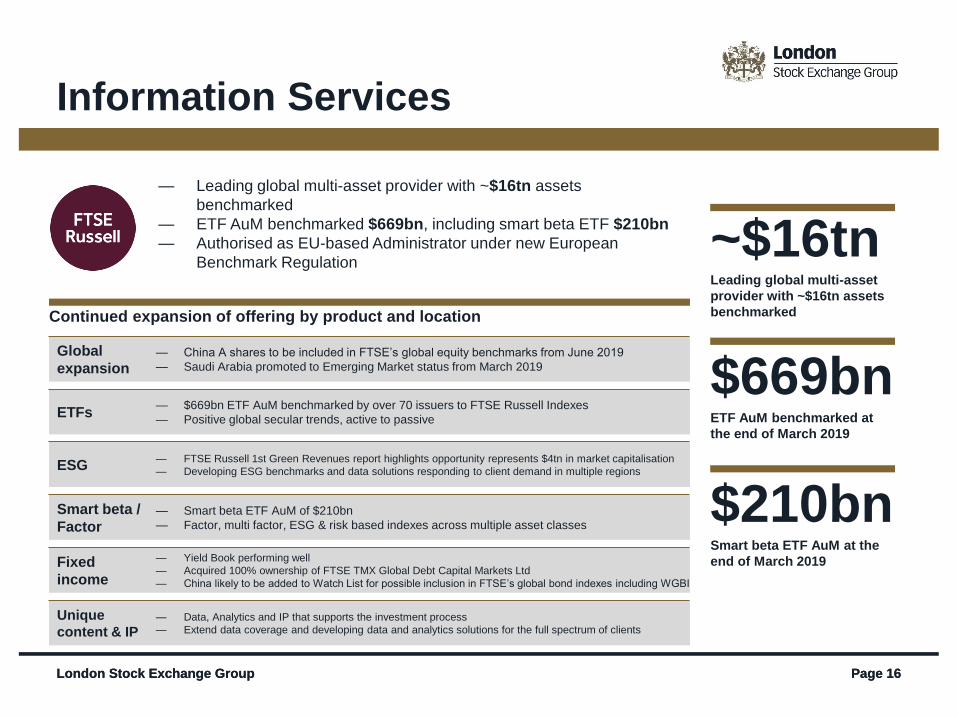
London Stock Exchange Group Page 16
— Leading global multi-asset provider with ~$16tn assets
benchmarked
— ETF AuM benchmarked $669bn, including smart beta ETF $210bn
— Authorised as EU-based Administrator under new European
Benchmark Regulation
London Stock Exchange Group Page 16
Information Services
~$16tn Leading global multi-asset
provider with ~$16tn assets
benchmarked
$669bnETF AuM benchmarked at
the end of March 2019
$210bn Smart beta ETF AuM at the
end of March 2019
Continued expansion of offering by product and location
Global
expansion— China A shares to be included in FTSE’s global equity benchmarks from June 2019
— Saudi Arabia promoted to Emerging Market status from March 2019
ETFs— $669bn ETF AuM benchmarked by over 70 issuers to FTSE Russell Indexes
— Positive global secular trends, active to passive
ESG— FTSE Russell 1st Green Revenues report highlights opportunity represents $4tn in market capitalisation
— Developing ESG benchmarks and data solutions responding to client demand in multiple regions
Smart beta /
Factor— Smart beta ETF AuM of $210bn
— Factor, multi factor, ESG & risk based indexes across multiple asset classes
Fixed
income
— Yield Book performing well
— Acquired 100% ownership of FTSE TMX Global Debt Capital Markets Ltd
— China likely to be added to Watch List for possible inclusion in FTSE’s global bond indexes including WGBI
Unique
content & IP— Data, Analytics and IP that supports the investment process
— Extend data coverage and developing data and analytics solutions for the full spectrum of clients
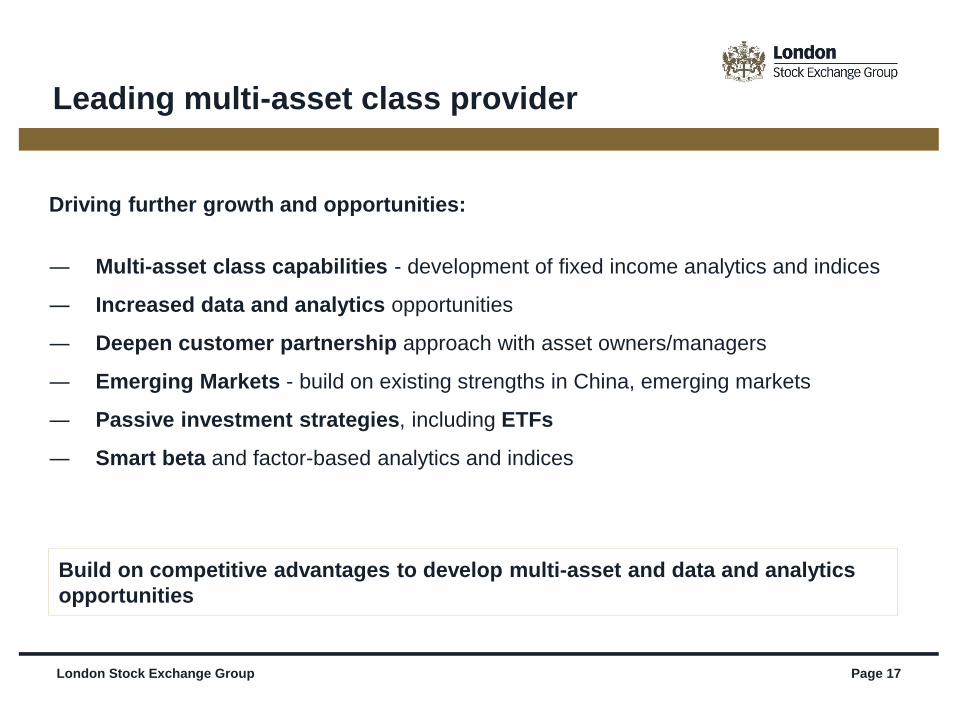
Leading multi-asset class provider
Driving further growth and opportunities:
― Multi-asset class capabilities - development of fixed income analytics and indices
― Increased data and analytics opportunities
― Deepen customer partnership approach with asset owners/managers
― Emerging Markets - build on existing strengths in China, emerging markets
― Passive investment strategies, including ETFs
― Smart beta and factor-based analytics and indices
Build on competitive advantages to develop multi-asset and data and analytics
opportunities
London Stock Exchange Group Page 17
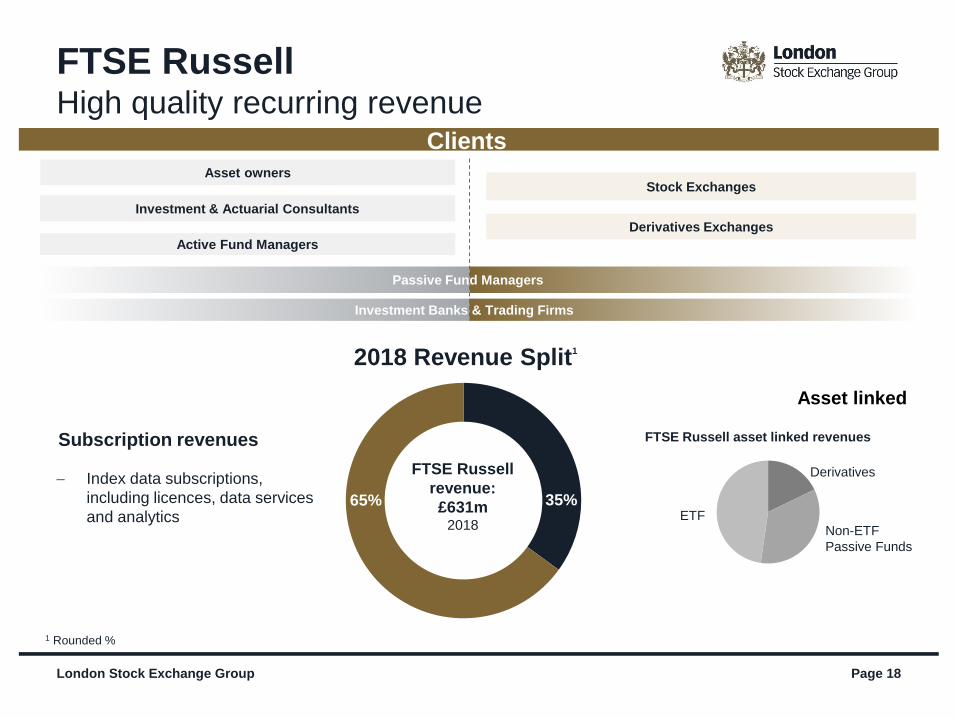
Page 18
2018 Revenue Split1
Asset linked
Clients
Derivatives Exchanges
Stock Exchanges
35%65%
Investment & Actuarial Consultants
Asset owners
Active Fund Managers
Passive Fund Managers
Investment Banks & Trading Firms
FTSE Russell asset linked revenues
Derivatives
Non-ETF
Passive Funds
Subscription revenues
1 Rounded %
ETF
FTSE Russell
revenue:
£631m2018
London Stock Exchange Group
FTSE RussellHigh quality recurring revenue
− Index data subscriptions,
including licences, data services
and analytics
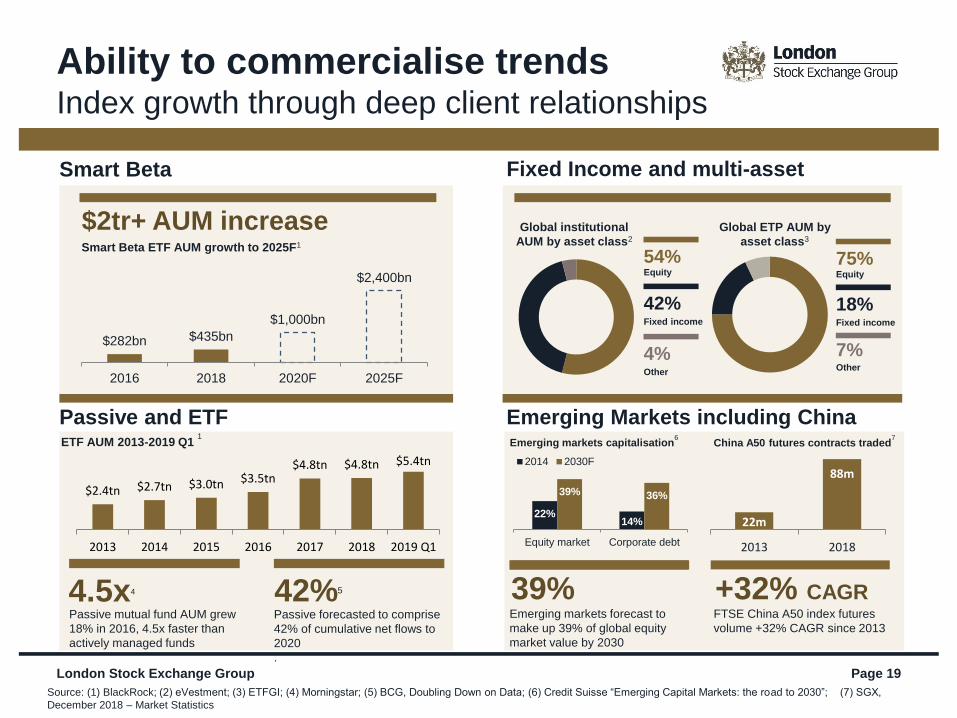
Smart Beta
Passive and ETF
$282bn $435bn
$1,000bn
$2,400bn
2016 2018 2020F 2025F
Emerging Markets including China
Page 19
Source: (1) BlackRock; (2) eVestment; (3) ETFGI; (4) Morningstar; (5) BCG, Doubling Down on Data; (6) Credit Suisse “Emerging Capital Markets: the road to 2030”; (7) SGX,
December 2018 – Market Statistics
Fixed Income and multi-asset
70m
22m
$2tr+ AUM increaseSmart Beta ETF AUM growth to 2025F1
4.5x4
Passive mutual fund AUM grew
18% in 2016, 4.5x faster than
actively managed funds
42%5
Passive forecasted to comprise
42% of cumulative net flows to
2020
.
+32% CAGRFTSE China A50 index futures
volume +32% CAGR since 2013
Global institutional
AUM by asset class2
Global ETP AUM by
asset class3
China A50 futures contracts traded7
18%Fixed income
75%Equity
7%Other
42%Fixed income
54%Equity
4%Other
ETF AUM 2013-2019 Q1 1
22%14%
39% 36%
Equity market Corporate debt
2014 2030F
39%Emerging markets forecast to
make up 39% of global equity
market value by 2030
Emerging markets capitalisation6
London Stock Exchange Group
22m
88m
2013 2018
Ability to commercialise trendsIndex growth through deep client relationships
$2.4tn $2.7tn $3.0tn $3.5tn$4.8tn $4.8tn $5.4tn
2013 2014 2015 2016 2017 2018 2019 Q1
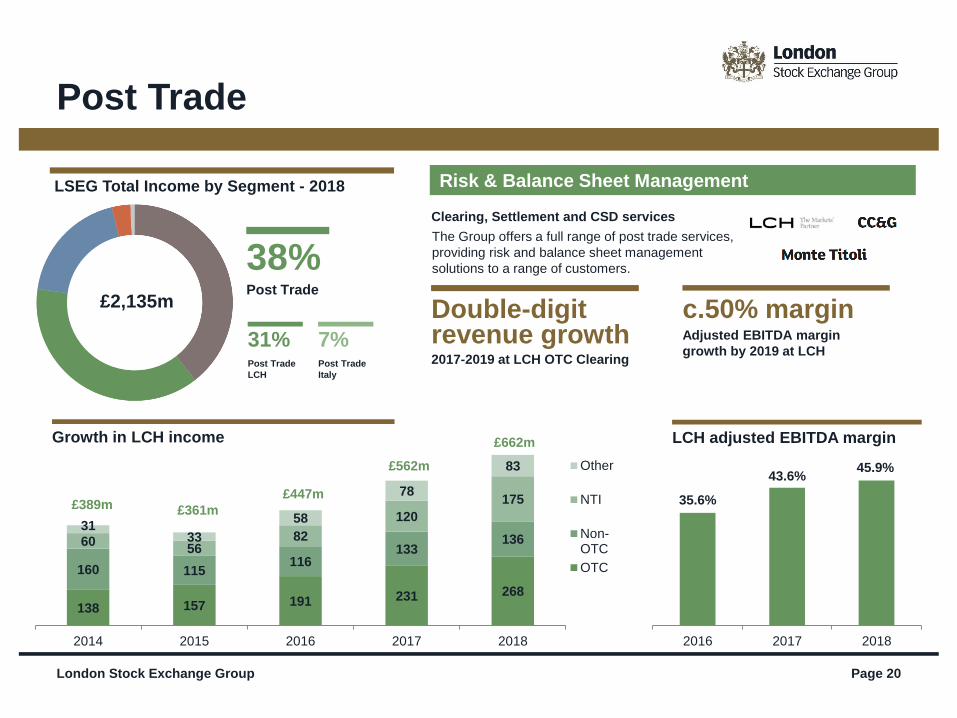
London Stock Exchange Group Page 20
Post Trade
LSEG Total Income by Segment - 2018
38%Post Trade
£2,135m
138 157 191 231 268
160 115116
13313660
5682
120
175
3133
58
78
83
2014 2015 2016 2017 2018
Other
NTI
Non-OTC
OTC
£389m£447m
£361m
£562m
7%Post Trade
Italy
31%Post Trade
LCH
Growth in LCH income £662m
Double-digit revenue growth2017-2019 at LCH OTC Clearing
Risk & Balance Sheet Management
Clearing, Settlement and CSD services
The Group offers a full range of post trade services,
providing risk and balance sheet management
solutions to a range of customers.
c.50% marginAdjusted EBITDA margin
growth by 2019 at LCH
35.6%
43.6%45.9%
2016 2017 2018
LCH adjusted EBITDA margin
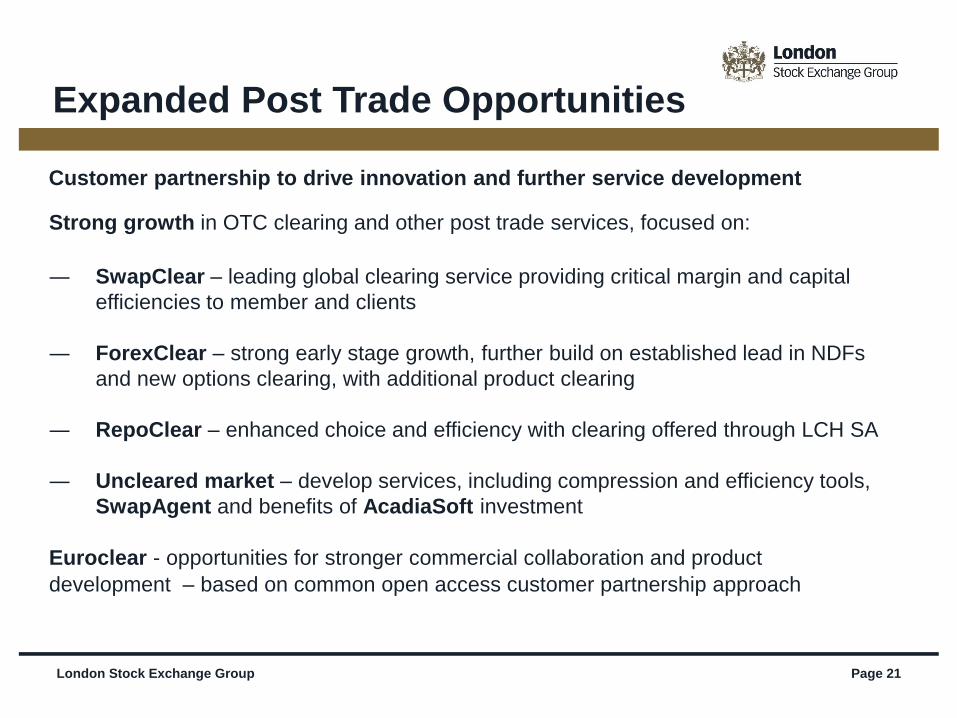
Expanded Post Trade Opportunities
Strong growth in OTC clearing and other post trade services, focused on:
― SwapClear – leading global clearing service providing critical margin and capital
efficiencies to member and clients
― ForexClear – strong early stage growth, further build on established lead in NDFs
and new options clearing, with additional product clearing
― RepoClear – enhanced choice and efficiency with clearing offered through LCH SA
― Uncleared market – develop services, including compression and efficiency tools,
SwapAgent and benefits of AcadiaSoft investment
Euroclear - opportunities for stronger commercial collaboration and product
development – based on common open access customer partnership approach
Customer partnership to drive innovation and further service development
London Stock Exchange Group Page 21
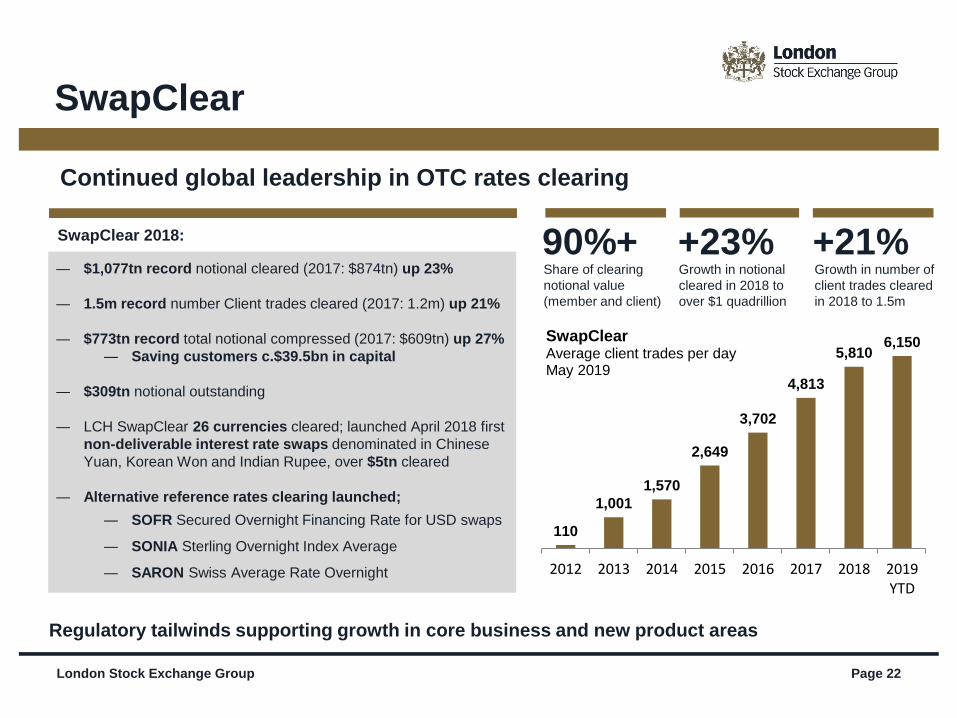
SwapClear
Regulatory tailwinds supporting growth in core business and new product areas
Continued global leadership in OTC rates clearing
― $1,077tn record notional cleared (2017: $874tn) up 23%
― 1.5m record number Client trades cleared (2017: 1.2m) up 21%
― $773tn record total notional compressed (2017: $609tn) up 27%
― Saving customers c.$39.5bn in capital
― $309tn notional outstanding
― LCH SwapClear 26 currencies cleared; launched April 2018 first
non-deliverable interest rate swaps denominated in Chinese
Yuan, Korean Won and Indian Rupee, over $5tn cleared
― Alternative reference rates clearing launched;
― SOFR Secured Overnight Financing Rate for USD swaps
― SONIA Sterling Overnight Index Average
― SARON Swiss Average Rate Overnight
SwapClear 2018: +23%90%+ +21%Share of clearing
notional value
(member and client)
Growth in notional
cleared in 2018 to
over $1 quadrillion
Growth in number of
client trades cleared
in 2018 to 1.5m
London Stock Exchange Group Page 22
110
1,001
1,570
2,649
3,702
4,813
5,8106,150
2012 2013 2014 2015 2016 2017 2018 2019YTD
SwapClearAverage client trades per dayMay 2019
Page 23London Stock Exchange Group
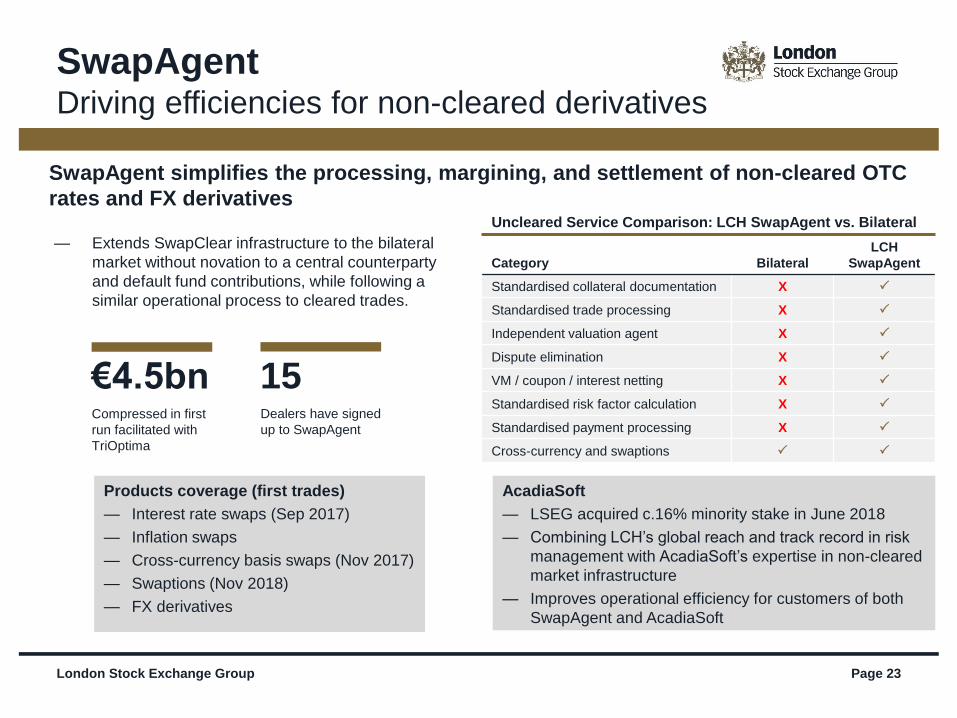
SwapAgentDriving efficiencies for non-cleared derivatives
SwapAgent simplifies the processing, margining, and settlement of non-cleared OTC
rates and FX derivatives
Products coverage (first trades)
— Interest rate swaps (Sep 2017)
— Inflation swaps
— Cross-currency basis swaps (Nov 2017)
— Swaptions (Nov 2018)
— FX derivatives
AcadiaSoft
— LSEG acquired c.16% minority stake in June 2018
— Combining LCH’s global reach and track record in risk
management with AcadiaSoft’s expertise in non-cleared
market infrastructure
— Improves operational efficiency for customers of both
SwapAgent and AcadiaSoft
Category Bilateral
LCH
SwapAgent
Standardised collateral documentation X
Standardised trade processing X
Independent valuation agent X
Dispute elimination X
VM / coupon / interest netting X
Standardised risk factor calculation X
Standardised payment processing X
Cross-currency and swaptions
Uncleared Service Comparison: LCH SwapAgent vs. Bilateral
15Dealers have signed
up to SwapAgent
€4.5bnCompressed in first
run facilitated with
TriOptima
— Extends SwapClear infrastructure to the bilateral
market without novation to a central counterparty
and default fund contributions, while following a
similar operational process to cleared trades.
Page 24London Stock Exchange Group
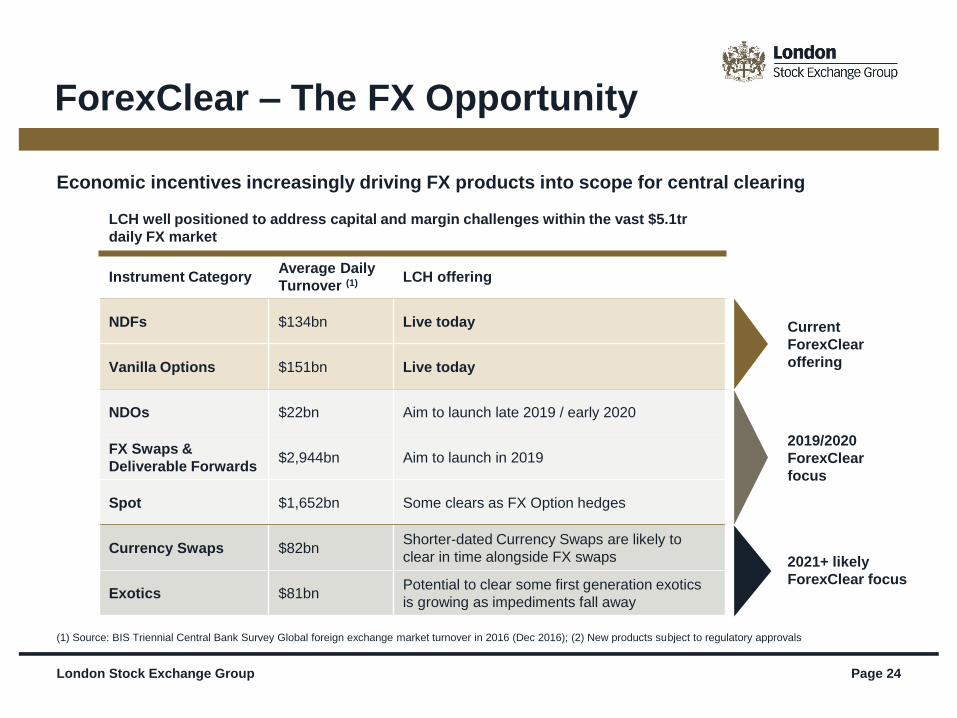
Instrument CategoryAverage Daily
Turnover (1) LCH offering
NDFs $134bn Live today
Vanilla Options $151bn Live today
NDOs $22bn Aim to launch late 2019 / early 2020
FX Swaps &
Deliverable Forwards$2,944bn Aim to launch in 2019
Spot $1,652bn Some clears as FX Option hedges
Currency Swaps $82bnShorter-dated Currency Swaps are likely to
clear in time alongside FX swaps
Exotics $81bnPotential to clear some first generation exotics
is growing as impediments fall away
Economic incentives increasingly driving FX products into scope for central clearing
Current
ForexClear
offering
2019/2020
ForexClear
focus
2021+ likely
ForexClear focus
LCH well positioned to address capital and margin challenges within the vast $5.1tr
daily FX market
ForexClear – The FX Opportunity
(1) Source: BIS Triennial Central Bank Survey Global foreign exchange market turnover in 2016 (Dec 2016); (2) New products subject to regulatory approvals
Page 25
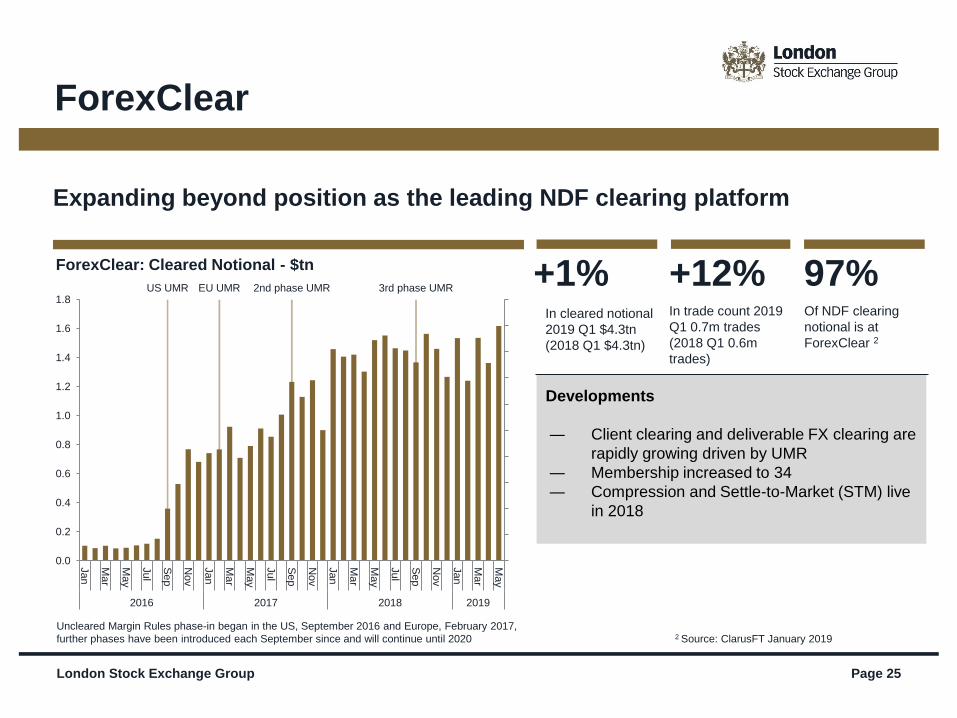
Expanding beyond position as the leading NDF clearing platform
ForexClear: Cleared Notional - $tn +12%+1%In cleared notional
2019 Q1 $4.3tn
(2018 Q1 $4.3tn)
In trade count 2019
Q1 0.7m trades
(2018 Q1 0.6m
trades)
London Stock Exchange Group
97%Of NDF clearing
notional is at
ForexClear 2
Developments
― Client clearing and deliverable FX clearing are
rapidly growing driven by UMR
― Membership increased to 34
― Compression and Settle-to-Market (STM) live
in 2018
Uncleared Margin Rules phase-in began in the US, September 2016 and Europe, February 2017,
further phases have been introduced each September since and will continue until 2020 2 Source: ClarusFT January 2019
ForexClear
US UMR EU UMR 2nd phase UMR 3rd phase UMR
0.0
0.2
0.4
0.6
0.8
1.0
1.2
1.4
1.6
1.8
Jan
Ma
r
Ma
y
Jul
Se
p
Nov
Jan
Ma
r
Ma
y
Jul
Se
p
Nov
Jan
Ma
r
Ma
y
Jul
Se
p
Nov
Jan
Ma
r
Ma
y
2016 2017 2018 2019
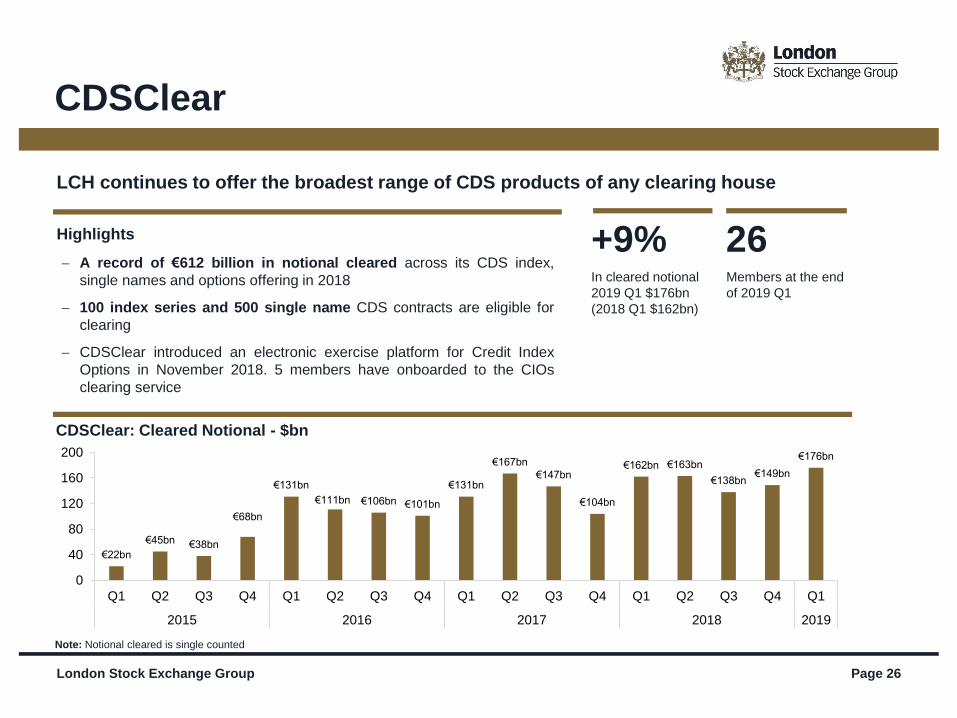
LCH continues to offer the broadest range of CDS products of any clearing house
− A record of €612 billion in notional cleared across its CDS index,
single names and options offering in 2018
− 100 index series and 500 single name CDS contracts are eligible for
clearing
− CDSClear introduced an electronic exercise platform for Credit Index
Options in November 2018. 5 members have onboarded to the CIOs
clearing service
CDSClear
Highlights
Note: Notional cleared is single counted
CDSClear: Cleared Notional - $bn
+9%In cleared notional
2019 Q1 $176bn
(2018 Q1 $162bn)
26Members at the end
of 2019 Q1
London Stock Exchange Group Page 26
€22bn
€45bn €38bn
€68bn
€131bn
€111bn €106bn €101bn
€131bn
€167bn
€147bn
€104bn
€162bn €163bn
€138bn€149bn
€176bn
0
40
80
120
160
200
Q1 Q2 Q3 Q4 Q1 Q2 Q3 Q4 Q1 Q2 Q3 Q4 Q1 Q2 Q3 Q4 Q1
2015 2016 2017 2018 2019
London Stock Exchange Group Page 27
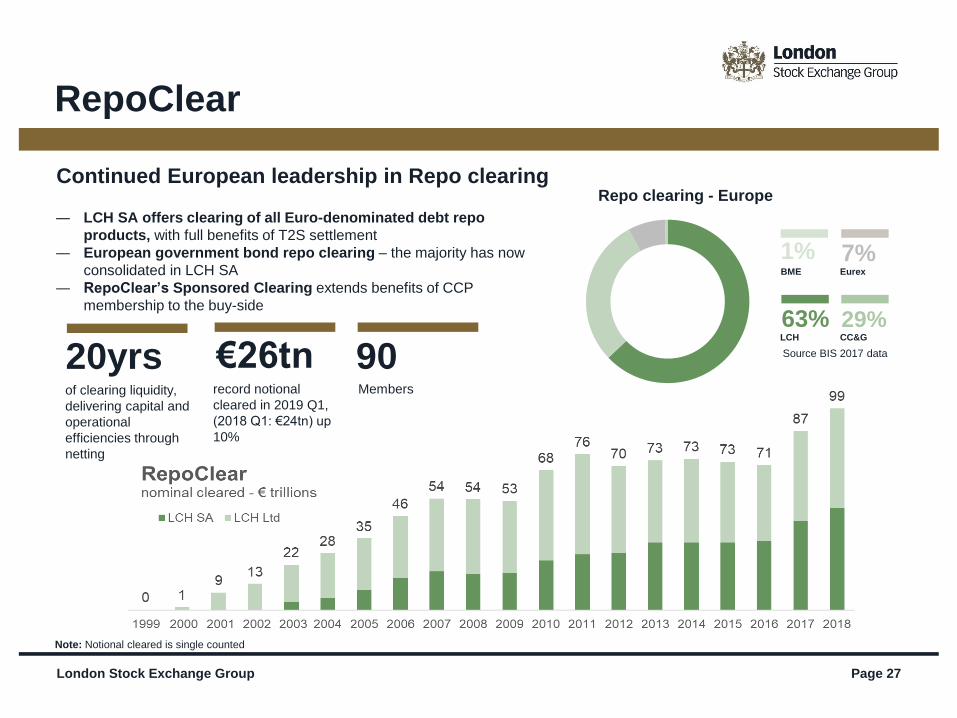
RepoClear
Continued European leadership in Repo clearing
― LCH SA offers clearing of all Euro-denominated debt repo
products, with full benefits of T2S settlement
― European government bond repo clearing – the majority has now
consolidated in LCH SA
― RepoClear’s Sponsored Clearing extends benefits of CCP
membership to the buy-side
Repo clearing - Europe
Source BIS 2017 data
1%BME
7%Eurex
63%LCH
29%CC&G
90Members
€26tn record notional
cleared in 2019 Q1,
(2018 Q1: €24tn) up
10%
20yrs of clearing liquidity,
delivering capital and
operational
efficiencies through
netting
Note: Notional cleared is single counted
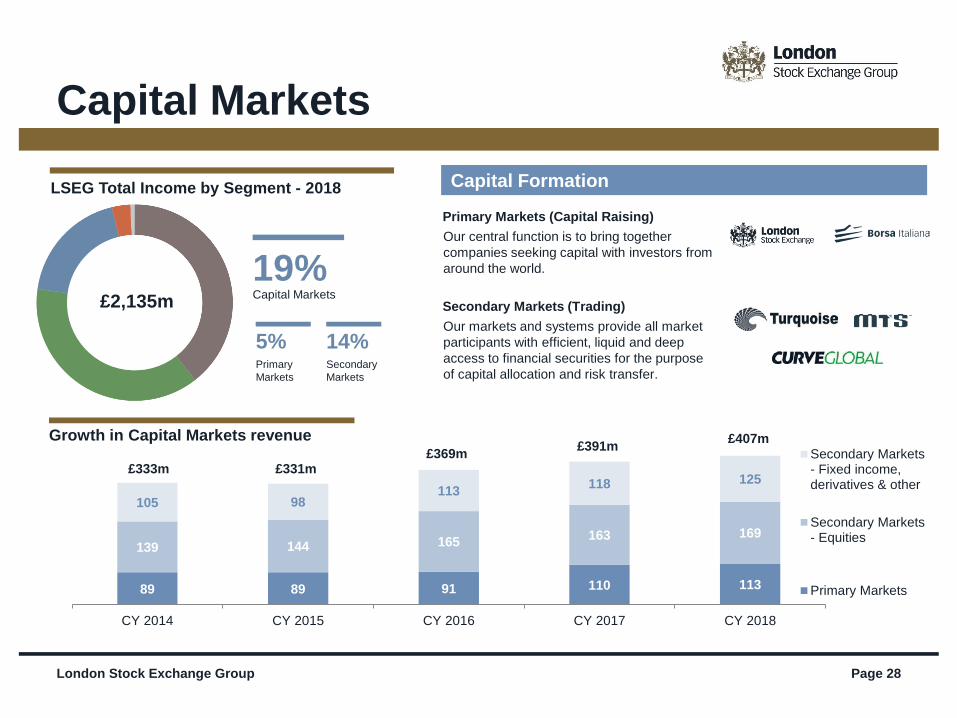
89 89 91 110 113
139 144 165163 169
105 98113
118 125
CY 2014 CY 2015 CY 2016 CY 2017 CY 2018
Secondary Markets- Fixed income,derivatives & other
Secondary Markets- Equities
Primary Markets
London Stock Exchange Group Page 28
Capital Markets
Capital Formation
Primary Markets (Capital Raising)
LSEG Total Income by Segment - 2018
Our central function is to bring together
companies seeking capital with investors from
around the world.
£2,135m
£331m£333m
£391m£369m
£407mGrowth in Capital Markets revenue
Secondary Markets (Trading)
Our markets and systems provide all market
participants with efficient, liquid and deep
access to financial securities for the purpose
of capital allocation and risk transfer.
14%Secondary
Markets
5%Primary
Markets
19%Capital Markets
Capital Markets Highlights
Leading UK & Italy listing and trading businesses, LSE plc and Borsa Italiana
Fixed income markets
― MTS Repo €87.4tn traded up 13% in 2018
― MTS selected by Johannesburg Stock Exchange to power South Africa’s first electronic government
bond market
― Over 2,000 bonds listed in 2018 - more than 50% were international issues, including green
financing, Chinese RMB, Indian Rupee and Sukuk bonds
Turquoise Plato dark book - largest European dark pool in 2018
― Turquoise Plato Block Discovery Large in Scale value traded €93bn
Shanghai-London Stock Connect – ongoing preparations for launch
Capital formation core to Group business model delivering partnership and innovation across
capital markets lifecycle
Partnership approach with customers drives product innovation e.g. Turquoise Plato, CurveGlobal
International growth opportunities continue to offset market headwinds
London Stock Exchange Group Page 29
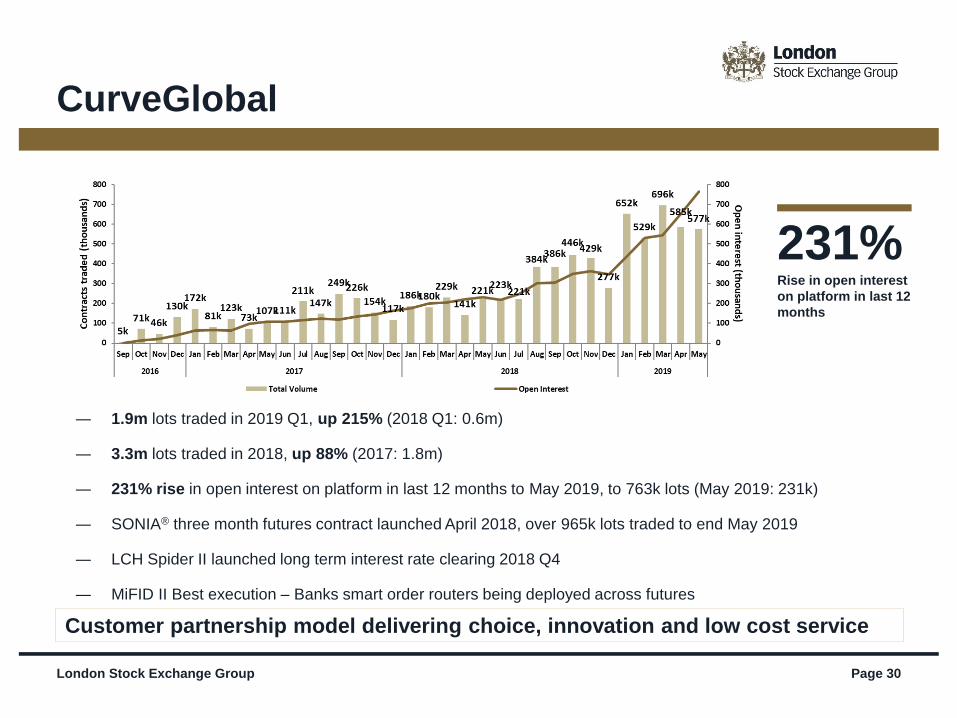
― 1.9m lots traded in 2019 Q1, up 215% (2018 Q1: 0.6m)
― 3.3m lots traded in 2018, up 88% (2017: 1.8m)
― 231% rise in open interest on platform in last 12 months to May 2019, to 763k lots (May 2019: 231k)
― SONIA® three month futures contract launched April 2018, over 965k lots traded to end May 2019
― LCH Spider II launched long term interest rate clearing 2018 Q4
― MiFID II Best execution – Banks smart order routers being deployed across futures
London Stock Exchange Group Page 30
CurveGlobal
231%Rise in open interest
on platform in last 12
months
Customer partnership model delivering choice, innovation and low cost service
Page 31
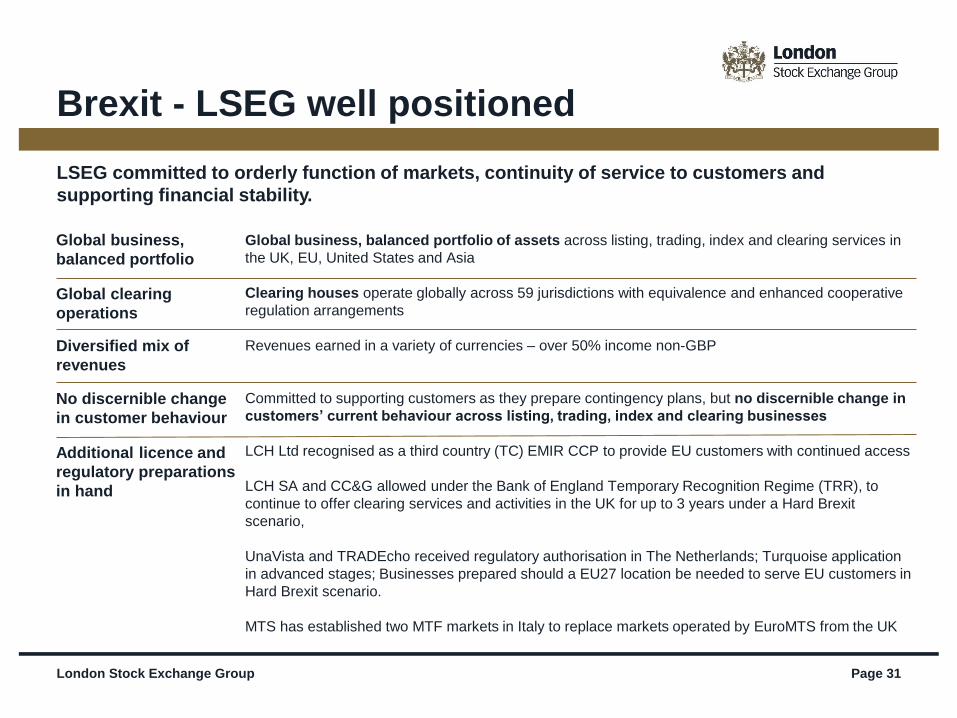
Global business, balanced portfolio of assets across listing, trading, index and clearing services in
the UK, EU, United States and Asia
Clearing houses operate globally across 59 jurisdictions with equivalence and enhanced cooperative
regulation arrangements
Revenues earned in a variety of currencies – over 50% income non-GBP
Committed to supporting customers as they prepare contingency plans, but no discernible change in
customers’ current behaviour across listing, trading, index and clearing businesses
LCH Ltd recognised as a third country (TC) EMIR CCP to provide EU customers with continued access
LCH SA and CC&G allowed under the Bank of England Temporary Recognition Regime (TRR), to
continue to offer clearing services and activities in the UK for up to 3 years under a Hard Brexit
scenario,
UnaVista and TRADEcho received regulatory authorisation in The Netherlands; Turquoise application
in advanced stages; Businesses prepared should a EU27 location be needed to serve EU customers in
Hard Brexit scenario.
MTS has established two MTF markets in Italy to replace markets operated by EuroMTS from the UK
London Stock Exchange Group
Brexit - LSEG well positioned
Global business,
balanced portfolio
Global clearing
operations
Diversified mix of
revenues
No discernible change
in customer behaviour
Additional licence and
regulatory preparations
in hand
LSEG committed to orderly function of markets, continuity of service to customers and
supporting financial stability.

Appendices
Page 32
London Stock Exchange Group Page 33
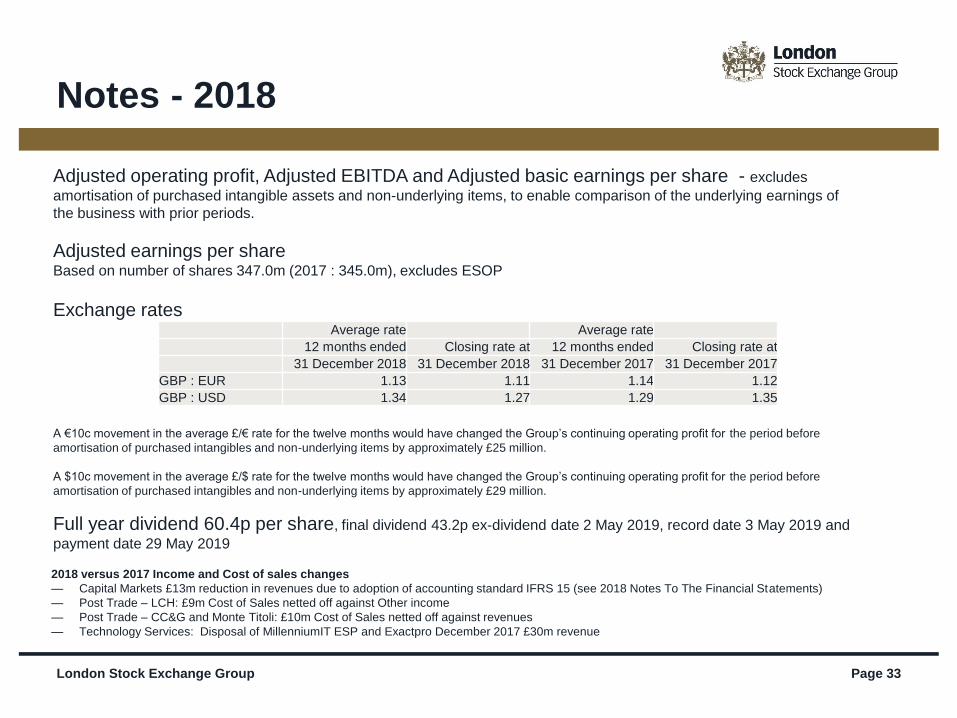
Notes - 2018
Adjusted operating profit, Adjusted EBITDA and Adjusted basic earnings per share - excludes
amortisation of purchased intangible assets and non-underlying items, to enable comparison of the underlying earnings of
the business with prior periods.
Adjusted earnings per shareBased on number of shares 347.0m (2017 : 345.0m), excludes ESOP
Exchange rates
A €10c movement in the average £/€ rate for the twelve months would have changed the Group’s continuing operating profit for the period before
amortisation of purchased intangibles and non-underlying items by approximately £25 million.
A $10c movement in the average £/$ rate for the twelve months would have changed the Group’s continuing operating profit for the period before
amortisation of purchased intangibles and non-underlying items by approximately £29 million.
Full year dividend 60.4p per share, final dividend 43.2p ex-dividend date 2 May 2019, record date 3 May 2019 and
payment date 29 May 2019
Average rate Average rate
12 months ended Closing rate at 12 months ended Closing rate at
31 December 2018 31 December 2018 31 December 2017 31 December 2017
GBP : EUR 1.13 1.11 1.14 1.12
GBP : USD 1.34 1.27 1.29 1.35
2018 versus 2017 Income and Cost of sales changes
— Capital Markets £13m reduction in revenues due to adoption of accounting standard IFRS 15 (see 2018 Notes To The Financial Statements)
— Post Trade – LCH: £9m Cost of Sales netted off against Other income
— Post Trade – CC&G and Monte Titoli: £10m Cost of Sales netted off against revenues
— Technology Services: Disposal of MillenniumIT ESP and Exactpro December 2017 £30m revenue
London Stock Exchange Group Page 34
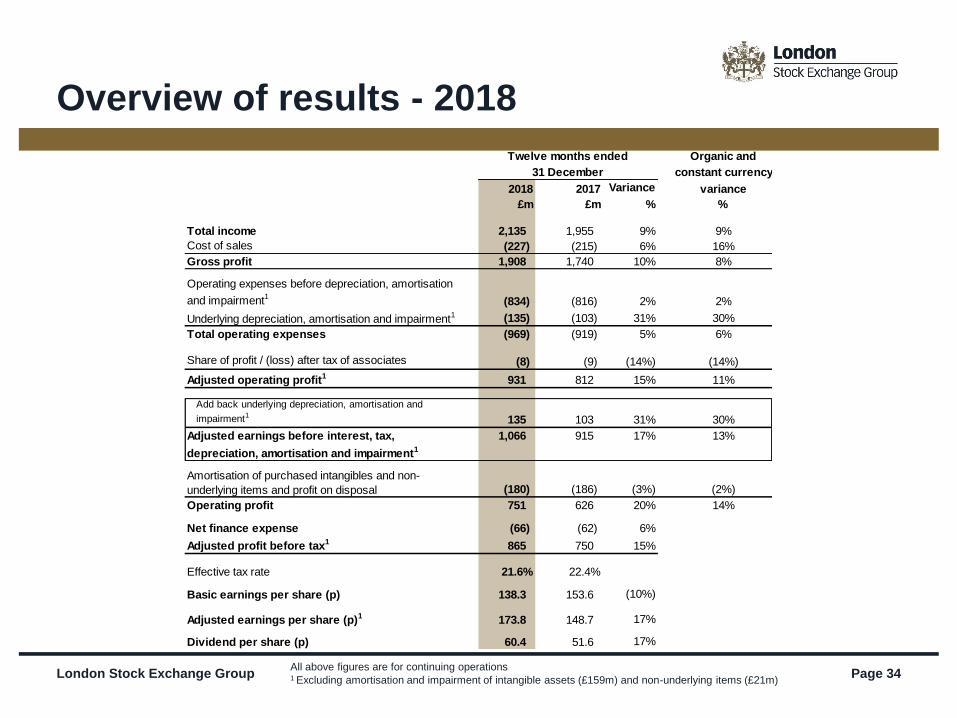
Overview of results - 2018
All above figures are for continuing operations1 Excluding amortisation and impairment of intangible assets (£159m) and non-underlying items (£21m)
Organic and
constant currency
2018 2017 Variance variance
£m £m % %
Total income 2,135 1,955 9% 9%
Cost of sales (227) (215) 6% 16%
Gross profit 1,908 1,740 10% 8%
Operating expenses before depreciation, amortisation
and impairment1 (834) (816) 2% 2%
Underlying depreciation, amortisation and impairment1 (135) (103) 31% 30%
Total operating expenses (969) (919) 5% 6%
Share of profit / (loss) after tax of associates (8) (9) (14%) (14%)
Adjusted operating profit1 931 812 15% 11%
Add back underlying depreciation, amortisation and
impairment1135 103 31% 30%
Adjusted earnings before interest, tax,
depreciation, amortisation and impairment1
1,066 915 17% 13%
Amortisation of purchased intangibles and non-
underlying items and profit on disposal (180) (186) (3%) (2%)
Operating profit 751 626 20% 14%
Net finance expense (66) (62) 6%
Adjusted profit before tax1 865 750 15%
Effective tax rate 21.6% 22.4%
Basic earnings per share (p) 138.3 153.6 (10%)
Adjusted earnings per share (p)1 173.8 148.7 17%
Dividend per share (p) 60.4 51.6 17%
31 December
Twelve months ended
London Stock Exchange Group Page 35
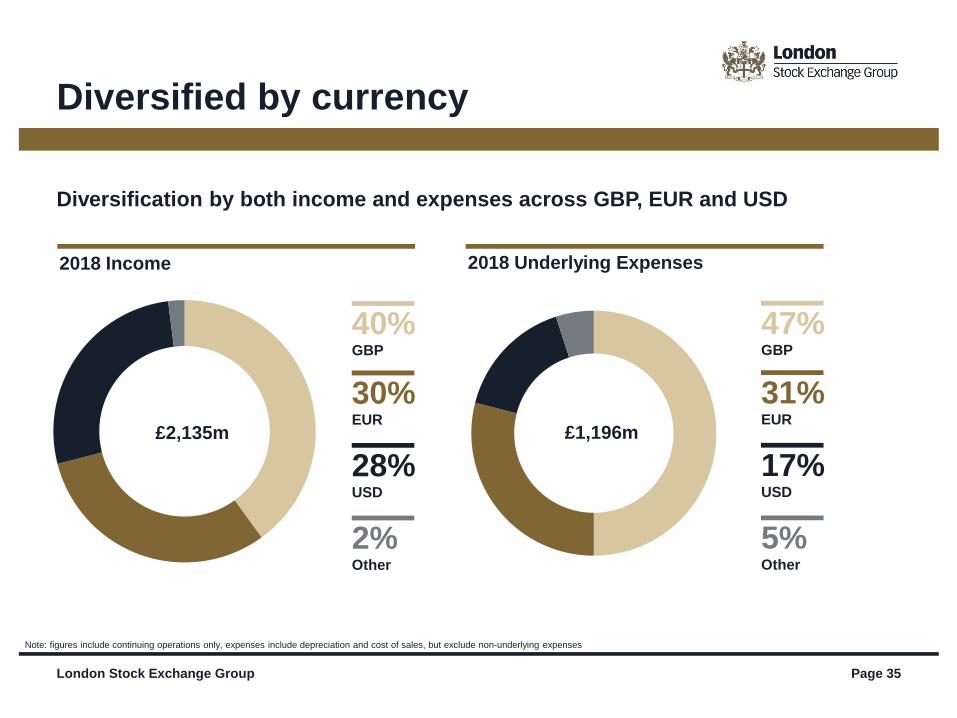
Diversified by currency
Note: figures include continuing operations only, expenses include depreciation and cost of sales, but exclude non-underlying expenses
2018 Income
28%USD
40%GBP
30%EUR
2%Other
£2,135m
2018 Underlying Expenses
17%USD
47%GBP
31%EUR
5%Other
£1,196m
Diversification by both income and expenses across GBP, EUR and USD
London Stock Exchange Group Page 36
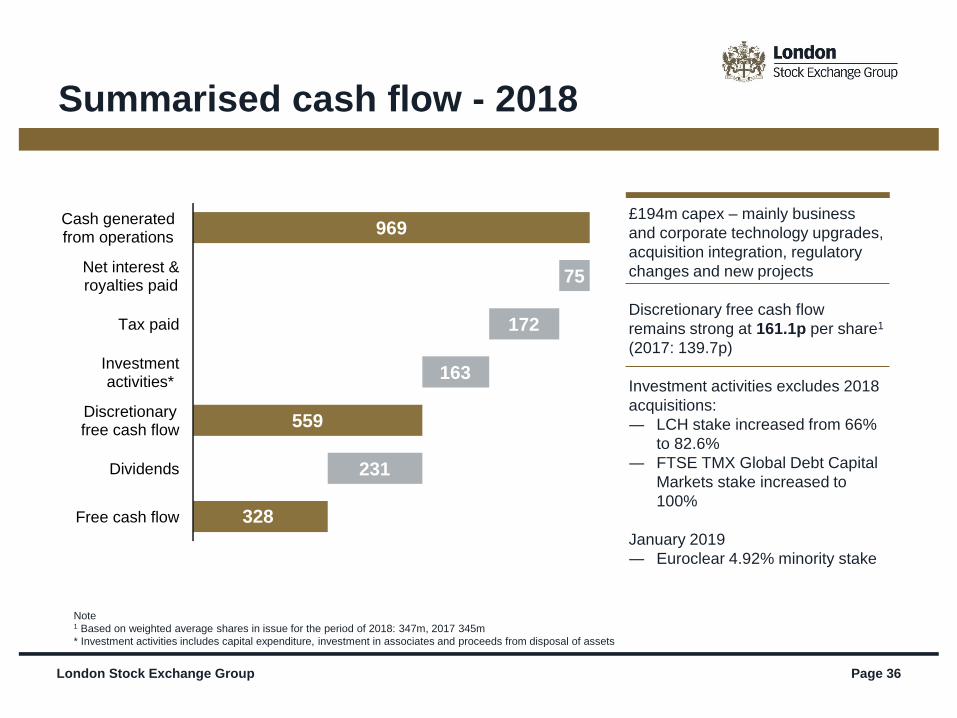
Note1 Based on weighted average shares in issue for the period of 2018: 347m, 2017 345m
* Investment activities includes capital expenditure, investment in associates and proceeds from disposal of assets
Summarised cash flow - 2018
£194m capex – mainly business
and corporate technology upgrades,
acquisition integration, regulatory
changes and new projects
Discretionary free cash flow
remains strong at 161.1p per share1
(2017: 139.7p)
Investment activities excludes 2018
acquisitions:
― LCH stake increased from 66%
to 82.6%
― FTSE TMX Global Debt Capital
Markets stake increased to
100%
January 2019
― Euroclear 4.92% minority stake
Cash generatedfrom operations
Net interest &royalties paid
Tax paid
Investmentactivities*
Discretionaryfree cash flow
Dividends
Free cash flow
969
559
328
75
172
163
231
London Stock Exchange Group Page 37London Stock Exchange Group Page 37
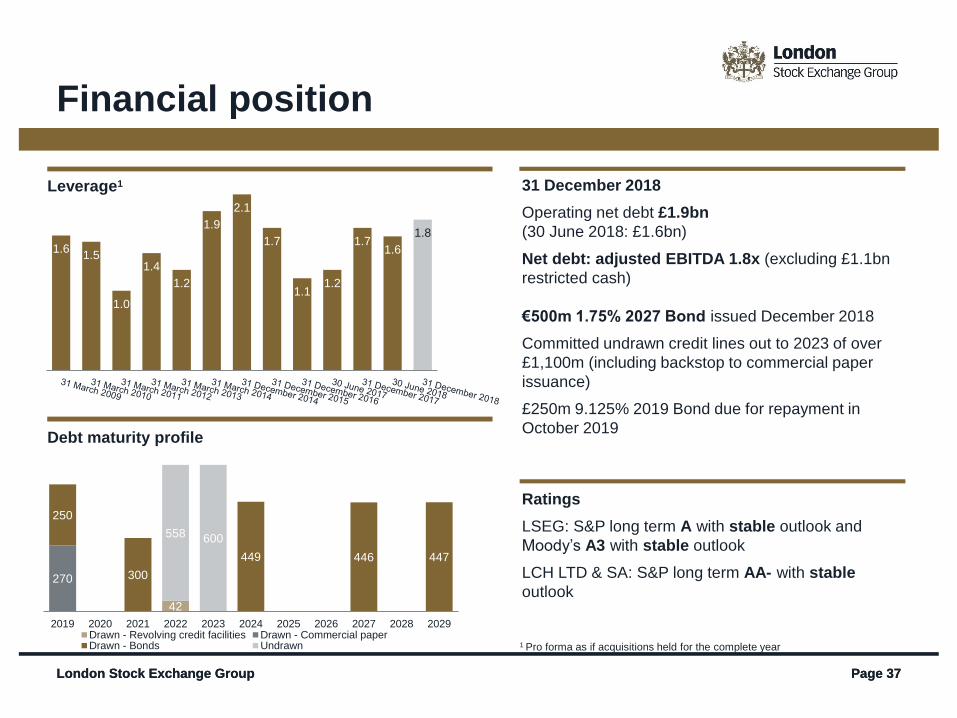
Leverage1
Debt maturity profile
Financial position
31 December 2018
Operating net debt £1.9bn
(30 June 2018: £1.6bn)
Net debt: adjusted EBITDA 1.8x (excluding £1.1bn
restricted cash)
€500m 1.75% 2027 Bond issued December 2018
Committed undrawn credit lines out to 2023 of over
£1,100m (including backstop to commercial paper
issuance)
£250m 9.125% 2019 Bond due for repayment in
October 2019
Ratings
LSEG: S&P long term A with stable outlook and
Moody’s A3 with stable outlook
LCH LTD & SA: S&P long term AA- with stable
outlook
1 Pro forma as if acquisitions held for the complete year
42
270
250
300
449 446 447
558 600
2019 2020 2021 2022 2023 2024 2025 2026 2027 2028 2029Drawn - Revolving credit facilities Drawn - Commercial paperDrawn - Bonds Undrawn
1.8
1.61.7
1.21.1
1.7
2.1
1.9
1.2
1.4
1.0
1.51.6
London Stock Exchange Group Page 38
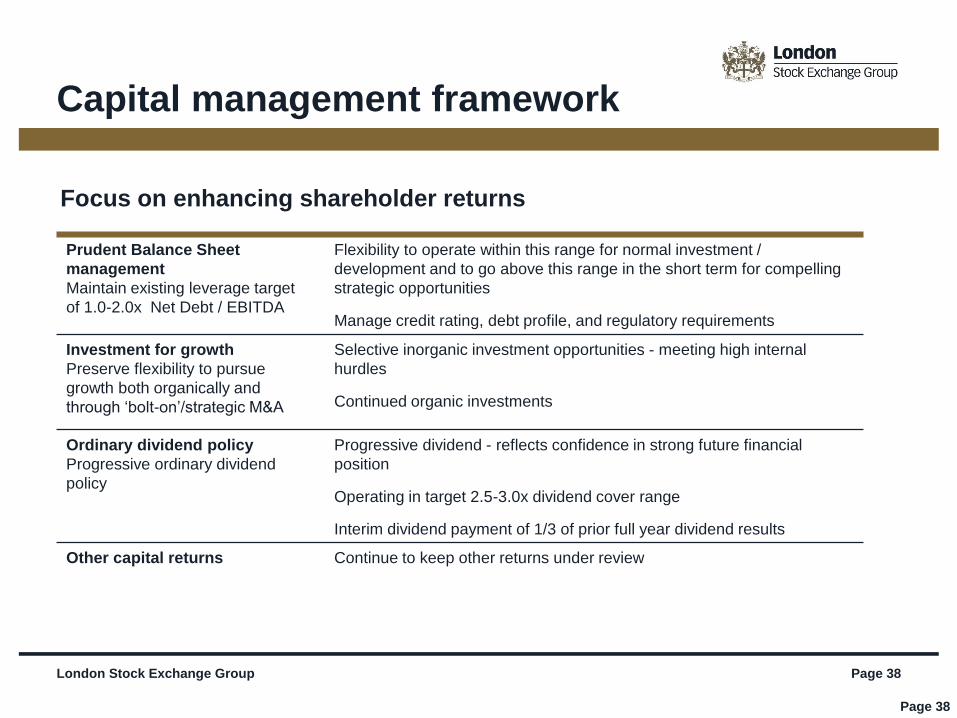
Capital management framework
Prudent Balance Sheet
management
Maintain existing leverage target
of 1.0-2.0x Net Debt / EBITDA
Flexibility to operate within this range for normal investment /
development and to go above this range in the short term for compelling
strategic opportunities
Manage credit rating, debt profile, and regulatory requirements
Investment for growth
Preserve flexibility to pursue
growth both organically and
through ‘bolt-on’/strategic M&A
Selective inorganic investment opportunities - meeting high internal
hurdles
Continued organic investments
Ordinary dividend policy
Progressive ordinary dividend
policy
Progressive dividend - reflects confidence in strong future financial
position
Operating in target 2.5-3.0x dividend cover range
Interim dividend payment of 1/3 of prior full year dividend results
Other capital returns Continue to keep other returns under review
Focus on enhancing shareholder returns
Page 38
London Stock Exchange Group Page 39
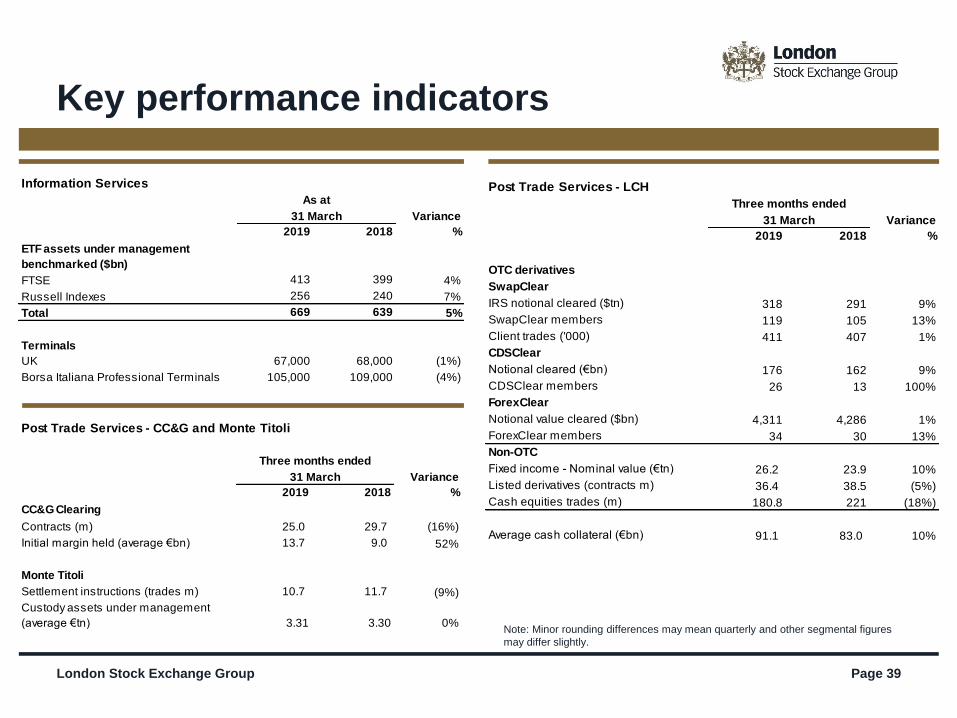
Key performance indicators
Note: Minor rounding differences may mean quarterly and other segmental figures
may differ slightly.
Information Services
Variance
2019 2018 %
ETF assets under management
benchmarked ($bn)
FTSE 413 399 4%
Russell Indexes 256 240 7%
Total 669 639 5%
Terminals
UK 67,000 68,000 (1%)
Borsa Italiana Professional Terminals 105,000 109,000 (4%)
31 March
As at
Post Trade Services - CC&G and Monte Titoli
Variance
2019 2018 %
CC&G Clearing
Contracts (m) 25.0 29.7 (16%)
Initial margin held (average €bn) 13.7 9.0 52%
Monte Titoli
Settlement instructions (trades m) 10.7 11.7 (9%)
Custody assets under management
(average €tn) 3.31 3.30 0%
31 March
Three months ended
Post Trade Services - LCH
Variance
2019 2018 %
OTC derivatives
SwapClear
IRS notional cleared ($tn) 318 291 9%
SwapClear members 119 105 13%
Client trades ('000) 411 407 1%
CDSClear
Notional cleared (€bn) 176 162 9%
CDSClear members 26 13 100%
ForexClear
Notional value cleared ($bn) 4,311 4,286 1%
ForexClear members 34 30 13%
Non-OTC
Fixed income - Nominal value (€tn) 26.2 23.9 10%
Listed derivatives (contracts m) 36.4 38.5 (5%)
Cash equities trades (m) 180.8 221 (18%)
Average cash collateral (€bn) 91.1 83.0 10%
31 March
Three months ended
London Stock Exchange Group Page 40
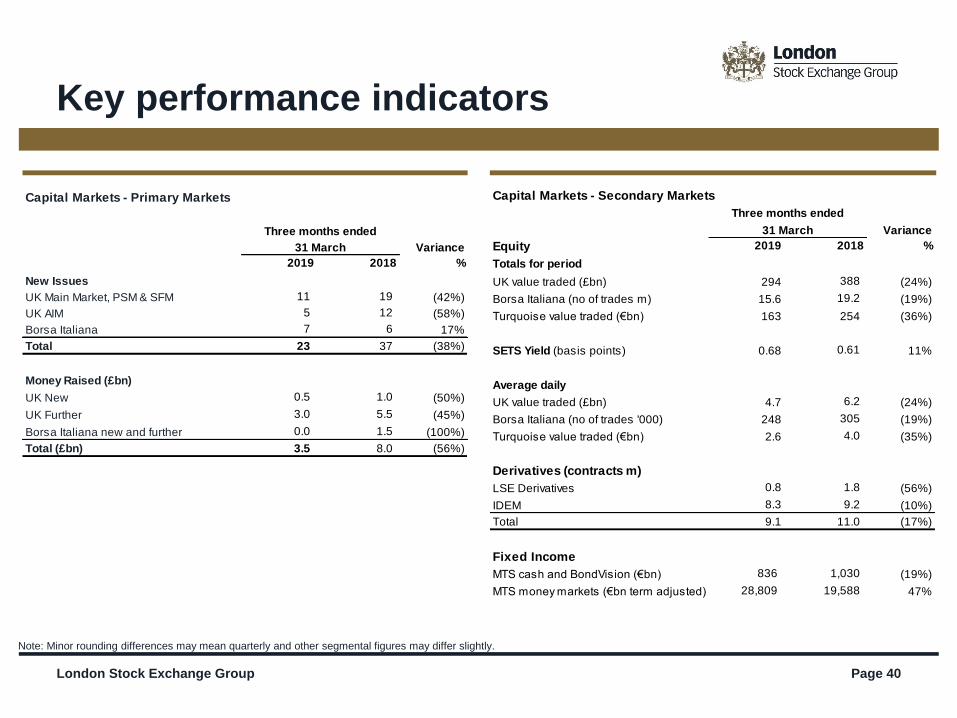
Key performance indicators
Note: Minor rounding differences may mean quarterly and other segmental figures may differ slightly.
Capital Markets - Primary Markets
Variance
2019 2018 %
New Issues
UK Main Market, PSM & SFM 11 19 (42%)
UK AIM 5 12 (58%)
Borsa Italiana 7 6 17%
Total 23 37 (38%)
Money Raised (£bn)
UK New 0.5 1.0 (50%)
UK Further 3.0 5.5 (45%)
Borsa Italiana new and further 0.0 1.5 (100%)
Total (£bn) 3.5 8.0 (56%)
Three months ended
31 March
Capital Markets - Secondary Markets
Variance
Equity 2019 2018 %
Totals for period
UK value traded (£bn) 294 388 (24%)
Borsa Italiana (no of trades m) 15.6 19.2 (19%)
Turquoise value traded (€bn) 163 254 (36%)
SETS Yield (basis points) 0.68 0.61 11%
Average daily
UK value traded (£bn) 4.7 6.2 (24%)
Borsa Italiana (no of trades '000) 248 305 (19%)
Turquoise value traded (€bn) 2.6 4.0 (35%)
Derivatives (contracts m)
LSE Derivatives 0.8 1.8 (56%)
IDEM 8.3 9.2 (10%)
Total 9.1 11.0 (17%)
Fixed Income
MTS cash and BondVision (€bn) 836 1,030 (19%)
MTS money markets (€bn term adjusted) 28,809 19,588 47%
Three months ended
31 March
London Stock Exchange Group Page 41
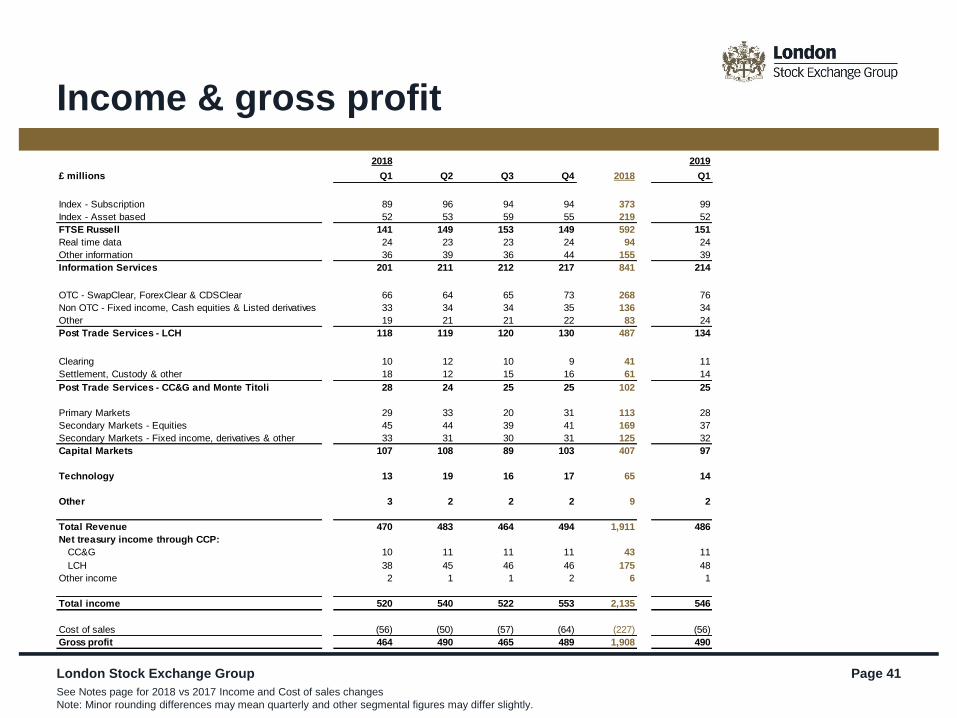
Income & gross profit
See Notes page for 2018 vs 2017 Income and Cost of sales changes
Note: Minor rounding differences may mean quarterly and other segmental figures may differ slightly.
2018 2019
£ millions Q1 Q2 Q3 Q4 2018 Q1
Index - Subscription 89 96 94 94 373 99
Index - Asset based 52 53 59 55 219 52
FTSE Russell 141 149 153 149 592 151
Real time data 24 23 23 24 94 24
Other information 36 39 36 44 155 39
Information Services 201 211 212 217 841 214
OTC - SwapClear, ForexClear & CDSClear 66 64 65 73 268 76
Non OTC - Fixed income, Cash equities & Listed derivatives 33 34 34 35 136 34
Other 19 21 21 22 83 24
Post Trade Services - LCH 118 119 120 130 487 134
Clearing 10 12 10 9 41 11
Settlement, Custody & other 18 12 15 16 61 14
Post Trade Services - CC&G and Monte Titoli 28 24 25 25 102 25
Primary Markets 29 33 20 31 113 28
Secondary Markets - Equities 45 44 39 41 169 37
Secondary Markets - Fixed income, derivatives & other 33 31 30 31 125 32
Capital Markets 107 108 89 103 407 97
Technology 13 19 16 17 65 14
Other 3 2 2 2 9 2
Total Revenue 470 483 464 494 1,911 486
Net treasury income through CCP:
CC&G 10 11 11 11 43 11
LCH 38 45 46 46 175 48
Other income 2 1 1 2 6 1
Total income 520 540 522 553 2,135 546
Cost of sales (56) (50) (57) (64) (227) (56)
Gross profit 464 490 465 489 1,908 490
London Stock Exchange Group plc
10 Paternoster Square
London
EC4M 7LS
For information on the Group:
www.lseg.com
London Stock Exchange Group
Paul Froud
Head of Investor Relations
Tel: +44 (0)20 7797 1186
email : [email protected]
Tom Woodley
Investor Relations Manager
Tel: +44 (0)20 7797 1293
email: [email protected]
Ian Hughes
Investor Relations Executive
email: [email protected]
Page 42
Contacts