London Freight Data Report: 2014 Upatecontent.tfl.gov.uk/london-freight-data-report-2014.pdfLondon...
30
London Freight Data Report: 2014 Update Prepared by Julian Allen, Michael Browne and Allan Woodburn Planning and Transport Department University of Westminster for Transport for London 1 st December 2014 Final version
Transcript of London Freight Data Report: 2014 Upatecontent.tfl.gov.uk/london-freight-data-report-2014.pdfLondon...
London Freight Data Report: 2014 Update
Prepared by
Julian Allen, Michael Browne and Allan Woodburn Planning and Transport Department
University of Westminster
for
Transport for London
1st December 2014
Final version
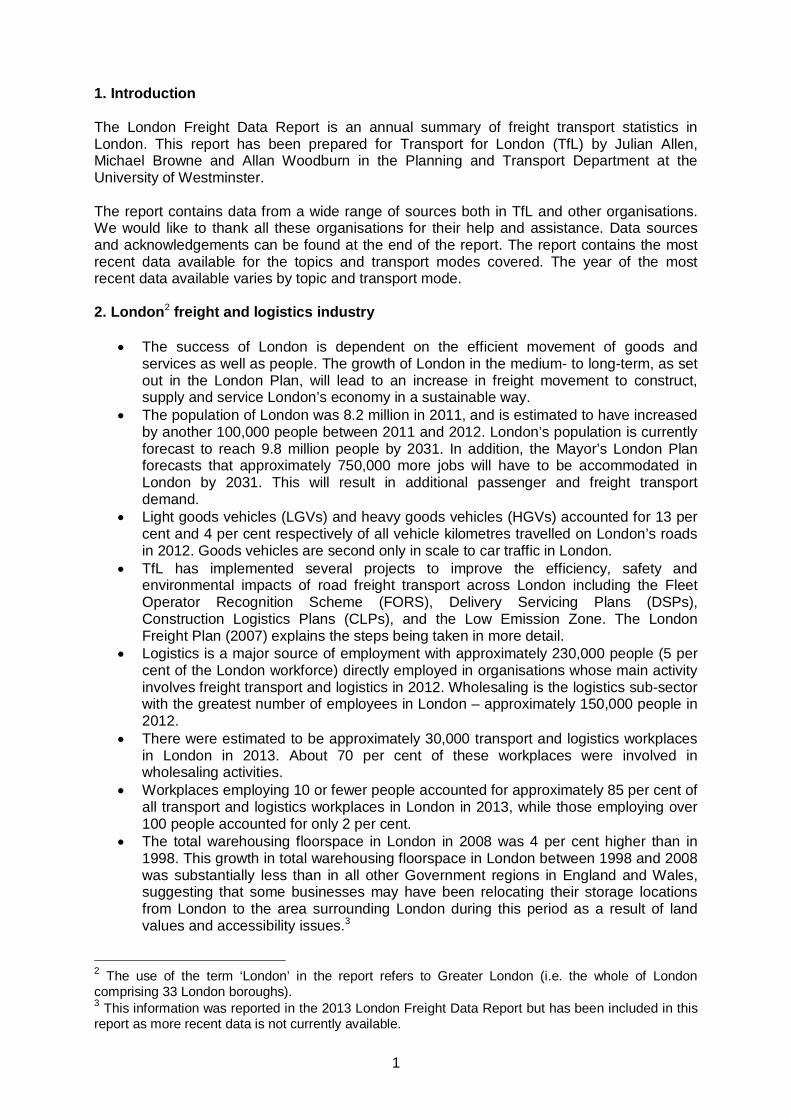
Executive Summary
• The success of London is dependent on the efficient movement of goods and services as well as people.
• Logistics is a major source of employment with approximately 5 per cent of the London workforce directly employed in organisations whose main activity involves freight transport and logistics in 2012.
• Road is by far the dominant mode for goods transport in London in terms of the weight of goods lifted. The next most important mode is Port of London traffic on the river Thames within London, followed by rail and air.
• Light goods vehicles (LGVs) and heavy goods vehicles (HGVs) accounted for 13 per cent and 4 per cent respectively of all vehicle kilometres travelled on London’s roads in 2012. Goods vehicles are second only in scale to car traffic on London’s roads.
• In 2012, 91 people were killed and seriously injured in collisions involving HGVs in London (compared with the 2005-9 average of 153 people).
• In 2012, 284 people were killed and seriously injured in collisions involving LGVs in London (compared with the 2005-9 average of 278 people).
• The number of fatal and serious injuries in collisions involving HGVs per vehicle kilometre travelled in London was 40 per cent lower in 2012 than the 2005-2009 annual average, while for LGVs was 9 per cent higher.
• TfL estimates indicate that LGVs and HGVs were responsible for 10 per cent and 13 per cent of road transport CO2 emissions in London in 2010 respectively1.
• The report includes a special focus on three specific freight transport topics in London. These topics have been included either due to the progress that has been made in relation to them in the past year, or due to the availability of analysis that provides greater insight into them. The topics included are: the work of the Industrial HGV Task Force (IHTF) and other efforts to improve goods vehicle safety, the Fleet Operators Recognition Scheme (FORS), and road freight traffic activity patterns in London.
1 This information was reported in the 2013 London Freight Data Report but has been included in this report as more recent data is not currently available.

CONTENTS
Page No.
1. Introduction 1
2. London freight and logistics industry 1
3. London freight transport activity 2
4. Freight transport by road 2 4.1 Road freight transport activity 2 4.2 Goods vehicles licensed 5 4.3 Road freight transport and society 6 4.4 Road freight transport and the environment 9
5. Rail freight transport 10
6. Freight transport on the river Thames 11
7. Air freight transport 12
8. Focus on specific topics 13 8.1 Industrial HGV Task Force and Safer Lorry Scheme 13 8.2 Fleet Operator Recognition Scheme (FORS) 15 8.3 Road freight traffic activity patterns in London 18
Glossary 23
Acknowledgements 25
References 25
1. Introduction The London Freight Data Report is an annual summary of freight transport statistics in London. This report has been prepared for Transport for London (TfL) by Julian Allen, Michael Browne and Allan Woodburn in the Planning and Transport Department at the University of Westminster. The report contains data from a wide range of sources both in TfL and other organisations. We would like to thank all these organisations for their help and assistance. Data sources and acknowledgements can be found at the end of the report. The report contains the most recent data available for the topics and transport modes covered. The year of the most recent data available varies by topic and transport mode. 2. London2 freight and logistics industry
• The success of London is dependent on the efficient movement of goods and services as well as people. The growth of London in the medium- to long-term, as set out in the London Plan, will lead to an increase in freight movement to construct, supply and service London’s economy in a sustainable way.
• The population of London was 8.2 million in 2011, and is estimated to have increased by another 100,000 people between 2011 and 2012. London’s population is currently forecast to reach 9.8 million people by 2031. In addition, the Mayor’s London Plan forecasts that approximately 750,000 more jobs will have to be accommodated in London by 2031. This will result in additional passenger and freight transport demand.
• Light goods vehicles (LGVs) and heavy goods vehicles (HGVs) accounted for 13 per cent and 4 per cent respectively of all vehicle kilometres travelled on London’s roads in 2012. Goods vehicles are second only in scale to car traffic in London.
• TfL has implemented several projects to improve the efficiency, safety and environmental impacts of road freight transport across London including the Fleet Operator Recognition Scheme (FORS), Delivery Servicing Plans (DSPs), Construction Logistics Plans (CLPs), and the Low Emission Zone. The London Freight Plan (2007) explains the steps being taken in more detail.
• Logistics is a major source of employment with approximately 230,000 people (5 per cent of the London workforce) directly employed in organisations whose main activity involves freight transport and logistics in 2012. Wholesaling is the logistics sub-sector with the greatest number of employees in London – approximately 150,000 people in 2012.
• There were estimated to be approximately 30,000 transport and logistics workplaces in London in 2013. About 70 per cent of these workplaces were involved in wholesaling activities.
• Workplaces employing 10 or fewer people accounted for approximately 85 per cent of all transport and logistics workplaces in London in 2013, while those employing over 100 people accounted for only 2 per cent.
• The total warehousing floorspace in London in 2008 was 4 per cent higher than in 1998. This growth in total warehousing floorspace in London between 1998 and 2008 was substantially less than in all other Government regions in England and Wales, suggesting that some businesses may have been relocating their storage locations from London to the area surrounding London during this period as a result of land values and accessibility issues.3
2 The use of the term ‘London’ in the report refers to Greater London (i.e. the whole of London comprising 33 London boroughs). 3 This information was reported in the 2013 London Freight Data Report but has been included in this report as more recent data is not currently available.
1
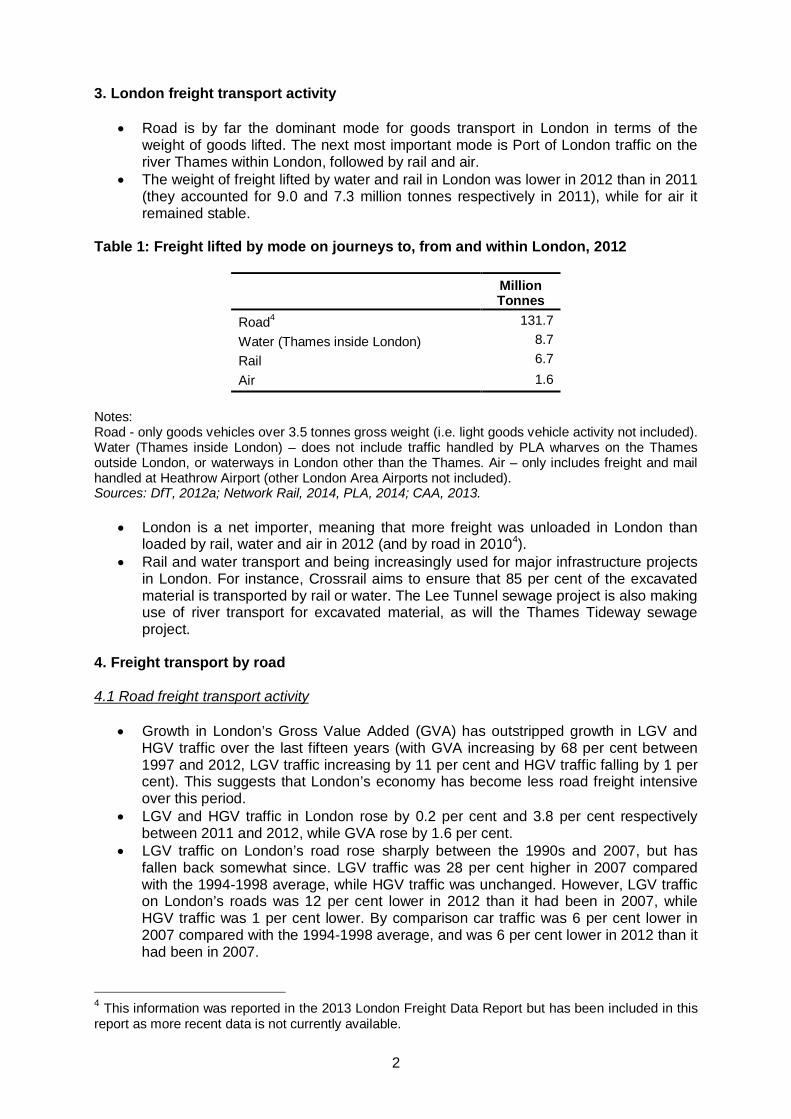
3. London freight transport activity
• Road is by far the dominant mode for goods transport in London in terms of the weight of goods lifted. The next most important mode is Port of London traffic on the river Thames within London, followed by rail and air.
• The weight of freight lifted by water and rail in London was lower in 2012 than in 2011 (they accounted for 9.0 and 7.3 million tonnes respectively in 2011), while for air it remained stable.
Table 1: Freight lifted by mode on journeys to, from and within London, 2012
Million Tonnes
Road4 131.7 Water (Thames inside London) 8.7 Rail 6.7 Air 1.6
Notes: Road - only goods vehicles over 3.5 tonnes gross weight (i.e. light goods vehicle activity not included). Water (Thames inside London) – does not include traffic handled by PLA wharves on the Thames outside London, or waterways in London other than the Thames. Air – only includes freight and mail handled at Heathrow Airport (other London Area Airports not included). Sources: DfT, 2012a; Network Rail, 2014, PLA, 2014; CAA, 2013.
• London is a net importer, meaning that more freight was unloaded in London than loaded by rail, water and air in 2012 (and by road in 20104).
• Rail and water transport and being increasingly used for major infrastructure projects in London. For instance, Crossrail aims to ensure that 85 per cent of the excavated material is transported by rail or water. The Lee Tunnel sewage project is also making use of river transport for excavated material, as will the Thames Tideway sewage project.
4. Freight transport by road 4.1 Road freight transport activity
• Growth in London’s Gross Value Added (GVA) has outstripped growth in LGV and HGV traffic over the last fifteen years (with GVA increasing by 68 per cent between 1997 and 2012, LGV traffic increasing by 11 per cent and HGV traffic falling by 1 per cent). This suggests that London’s economy has become less road freight intensive over this period.
• LGV and HGV traffic in London rose by 0.2 per cent and 3.8 per cent respectively between 2011 and 2012, while GVA rose by 1.6 per cent.
• LGV traffic on London’s road rose sharply between the 1990s and 2007, but has fallen back somewhat since. LGV traffic was 28 per cent higher in 2007 compared with the 1994-1998 average, while HGV traffic was unchanged. However, LGV traffic on London’s roads was 12 per cent lower in 2012 than it had been in 2007, while HGV traffic was 1 per cent lower. By comparison car traffic was 6 per cent lower in 2007 compared with the 1994-1998 average, and was 6 per cent lower in 2012 than it had been in 2007.
4 This information was reported in the 2013 London Freight Data Report but has been included in this report as more recent data is not currently available.
2

Figure 1: Comparison of Gross Value Added and goods vehicles kilometres travelled in London, 1997-2012
0
20
40
60
80
100
120
140
160
18019
97
1998
1999
2000
2001
2002
2003
2004
2005
2006
2007
2008
2009
2010
2011
2012
Inde
x (1
997=
100)
Gross value added LGV vehicle km HGV vehicle km
Source: Calculated from data provided by GLA, 2013 and TfL, 2014a. Figure 2: Vehicle kilometres performed by goods vehicles on all roads in London, 1993-2012
0.0
0.5
1.0
1.5
2.0
2.5
3.0
3.5
4.0
4.5
1993
1994
1995
1996
1997
1998
1999
2000
2001
2002
2003
2004
2005
2006
2007
2008
2009
2010
2011
2012
Vehi
cle
kilo
met
res
(bill
ion)
Light goods vehicles Heavy goods vehicles
Source: TfL, 2014a.
• All goods vehicles (i.e. LGVs and HGVs) travelled a total of 4.8 billion vehicle kilometres on roads in London in 2012. Approximately 80 per cent of these kilometres were performed by LGVs (up to 3.5 tonnes gross weight), and 20 per cent by HGVs (15 per cent by rigid goods vehicles over 3.5 tonnes, and 5 per cent by articulated goods vehicles over 3.5 tonnes).
• LGVs and HGVs were responsible for 13 per cent and 4 per cent respectively of the vehicle kilometres travelled by all motorised road vehicles in London in 2012. This
3

data is based on vehicle movements; if it were based on equivalent Passenger Car Units (PCUs) then HGVs would approximately double in importance.5
• LGVs are estimated to have performed approximately 60 per cent of their total distance travelled in London in 2012 on major roads and 40 per cent on minor roads, compared with approximately 80 per cent and 10 per cent respectively for HGVs.
Figure 3: Total vehicle kilometres travelled in London by vehicle type, 2012
0.7 0.6 1.0
22.9
3.8
0
5
10
15
20
25
Cars and taxis Two-wheeledmotor vehicles
Buses andcoaches
Light goodsvehicles
Heavy goodsvehicles
Vehi
cle
kilo
met
res
(bill
ion)
Source: TfL, 2014a.
• Approximately 132 million tonnes of road freight carried on journeys by UK-registered HGVs had its origin and/or destination in London in 2010. The road freight carried on journeys to, from and within London represented approximately 9 per cent by weight of the total freight lifted on all road freight journeys in Britain in 2010.6
• It is estimated that in 2010, 44 million tonnes lifted in London on journeys by UK-registered HGVs had both an origin and destination in London. Fifty three million tonnes were lifted elsewhere in the country and had a destination in London, while 35 million tonnes were lifted in London and had a destination elsewhere in the country.6
• London has a higher net inflow of goods by road than all other British regions in 2010, with 18 million more tonnes of goods arriving on vehicle journeys than leaving.6
• Of the freight lifted in London and delivered elsewhere in the UK in 2010, 79 per cent by weight was unloaded in the two regions closest to London, namely the South East and the East of England. Of the freight delivered in London from elsewhere in the UK, 76 per cent by weight was loaded in these same two regions. 6
5 The Department for Transport uses Passenger Car Unit (PCU) factors of 1.9 for rigid HGVs and 2.9 for articulated HGVs (DfT, 2012b). Given that rigid and articulated HGVs accounted for 77 and 23 per cent respectively of total HGV vehicle kilometres in London in 2010, all HGVs can be calculated to have a PCU factor of 2.1. DfT uses a PCU factor of 1.0 for LGVs. 6 This information was reported in the 2013 London Freight Data Report but has been included in this report as more recent data is not currently available.
4

Figure 4: Freight lifted by HGVs on journeys to, from and within London, 2000-2010
Source: DfT, 2012a.
• Rigid goods vehicles (over 3.5 tonnes gross weight) were responsible for 49 per cent by weight of the freight lifted on all journeys within, to and from London, compared with 51 per cent by articulated goods vehicles in 2010.7
• For all journeys within, to and from London in 2010, 31 per cent of vehicle kilometres were run empty. This compares with an empty running percentage of 29 per cent for all HGV kilometres performed in Britain in 2010.7
• The lading factor of 0.59 for all HGV journeys to, from and within London in 2010 is the same as the lading factor for all HGV activity performed in Britain. 7
4.2 Goods vehicles licensed
• There were approximately 226,000 goods vehicles licensed with keeper’s addresses in London at the end of September 2013. The vast majority of these were LGVs (i.e. up to 3.5 tonnes gross vehicle weight). This is approximately 1 per cent more goods vehicles than were registered at keeper’s addresses in London a year earlier.
• In the whole of the South East and Metropolitan Traffic Area (SEMTA - which includes London), 9,693 operator licences were in issue in 2012/13 for a total of 41,816 HGVs. This is equivalent to approximately 12 per cent of all HGVs specified on operator licences in Britain (and 13 per cent of all licences).8
• The number of operator licences in SEMTA has fallen by 23 per cent between 2002/03 and 2012/13, while the number of HGVs on these licences has fallen by 18 per cent. There has been exactly the same proportionate reduction in operator licences and the number of HGVs on these licences in Britain as a whole over the same period.
7 This information was reported in the 2013 London Freight Data Report but has been included in this report as more recent data is not currently available. 8 SEMTA includes all of London, the counties of Kent, Surrey, East Sussex and West Sussex; the Districts of Brighton and Hove, and the Medway Towns.
0
20
40
60
80
100
120
140
160
2000 2001 2002 2003 2004 2005 2006 2007 2008 2009 2010
Tonn
es li
fted
(mill
ion)
Within London From London To London
5

Figure 5: Operator licences in issue and HGVs specified on these licences in SEMTA, 2002/03-2012/13
0
2,000
4,000
6,000
8,000
10,000
12,000
14,000
2002
-3
2003
-4
2004
-5
2005
-6
2006
-7
2007
-8
2008
-9
2009
-10
2010
-11
2011
-12
2012
-13N
umbe
r of l
icen
ces
in is
sue
30,000
35,000
40,000
45,000
50,000
55,000
Num
ber o
f veh
icle
s on
lice
nces
Number of licences in issue Number of vehicles on licences
Source: Traffic Commissioners, 2013. 4.3 Road freight transport and society Figure 6: Fatal and serious casualties per billion vehicle kilometres in London, 1993-2012
0
50
100
150
200
250
300
1993
1994
1995
1996
1997
1998
1999
2000
2001
2002
2003
2004
2005
2006
2007
2008
2009
2010
2011
2012
Fata
l & s
erio
us c
asua
lties
per
bill
ion
vehi
cle
km
Light goods vehicles Heavy goods vehicles
Source: calculated from data provided by TfL, 2014b.
• LGVs were responsible for 13 per cent of total motorised vehicle kilometres on roads in London in 2012, and were involved in collisions that resulted in 10 per cent of total road traffic casualties, 9 per cent of killed and seriously injured casualties, and 13 per cent of total road traffic fatalities in London in 2012.
• In 2012, 284 people were killed and seriously injured in collisions involving LGVs in London (compared with the 2005-9 average of 278 people). Of these, there were 17 fatalities in 2012 (compared with the 2005-9 average of 15 fatalities).
• Of the 17 fatalities resulting from collisions involving LGVs in 2012, 11 were
pedestrians, 1 was pedal cyclists, 4 were motorcyclists, and 1 was a car occupant.
6

• Compared with the 2005-9 average, the number of people killed and seriously injured in collisions involving LGVs was 2 per cent higher in 2012. The number of slight casualties in collisions involving LGVs was 18 per cent higher.
• The number of fatal and serious injuries in collisions involving LGVs in London per vehicle kilometre travelled was 9 per cent higher in 2012 than the 2005-2009 annual average. The number of slight casualties in collisions involving LGVs per vehicle kilometre travelled was 26 per cent higher.
Figure 7: Casualties resulting from collisions involving LGVs in London by severity, 1990-2012
0
1,000
2,000
3,000
4,000
5,000
6,000
1990
1991
1992
1993
1994
1995
1996
1997
1998
1999
2000
2001
2002
2003
2004
2005
2006
2007
2008
2009
2010
2011
2012
Num
ber o
f cas
ualti
es
Slight casualties Fatal and serious casualties
Source: calculated from data provided by TfL, 2014b. Table 2: Fatal and serious casualties resulting from collisions involving LGVs were in London, 2012 compared with 2005-2009 average and 2011
Casualty mode of Travel Casualty numbers Percentage change in
2012 over
2005-2009 average 2011 2012 2011 2005-2009
average
Pedestrians 70 82 74 -10% 6% Pedal cyclists 40 58 74 28% 87% Powered two-wheeler 63 67 64 -4% 2% Car occupants 55 46 43 -7% -22% Taxi occupants 3 1 0 -100% -100% Bus or coach occupants 6 2 4 100% -29% Goods vehicle occupants 40 25 23 -8% -43% Other vehicle occupants 1 2 2 0% 67% TOTAL 277 283 284 0% 2%
Source: Calculated from data provided by TfL, 2013b.
• HGVs were responsible for 4 per cent of total motorised vehicle kilometres on roads in London in 2012, and were involved in collisions that resulted in 3 per cent of total road traffic casualties, 3 per cent of killed and seriously injured casualties, and 13 per cent of total road traffic fatalities in London in 2012.
7

• In 2012, 91 people were killed and seriously injured in collisions involving HGVs in London (compared to the 2005-9 average of 153 people). Of these, there were 18 fatalities in collisions involving HGVs in London in 2012 (compared with the 2005-9 average of 26 fatalities).
• Of the 18 fatalities resulting from collisions involving HGVs in 2012, 11 were pedestrians, 4 were pedal cyclists, 1 was a motorcyclist, 1 was a car occupant, and 1 was a goods vehicle occupant.
• Goods vehicles over 7.5 tonnes were involved in the majority of fatalities in collisions involving HGVs in 2012 (14 out of 18 fatalities).
• Research by TfL using 2010-2011 data indicated that HGVs serving the construction industry may be overrepresented in cyclist fatalities in London.9 This led to the formation of the Industrial HGV Task Force and other work, which is discussed in more detail in a separate section later in this report.
• Compared with the 2005-9 average, the number of people killed and seriously injured in collisions involving HGVs was 40 per cent lower in 2012. The number of slight casualties in collisions involving HGVs was 17 per cent lower.
• The number of fatal and serious injuries in collisions involving HGVs in London per vehicle kilometre travelled was 40 per cent lower in 2012 than the 2005-2009 annual average. The number of slight casualties in collisions involving HGVs per vehicle kilometre travelled was 16 per cent lower.
Figure 8: Casualties resulting from collisions involving HGVs in London by severity, 1990-2012
0
200
400
600
800
1,000
1,200
1,400
1,600
1,800
2,000
1990
1991
1992
1993
1994
1995
1996
1997
1998
1999
2000
2001
2002
2003
2004
2005
2006
2007
2008
2009
2010
2011
2012
Num
ber o
f cas
ualti
es
Slight casualties Fatal and serious casualties
Source: calculated from data provided by TfL, 2014b.
9 TfL research referred to in Delmonte et al. (2012).
8

Table 3: Fatal and serious casualties resulting from collisions involving HGVs in London, 2012 compared with 2005-2009 average and 2011
Casualty mode of Travel Casualty numbers Percentage change in
2012 over
2005-2009 average 2011 2012 2011 2005-2009
average
Pedestrians 44 22 40 82% -9% Pedal cyclists 27 28 19 -32% -30% Powered two-wheeler 21 15 16 7% -25% Car occupants 40 22 12 -45% -70% Taxi occupants 2 3 0 0% -100% Bus or coach occupants 2 2 0 -100% -100% Goods vehicle occupants 15 5 4 -20% -73% Other vehicle occupants 1 1 0 -100% -100% TOTAL 152 98 98 -7% -40%
Source: Calculated from data provided by TfL, 2014b. Figure 9: Proportion of total traffic fatalities resulting from collisions involving goods vehicles in London, 1990-2012
0%
2%
4%
6%
8%
10%
12%
14%
16%
18%
1990
1991
1992
1993
1994
1995
1996
1997
1998
1999
2000
2001
2002
2003
2004
2005
2006
2007
2008
2009
2010
2011
2012
Prop
ortio
n of
tota
l tra
ffic
fata
litie
s
Light goods vehicles Heavy goods vehicles
Source: Calculated from data provided by TfL, 2014b. 4.4 Road freight transport and the environment
• TfL has estimated that CO2 emissions from road transport fell by 6 per cent between 2008 and 2010.10
• These latest estimates indicate that road freight transport was responsible for 23 per cent of road transport CO2 emissions in London in 2010 - 13 per cent by HGVs and 10 per cent by LGVs (while cars and motorcycles accounted for 65 per cent).10
• TfL has estimated that NOx emissions from road transport fell by 19 per cent between 2008 and 2010.10
10 This information was reported in the 2013 London Freight Data Report but has been included in this report as more recent data is not currently available.
9

• These latest estimates indicate that road freight transport was responsible for 36 per cent of road transport NOx emissions in London in 2010 - 24 per cent by HGVs and 12 per cent by LGVs (while cars and motorcycles accounted for 38 per cent).11
• TfL has estimated that PM10 exhaust emissions from road transport reduced by 15 per cent between 2008 and 2010.11
• These latest estimates indicate that road freight transport was responsible for 39 per cent of road transport PM10 exhaust emissions in London in 2010 - 17 per cent by HGVs and 22 per cent by LGVs (while cars and motorcycles accounted for 47 per cent).11
• In January 2012 Phases 3 and 4 of the London Low Emission Zone (LEZ) were introduced. Phase 3 requires Euro III standards for PM emissions for larger LGVs with an unladen weight of 1.205 tonnes or greater and minibuses, while Phase 4 requires Euro IV standards for PM emissions for HGVs, buses and coaches. Compliance rates at the end of March 2014 were 99.3% per cent for Phase 3 vehicles and 97.0% per cent for Phase 4 vehicles. The LEZ scheme has therefore helped to achieve a shift in the ‘Euro Class’ of the HGV and larger LGV fleet operating London with the vast majority of older, dirtier goods vehicles eliminated, and thereby reduced NOx and PM10 emissions.
5. Rail freight transport
• In 2012, 6.7 million tonnes of rail freight was lifted on journeys to, from and within London (compared with 7.3 million tonnes in 2011).
Figure 10: Goods lifted by rail on journeys to, from and within London, 2004-2012
0
1
2
3
4
5
6
7
8
2004 2005 2006 2007 2008 2009 2010 2011 2012
Mill
ion
tonn
es
Within London To London From London
Source: Calculated from Network Rail data processed by MDS Transmodal, 2014.
• London is a net importer of freight by rail from other parts of the country, with almost four times as much by weight arriving as leaving in 2012.
• The rail freight lifted on journeys to, from and within London in 2012 represented 7 per cent by weight of the total rail freight lifted in Britain.
11 This information was reported in the 2013 London Freight Data Report but has been included in this report as more recent data is not currently available.
10

• The major rail freight flows to London in 2012 by weight were aggregates for the construction industry. No single commodity type dominated flows out of London, which were much less significant than inward flows in tonnage terms.
• The greatest inward flows to London in 2012 by weight came from the South West and East Midlands (together accounting for 68 per cent of goods transported by rail and unloaded at terminals in London).
• For goods loaded on to rail in London, approximately 40 per cent was moved to the South East and a further 35 per cent was intra-London traffic in 2012.
• In addition, considerable volumes of rail freight pass through London en route to and from other regions.
6. Freight on the river Thames
• There are approximately 80 operational wharves in the PLA (in and outside London). • There are currently 50 safeguarded wharves on the Thames and its tributaries in
London (some of which are actively used for freight transport and some of which are not currently in use).
• The Mayor of London published his final review of the safeguarding of wharves on London's waterways and recommendations for the future safeguarding or release of individual wharves in 2013. In this final review, the Mayor has recommended that nine wharves that are currently safeguarded are released and that one additional wharf is safeguarded.
• The Port of London Authority (PLA) was the UK’s second most important port in terms of the weight of freight handled in 2012 accounting for 9 per cent of all foreign and domestic tonnage handled at UK ports. The PLA is a net importer of freight by ship, with 83 per cent by weight of the total freight handled arriving at, and 17 per cent of the total freight handled departing from, PLA wharves in 2012.
• Approximately 45 million tonnes of foreign and coastwise goods were handled at wharves in the PLA in 2012. Approximately 7 million tonnes of these goods were loaded or unloaded at a PLA wharf within London.
• In addition, 1.6 million tonnes of goods were transported between wharves within the PLA in 2012 (of which 1.4 million tonnes had either an origin or destination in London - with the loading or unloading taking place at a PLA wharf outside London, and 0.2 million tonnes was transported between two London wharves).
• Therefore the total weight of freight handled at PLA wharves in London in 2012 was approximately 9 million tonnes (which represented 18 per cent of the total freight handled by weight at all PLA wharves). Approximately 80 per cent of this cargo handled in London was foreign and coastwise traffic (i.e. was transported between a wharf outside the PLA and a PLA wharf), while approximately 20 per cent was moved between PLA wharves in London.
11
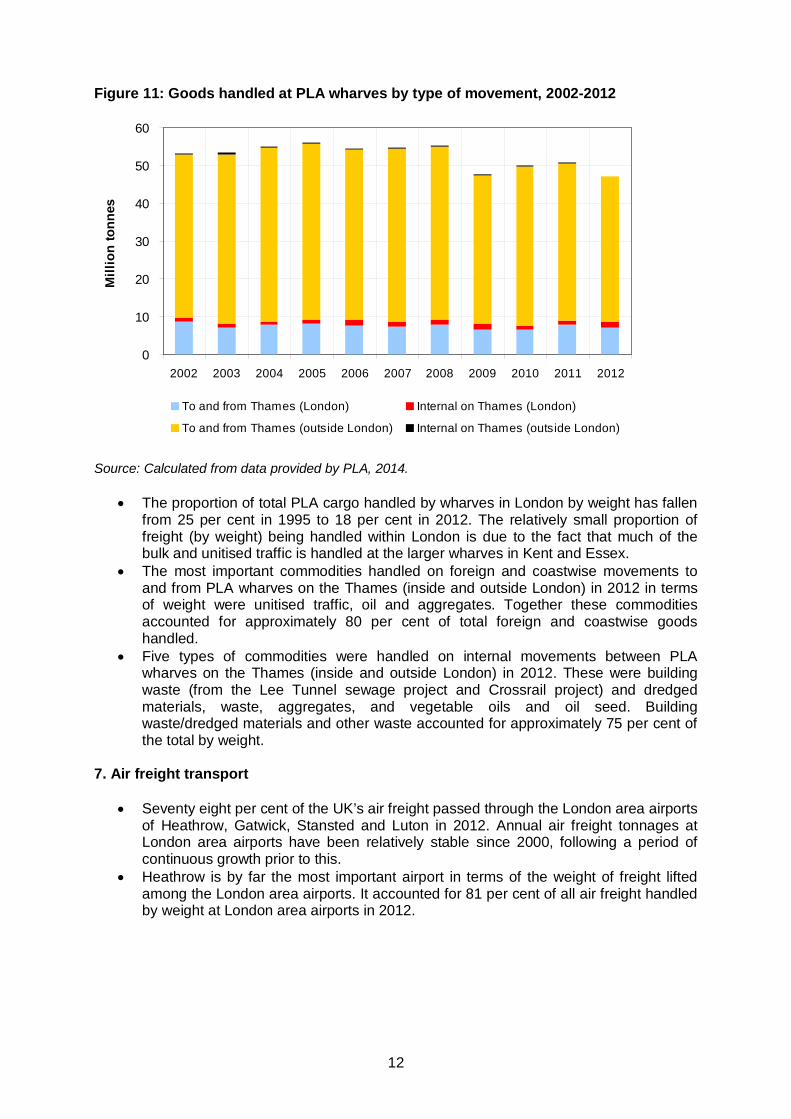
Figure 11: Goods handled at PLA wharves by type of movement, 2002-2012
0
10
20
30
40
50
60
2002 2003 2004 2005 2006 2007 2008 2009 2010 2011 2012
Mill
ion
tonn
es
To and from Thames (London) Internal on Thames (London)
To and from Thames (outside London) Internal on Thames (outside London)
Source: Calculated from data provided by PLA, 2014.
• The proportion of total PLA cargo handled by wharves in London by weight has fallen from 25 per cent in 1995 to 18 per cent in 2012. The relatively small proportion of freight (by weight) being handled within London is due to the fact that much of the bulk and unitised traffic is handled at the larger wharves in Kent and Essex.
• The most important commodities handled on foreign and coastwise movements to and from PLA wharves on the Thames (inside and outside London) in 2012 in terms of weight were unitised traffic, oil and aggregates. Together these commodities accounted for approximately 80 per cent of total foreign and coastwise goods handled.
• Five types of commodities were handled on internal movements between PLA wharves on the Thames (inside and outside London) in 2012. These were building waste (from the Lee Tunnel sewage project and Crossrail project) and dredged materials, waste, aggregates, and vegetable oils and oil seed. Building waste/dredged materials and other waste accounted for approximately 75 per cent of the total by weight.
7. Air freight transport
• Seventy eight per cent of the UK’s air freight passed through the London area airports of Heathrow, Gatwick, Stansted and Luton in 2012. Annual air freight tonnages at London area airports have been relatively stable since 2000, following a period of continuous growth prior to this.
• Heathrow is by far the most important airport in terms of the weight of freight lifted among the London area airports. It accounted for 81 per cent of all air freight handled by weight at London area airports in 2012.
12

Figure 12: Freight handled at London area airports by airport, 2002-2012
0.00
0.20
0.40
0.60
0.80
1.00
1.20
1.40
1.60
1.80
2.00
2002 2003 2004 2005 2006 2007 2008 2009 2010 2011 2012
Mill
ion
tonn
es
Gatwick Heathrow Luton Stansted
Source: CAA, 2013.
• In addition, London area airports handled 55 per cent of all the UK’s mail handled by air in 2012 (by weight). Heathrow accounted for 75 per cent of all air mail handled at London area airports in 2012.
• There was a net import of air freight into the London area airports in 2012, with 0.95 million tonnes being set down and 0.85 million tonnes being picked up.
8. Focus on specific topics This section contains detailed consideration of several specific freight transport topics in London. These topics have been included either due to the progress that has been made in relation to them in the past year, or due to the availability of analysis that provides greater insight into them. The topics included are: the work of the Industrial HGV Task Force (IHTF), the Fleet Operators Recognition Scheme (FORS), and an analysis of road freight traffic activity in London. 8.1 Industrial HGV Task Force and Safer Lorry Scheme • TfL and the Department for Transport (DfT) established the Industrial HGV Task Force
(IHTF) in October 2013. The IHTF is staffed by officers from Driver and Vehicle Standards Agency (DVSA), the Metropolitan Police Service (MPS) and the City of London Police (CoLP). The IHTF has the aim of contributing to a reduction in fatalities and serious injuries involving vulnerable road users and HGVs through coordinated, targeted roadside enforcement operations against non-compliant operators, drivers and vehicles. A particular focus of the IHTF’s enforcement work is HGVs in the construction and waste industries due to their involvement rates in cyclist fatalities. The roadside checks carried out by IHTF are in addition to the usual commercial vehicle compliance activities of DVSA and the Police.
• Between October 2013 and March 2014 the IHTF targeted and stopped 1,960 vehicles (of which 1,850 were HGVs). Of all the vehicles stopped, 72 per cent were found to be non-compliant. In terms of HGVs in the construction and waste industry that were stopped 78 per cent were found to be non-compliant.
• During this six-month period 24 of the most dangerous and unsafe vehicles were immediately seized. Roadworthiness prohibitions were issued to 44 per cent of vehicles
13

stopped, and 5 per cent of vehicles were issued with roadworthiness inspection notices. Drivers hours’ prohibitions were issued to 7 per cent of drivers stopped.
• A total of 380 vehicle-related and 139 driver-related Fixed Penalty Notices were also issued over this six-month period.
Table 4: Results of Industrial HGV task force roadside vehicle checks in London, October 2013-March 2014
Construction and Waste
HGVs
Other HGVs
Other Vehicles
All vehicles stopped
Total number of vehicles stopped 919 931 110 1,960 No. of satisfactory stops 200 325 23 548 No. of unsatisfactory stops 719 606 87 1,412 Roadworthiness Prohibition (PG9) 441 351 68 860 Roadworthiness Inspection Notice 60 28 2 90 Driver Hours prohibitions (Total) 83 54 0 137 Overweight prohibitions 9 3 12 24 FPNs issued (Driver related) 72 59 8 139 FPNs issued (Vehicle related) 183 164 33 380 Vehicles seized 16 4 4 24
Notes: "FPNs" - fixed penalty notices. "Roadworthiness Prohibition (PG9)" - ban on the use of a vehicle on a public road. A prohibition will normally be issued where a vehicle is found by an Examiner to be, or likely to become, unfit for use or where driving of the vehicle would involve a risk of injury to any person. "Roadworthiness Inspection Notice" - if Examiners find on a vehicle roadworthiness check defects not serious enough to warrant prohibition, they will advise the user/owner using a Vehicle Inspection Notice. This notice is advisory only and does not in itself prevent further use of the vehicle. Even if not prohibitable, some of the defects may mean that the vehicle is unroadworthy and does not comply with the law. “Other vehicles” - includes all other non-HGVs, and includes cars, motorbikes, camper vans, caravans etc. Although the IHTF do not target these vehicles, they have a responsibility to stop those they consider to be a risk to other road users. "Vehicles seized" - vehicles seized for insurance or license offences, rather than PG9 prohibitions. Data collated by TfL and the MPS. Results are for the period 1st October 2013 – 29th March 2014. Source: TfL, 2014c. • The IHTF uses a targeted approach to enforcement based on Operator Compliance Risk
Scoring, Automatic Number Plate Recognition (ANPR) and roadside observation. The levels of non-compliance identified by the IHTF are a result of this approach and should not therefore be considered as representative of the industry as a whole.
• Continued resourcing for the IHTF has been committed, so the team will continue its roadside checks, operator visits, educational work, and preparatory work for court cases for the foreseeable future (TfL, 2014d).
• TfL has established the Construction Logistics and Cyclist Safety (CLOCS) project which aims to reduce the risk of collisions between vulnerable road users and construction vehicles. This is to be achieved through the design and manufacture of safer new vehicles and by retrofitting appropriate equipment to existing vehicles, establishing a culture in the construction industry where it is normal to take both road and site safety seriously, and encouraging the construction logistics industry to adopt best practice. In addition, TfL has published a cycle safety toolkit aimed at fleet managers (TfL, 2013a).
• As part of CLOCS, TfL continues to promote Construction Logistics Plans (CLP) as a means by which the negative impact of construction on road transport and the local environment can be reduced. Planning authorities are more frequently requiring CLPs to
14

be established as part of the planning process to assess transport impacts during each building phase.
• TfL requires that all businesses working for or on behalf of it take measures to improve the Work Related Road Risk (WRRR) standards of its goods vehicles to help reduce the risk of collisions with cyclists and other vulnerable road users. These WRRR standards require that operators working for TfL have at least Bronze status in the Fleet Operator Recognition Scheme (FORS), vehicle are fitted with close proximity warning systems, Class VI mirrors and rear warning signs, drivers are trained in approved safe urban driving practices, and drivers' licences are checked regularly with the DVLA. It is now mandatory, under all new and existing contracts, for contractors and their sub-contractors who deliver to TfL premises or sites to adopt these WRRR cycle safety requirements. TfL also issued a guidance document in 2013 to help others build WRRR clauses into their procurement activities (TfL, 2013b). Other organisations such as Crossrail and Mace have also introduced, or plan to introduce, some or all of these WRRR contractual requirements.
• Collaboration between TfL and developers, operators and trade associations in the construction industry led to the publication of a standard for Work Related Road Risk specifically for construction logistics (TfL, 2013c).
• The Mayor of London and London Councils are also proposing to set up a Safer Lorry Scheme to prevent HGVs without basic safety equipment from operating in London (TfL, 2014e). A study carried out by the Transport Research Laboratory for TfL as part of the Mayor of London’s consultation on “Safer Lorries” in 2014 has estimated that the presence of safety equipment on all currently exempted HGVs would have led to between 3.20 and 6.85 fatalities and between 1.24 and 4.75 serious casualties among vulnerable road users (i.e. cyclists and pedestrians) being prevented in London in the five year period between 2008 and 2012 (Robinson and Cuerden, 2014).
• The Mayor of London is also trying to encourage the DfT to make basic safety equipment mandatory for all HGVs and is lobbying the DfT and the EU to introduce mandatory safer lorry designs to HGVs across Europe.
• In March 2014 the European Parliament Transport Committee voted in favour of a new draft regulation for HGVs that will reduce blind spots and increase visibility from the driver’s cab, thereby enhancing vehicle safety. It is proposed that this new standard will be obligatory for new HGVs manufactured from 2022. However, this vote represented only the first step in the proposal becoming law.
8.2 Fleet Operator Recognition Scheme (FORS) • The Fleet Operator Recognition Scheme (FORS) is a voluntary accreditation scheme for
fleet operators. Its purpose is to raise the level of quality within fleet operations, and to demonstrate which operators are achieving the standards. FORS provides operators with practical advice and guidance to help reduce fuel consumption, CO2 emissions, vehicle collisions, and penalty charges through improving driver behaviour, vehicle and fleet management, and safety and efficiency in transport operations.
• On joining FORS an organisation and its depot fleet receive registered status. There are three levels of FORS certification (bronze, silver, and gold) that can be achieved by companies and their fleets based on their attaining the required standards.
• The FORS standard is based upon legal compliance, safety, efficiency and environmental protection. Fleet operators’ operations are assessed against the requirements of the FORS standard by an approved FORS certification body.
• FORS encourages operators to identify areas of vehicle operation for improvement. A successful bronze assessment provides an operator with reassurance that their operation is being run safely, efficiently and in an environmentally sound manner.
• All vehicles in FORS display the FORS logo. This allows existing and potential customers and the general public to readily distinguish FORS operators from other operators. Some users of fleet operator services ask that their suppliers are FORS recognised.
15

• Organisations are able to register for FORS if they operate any vehicle in the UK that is involved in the movement of materials, products, valuables, equipment, tools, waste, food or luggage which may include one or more of the following: HGVs, LGVs, cars, coaches, minibuses and motorcycles.
• In 2013, FORS introduced a process for enabling bronze accreditation across multiple-operating centres without the need for these operating centres to be audited (only 3 operating centres now need to achieve the required bronze standard for all of an organisation’s centres to attain bronze accreditation).
• In August 2013 Mace (the major construction company) announced that any goods vehicles arriving on one of its project that was not FORS Bronze accredited with the FORS sticker displayed would be turned away without offloading. TfL already had such a requirement in place for businesses working for or on behalf of it.
• By the end of March 2014 approximately 230,000 vehicles operating in London had been registered in FORS, of which approximately 170,000 had achieved bronze, silver or gold accreditation (a 76 per cent increase on the previous year). This increase was largely due to the change in FORS standard that requires FORS accredited companies to undertake a re-approval audit each year and for vehicles registered in the scheme to progress to Bronze standard within one year of joining.
Figure 13: Number of FORS vehicles, 2008-2014
0
50,000
100,000
150,000
200,000
250,000
300,000
2009 2010 2011 2012 2013 2014
Num
ber o
f veh
icle
s
Bronze, Silver and Gold vehicles Registered vehicles
Note: Data is for the end of March each year. Source: TfL, 2014f. • In April 2014, LGVs accounted for approximately 50 per cent terms of the vehicles in
FORS, HGVs for approximately 35 percent, cars for 13 per cent and coaches and minibuses for approximately 3 per cent.
• FORS organisations operate vehicles in a wide range of sectors. Sectors that account for sizeable proportions of all FORS vehicles include (in order of importance): utilities, servicing and maintenance, construction, waste and recycling, retailing (food, drink and tobacco and non-food/fast moving consumer goods), general haulage, automotive, parcels and courier services.
16

Table 5: Fleet Operator Scheme (FORS) company members, depots and vehicles by sector, April 2014 Sector % of companies % of operating
centres % of vehicles
Aggregates 9.4% 4.3% 2.5% Agriculture/Horticulture 1.2% 0.9% 0.5% Airfreight 1.0% 0.6% 1.1% Automotive 1.2% 1.9% 6.5% Bus or Coach 0.8% 0.8% 2.1% Catering & Supplies 0.3% 0.1% 0.1% Charity 0.2% 0.1% 0.0% Chemical 0.6% 0.5% 0.4% Coal, Ore & Mineral Waste 0.2% 0.2% 0.1% Construction 20.8% 20.9% 14.7% Containers 2.0% 1.2% 0.9% Electrical 1.3% 4.3% 0.4% Engineering 4.4% 2.5% 3.8% Events 1.0% 0.6% 0.4% Fleet Cars 0.1% 0.8% 0.6% FMCG/Non Food Retail 1.1% 3.2% 3.4% Food Drinks & Tobacco 1.8% 2.7% 3.3% Forestry Products 0.6% 0.4% 0.2% General Haulage 15.8% 7.8% 7.6% Hire and Rental 1.4% 1.0% 0.7% Local Authority/Public Sector 0.6% 0.6% 0.5% Manufacturing 3.7% 1.5% 1.0% Media 0.3% 0.2% 0.3% Medical & Health 0.3% 0.3% 0.4% Metals & Metal Products 2.7% 1.3% 0.8% Oil & Petroleum Products 0.5% 1.0% 0.5% Parcels & Courier Services 3.2% 6.5% 5.2% Plant Hire 3.1% 1.7% 0.9% Professional Sector 0.3% 0.1% 0.1% Rail Sector 1.5% 1.1% 0.9% Removals 0.6% 0.3% 0.1% Specialist Haulage/abnormal loads 3.5% 2.2% 1.1% Service & Maintenance 4.3% 5.1% 10.0% Taxi and Private car 0.2% 0.1% 0.2% Utilities 3.0% 8.8% 20.9% Waste & Recycling 6.1% 6.3% 7.3% Wholesale 0.9% 8.2% 0.5% Other 0.1% 0.0% 0.0% TOTAL 100.0% 100.0% 100.0% Notes: FORS company members can belong to more than one sector. Above data only includes active FORS company members (i.e. dormant members excluded). Source: TfL, 2014f. • Operational fleet changes implemented as part of FORS are intended to benefit member
organisations while at the same time benefitting the wider society and environment. Some case studies are provided below (TfL, 2014g).
• Mobile Mini (a company supplying portable accommodation) managed to reduce the distance driven by their fleet by 7 per cent and fuel consumed by 3 per cent between 2012 and 2013 as a result of focusing on careful driving. They made use of the fuel efficient driving, SAFED training for drivers and an anti-idling campaign.
• Veolia Environmental Services (a leading recycling and waste management company) has invested over £3 million in alternative fuelled vehicles since 2009, which has helped it to achieve a reduction of 6 per cent in fuel consumption.
17

• By providing drivers with better training and implementing more efficient routeing, Continental Landscapes Ltd (a grounds maintenance and street cleansing services company), managed to reduce vehicle-related incidents by 9 per cent and the number of vehicle required by 2 per cent between 2012 and 2013.
• FM Conway (an infrastructure services companies) has implemented a range of vehicle safety measures. These include installing side-guards, nearside blind-spot and reversing cameras, seven side-sensors, and audible 'vehicle turning left' warnings to every HGV in the fleet. It also implemented vehicle noise reduction measures to tipper trucks to reduce disturbance to residents including body liners, body locks, and rubber sealed tailboards. In addition to benefitting society, these changes have resulted in a 45 per cent reduction in vehicle insurance costs and a 35 per cent reduction in the total number of insurance claims in a 4-year period since 2009.
• The John Lewis Partnership has made annual vehicle fuel savings of approximately 6 per cent (and associated CO2 savings) by implementing methods including fitting aerodynamic equipment, improving trailer load factors, using double deck trailers and carrying out more back hauling.
• LondonWaste Ltd (recycling and sustainable waste management company) identified that its fleet fuel consumption was high as a result of FORS benchmarking. This led the company to discover it had a problem with engine idling. LondonWaste therefore reviewed the driver bonus scheme to include the promotion of anti-idling. This led to a 50 per cent reduction in engine idling and reduced vehicle fuel consumption by approximately 1000 litres per month.
• Travis Perkins Group (supplier of building materials) carried out vehicle analysis as part of its FORS membership and found that its vehicles spent approximately 90 minutes idling unnecessarily daily, thereby using fuel and resulting in CO2 and other pollutant emissions. The implementation of a monitoring system has reduced idling time by approximately 70 minutes per vehicle per day, and has led to reductions in fuel consumption of 1 million litres of fuel over the last three years across its 3,000 vehicle fleet, leading to important cost savings.
8.3 Road freight traffic activity patterns in London • Figure 14 shows the relative change in traffic levels on London’s roads between 1993
and 2012 for LGVs, HGVs and cars/taxis (as measured by vehicle kilometres travelled). • LGV traffic was greater in 2012 than in 1993, while HGV traffic was approximately the
same, and car traffic was lower. • Car traffic began to fall after 1999 and has continued to do so, while in the case of HGV
traffic this fall commenced in 2000 and continued to do so until 2009, since when it began to rise again. LGV traffic continued to increase until 2007, falling back somewhat until 2010 and stabilising thereafter.
• The changes in traffic levels for LGVs, HGV, and cars in London shown in Figure 14 indicate that anecdotal reports in the last five years about growth in LGV traffic in London are explained by an increase in the relative importance of LGVs compared to cars rather than absolute increases in LGV traffic.
18
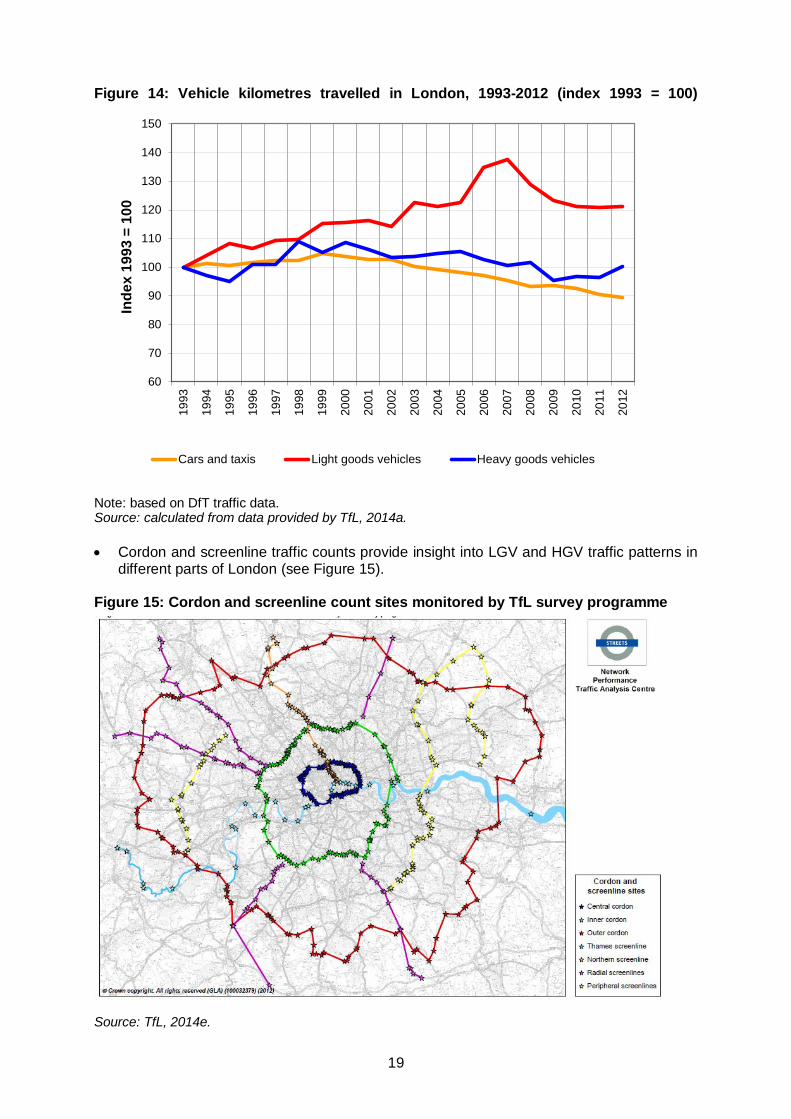
Figure 14: Vehicle kilometres travelled in London, 1993-2012 (index 1993 = 100)
60
70
80
90
100
110
120
130
140
150
1993
1994
1995
1996
1997
1998
1999
2000
2001
2002
2003
2004
2005
2006
2007
2008
2009
2010
2011
2012
Inde
x 19
93 =
100
Cars and taxis Light goods vehicles Heavy goods vehicles
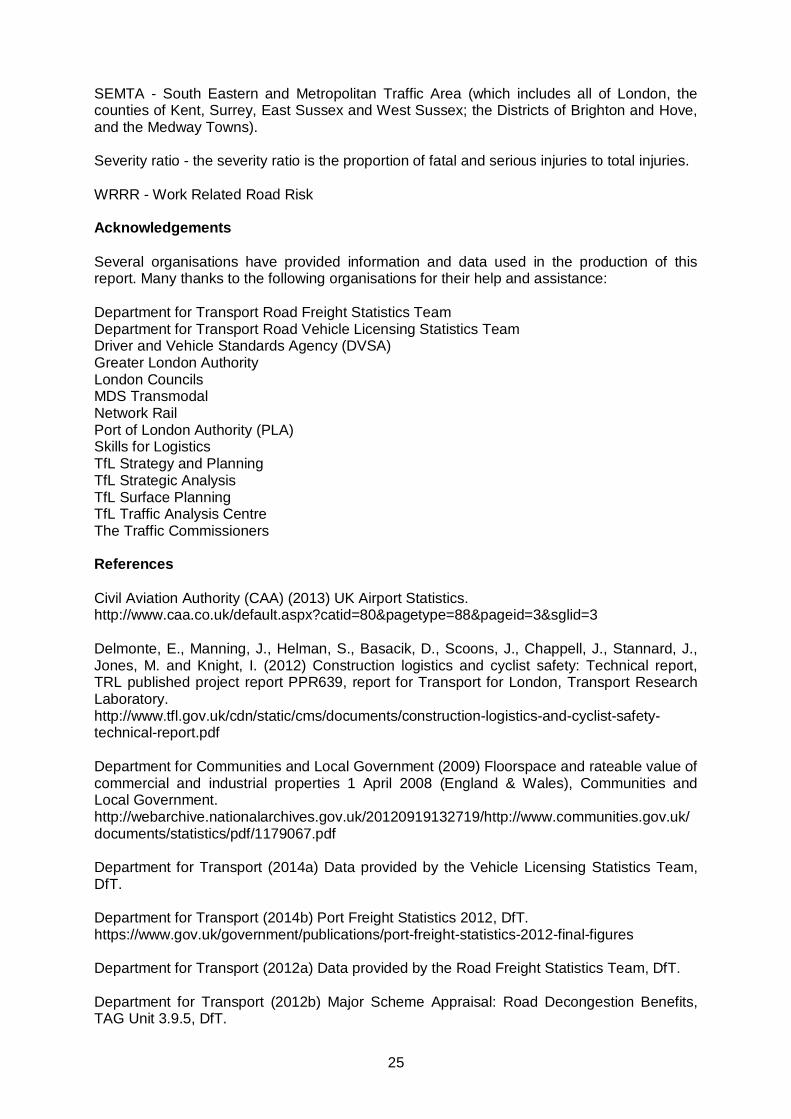
Note: based on DfT traffic data. Source: calculated from data provided by TfL, 2014a. • Cordon and screenline traffic counts provide insight into LGV and HGV traffic patterns in
different parts of London (see Figure 15). Figure 15: Cordon and screenline count sites monitored by TfL survey programme Source: TfL, 2014e.
19

• Cordon counts are carried out at the boundary, inner and central cordons. The boundary cordon roughly corresponds to the boundary of Greater London and is entirely within the M25 orbital motorway, the inner cordon encloses an area similar to the inner London boroughs, and the central cordon encloses central London, with count points situated outside the Inner Ring Road and within a radius of 2.5 to 3kms from the centre of London.
• At the boundary cordon LGV crossings rose strongly to 2007, since when they have stabilised. By comparison HGV crossings have fallen considerably over recent decades, but at a slower rate since 2001 (see Figure 16).
• LGV crossings at the inner cordon also rose strongly over recent decades before falling in 2005, then increasing again in 2008, since when they have remained stable. HGV crossings fell even more strongly at the inner cordon than the boundary cordon over the decades to 2005 since when they have remained relatively stable (see Figure 17).
• LGV crossings at the central cordon have exhibited a different pattern to those at the boundary and inner cordons, with levels increasing sharply during the 1980s, the falling to 1993, since when they have remained stable. HGV crossings showed similar rates of reductions at the central cordon as at the inner cordon until 2004 since when HGV crossings have stabilised (see Figure 18).
• The Thames, Northern, radial and peripheral screenline counts also show a pattern of increasing LGV crossings and declining HGV crossing over recent decades. However, whereas the boundary, inner and central cordon counts show relative stability in LGV and HGV crossings over the last 5-10 years (depending on the cordon in question), the screenline counts vary somewhat from this recent picture.
• The Northern screenline shows the most similar recent pattern to the cordon counts, with LGV crossings remaining stable since 2005 and HGV crossings stable since 2007.
• At the Thames screenline LGV crossings rose strongly until 2000, then fell sharply to 2006, since when they have increased strongly again. HGV crossings have exhibited a similar pattern to the cordon counts with them stopping falling in 2006 and subsequently remaining stable.
• At the peripheral screenlines LGV crossing have increased continually to 2012 with the exception of a fall in 2006. Meanwhile HGV crossings have fallen at each count between 1994 and 2012.
• At the radial screenlines, LGV crossings fell between 2003 and 2006 (having risen continuously prior to this) but have continued to rise strongly since 2006. HGV crossings fell continuously between 1994 and 2009, but increased in 2012.
20

Figure 16: Greater London boundary daily crossings – goods vehicles: 24 hour flows, 1977-2013
0
50
100
150
200
250
300
350
400
1977 1980 1983 1986 1989 1992 1995 1998 2001 2004 2007 2010 2013
Thou
sand
s of
veh
icle
s (tw
o-w
ay)
Light Goods Vehicles Heavy Goods Vehicles
Source: TfL, 2014a. Figure 17: Inner London cordon daily crossings – goods vehicles: 24 hour flows, 1978-2012
0
50
100
150
200
250
300
350
1978
1980
1982
1984
1986
1988
1990
1992
1994
1996
1998
2000
2002
2004
2006
2008
2010
2012
Thou
sand
s of
veh
icle
s (tw
o-w
ay)
Light Goods Vehicles Heavy Goods Vehicles
Source: TfL, 2014a.
21

Figure 18: Central London cordon daily crossings - goods vehicles: 24 hour flows, 1977-2012
0
50
100
150
200
25019
77
1979
1981
1983
1985
1987
1989
1991
1993
1995
1997
1999
2001
2003
2005
2007
2009
2011
Thou
sand
s of
veh
icle
s (tw
o-w
ay)
Light Goods Vehicles Heavy Goods Vehicles
Source: TfL, 2014a.
22

Glossary Roads classifications Major roads - include motorways and A roads. These roads usually have high traffic flows and are often the main arteries to major destinations. Minor roads - B roads, C roads and unclassified roads and are all maintained by the local authorities. Types of road goods vehicles Light goods vehicles (LGVs) - commercial vehicles up to and including 3.5 tonnes gross plated weight. LGVs are commonly referred to as ‘vans’. Heavy goods vehicles (HGVs) - commercial vehicles of more than 3.5 tonnes gross plated weight. Articulated goods vehicles - articulated vehicles have two parts: a motorised drawing unit known as a tractive unit (or motor vehicle) and a mounted trailer. These vehicles are over 3.5 tonnes gross plated weight and are therefore referred to as heavy goods vehicles (HGVs). Rigid goods vehicles - a goods vehicle which has only one part (i.e. unlike an articulated vehicle it does not have a separate tractive unit and trailer). Rigid vehicles vary from two to four axles and are over 3.5 tonnes gross plated weight and are therefore referred to as heavy goods vehicles (HGVs). Freight transport operations Empty running - proportion of total vehicle kilometres that the goods vehicle is run empty. Gross vehicle weight - the maximum permissible weight of the goods vehicle and its load. Lading factor - The ratio of the actual tonne-kilometres to the maximum tonne-kilometres achievable if the vehicles, whenever loaded, were loaded to their maximum carrying capacity. Operator licence (O-licence) - Operator (O) licensing is the regulatory control system used to ensure the safe and legal operation of heavy goods vehicles in the UK. An operator's licence is required to operate a motor vehicle with a gross plated weight of more than 3.5 tonnes (i.e. an HGV) on a road. An O-licence is required for HGVs used for both own account and public haulage operations. Own account - goods vehicle operators who only carry goods in the course of their own trade or business. Public haulage - goods vehicle operators who carry goods for other people (often also referred to as `hire or reward'). Rail freight terminal - A facility designed to transfer goods from one train to another or between transport modes. Foreign and coastwise traffic – goods transported between a wharf outside the PLA and a PLA wharf. These are referred to as movements ‘to and from the Thames’ in Figure 11.
23

Internal on Thames (London) – these water-based movements in Figure 11 include those that are loaded and/or unloaded in London. Safeguarded wharves - those wharves in London which have been given special status to ensure that they continue to be available for river freight transport use and are protected from redevelopment Wharf - A landing place or pier where ships may berth and load or unload. Acronyms for organisations CAA - Civil Aviation Authority DfT - Department for Transport DVSA – Driver and Vehicle Standards Agency FTA – Freight Transport Association GLA - Greater London Authority ONS - Office for National Statistics PLA - Port of London Authority TfL - Transport for London Other abbreviations and definitions used CLOCS - Construction Logistics and Cyclist Safety CLPs - Construction Logistics Plans CO2 - carbon dioxide. DSPs – Delivery Servicing Plans FORS - Fleet Operator Recognition Scheme GVA - Gross Value Added (the difference between output and intermediate consumption for any given sector/industry. That is the difference between the value of goods and services produced and the cost of raw materials and other inputs which are used up in production). Ground based transport – includes emissions from aircraft whilst taxiing and during the take-off and landing cycle (i.e., below one mile in altitude). LEZ - Low Emission Zone NOx - the collective term for oxides of nitrogen PM10 - particulate matter: fine particles with an aerodynamic diameter of less than 10 microns which has several significant adverse health effects including heart disease, poor lung function and lung cancer.
24
SEMTA - South Eastern and Metropolitan Traffic Area (which includes all of London, the counties of Kent, Surrey, East Sussex and West Sussex; the Districts of Brighton and Hove, and the Medway Towns). Severity ratio - the severity ratio is the proportion of fatal and serious injuries to total injuries. WRRR - Work Related Road Risk Acknowledgements Several organisations have provided information and data used in the production of this report. Many thanks to the following organisations for their help and assistance: Department for Transport Road Freight Statistics Team Department for Transport Road Vehicle Licensing Statistics Team Driver and Vehicle Standards Agency (DVSA) Greater London Authority London Councils MDS Transmodal Network Rail Port of London Authority (PLA) Skills for Logistics TfL Strategy and Planning TfL Strategic Analysis TfL Surface Planning TfL Traffic Analysis Centre The Traffic Commissioners References Civil Aviation Authority (CAA) (2013) UK Airport Statistics. http://www.caa.co.uk/default.aspx?catid=80&pagetype=88&pageid=3&sglid=3 Delmonte, E., Manning, J., Helman, S., Basacik, D., Scoons, J., Chappell, J., Stannard, J., Jones, M. and Knight, I. (2012) Construction logistics and cyclist safety: Technical report, TRL published project report PPR639, report for Transport for London, Transport Research Laboratory. http://www.tfl.gov.uk/cdn/static/cms/documents/construction-logistics-and-cyclist-safety-technical-report.pdf Department for Communities and Local Government (2009) Floorspace and rateable value of commercial and industrial properties 1 April 2008 (England & Wales), Communities and Local Government. http://webarchive.nationalarchives.gov.uk/20120919132719/http://www.communities.gov.uk/documents/statistics/pdf/1179067.pdf Department for Transport (2014a) Data provided by the Vehicle Licensing Statistics Team, DfT. Department for Transport (2014b) Port Freight Statistics 2012, DfT. https://www.gov.uk/government/publications/port-freight-statistics-2012-final-figures Department for Transport (2012a) Data provided by the Road Freight Statistics Team, DfT. Department for Transport (2012b) Major Scheme Appraisal: Road Decongestion Benefits, TAG Unit 3.9.5, DfT.
25

http://www.dft.gov.uk/webtag/documents/expert/pdf/U3_9_5-msa-road-decongestion-benefits-120723.pdf Department for Transport (2013) Transport Statistics Great Britain 2013, DfT. https://www.gov.uk/government/statistics/transport-statistics-great-britain-2013 Greater London Authority (2013) GLA 2013 Round of Demographic Projections - Trend-based population projections, Central scenario (for actual and forecast population from 2001), GLA. http://data.london.gov.uk/datastore/package/gla-2013-round-population-and-household-projections GLA Economics (2013) London’s Economic Outlook: Autumn 2013, Greater London Authority. https://www.london.gov.uk/priorities/business-economy/publications/gla-economics/london-s-economic-outlook-autumn-2013 Mayor of London (2012a) Safeguarded Wharves Review 2011/2012 – Further Consultation, Greater London Authority. http://www.london.gov.uk/priorities/planning/spg/safeguarded-wharves-review Mayor of London (2011) The London Plan: Spatial Development Strategy for Greater London, July 2011, Greater London Authority. http://www.london.gov.uk/priorities/planning/londonplan Network Rail (2014) Rail freight data provided by MDS Transmodal. Office for National Statistics (ONS) (2013) Region and Country Profiles: Key Statistics 17 October 2013, ONS. http://www.ons.gov.uk/ons/rel/regional-trends/region-and-country-profiles/region-and-country-profiles---key-statistics-and-profiles--october-2013/regional-profiles---key-statistics--october-2013.xls Port of London Authority (PLA) (2014) Data provided by the PLA. Robinson, T. and Cuerden, R. (2014) Safer Lorries in London: Identifying the Casualties Associated with Side Guard Rails and Mirror Exemptions, Published Project Report PPR683, Transport Research Laboratory. http://www.trl.co.uk/online_store/reports_publications/trl_reports/cat_road_user_safety/report_construction_logistics_and_cyclist_safety_summary_report.htm Skills for Logistics (2014) Data provided by Skills for Logistics. Traffic Commissioners (2013) Traffic Commissioners’ Annual Reports 2012-2013, Department for Transport. https://www.gov.uk/government/publications/traffic-commissioners-annual-report-2012-to-2013 Transport for London (TfL) (2014a) Road traffic data provided by Traffic Analysis Centre, Transport for London. Transport for London (2014b) Goods vehicle casualty and collision data provided by Strategy and Planning, Transport for London. Transport for London (2014c) Industrial HGV Task Force: Review of first six months of operations October 2013 – March 2014, Transport for London.
26

http://www.tfl.gov.uk/cdn/static/cms/documents/industrial-hgv-task-force-review-of-first-six-months-of-operations.pdf Transport for London (2014d) Successful six-month trial leads to continuation of the Industrial HGV Task Force on London's streets, press release 11 April 2014, Transport for London. http://www.tfl.gov.uk/info-for/media/press-releases/2014/april/successful-sixmonth-trial-leads-to-continuation-of-the-industrial-hgv-task-force-on-londons-streets Transport for London (2014e) Safer Lorry Scheme: The Way Forward, Transport for London. http://www.tfl.gov.uk/cdn/static/cms/documents/safer-lorry-scheme-the-way-forward-report.pdf Transport for London (2014f) Fleet Operator Recognition Scheme (FORS) data provided by FORS team, Transport for London. Transport for London (2014g) Fleet Operator Recognition Scheme (FORS) Case Studies, Transport for London. http://www.fors-online.org.uk/index.php?page=CS_INTRO Transport for London (2013a) Cycle Safety Toolkit: A Guide for Fleet Managers, Transport for London. http://www.fors-online.org.uk/resource.php?name=Guide%20for%20fleet%20managers Transport for London (2013b) Improving Road Safety Through Procurement, Transport for London. http://www.tfl.gov.uk/cdn/static/cms/documents/improving-road-safety-through-procurement.pdf Transport for London (2013c) Standard for Construction Logistics: Managing Work Related Road Risk (WRRR): A construction industry initiative to improve vulnerable road user safety, Transport for London. http://www.tfl.gov.uk/cdn/static/cms/documents/standard-for-construction-logistics.pdf Transport for London (2013d) TfL Cordon and Screenline Surveys 1971 – 2012, TAC Traffic Note 3, Network Performance, Traffic Analysis Centre, Transport for London. Transport for London (2013e) Travel in London: Report 6, Transport for London. https://www.tfl.gov.uk/cdn/static/cms/documents/travel-in-london-report-6.pdf Transport for London (2013f) Delivering a Freight Legacy, Transport for London. http://www.tfl.gov.uk/cdn/static/cms/documents/delivering-a-road-freight-legacy.pdf Transport for London (2007) London Freight Plan, Transport for London. http://www.tfl.gov.uk/info-for/freight/planning/london-freight-plan
27