London: Europe's New York - Loughborough University · PPT file · Web view · 2012-10-19London:...
41
London: Europe’s New York Alan Freeman, GLA Economics
Transcript of London: Europe's New York - Loughborough University · PPT file · Web view · 2012-10-19London:...

London: Europe’s New York
Alan Freeman, GLA Economics

1: Policy
2: Data
3: Answers

Planning for Growth
2002: Planning for London’s Growth– ‘Accept Growth and plan for it’– 700,000 population growth 1986-2002– 522,000 Job growth 1995-2002
Major decisions based on this– £15-£30 billion on transport– Accommodate growth in housing and offices
Major change in UK strategy – London as a major national asset
On what basis can such decisions be made?

Theory, data and policy
To what extent is there a sound theoretical and empirical basis to take such decisions?
How can it be improved? What role should be played by
– Academic studies– Official statistical agencies– Governmental Agencies (GLA, LDA, RDAs,
Ministries)– NGOs (think-tanks, lobby groups, etc)– Commercial suppliers of data and analysis

GLA Economics
Set up in May 2002 GLA group-wide 16 staff including 11 economists
To ‘provide a firm statistical, factual and forecasting basis for
policy-making by the GLA and its functional bodies’

Why data matters
Policy: have to make a decision on some basis; cannot wait for a perfect theory
Theory: have to be able to judge without prior prejudice between contending analyses
Democracy: public must know how a decision was reached, and be able to consider all alternatives
Data
TheoryPolicy

The state of play Widespread agreement that
– London is in some sense a ‘World City’– London underwent a step change starting in the mid-1980s– This involved a long-term reversal in population trends from
1985– It included a structural transformation of its economy from
1995– It was led by Finance and Business sector expansion– This was in some sense driven by ‘globalisation’
BUT: no agreed model of spatial growth– See for example intro to Fujita, Krugman and Venables(1999)
AND: London is unique– New York, Paris, Tokyo may be its only general comparators
THEREFORE data is of prime importance

2: Data, what data?

“When it comes to productivity, it is the German cities that
perform best across the study”
-Parkinson, Hutchings, Simmie and Verdonk(2004)
Competitive European cities – where do the core cities stand? Report to the
ODPM

While the position of New York, London and Tokyo was confirmed, the data also showed the relative
decline of London and the relative growth of other
European cities particularly Paris and
Frankfurt- John Rennie Short (2002), Cities and Globalization, GaWC 2002

Four tales of two cities
Annual growth in GVA per capita
0.0
0.5
1.0
1.5
2.0
2.5
Paris Frankfurt London
Supplier 1 5-year Supplier 2 5-yearSupplier 1 10-year Supplier 2 10-year

Where in the world is Frankfurt?
-2.0% -1.0% 0.0% 1.0% 2.0% 3.0% 4.0% 5.0%
CologneBerlin
StrasbourgTurin
FrankfurtLondon
AmsterdamLyonParis
MadridMilan
HamburgMunich
Stuttgart
Annual Productivity growth 1995-200, constant 1995 Euros
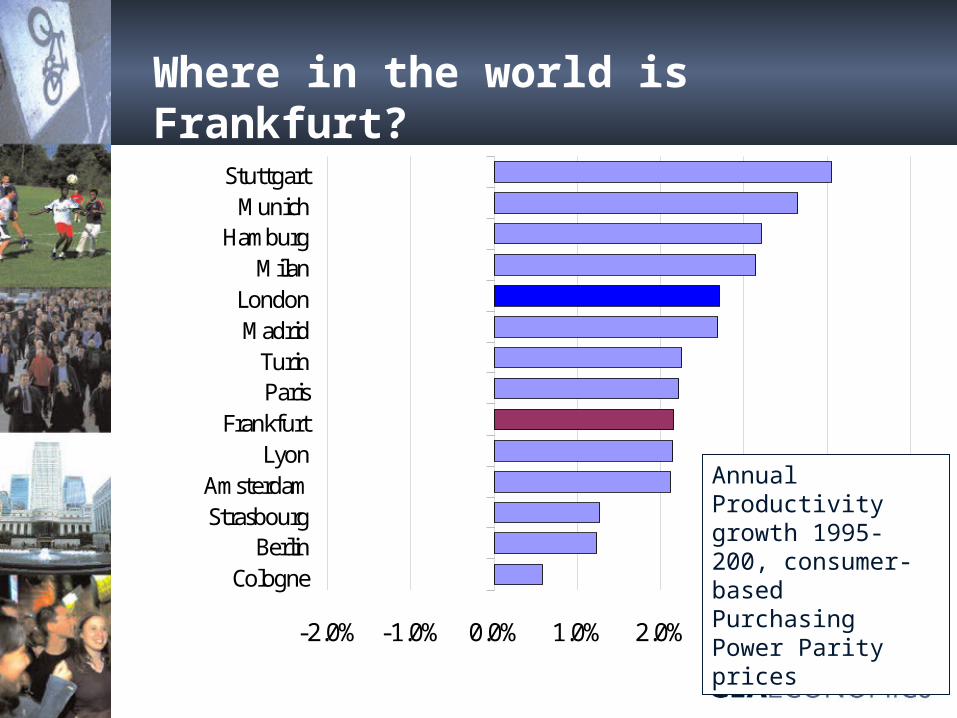
Where in the world is Frankfurt?
-2.0% -1.0% 0.0% 1.0% 2.0% 3.0% 4.0% 5.0%
CologneBerlin
StrasbourgAmsterdam
LyonFrankfurt
ParisTurin
MadridLondon
MilanHamburg
MunichStuttgart
Annual Productivity growth 1995-200, consumer-based Purchasing Power Parity prices

Where in the world is Frankfurt?
-2.0% -1.0% 0.0% 1.0% 2.0% 3.0% 4.0% 5.0%
CologneBerlinTurin
MadridMilanParis
LondonStrasbourgAmsterdam
HamburgLyon
FrankfurtStuttgartMunich
Annual Productivity growth 1995-200, production-based Purchasing Power Parity prices

Where in the world is Frankfurt?


London according to Urban Audit

London according to GEMACA/ Paul Cheshire
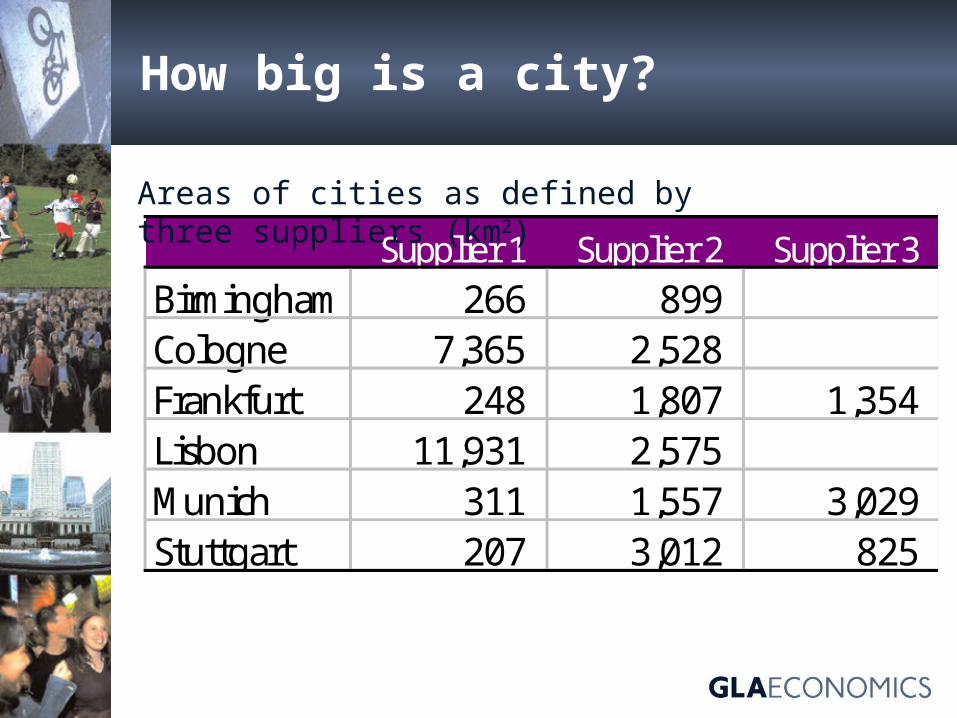
How big is a city?
Supplier 1 Supplier 2 Supplier 3Birmingham 266 899 Cologne 7,365 2,528 Frankfurt 248 1,807 1,354 Lisbon 11,931 2,575 Munich 311 1,557 3,029 Stuttgart 207 3,012 825
Areas of cities as defined by three suppliers (km2)

Summary: In Europe there is neither agreement, nor incontrovertible evidence, nor a generally accepted
theoretical foundation, for what constitutes a valid
measure of city performance
So what?

Why size matters
The obvious– Number of employees, people, buildings, land, etc.
vary with the size of the city The less obvious
– What counts as ‘location’ varies• Is Heathrow ‘in London’?• Is Microsoft ‘in London’?
– Productivity varies • value-added is greater in the Central Business District
– Unemployment varies (such that no administrative definition compares adequately)
• London’s unemployed are concentrated in the inner city• Paris unemployed are concentrated in the periphery
Even affects what we mean by ‘growth’…

How definitions determine productivity
Greater London 157.4Inner London 250.6Inner London –West 461.9Inner London – East 129.1Outer London 99.4South East 116
GVA per capita1 in constant 1995 Euros: 1995 = 100
1As proxy for productivity

How definitions determine growthParis (1990 census) London (1991 census)City 2157 City of London 4Petite couronne 3988 Inner London 2343Grande couronne 4520 GLA 6394Ile de France 1066
0South East 16794
FUR (1971 boundaries)
10624
8757
FUR (1991 boundaries)
11418
12519
Change due to expansion
794 3762‘Growth’ 1971-1991 = ‘density effect’ plus change due to expansionEstimates of London’s growth will differ by up to 43 per cent depending on whether geographic expansion is included

3: Solutions

Geographical standardisation is possible, but has not happened USA/Canada: long-standing system (CMSA)
– Harmonised across USA– City, metropolitan zone distinguished– ‘Functional’ definition since 1948– Urban core plus connected region– Now treated as ‘commuter belt’ but, NB,
includes other measures of interconnectedness (1948: phone calls)
Europe: new process of harmonisation but– Statistical boundaries not consistent– ‘Administrative’ prioritised over ‘functional’– NUTS system does not distinguish region type

Review of the state of play In general
– Comparability is a premium because policy must be consistent– Conduct sensitivity analysis to identify risks– Always read the data
Geography: a standard exists– See if we can define compatible European standard– If so, base policy on it– Prioritise research on it– But maintain ‘alternative definitions’
Performance Indicators: less standardised than you think– Where an international standard exists, (eg ILO employment)
enforce it– Maintain data and research on a variety of definitions but
‘campaign’ for standardisation – Adopt specific definitions for policy purposes on the basis of
suitability for purpose

Site and ExtentAre there city
indicators that do not depend on city
boundaries?

What can the banks tell us? ‘Site’ and ‘situation’ measures can be relatively independent
of city definition: eg air traffic – we can (nearly) always say which ‘city’ an airport serves.
Others may be– Measures of ‘interconnectedness’ eg newspaper mentions,
branch headquarters Also functions that are concentrated in the Central Business
District– Headquarters and local branch locations, but with caution
(remember Microsoft)– The most highly concentrated functions of all are financial
markets Hence: if London’s specific competitive advantage is its
financial function, we may be able to benchmark this with relative independence from ‘geographic’ issues

What is ‘globalisation’, actually? There are many different definitions of
globalisation and some do not even agree it exists
From the policy standpoint what matters is not what it is called, but what is happening
We do know that London’s growth is closely associated with the growth of the financial sector
So it makes sense to study this on a city basis worldwide

0%
5%
10%
15%
20%
25%
30%
35%
1968 1973 1978 1983 1988 1993 1998 20030%
50%
100%
150%
200%
250%
300%
350%
Exports/GDP (Left Scale)Imports/GDP Left Scale)Foreign Assets/GDP (Right Scale)Foreign Liabilities/GDP (Right Scale)
What happened to the UK under ‘globalisation’?

Point location, national function, global reach: the concept of ‘Financial Capital’.
“By…1900 the tide had turned firmly in favour of national exchanges, and while some
regional exchanges survive today, they are far less important.
“The dominance of National Exchanges was made possible by better communications, but were also stimulated by the growing capital needs of large, less locally-based projects,
including international ventures”- Dimson, E, Paul Marsh and Mike Staunton
(2002), The Triumph of the Optimists. Princeton: PUP

“The financial markets, the businesses and other organisations based in London have a substantial
influence on activity throughout Europe.
“Other independent financial centres in Europe such as Frankfurt, Paris and Milan, can be viewed
as having a similar relationship to London as cities such as Boston, San Francisco and Chicago
have to New York.
“In this respect in making comparisons between London and New York, it is valid to consider the
size and scale of financial markets and activity in Europe as a whole, not just the UK, to take account of London’s sphere of influence”
- IFSL( 2004) Financial Market Trends, Europe vs US: the growing global influence of London, Europe’s financial capital. London:
IFSL
Europe’s financial capital in the making?

0%50%
100%150%200%250%300%350%
1980 1990 2002
USAJapanFranceGermanyItalyUK
Changing structure of financial leadership:
Assets as share of GDP, Big 6

1980 Share of World Assets
25%
8%
35%
4%
2%
6%
26%
UK Mainland Europe Big 3Japan USARemaining Advanced Developing
A highly concentrated market: percent of world foreign assets in 1980

But a changing market: percent of world foreign assets in 2000
2000 Share of World Assets
21%
10%
26%
19%
9%
28%
15%
UK Mainland Europe Big 3Japan USARemaining Advanced Developing

Some cautions
European integration can show up in the accounts as a rise in ‘foreign assets’, without necessarily reflect a growth in ‘global reach’
UK data on financial markets is frequently used as a proxy for London data (because markets are so concentrated) but there are independent financial centres eg Scotland
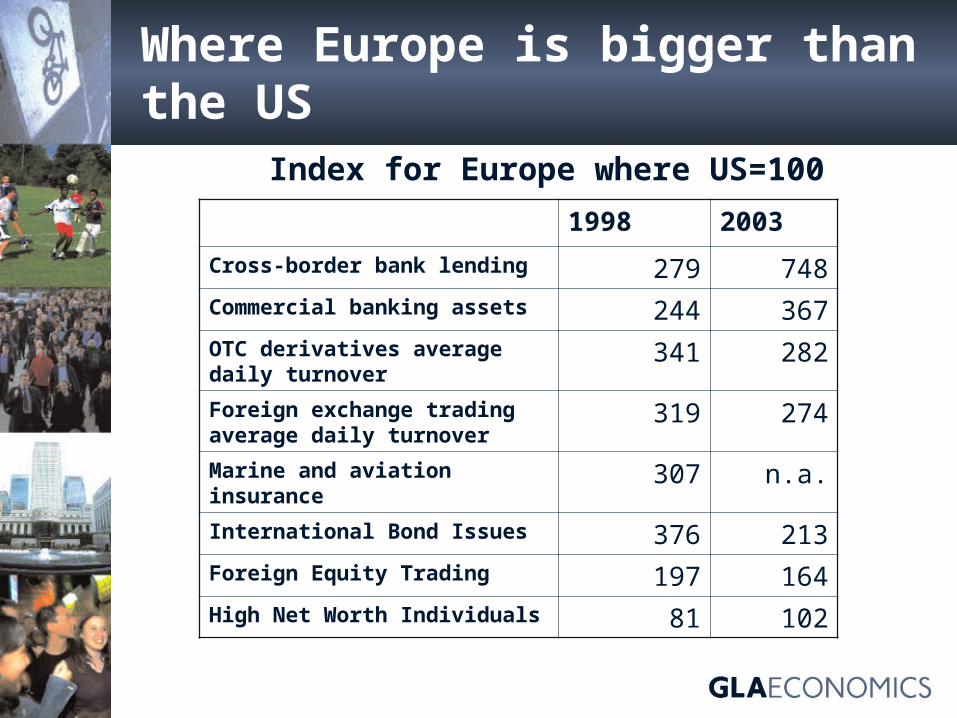
Where Europe is bigger than the US
1998 2003Cross-border bank lending 279 748Commercial banking assets 244 367OTC derivatives average daily turnover
341 282Foreign exchange trading average daily turnover
319 274Marine and aviation insurance
307 n.a.International Bond Issues 376 213Foreign Equity Trading 197 164High Net Worth Individuals 81 102
Index for Europe where US=100

Where the US is bigger than Europe
1998 2003Insurance global premiums 96 97Exchange-traded derivatives
72 82Domestic Bonds amounts 57 61International Banking Revenue
37 59Funds Under Management 51 60Equity Market Turnover 57 60Hedge Fund Assets under management
n.a. 32
Index for Europe where US=100

Where is London’s strength?
London world strength is as an ‘offshore banking’ centre: for contracts and trade between two parties neither of which is necessarily UK based– Language services– Legal services– Accounting services– Currency exchange
Its strengths lie in internationally traded instruments in which it has generally overwhelming dominance. For example, – 32 per cent of global foreign exchange market– 43 per cent of OTC derivative market; – 70 per cent of the secondary market in international
bonds

London’s share of key world markets% share of world market Londo
nUS Japan France Germa
nyCross-border bank lending
20 9 8 8 11
Foreign Equities turnover
43 31 3
Foreign exchange trading
31 19 8 3 5
Exchange-traded derivatives
6 26 2 3 12
OTC derivatives 43 24 3 10 3International Bonds secondary market
70
Hedge Fund Assets 14 74 1 1Note: London data is identical to UK dataSource: IFSL(2000) International Financial Markets in the UK. London:IFSL

Trends in ‘international’ sectors of the financial market
£bn 1995 2003 % changeCross-border bank lending
1,350 3,092 129
Foreign Equities turnover
627 1,470 134
Foreign exchange trading
464 753 62
Exchange-traded derivatives
201 507 152
OTC derivatives 74 643 769
International financial markets in the UK
Source: IFSL(2000) International Financial Markets in the UK. London:IFSL