London Cycling Design Standards Contents · London Cycling Design Standards Tools and techniques...
32
This chapter sets out network planning, route planning and implementation tools and techniques, showing how planning, design and delivery are related. All the tools described here are intended to serve the objective of efficiently delivering safer, more comfortable, direct, coherent, attractive and adaptable cycling infrastructure. 2. Tools and techniques Contents London Cycling Design Standards Version control Version 1 (Dec 2014) – Published Version 2 (Sept 2016) – Minor amendments following publication of TSRGD (2016)
Transcript of London Cycling Design Standards Contents · London Cycling Design Standards Tools and techniques...

This chapter sets out network planning, route planning and implementation tools and techniques, showing how planning, design and delivery are related. All the tools described here are intended to serve the objective of efficiently delivering safer, more comfortable, direct, coherent, attractive and adaptable cycling infrastructure.
2. Tools and techniques
ContentsLondon Cycling Design Standards
Version controlVersion 1 (Dec 2014) – PublishedVersion 2 (Sept 2016) – Minor amendments following publication of TSRGD (2016)

Tools and techniquesLondon Cycling Design Standards
2.3 Developing a coherent cycle network 142.3.1 Five-step analysis 142.3.2 Review of existing conditions 142.3.3 Mesh density analysis 152.3.4 Accessibility classification 172.3.5 Area porosity analysis 182.3.6 Cycling Level of Service audit 192.3.7 Example approaches 202.3.8 Planning cycling into new development 222.3.9 Area-based proposals 242.3.10 Planning applications 24
2.4 Scheme delivery 252.4.1 Scheme stages 252.4.2 Brief and feasibility 252.4.3 Signal works 272.4.4 Road Safety Audits 272.4.5 Other pre-construction procedures 272.4.6 Traffic Orders 282.4.7 Procedures for creating cycle facilities 28
Bibliography 30
2.1 The Tube Network for the Bike 012.1.1 Overview of procedures 012.1.2 London’s cycling network strategy 022.1.3 Stakeholder involvement 04
2.2 Cycling Level of Service assessment 042.2.1 Background 042.2.2 When to assess 052.2.3 Scoring 052.2.4 Involving users in assessment 112.2.5 Junction assessment tool 112.2.6 Scoring junction assessments 122.2.7 Example junction assessment 13
2. Tools and techniques

London Cycling Design Standards
2.1.1 Overview of procedures
The level of route delivery planning, design and stakeholder involvement needs to be appropriate for the level of intervention proposed. Where there are limited changes to be made, as is likely for large stretches of Quietway routes, then a minimal approach should be taken and procedural demands should not be allowed to impede delivery.
The relationship between different techniques and procedures for a cycle route is shown in figure 2.1 below. The process for other, location-specific interventions will not involve route assembly but should still relate to network strategy and land use planning and should be tested through similar engagement and assessment procedures.
Figure 2.1 Overview of techniques and procedures for delivery of cycle infrastructure
Network Strategy
Route assembly
Scheme delivery
Network planning& land use planning
Monitoring, maintenance, enforcement
As appropriate through the process:Stakeholder involvementCycling Level of Service assessmentInfluencing other emerging schemes
2.1 The Tube Network for the Bike
[Chapter 2] The Tube Network for the Bike 01

London Cycling Design Standards
2.1.2 London’s cycling network strategy
The network strategy for London is the development of the ‘Tube Network for the Bike’ approach described in the Mayor’s Vision for Cycling. Its application in London is geared to enabling more people to cycle more safely, mindful of the expected growth in numbers of cyclists. Routes and schemes that contribute to the network in outer London are aimed at transforming cycling in areas where numbers of cyclists may be low or stable but where there is great potential for further growth.
The elements that will add significantly to the network through the Mayor’s Vision for Cycling are:
• Cycle Superhighways New Superhighways Upgrade of the four existing Superhighways
• Quietways Central London Grid New Quietways in inner and outer London
• Mini-Hollands Transformation of town centres and associated areas in three outer London boroughs: Enfield, Kingston-upon-Thames and Waltham Forest
New and improved infrastructure delivered beyond these programmes, whether or not it is conceived specifically to support cycling, can add further to borough networks and to the creation of a high quality network for cycling in London.
Different approaches have been planned for areas of different cycling potential. Area-wide infrastructure is appropriate for central London or specific outer London town centres, where there is a high density of potential and existing cycle journeys. Outside these urban centres, the cycling potential is less concentrated, so planned infrastructure will be adapted accordingly.
Cycle SuperhighwaysThe first four Superhighways brought about an average 77 per cent increase in cycling on the routes concerned – 30 per cent of those cycling trips are new or switched from another mode (TfL, Barclays Cycle Superhighways Evaluation Report, 2012). The contribution of the Cycle Superhighway programme to the overall network has been revised in light of the aspirations set out in the Mayor’s Vision for Cycling. Cycle Superhighways in the new network will include upgraded versions of the existing routes and new routes.
The Cycle Superhighways programme has a large interface with the responsibilities of London boroughs and others. In some cases, the route is on borough-owned roads and there needs to be close working between TfL and the boroughs to obtain approvals and buy-in to any proposals. Even where TfL is the highway authority, boroughs should still be closely involved in the design process as the measures implemented are likely to have an impact beyond the TfL Road Network (TLRN) highway.
QuietwaysAssessment criteria for prioritising potential Quietways routes, including those that form part of the Central London Grid, are set out in figure 2.2. Routes should be assessed against these measures as far as possible before final route selection and detailed design.
[Chapter 2] The Tube Network for the Bike 02

London Cycling Design Standards
Network Prioritisation • Contribution to a network – a geographical
spread of routes that capture trip attractors and connect key points across London
• Deliverable along the entire length of a route over an agreed period
• Awareness of other schemes being delivered in the area that may influence phasing or impact the selected route
Attractiveness• Avoiding or treating significant collision
hotspots
• Secure and offering a feeling of safety
• Accessible at all times, or with a suitable ‘after-hours’ alternative
• Having priority at junctions/intersections/crossings (ideally)
• Making use of streets with limited traffic access (ideally)
Buildability• Known significant outstanding land
ownership, access issues or ecological issues
• With significant sections already to a good standard
• Limited requirement for signals work
• Practicality and cost effectiveness of any modification to junctions
Directness and Cohesion• Following cycle desire lines, public transport
routes or routes used for short trips by car
• Connecting places of interest
• Minimising delays and avoiding unnecessary diversions (preferably using the same roads in each direction)
• Overcoming specific barriers to cycling, particularly at junctions
• Easy to navigate and homogeneous
Traffic composition and impact to other users• Minimising use of heavily trafficked roads
• With limited use by freight vehicles and other HGVs
• Having limited points of conflict with oncoming and crossing traffic, parked vehicles and loading bays
• Improving pedestrian facilities, if possible, and with the ability to manage movement through areas of heavy pedestrian use
Political support• With support in principle for the entire
route from the managing authority, senior officer and/or relevant local authority Member
• With agreement on alignments and improvements secured between all boroughs involved
Figure 2.2 Quietways route prioritisation criteria
[Chapter 2] The Tube Network for the Bike 03

London Cycling Design Standards
2.1.3 Stakeholder involvement
Stakeholder support and consultation throughout the process is important for schemes to be successful. To be meaningful, it needs to be conducted at times when it can positively influence outcomes without causing delay and can be done in a proportionate manner. Engagement of stakeholders at the start of a project can help avoid errors that would be harder and more costly to rectify at a later stage. Stakeholders can provide valuable information and local knowledge during route planning and scheme development.
Two distinct functions need to be considered: incorporating and responding to stakeholder interests, and keeping stakeholders informed of issues that affect their interests.
It is recommended that the following people and organisations are involved at a meaningful time in the design process:
• Ward councillors and highway authority
• Local cycle user groups and cycling organisations
• TfL, including modal specific representatives such as buses and taxis and private hire
• Local employers and other generators (or potential generators) of significant cyclist movement, such as higher education establishments and hospitals
• Freight industry representatives
• Local disability groups
• Groups with an interest in pedestrian accessibility
• Groups with an interest in inclusive cycling
• Metropolitan Police Service – specifically, traffic management officers
• Developers or landowners whose land may be affected or who may be asked to contribute to funding
• Residents, local amenity groups, conservation groups and English Heritage
• Schools and colleges
Conduct of an Equality Impact Assessment (EqIA) or Accessibility Audit can be a useful tool for engaging some of the above groups on issues around accessibility and improving the environment for people with protected characteristics under the Equality Act (2010). This includes cyclists and public and private transport users as well as pedestrians. Where schemes propose significant close interaction of pedestrians and cyclists – any proposal involving shared use, for example – an EqIA is recommended.
2.2.1 Background
A Cycling Level of Service (CLoS) assessment has been developed in order to set a common standard for the performance of cycling infrastructure for routes and schemes, and for individual junctions. The purpose of the CLoS assessment is to frame discussion about design options so that schemes are appealing for existing cyclists and can entice new cyclists onto the network. It should be used on any scheme that has an impact on the street environment.
As it is focused on ‘rideability’ (the experience of cycling) and the performance of links and junctions CLoS does not differentiate between street types. Infrastructure appropriate to the street type is a prior consideration, although acceptable scoring ranges may need adjustment by street type according to how programme-specific requirements are defined.
CLoS builds on the knowledge of existing systems such as the CIHT Cycle Audit and Cycle Review, the London Cycling Campaign’s User Quality Audit and ‘Love London, Go Dutch’ matrix and the Dutch ‘Bicycle Balance’ system. It does not replace any existing audit system such as the Road Safety Audit, Non Motorised User Audit or Cycle Audit. It is designed to raise issues already covered by regulatory and
2.2 Cycling Level of Service assessment
[Chapter 2] The Tube Network for the Bike | Cycling Level of Service assessment 04
London Cycling Design Standards
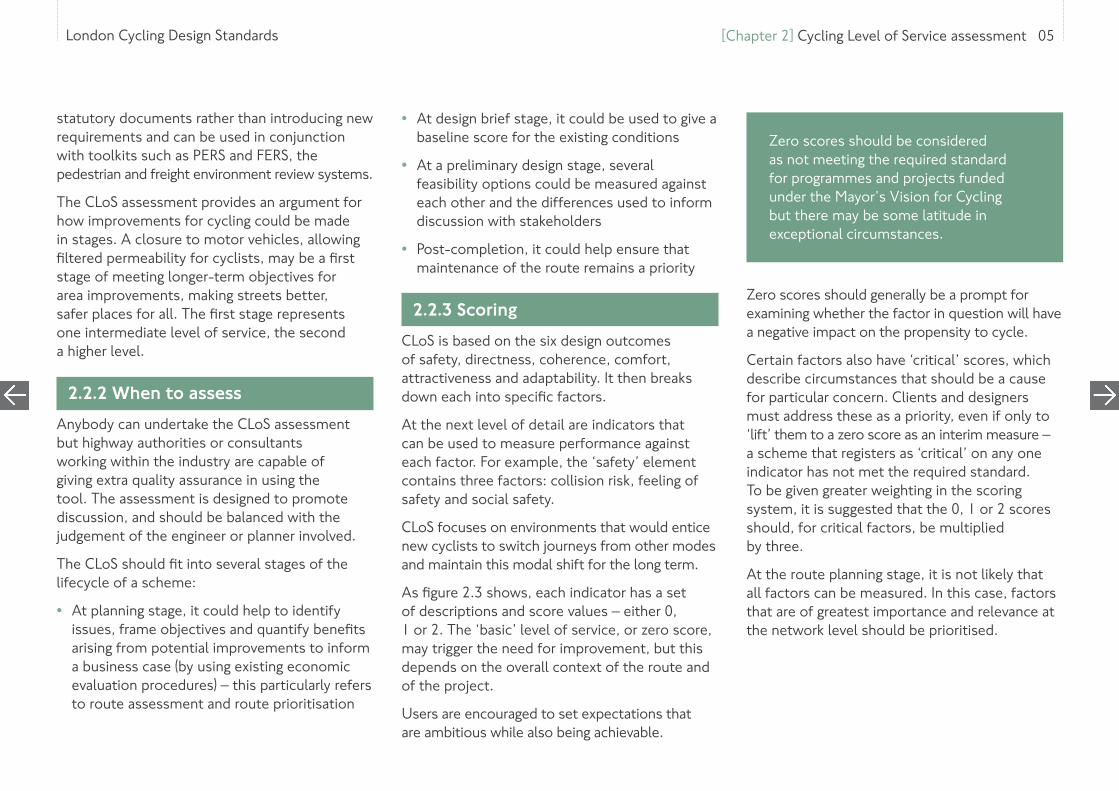
statutory documents rather than introducing new requirements and can be used in conjunction with toolkits such as PERS and FERS, the pedestrian and freight environment review systems.
The CLoS assessment provides an argument for how improvements for cycling could be made in stages. A closure to motor vehicles, allowing filtered permeability for cyclists, may be a first stage of meeting longer-term objectives for area improvements, making streets better, safer places for all. The first stage represents one intermediate level of service, the second a higher level.
2.2.2 When to assess
Anybody can undertake the CLoS assessment but highway authorities or consultants working within the industry are capable of giving extra quality assurance in using the tool. The assessment is designed to promote discussion, and should be balanced with the judgement of the engineer or planner involved.
The CLoS should fit into several stages of the lifecycle of a scheme:
• At planning stage, it could help to identify issues, frame objectives and quantify benefits arising from potential improvements to inform a business case (by using existing economic evaluation procedures) – this particularly refers to route assessment and route prioritisation
• At design brief stage, it could be used to give a baseline score for the existing conditions
• At a preliminary design stage, several feasibility options could be measured against each other and the differences used to inform discussion with stakeholders
• Post-completion, it could help ensure that maintenance of the route remains a priority
2.2.3 Scoring
CLoS is based on the six design outcomes of safety, directness, coherence, comfort, attractiveness and adaptability. It then breaks down each into specific factors.
At the next level of detail are indicators that can be used to measure performance against each factor. For example, the ‘safety’ element contains three factors: collision risk, feeling of safety and social safety.
CLoS focuses on environments that would entice new cyclists to switch journeys from other modes and maintain this modal shift for the long term.
As figure 2.3 shows, each indicator has a set of descriptions and score values – either 0, 1 or 2. The ‘basic’ level of service, or zero score, may trigger the need for improvement, but this depends on the overall context of the route and of the project.
Users are encouraged to set expectations that are ambitious while also being achievable.
Zero scores should generally be a prompt for examining whether the factor in question will have a negative impact on the propensity to cycle.
Certain factors also have ‘critical’ scores, which describe circumstances that should be a cause for particular concern. Clients and designers must address these as a priority, even if only to ‘lift’ them to a zero score as an interim measure – a scheme that registers as ‘critical’ on any one indicator has not met the required standard. To be given greater weighting in the scoring system, it is suggested that the 0, 1 or 2 scores should, for critical factors, be multiplied by three.
At the route planning stage, it is not likely that all factors can be measured. In this case, factors that are of greatest importance and relevance at the network level should be prioritised.
Zero scores should be considered as not meeting the required standard for programmes and projects funded under the Mayor’s Vision for Cycling but there may be some latitude in exceptional circumstances.
[Chapter 2] Cycling Level of Service assessment 05

London Cycling Design Standards
Factor Indicator Critical* Basic CLoS (score=0) Good CLoS (score=1) Highest CLoS (score=2) Score
Safety (48)
Collision risk
Left/right hook at junctions
Heavy streams of turning traffic cut across main cycling stream
Side road junctions frequent and/or untreated. Conflicting movements at major junctions not separated
Fewer side road junctions. Use of entry treatments. Conflicting movements on cycle routes are separated at major junctions
Side roads closed or footway is continuous. All conflicting streams separated at major junctions
Collision alongside or from behind
Nearside lane in range 3.2m to 4.0m
Cyclists in wide (4m+) nearside traffic lanes or cycle lanes less than 2m wide
Cyclists in dedicated cycle lanes at least 2m wide
Cyclists separated from motorised traffic
Kerbside activity or risk of collision with door
Cycle lanes <1.5m alongside parking /loading with no buffer
Frequent kerbside activity / effective width for cyclists of 1.5m
Less frequent kerbside activity / effective width for cyclists of 2m
No kerbside activity / No interaction with vehicles parking or loading
Other vehicle fails to give way or disobeys signals
Poor visibility, no route continuity across junctions and unclear priority
Clear route continuity through junctions, good visibility, priority clear for all users, visual priority for cyclists across side roads
Cycle priority at signalised junctions; visual priority for cyclists across side roads
Feeling of safety
Separation from heavy traffic
Cyclists in general traffic lanes or cycle lanes less than 2m
Cycle lanes at least 2m wide Cyclists physically separated from other traffic at junctions and on links, or no heavy freight
Speed of traffic (where cyclists are not separated)
85th percentile greater than 30mph
85th percentile greater than 25mph
85th percentile 20-25mph 85th percentile less than 20mph
Total volume of traffic (where cyclists are not separated)
>1,000 vehicles/ hour at peak
500 - 1,000 vehicles / hour at peak (but becomes ‘critical’ if 5 per cent or more are HGVs)
200 - 500 vehicles / hour at peak (but becomes ‘basic’ if 2 per cent or more are HGVs)
<200 vehicles / hour at peak
Interaction with HGVs
Frequent, close interaction
Frequent interaction Occasional interaction No interaction
Figure 2.3 Cycling Level of Service assessment matrix (part 1)
[Chapter 2] Cycling Level of Service assessment 06
London Cycling Design Standards
Factor Indicator Critical* Basic CLoS (score=0) Good CLoS (score=1) Highest CLoS (score=2) Score
Social safety
Risk/fear of crime High risk: ‘ambush spots’, loitering, poor maintenance
Low risk: area is open, well designed and maintained
No fear of crime: high quality streetscene and pleasant interaction
Lighting Long stretches of darkness Short stretches of darkness Route lit thoroughly
Isolation Route passes far from other activity, for most of the day
Route close to activity, for all of the day
Route always overlooked
Impact of highway design on behaviour
Layout encourages aggressive behaviour
Layout controls behaviour throughout
Layout encourages civilised behaviour: negotiation and forgiveness
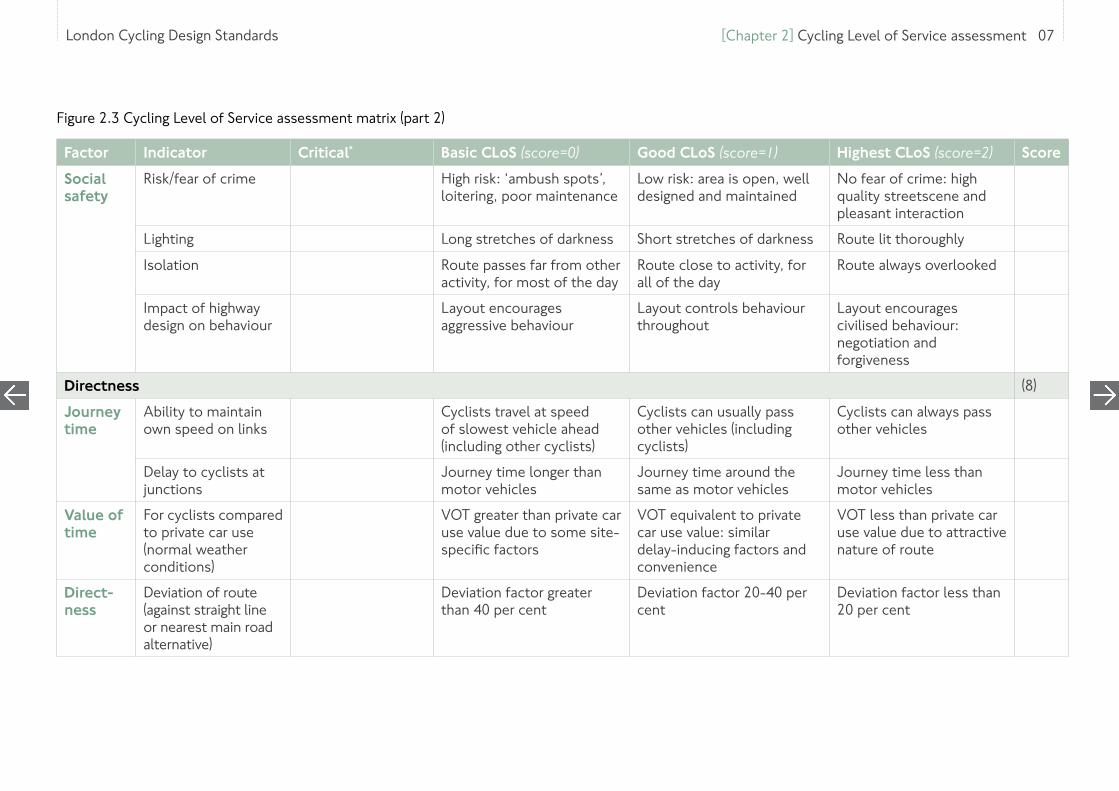
Directness (8)
Journey time
Ability to maintain own speed on links
Cyclists travel at speed of slowest vehicle ahead (including other cyclists)
Cyclists can usually pass other vehicles (including cyclists)
Cyclists can always pass other vehicles
Delay to cyclists at junctions
Journey time longer than motor vehicles
Journey time around the same as motor vehicles
Journey time less than motor vehicles
Value of time
For cyclists compared to private car use (normal weather conditions)
VOT greater than private car use value due to some site-specific factors
VOT equivalent to private car use value: similar delay-inducing factors and convenience
VOT less than private car use value due to attractive nature of route
Direct-ness
Deviation of route (against straight line or nearest main road alternative)
Deviation factor greater than 40 per cent
Deviation factor 20-40 per cent
Deviation factor less than 20 per cent
Figure 2.3 Cycling Level of Service assessment matrix (part 2)
[Chapter 2] Cycling Level of Service assessment 07

London Cycling Design Standards
Factor Indicator Critical* Basic CLoS (score=0) Good CLoS (score=1) Highest CLoS (score=2) Score
Coherence (6)
Connec-tions
Ability to join/leave route safely and easily
Cyclists cannot connect to other routes without dismounting
Cyclists share connections with motor traffic
Cyclists have dedicated connections to other routes
Density of other routes Network density mesh width >400m
Network density mesh width 250-400m
Network density mesh width <250m
Way-finding
Signing Basic direction signing (cyclists follow road signs and markings)
Some cycle-specific direction signing
Consistent signing of range of routes and destinations at decision points
Comfort (20)
Surface quality
Defects: non cycle friendly ironworks, raised/ sunken covers/gullies
Major defects Many minor defects Few minor defects Smooth, high-grip surface
Surface material
Construction Hand-laid asphalt or unstable blocks/sets
Machine laid asphalt concrete or HRA; smooth blocks
Machine laid asphalt concrete; smooth and firm blocks undisturbed by turning vehicles
Effective width without conflict
Clear nearside space in secondary position or motor vehicle speed/volume in primary position
Secondary: <1.5m Primary: high motor vehicle flow
Secondary: 1.5m Primary: medium motor vehicle flow
Secondary: 1.5-2.0m Primary: low motor vehicle flow
Secondary: >2.0m Primary: no overtaking by motor vehicles
Gradient Uphill gradient over 100m
>5 per cent 3-5 per cent <3 per cent
Deflect-ions
Pinch points caused by horizontal deflections
(Remaining) lane width <3.2m
(Remaining) lane width >4.0m or <3.0m (low motor vehicle flow)
Traffic is calmed so no need for horizontal deflections
Undu-lations
Vertical deflections Round top humps Sinusoidal humps No vertical deflections
Figure 2.3 Cycling Level of Service assessment matrix (part 3)
[Chapter 2] Cycling Level of Service assessment 08
London Cycling Design Standards
Factor Indicator Critical* Basic CLoS (score=0) Good CLoS (score=1) Highest CLoS (score=2) Score
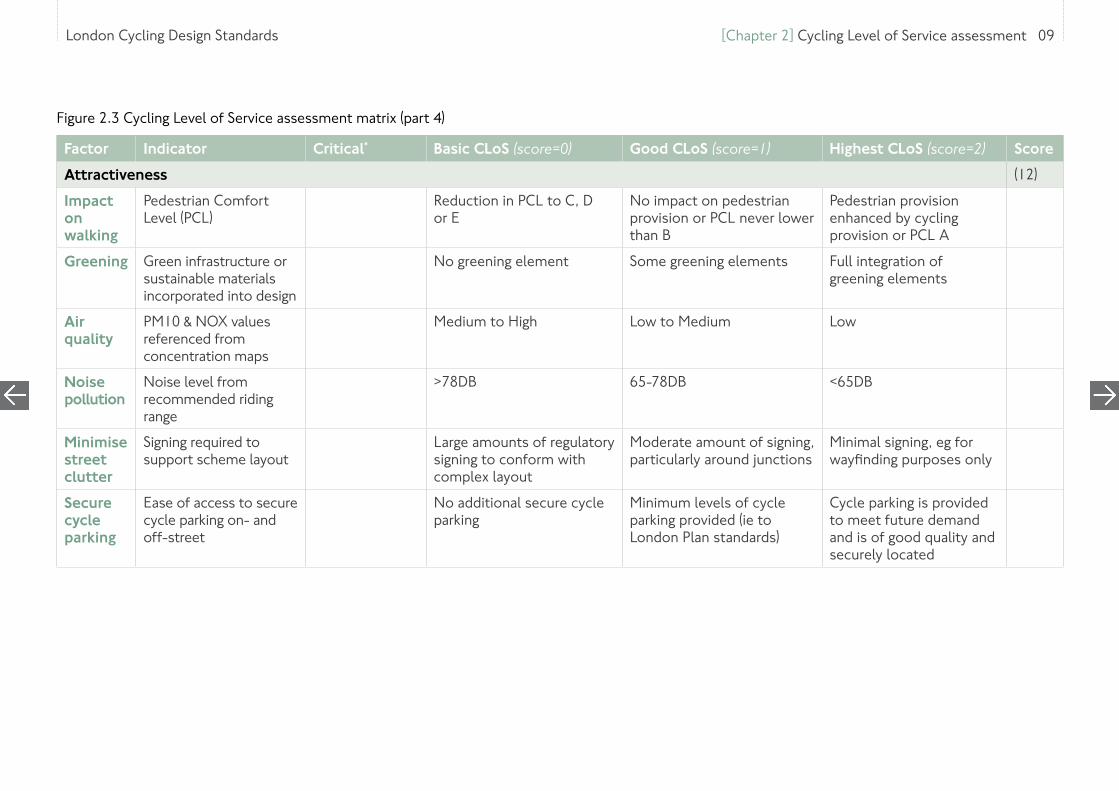
Attractiveness (12)
Impact on walking
Pedestrian Comfort Level (PCL)
Reduction in PCL to C, D or E
No impact on pedestrian provision or PCL never lower than B
Pedestrian provision enhanced by cycling provision or PCL A
Greening Green infrastructure or sustainable materials incorporated into design
No greening element Some greening elements Full integration of greening elements
Air quality
PM10 & NOX values referenced from concentration maps
Medium to High Low to Medium Low
Noise pollution
Noise level from recommended riding range
>78DB 65-78DB <65DB
Minimise street clutter
Signing required to support scheme layout
Large amounts of regulatory signing to conform with complex layout
Moderate amount of signing, particularly around junctions
Minimal signing, eg for wayfinding purposes only
Secure cycle parking
Ease of access to secure cycle parking on- and off-street
No additional secure cycle parking
Minimum levels of cycle parking provided (ie to London Plan standards)
Cycle parking is provided to meet future demand and is of good quality and securely located
Figure 2.3 Cycling Level of Service assessment matrix (part 4)
[Chapter 2] Cycling Level of Service assessment 09

London Cycling Design Standards
Factor Indicator Critical* Basic CLoS (score=0) Good CLoS (score=1) Highest CLoS (score=2) Score
Adaptability (6)
Public transport inte-gration
Smooth transition between modes or route continuity maintained through interchanges
No consideration for cyclists within interchange area
Cycle route continuity maintained through interchange and some cycle parking available
Cycle route continuity maintained and secure cycle parking provided. Transport of cycles available.
Flexibility Facility can be expanded or layouts adopted within area constraints
No adjustments are possible within constraints. Road works may require some closure
Links can be adjusted to meet demand but junctions are constrained by vehicle capacity limitations. Road works will not require closure; cycling will be maintained although route quality may be compromised to some extent
Layout can be adapted freely without constrain to meet demand or collision risk. Adjustments can be made to maintain full route quality when roadworks are present
Growth enabled
Route matches predicted usage and has exceedence built into the design
Provision does not match current levels of demand
Provision is matched to predicted demand flows
Provision has spare capacity for large increases in predicted cycle use
TOTAL (max 100) (100)
*For highlighted critical indicators, score is multiplied by 3 (basic = 0, good = 3, highest = 6)
Figure 2.3 Cycling Level of Service assessment matrix (part 5)
[Chapter 2] Cycling Level of Service assessment 10
London Cycling Design Standards
2.2.4 Involving users in assessment
User satisfaction surveys can be particularly useful for capturing some of the more subjective judgements in the assessment. It is important to make a clear connection between the needs of the local users and the reasons for making certain design decisions. As figure 2.3 shows, subjective safety – therefore the perception of risk – is a key factor in measuring the fitness-for-purpose of a cycling facility, even where the collision history of a location, for example, might indicate that the objectively measured risk is low.
The impact on walking is an important element in the assessment, even though it may not be directly linked to level of service for cyclists. A Pedestrian Comfort Assessment, as described in TfL’s Pedestrian Comfort Guidance, should complement use of CLoS and provide a balanced analysis of impact on walking and cycling.
2.2.5 Junction assessment tool
As the Cycle Safety Action Plan (2014) describes, the most common cycle collision types tend to involve movements at or around junctions. A supplementary process for assessing junctions has therefore been developed to give a broader assessment of a given location, or in order to inform scoring of the collision risk criteria in the CLoS assessment.
Rather than going through the entire CLoS assessment for each possible movement of a cyclist through a junction, an estimation of potential conflict can be done through briefly assessing each of the potential movements in turn and marking them on a plan of the junction, as shown in figure 2.5. Each movement can be rated and marked on the plan according to how safely and comfortably it can be made by cyclists:
• Red – where conditions exist that are most likely to give rise to the most common collision types
• Amber – where the risk of those collisions has been reduced by design layout or traffic management interventions
• Green – where the potential for collisions has been removed entirely
‘Green’ should be taken to mean suitable for all cyclists; ‘red’ means suitable only for a minority of cyclists (and, even for them, it may be uncomfortable to make).
Any banned movements for cyclists should be shown in black with a cross at the end. Movements that can be made but would involve a particularly high level of risk to the cyclist should be noted with a red cross at the end. These are movements that most cycle trainers would advise against making.
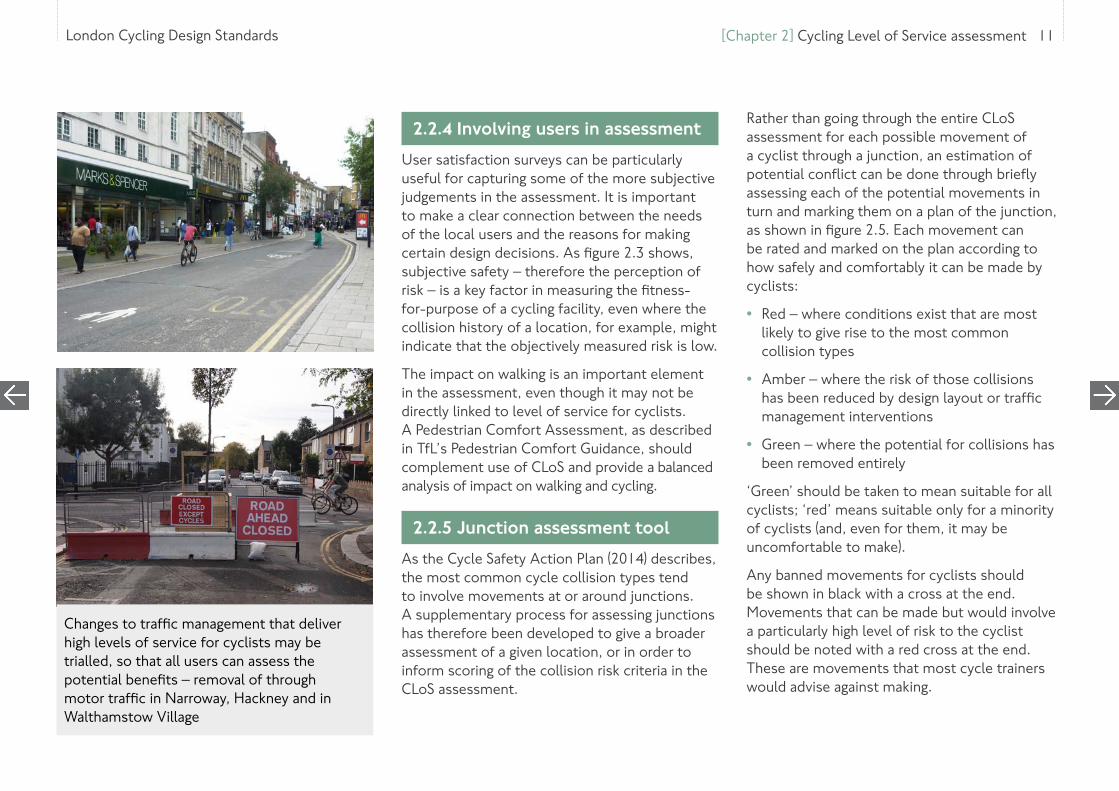
Changes to traffic management that deliver high levels of service for cyclists may be trialled, so that all users can assess the potential benefits – removal of through motor traffic in Narroway, Hackney and in Walthamstow Village
[Chapter 2] Cycling Level of Service assessment 11
London Cycling Design Standards
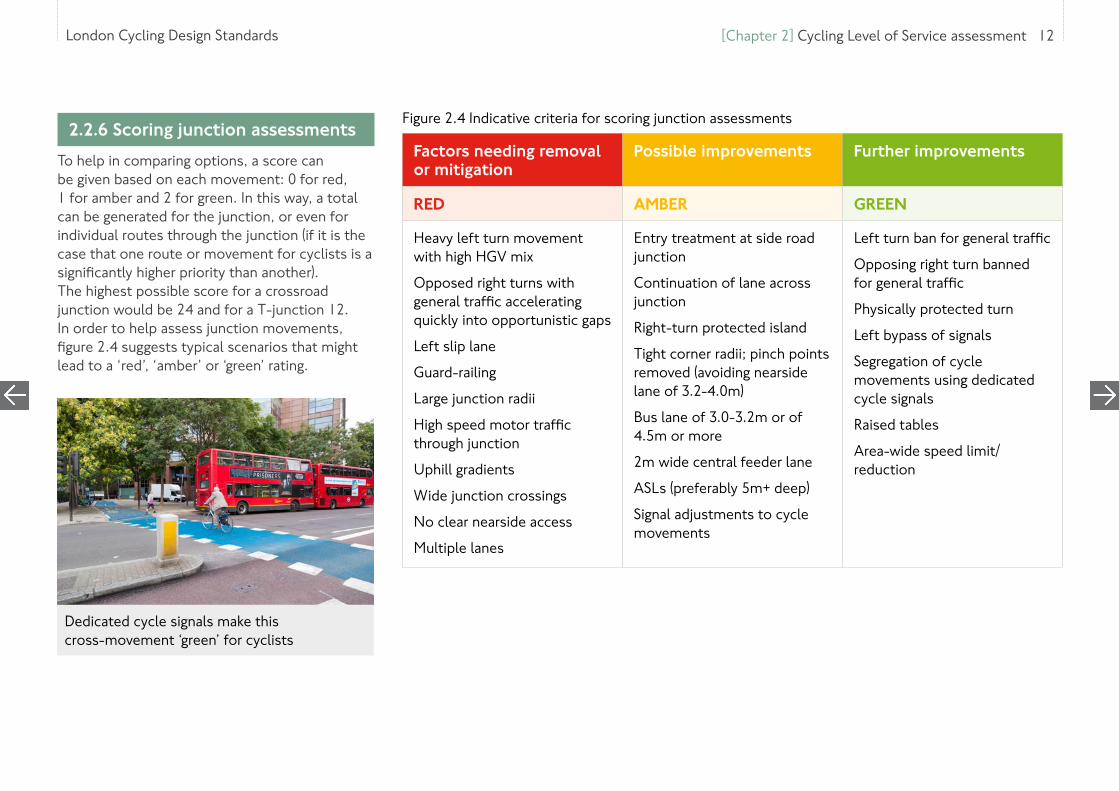
2.2.6 Scoring junction assessments
To help in comparing options, a score can be given based on each movement: 0 for red, 1 for amber and 2 for green. In this way, a total can be generated for the junction, or even for individual routes through the junction (if it is the case that one route or movement for cyclists is a significantly higher priority than another). The highest possible score for a crossroad junction would be 24 and for a T-junction 12. In order to help assess junction movements, figure 2.4 suggests typical scenarios that might lead to a ‘red’, ‘amber’ or ‘green’ rating.
Factors needing removal or mitigation
Possible improvements Further improvements
RED AMBER GREEN
Heavy left turn movement with high HGV mix
Opposed right turns with general traffic accelerating quickly into opportunistic gaps
Left slip lane
Guard-railing
Large junction radii
High speed motor traffic through junction
Uphill gradients
Wide junction crossings
No clear nearside access
Multiple lanes
Entry treatment at side road junction
Continuation of lane across junction
Right-turn protected island
Tight corner radii; pinch points removed (avoiding nearside lane of 3.2-4.0m)
Bus lane of 3.0-3.2m or of 4.5m or more
2m wide central feeder lane
ASLs (preferably 5m+ deep)
Signal adjustments to cycle movements
Left turn ban for general traffic
Opposing right turn banned for general traffic
Physically protected turn
Left bypass of signals
Segregation of cycle movements using dedicated cycle signals
Raised tables
Area-wide speed limit/reduction
Figure 2.4 Indicative criteria for scoring junction assessments
Dedicated cycle signals make this cross-movement ‘green’ for cyclists
[Chapter 2] Cycling Level of Service assessment 12
London Cycling Design Standards
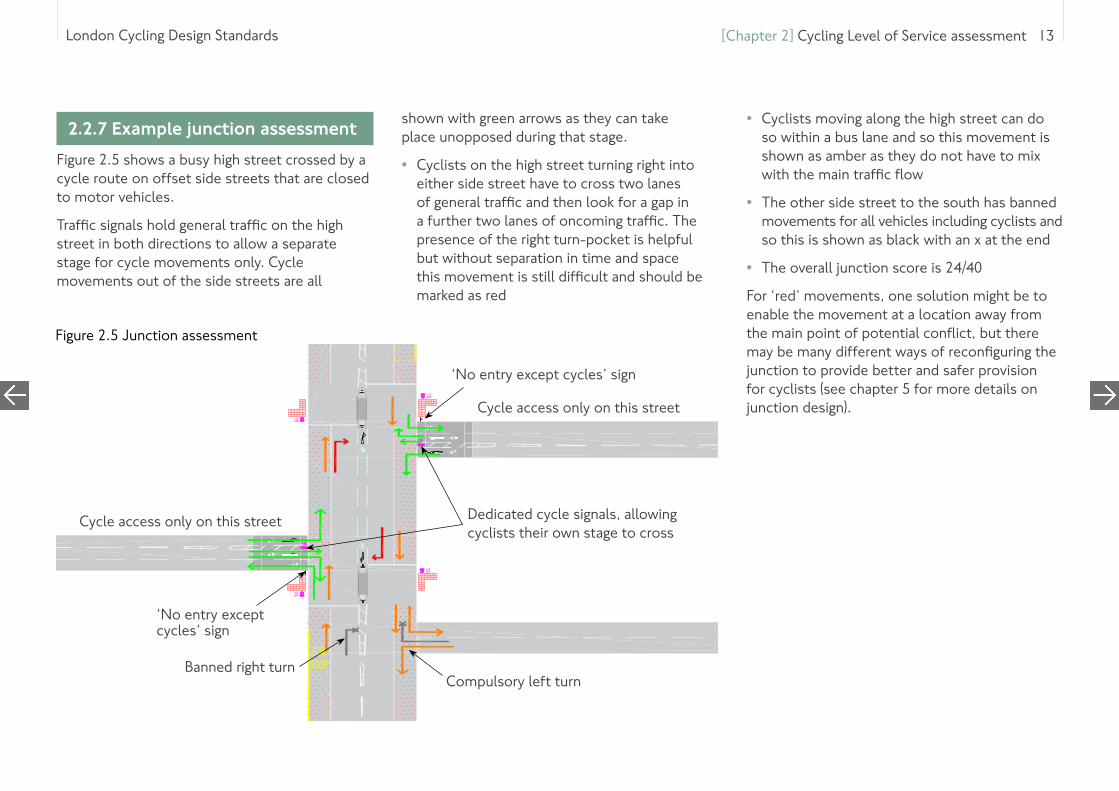
2.2.7 Example junction assessment
Figure 2.5 shows a busy high street crossed by a cycle route on offset side streets that are closed to motor vehicles.
Traffic signals hold general traffic on the high street in both directions to allow a separate stage for cycle movements only. Cycle movements out of the side streets are all
shown with green arrows as they can take place unopposed during that stage.
• Cyclists on the high street turning right into either side street have to cross two lanes of general traffic and then look for a gap in a further two lanes of oncoming traffic. The presence of the right turn-pocket is helpful but without separation in time and space this movement is still difficult and should be marked as red
Figure 2.5 Junction assessment
• Cyclists moving along the high street can do so within a bus lane and so this movement is shown as amber as they do not have to mix with the main traffic flow
• The other side street to the south has banned movements for all vehicles including cyclists and so this is shown as black with an x at the end
• The overall junction score is 24/40
For ‘red’ movements, one solution might be to enable the movement at a location away from the main point of potential conflict, but there may be many different ways of reconfiguring the junction to provide better and safer provision for cyclists (see chapter 5 for more details on junction design).
‘No entry except cycles’ sign
Cycle access only on this street
Cycle access only on this street
Compulsory left turnBanned right turn
‘No entry except cycles’ sign
Dedicated cycle signals, allowing cyclists their own stage to cross
[Chapter 2] Cycling Level of Service assessment 13

London Cycling Design Standards
Figure 2.7 Existing context showing base network
2.3.1 Five-step analysis
This section covers examples of techniques that can be used to help network planning. It is organised as a five-step analysis, summarised in figure 2.6, covering the full process for planning a network for cycling from the beginning. It takes into account urban form and land use as well as street types and route characteristics.
In reality, some of the network is likely to be in place (but may be in need of upgrading) and some of the analysis may already exist. The five steps are presented here as helpful techniques that can support the development of a coherent network, and can also be used in communicating the various attributes that a good network for cycling should contain.
Figure 2.6 Five-step analysis: planning a cycle network from the beginning
Review existing
conditions
Mesh density analysis
Classifi-cation audit
Porosity analysis
Cycling Level of Service assessment
2.3 Developing a coherent cycle network
2.3.2 Review of existing conditions
Figure 2.7 shows a typical London street layout with a railway line, a canal, a park and different road classifications such as connectors, high roads, high streets, city streets, city places and local roads. These are suggested by the road thickness and frontages. Character buildings and major trip generators have also been highlighted. Proposals for cycling should reflect the character of an area and the movement and place functions of its streets. Cycling infrastructure should improve the quality of streets and so
coherent network planning needs to be sensitive to its surroundings.
Overlaid on the street plan is a 400m by 400m grid: this is also the standard mesh density sought for cycle networks in central London, as referenced in the CLoS. The coloured lines show the existing cycle networks:
• The red route forms part of the national cycle network which spans the UK and, in some cases, joins up with the international EuroVelo network. It should be recognised that this network has a strategic importance and any changes to it could affect many users.
FootpathMain RoadMinor RoadNational Cycle RouteGreenway Cycle RouteShared Pedestrian/Cycle RouteParkCanal
Local Neighbourhood Centre
District Centre
Key
[Chapter 2] Developing a coherent cycle network 14

London Cycling Design Standards
Cell example
Area bound example
Figure 2.8 Heat map representation of the densityrailways, including bridging points), local centres, land uses, trip generators (see figure 2.17 for a fuller list)
• Identify key trip generators, active frontages, character buildings
• Classify roads based on RTF street types (or refer to street type maps where this work has already been done)
• Overlay existing cycle networks, including strategic and local routes
Analysis• Look for gaps in the existing cycle networks• Look to see if cycling provision is appropriate
for the RTF street type• Look for desire lines between trip generators• Identify character areas and heritage areas
• The blue routes shown are local routes that may well have been developed as part of the London Cycle Network programme and so may serve a strategic function as part of long-held desire lines for cyclists. Routes of this type can date back many years, may be best considered for future network adoption and often already feature cycle-friendly interventions.
• The green route shows a route along a canal towpath that may form part of the greenway network. This route is not suitable for cycling at a high speed, as it requires the courteous behaviour essential to sharing space with pedestrians. Still, canal towpaths can be part of the area cycle network, due to its attractive, traffic-free condition.
In any area the remnants of previously planned strategic cycle networks should be evident and these should be referenced on the base plan so that gaps or other failures can be assessed. It is important to view routes in context and incorporate cycling within the unique layout of the area without compromising strategic network considerations such as coherence and directness. At all stages of this process, it is also important to source up-to-date and accurate information.
Method• Briefly assess place characteristics: natural
features, key constraints (eg waterways or
2.3.3 Mesh density analysis
In a properly joined-up cycle network, cyclists should not have to travel more than 400 metres to get to a parallel route of similar quality. As referenced in CLoS, this attribute of a cycle network is known as ‘mesh density’: it describes whether the grid of cycle routes is tighter (with more route choice) or looser (less extensive).
Analysis of mesh density is best undertaken with GIS software and there are two main methods to follow (see figure 2.8). The first involves dividing the area into cells and measuring the length of
cycle network in each cell. A 1km by 1km cell should have 4km of cycle network. The second method involves starting with the cycle network and its routes and measuring the size of the areas bounded by the routes.
[Chapter 2] Developing a coherent cycle network 15

London Cycling Design Standards
An area of 160,000 square metres would be present inside a 400-metre by 400-metre mesh and so this can be used as the standard to measure against. Smaller areas should show as hotter on the heat map (reds and oranges) as there is more coverage than required and higher areas should show as cooler (blues) as there is not enough coverage.
Sections of network that run across major barriers to cycling, such as major untreated junctions and gyratory systems, should not be counted in either method. Local authorities should use up-to-date information about the condition and extent of local networks.
Figure 2.9 shows a heat map representation of the density of routes in the study area. The analysis highlights in yellow the ‘cooler’ areas, with poorer cycle network coverage. The ‘hotter’ red areas have a higher mesh density: less distance between parallel routes. This type of analysis can be used to test the impact of planned interventions and can be run after networks have been extended to test even coverage.
Method• Assess cycle networks for major barriers
• Load existing cycle network data
• Overlay existing cycle networks, strategically planned and local routes
• Highlight bridges, natural features and constraints
Analysis• Look for areas of low network coverage and
identify potential route options
• Look for areas of high network coverage and identify most strategic alignments
Figure 2.9 Mesh density heat map
< 250 metre mesh 250 – 400 metre
> 400 metre mesh
Key
[Chapter 2] Developing a coherent cycle network 16
London Cycling Design Standards
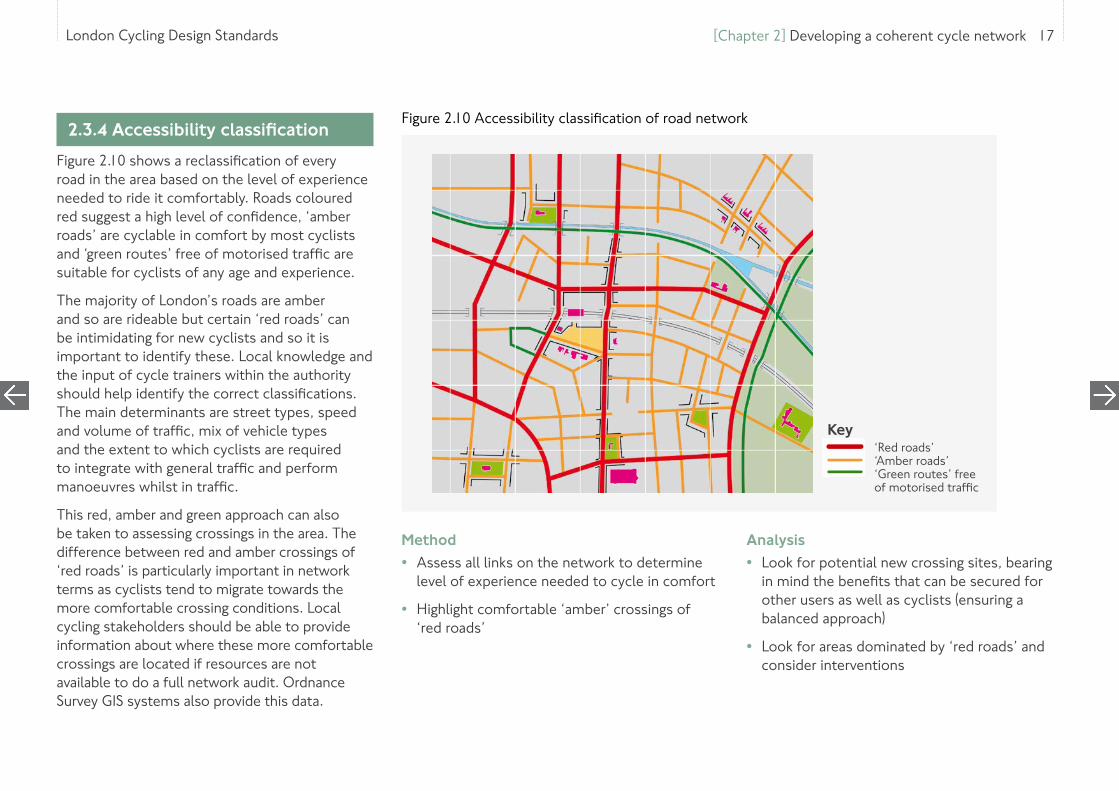
2.3.4 Accessibility classification
Figure 2.10 shows a reclassification of every road in the area based on the level of experience needed to ride it comfortably. Roads coloured red suggest a high level of confidence, ‘amber roads’ are cyclable in comfort by most cyclists and ‘green routes’ free of motorised traffic are suitable for cyclists of any age and experience.
The majority of London’s roads are amber and so are rideable but certain ‘red roads’ can be intimidating for new cyclists and so it is important to identify these. Local knowledge and the input of cycle trainers within the authority should help identify the correct classifications. The main determinants are street types, speed and volume of traffic, mix of vehicle types and the extent to which cyclists are required to integrate with general traffic and perform manoeuvres whilst in traffic.
This red, amber and green approach can also be taken to assessing crossings in the area. The difference between red and amber crossings of ‘red roads’ is particularly important in network terms as cyclists tend to migrate towards the more comfortable crossing conditions. Local cycling stakeholders should be able to provide information about where these more comfortable crossings are located if resources are not available to do a full network audit. Ordnance Survey GIS systems also provide this data.
Method• Assess all links on the network to determine
level of experience needed to cycle in comfort
• Highlight comfortable ‘amber’ crossings of ‘red roads’
Analysis• Look for potential new crossing sites, bearing
in mind the benefits that can be secured for other users as well as cyclists (ensuring a balanced approach)
• Look for areas dominated by ‘red roads’ and consider interventions
Figure 2.10 Accessibility classification of road network
‘Red roads’‘Amber roads’‘Green routes’ free of motorised traffic
Key
[Chapter 2] Developing a coherent cycle network 17
London Cycling Design Standards
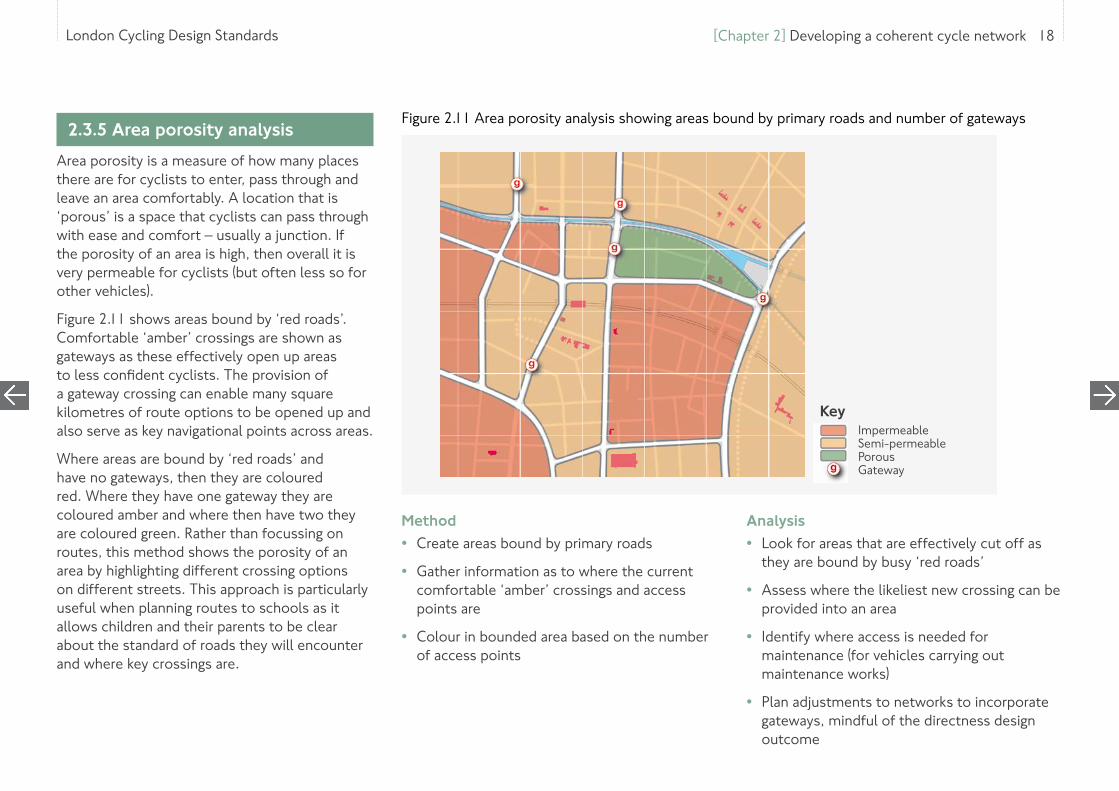
2.3.5 Area porosity analysis
Area porosity is a measure of how many places there are for cyclists to enter, pass through and leave an area comfortably. A location that is ‘porous’ is a space that cyclists can pass through with ease and comfort – usually a junction. If the porosity of an area is high, then overall it is very permeable for cyclists (but often less so for other vehicles).
Figure 2.11 shows areas bound by ‘red roads’. Comfortable ‘amber’ crossings are shown as gateways as these effectively open up areas to less confident cyclists. The provision of a gateway crossing can enable many square kilometres of route options to be opened up and also serve as key navigational points across areas.
Where areas are bound by ‘red roads’ and have no gateways, then they are coloured red. Where they have one gateway they are coloured amber and where then have two they are coloured green. Rather than focussing on routes, this method shows the porosity of an area by highlighting different crossing options on different streets. This approach is particularly useful when planning routes to schools as it allows children and their parents to be clear about the standard of roads they will encounter and where key crossings are.
Method• Create areas bound by primary roads
• Gather information as to where the current comfortable ‘amber’ crossings and access points are
• Colour in bounded area based on the number of access points
Analysis• Look for areas that are effectively cut off as
they are bound by busy ‘red roads’
• Assess where the likeliest new crossing can be provided into an area
• Identify where access is needed for maintenance (for vehicles carrying out maintenance works)
• Plan adjustments to networks to incorporate gateways, mindful of the directness design outcome
Figure 2.11 Area porosity analysis showing areas bound by primary roads and number of gateways
ImpermeableSemi-permeablePorousGateway
Key
[Chapter 2] Developing a coherent cycle network 18

London Cycling Design Standards
2.3.6 Cycling Level of Service audit
Figure 2.12 shows road classification based on the Cycling Level of Service, converting scores into red, amber and green categories. This takes time to complete in full but gives a comprehensive baseline of the rideability of the streets in an area. Routes that fall below the standards stipulated in the CLoS should be considered for upgrading or, if constraints are too great, then this approach can highlight alternative alignments. The colouring is likely to look similar to the accessibility classification system: this approach, based on the key design outcomes, adds a greater level of sophistication, should it be required.
Potential strategic routes in the chosen area may require substantial investment, which may need detailed justification. The junction assessment tool should be applied to all junctions along planned strategic network routes and where cycle routes pass across busier roads. If multiple roads are assessed, then the effect of area traffic management improvements can be measured against the established baseline. This method is the most time-consuming but helps collect vital information to underpin scheme prioritisation and area traffic network strategies.
Method• Use the CLoS and junction assessment tool to
assess the area network or focus on particular established or planned strategic routes
Analysis• Look where best conditions are and assess
whether these can be connected to form routes
• Assess potential for upgrading junctions to higher CLoS standards
• Assess the standard of existing network routes and look for potential improved alignments
Figure 2.12 Cycling Level of Service indicative ratings for network links and key nodes
Levels of service on linkslow (eg less than 40%)intermediate (eg 40-70%)high (eg more that 70%)
Junction assessment scoreslow (eg less than 40%)intermediate (eg 40-70%)high (eg more that 70%)
Key
[Chapter 2] Developing a coherent cycle network 19

London Cycling Design Standards
2.3.7 Example approaches to developing the network
These tools can help identify where interventions would make the whole area accessible to all cyclists. To develop this into a strategy, there are two main approaches: area-based and route-based. The examples below describe how the application of these strategic approaches may work in practice. In both cases, working through the detail involves engaging with the impact on all modes and considering existing on-street infrastructure and the potential for improving it for a broader range of users.
Area approach – filtered permeability Figure 2.13 shows a potential intervention that takes an area-based approach to improving conditions for cycling by removing through motor traffic in zoned areas around a traffic-free centre. Motorised traffic can enter and leave the zones but cannot pass between them without using the primary routes or alternative roads outside the zones. Cyclists can pass freely through motorised traffic restrictions between zones and so are favoured in terms of journey time and convenience. Residents benefit from removal of through-traffic and their homes can still be served by deliveries and parking. Most motorised vehicle movements will be made by residents themselves. The general level of traffic is reduced to such an extent that the CLoS scores are improved on all roads
dramatically without the need for cycle-specific infrastructure. This is a bold approach but delivers a high level of service for cycling in a cost-effective manner.
The London Borough of Hackney has implemented this approach in certain areas and has the highest modal share for cycling in London. Other cities and towns have used features such as rivers and railway lines to divide areas into zones. If quick and easy access for pedestrians and cyclists is implemented across these barriers then these modes will flourish,
while motorised traffic has to take longer, more circuitous routes.
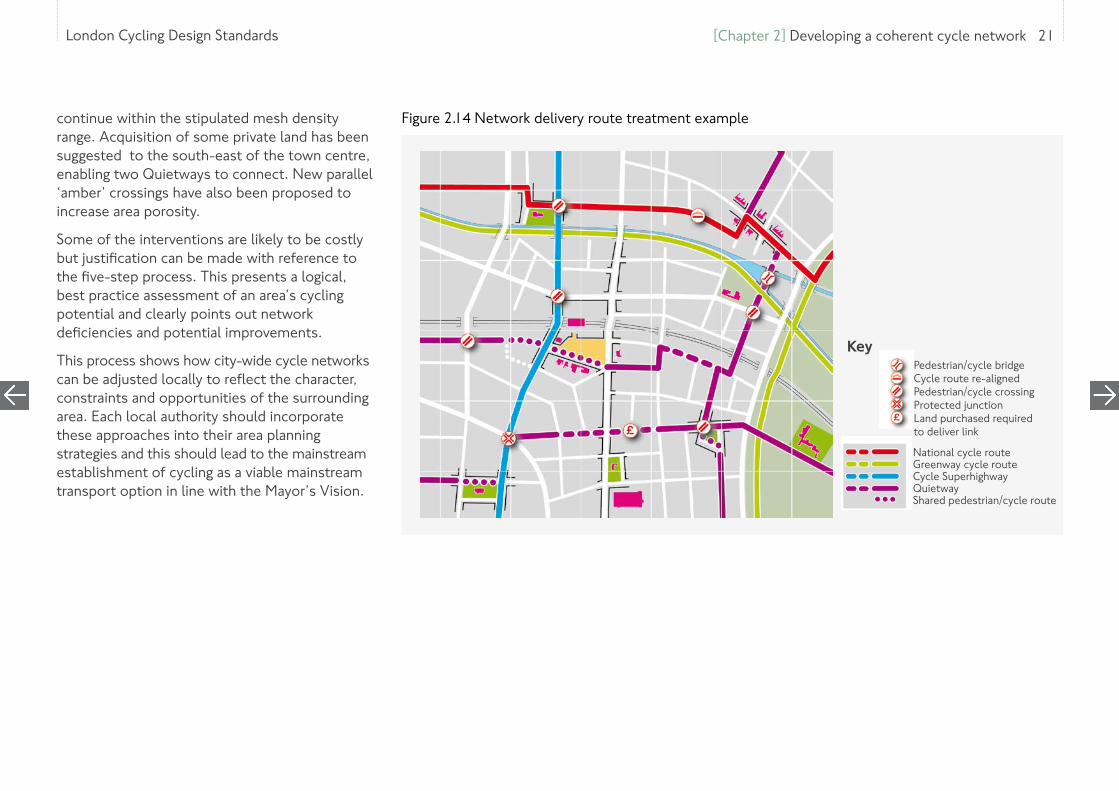
Route option – network delivery Figure 2.14 shows a route-based approach, where networks have been expanded, connected and revised based on the five-step analysis (summarised in figure 2.6). In the example below, major interventions such as a full junction redesign on a connector road where a Superhighway meets a Quietway have been proposed as well as a new bridge link allowing a Quietway to
Figure 2.13 Filtered permeability area treatment example
Vehicle restricted streetsPoint closure to general traffic/cycle access maintainedEntry points for general trafficClosure with timed restricted access
District centre (Impermeable to general traffic)Neighbourhoods (Impermeable to general traffic)
Key
[Chapter 2] Developing a coherent cycle network 20
London Cycling Design Standards
continue within the stipulated mesh density range. Acquisition of some private land has been suggested to the south-east of the town centre, enabling two Quietways to connect. New parallel ‘amber’ crossings have also been proposed to increase area porosity.
Some of the interventions are likely to be costly but justification can be made with reference to the five-step process. This presents a logical, best practice assessment of an area’s cycling potential and clearly points out network deficiencies and potential improvements.
This process shows how city-wide cycle networks can be adjusted locally to reflect the character, constraints and opportunities of the surrounding area. Each local authority should incorporate these approaches into their area planning strategies and this should lead to the mainstream establishment of cycling as a viable mainstream transport option in line with the Mayor’s Vision.
Figure 2.14 Network delivery route treatment example
Pedestrian/cycle bridgeCycle route re-alignedPedestrian/cycle crossingProtected junctionLand purchased required to deliver link
National cycle routeGreenway cycle routeCycle SuperhighwayQuietwayShared pedestrian/cycle route
Key
[Chapter 2] Developing a coherent cycle network 21

London Cycling Design Standards
2.3.8 Planning cycling into new development
The cycle network strategy should be an important influence on the planning of larger development areas and should be integrated into authority- and area-wide spatial planning frameworks as well being reflected in site-specific proposals. Figure 2.15 summarises how the cycling design outcomes might be addressed in these plans and strategies.
High quality cycling provision must be designed into all new development from the beginning. Typical problems in new developments include: the quality and quantity of cycle parking, a tendency to resort to shared infrastructure between pedestrians and cyclists, lack of coherence and connectivity of cycle lanes and tracks, and junctions that are not designed with all users in mind (with advanced stop lines as the sole provision for cyclists). It is recommended that high levels of cycling service are aimed for as key objectives for any development, and the advice in this guidance should generally be followed to achieve it.
Proposed cycle network for Nine Elms on the South Bank, showing a dense grid of cycle-friendly streets and spaces
[Chapter 2] Developing a coherent cycle network 22

London Cycling Design Standards
Strategic: planning and policy-making Area-wide planning Site specific (planning applications)
Safety Commitments to reducing death and injury on London’s streets, and to creating low speed environments.
Analysis of existing conditions for cyclists and pedestrians. Commitment to meeting design standards in improving provision.
Road Safety Audit, Non-Motorised User Audit or Quality Audit as part of Transport Assessment
Directness Policy that prioritises sustainable forms of transport and supports accessible, legible, permeable urban form.
Analysis of the relationship between origins and destinations (schools, local centres, parks, homes, places of work), how cycling links will be provided between them and how all road user needs should be balanced.
Detail on proposed route(s), showing analysis of directness and likely delay for cyclists. Identification of barriers to be overcome by improving cycling provision.
Comfort Linking air quality and environmental improvements to shifts from motorised forms of transport.
Requirements on level of service to be provided on identified routes. Evidence of responding to identified future demand for cycling.
Sufficient detail to allow analysis of effective width, gradient, deflections and capacity and surface quality. Should describe impacts on pedestrian comfort (using TfL’s Pedestrian Comfort Guidance).
Coherence Commitment to sustainable forms of development and good integration between transport modes.
A hierarchy of streets and routes that clearly shows a joined-up, legible network for cycling.
Details of how proposals contribute to the development of a coherent network in the wider area.
Attractiveness Recognition of the benefits of more people walking and cycling and interventions that promote better places for all. Provision of good quality, well located, secure cycle parking to help support growth in cycling.
Design guidance or code that deals with public realm quality – for example, setting out indicative street types that clearly how show good provision for cyclists will be provided. This should include indicative locations and quantity of cycle parking.
Detailed proposals for materials, cycle parking, other street furniture, signage, landscaping, management arrangements and maintenance costs.
Adaptability Provision for measuring and monitoring strategic outcomes on cycling (eg route use, vehicle volumes and speeds) to help adapt to changing contexts.
Implementation plan that allows (re)assessment of cycling provision during and beyond the various development phases. Consideration of how improvements to cycling and walking are to be funded, for example through CIL or S106.
Proposals that set out how cycling facilities operate with other uses and kerbside activity and how provision can respond to change in demand over time.
Figure 2.15 Support for cycling in planning policies, strategies and site-specific proposals
[Chapter 2] Developing a coherent cycle network 23

London Cycling Design Standards
2.3.9 Area-based proposals
The way cyclists move through the development and to likely destinations needs to be considered in masterplanning or in planning movement generally. Links should be made to networks in the wider area to ensure the neighbourhood is well-connected and people do not have to rely on a limited number of transport choices. Cycling and walking need to be attractive options for people as soon as they move in.
The right balance needs to be struck between prescription and flexibility when planning cycling infrastructure. When negotiating Section 106 contributions and Community Infrastructure Levy (CIL) from developments to help fund improvements to cycling in an area, it is better to describe the desired outcomes rather than specifying in the legal agreement exactly what must be built. Where Section 106 requirements and CILs are overly restrictive, they can be difficult to enact, or enacting them may have adverse consequences for cycling.
In an outline planning consent, there should be a commitment to providing dedicated cycling facilities, but some flexibility should remain about the type and exact location of cycling provision. Over-prescription at this stage could undermine attempts to design the most appropriate treatments once detail of street
and building design becomes clearer. Setting out the strategy for cycling in an outline application is more important than the detail: ideally this should draw on an existing network strategy (see section 2.1).
2.3.10 Planning applications
TfL’s online Transport Assessment Guidance tool describes the purpose and content of transport assessments as part of the planning application process. This deals with areas such as pedestrian and cycle linkages, trip generation, modelling and impact.
It is important to establish at the transport assessment stage that access for cyclists to and through a development will be provided to a defined quality. This is likely not only to require the input of cycling officers to the development control process but also some local knowledge about the existing cycling network, which local stakeholders and cycling officers can help to provide. Applicants should use this to assess and map existing local provision and explore ways in which improvements could be made, to add value to their schemes.
Reference to the cycling level of service of existing streets in the vicinity of a new development, based on objective analysis, is recommended; applicants must not rely alone on route information provided by TfL cycle guide maps.
Through pre-application discussions, the application stage and enforcement, the planning process should ensure that proposals meet policy requirements, that they are fit for purpose for the proposed site and development, and that they are implemented as planned.
New bridge at Rainham: making large areas more joined-up for cycling may well involve investing in new infrastructure
[Chapter 2] Developing a coherent cycle network 24
London Cycling Design Standards
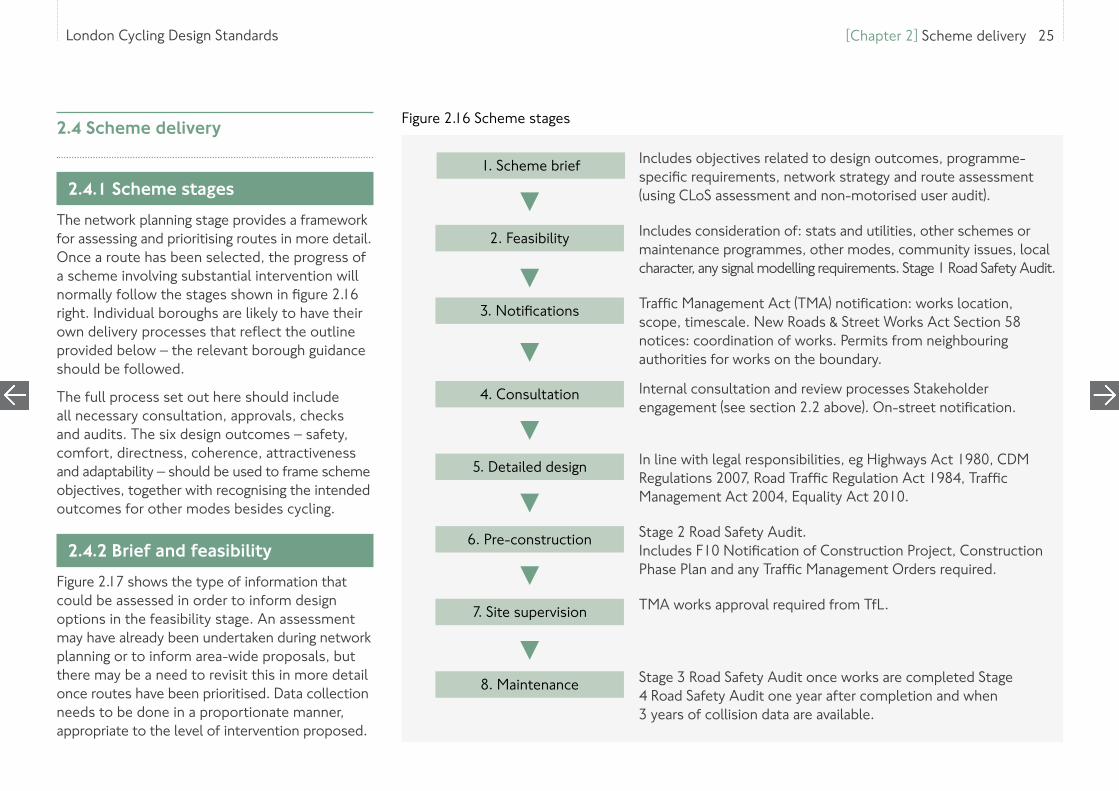
2.4.1 Scheme stages
The network planning stage provides a framework for assessing and prioritising routes in more detail. Once a route has been selected, the progress of a scheme involving substantial intervention will normally follow the stages shown in figure 2.16 right. Individual boroughs are likely to have their own delivery processes that reflect the outline provided below – the relevant borough guidance should be followed.
The full process set out here should include all necessary consultation, approvals, checks and audits. The six design outcomes – safety, comfort, directness, coherence, attractiveness and adaptability – should be used to frame scheme objectives, together with recognising the intended outcomes for other modes besides cycling.
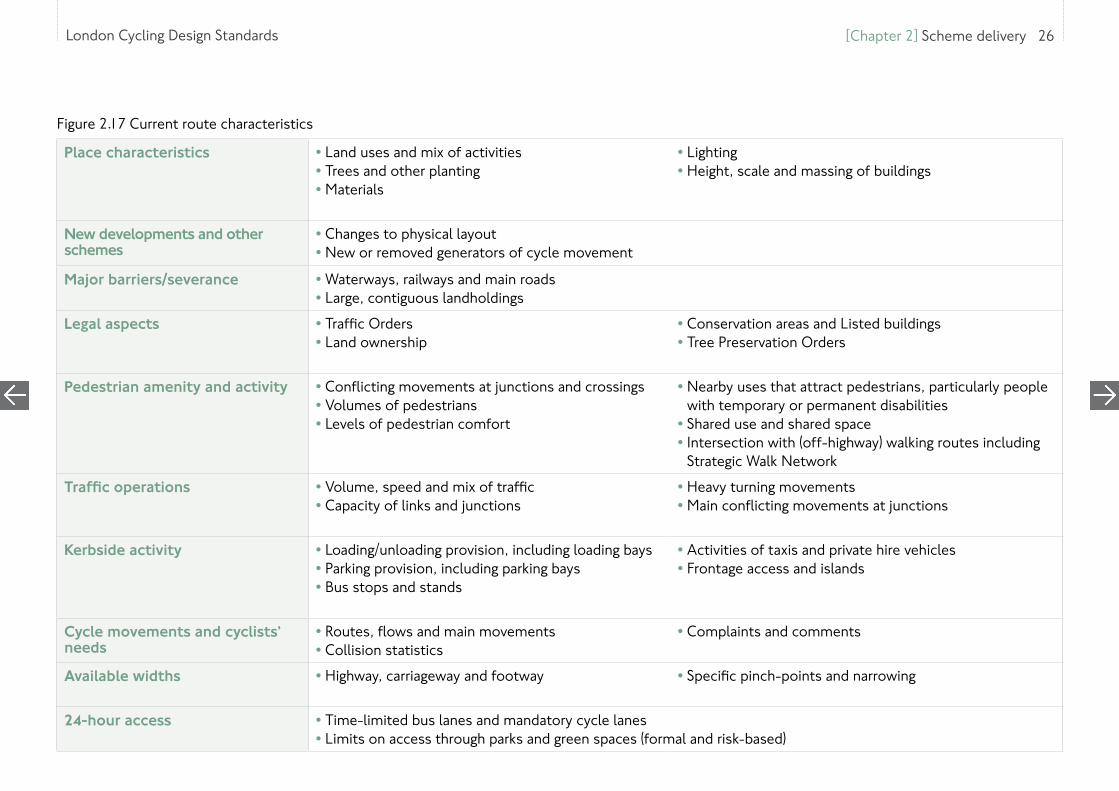
2.4.2 Brief and feasibility
Figure 2.17 shows the type of information that could be assessed in order to inform design options in the feasibility stage. An assessment may have already been undertaken during network planning or to inform area-wide proposals, but there may be a need to revisit this in more detail once routes have been prioritised. Data collection needs to be done in a proportionate manner, appropriate to the level of intervention proposed.
1. Scheme brief
2. Feasibility
3. Notifications
6. Pre-construction
4. Consultation
7. Site supervision
5. Detailed design
8. Maintenance
Includes objectives related to design outcomes, programme-specific requirements, network strategy and route assessment (using CLoS assessment and non-motorised user audit).
Traffic Management Act (TMA) notification: works location, scope, timescale. New Roads & Street Works Act Section 58 notices: coordination of works. Permits from neighbouring authorities for works on the boundary.
Internal consultation and review processes Stakeholder engagement (see section 2.2 above). On-street notification.
In line with legal responsibilities, eg Highways Act 1980, CDM Regulations 2007, Road Traffic Regulation Act 1984, Traffic Management Act 2004, Equality Act 2010.
Stage 2 Road Safety Audit. Includes F10 Notification of Construction Project, Construction Phase Plan and any Traffic Management Orders required.
TMA works approval required from TfL.
Stage 3 Road Safety Audit once works are completed Stage 4 Road Safety Audit one year after completion and when 3 years of collision data are available.
Includes consideration of: stats and utilities, other schemes or maintenance programmes, other modes, community issues, local character, any signal modelling requirements. Stage 1 Road Safety Audit.
2.4 Scheme delivery Figure 2.16 Scheme stages
[Chapter 2] Scheme delivery 25
London Cycling Design Standards
Figure 2.17 Current route characteristics
Place characteristics • Land uses and mix of activities• Trees and other planting• Materials
• Lighting• Height, scale and massing of buildings
New developments and other schemes
• Changes to physical layout • New or removed generators of cycle movement
Major barriers/severance • Waterways, railways and main roads • Large, contiguous landholdings
Legal aspects
• Traffic Orders• Land ownership
• Conservation areas and Listed buildings• Tree Preservation Orders
Pedestrian amenity and activity
• Conflicting movements at junctions and crossings• Volumes of pedestrians• Levels of pedestrian comfort
• Nearby uses that attract pedestrians, particularly people with temporary or permanent disabilities
• Shared use and shared space• Intersection with (off-highway) walking routes including
Strategic Walk Network
Traffic operations
• Volume, speed and mix of traffic• Capacity of links and junctions
• Heavy turning movements • Main conflicting movements at junctions
Kerbside activity • Loading/unloading provision, including loading bays• Parking provision, including parking bays• Bus stops and stands
• Activities of taxis and private hire vehicles • Frontage access and islands
Cycle movements and cyclists’ needs
• Routes, flows and main movements• Collision statistics
• Complaints and comments
Available widths • Highway, carriageway and footway • Specific pinch-points and narrowing
24-hour access • Time-limited bus lanes and mandatory cycle lanes• Limits on access through parks and green spaces (formal and risk-based)
[Chapter 2] Scheme delivery 26
London Cycling Design Standards
2.4.3 Signal works
If signal works are necessary then these should be programmed with TfL during the feasibility stage. If modelling capability is not present in-house then a consultant should be commissioned to run through the Model Auditing Process (MAP) with TfL.
MAP is a requirement for schemes that have an impact on the TLRN or Strategic Road Network, and represents good practice for any other scheme. It has been developed to ensure that models submitted to TfL for audit are developed, calibrated and validated to an appropriate standard and is described fully in TfL’s Traffic Modelling Guidelines (2010). Signal design should then be agreed with TfL during the detailed design stage – further information is provided in section 5.4.2.
2.4.4 Road safety audits
Road safety audits (RSAs) are well-established procedures, widely applied to cycling and other traffic schemes. RSAs consider the road safety implications of all measures and their impact on the network under all anticipated operating conditions. The effects on all classes of road user are considered. In the hands of competent practitioners, RSAs improve the design and
safety of cycle schemes. TfL has produced guidance on its safety audit procedures in the form of document SQA-0170, Road Safety Audit, Issue 5 (2014). For borough roads, procedures required by the relevant highway authority should be followed.
RSAs should inform decisions on risk reduction measures and restrictions that are balanced, proportionate and appropriate for the street environment. Issues raised about a given intervention need to be balanced against the issues that will remain if the scheme is not implemented, particularly where cyclists may be compelled to use an alternative route that involves exposure to equivalent or greater risks. RSAs should contribute fully to good design outcomes for all users, but they should not, in themselves, determine cycling priorities and requirements that will support growth.
Changes to schemes are recommended as the audit team considers appropriate. On receipt of the safety audit report, the scheme engineer/designer should consider its content and amend the scheme accordingly. If the project sponsor authority does not wish to incorporate some or all recommendations of the safety audit they are required to prepare and state in the RSA report the reason(s) why they consider the recommended action is not appropriate.
2.4.5 Other pre-construction procedures
As set out in section 2.1.3, ‘Stakeholder involvement’, an Accessibility Audit or other form of Equality Impact Assessment should be considered for any scheme involving facilities shared between pedestrians and cyclists.
During the pre-construction phase, TMA works approval should be submitted to the relevant highway authority, following procedures set out by that authority. TfL requires the following procedures:
• Works notification should happen by letter to those affected at least 2 weeks before works begin
• Notice required for parking suspensions is 17 days, bus suspensions 3 days and signal switch-offs 3 days
• If the works do not proceed then a cancellation notice should be submitted
• Works permits should be submitted a minimum of 10 days before works start
• Start notice should be submitted by 16.30 the next working day and stop notice should be submitted by 16.30 the next working day following the end of the works
• The CDM coordinator should approve the construction phase plan before any works progress
[Chapter 2] Scheme delivery 27
London Cycling Design Standards
2.4.6 Traffic Orders
Obtaining a Traffic Order (normally known as a Traffic Management Order, TMO, in London) involves several stages:
• Consultation on initial layout / design: obtaining the view of local councillors, emergency services and other relevant institutions
• Advertisement of the Traffic Order, via public notices, for at least 21 days
• Making the Order
• Implementing the Order
The use of Traffic Orders in support of coherent cycling infrastructure is relevant to parking controls, creation of some cycle facilities, provision of cycle parking and exemptions for cyclists from certain banned movements. Since the publication of the revised Traffic Signs Regulations and General Directions (2016), there has no longer been a requirement for a Traffic Order to implement with-flow mandatory cycle lanes.
As described in the Local Authorities’ Traffic Orders (Procedures) Regulations (1996), traffic authorities are empowered under the Road Traffic Regulation Act (1984) to make Traffic Orders to regulate and manage the speed, movement and parking and loading of vehicles and to regulate pedestrian movement. The Environment Act 1995 enables Orders to be made in pursuit of national or local air quality management strategies.
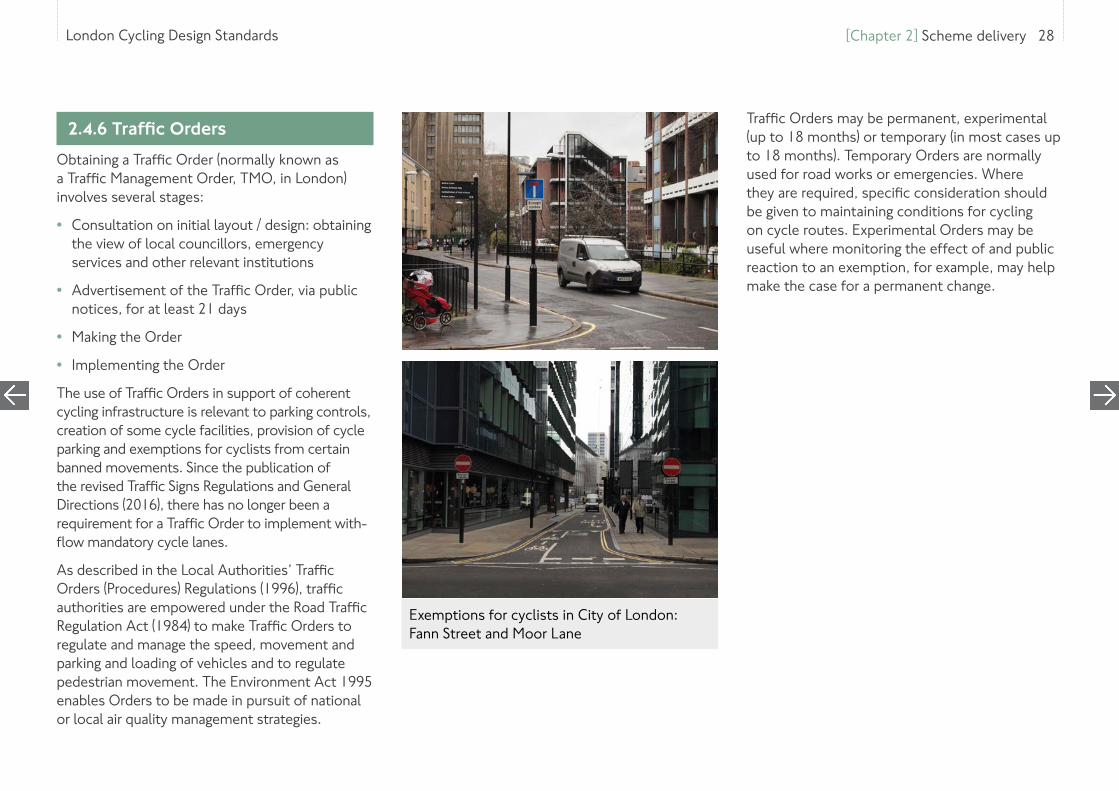
Traffic Orders may be permanent, experimental (up to 18 months) or temporary (in most cases up to 18 months). Temporary Orders are normally used for road works or emergencies. Where they are required, specific consideration should be given to maintaining conditions for cycling on cycle routes. Experimental Orders may be useful where monitoring the effect of and public reaction to an exemption, for example, may help make the case for a permanent change.
Exemptions for cyclists in City of London: Fann Street and Moor Lane
[Chapter 2] Scheme delivery 28

London Cycling Design Standards
2.4.7 Procedures for creating cycle facilities
Scheme delivery may also need to build in the process for designating certain infrastructure as being appropriate for cyclists. See section 4.1 for definition of different cycle infrastructure types and legal instruments required to create them.
Cycle tracks and shared use facilities must be formally approved and have effective Notices in place. On highway, this will entail approval (by delegated authority) under Section 65(1) of the 1980 Highways Act. For the TLRN this is carried-out by a TfL designated officer. For roads managed by London boroughs, this is normally delegated to a senior officer. As well as major areas of shared use and cycle track, the shared use sections to either side of Toucan crossings will need to have effective Notices.
The TfL Traffic Orders Team hold copies of all Notices for existing TfL/TLRN cycle track, shared use and adjacent/segregated use. These are recorded under HA Section 65(1), not TROs. London boroughs normally have a similar system within their Traffic Order section.
Footpath part-converted into cycle track, Hackney
Shared use path away from the highway, Queen Elizabeth Olympic Park
[Chapter 2] Scheme delivery 29
Bibliography
• DfT Briefing on the Government’s ambitions for cycling (2013)
• DfT Traffic Signs Regulations and General Directions (2016)
• CIHT Cycle Audit and Cycle Review (1996)
• Local Authorities’ Traffic Orders (Procedures) Regulations (1996)
• LCC ‘Love London, Go Dutch’ matrix
• TfL Pedestrian Comfort Guidance for London (2010)
• Road Traffic Regulation Act (1984)
• TfL SQA-0170, Road Safety Audit, Issue 5 (2014)
• TfL Traffic Modelling Guidelines (2010)
• TfL Transport Assessment Guidance
London Cycling Design Standards [Chapter 2] Bibliography 30