LOK SATTA · 2014-12-12 · LOK SATTA 6 Table – 2 : Women’s Representation in Parliament...
26
LOK SATTA 1 LOK SATTA People Power Elections and Representational Legitimacy Workshop on The Indian Parliament: A Comparative Perspective 25 th - 27 th March, 2002, CPA, New Delhi
Transcript of LOK SATTA · 2014-12-12 · LOK SATTA 6 Table – 2 : Women’s Representation in Parliament...

LOK SATTA
1
LOK SATTAPeople Power
Elections and Representational Legitimacy
Workshop on
The Indian Parliament: A Comparative Perspective
25th - 27th March, 2002, CPA, New Delhi

LOK SATTA
2
Indian Democracy - Impressive Record
Myron Weiner’s Democratic Practices
Competitive elections
Political freedoms
Peaceful transfer of power & due process
Government accountable to people

LOK SATTA
3
Indian Democracy - Aberrations
Internal emergency (1975 - 77)
Flawed elections
Decline of debate in legislatures
Abuse of Art 356
Palace coups to oust legitimate governments
Ayaram- gayaram culture
Bribery for voting in legislature (JMM Case)
Contentious transfer of power (Jagadambica Pal - Feb 98)
Change of players - but no change of rules of the game

LOK SATTA
4
Key Ingredients of Democracy
Freedom
Self-governance
Empowerment
Rule of law
Self-correcting mechanisms

LOK SATTA
5
Table 1: Representational base of our legislartures
Year ofelection
% of Members of"Forward Castes"
% of BCMembers
% offarmers
1952 45.4 10.2 22.5
1962 49.4 12.8 27.4
1971 44.7 13.0 32.2
1984 36.9 9.3 38.3
1996 45.6 23.3 51.8
Source: India Today, July 16, 1996. p26-30

LOK SATTA
6
Table – 2 : Women’s Representation in Parliament 1952-1999
Lok Sabha Rajya SabhaYearSeats Women
MPs% ofWomenMPs
Seats WomenMPs
% ofWomenMPs
1952 499 22 4.41 219 16 07.311957 500 27 5.40 237 18 07.591962 503 34 6.76 238 18 07.561967 523 31 5.93 240 20 08.331971 521 22 4.22 243 17 07.001977 544 19 3.49 244 25 10.251980 544 28 5.15 244 24 09.841984 544 44 8.09 244 28 11.481989 517 27 5.22 245 24 09.801991 544 39 7.17 245 38 15.511996 543 39 7.18 223 19 08.521998 543 43 7.92 245 15 06.121999 543 49 9.02 245 19 07.76Average 528 33 6.15 238 22 09.00
Source : CSDS Data unit

LOK SATTA
7
Table 3 : Independents Elected to Lok Sabha in Successive General Elections
Year No.of seatsfilled
No.ofindenpendents
elected
Percentage ofindependents
who lost deposit1952 489 38 66.6
1957 494 42 60.1
1962 494 20 79
1967 520 35 86.21971 518 14 941977 542 9 97.2
1980 529 9 98.9
1984 542 5 99.7
1989 529 12 98.9
1991 534 1 99.5
1996 542 9 99.7
1998 542 6 99.1
Source : Lok Satta Data unit

LOK SATTA
8
New Entrants into Lok Sabha
Heredity and family links
Money power
Criminal record and muscle power
Personal loyalty to ‘high command’
Non-political visibility (films or sports)
Accidents of fate
LOK SATTA
9
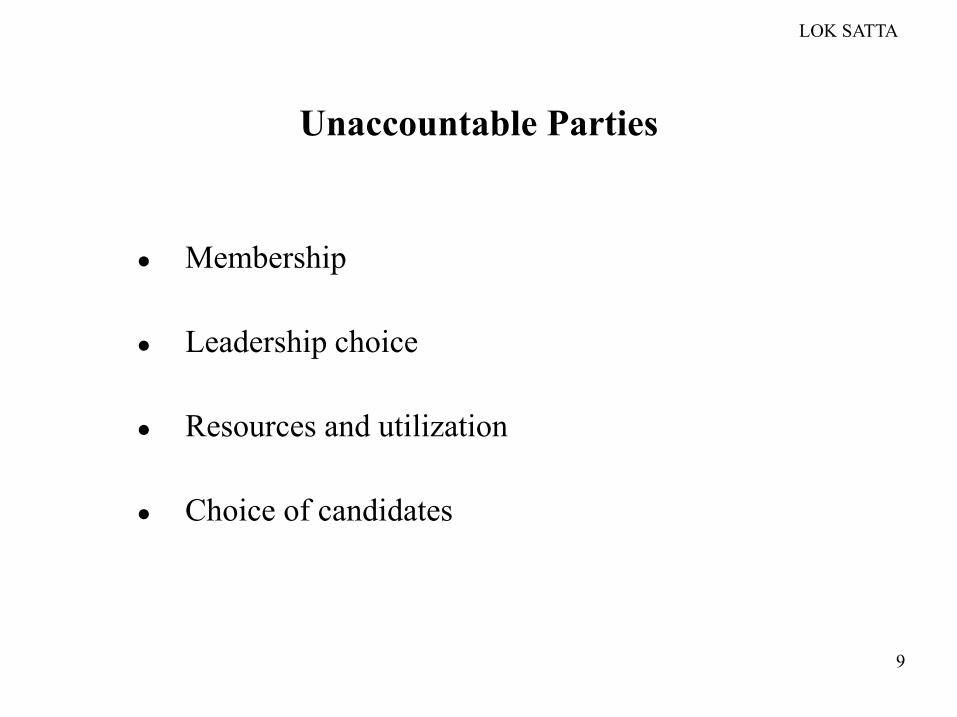
Unaccountable Parties
Membership
Leadership choice
Resources and utilization
Choice of candidates

LOK SATTA
10
Political Parties - Why Regulation?
Political Parties
Monopoly or oligopoly
Represent history, memories,
aspirations of millions
Seek power over all people
Cannot be easily formed or
built
People and members have no
realistic alternatives
Vehicles for political
participation of citizens
Societies
Free choice
Mere organisations of convenience
Pursue members’ collective goals
Can be formed and dissolved at will
Members have multiple options
Vehicles for voluntary pursuit of
individual / group goals

LOK SATTA
11
Macro Perspectives of Indian Polity
Disaggregate volatility
Broadly reflective of public opinion
Ruling parties and powerful candidates do lose
Rejection/Negative vote pretty common

LOK SATTA
12
Micro Perspectives of Indian Polity
Money power dominant
Criminalization rampant
Voting irregularities frequent
People take money to vote
Caste and divisive impulses are prominent

LOK SATTA
13
How is Democracy Surviving?
A system of compensatory errors (competing distortions
neutralize each other)
Strength of Election Commission
Tradition of Neutrality of Officials
Pre-Polling process scrupulously fair ( nominations, ballot
papers, appointment of polling officials etc.)
Post-polling process - completely non-partisan (transport,
storage and counting of ballots and declaration of results)
LOK SATTA
14
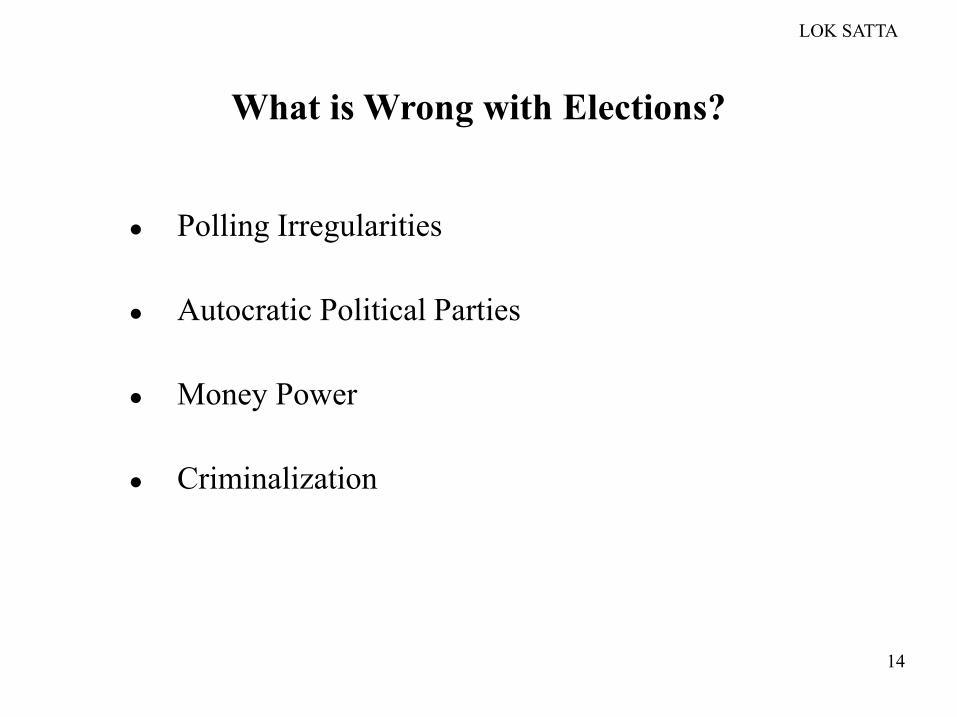
What is Wrong with Elections?
Polling Irregularities
Autocratic Political Parties
Money Power
Criminalization

LOK SATTA
15
Polling Irregularities
Serious flaws in voter rolls
Sample survey 40% errors in urban areas
State-wide survey 15% errors in villages
> 40% errors in towns
21.7% possible fraudulent voting in cities

LOK SATTA
16
Verification of Voters’ Lists in Andhra Pradesh Survey of Rural Polling Stations
Details of electoral rolls verified Deletions Reqd
(Errors of Commission) Additions Reqd
(Errors of Ommission)
Variation D
istr
ict
No
. o
f P
ollin
g
Stn
s.
No
. o
f V
ote
rs
Sh
ifti
ng
De
ath
Oth
er
To
tal
% o
f vo
ters
Att
ain
ed
1
8 y
ea
rs o
f A
ge
By s
hif
tin
g
T
ota
l
% o
f vo
ters
To
tal
% o
f vo
ters
E.G 4 1289 166 36 202 15.7 31 50 81 6.3 283 22.0
W.G. 2 2086 37 52 89 4.3 24 23 47 2.3 136 6.5
Krishna 1 416 27 13 1 41 9.9 12 3 15 3.6 56 13.5
Prakasam 2 1297 43 38 2 83 6.4 34 12 46 3.5 129 9.9
Nellore 4 3084 87 79 15 181 5.9 60 100 160 5.2 341 11.1
Chittoor 2 1762 143 37 90 270 15.3 47 110 157 8.9 427 24.2
Kurnool 4 4648 488 71 1 560 12.0 82 128 210 4.5 770 16.6
Warangal 2 1399 51 15 4 70 5.0 7 12 19 1.4 89 6.4
M'bnagar 1 344 32 11 43 12.5 35 12 47 13.7 90 26.2
Karimnagar 5 3956 549 100 59 708 17.9 78 142 220 5.6 928 23.5
Khammam 2 2016 11 36 12 59 2.9 37 0 37 1.8 96 4.8
Rural Total 29 22297 1634 488 184 2306 10.34 447 592 1039 4.7 3345 15.10
Table 4: Verification Voters’ List in Andhra Pradesh Survey of Rural Polling Stations

LOK SATTA
17
Verification of Voters’ Lists in Andhra Pradesh Survey of Urban Polling Stations
Details of electoral rolls
verified Deletions Reqd
(Errors of Commission) Additions Reqd
(Errors of Ommission)
Variation
Dis
tric
t
No
. o
f P
oll
ing
S
tns
. N
o.
of
Vo
ters
Sh
ifti
ng
De
ath
Oth
er
To
tal
% o
f v
ote
rs
Att
ain
ed
1
8 y
ea
rs o
f A
ge
By s
hif
tin
g
To
tal
% 0
f v
ote
rs
To
tal
% o
f v
ote
rs
Vizag 3 1298 355 22 17 394 30.4 82 413 495 38.1 889 68.5
E.Godavari 3 419 78 14 0 92 22.0 39 85 124 29.6 216 51.6
W.Godavari 2 1491 121 12 133 8.9 46 179 225 15.1 358 24.0
Krishna 3 1919 690 35 0 725 37.8 53 500 553 28.8 1278 66.6
Kurnool 3 1796 419 43 28 490 27.3 62 90 152 8.5 642 35.7
Nalgonda 1 797 273 5 2 280 35.1 34 125 159 19.9 439 55.1
Warangal 2 1863 320 28 30 378 20.3 43 74 117 6.3 495 26.6
Guntur 5 4060 1039 83 92 1214 29.9 209 604 813 20.0 2027 49.9
Hyderabad 5 4459 923 31 42 996 22.3 85 691 776 17.4 1772 39.7
Urban Total 27 18102 4218 273 211 4702 26.0 653 2761 3414 18.9 8116 44.8
Rural+Urban 56 40399 5852 761 395 7008 17.3 1100 3353 4453 11.0 11461 28.4
Table 5: Verification Voters’ List in Andhra Pradesh Survey of Urban Polling Stations

LOK SATTA
18
Post-Polling Survey of Select Polling Station Areas
(1999 Assembly and Parliamentary Polls, Hyderabad, AP)
No. not voted or doubtful casesAssembly
Constituency /
Polling Booth
No.,
No.of
voters
No.of
votes
polled
No.who
reported that
they actually
‘voted’
Residing in the
area but not
voted
Left the area but
residing within
the city
Left the city /
country etc .
Total
Percentage
of doubtful and
‘not voted’ votes
1 2 3 4 5 6 7 8 9
207/173 1143 625 483 5 91 46 142 22.7
207/176 956 459 377 15 41 26 82 17.9
209/93 725 428 306 20 95 7 122 28.5
209/75 989 495 380 42 72 1 115 23.2
210/426 893 476 399 22 49 6 77 16.2
Total 4706 2483 1945 104 348 86 538 21.7
Table 6: Post-Polling Survey of Select Polling Station Areas
(1999 Assembly and Parliamentary Polls, Hyderabad, AP)

LOK SATTA
19
Problems with Current Campaign Funding Laws
Explanation 1 of Section 77 of R.P. Act, 1951
No Public Auditing
Weak Enforcement (Non- Existent)
No Disclosure Norms
No Penalties
No Asset and Income Disclosures
No incentive for Public Funding
LOK SATTA
20
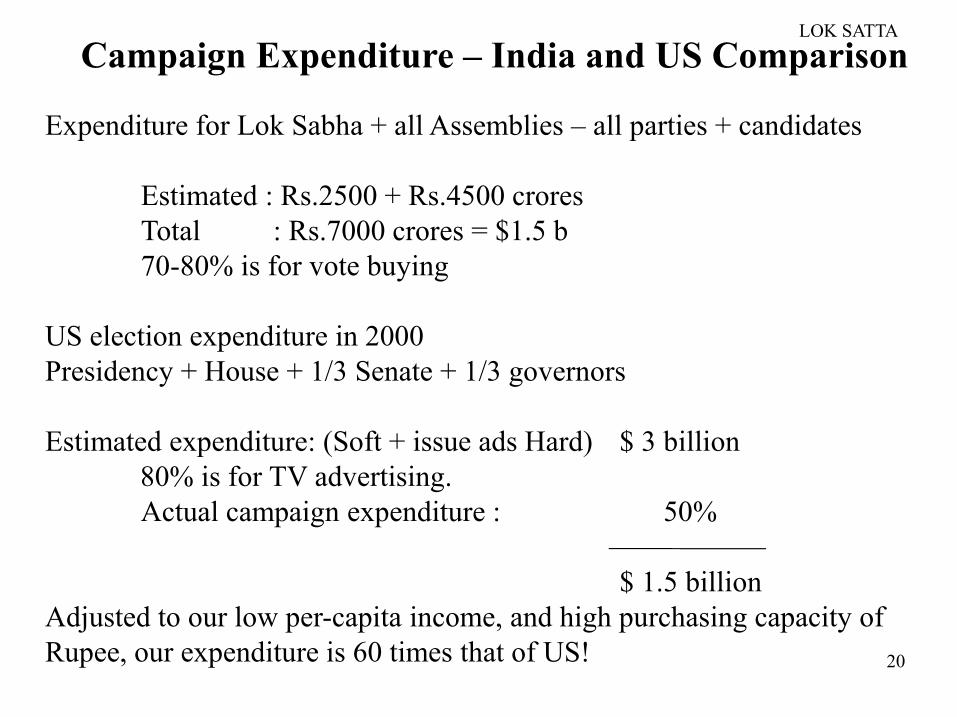
Campaign Expenditure – India and US Comparison
Expenditure for Lok Sabha + all Assemblies – all parties + candidates
Estimated : Rs.2500 + Rs.4500 croresTotal : Rs.7000 crores = $1.5 b70-80% is for vote buying
US election expenditure in 2000Presidency + House + 1/3 Senate + 1/3 governors
Estimated expenditure: (Soft + issue ads Hard) $ 3 billion80% is for TV advertising. Actual campaign expenditure : 50%
$ 1.5 billionAdjusted to our low per-capita income, and high purchasing capacity of Rupee, our expenditure is 60 times that of US!
LOK SATTA
21
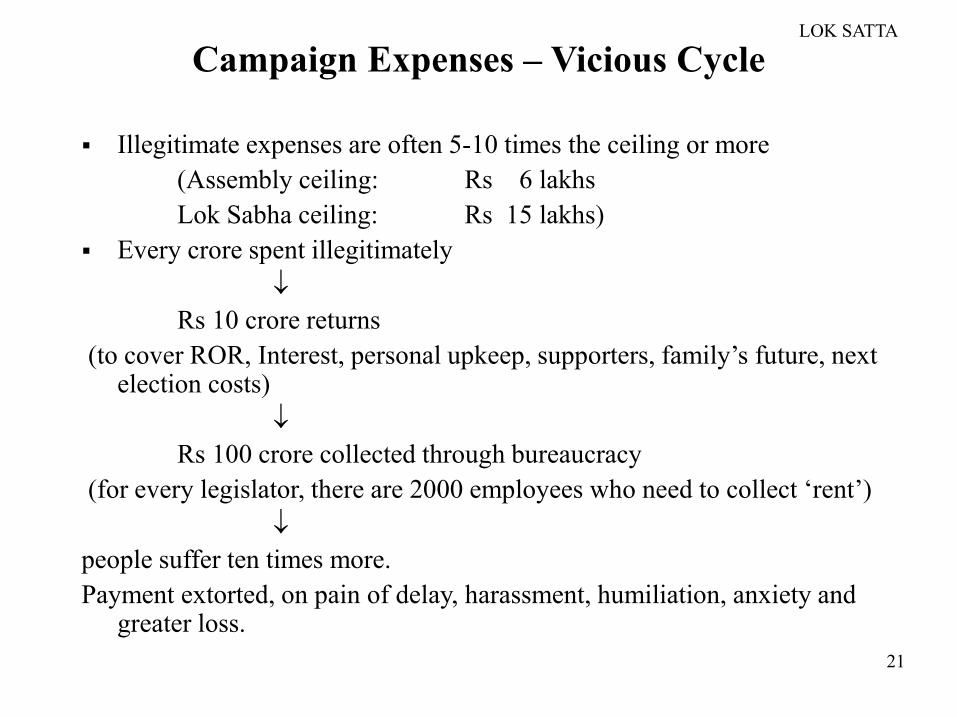
Campaign Expenses – Vicious Cycle
Illegitimate expenses are often 5-10 times the ceiling or more
(Assembly ceiling: Rs 6 lakhs
Lok Sabha ceiling: Rs 15 lakhs)
Every crore spent illegitimately
Rs 10 crore returns
(to cover ROR, Interest, personal upkeep, supporters, family’s future, next election costs)
Rs 100 crore collected through bureaucracy
(for every legislator, there are 2000 employees who need to collect ‘rent’)
people suffer ten times more.
Payment extorted, on pain of delay, harassment, humiliation, anxiety and greater loss.

LOK SATTA
22
Criminalization
Polling irregularities
Failure of criminal justice system
Political control of crime investigation
Limitations of electoral law
Compulsions of FPTP system
Disguised executive system
Crime - Caste nexus

LOK SATTA
23
Table 7: Percentage of votes and seats obtained by the largest party in Lok Sabha.Year % of Votes
PolledName of the
Largest /Majority
Party
Seatsobtained
/Total No.of Seats
% Votesobtained by
largest /Majority
Party
% votesnecessary
forobtaining50% seats
% votesneeded for
half the seats(in total
electorate)1952 61.7 Congress 357/489 45.04 30.9 19.071957 63.7 Congress 359/494 47.8 32.8 20.891962 55.4 Congress 358/494 44.7 31.0 17.171967 61.3 Congress 279/520 40.7 37.9 23.201971 55.3 Congress 352/519 43.7 32.3 17.861977 60.5 Janata 295/542 41.4 38.0 22.991980 56.9 Congress 353/527 42.7 32.9 18.721984 64.1 Congress 415/543 48.1 32.6 20.891989 62.2 INC 197/543 39.5 54.5* 33.89*1991 56.7 Congress 232/543 36.5 42.7 24.201996 57.9 BJP 169/543 20.3 32.6 18.80
1998**1999 60.0 BJP 182/543 23.75 35.50 21.30
Note: * Congress lost a large number of seats with small margin** Figures not immediately available
Source: Syed Shahabuddin: ‘Representational Legitimacy of the Existing System’ – paper presented at theNational Seminar on Electoral Reforms, Kolkata, 17-18 Nov 2000
Distortions of FPTP System

LOK SATTA
24
Distortions of FPTP
Election with minority of votes polled
Composition of Legislature unrepresentative
Non-representation of scattered minorities
Over representation of locally dominant groups
Tokenism in dealing with problems of equality
Reservation with or without rotation
Best talent repelled
No pressure on established parties to reform
Alienation of large segments

LOK SATTA
25
Parliamentary Executive in Perspective
Legislature acts as unaccountable, disguised executive
Elections highly adversarial
Creation of modern ‘Zaminadaris’
Patronage, transfers, postings etc.
Political control of crime investigation
Change of governments does not improve governance
Short-term populism
Contd..
LOK SATTA
26
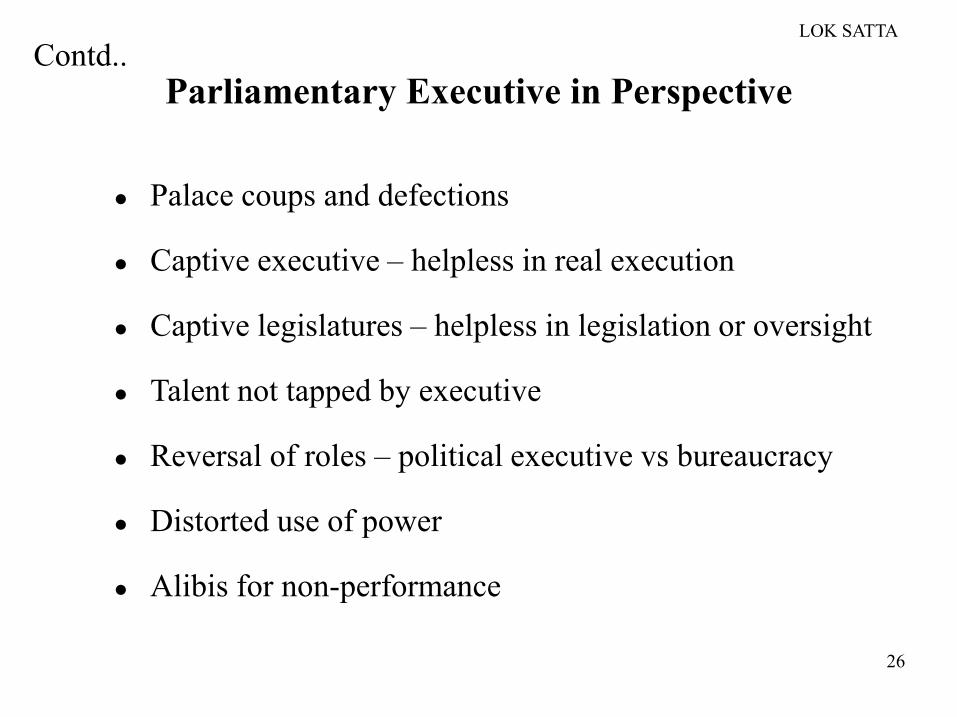
Parliamentary Executive in Perspective
Palace coups and defections
Captive executive – helpless in real execution
Captive legislatures – helpless in legislation or oversight
Talent not tapped by executive
Reversal of roles – political executive vs bureaucracy
Distorted use of power
Alibis for non-performance
Contd..