
Logistics Databank Analytics Report- Nov 2019 · Vaishno Logistics CFS, Navi Mumbai Top Performing...
39
© DMICDC Logistics Data Services Limited © DMICDC Logistics Data Services Limited © DMICDC Logistics Data Services Limited Logistics Databank Analytics Report- Nov 2019
Transcript of Logistics Databank Analytics Report- Nov 2019 · Vaishno Logistics CFS, Navi Mumbai Top Performing...
© DMICDC Logistics Data Services Limited© DMICDC Logistics Data Services Limited© DMICDC Logistics Data Services Limited
Logistics Databank Analytics Report- Nov 2019
© DMICDC Logistics Data Services Limited
Index
Section Two
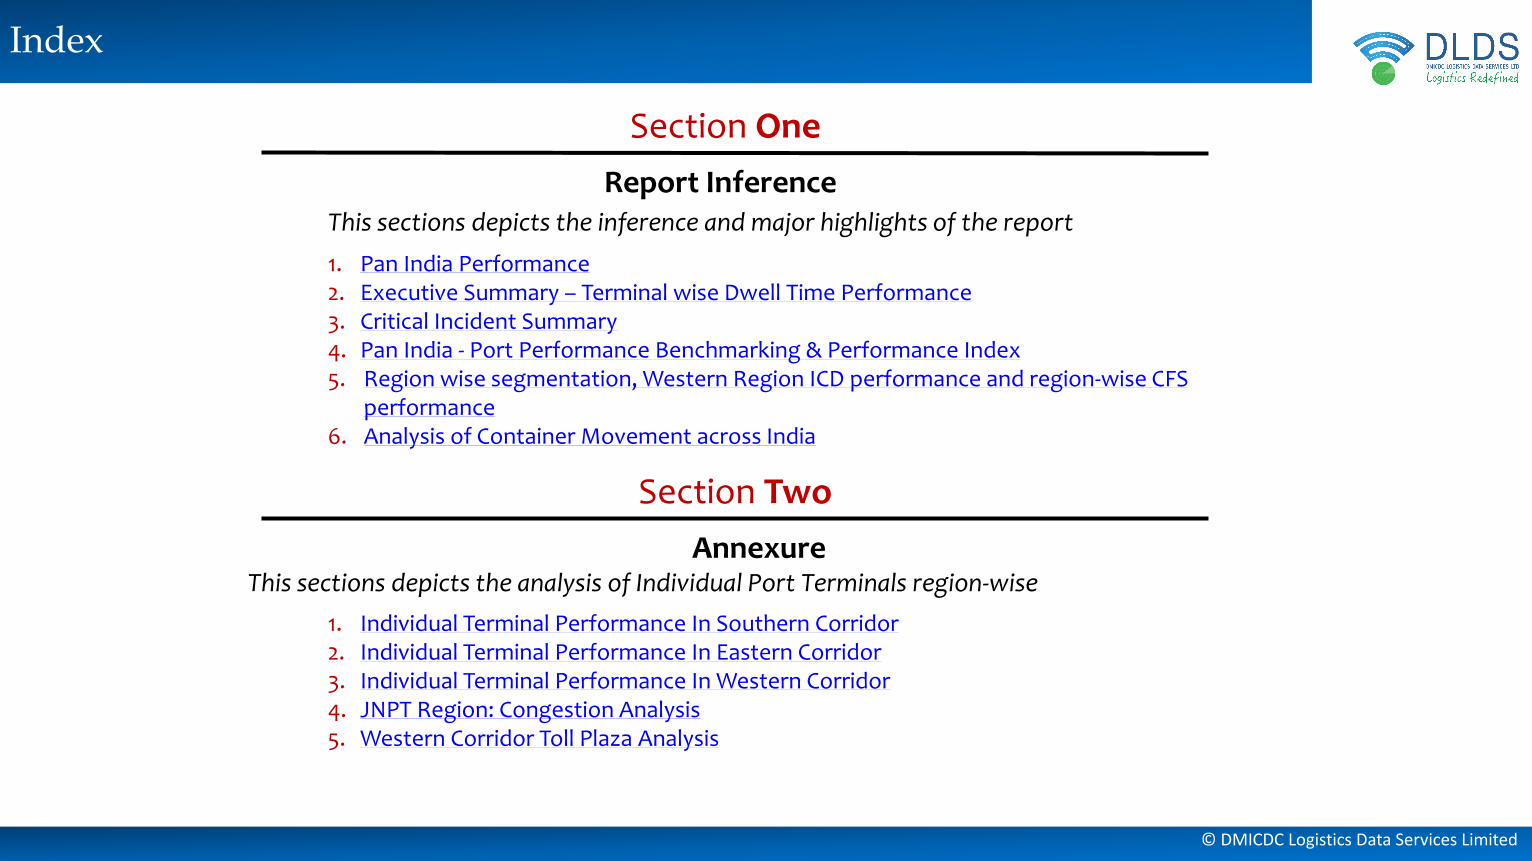
AnnexureThis sections depicts the analysis of Individual Port Terminals region-wise
Section One
Report InferenceThis sections depicts the inference and major highlights of the report
1. Pan India Performance2. Executive Summary – Terminal wise Dwell Time Performance3. Critical Incident Summary4. Pan India - Port Performance Benchmarking & Performance Index5. Region wise segmentation, Western Region ICD performance and region-wise CFS
performance6. Analysis of Container Movement across India
1. Individual Terminal Performance In Southern Corridor2. Individual Terminal Performance In Eastern Corridor3. Individual Terminal Performance In Western Corridor4. JNPT Region: Congestion Analysis5. Western Corridor Toll Plaza Analysis
© DMICDC Logistics Data Services Limited
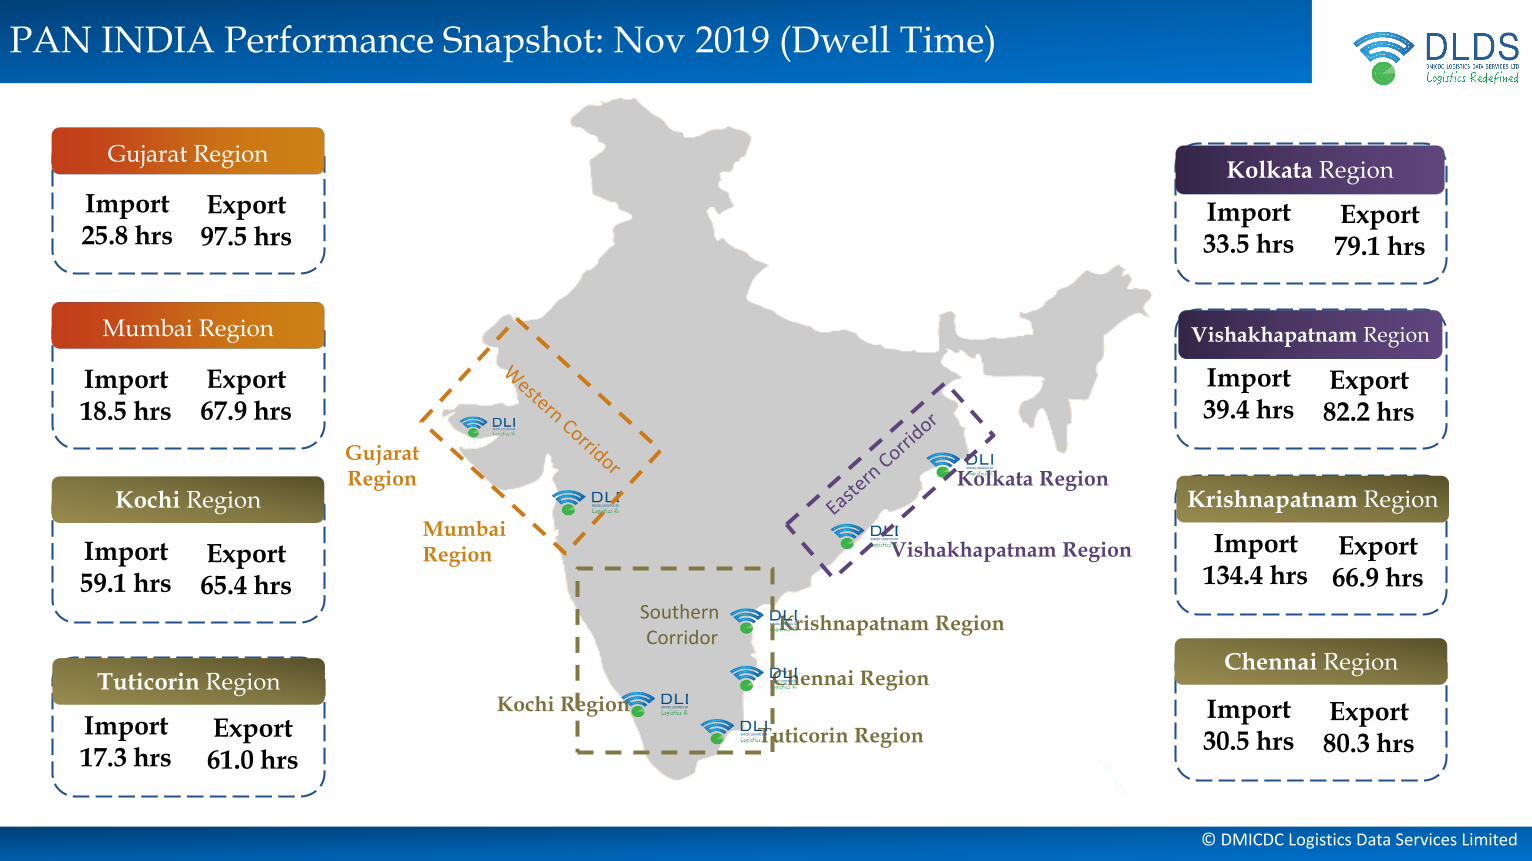
PAN INDIA Performance Snapshot: Nov 2019 (Dwell Time)
Mumbai Region
Kolkata Region
Tuticorin Region
Krishnapatnam Region
Chennai Region
Gujarat Region
Vishakhapatnam Region
Kochi Region
SouthernCorridor
Import33.5 hrs
Export79.1 hrs
Gujarat Region
Import25.8 hrs
Export97.5 hrs
Mumbai Region
Import18.5 hrs
Export67.9 hrs
Import17.3 hrs
Export61.0 hrs
Kochi Region
Import59.1 hrs
Export65.4 hrs
Import39.4 hrs
Export82.2 hrs
Import134.4 hrs
Export66.9 hrs
Import30.5 hrs
Export80.3 hrs
Tuticorin RegionChennai Region
Krishnapatnam Region
Kolkata Region
Vishakhapatnam Region
© DMICDC Logistics Data Services Limited
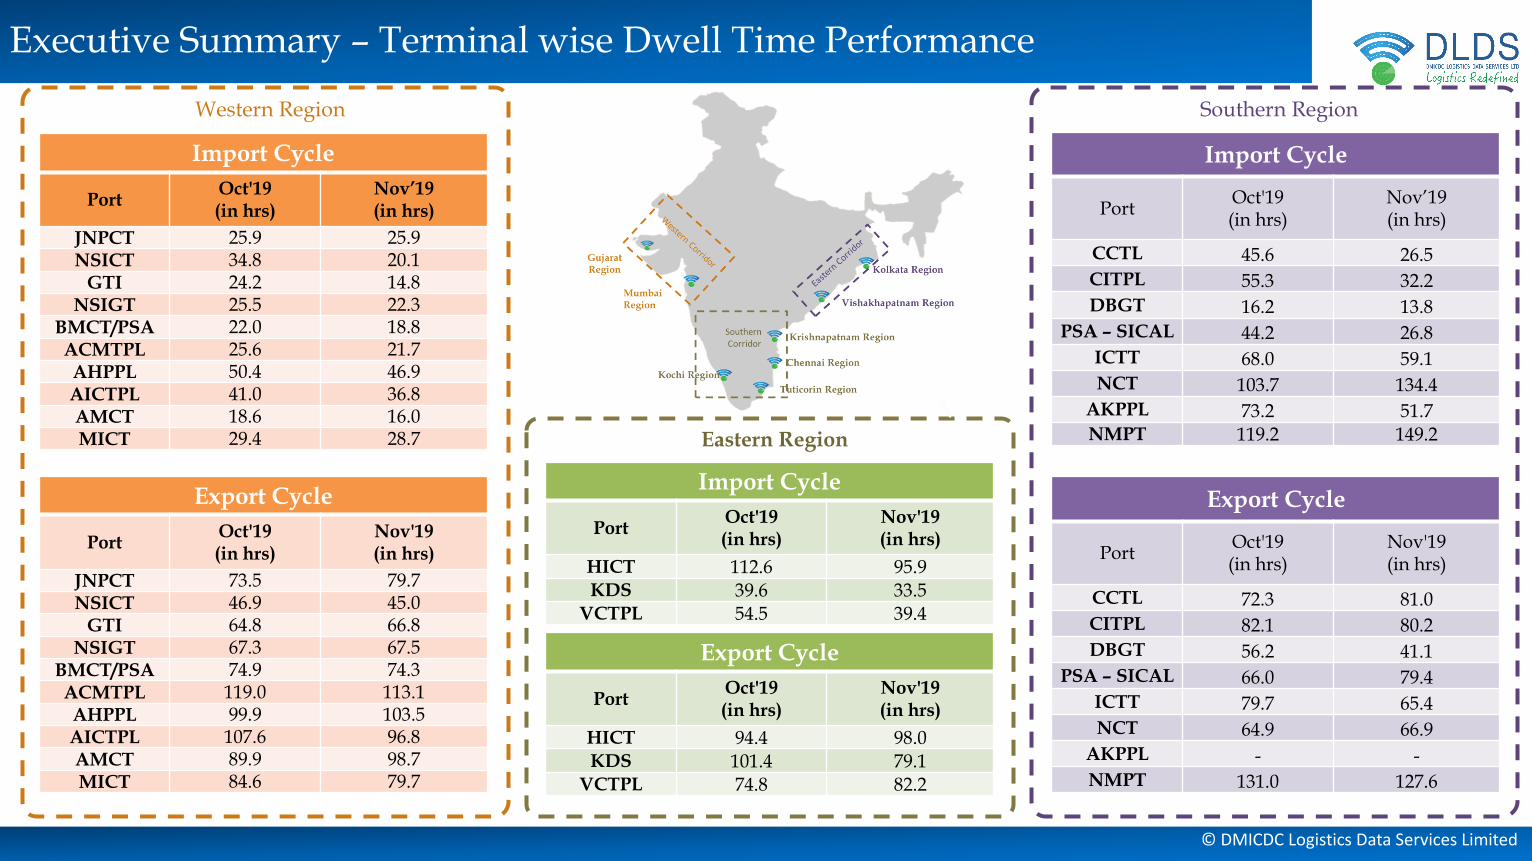
Western Region
Executive Summary – Terminal wise Dwell Time Performance
Import Cycle
PortOct'19(in hrs)
Nov’19(in hrs)
JNPCT 25.9 25.9NSICT 34.8 20.1
GTI 24.2 14.8NSIGT 25.5 22.3
BMCT/PSA 22.0 18.8ACMTPL 25.6 21.7AHPPL 50.4 46.9AICTPL 41.0 36.8AMCT 18.6 16.0MICT 29.4 28.7
Export Cycle
PortOct'19(in hrs)
Nov'19(in hrs)
JNPCT 73.5 79.7NSICT 46.9 45.0
GTI 64.8 66.8NSIGT 67.3 67.5
BMCT/PSA 74.9 74.3ACMTPL 119.0 113.1AHPPL 99.9 103.5AICTPL 107.6 96.8AMCT 89.9 98.7MICT 84.6 79.7
Import Cycle
PortOct'19(in hrs)
Nov'19(in hrs)
HICT 112.6 95.9KDS 39.6 33.5
VCTPL 54.5 39.4
Export Cycle
PortOct'19(in hrs)
Nov'19(in hrs)
HICT 94.4 98.0KDS 101.4 79.1
VCTPL 74.8 82.2
Southern Region
Eastern Region
Import Cycle
PortOct'19(in hrs)
Nov’19(in hrs)
CCTL 45.6 26.5
CITPL 55.3 32.2
DBGT 16.2 13.8
PSA – SICAL 44.2 26.8
ICTT 68.0 59.1
NCT 103.7 134.4
AKPPL 73.2 51.7NMPT 119.2 149.2
Export Cycle
PortOct'19(in hrs)
Nov'19(in hrs)
CCTL 72.3 81.0
CITPL 82.1 80.2
DBGT 56.2 41.1
PSA – SICAL 66.0 79.4
ICTT 79.7 65.4
NCT 64.9 66.9
AKPPL - -
NMPT 131.0 127.6
© DMICDC Logistics Data Services Limited
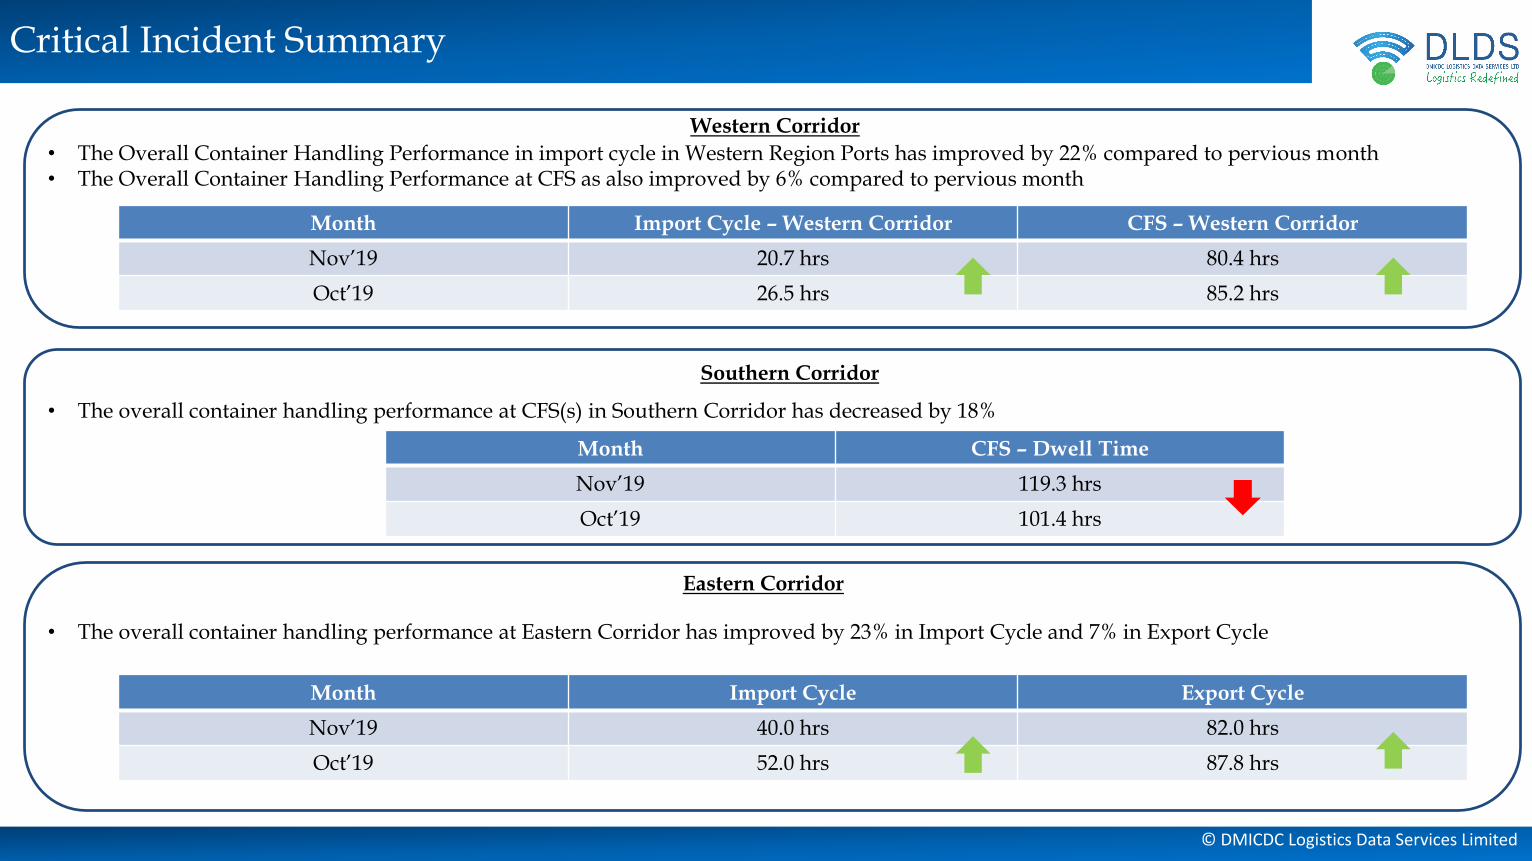
Critical Incident Summary
Eastern Corridor
Southern Corridor
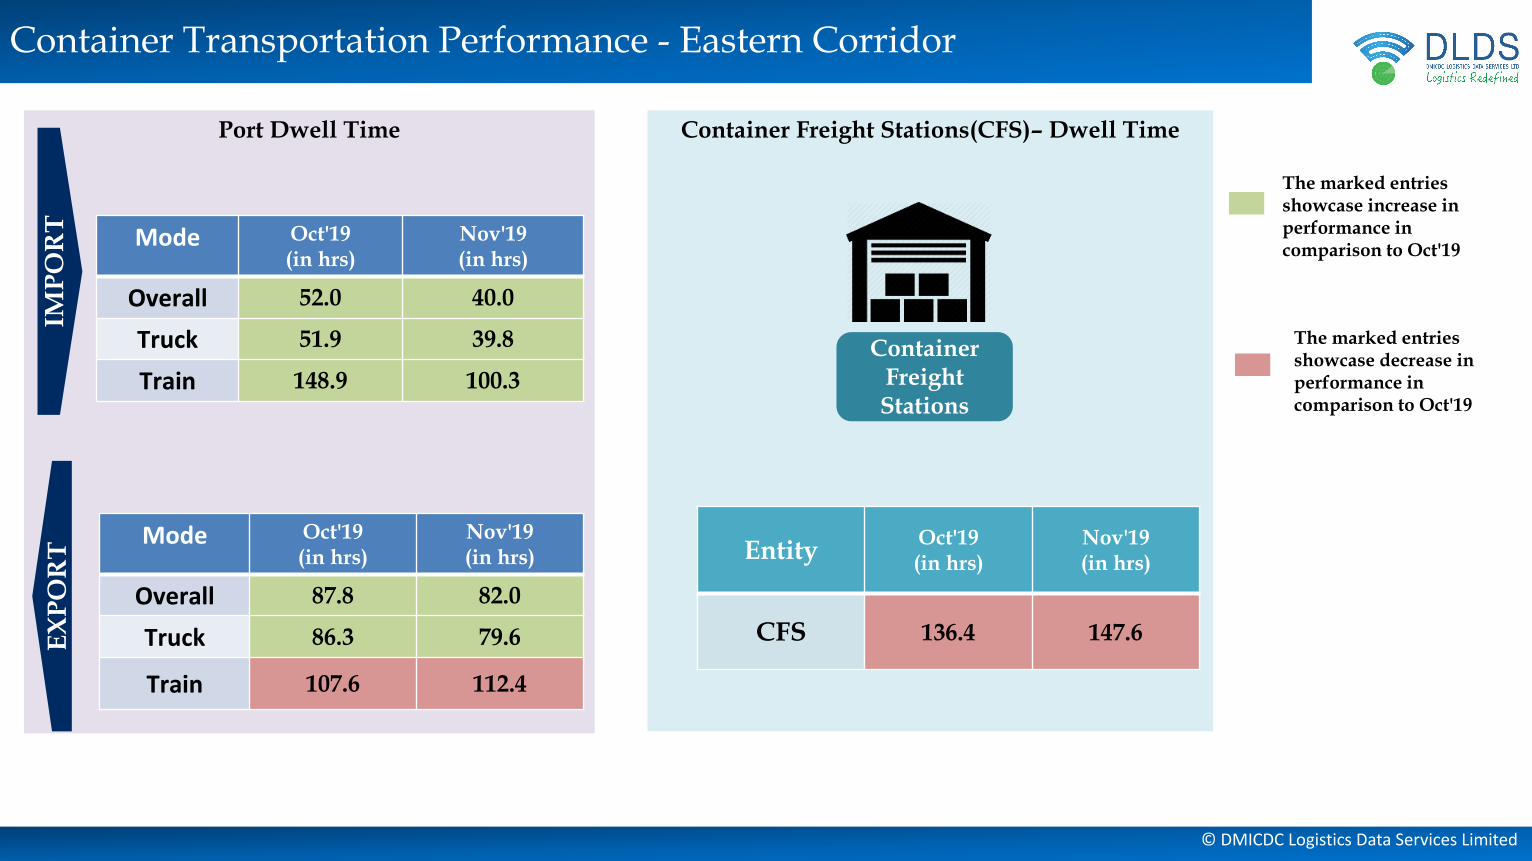
• The overall container handling performance at Eastern Corridor has improved by 23% in Import Cycle and 7% in Export Cycle
Month Import Cycle Export Cycle
Nov’19 40.0 hrs 82.0 hrs
Oct’19 52.0 hrs 87.8 hrs
• The overall container handling performance at CFS(s) in Southern Corridor has decreased by 18%
Month CFS – Dwell Time
Nov’19 119.3 hrs
Oct’19 101.4 hrs
Western Corridor
• The Overall Container Handling Performance in import cycle in Western Region Ports has improved by 22% compared to pervious month • The Overall Container Handling Performance at CFS as also improved by 6% compared to pervious month
Month Import Cycle – Western Corridor CFS – Western Corridor
Nov’19 20.7 hrs 80.4 hrs
Oct’19 26.5 hrs 85.2 hrs
© DMICDC Logistics Data Services Limited
Port Terminal Performance Index – Nov’19
ACMTTL
AHPPL
AICTAMCT
BMCT
CCTL
CITPL
DBGT
GTI
HICTICTTJNPCT
AKPPL
KDS
MICT
NCT
NSIGT
NSICT
PSA - SICAL
VCTPL
NMPT
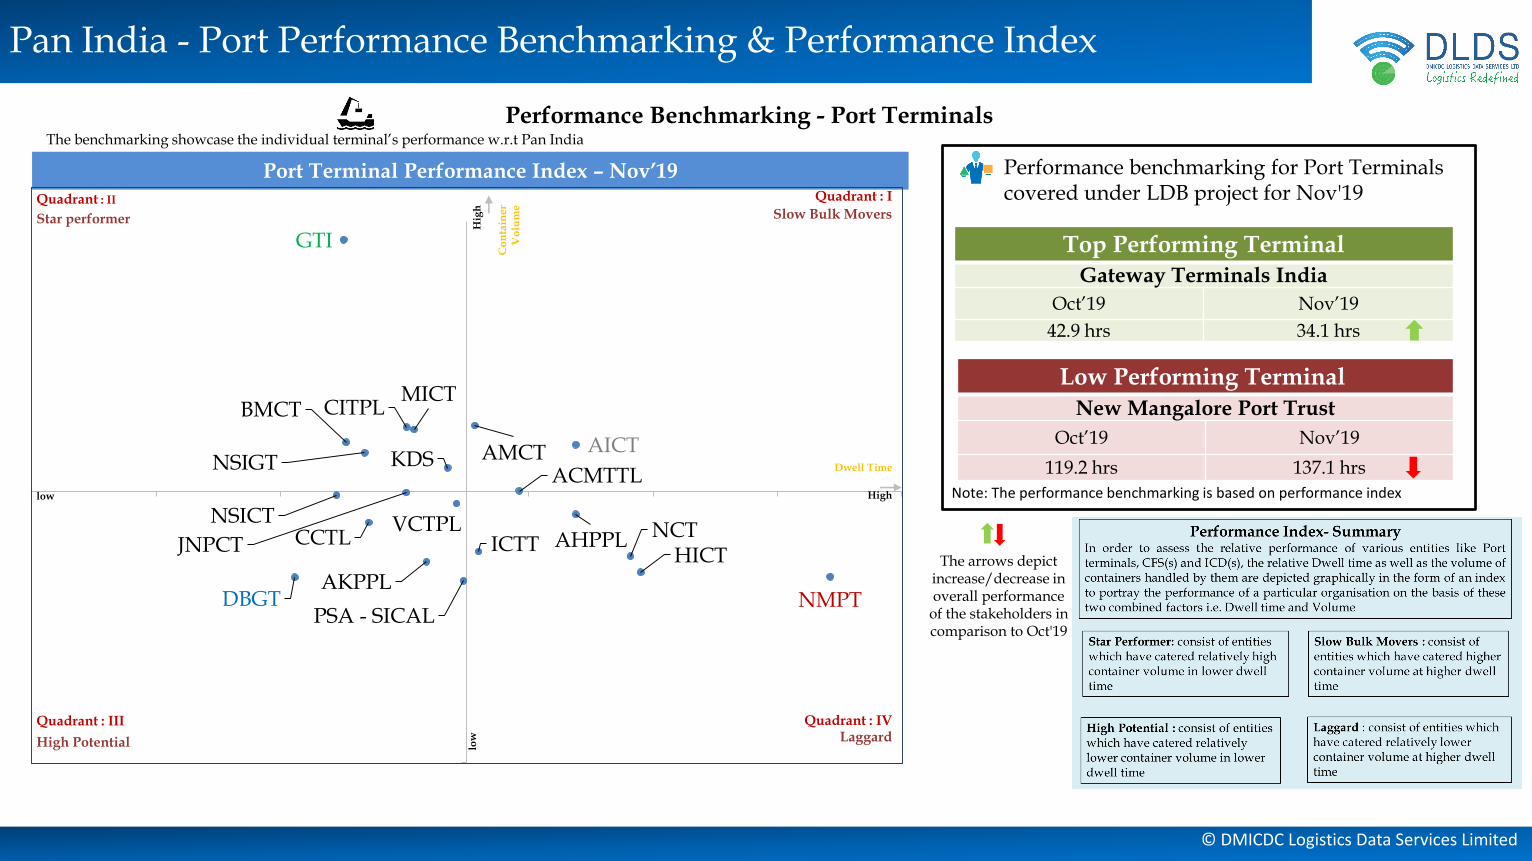
Pan India - Port Performance Benchmarking & Performance Index
Performance Benchmarking - Port Terminals
Performance benchmarking for Port Terminals covered under LDB project for Nov'19
Top Performing Terminal
Gateway Terminals India
Oct’19 Nov’19
42.9 hrs 34.1 hrs
Note: The performance benchmarking is based on performance index
Quadrant : IQuadrant : II
Quadrant : III Quadrant : IV
Dwell Time
Co
nta
ine
rV
olu
me
Highlow
low
Hig
h
Star performer
Laggard
Slow Bulk Movers
High Potential
The arrows depict increase/decrease in overall performance
of the stakeholders in comparison to Oct'19
Low Performing Terminal
New Mangalore Port Trust
Oct’19 Nov’19
119.2 hrs 137.1 hrs
The benchmarking showcase the individual terminal’s performance w.r.t Pan India
© DMICDC Logistics Data Services Limited
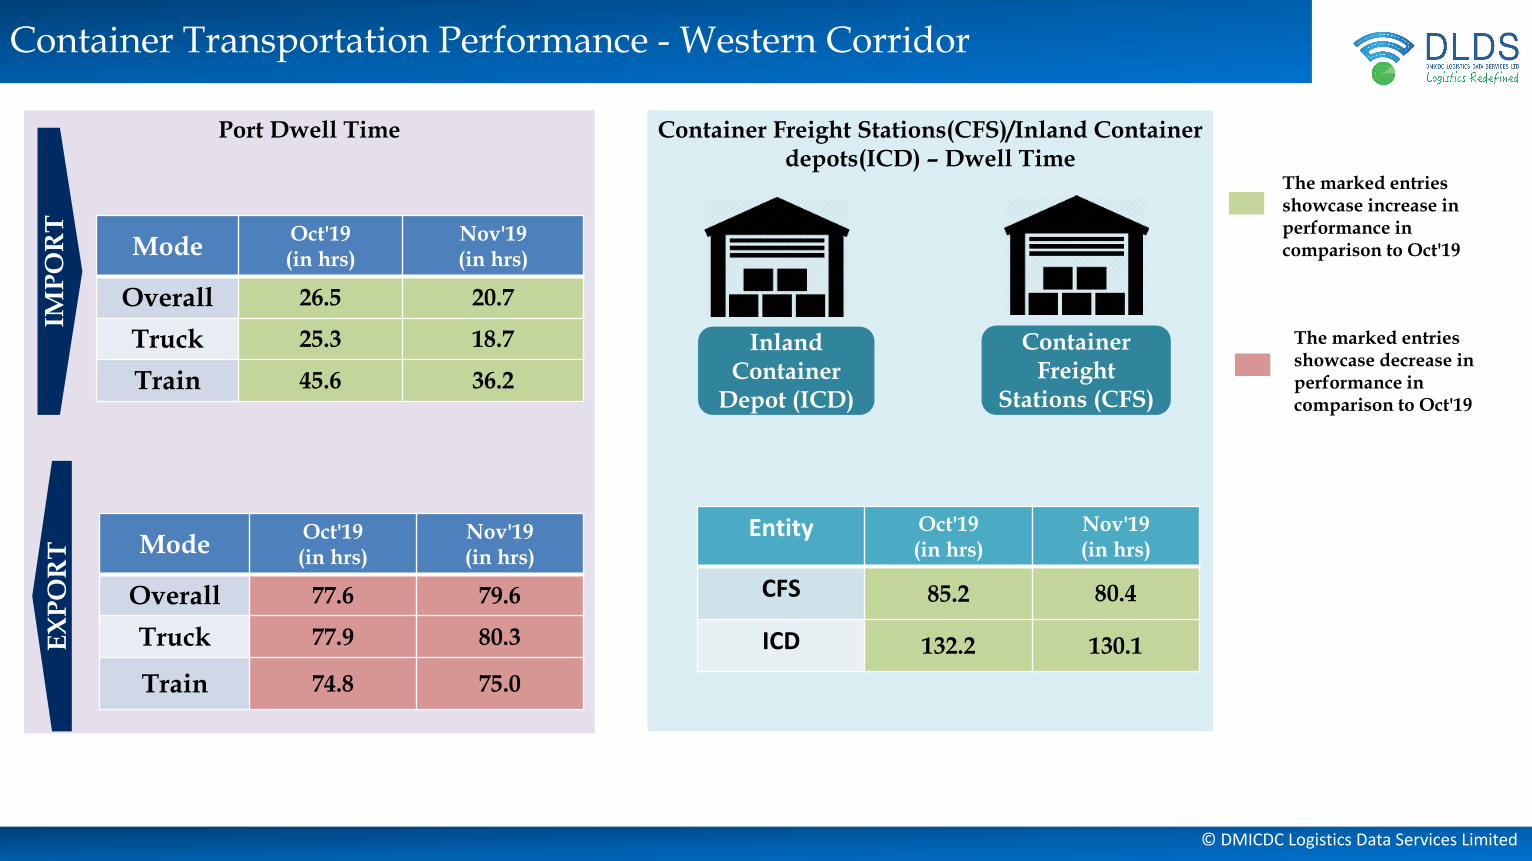
Container Transportation Performance - Western Corridor
Container Freight Stations(CFS)/Inland Container depots(ICD) – Dwell Time
Port Dwell Time
IMP
OR
TE
XP
OR
T
Inland Container
Depot (ICD)
ModeOct'19(in hrs)
Nov'19(in hrs)
Overall 77.6 79.6
Truck 77.9 80.3
Train 74.8 75.0
ModeOct'19(in hrs)
Nov'19(in hrs)
Overall 26.5 20.7
Truck 25.3 18.7
Train 45.6 36.2
Container Freight
Stations (CFS)
Entity Oct'19(in hrs)
Nov'19(in hrs)
CFS 85.2 80.4
ICD 132.2 130.1
The marked entries showcase increase in performance in comparison to Oct'19
The marked entries showcase decrease in performance in comparison to Oct'19
© DMICDC Logistics Data Services Limited
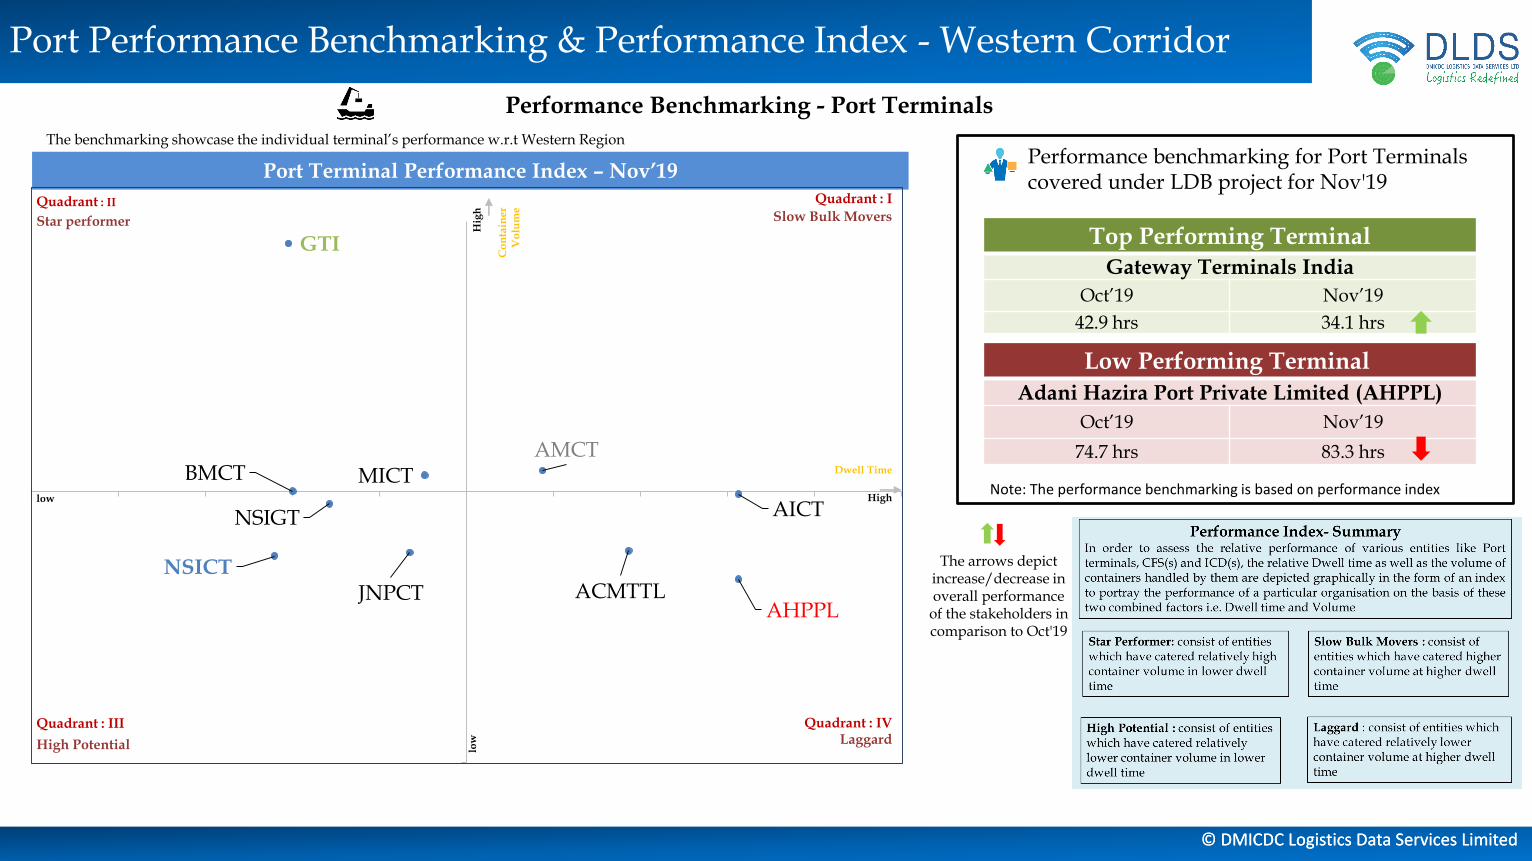
Port Performance Benchmarking & Performance Index - Western Corridor
© DMICDC Logistics Data Services Limited
Performance Benchmarking - Port Terminals
The arrows depict increase/decrease in overall performance
of the stakeholders in comparison to Oct'19
Performance benchmarking for Port Terminals covered under LDB project for Nov'19
Note: The performance benchmarking is based on performance index
Low Performing Terminal
Adani Hazira Port Private Limited (AHPPL)
Oct’19 Nov’19
74.7 hrs 83.3 hrs
Port Terminal Performance Index – Nov’19Quadrant : IQuadrant : II
Quadrant : III Quadrant : IV
Dwell Time
Co
nta
ine
rV
olu
me
Highlow
low
Hig
h
Star performer
Laggard
Slow Bulk Movers
High Potential
Top Performing Terminal
Gateway Terminals India
Oct’19 Nov’19
42.9 hrs 34.1 hrs
JNPCTNSICT
GTI
NSIGT
BMCT
AHPPL
AMCT
AICT
ACMTTL
MICT
The benchmarking showcase the individual terminal’s performance w.r.t Western Region
© DMICDC Logistics Data Services Limited
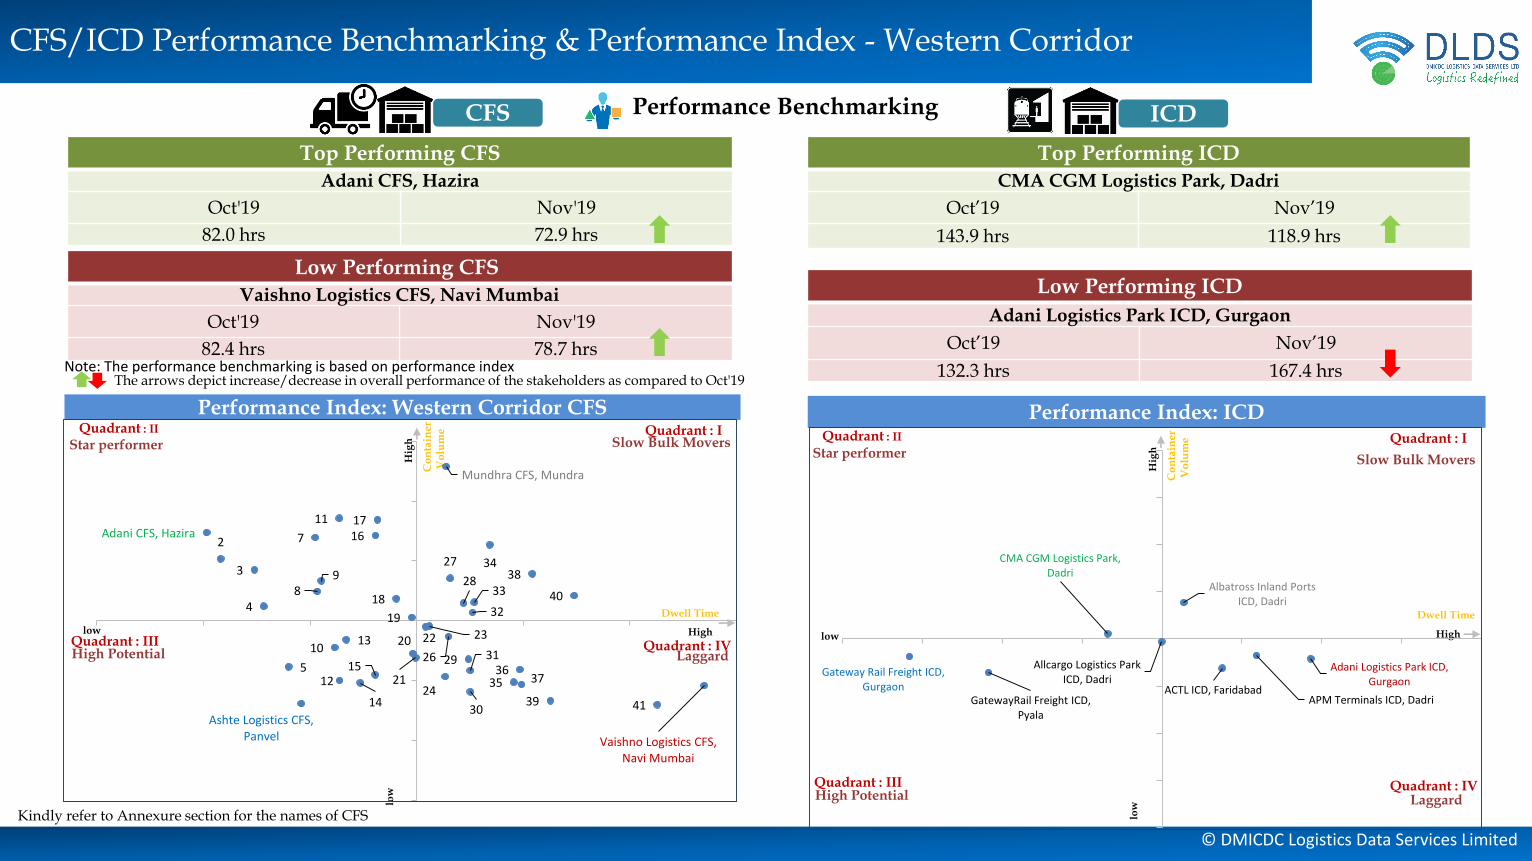
The arrows depict increase/decrease in overall performance of the stakeholders as compared to Oct'19
CFS/ICD Performance Benchmarking & Performance Index - Western Corridor
Low Performing CFS
Vaishno Logistics CFS, Navi Mumbai
Oct'19 Nov'19
82.4 hrs 78.7 hrs
Top Performing ICD
CMA CGM Logistics Park, Dadri
Oct’19 Nov’19
143.9 hrs 118.9 hrs
Low Performing ICD
Adani Logistics Park ICD, Gurgaon
Oct’19 Nov’19
132.3 hrs 167.4 hrsNote: The performance benchmarking is based on performance index
Performance BenchmarkingCFS ICD
Kindly refer to Annexure section for the names of CFS
Quadrant : IQuadrant : II
Quadrant : III Quadrant : IV
Performance Index: ICD
Dwell Time
Co
nta
ine
rV
olu
me
Highlow
low
Hig
hStar performer
Laggard
Slow Bulk Movers
High Potential
Quadrant : IQuadrant : II
Quadrant : III Quadrant : IV
Performance Index: Western Corridor CFS
Dwell Time
Co
nta
ine
rV
olu
me
Highlow
low
Hig
hStar performer
Laggard
Slow Bulk Movers
High Potential
Adani CFS, Hazira2
3
4
5
Ashte Logistics CFS, Panvel
7
89
10
11
12
13
14
15
1617
18
19
20
21
22 23
24
Mundhra CFS, Mundra
26
27
28
29
30
31
32
33
34
3536
37
38
39
40
41
Vaishno Logistics CFS, Navi Mumbai
Top Performing CFS
Adani CFS, Hazira
Oct'19 Nov'19
82.0 hrs 72.9 hrs
ACTL ICD, Faridabad
Adani Logistics Park ICD, Gurgaon
Albatross Inland Ports ICD, Dadri
Allcargo Logistics Park ICD, Dadri
APM Terminals ICD, Dadri
CMA CGM Logistics Park, Dadri
Gateway Rail Freight ICD, Gurgaon
GatewayRail Freight ICD, Pyala
© DMICDC Logistics Data Services Limited
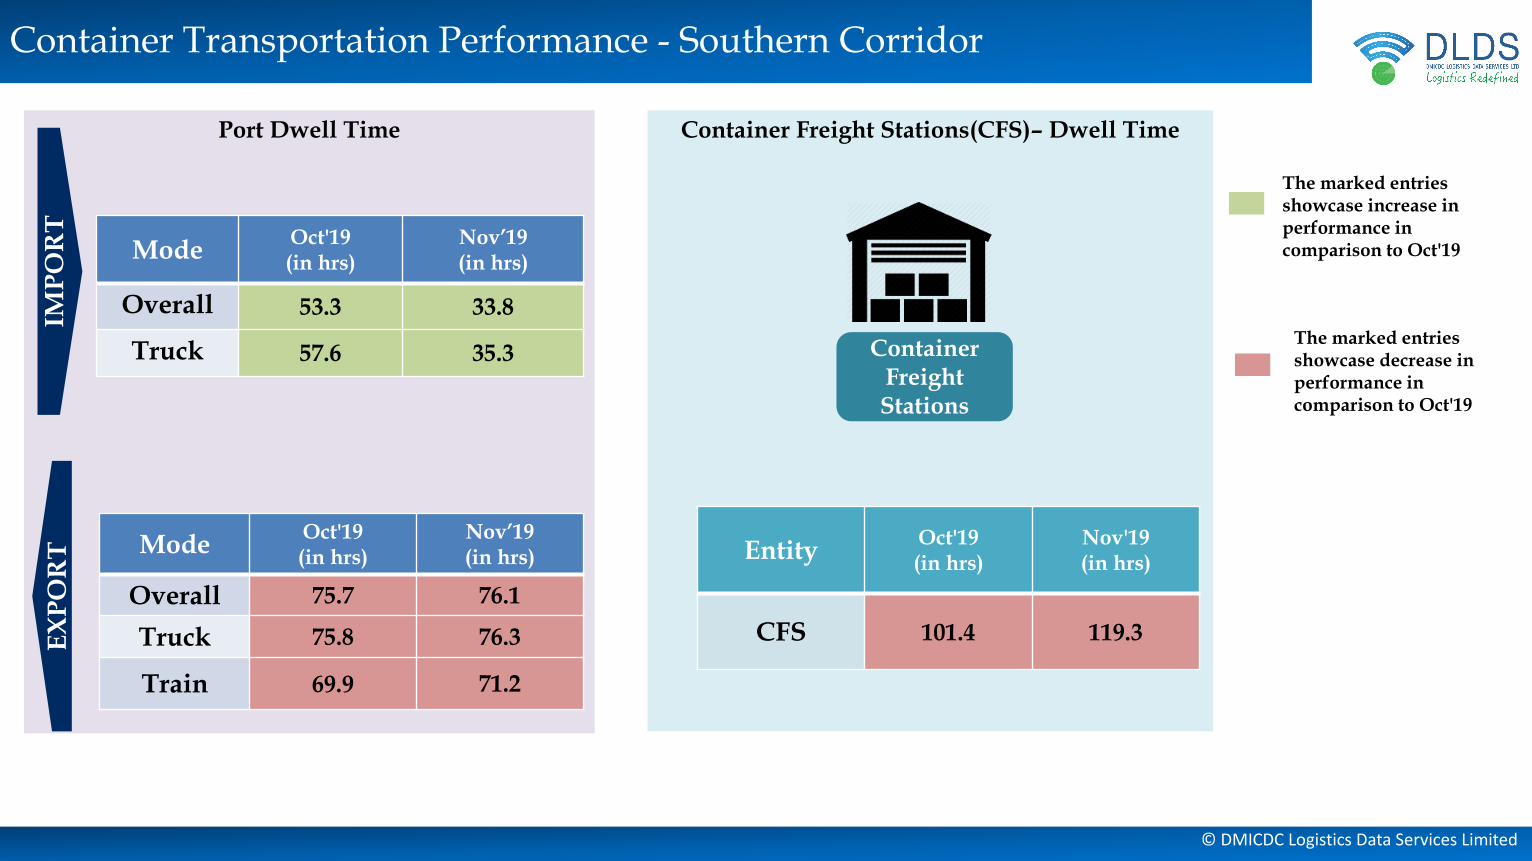
Container Transportation Performance - Southern Corridor
Container Freight Stations(CFS)– Dwell TimePort Dwell Time
IMP
OR
TE
XP
OR
T ModeOct'19(in hrs)
Nov’19(in hrs)
Overall 75.7 76.1
Truck 75.8 76.3
Train 69.9 71.2
ModeOct'19(in hrs)
Nov’19(in hrs)
Overall 53.3 33.8
Truck 57.6 35.3 Container Freight Stations
EntityOct'19(in hrs)
Nov'19(in hrs)
CFS 101.4 119.3
The marked entries showcase increase in performance in comparison to Oct'19
The marked entries showcase decrease in performance in comparison to Oct'19
© DMICDC Logistics Data Services Limited
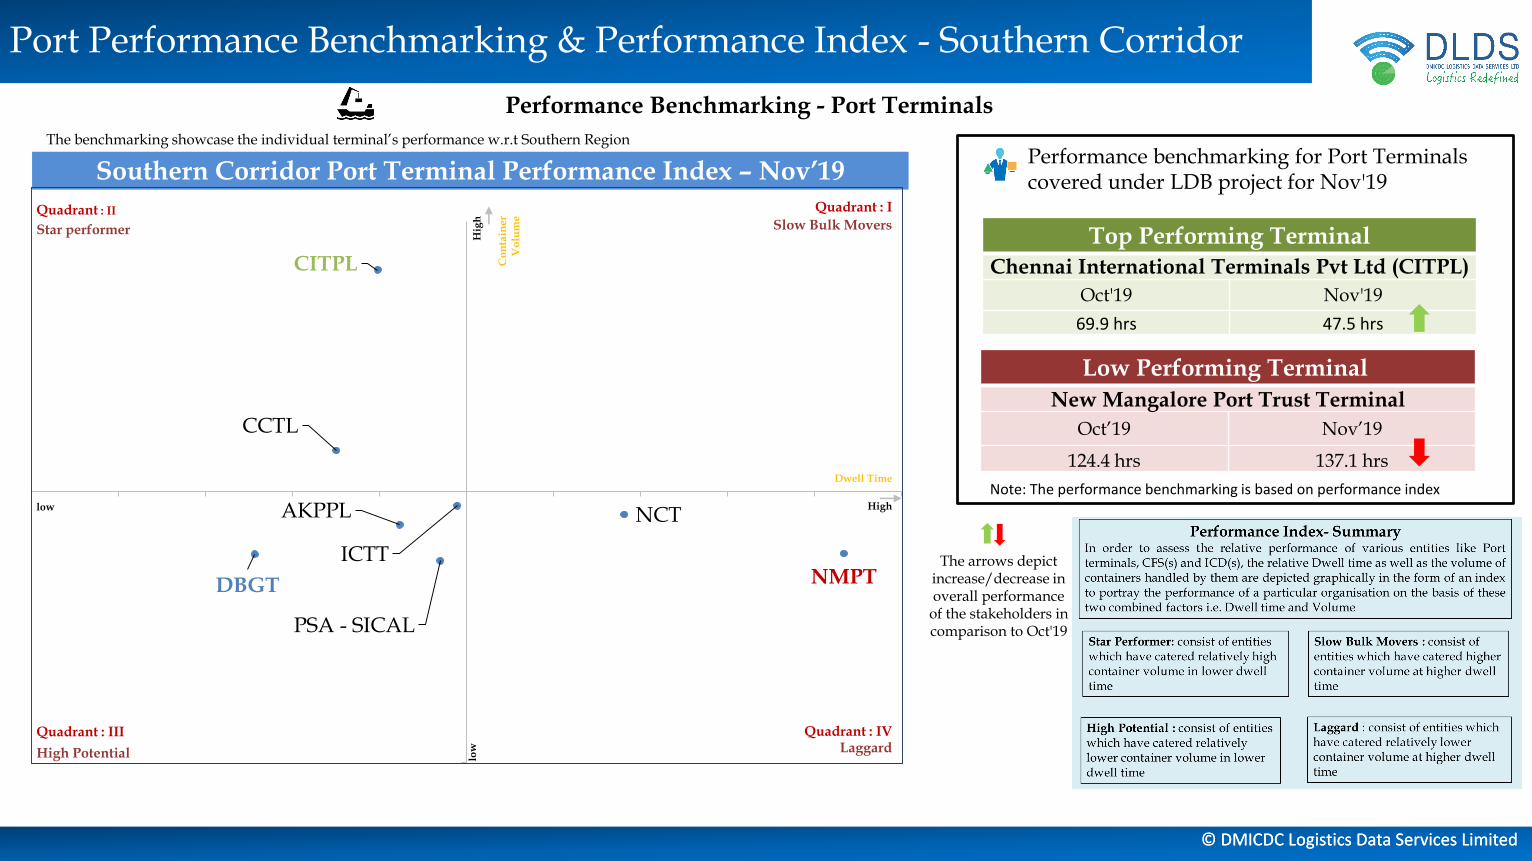
Port Performance Benchmarking & Performance Index - Southern Corridor
© DMICDC Logistics Data Services Limited
Performance Benchmarking - Port Terminals
Performance benchmarking for Port Terminals covered under LDB project for Nov'19Southern Corridor Port Terminal Performance Index – Nov’19
Quadrant : IQuadrant : II
Quadrant : III Quadrant : IV
Dwell Time
Co
nta
ine
rV
olu
me
Highlow
low
Hig
h
Star performer
Laggard
Slow Bulk Movers
High Potential
Top Performing Terminal
Chennai International Terminals Pvt Ltd (CITPL)
Oct'19 Nov'19
69.9 hrs 47.5 hrs
The arrows depict increase/decrease in overall performance
of the stakeholders in comparison to Oct'19
Note: The performance benchmarking is based on performance index
Low Performing Terminal
New Mangalore Port Trust Terminal
Oct’19 Nov’19
124.4 hrs 137.1 hrs
CCTL
CITPL
DBGT
PSA - SICAL
ICTT
NCT AKPPL
NMPT
The benchmarking showcase the individual terminal’s performance w.r.t Southern Region
© DMICDC Logistics Data Services Limited
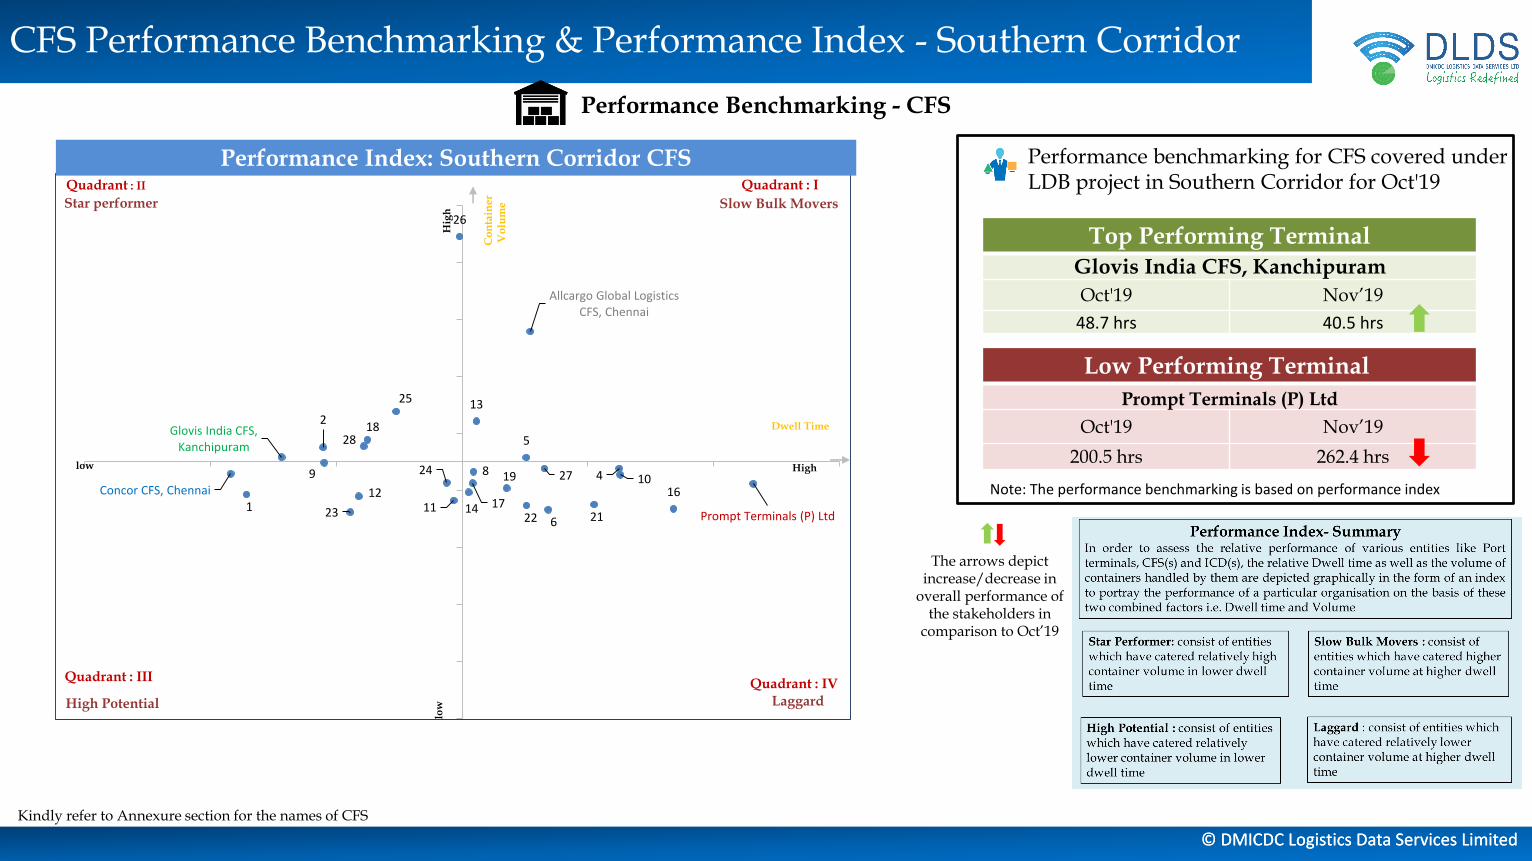
CFS Performance Benchmarking & Performance Index - Southern Corridor
© DMICDC Logistics Data Services Limited
Performance benchmarking for CFS covered under LDB project in Southern Corridor for Oct'19
Performance Benchmarking - CFS
Kindly refer to Annexure section for the names of CFS
1
2
Allcargo Global Logistics CFS, Chennai
4
5
6
Concor CFS, Chennai
89 10
1112
13
14
Glovis India CFS, Kanchipuram
1617
18
19
Prompt Terminals (P) Ltd212223
24
25
26
27
28
Quadrant : IQuadrant : II
Quadrant : IIIQuadrant : IV
Performance Index: Southern Corridor CFS
Dwell Time
Co
nta
ine
rV
olu
me
Highlow
low
Hig
h
Star performer
Laggard
Slow Bulk Movers
High Potential
Top Performing Terminal
Glovis India CFS, Kanchipuram
Oct'19 Nov’19
48.7 hrs 40.5 hrs
Low Performing Terminal
Prompt Terminals (P) Ltd
Oct'19 Nov’19
200.5 hrs 262.4 hrs
Note: The performance benchmarking is based on performance index
The arrows depict increase/decrease in
overall performance of the stakeholders in
comparison to Oct’19
© DMICDC Logistics Data Services Limited
Container Transportation Performance - Eastern Corridor
Container Freight Stations(CFS)– Dwell TimePort Dwell Time
IMP
OR
TE
XP
OR
T
Mode Oct'19(in hrs)
Nov'19(in hrs)
Overall 87.8 82.0
Truck 86.3 79.6
Train 107.6 112.4
Container Freight Stations
EntityOct'19(in hrs)
Nov'19(in hrs)
CFS 136.4 147.6
The marked entries showcase increase in performance in comparison to Oct'19
The marked entries showcase decrease in performance in comparison to Oct'19
Mode Oct'19(in hrs)
Nov'19(in hrs)
Overall 52.0 40.0
Truck 51.9 39.8
Train 148.9 100.3
© DMICDC Logistics Data Services Limited
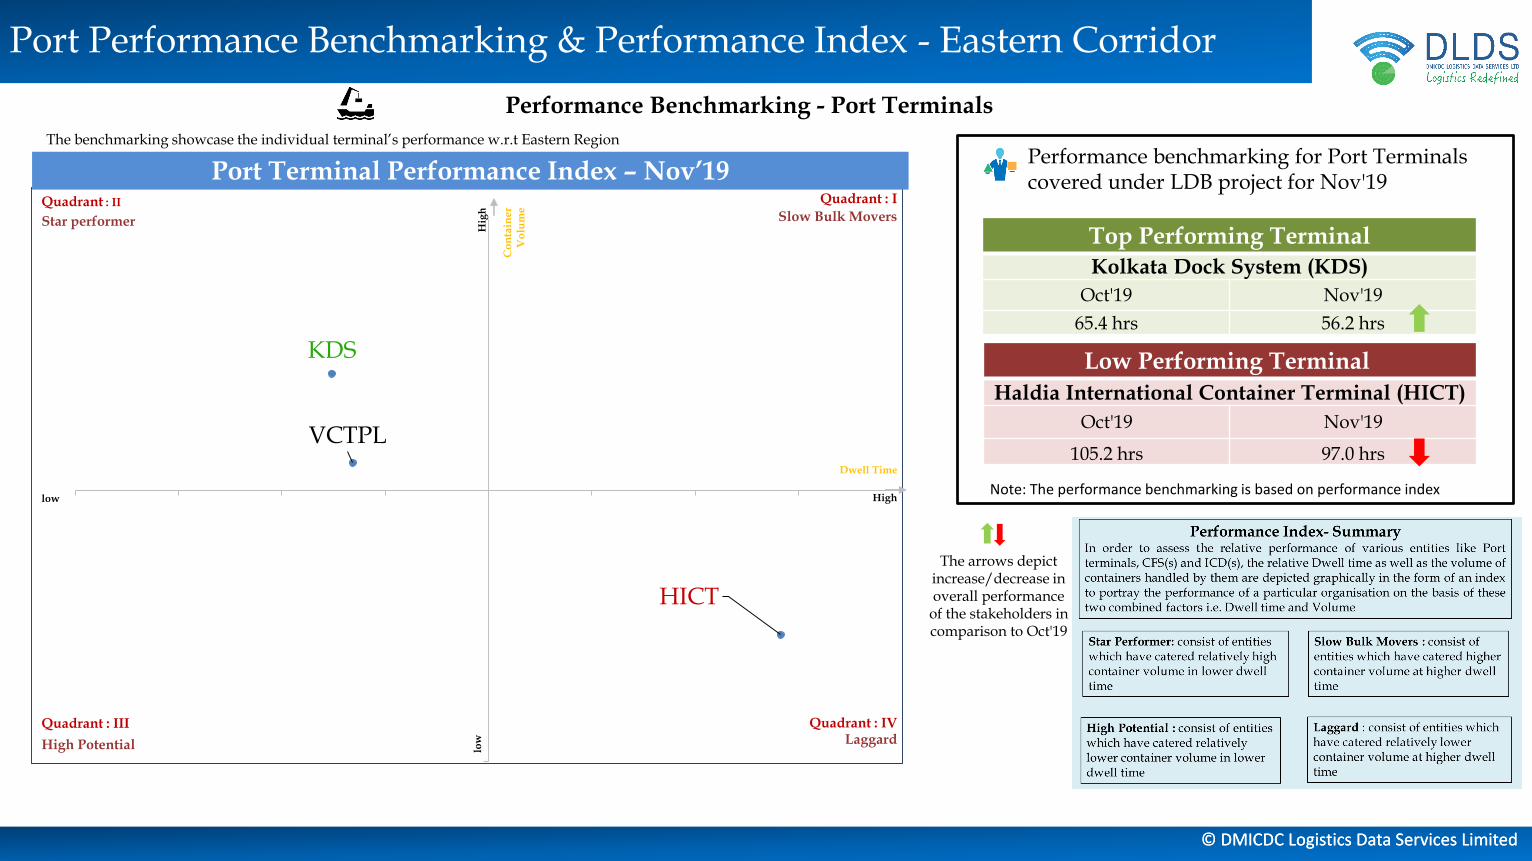
Port Performance Benchmarking & Performance Index - Eastern Corridor
© DMICDC Logistics Data Services Limited
Performance Benchmarking - Port Terminals
The arrows depict increase/decrease in overall performance
of the stakeholders in comparison to Oct'19
Performance benchmarking for Port Terminals covered under LDB project for Nov'19
Top Performing Terminal
Kolkata Dock System (KDS)
Oct'19 Nov'19
65.4 hrs 56.2 hrs
Note: The performance benchmarking is based on performance index
Low Performing Terminal
Haldia International Container Terminal (HICT)
Oct'19 Nov'19
105.2 hrs 97.0 hrsVCTPL
KDS
HICT
Port Terminal Performance Index – Nov’19Quadrant : IQuadrant : II
Quadrant : III Quadrant : IV
Dwell Time
Co
nta
ine
rV
olu
me
Highlow
low
Hig
h
Star performer
Laggard
Slow Bulk Movers
High Potential
The benchmarking showcase the individual terminal’s performance w.r.t Eastern Region
© DMICDC Logistics Data Services Limited
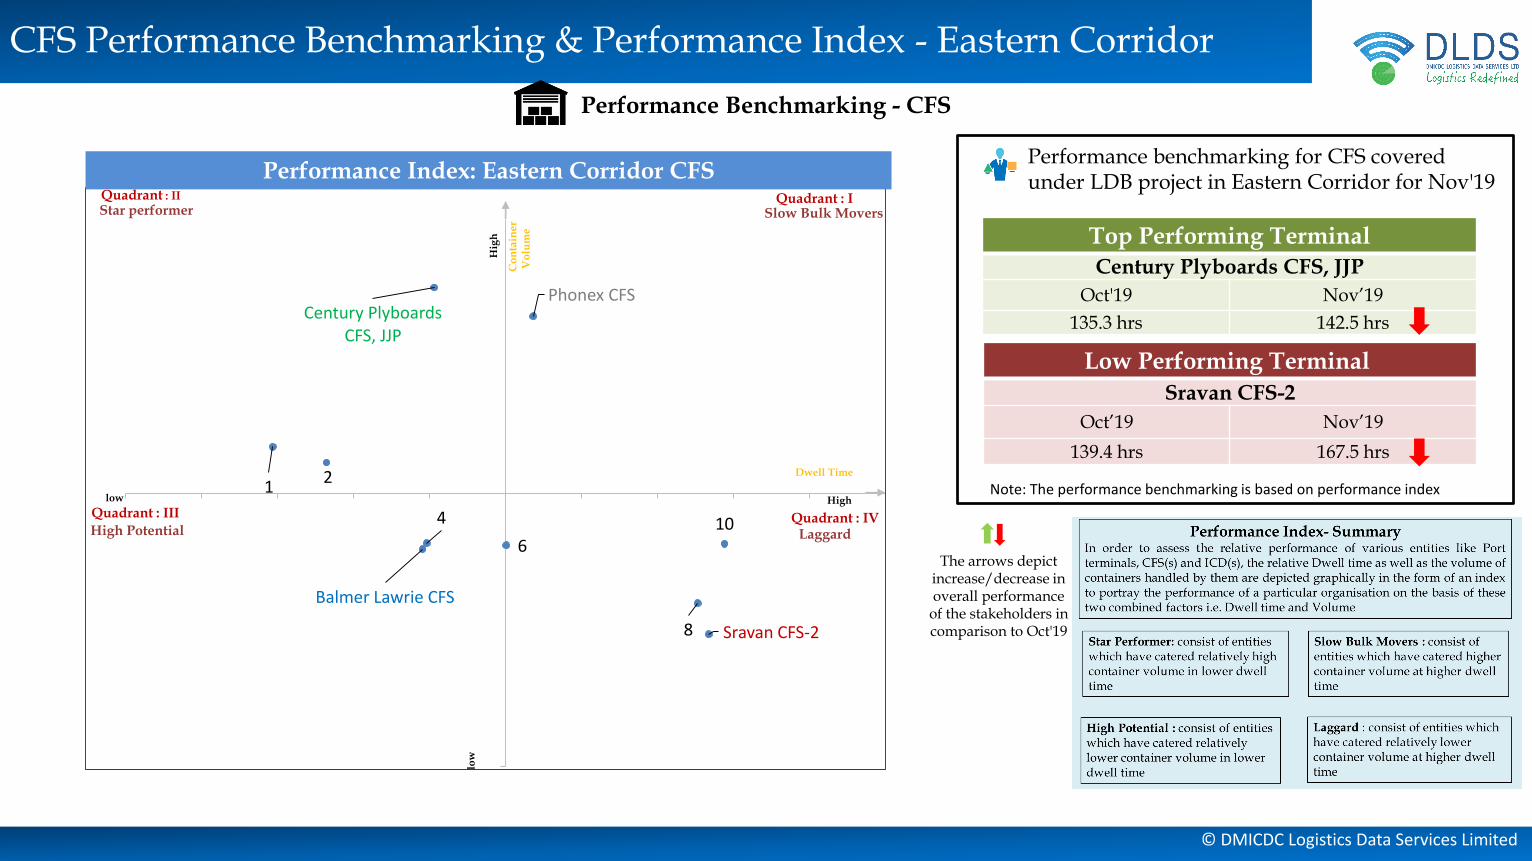
CFS Performance Benchmarking & Performance Index - Eastern Corridor
Performance Benchmarking - CFS
Performance benchmarking for CFS covered under LDB project in Eastern Corridor for Nov'19
12
Balmer Lawrie CFS
4
Century Plyboards CFS, JJP
6
Phonex CFS
8 Sravan CFS-2
10
Quadrant : IQuadrant : II
Quadrant : III Quadrant : IV
Performance Index: Eastern Corridor CFS
Dwell Time
Co
nta
ine
rV
olu
me
Highlow
low
Hig
h
Star performer
Laggard
Slow Bulk Movers
High Potential
Top Performing Terminal
Century Plyboards CFS, JJP
Oct'19 Nov’19
135.3 hrs 142.5 hrs
Low Performing Terminal
Sravan CFS-2
Oct’19 Nov’19
139.4 hrs 167.5 hrs
Note: The performance benchmarking is based on performance index
The arrows depict increase/decrease in overall performance
of the stakeholders in comparison to Oct'19

© DMICDC Logistics Data Services Limited
Annexure
© DMICDC Logistics Data Services Limited
Individual Terminal Performance In Southern Corridor
© DMICDC Logistics Data Services Limited
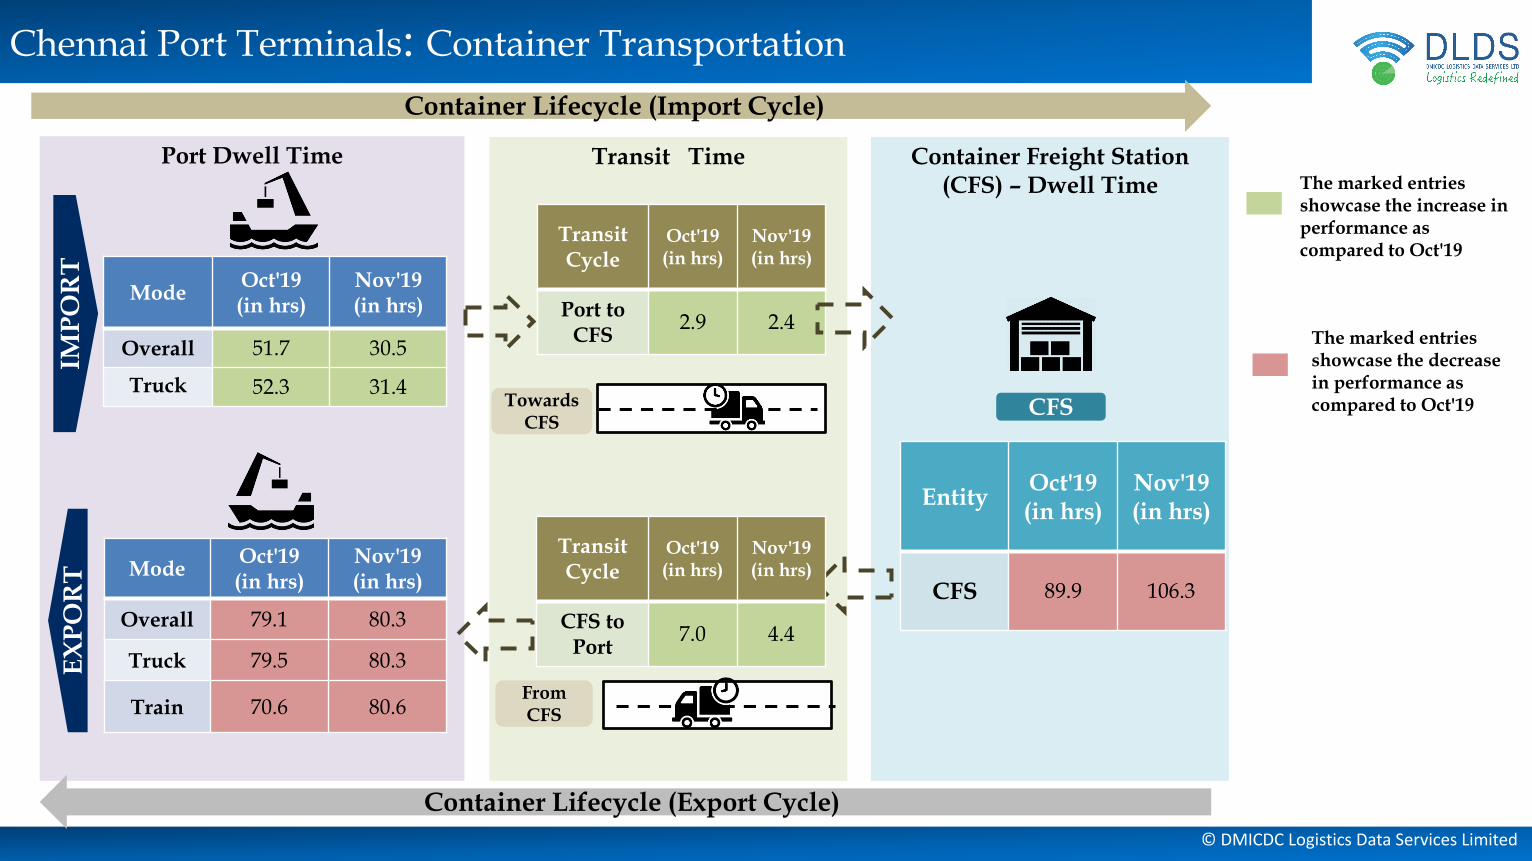
Chennai Port Terminals: Container Transportation
Container Freight Station (CFS) – Dwell Time
Transit TimePort Dwell Time
IMP
OR
TE
XP
OR
T ModeOct'19(in hrs)
Nov'19(in hrs)
Overall 79.1 80.3
Truck 79.5 80.3
Train 70.6 80.6
ModeOct'19(in hrs)
Nov'19(in hrs)
Overall 51.7 30.5
Truck 52.3 31.4Towards
CFS
From CFS
CFS
Transit Cycle
Oct'19(in hrs)
Nov'19(in hrs)
Port to CFS
2.9 2.4
EntityOct'19(in hrs)
Nov'19(in hrs)
CFS 89.9 106.3
Container Lifecycle (Import Cycle)
Container Lifecycle (Export Cycle)
The marked entries showcase the increase in performance as compared to Oct'19
The marked entries showcase the decrease in performance as compared to Oct'19
Transit Cycle
Oct'19(in hrs)
Nov'19(in hrs)
CFS to Port
7.0 4.4
© DMICDC Logistics Data Services Limited
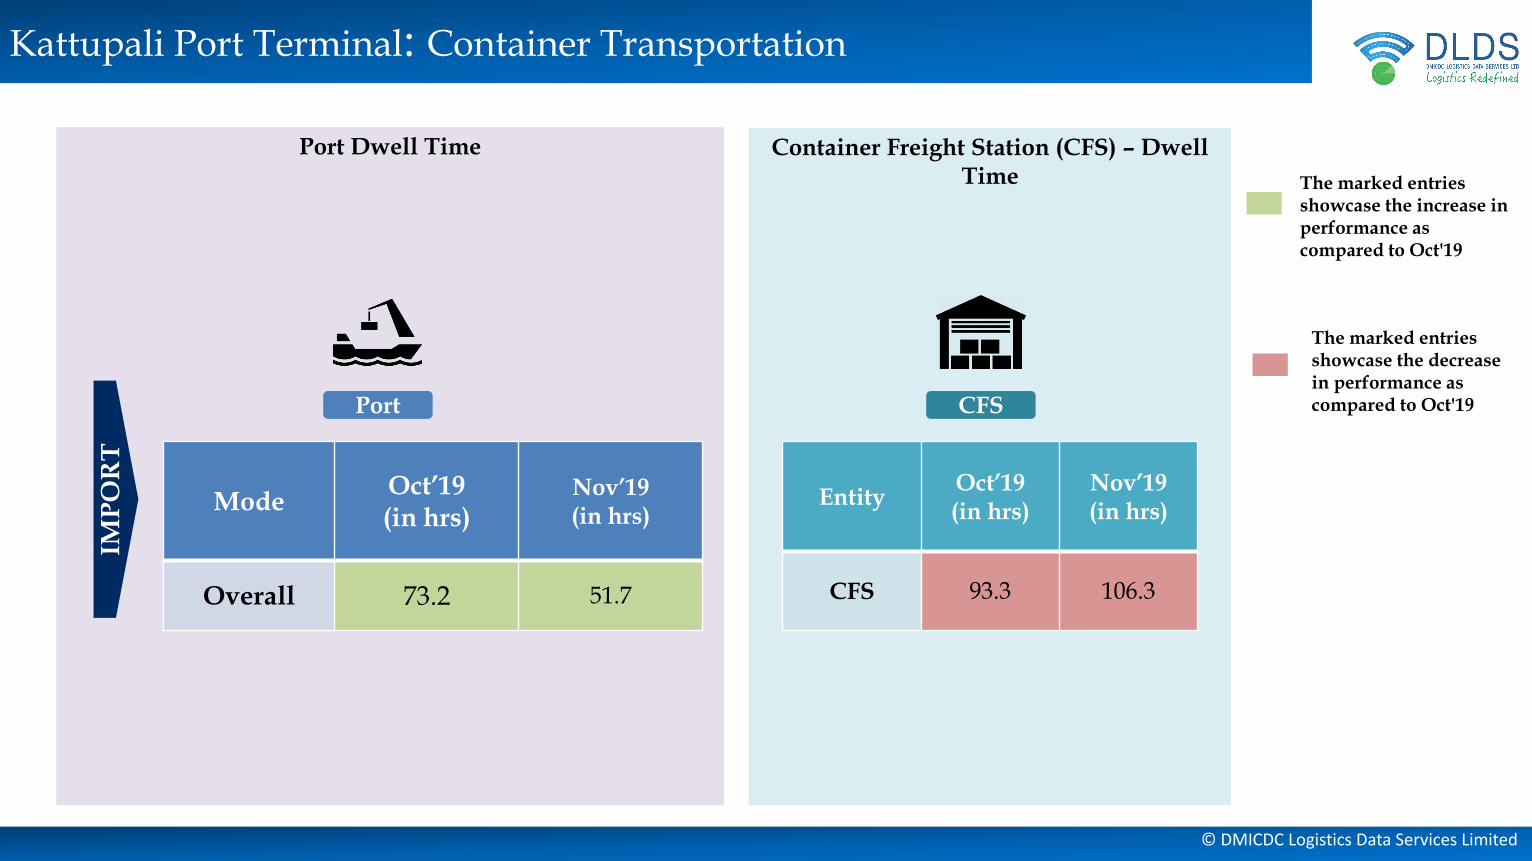
Kattupali Port Terminal: Container Transportation
Container Freight Station (CFS) – Dwell Time
Port Dwell Time
IMP
OR
T
ModeOct’19(in hrs)
Nov’19(in hrs)
Overall 73.2 51.7
CFS
EntityOct’19(in hrs)
Nov’19(in hrs)
CFS 93.3 106.3
The marked entries showcase the increase in performance as compared to Oct'19
The marked entries showcase the decrease in performance as compared to Oct'19Port
© DMICDC Logistics Data Services Limited
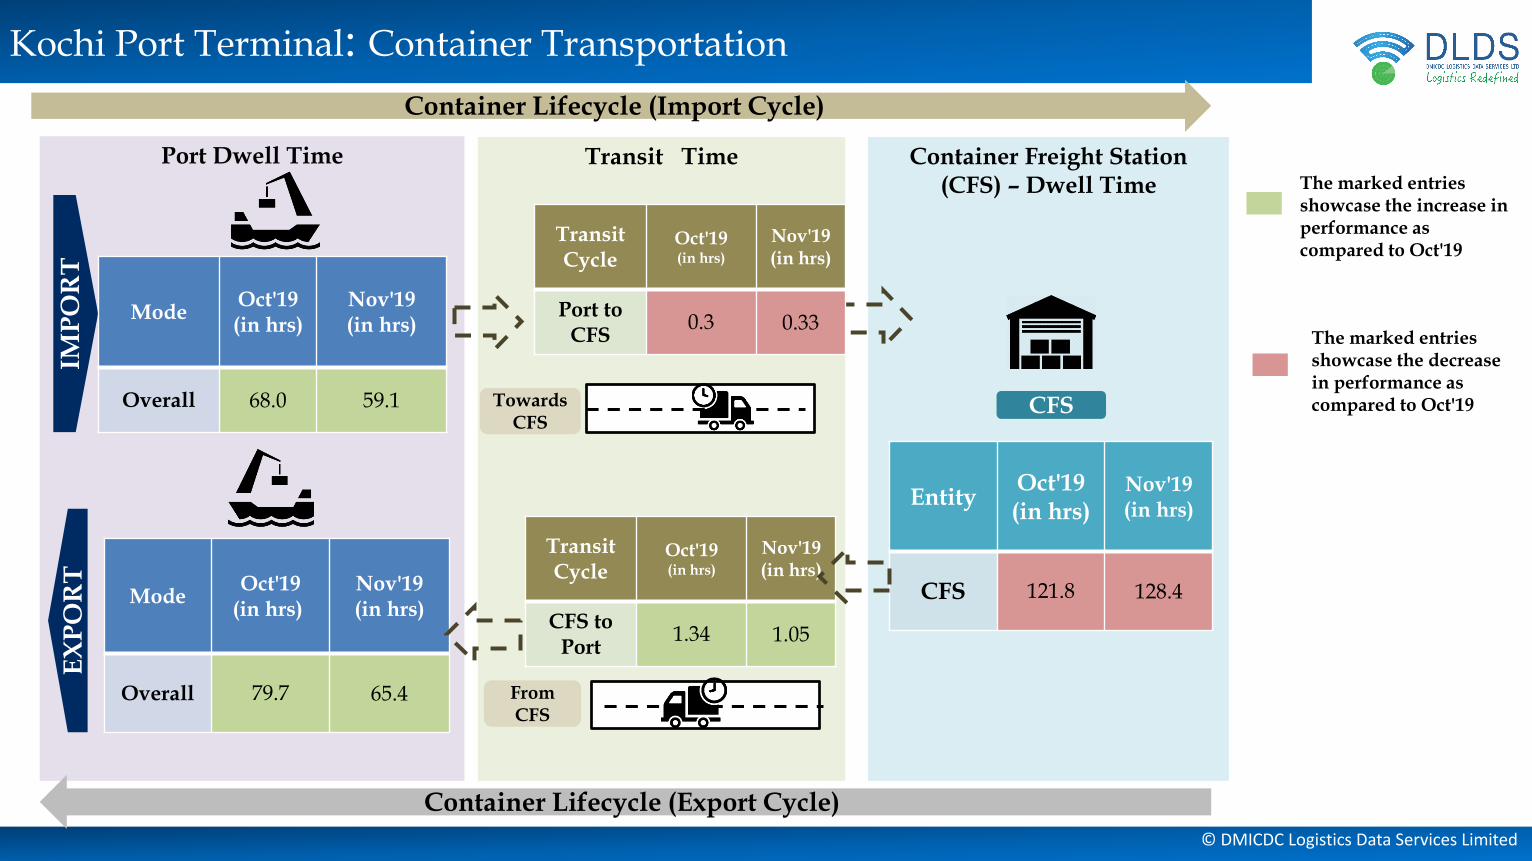
Container Freight Station (CFS) – Dwell Time
Kochi Port Terminal: Container Transportation
Port Dwell Time
IMP
OR
TE
XP
OR
T
ModeOct'19
(in hrs)Nov'19(in hrs)
Overall 79.7 65.4
ModeOct'19(in hrs)
Nov'19(in hrs)
Overall 68.0 59.1 CFS
Container Lifecycle (Import Cycle)
Container Lifecycle (Export Cycle)
The marked entries showcase the increase in performance as compared to Oct'19
The marked entries showcase the decrease in performance as compared to Oct'19
Transit Time
Towards CFS
From CFS
Transit Cycle
Oct'19(in hrs)
Nov'19(in hrs)
Port to CFS
0.3 0.33
Transit Cycle
Oct'19(in hrs)
Nov'19(in hrs)
CFS to Port
1.34 1.05
EntityOct'19(in hrs)
Nov'19(in hrs)
CFS 121.8 128.4
© DMICDC Logistics Data Services Limited
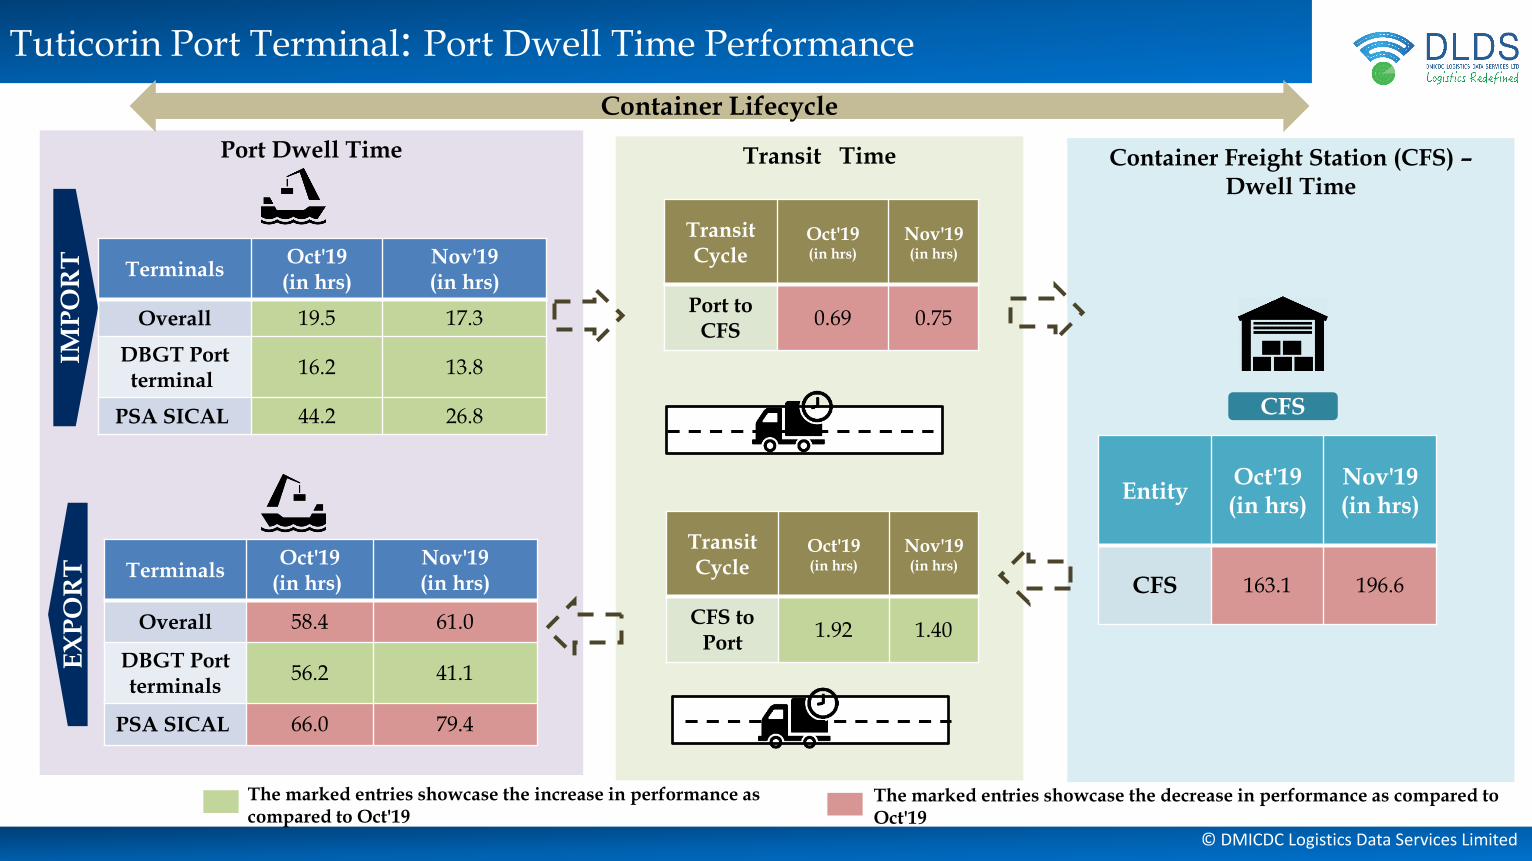
Tuticorin Port Terminal: Port Dwell Time Performance
Port Dwell Time
IMP
OR
TE
XP
OR
T TerminalsOct'19
(in hrs)Nov'19(in hrs)
Overall 58.4 61.0
DBGT Port terminals
56.2 41.1
PSA SICAL 66.0 79.4
TerminalsOct'19(in hrs)
Nov'19(in hrs)
Overall 19.5 17.3
DBGT Port terminal
16.2 13.8
PSA SICAL 44.2 26.8
The marked entries showcase the increase in performance as compared to Oct'19
The marked entries showcase the decrease in performance as compared to Oct'19
Transit Time Container Freight Station (CFS) –Dwell Time
CFS
Transit Cycle
Oct'19(in hrs)
Nov'19(in hrs)
Port to CFS
0.69 0.75
Transit Cycle
Oct'19(in hrs)
Nov'19(in hrs)
CFS to Port
1.92 1.40
EntityOct'19(in hrs)
Nov'19(in hrs)
CFS 163.1 196.6
Container Lifecycle
© DMICDC Logistics Data Services Limited
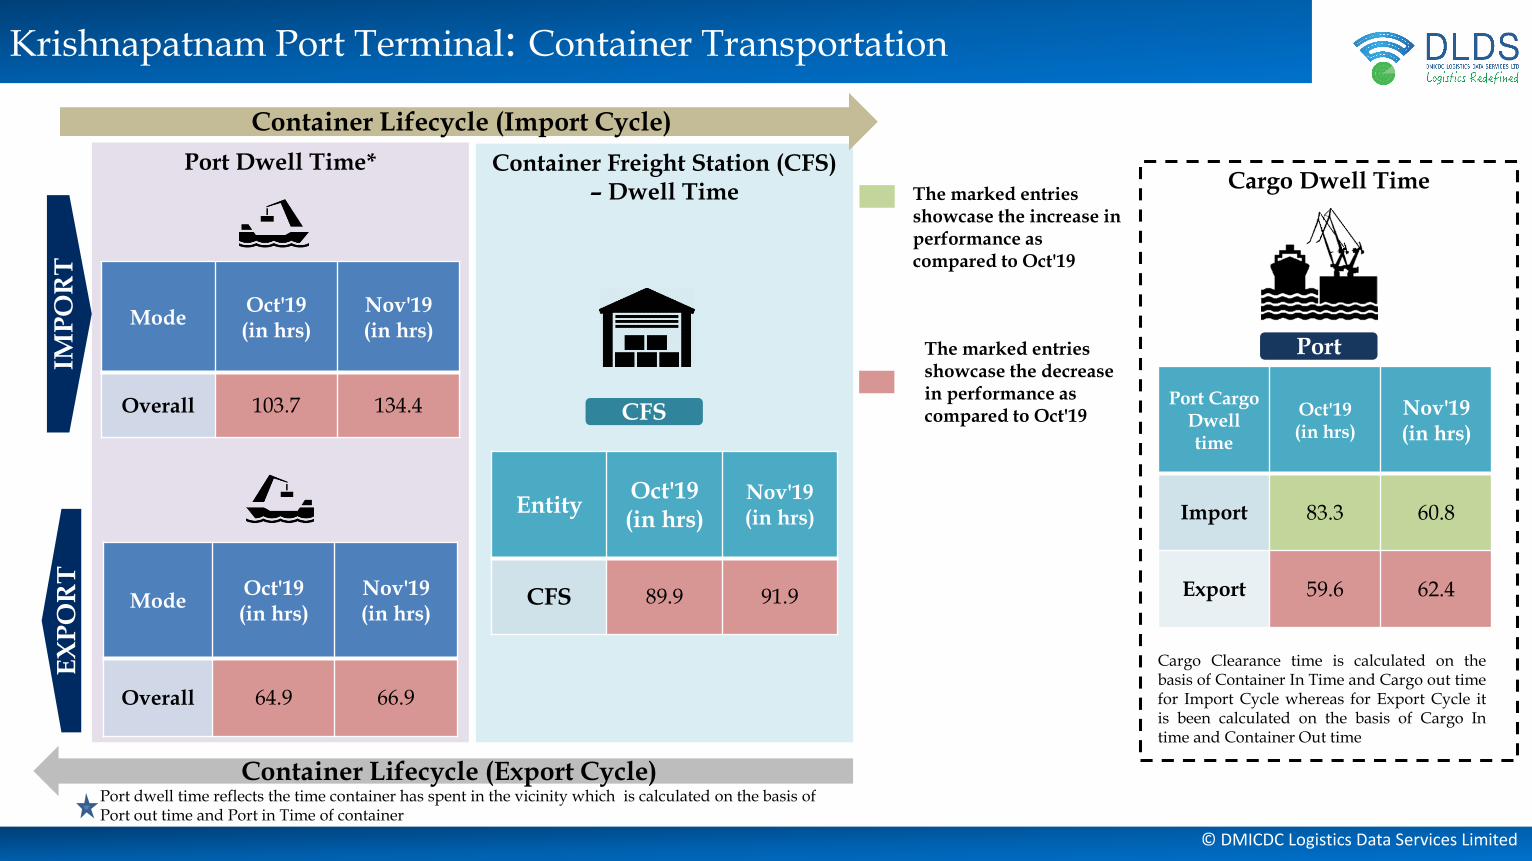
Krishnapatnam Port Terminal: Container Transportation
Container Freight Station (CFS) – Dwell Time
Port Dwell Time*
CFS
Container Lifecycle (Import Cycle)
Container Lifecycle (Export Cycle)
The marked entries showcase the increase in performance as compared to Oct'19
The marked entries showcase the decrease in performance as compared to Oct'19
ModeOct'19(in hrs)
Nov'19(in hrs)
Overall 64.9 66.9
ModeOct'19(in hrs)
Nov'19(in hrs)
Overall 103.7 134.4
EntityOct'19(in hrs)
Nov'19(in hrs)
CFS 89.9 91.9
Cargo Dwell Time
Port
Port Cargo Dwell time
Oct'19(in hrs)
Nov'19(in hrs)
Import 83.3 60.8
Export 59.6 62.4
IMP
OR
TE
XP
OR
T
Port dwell time reflects the time container has spent in the vicinity which is calculated on the basis of Port out time and Port in Time of container
Cargo Clearance time is calculated on thebasis of Container In Time and Cargo out timefor Import Cycle whereas for Export Cycle itis been calculated on the basis of Cargo Intime and Container Out time
© DMICDC Logistics Data Services Limited
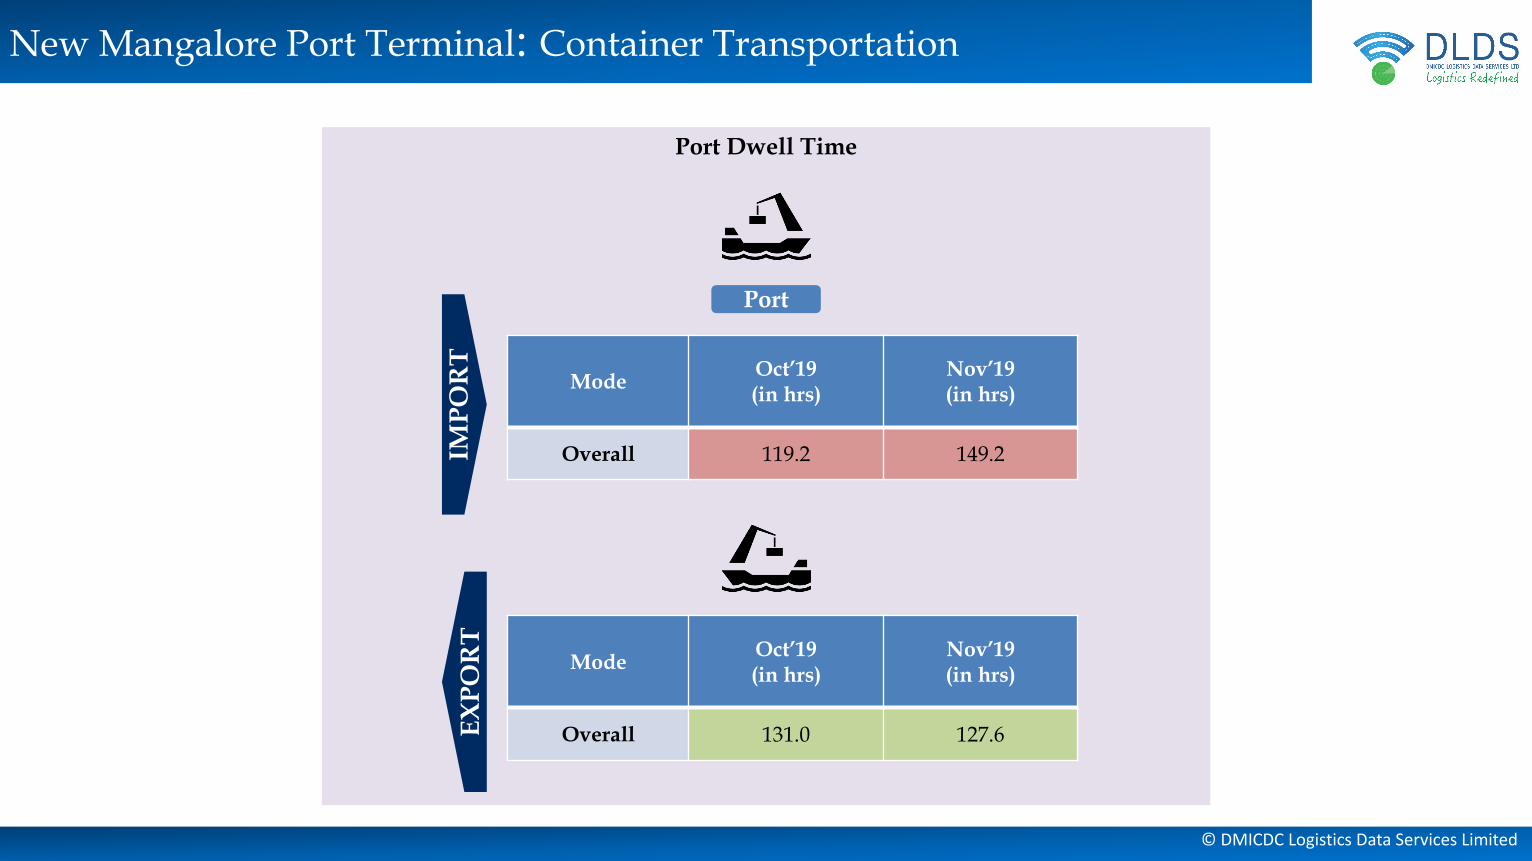
New Mangalore Port Terminal: Container Transportation
Port Dwell Time
IMP
OR
T
ModeOct’19(in hrs)
Nov’19(in hrs)
Overall 119.2 149.2
Port
EX
PO
RT
ModeOct’19(in hrs)
Nov’19(in hrs)
Overall 131.0 127.6

© DMICDC Logistics Data Services Limited
Individual Terminal Performance In Eastern Corridor
© DMICDC Logistics Data Services Limited
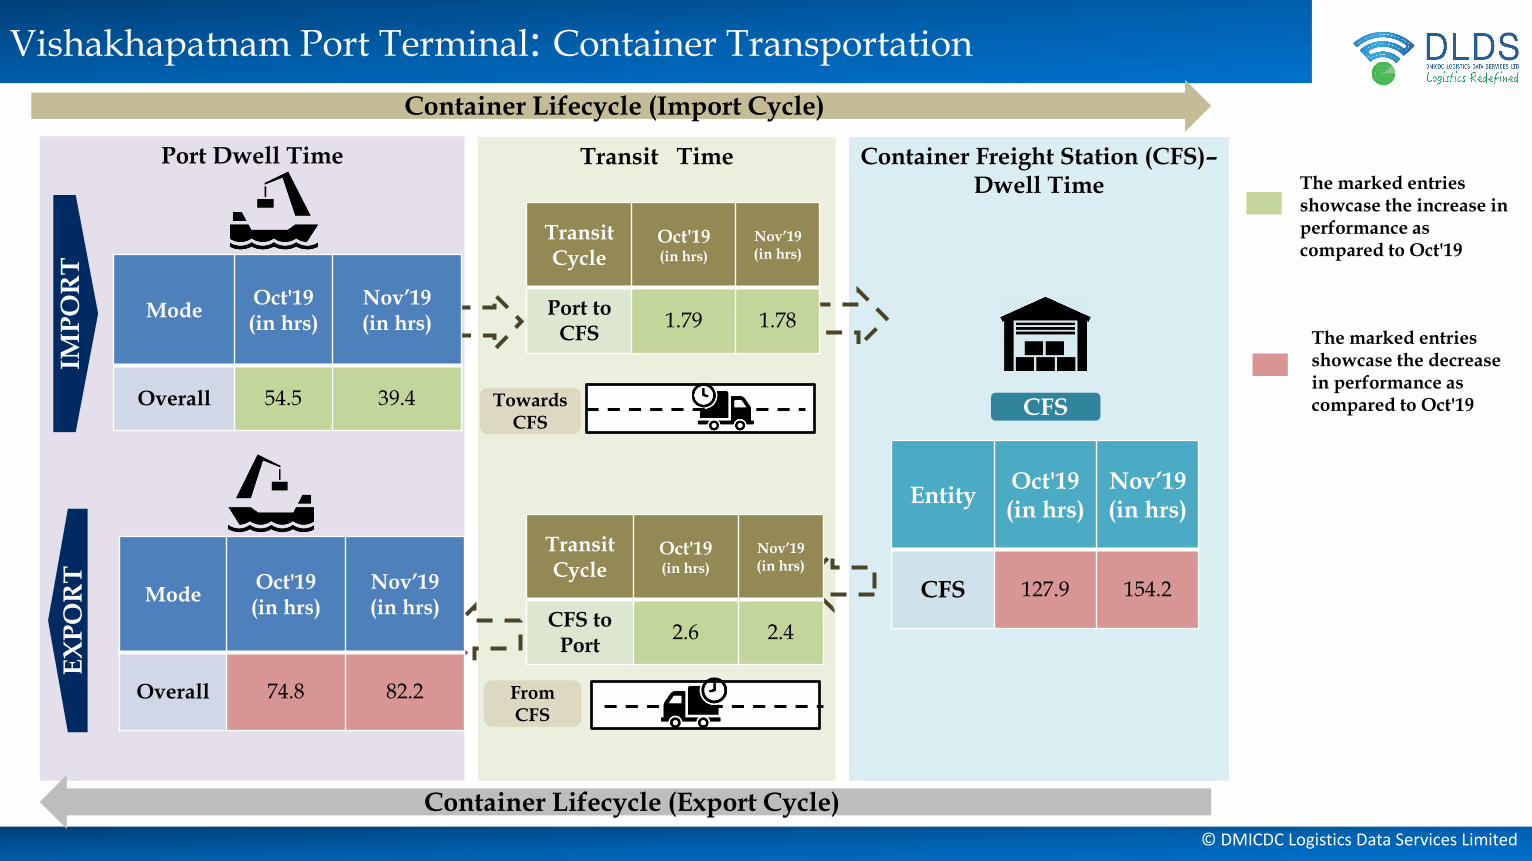
Vishakhapatnam Port Terminal: Container Transportation
Container Freight Station (CFS)–Dwell Time
Port Dwell Time
IMP
OR
TE
XP
OR
T
Container Lifecycle (Import Cycle)
Container Lifecycle (Export Cycle)
Transit Time
Towards CFS
From CFS
ModeOct'19(in hrs)
Nov’19(in hrs)
Overall 74.8 82.2
ModeOct'19(in hrs)
Nov’19(in hrs)
Overall 54.5 39.4
Transit Cycle
Oct'19(in hrs)
Nov’19(in hrs)
Port to CFS
1.79 1.78
Transit Cycle
Oct'19(in hrs)
Nov’19(in hrs)
CFS to Port
2.6 2.4
EntityOct'19(in hrs)
Nov’19(in hrs)
CFS 127.9 154.2
The marked entries showcase the increase in performance as compared to Oct'19
The marked entries showcase the decrease in performance as compared to Oct'19CFS
© DMICDC Logistics Data Services Limited
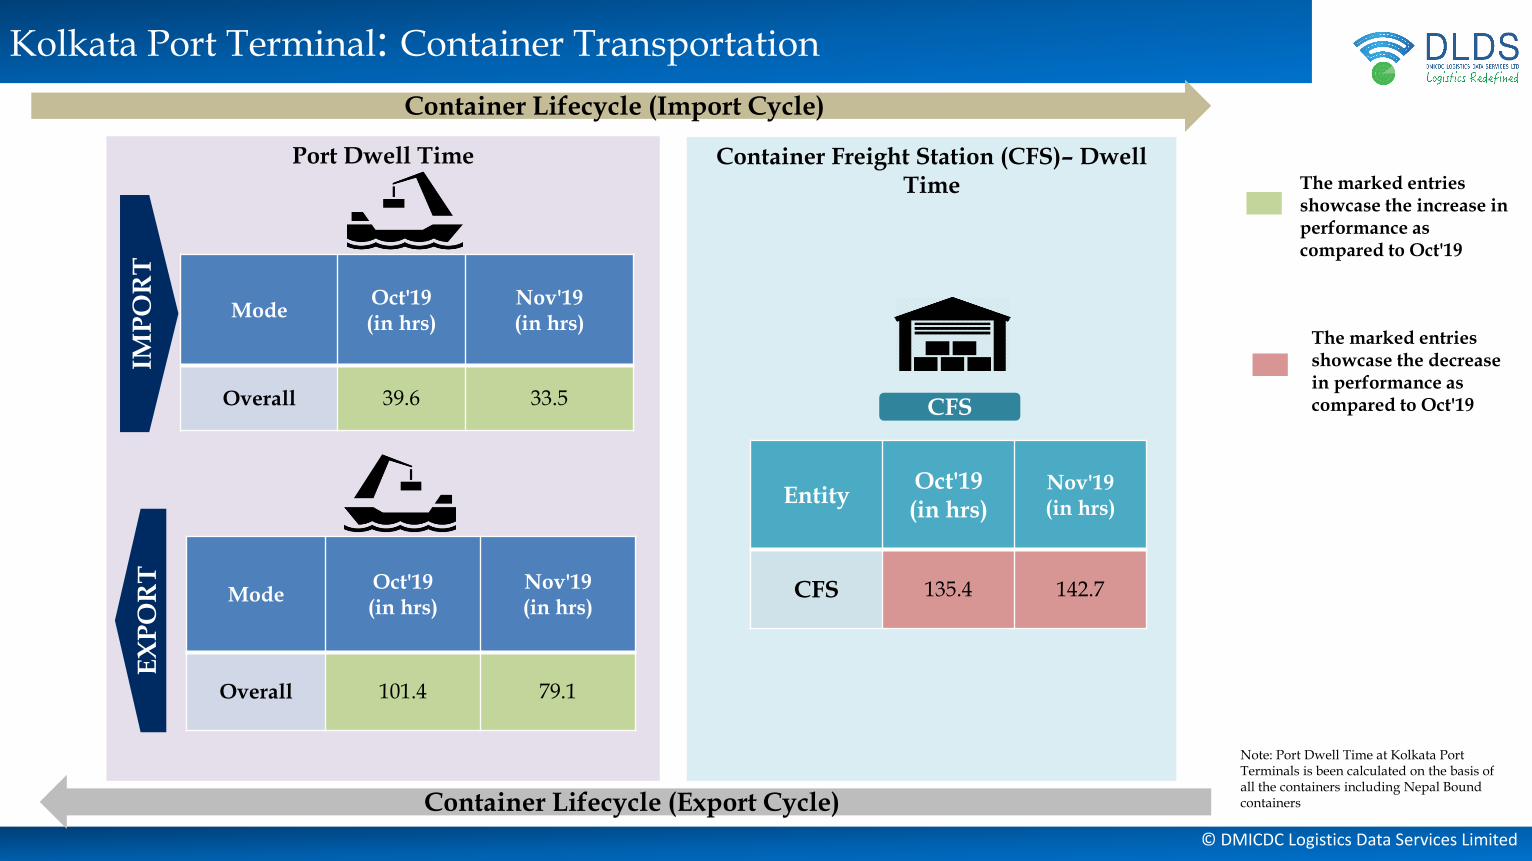
Kolkata Port Terminal: Container Transportation
Container Freight Station (CFS)– Dwell Time
Port Dwell Time IM
PO
RT
EX
PO
RT
Container Lifecycle (Import Cycle)
Container Lifecycle (Export Cycle)
CFS
ModeOct'19(in hrs)
Nov'19(in hrs)
Overall 101.4 79.1
ModeOct'19(in hrs)
Nov'19(in hrs)
Overall 39.6 33.5
EntityOct'19(in hrs)
Nov'19(in hrs)
CFS 135.4 142.7
The marked entries showcase the increase in performance as compared to Oct'19
The marked entries showcase the decrease in performance as compared to Oct'19
Note: Port Dwell Time at Kolkata Port Terminals is been calculated on the basis of all the containers including Nepal Bound containers
© DMICDC Logistics Data Services Limited
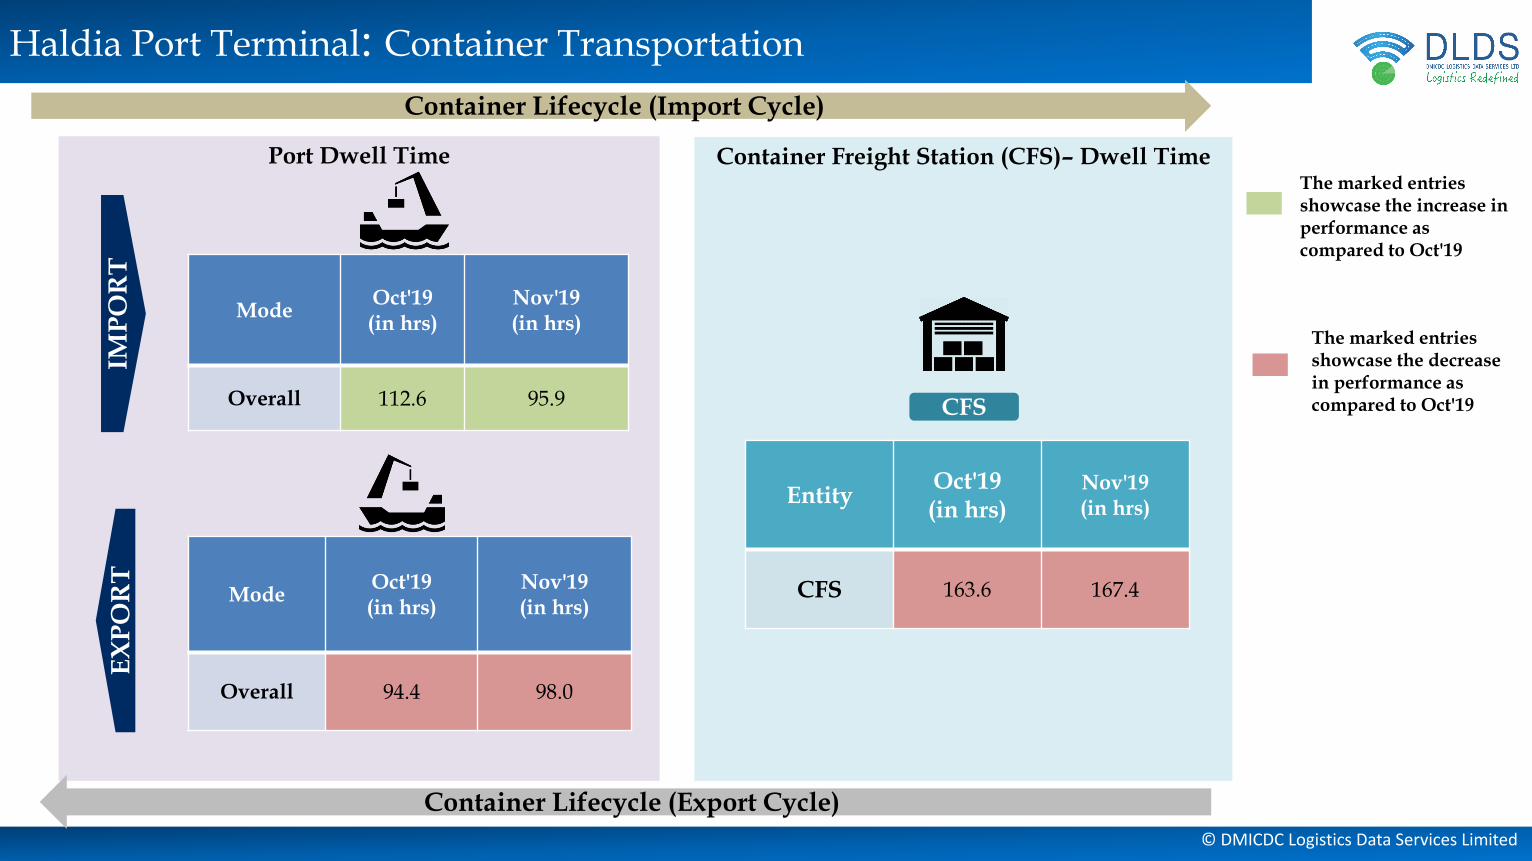
Haldia Port Terminal: Container Transportation
Container Freight Station (CFS)– Dwell TimePort Dwell Time
IMP
OR
TE
XP
OR
T
CFS
ModeOct'19(in hrs)
Nov'19(in hrs)
Overall 94.4 98.0
ModeOct'19(in hrs)
Nov'19(in hrs)
Overall 112.6 95.9
EntityOct'19(in hrs)
Nov'19(in hrs)
CFS 163.6 167.4
The marked entries showcase the increase in performance as compared to Oct'19
The marked entries showcase the decrease in performance as compared to Oct'19
Container Lifecycle (Import Cycle)
Container Lifecycle (Export Cycle)

© DMICDC Logistics Data Services Limited
Individual Terminal Performance In Western Corridor
© DMICDC Logistics Data Services Limited
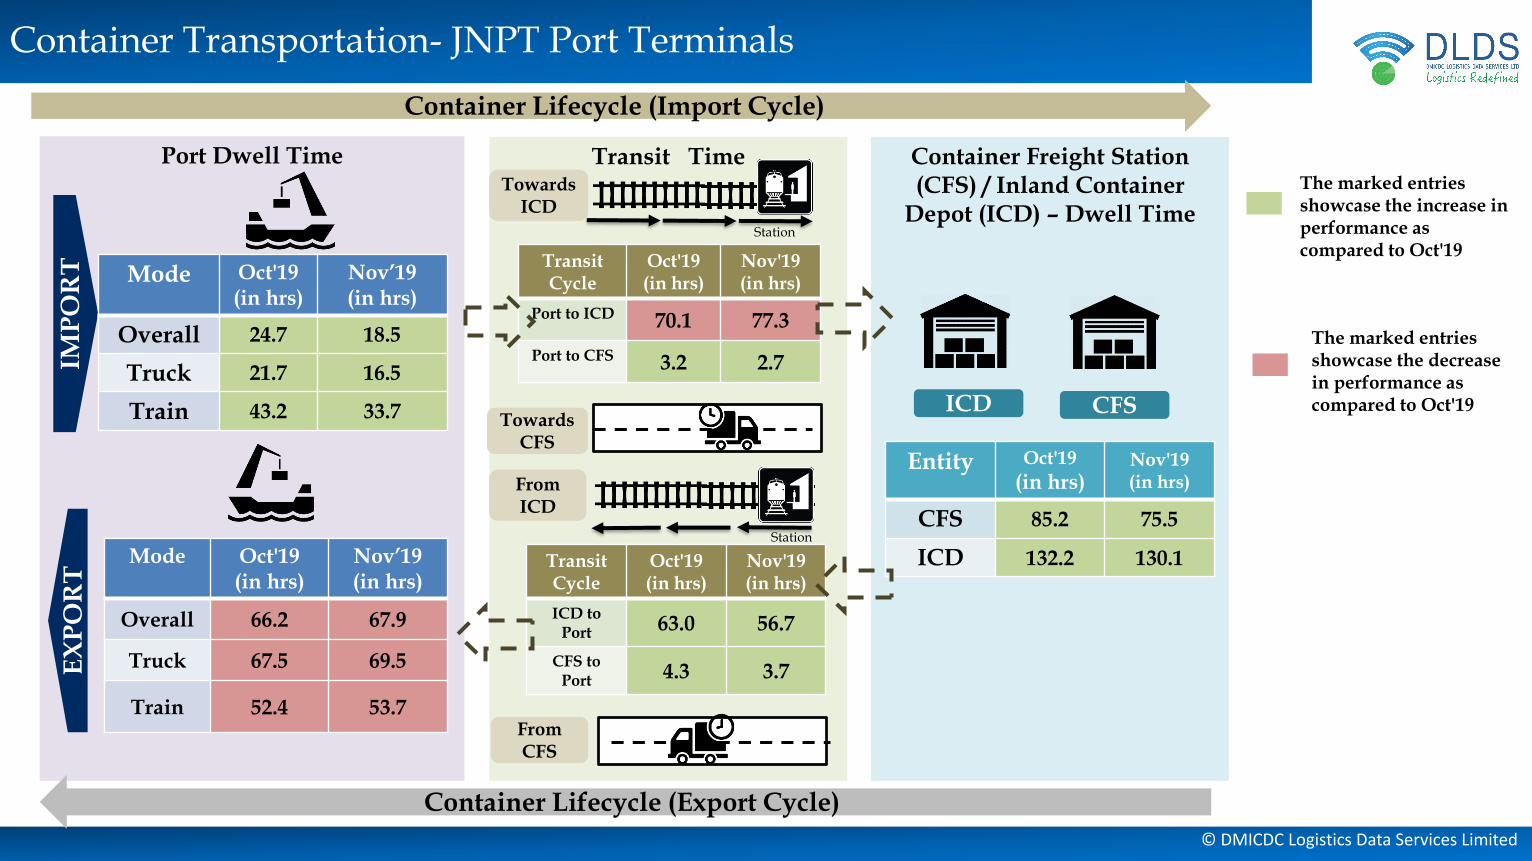
Container Transportation- JNPT Port Terminals
Container Freight Station (CFS) / Inland Container
Depot (ICD) – Dwell Time
Transit TimePort Dwell Time
IMP
OR
TE
XP
OR
T
ICD
Mode Oct'19(in hrs)
Nov’19(in hrs)
Overall 66.2 67.9
Truck 67.5 69.5
Train 52.4 53.7
Mode Oct'19(in hrs)
Nov’19(in hrs)
Overall 24.7 18.5
Truck 21.7 16.5
Train 43.2 33.7
Towards ICD
Towards CFS
Station
From ICD
From CFS
Station
CFS
Transit Cycle
Oct'19(in hrs)
Nov'19(in hrs)
Port to ICD 70.1 77.3
Port to CFS 3.2 2.7
Entity Oct'19
(in hrs)Nov'19(in hrs)
CFS 85.2 75.5
ICD 132.2 130.1Transit Cycle
Oct'19(in hrs)
Nov'19(in hrs)
ICD to Port 63.0 56.7
CFS to Port 4.3 3.7
Container Lifecycle (Import Cycle)
Container Lifecycle (Export Cycle)
The marked entries showcase the increase in performance as compared to Oct'19
The marked entries showcase the decrease in performance as compared to Oct'19
© DMICDC Logistics Data Services Limited
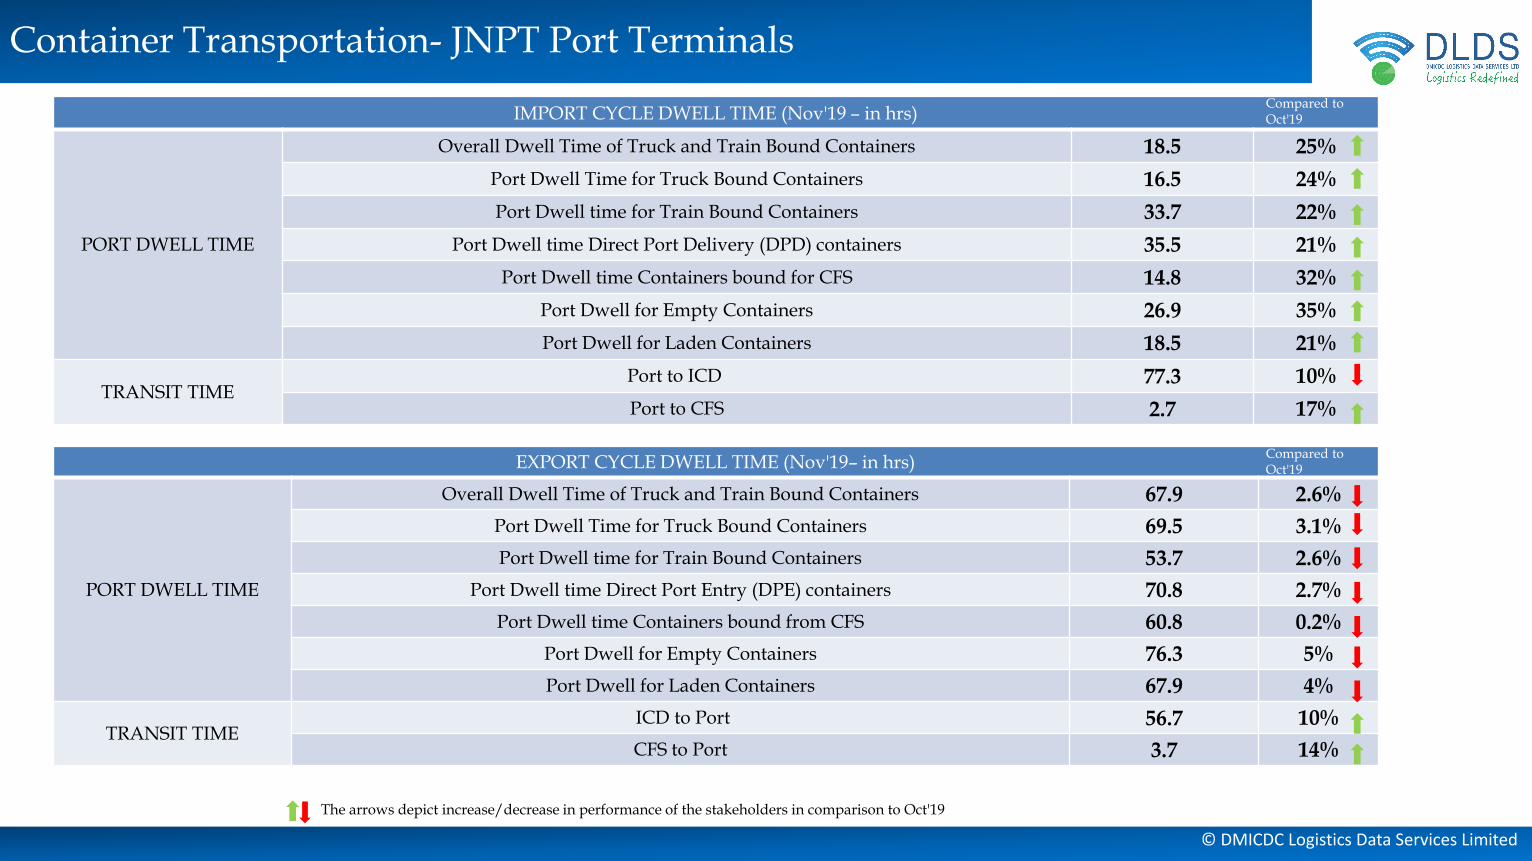
Container Transportation- JNPT Port Terminals
The arrows depict increase/decrease in performance of the stakeholders in comparison to Oct'19
IMPORT CYCLE DWELL TIME (Nov'19 – in hrs)
PORT DWELL TIME
Overall Dwell Time of Truck and Train Bound Containers 18.5 25%
Port Dwell Time for Truck Bound Containers 16.5 24%
Port Dwell time for Train Bound Containers 33.7 22%
Port Dwell time Direct Port Delivery (DPD) containers 35.5 21%
Port Dwell time Containers bound for CFS 14.8 32%
Port Dwell for Empty Containers 26.9 35%
Port Dwell for Laden Containers 18.5 21%
TRANSIT TIMEPort to ICD 77.3 10%
Port to CFS 2.7 17%
EXPORT CYCLE DWELL TIME (Nov'19– in hrs)
PORT DWELL TIME
Overall Dwell Time of Truck and Train Bound Containers 67.9 2.6%
Port Dwell Time for Truck Bound Containers 69.5 3.1%
Port Dwell time for Train Bound Containers 53.7 2.6%
Port Dwell time Direct Port Entry (DPE) containers 70.8 2.7%
Port Dwell time Containers bound from CFS 60.8 0.2%
Port Dwell for Empty Containers 76.3 5%
Port Dwell for Laden Containers 67.9 4%
TRANSIT TIMEICD to Port 56.7 10%
CFS to Port 3.7 14%
Compared to Oct'19
Compared to Oct'19
© DMICDC Logistics Data Services Limited
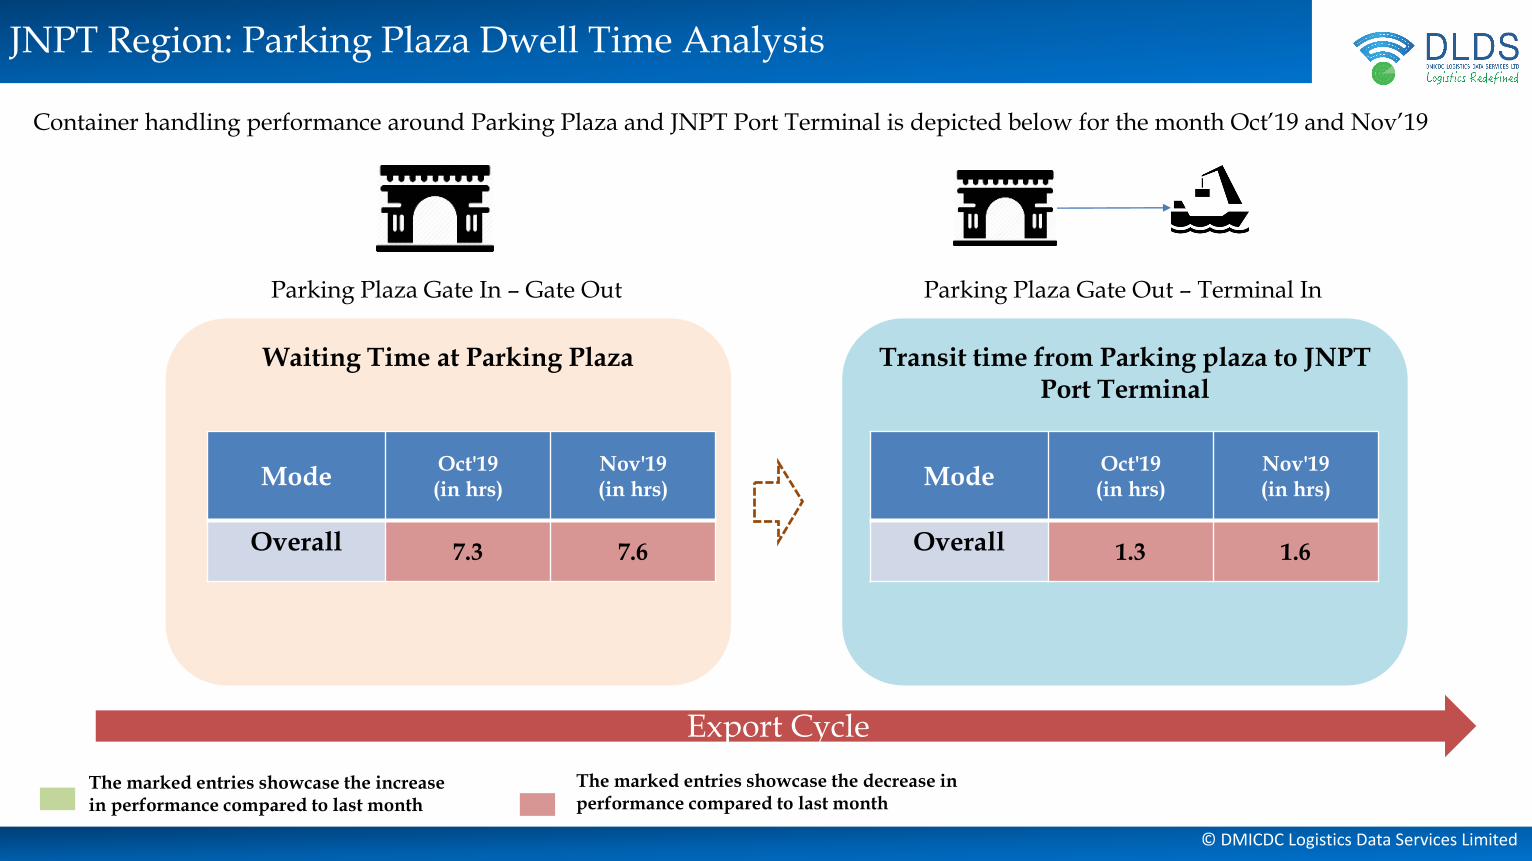
JNPT Region: Parking Plaza Dwell Time Analysis
Container handling performance around Parking Plaza and JNPT Port Terminal is depicted below for the month Oct’19 and Nov’19
Waiting Time at Parking Plaza Transit time from Parking plaza to JNPT Port Terminal
Export Cycle
Parking Plaza Gate In – Gate Out Parking Plaza Gate Out – Terminal In
ModeOct'19(in hrs)
Nov'19(in hrs)
Overall 7.3 7.6
The marked entries showcase the increase in performance compared to last month
The marked entries showcase the decrease in performance compared to last month
ModeOct'19(in hrs)
Nov'19(in hrs)
Overall 1.3 1.6
© DMICDC Logistics Data Services Limited
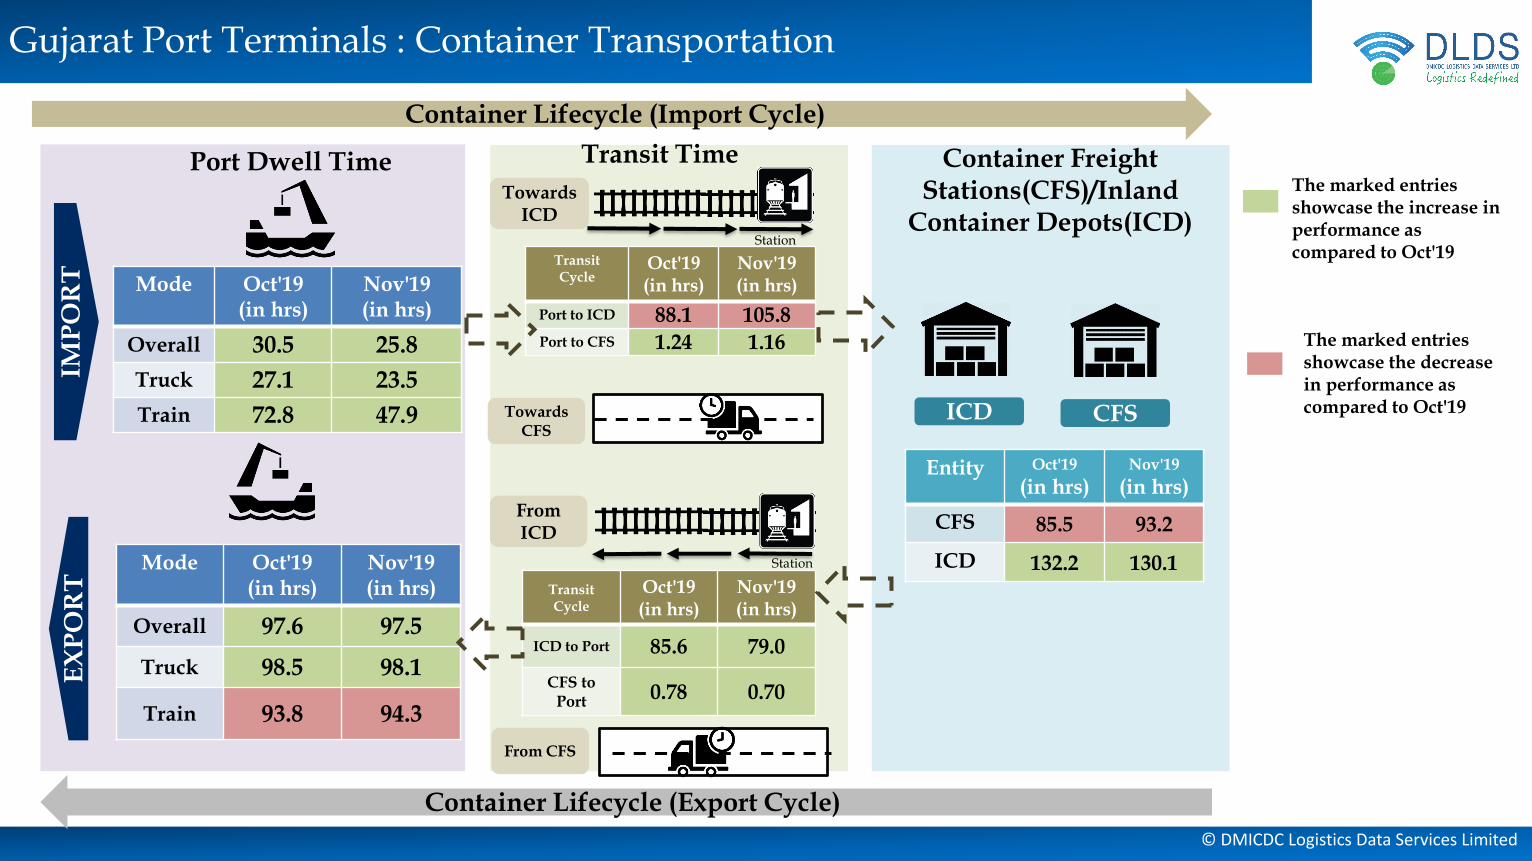
Gujarat Port Terminals : Container TransportationIM
PO
RT
EX
PO
RT
ICD
Mode Oct'19(in hrs)
Nov'19(in hrs)
Overall 97.6 97.5
Truck 98.5 98.1
Train 93.8 94.3
Mode Oct'19(in hrs)
Nov'19(in hrs)
Overall 30.5 25.8
Truck 27.1 23.5
Train 72.8 47.9
Towards ICD
Towards CFS
Station
From ICD
From CFS
Station
CFS
Transit Cycle
Oct'19(in hrs)
Nov'19(in hrs)
Port to ICD 88.1 105.8Port to CFS 1.24 1.16
Entity Oct'19
(in hrs)Nov'19
(in hrs)
CFS 85.5 93.2
ICD 132.2 130.1Transit Cycle
Oct'19(in hrs)
Nov'19(in hrs)
ICD to Port 85.6 79.0
CFS to Port 0.78 0.70
Port Dwell Time Transit Time Container Freight Stations(CFS)/Inland
Container Depots(ICD)
Container Lifecycle (Import Cycle)
Container Lifecycle (Export Cycle)
The marked entries showcase the increase in performance as compared to Oct'19
The marked entries showcase the decrease in performance as compared to Oct'19
© DMICDC Logistics Data Services Limited
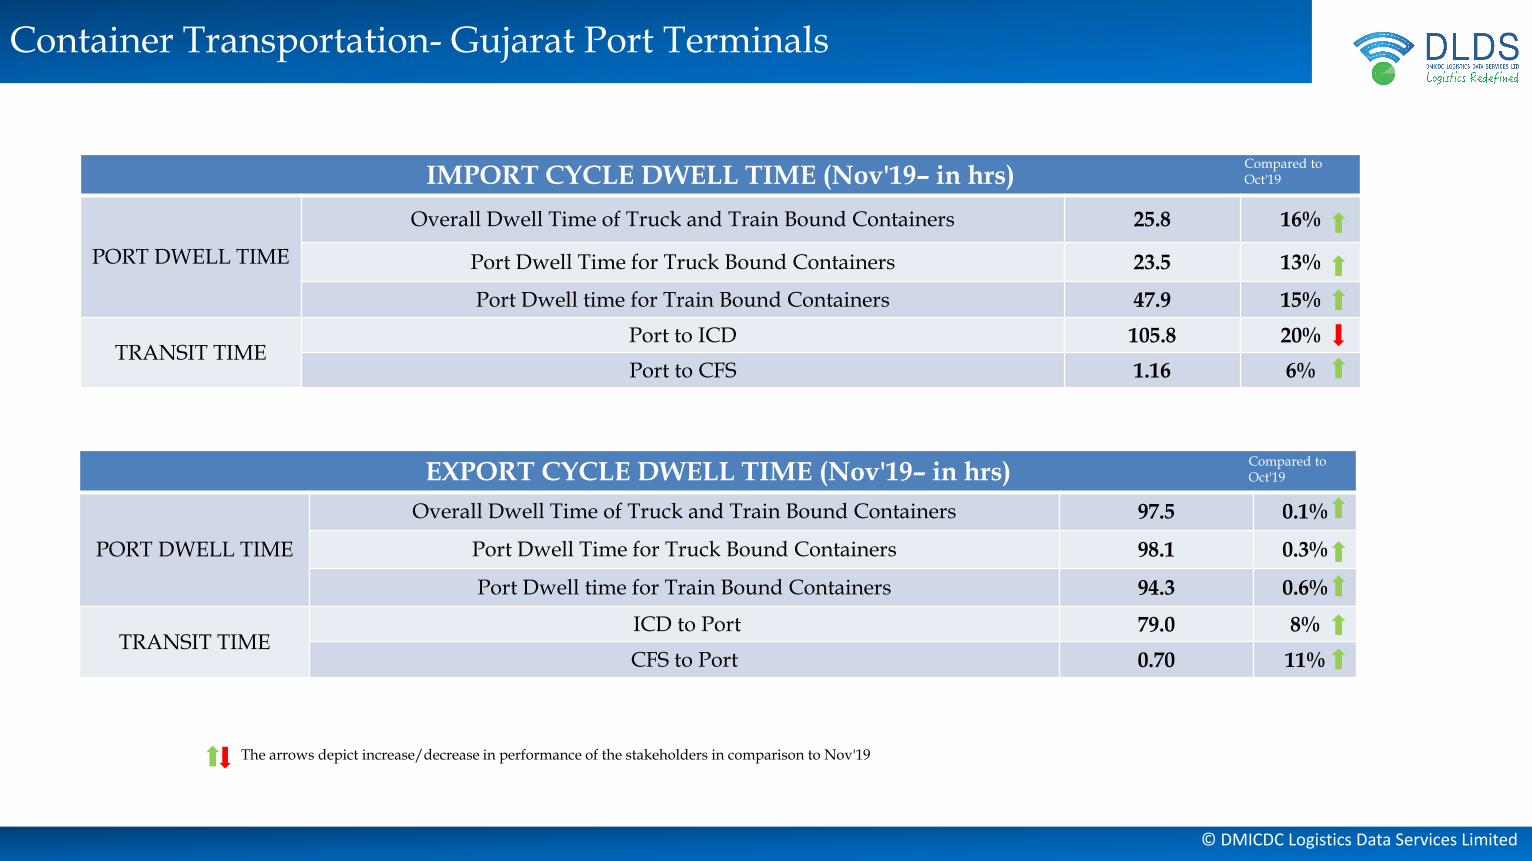
Container Transportation- Gujarat Port Terminals
IMPORT CYCLE DWELL TIME (Nov'19– in hrs)
PORT DWELL TIME
Overall Dwell Time of Truck and Train Bound Containers 25.8 16%
Port Dwell Time for Truck Bound Containers 23.5 13%
Port Dwell time for Train Bound Containers 47.9 15%
TRANSIT TIMEPort to ICD 105.8 20%
Port to CFS 1.16 6%
EXPORT CYCLE DWELL TIME (Nov'19– in hrs)
PORT DWELL TIME
Overall Dwell Time of Truck and Train Bound Containers 97.5 0.1%
Port Dwell Time for Truck Bound Containers 98.1 0.3%
Port Dwell time for Train Bound Containers 94.3 0.6%
TRANSIT TIMEICD to Port 79.0 8%
CFS to Port 0.70 11%
The arrows depict increase/decrease in performance of the stakeholders in comparison to Nov'19
Compared to Oct'19
Compared to Oct'19
© DMICDC Logistics Data Services Limited
JNPT – Import – Nov'19 JNPT – Export –Nov'19
Cluster 2
Cluster 5
Cluster 7
Cluster 4
Cluster 6
Cluster 3
Cluster 1
JNPT
Cluster 8
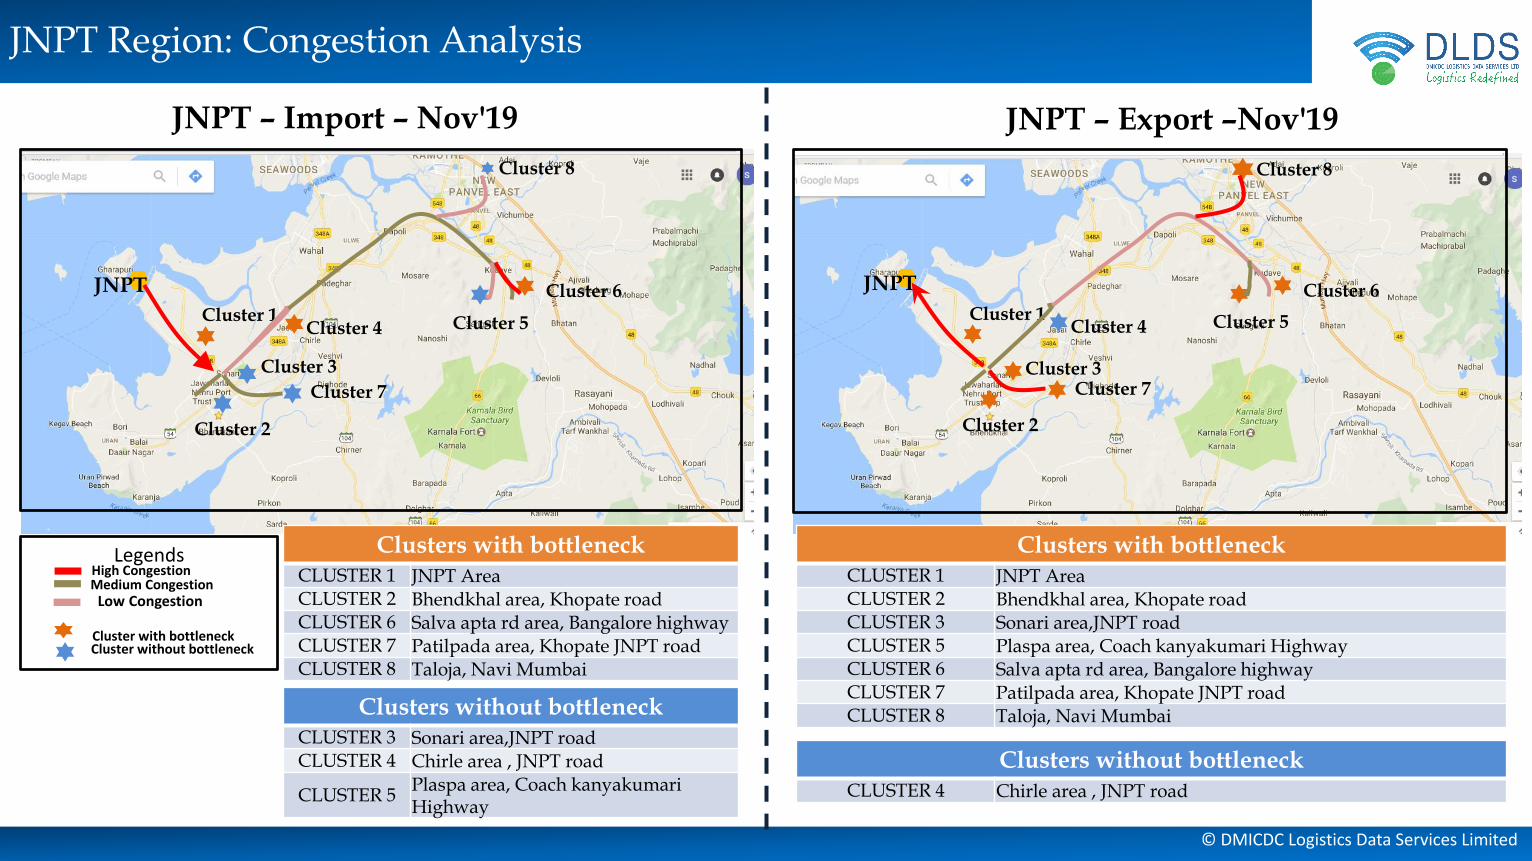
JNPT Region: Congestion Analysis
Cluster 2
Cluster 5
Cluster 7
Cluster 4
Cluster 6
Cluster 3
Cluster 1
JNPT
Cluster 8
High Congestion
Cluster without bottleneckCluster with bottleneck
Medium Congestion Low Congestion
Legends Clusters with bottleneckCLUSTER 1 JNPT AreaCLUSTER 2 Bhendkhal area, Khopate roadCLUSTER 3 Sonari area,JNPT roadCLUSTER 5 Plaspa area, Coach kanyakumari HighwayCLUSTER 6 Salva apta rd area, Bangalore highwayCLUSTER 7 Patilpada area, Khopate JNPT roadCLUSTER 8 Taloja, Navi Mumbai
Clusters with bottleneckCLUSTER 1 JNPT AreaCLUSTER 2 Bhendkhal area, Khopate roadCLUSTER 6 Salva apta rd area, Bangalore highwayCLUSTER 7 Patilpada area, Khopate JNPT roadCLUSTER 8 Taloja, Navi Mumbai
Clusters without bottleneckCLUSTER 3 Sonari area,JNPT roadCLUSTER 4 Chirle area , JNPT road
CLUSTER 5Plaspa area, Coach kanyakumari Highway
Clusters without bottleneckCLUSTER 4 Chirle area , JNPT road
© DMICDC Logistics Data Services Limited
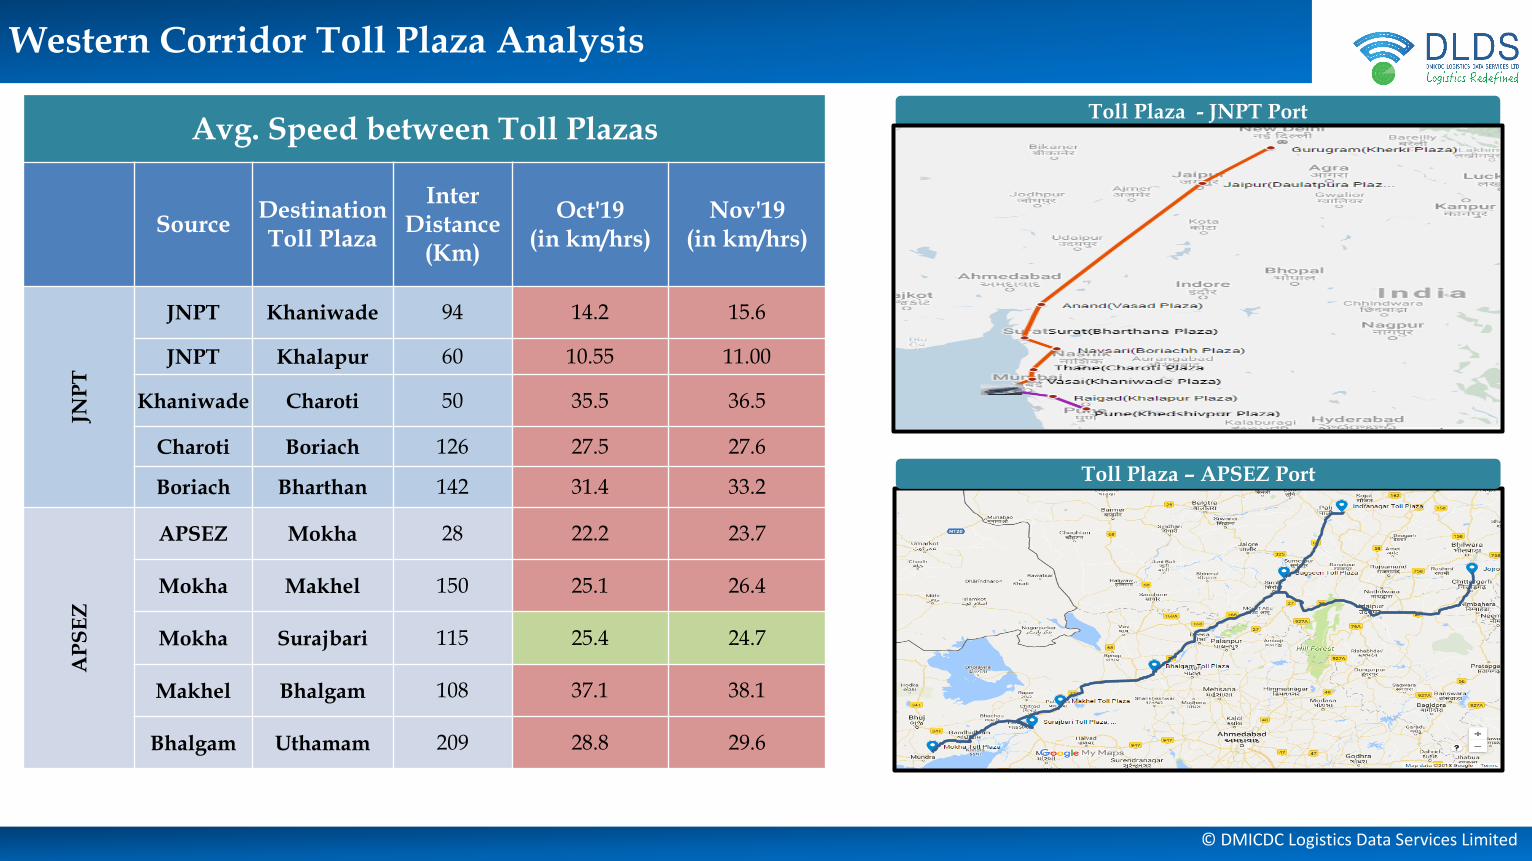
Avg. Speed between Toll Plazas
Source Destination Toll Plaza
Inter Distance
(Km)
Oct'19(in km/hrs)
Nov'19(in km/hrs)
JNP
T
JNPT Khaniwade 94 14.2 15.6
JNPT Khalapur 60 10.55 11.00
Khaniwade Charoti 50 35.5 36.5
Charoti Boriach 126 27.5 27.6
Boriach Bharthan 142 31.4 33.2
AP
SE
Z
APSEZ Mokha 28 22.2 23.7
Mokha Makhel 150 25.1 26.4
Mokha Surajbari 115 25.4 24.7
Makhel Bhalgam 108 37.1 38.1
Bhalgam Uthamam 209 28.8 29.6
Toll Plaza – APSEZ Port
Western Corridor Toll Plaza Analysis
Toll Plaza - JNPT Port
© DMICDC Logistics Data Services Limited
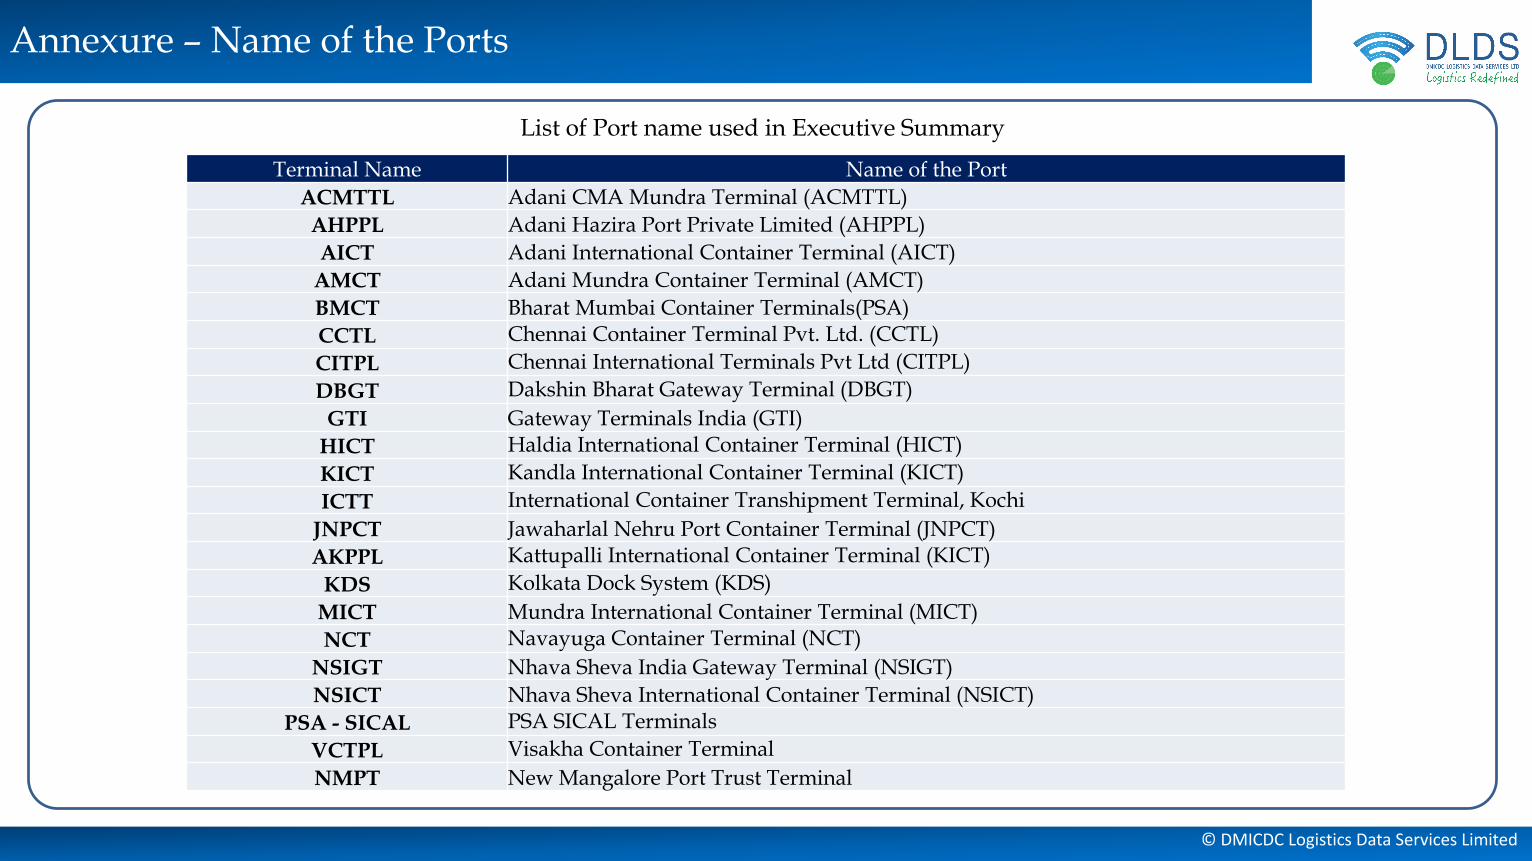
List of Port name used in Executive Summary
Annexure – Name of the Ports
Terminal Name Name of the Port
ACMTTL Adani CMA Mundra Terminal (ACMTTL)
AHPPL Adani Hazira Port Private Limited (AHPPL)
AICT Adani International Container Terminal (AICT)
AMCT Adani Mundra Container Terminal (AMCT)
BMCT Bharat Mumbai Container Terminals(PSA)
CCTL Chennai Container Terminal Pvt. Ltd. (CCTL)
CITPL Chennai International Terminals Pvt Ltd (CITPL)
DBGT Dakshin Bharat Gateway Terminal (DBGT)
GTI Gateway Terminals India (GTI)
HICT Haldia International Container Terminal (HICT)
KICT Kandla International Container Terminal (KICT)
ICTT International Container Transhipment Terminal, Kochi
JNPCT Jawaharlal Nehru Port Container Terminal (JNPCT)
AKPPL Kattupalli International Container Terminal (KICT)
KDS Kolkata Dock System (KDS)
MICT Mundra International Container Terminal (MICT)
NCT Navayuga Container Terminal (NCT)
NSIGT Nhava Sheva India Gateway Terminal (NSIGT)
NSICT Nhava Sheva International Container Terminal (NSICT)
PSA - SICAL PSA SICAL Terminals
VCTPL Visakha Container Terminal
NMPT New Mangalore Port Trust Terminal
© DMICDC Logistics Data Services Limited
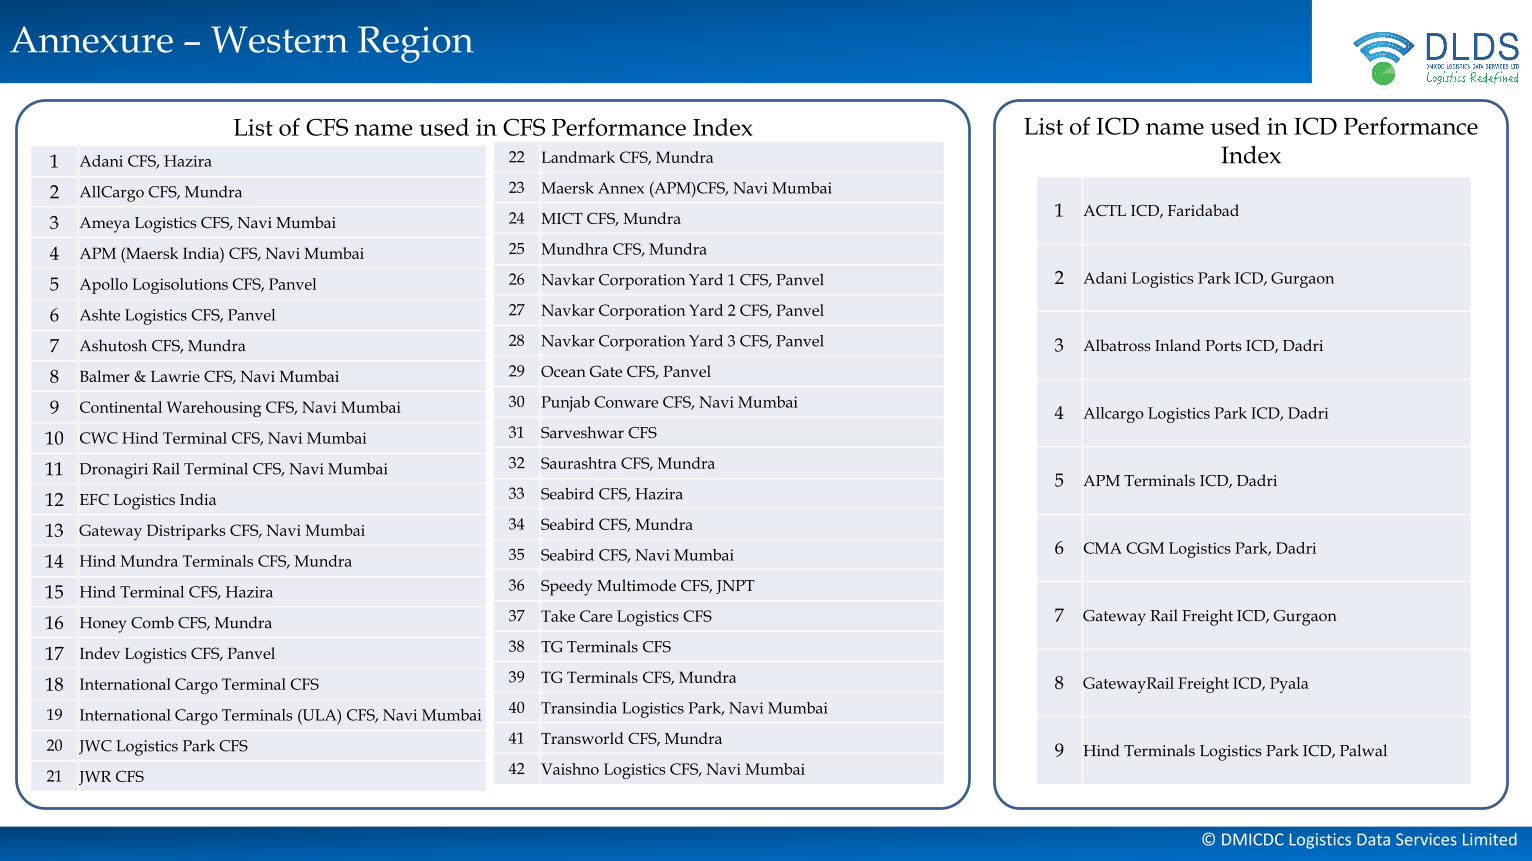
List of CFS name used in CFS Performance Index
Annexure – Western Region
1 Adani CFS, Hazira
2 AllCargo CFS, Mundra
3 Ameya Logistics CFS, Navi Mumbai
4 APM (Maersk India) CFS, Navi Mumbai
5 Apollo Logisolutions CFS, Panvel
6 Ashte Logistics CFS, Panvel
7 Ashutosh CFS, Mundra
8 Balmer & Lawrie CFS, Navi Mumbai
9 Continental Warehousing CFS, Navi Mumbai
10 CWC Hind Terminal CFS, Navi Mumbai
11 Dronagiri Rail Terminal CFS, Navi Mumbai
12 EFC Logistics India
13 Gateway Distriparks CFS, Navi Mumbai
14 Hind Mundra Terminals CFS, Mundra
15 Hind Terminal CFS, Hazira
16 Honey Comb CFS, Mundra
17 Indev Logistics CFS, Panvel
18 International Cargo Terminal CFS
19 International Cargo Terminals (ULA) CFS, Navi Mumbai
20 JWC Logistics Park CFS
21 JWR CFS
22 Landmark CFS, Mundra
23 Maersk Annex (APM)CFS, Navi Mumbai
24 MICT CFS, Mundra
25 Mundhra CFS, Mundra
26 Navkar Corporation Yard 1 CFS, Panvel
27 Navkar Corporation Yard 2 CFS, Panvel
28 Navkar Corporation Yard 3 CFS, Panvel
29 Ocean Gate CFS, Panvel
30 Punjab Conware CFS, Navi Mumbai
31 Sarveshwar CFS
32 Saurashtra CFS, Mundra
33 Seabird CFS, Hazira
34 Seabird CFS, Mundra
35 Seabird CFS, Navi Mumbai
36 Speedy Multimode CFS, JNPT
37 Take Care Logistics CFS
38 TG Terminals CFS
39 TG Terminals CFS, Mundra
40 Transindia Logistics Park, Navi Mumbai
41 Transworld CFS, Mundra
42 Vaishno Logistics CFS, Navi Mumbai
1 ACTL ICD, Faridabad
2 Adani Logistics Park ICD, Gurgaon
3 Albatross Inland Ports ICD, Dadri
4 Allcargo Logistics Park ICD, Dadri
5 APM Terminals ICD, Dadri
6 CMA CGM Logistics Park, Dadri
7 Gateway Rail Freight ICD, Gurgaon
8 GatewayRail Freight ICD, Pyala
9 Hind Terminals Logistics Park ICD, Palwal
List of ICD name used in ICD Performance Index
© DMICDC Logistics Data Services Limited
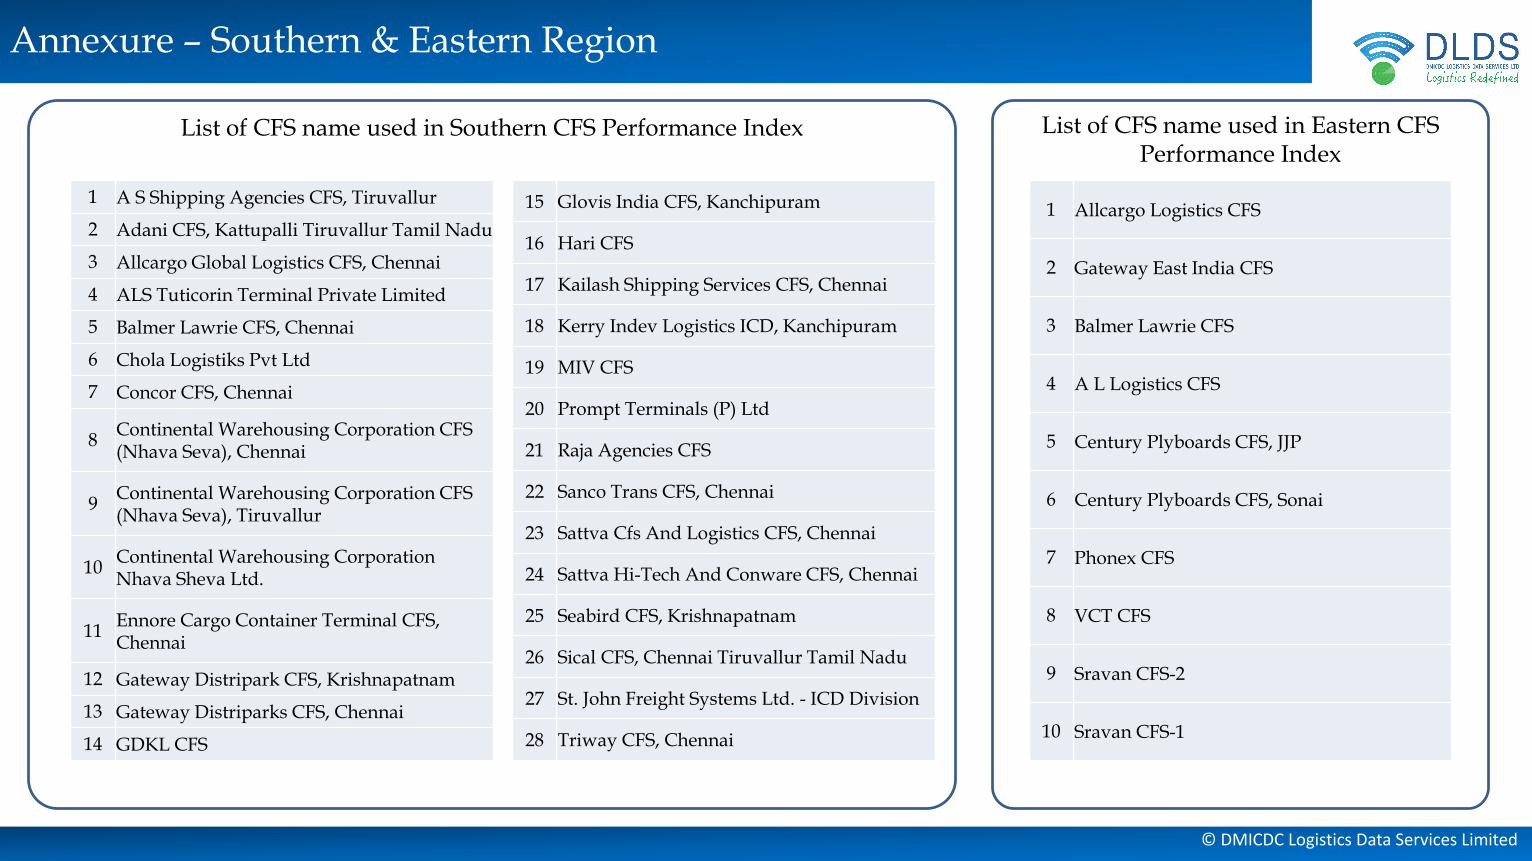
List of CFS name used in Southern CFS Performance Index
Annexure – Southern & Eastern Region
1 Allcargo Logistics CFS
2 Gateway East India CFS
3 Balmer Lawrie CFS
4 A L Logistics CFS
5 Century Plyboards CFS, JJP
6 Century Plyboards CFS, Sonai
7 Phonex CFS
8 VCT CFS
9 Sravan CFS-2
10 Sravan CFS-1
List of CFS name used in Eastern CFS Performance Index
1 A S Shipping Agencies CFS, Tiruvallur
2 Adani CFS, Kattupalli Tiruvallur Tamil Nadu
3 Allcargo Global Logistics CFS, Chennai
4 ALS Tuticorin Terminal Private Limited
5 Balmer Lawrie CFS, Chennai
6 Chola Logistiks Pvt Ltd
7 Concor CFS, Chennai
8Continental Warehousing Corporation CFS (Nhava Seva), Chennai
9Continental Warehousing Corporation CFS (Nhava Seva), Tiruvallur
10Continental Warehousing Corporation Nhava Sheva Ltd.
11Ennore Cargo Container Terminal CFS, Chennai
12 Gateway Distripark CFS, Krishnapatnam
13 Gateway Distriparks CFS, Chennai
14 GDKL CFS
15 Glovis India CFS, Kanchipuram
16 Hari CFS
17 Kailash Shipping Services CFS, Chennai
18 Kerry Indev Logistics ICD, Kanchipuram
19 MIV CFS
20 Prompt Terminals (P) Ltd
21 Raja Agencies CFS
22 Sanco Trans CFS, Chennai
23 Sattva Cfs And Logistics CFS, Chennai
24 Sattva Hi-Tech And Conware CFS, Chennai
25 Seabird CFS, Krishnapatnam
26 Sical CFS, Chennai Tiruvallur Tamil Nadu
27 St. John Freight Systems Ltd. - ICD Division
28 Triway CFS, Chennai
© DMICDC Logistics Data Services Limited
THANK YOU


![P567 Not Adani Deal - The Australia Institute Not Adani Deal [WEB]_… · Not Adani Deal Queensland Government subsidies to Adani The Queensland Labor Government has offered Adani](https://static.fdocuments.in/doc/165x107/5edfdb34ad6a402d666b26e7/p567-not-adani-deal-the-australia-institute-not-adani-deal-web-not-adani.jpg)