Logan River environmental values and water quality … · Environmental Protection (Water) Policy...
39
Environmental Protection (Water) Policy 2009 Logan River environmental values and water quality objectives Basin No 145 (part) including all tributaries of the Logan River July 2010
Transcript of Logan River environmental values and water quality … · Environmental Protection (Water) Policy...

Environmental Protection (Water) Policy 2009
Logan River environmental values and water quality objectives
Basin No 145 (part) including all tributaries of the Logan River
July 2010

Prepared by:
Water Quality & Ecosystem Health Policy Unit
Department of Environment and Resource Management
© State of Queensland (Department of Environment and Resource Management) 2010
The Department of Environment and Resource Management authorises the reproduction of textual
material, whole or part, in any form, provided appropriate acknowledgement is given.
This publication is available in alternative formats (including large print and audiotape) on request.
Contact (07) 322 48412 or email <[email protected]>
July 2010
Document Ref Number

iii
Main parts of this document and what they contain
Environmental Values (EVs - section 2)
Introduction (section 1)
Water Quality Objectives (WQOs - section 3)
• Scope of waters covered
• Key terms / how to use document
• Links to WQ plan (map)
• Mapping / water type information
• Further contact details
• Amendment provisions
Accompanying WQ Plan (map)
Dictionary (section 5)
Ways to improve water quality
(section 4)
• Source of EVs for this document
• Table of EVs by waterway - aquatic ecosystem - human use
• Any applicable management goals to support EVs
• How to establish WQOs to protect all selected EVs
• WQOs in this document, for - aquatic ecosystem EV - human use EVs
• List of plans, reports etc containing management actions relevant to the waterways in this area
• Definitions of key terms including an explanation table of all environmental values
• An accompanying map that shows water types, levels of protection and other information contained in this document
iv
CONTENTS
1 INTRODUCTION ............................................................................................................................. 1
1.1 WATERS TO WHICH THIS DOCUMENT APPLIES .............................................................................. 1 1.2 GUIDANCE ON USING THIS DOCUMENT......................................................................................... 2
1.2.1 Key terms............................................................................................................................ 2 1.2.2 Main parts of this document................................................................................................ 4 1.2.3 Use of this document .......................................................................................................... 4
1.3 INFORMATION ABOUT MAPPED AREAS AND BOUNDARIES............................................................... 4 1.4 WATER TYPES AND BASIS FOR BOUNDARIES ................................................................................ 5
1.4.1 Water types......................................................................................................................... 5 1.4.2 Water type boundaries........................................................................................................ 5
1.5 MATTERS FOR AMENDMENT ....................................................................................................... 6
2 ENVIRONMENTAL VALUES (EVS) ............................................................................................... 7
2.1 ENVIRONMENTAL VALUES .......................................................................................................... 7 2.2 MANAGEMENT GOALS TO SUPPORT EVS..................................................................................... 7
3 WATER QUALITY OBJECTIVES (WQOS) TO PROTECT ENVIRONMENTAL VALUES.......... 10
3.1 WATER QUALITY OBJECTIVES (WQOS) TO PROTECT AQUATIC ECOSYSTEMS ............................... 11 3.1.1 Physico-chemical WQOs .................................................................................................. 11 3.1.2 Biological WQOs............................................................................................................... 19 3.1.3 Riparian WQOs................................................................................................................. 20 3.1.4 Stormwater design objectives........................................................................................... 20
3.2 WATER QUALITY OBJECTIVES (WQOS) FOR HUMAN USE EVS .................................................... 21
4 WAYS TO IMPROVE WATER QUALITY ..................................................................................... 31
5 DICTIONARY................................................................................................................................. 32
List of Tables
Table 1 Environmental values (EVs) for Logan River catchment waters 8 Table 2a Water quality objectives to protect aquatic ecosystem environmental value (refer to Plan
WQ1454 for location of waters) 12 Table 2b Groundwater water quality objectives for Logan River catchment 17 Table 3 Aquatic ecosystem EV: Biological water quality objectives for freshwater streams (refer to Plan
WQ1454 for location of streams) 19 Table 4 Water quality objectives to protect human use environmental values 21 Table 5 Primary contact recreation EV: Water quality objectives for management of cyanobacteria in
contact recreation areas 24 Table 6 Aquaculture EV: Water quality objectives for tropical aquaculture 25 Table 7 Aquaculture EV: Water quality objectives for optimal growth of particular species in freshwater
25 Table 8 Aquaculture EV: Water quality objectives for optimal growth of particular marine species 26 Table 9 Irrigation EV: Water quality objectives for thermotolerant (faecal) coliforms in irrigation waters
used for food and non-food crops 27 Table 10 Irrigation EV: Water quality objectives for heavy metals and metalloids in agricultural irrigation
water – long-term trigger value (LTV), short-term trigger value (STV) and soil cumulative contamination loading limit (CCL) 28
Table 11 Stock watering EV: Water quality objectives for tolerances of livestock to total dissolved solids (salinity) in drinking water 29
Table 12 Stock watering EV: Water quality objectives (low risk trigger values) for heavy metals and metalloids in livestock drinking water 29
Table 13 Drinking water EV: Priority water quality objectives for drinking water supply in the vicinity of off-takes, including groundwater, before treatment 30
Table 14 Suite of environmental values that can be chosen for protection 33
Logan River environmental values and water quality objectives
1
1 Introduction This document is made pursuant to the provisions of the Environmental Protection (Water) Policy 2009 (the EPP [Water]), which is subordinate legislation under the Environmental Protection Act 1994. The EPP (Water) provides a framework for:
• identifying environmental values for Queensland waters, and deciding the water quality objectives to protect or enhance those environmental values; and
• including the identified environmental values and water quality objectives under Schedule 1 of the EPP (Water).
This document contains environmental values and water quality objectives for waters in the Logan River catchment, and is listed under schedule 1 of the EPP (Water).
1.1 Waters to which this document applies This document applies to fresh, estuarine and marine surface waters and groundwaters draining the Logan River catchment, as indicated in the accompanying plan (WQ1454)
1. These waters fall substantially within
the broader South Coast basin (basin 145)2. Waters covered by this document include:
• Logan River including both freshwater and estuary;
• California Creek;
• Native Dog Creek;
• Serpentine Creek;
• Slacks Creek;
• tidal canals, constructed estuaries, marinas and boat harbours;
• Lake Maroon;
• Christmas Creek;
• Running Creek;
• Knapps Creek;
• Teviot Brook;
• other freshwater and estuarine waters in the Logan River estuary catchment;
• wetlands; and
• groundwaters. The geographical extent of waters addressed by this document is shown in the plan (WQ1454), and is broadly:
• north to the boundary of the Logan River catchment with the Redland and Brisbane catchments, and to the boundary of Bremer River catchment;
• west to boundary of the Logan River catchment with the Brisbane and Bremer catchments;
• south to the boundary of the Logan River catchment; and
• east to the boundary of the Logan River catchment with the Albert River catchment and Moreton Bay.
1This document and the accompanying plan are available in electronic form from the Environmental Values web page
on the Department of Environment and Resource Management (DERM) website: http://www.derm.qld.gov.au/.
The boundaries in the accompanying plan WQ1454 are indicative only. The water types and management intent
depicted in the accompanying plan are stored in electronic form as part of the SEQ Environmental Values Schedule 1
Database July 2010 and held at the DERM offices at 41 George Street Brisbane. Database regions are based on the
regions established in the Queensland water quality guidelines. For further information on accessing the database,
please contact DERM by email at [email protected]. 2 Australia’s River Basins 1997 – Product User Guide. Published by Geoscience Australia. Canberra, ACT (3
rd edition,
2004).

Logan River environmental values and water quality objectives
2
1.2 Guidance on using this document
1.2.1 Key terms Key terms used in this document are explained below. Additional detail is provided in the dictionary at the end of the document: ADWG: means the Australian drinking water guidelines (2004), prepared by the National Health and Medical Research Council (NHMRC) in collaboration with the Natural Resource Management Ministerial Council
(NRMMC)3.
AWQG: means the Australian and New Zealand guidelines for fresh and marine water quality (October 2000), prepared by the Australian and New Zealand Environment and Conservation Council (ANZECC) and the Agriculture and Resource Management Council of Australia and New Zealand (ARMCANZ)
4.
Environmental Values (EVs) for water: means the EVs specified in Table 1 of this document for the corresponding water. EVs for water are the qualities of water that make it suitable for supporting aquatic ecosystems and human water uses. These EVs need to be protected from the effects of habitat alteration, waste releases, contaminated runoff and changed flows to ensure healthy aquatic ecosystems and waterways that are safe for community use. Particular waters may have different EVs. The range of EVs and the waters they can potentially apply to are listed below, and further details are provided in the dictionary (refer Section 5). List of EVs and applicable waters
Potentially applicable to: Environmental Value (EV)
Tidal waters
Fresh (non-tidal) waters
Protection of aquatic ecosystems (Aquatic ecosystem EV)
Protection or enhancement of aquatic ecosystem values, under four possible levels of ecosystem conditions:
• High ecological value (effectively unmodified) waters;
• Slightly disturbed waters;
• Moderately disturbed waters; and
• Highly disturbed waters. [suitability for seagrass and wildlife habitat have also been specifically identified for some waters as a component of this EV]
� �
EVs other than aquatic ecosystem EV (called human use EVs)
Suitability for human consumers of wild or stocked fish, shellfish or crustaceans [suitability for oystering has also been specifically identified for some waters]
� �
Suitability for primary contact recreation (eg swimming)
� �
Suitability for secondary contact recreation (eg boating)
� �
Suitability for visual (no contact) recreation � �
3 The Australian drinking water guidelines (2004) can be downloaded from the following website:
http://www.nhmrc.gov.au/publications/synopses/eh19syn.htm
4 The AWQG (2000) can be downloaded from the following website:
http://www.mincos.gov.au/publications/australian_and_new_zealand_guidelines_for_fresh_and_marine_water_quality

Logan River environmental values and water quality objectives
3
Potentially applicable to: Environmental Value (EV)
Tidal waters
Fresh (non-tidal) waters
Protection of cultural and spiritual values, including Traditional Owner values of water
� �
Suitability for industrial use (including manufacturing plants, power generation)
� �
Suitability for aquaculture (eg red claw, barramundi)
� �
Suitability for drinking water supplies
�
Suitability for crop irrigation
�
Suitability for stock watering
�
Suitability for farm supply/use �
Level of protection for a water (aquatic ecosystem EV): means the level of aquatic ecosystem condition specified in Table 2 of this document that the corresponding water quality objectives for that water are intended to achieve (refer to management intent definition below for further information). Management goal: means the goals (if any) stated in section 2 of this document to support the EVs for waters identified in Table 1. Management intent (level of protection) for a water (aquatic ecosystem EV): means the level of aquatic ecosystem condition specified in Table 2 of this document that the corresponding water quality objectives for that water are intended to achieve. For example, the intent for high ecological value waters is that their effectively unmodified condition is maintained. QWQG: means the (hyperlink added) Queensland water quality guidelines, prepared by the Department of Environment and Resource Management (2009)
5.
Water quality guidelines (defined in the EPP [Water]): are numerical concentration levels or statements for indicators that protect a stated environmental value. Under the EVs setting process contained in the EPP (Water), water quality guidelines are used as an input to the development of water quality objectives. Water quality indicator (for an EV): a property that is able to be measured or decided in a quantitative way. Examples of water quality indicators include physical indicators (e.g. temperature), chemical indicators (e.g. nitrogen, phosphorus, metals), and biological indicators (e.g. macroinvertebrates, seagrass, fish).
Water quality objectives (WQOs): means the WQOs specified in Tables 2–13 of this document to support the EVs for waters identified in Table 1. WQOs are long term goals for water quality management. They are numerical concentration levels or narrative statements of indicators established for receiving waters to support and protect the designated EVs for those waters. They are based on scientific criteria or water quality guidelines but may be modified by other (eg social, cultural, economic) inputs. Examples of WQOs include:
• total phosphorus concentration <20 micrograms per litre (µg/L);
• chlorophyll a concentration <1 µg/L;
• dissolved oxygen between 95% and 105% saturation;
• family richness of macroinvertebrate > 12 families; and
• exotic individuals of fish < 5%.
5 The Queensland water quality guidelines can be downloaded from the DERM website at:
http://www.derm.qld.gov.au/environmental_management/water/queensland_water_quality_guidelines/

Logan River environmental values and water quality objectives
4
Water type: groupings of waters with similar characteristics, as shown in the accompanying plan. The water types covered by this document are based on mapping and definitional rules for water types established in the QWQG and, where available, other site-specific documents. Water types can include coastal marine waters (open coastal, enclosed coastal), estuarine waters (lower, middle and upper estuaries), tidal canals, constructed estuaries, marinas and boat harbours, freshwaters (lowland, upland, lakes/reservoirs), wetlands and groundwaters. WQOs applying to different water types are outlined in this document. More detail on water types is provided in section 1.4.
1.2.2 Main parts of this document The main components of this document are:
• Plan WQ1454 – showing the spatial extent and boundaries of water types covered by this document;
• Section 1 – introduction and guidance on how to use the document;
• Section 2 (Table 1) – environmental values (EVs) applying to waters covered by this document;
• Section 3 (Tables 2–13) – water quality objectives (WQOs) applying to different EVs: � Tables 2 to 3 provide WQOs to protect the aquatic ecosystem EV, and closely link to the water
types shown on Plan WQ1454; � Tables 4 to 13 provide WQOs to protect human use EVs;
• Section 4 – ways to improve water quality: containing a list of relevant documents, provided for information purposes only; and
• Section 5 – a dictionary of other terms relevant to EVs and WQOs.
1.2.3 Use of this document Section 2 (Table 1) lists the identified EVs for protection for particular waters. The aquatic ecosystem EV is a default applying to all waters. Reference to section 3 (Tables 2–3) provides the corresponding WQOs to protect the aquatic ecosystem EV. Where relevant, different WQOs are specified to protect the aquatic ecosystem EV in different water types (refer to the tables and the accompanying plan). For the human use EVs specified for a water in Table 1, Tables 4 onwards provide the corresponding WQOs to support these EVs. Where reference to Table 1 indicates more than one EV applies to a given water, the adoption of the most stringent WQO for the identified EVs applies to each water quality indicator in order to protect all identified EVs. Further detail on selection of most stringent WQOs is provided in section 3.
This document also refers to a number of guidelines, codes and other reference sources on water quality. In particular, the Queensland water quality guidelines (QWQG) prepared by DERM provide a technical basis for the water quality objectives contained in this document. The QWQG also provide more detailed information on water types, water quality indicators, derivation of local water quality guidelines, application during flood events, monitoring, predicting and assessing compliance.
1.3 Information about mapped areas and boundaries The boundaries in the accompanying plan WQ1454 are indicative only. The water types and management intent (level of protection) depicted in the accompanying plan are stored in electronic form as part of the South East Queensland Environmental Values Schedule 1 Database July 2010 and held at the offices of DERM at 41 George Street Brisbane. Database regions are based on the regions established in the Queensland water quality guidelines. For further information on accessing the accompanying plan and database, please contact the Department by email at [email protected].

Logan River environmental values and water quality objectives
5
1.4 Water types and basis for boundaries
1.4.1 Water types Waters in this document have been classified into different water types from the list below. The water types are based on the AWQG (2000) and mapping and definitional rules contained in the QWQG (2009). Further detail on water types is contained in these sources.
• open coastal: waters extending to the seaward limits of Queensland waters;
• enclosed coastal/lower estuary: waters occurring at the downstream end of estuaries and including shallow coastal waters in adjacent enclosed bays;
• mid estuary: waters extending the majority of the length of estuaries with a moderate amount of water movement from either freshwater inflow or tidal exchange;
• upper estuary: waters in the upper reaches of estuaries, with limited flushing. This water type is absent from short estuaries, less than 15km total estuary length;
• tidal canals, constructed estuaries, marinas and boat harbours;
• lowland freshwaters: larger slow flowing freshwater streams and rivers, shown on the accompanying plan as freshwaters under 150 metres altitude. This water type has been further divided into three sub types in south east Queensland, derived from work carried out for the Ecosystem Health Monitoring Program
6:
� lowland freshwaters: Larger (third, fourth and fifth order), slow flowing and meandering streams and rivers. Gradient very slight. Substrates sometimes cobble and gravel but more often silt, sand or mud.
� wallum/tannin-stained freshwaters: Tannin-stained, generally low gradient, small to mid-sized
streams, many with sandy substrates and low pH, tea-coloured water draining through wallum vegetation.
� coastal freshwaters: Mix of small and large slow-flowing lowland rivers and creeks between
Caboolture and the NSW border, that flow across the coastal plain. Substrates are often cobble despite the low gradient. Does not include steeper upland streams that feed these systems.
• upland freshwaters: small upland streams, moderate – fast flowing with steeper gradients than lowland freshwaters. Shown on the accompanying plan as freshwaters above 150 metres altitude;
• freshwater lakes/reservoirs;
• groundwaters; and
• wetlands. Water types identified in this document are shown in Tables 2–3 and the accompanying plan (WQ1454).
1.4.2 Water type boundaries The boundaries of different water types have been mapped using a variety of attributes, including:
1) geographic coordinates; 2) catchment or sub-catchment boundaries; 3) highest/lowest astronomical tide; 4) tidal limiting structure (weirs); 5) maritime mapping conventions; 6) coastline; 7) surveyed terrestrial boundaries; and 8) altitude.
The basis of different boundaries is shown in the plan. The boundaries of water types may be confirmed or revised by site investigations. Refer section 1.3 above.
6 Refer Queensland Water Quality Guidelines (DERM, 2009) and EHMP (2004) Ecosystem Health Monitoring
Program 2003-2004 Annual Technical Report. Moreton Bay Waterways and Catchments Partnership.

Logan River environmental values and water quality objectives
6
1.5 Matters for Amendment Amendments of the following type may be made to this schedule 1 document for the purposes of replacement under section 12(2)(b) of the EPP (Water):
• Changes to EVs;
• Changes to management goals;
• Changes to WQOs;
• Changes to management intent (level of protection) categories; • Changes to waterway or water type boundaries/descriptions; and
• Updates to information/data sources, web sites and email contact details, agency/departmental names, other institutional names, references.

Logan River environmental values and water quality objectives
7
2 Environmental values (EVs)
2.1 Environmental Values Table 1 outlines the environmental values (EVs) for waters in the Logan River catchment. These are based on a combination of:
• EVs in the South East Queensland Regional Water Quality Management Strategy, 2001; and
• Work carried out by DERM as part of the EVs/WQOs scheduling process. The dictionary to this document provides further explanation of EVs - refer section 5.
2.2 Management Goals to support EVs There are no management goals specified under this document.

Logan River environmental values and water quality objectives
8
Table 1 Environmental values (EVs) for Logan River catchment waters
Environmental values 1, 2, 3, 4, 5
Aq
uati
c
eco
sy
ste
ms
Seag
ras
s
Irri
gati
on
Farm
S
up
ply
/us
e
Sto
ck
wate
r
Aq
uacu
ltu
re
Hu
man
co
nsu
mer
Oyste
rin
g
Pri
mary
re
cre
ati
on
Seco
nd
ary
re
cre
ati
on
Vis
ua
l r
ec
reati
on
Dri
nkin
g
wate
r
Ind
ustr
ial
use
Cu
ltu
ral an
d
sp
irit
ual
valu
es
Water
Coastal sub-catchment
Logan River – enclosed coastal and estuary
� � � � � � � � �
Scrubby Creek - freshwater
� � � �
Slacks Creek - freshwater
� � � �
California Creek
� � � � � � �
Native Dog Creek
� � � � � � � � � � �
Serpentine Creek
� � � � � �
Southern Redland Bay 6
� � � � � � � � � � �
Other tidal canals, constructed estuaries, marinas and boat harbours (not included in above waters)
� � � � � �
Other estuarine tributaries (not included in above waters)
� � � � �
Other wetlands, lakes and reservoir (not included in above waters)
� � � � � �

Logan River environmental values and water quality objectives
9
Environmental values 1, 2, 3, 4, 5
Aq
uati
c
eco
sy
ste
ms
Seag
ras
s
Irri
gati
on
Farm
S
up
ply
/us
e
Sto
ck
wate
r
Aq
uacu
ltu
re
Hu
man
co
nsu
mer
Oyste
rin
g
Pri
mary
re
cre
ati
on
Seco
nd
ary
re
cre
ati
on
Vis
ua
l r
ec
reati
on
Dri
nkin
g
wate
r
Ind
ustr
ial
use
Cu
ltu
ral an
d
sp
irit
ual
valu
es
Water
Upper sub-catchments
Lake Maroon � � � � � � � � � �7
Lower Teviot Brook � � � � � � � � � � � Eastern Logan River � � � � � � � � � � � � Western Logan River including Knapps Creek and Cannon Creek
� � � � � � � � � � � �
Upper Eastern Logan River including Christmas Creek & Running Creek
�
� � � � � � � � � �7 �
Upper Teviot Brook � � � � � � � � � �7 �
Palen Creek � � � � � � � � � � �7 �
Upper Western Logan River including Burnett Creek
� � � � � � � � � � �
7 �
Other freshwater tributaries (not included in above waters)
� � � � � � � � � � � �
Groundwaters
� � � � � �
Notes: 1. � means the EV is selected for protection. 2. Blank indicates that the EV is not chosen for protection. 3. Seagrass is a component of the aquatic ecosystem EV. Oystering is a component of the human consumer EV. 4. Refer dictionary for further explanation of environmental values. 5. Refer to section 3 for water quality objectives applying to the EVs in this table. 6. Part of Southern Redland Bay area extends into Redland catchment and is shown on Redland Creek Plan WQ1453. 7. Industrial EV identified as a possible future use in all upland sub-catchments of Logan, including Lake Maroon.
Logan River environmental values and water quality objectives
10
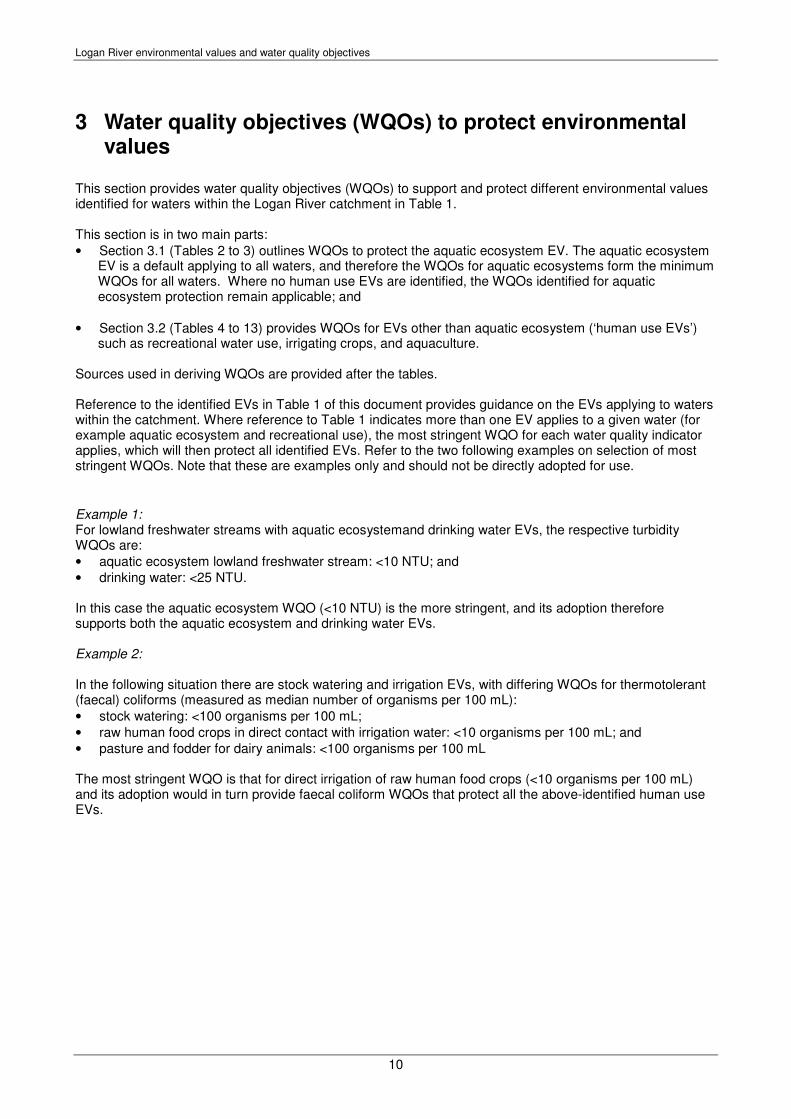
3 Water quality objectives (WQOs) to protect environmental values
This section provides water quality objectives (WQOs) to support and protect different environmental values identified for waters within the Logan River catchment in Table 1. This section is in two main parts:
• Section 3.1 (Tables 2 to 3) outlines WQOs to protect the aquatic ecosystem EV. The aquatic ecosystem EV is a default applying to all waters, and therefore the WQOs for aquatic ecosystems form the minimum WQOs for all waters. Where no human use EVs are identified, the WQOs identified for aquatic ecosystem protection remain applicable; and
• Section 3.2 (Tables 4 to 13) provides WQOs for EVs other than aquatic ecosystem (‘human use EVs’) such as recreational water use, irrigating crops, and aquaculture.
Sources used in deriving WQOs are provided after the tables. Reference to the identified EVs in Table 1 of this document provides guidance on the EVs applying to waters within the catchment. Where reference to Table 1 indicates more than one EV applies to a given water (for example aquatic ecosystem and recreational use), the most stringent WQO for each water quality indicator applies, which will then protect all identified EVs. Refer to the two following examples on selection of most stringent WQOs. Note that these are examples only and should not be directly adopted for use.
Example 1: For lowland freshwater streams with aquatic ecosystemand drinking water EVs, the respective turbidity WQOs are:
• aquatic ecosystem lowland freshwater stream: <10 NTU; and
• drinking water: <25 NTU. In this case the aquatic ecosystem WQO (<10 NTU) is the more stringent, and its adoption therefore supports both the aquatic ecosystem and drinking water EVs. Example 2: In the following situation there are stock watering and irrigation EVs, with differing WQOs for thermotolerant (faecal) coliforms (measured as median number of organisms per 100 mL):
• stock watering: <100 organisms per 100 mL;
• raw human food crops in direct contact with irrigation water: <10 organisms per 100 mL; and
• pasture and fodder for dairy animals: <100 organisms per 100 mL The most stringent WQO is that for direct irrigation of raw human food crops (<10 organisms per 100 mL) and its adoption would in turn provide faecal coliform WQOs that protect all the above-identified human use EVs.

Logan River environmental values and water quality objectives
11
3.1 Water quality objectives (WQOs) to protect aquatic ecosystems This section provides physico-chemical (section 3.1.1), biological (section 3.1.2) and riparian (section 3.1.3) WQOs to support the aquatic ecosystem EV. Sources used in deriving locally relevant WQOs are provided after the tables in each of these sections. Section 5 of the Queensland Water Quality Guidelines 2009 addresses procedures for the application of guidelines for aquatic ecosystem protection. For the comparison of test site monitoring data against water quality objectives, the median concentration of n independent samples at a particular monitoring site should be compared against the water quality objective of the same indicator, water type and level of aquatic ecosystems protection; as listed in Tables 2-13 below.
3.1.1 Physico-chemical WQOs Table 2 below includes the following information:
• water area or water type (column 1) (for boundaries of specified areas, refer to the accompanying plan),
• the corresponding management intent (level of protection) for the identified waters (column 2),
• the corresponding physico-chemical WQOs to achieve the management intent (level of protection) for the identified waters.
The EPP (Water) identifies the management intent (level of protection) for different waters (s 14). In summary:
• It identifies some waters for which the management intent (level of protection) is to maintain or achieve an effectively unmodified waterway condition (high ecological value - HEV). These may include waters that are currently HEV, slightly disturbed, or potentially, more modified waters which can be progressively improved to achieve HEV condition. Any such waters are identified in Columns 1 and 2 of Table 2 and are identified and labelled on the accompanying plan in cross-hatching.
• The management intent (level of protection) for most waters is to achieve a moderately disturbed condition, for which corresponding WQOs have been derived.
• The management intent (level of protection) for highly disturbed waters is that they be progressively improved. Some highly disturbed waters may require a long time frame to return to a moderately disturbed condition level. In some circumstances, interim WOQs that reflect a more highly disturbed condition level (which is an improvement on current condition) may be determined for such waters. Any such locations and their corresponding management intent (level of protection) are also identified in the table and accompanying plan.
Some objectives apply to specific areas or water types as indicated in Table 2 and shown on Plan WQ1454, while others apply to more than one water type, as indicated in the Table.

Logan River environmental values and water quality objectives
12
Table 2a Water quality objectives to protect aquatic ecosystem environmental value (refer to Plan WQ1454 for location of waters) Water area/type
(refer Plan WQ1454)
Management intent (level of
protection)
Water quality objectives to protect aquatic ecosystem EV 1-11
MARINE AND ESTUARINE WATERS
Note: For full coverage of Moreton Bay waters, refer to Moreton
Bay scheduling document and accompanying plan WQ1441
Area S1 – Southern Bay
Aquatic ecosystem – high ecological value
Maintain existing water quality (20th, 50
th and 80
th percentiles),
habitat, biota, flow and riparian areas. (Refer to Appendix D in Queensland Water Quality Guidelines for details.) The 20
th, 50
th and 80
th percentiles of existing water quality for S1
waters are:
• turbidity: 2 – 4 – 7 NTU
• chlorophyll a: 0.6 – 1.2 – 2.0 µg/L
• total nitrogen: 120 – 150 – 200 µg/L
• oxidised N: 2 – 2– 2 µg/L
• ammonia N: 2 – 3 – 5 µg/L
• organic N: 110 – 150 – 190 µg/L
• total phosphorus: 12 – 16 – 24 µg/L
• filterable reactive phosphorus (FRP): 3 – 4 – 8 µg/L
• dissolved oxygen: 95 – 100 – 105% saturation
• pH: 8.1 – 8.2 – 8.4
• secchi depth: 1.2 – 1.8 – 2.7m (note: minimum secchi depth
needed to restore seagrass to areas where it has been lost is
1.7m)
Maintain the existing seagrass depth limit for Zostera muelleri of
-1.3m AHD (50th percentile)
Area HEVa1285– Western Bay
Aquatic ecosystem – high ecological value
Achieve effectively unmodified water quality (20th, 50
th and 80
th
percentiles), habitat, biota, flow and riparian areas. (Refer to Appendix D in Queensland Water Quality Guidelines for details). The 20
th, 50
th and 80
th percentiles to be achieved are:
� turbidity: 2 – 4 – 7 NTU
� chlorophyll a: 0.5 – 1.0 – 2.0 µg/L
� total nitrogen: 120 – 150 – 200 µg/L
� oxidised N: 2 – 2 – 2 µg/L
� ammonia N: 2 – 3 – 5 µg/L
� organic N: 110 – 150 – 190 µg/L
� total phosphorus: 15 – 22 – 30 µg/L
� filterable reactive phosphorus (FRP): 6 – 10 – 14 µg/L
� dissolved oxygen: 95 – 100 – 105% saturation
� pH: 8.1 – 8.2 – 8.4
� secchi depth: 1.3 – 2.0 – 3.0m (note: minimum secchi depth
needed to restore seagrass to areas where it has been lost is
1.7m)
Maintain the existing seagrass depth limit for Zostera muelleri of
-1.9m AHD (50th percentile)
Area S2 – Southern Bay/lower estuary
Aquatic ecosystem –moderately disturbed
� turbidity: <7 NTU
� chlorophyll a: <2.0 µg/L
� total nitrogen: <200 µg/L
� oxidised N: <2 µg/L
� ammonia N: <5 µg/L
� organic N: <190 µg/L
� total phosphorus: <24 µg/L
� filterable reactive phosphorus (FRP): <8 µg/L
� dissolved oxygen: 95 – 105% saturation (20th—>80
th percentile)

Logan River environmental values and water quality objectives
13
Water area/type (refer Plan WQ1454)
Management intent (level of
protection)
Water quality objectives to protect aquatic ecosystem EV 1-11
� pH: 8.1 – 8.4
� secchi depth: >1.2m (20th percentile)
Note: minimum secchi depth needed to restore seagrass to areas
where it has been lost is 1.7m
Maintain the existing seagrass depth limit for Zostera muelleri of
-1.3m AHD (50th percentile)
Mid estuary Aquatic ecosystem –moderately disturbed
� turbidity: <8 NTU
� suspended solids: <20 mg/L
� chlorophyll a: <4 µg/L
� total nitrogen: <300 µg/L
� oxidised N: <10 µg/L
� ammonia N: <10 µg/L
� organic N: <280 µg/L
� total phosphorus: <25 µg/L
� filterable reactive phosphorus (FRP): <6 µg/L
� dissolved oxygen: 85 – 105% saturation (20th—>80
th percentile)
� pH: 7.0 – 8.4
� secchi depth: >1.0m (20th percentile)
Note
For waters shown on the plan as being mid estuary (orange colour) and occurring within inter-tidal zones of Moreton Bay, these waters may have water quality characteristics more in common with adjacent water areas/types (Southern Bay—S2). Under such circumstances, reference should be made to WQOs for the S2 water area shown above.
Upper estuary Aquatic ecosystem – moderately disturbed
� turbidity: <25 NTU
� suspended solids: <25 mg/L
� chlorophyll a: <8 µg/L
� total nitrogen: <450 µg/L
� oxidised N: <15 µg/L
� ammonia N: <30 µg/L
� organic N: <400 µg/L
� total phosphorus: <30 µg/L
� filterable reactive phosphorus (FRP): <10 µg/L
� dissolved oxygen: 80 – 105% saturation (20th—>80
th percentile)
� pH: 7.0 – 8.4
� secchi depth: >0.5m (20th percentile)
Tidal canals, constructed estuaries, marinas and boat harbours
Aquatic ecosystem – moderately disturbed
� turbidity: <8 NTU
� suspended solids: <20 mg/L
� chlorophyll a: <4 µg/L
� total nitrogen: <300 µg/L
� oxidised N: <10 µg/L
� ammonia N: <10 µg/L
� organic N: <280 µg/L
� total phosphorus: <25 µg/L
� filterable reactive phosphorus (FRP): <6 µg/L
� dissolved oxygen: 85 – 105% saturation (20th—>80
th percentile)
� pH: 7.0 – 8.4
� secchi depth: >1.0m (20th percentile)

Logan River environmental values and water quality objectives
14
Water area/type (refer Plan WQ1454)
Management intent (level of
protection)
Water quality objectives to protect aquatic ecosystem EV 1-11
Marine/estuarine waters with seagrass EV chosen
Aquatic
ecosystem –
moderately
disturbed
The minimum WQOs needed to restore seagrass to areas where it
has been lost are:
� median total suspended solids: <10 mg/L;
� median secchi depth: >1.7 m; and
� light attenuation coefficient: >0.9.
However, in areas where seagrass is intact, it is more important to
maintain existing water quality. Therefore the WQOs are:
� local total suspended solids, turbidity, secchi and light
attenuation is maintained; and
� local seagrass distribution and composition is maintained, as
measured by:
• extent of seagrass;
• species diversity; and
• seagrass depth limit.
For ALL marine and estuarine waters within this Table
All
Toxicants in water and sediment as per AWQG (2000):
• Toxicants in water: refer to AWQG section 3.4 - ‘water quality
guidelines for toxicants’ (including Tables 3.4.1, 3.4.2, and
Figure 3.4.1)
• Toxicants in sediments: refer to AWQG section 3.5 - ‘sediment
quality guidelines’ (including Table 3.5.1, Figure 3.5.1)
Release of sewage from vessels to be controlled in accordance with requirements of the Transport Operations (Marine Pollution) Act and Regulations. Comply with Code of Practice for Antifouling and In-water Hull
Cleaning and Maintenance, ANZECC.
Marine/estuarine riparian areas
Aquatic ecosystem –moderately disturbed
Protect or restore riparian areas. Refer section 3.1.3 – riparian area
water quality objectives.
FRESHWATERS
Area HEVm1121 (Daisy Hill)
Aquatic ecosystem – high ecological value
Maintain existing water quality (20th, 50
th and 80
th percentiles),
habitat, biota, flow and riparian areas. (Refer to Appendix D in Queensland Water Quality Guidelines for details.) Note: there is insufficient information available to establish current water quality for these waters. Refer to Appendix D in Queensland Water Quality Guidelines for details on how to establish a minimum water quality data set for deriving local 20
th, 50
th and 80
th
percentiles.
Area HEVm1122 (southern headwaters)
Aquatic ecosystem – high ecological value
Maintain existing water quality (20th, 50
th and 80
th percentiles),
habitat, biota, flow and riparian areas. (Refer to Appendix D in Queensland Water Quality Guidelines for details.) Note: there is insufficient information available to establish current water quality for these waters. Refer to Appendix D in Queensland Water Quality Guidelines for details on how to establish a minimum water quality data set for deriving local 20
th, 50
th and 80
th
percentiles.

Logan River environmental values and water quality objectives
15
Water area/type (refer Plan WQ1454)
Management intent (level of
protection)
Water quality objectives to protect aquatic ecosystem EV 1-11
Upland freshwater Aquatic ecosystem –moderately disturbed
• turbidity: <5 NTU
• suspended solids: <6 mg/L
• chlorophyll a: <2 µg/L
• total nitrogen: <250 µg/L
• oxidised N: <40 µg/L
• ammonia N: <10 µg/L
• organic N: <200 µg/L
• total phosphorus: <30 µg/L
• filterable reactive phosphorus (FRP): <15 µg/L
• dissolved oxygen: (20th—>80
th percentile) 90 – 110% saturation
• pH: 6.5 – 8.2
• conductivity: 780 µS/cm
Lowland freshwater (comprising lowland streams, wallum/tannin-stained streams and coastal streams)
Aquatic ecosystem –moderately disturbed
• turbidity: <10 NTU
• suspended solids: <6 mg/L
• chlorophyll a: <5 µg/L
• total nitrogen: <500 µg/L
• oxidised N: <60 µg/L
• ammonia N: <20 µg/L
• organic N: <420 µg/L
• total phosphorus: <50 µg/L
• filterable reactive phosphorus (FRP): <20 µg/L
• dissolved oxygen: (20th—>80
th percentile) % saturation 85% –
110%
• pH: 6.5 – 8.0
• conductivity: 780 µS/cm Freshwater lakes/reservoirs
Aquatic ecosystem –moderately disturbed
• turbidity range: <5 NTU
• suspended solids: n/d
• chlorophyll a: <5 µg/L
• total nitrogen: <300 µg/L
• oxidised N: <10 µg/L
• ammonia N: <10 µg/L
• organic N: <270 µg/L
• total phosphorus: <10 µg/L
• filterable reactive phosphorus (FRP): <5 µg/L
• dissolved oxygen: (20th—>80
th percentile) 90 – 110% saturation
• pH: 6.5 – 8.0
Area HD1121, HD1122
Aquatic ecosystem –highly disturbed
For highly disturbed areas, refer to AWQG sections 3.3.2.4, 7.4.4:
“For condition 3 waterbodies, derive trigger values from site-specific
biological or ecological effects data or, when an appropriate
reference system(s) has been identified and there are sufficient
resources to collect the necessary information, from local reference
data. In this latter case, depending on management objectives,
define trigger values using a conservative percentile value (e.g. 80th
percentile value) to improve water quality (preferred approach), or a
less conservative percentile (e.g. 90th percentile) to maintain water
quality. Use professional judgement to determine the most
appropriate cut-off percentile. For either condition 2 or condition 3
ecosystems, where there are insufficient information or resources to
undertake the necessary site-specific studies, use the default values
provided that are derived from regional reference data.” (AWQG,
2000; s 3.3.2.4)

Logan River environmental values and water quality objectives
16
Water area/type (refer Plan WQ1454)
Management intent (level of
protection)
Water quality objectives to protect aquatic ecosystem EV 1-11
For ALL freshwaters within this Table
All For additional biological WQOs, see Table 3.
Toxicants in water and sediment as per AWQG (2000):
• Toxicants in water: refer to AWQG section 3.4 - ‘water quality
guidelines for toxicants’ (including Tables 3.4.1, 3.4.2, and
Figure 3.4.1)
• Toxicants in sediments: refer to AWQG section 3.5 - ‘sediment
quality guidelines’ (including Table 3.5.1, Figure 3.5.1)
Comply with Code of Practice for Antifouling and In-water Hull
Cleaning and Maintenance, ANZECC.
Freshwater riparian areas
Aquatic ecosystem –moderately disturbed
Protect or restore riparian areas. Refer section 3.1.3– riparian area
water quality objectives.
Groundwaters (see Table 2b)
Aquatic ecosystem – high ecological value
Where groundwaters interact with surface waters, groundwater quality should not compromise identified EVs and WQOs for those waters.
Note: the AWQG [2000] recommends that that the highest level of
protection should be provided to underground aquatic ecosystems,
given their high conservation value. Where groundwaters are in
good condition the intent is to maintain existing water quality (20th,
50th and 80
th percentiles). Water quality objectives are provided for
specified groundwaters in Table 2b. For all other areas, there is
insufficient information available to establish current water quality
for groundwaters. Refer to Appendix D in Queensland water quality
guidelines for details on how to establish a minimum water quality
data set for deriving local 20th, 50
th and 80
th percentiles.
Wetlands
Aquatic ecosystem –moderately disturbed
Objectives as per AWQG (2000) and section 3.1.3.
Notes: 1. Oxidised N = NO2 + NO3. Units for nitrogen indicators are micrograms per litre (µg/L) N. 2. Units for phosphorus indicators are micrograms per litre (µg/L) P. 3. n/d = no data, n/a = not applicable for this indicator and water type. 4. DO objectives apply to daytime conditions. Lower values may occur at night but these should not be more than
10%–15% less than daytime values. DO values as low as 40% may occur in estuaries for short periods following material inflow events after rainfall. DO values <50% are likely to significantly impact on the ongoing ability of fish to persist in a waterbody. DO values <30% saturation are toxic to some fish species. These DO values should be applied as absolute lower limit objectives for DO. – see also section 4.2 of the QWQG. Very high DO (supersaturation) values can be toxic to some fish as they cause gas bubble disease.
5. DO values for freshwaters should only be applied to flowing waters. Stagnant pools in intermittent streams naturally experience values of DO below 50% saturation.
6. Wallum/tannin-stained waters contain naturally high levels of humic acids (and have a characteristic brown ti-tree stain). In these types of waters, natural pH values may range from 3.6 to 6.
7. During flood events or nil flow periods, pH values should not fall below 5.5 (except in wallum/tannin waters) or exceed 9.
8. Nutrient objectives do not apply during high flow events. See QWQG Section 5 and Appendix D for more information on applying guidelines under high flow conditions.
9. During periods of low flow and particularly in smaller creeks, build up of organic matter derived from natural sources
(e.g. leaf litter) can result in increased organic N levels (generally in the range of 400 to 800µg/L). This may lead to total N values exceeding the WQOs. Provided that levels of inorganic N (i.e. NH3 + oxidised N) remain low, then the elevated levels of organic N should not be seen as a breach of the WQOs, provided this is due to natural causes.

Logan River environmental values and water quality objectives
17
10. Conductivity. Under natural conditions, conductivity is highly dependent on local geology and soil types. The Queensland Water Quality Guidelines 2009 (Appendix G) provides information on conductivity values in a set of 18 defined salinity zones throughout Queensland. For each zone, the Queensland Water Quality Guidelines 2009 provide a range of percentile values based on data from all the sites within that zone. This provides a useful first estimate of background conductivity within a zone. However, even within zones there is a degree of variation between streams and therefore the values for the zone would still need to be ground truthed against local values.
11. Temperature varies both daily and seasonally, it is depth dependent and is also highly site specific. It is therefore not possible to provide simple generic water quality objectives (WQOs) for this indicator. The recommended approach is that local WQOs be developed. Thus, WQOs for potentially impacted streams should be based on measurements from nearby streams that have similar morphology and which are thought not to be impacted by anthropogenic thermal influences. From an ecological effects perspective, the most important aspects of temperature are the daily maximum temperature and the daily variation in temperature. Therefore measurements of temperature should be designed to collect information on these indicators of temperature and, similarly, local WQOs should be expressed in terms of these indicators. Clearly, there will be an annual cycle in the values of these indicators and therefore a full seasonal cycle of measurements is required to develop guideline values.
Sources: The water quality objectives were determined from a combination of documents and supporting data, including:
• Queensland Water Quality Guidelines (2009)
• Australian Water Quality Guidelines (2000)
• water quality guidelines in the Ecosystem Health Monitoring Program (EHMP)
• water quality objectives in local studies and the South East Queensland Regional Water Quality Management Strategy, 2001 (SEQRWQMS)
• Code of Practice for Antifouling and In-water Hull Cleaning and Maintenance, Australian and New Zealand Environment and Conservation Council (1997)
• Transport Operations (Marine Pollution) Act 1995 and Regulations 2008, Queensland Transport
Logan River environmental values and water quality objectives
18
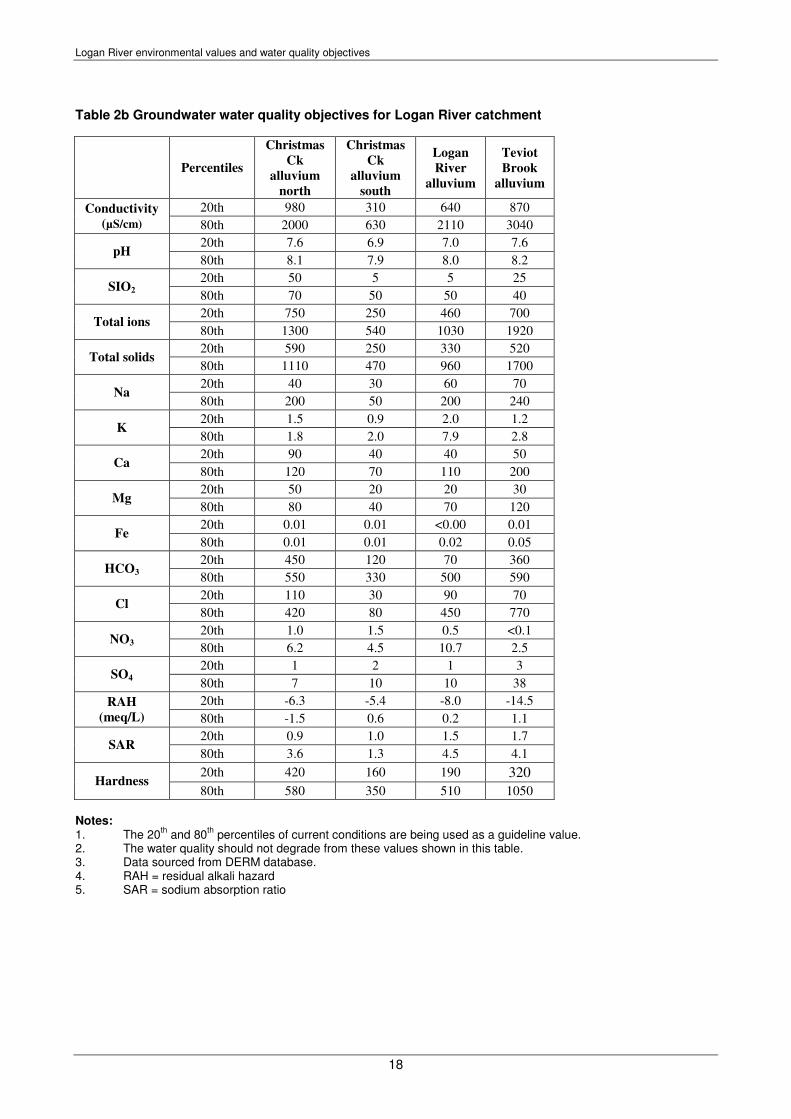
Table 2b Groundwater water quality objectives for Logan River catchment
Percentiles
Christmas
Ck
alluvium
north
Christmas
Ck
alluvium
south
Logan
River
alluvium
Teviot
Brook
alluvium
20th 980 310 640 870 Conductivity
(µS/cm) 80th 2000 630 2110 3040
20th 7.6 6.9 7.0 7.6 pH
80th 8.1 7.9 8.0 8.2
20th 50 5 5 25 SIO2
80th 70 50 50 40
20th 750 250 460 700 Total ions
80th 1300 540 1030 1920
20th 590 250 330 520 Total solids
80th 1110 470 960 1700
20th 40 30 60 70 Na
80th 200 50 200 240
20th 1.5 0.9 2.0 1.2 K
80th 1.8 2.0 7.9 2.8
20th 90 40 40 50 Ca
80th 120 70 110 200
20th 50 20 20 30 Mg
80th 80 40 70 120
20th 0.01 0.01 <0.00 0.01 Fe
80th 0.01 0.01 0.02 0.05
20th 450 120 70 360 HCO3
80th 550 330 500 590
20th 110 30 90 70 Cl
80th 420 80 450 770
20th 1.0 1.5 0.5 <0.1 NO3
80th 6.2 4.5 10.7 2.5
20th 1 2 1 3 SO4
80th 7 10 10 38
20th -6.3 -5.4 -8.0 -14.5 RAH
(meq/L) 80th -1.5 0.6 0.2 1.1
20th 0.9 1.0 1.5 1.7 SAR
80th 3.6 1.3 4.5 4.1
20th 420 160 190 320 Hardness
80th 580 350 510 1050
Notes: 1. The 20
th and 80
th percentiles of current conditions are being used as a guideline value.
2. The water quality should not degrade from these values shown in this table. 3. Data sourced from DERM database. 4. RAH = residual alkali hazard 5. SAR = sodium absorption ratio

Logan River environmental values and water quality objectives
19
3.1.2 Biological WQOs Table 3 provides biological WQOs for freshwaters (lowland streams, wallum/tannin-stained streams and coastal streams, upland streams) as shown on the plan. Table 3 Aquatic ecosystem EV: Biological water quality objectives for freshwater streams (refer to Plan WQ1454 for location of streams)
1, 2, 3, 4, 5
Indicator 4
Percentile used
Wallum /tannin-stained
freshwater
Lowland freshwater
Upland freshwater
Coastal freshwater
Operant 5 Units
Fish
4
Percent of native species expected (PONSE*)
original guideline 100 100 100 100 >= %
Observed to expected species ratio (O/E*) used for all 1 1 1 1 >= ratio (number)
Percent Alien individuals fish indices 0 0 0 0 = %
Invertebrates
4
Richness (family) 20th 11 22 22 22 >= number
PET taxa (taxa sensitive to human disturbance) 20th 3 4 5 4 >= number
SIGNAL score (stream invertebrate grade number average level) 1 = most tolerant 10 = most sensitive 20th 4 4 4.6 4 >= number
Ecological processes 4
Gross primary production (GPP) 80th 0.5 0.5 0.25 0.5 <= gC/m
2/day
Respiration (R24) 80th 0.35 0.35 0.15 0.35 <= gC/m2/day
Carbon isotope ratio measure (Del
13C) 20th -28 -28 -28 -28 >= delta units
Chl a 80th 12 12 8 12 <= mg Chl a/m
2
/day
Nutrient cycling
4
Algal bioassay (N+P)/C 80th 4 4 4 4 <= ratio (number)
Nitrogen isotope ratio measure (Del
15N) 80th 5 5 5 5 <= delta units
Source: Updated based on water quality guidelines in the Ecosystem Health Monitoring Program (EHMP) Notes: 1. Unless otherwise stated, objectives apply to support waters at a moderately disturbed level, and do not apply to high ecological value waters. 2. Refer to Plan WQ1454 for locations of streams. 3. Refer to section 1 of this document for definitions of stream types.

Logan River environmental values and water quality objectives
20
4. More details on the indicators in this table are provided in Appendix E of the QWQG (2009), and the Ecosystem Health Monitoring Program (EHMP) annual technical reports (2002–03, 2003–04).
5. For each indicator the ‘operant’ denotes whether test-site values should be higher than or lower than the specified number to achieve compliance.
* Denotes values for these indices derived from predictive computer models. n/a - model not built using this stream type.
3.1.3 Riparian WQOs For vegetation management relating to waterways, reference should be made to the relevant regional vegetation management codes under the Vegetation Management Act. These codes include performance requirements relating to watercourses and wetlands, aimed at maintaining water quality, bank stability, aquatic and terrestrial habitat. Codes include vegetation clearing controls that vary according to stream order. To review the latest applicable VM code (and other explanatory information) for waters for this area, refer to the vegetation management page on the DERM website. Planning schemes under the Sustainable Planning Act may also specify riparian buffers (for example under catchment protection or waterway codes). The latest planning schemes are accessible from http://www.dip.qld.gov.au/local-area-planning/local-government-planning-schemes.html.
3.1.4 Stormwater design objectives
Stormwater design objectives for urban development are contained in “Urban Stormwater Quality Planning Guidelines 2010” DERM (2010, as amended). Design objectives are specified for both the construction and operational phases of development in accordance with landscape features and the regional location of proposed development. The latest guidelines are available from the DERM website: http://www.derm.qld.gov.au/water/index.html.
Logan River environmental values and water quality objectives
21
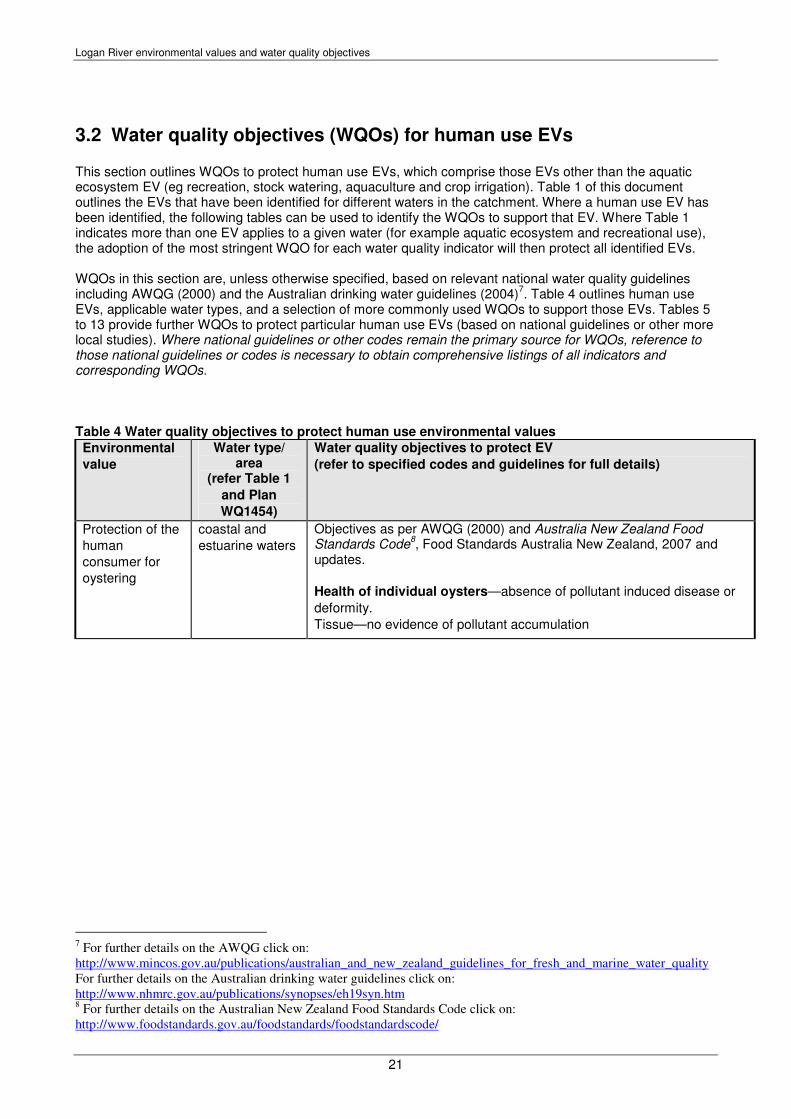
3.2 Water quality objectives (WQOs) for human use EVs This section outlines WQOs to protect human use EVs, which comprise those EVs other than the aquatic ecosystem EV (eg recreation, stock watering, aquaculture and crop irrigation). Table 1 of this document outlines the EVs that have been identified for different waters in the catchment. Where a human use EV has been identified, the following tables can be used to identify the WQOs to support that EV. Where Table 1 indicates more than one EV applies to a given water (for example aquatic ecosystem and recreational use), the adoption of the most stringent WQO for each water quality indicator will then protect all identified EVs. WQOs in this section are, unless otherwise specified, based on relevant national water quality guidelines including AWQG (2000) and the Australian drinking water guidelines (2004)
7. Table 4 outlines human use
EVs, applicable water types, and a selection of more commonly used WQOs to support those EVs. Tables 5 to 13 provide further WQOs to protect particular human use EVs (based on national guidelines or other more local studies). Where national guidelines or other codes remain the primary source for WQOs, reference to those national guidelines or codes is necessary to obtain comprehensive listings of all indicators and corresponding WQOs. Table 4 Water quality objectives to protect human use environmental values
Environmental
value
Water type/ area
(refer Table 1
and Plan
WQ1454)
Water quality objectives to protect EV
(refer to specified codes and guidelines for full details)
Protection of the
human
consumer for
oystering
coastal and
estuarine waters
Objectives as per AWQG (2000) and Australia New Zealand Food Standards Code
8, Food Standards Australia New Zealand, 2007 and
updates.
Health of individual oysters—absence of pollutant induced disease or
deformity.
Tissue—no evidence of pollutant accumulation
7 For further details on the AWQG click on:
http://www.mincos.gov.au/publications/australian_and_new_zealand_guidelines_for_fresh_and_marine_water_quality
For further details on the Australian drinking water guidelines click on:
http://www.nhmrc.gov.au/publications/synopses/eh19syn.htm 8 For further details on the Australian New Zealand Food Standards Code click on:
http://www.foodstandards.gov.au/foodstandards/foodstandardscode/

Logan River environmental values and water quality objectives
22
Environmental
value
Water type/ area
(refer Table 1
and Plan
WQ1454)
Water quality objectives to protect EV
(refer to specified codes and guidelines for full details)
Protection of the
human
consumer
coastal,
estuarine and
freshwaters
Objectives as per AWQG (2000) and Australia New Zealand Food
Standards Code, Food Standards Australia New Zealand, 2007 and
updates.
Fish and Crab Health Health of individuals – absence of pollutant induced disease or deformity. Tissue – no evidence of pollutant accumulation.
Suitability for
primary contact
recreation
coastal,
estuarine and
freshwaters
Objectives as per NHMRC (2008)9, including:
• Water free of physical (floating and submerged) hazards
• Temperature: 16–34°C
• pH: 6.5 – 8.5
• DO: >80%
• Faecal contamination: designated recreational waters are protected against direct contamination with fresh faecal material, particularly of human or domesticated animal origin. Two principal components are required for assessing faecal contamination:
• assessment of evidence for the likely influence of faecal material; and • counts of suitable faecal indicator bacteria (usually enterococci).
• These two components are combined to produce an overall microbial
classification of the recreational water body.
• Intestinal enterococci: 95th %ile ≤40 organisms per 100mL (for
healthy adults) (NHMRC, 2008; Table 5.7)
• Direct contact with venomous or dangerous aquatic organisms should be avoided. Recreational water bodies should be reasonably free of, or protected from, venomous organisms (eg box jellyfish and bluebottles).
• Cyanobacteria/algae - coastal/estuarine: recreational water bodies should not contain ≥ 10 cells/mL Karenia brevis and/or have Lyngbya majuscula and/or Pfiesteria present in high numbers.
• Cyanobacteria/algae – fresh water: recreational water bodies should not contain ≥10 µg/L total microcystins; ≥50 000 cells/mL toxic Microcystis aeruginosa; or biovolume equivalent of ≥4 mm
3/L for the
combined total of all cyanobacteria where a known toxin producer is dominant in the total biovolume; OR ≥10 mm
3/L for total biovolume of
all cyanobacterial material where known toxins are not present; OR• cyanobacterial scums consistently present. Further details contained in Table 5.
Waters contaminated with chemicals that are either toxic or irritating to
the skin or mucous membranes are unsuitable for recreational purposes.
Suitability for
secondary
contact
recreation
coastal,
estuarine and
freshwaters
Objectives as per NHMRC (2008), including:
• intestinal enterococci: 95th %ile ≤40 organisms per 100mL (for
healthy adults).
9 The National Health and Medical Research Council (NHMRC) has updated the recreational water quality guidelines
established in the AWQG (2000). These are available from the NHMRC website at:
http://www.nhmrc.gov.au/_files_nhmrc/file/publications/synopses/eh38.pdf

Logan River environmental values and water quality objectives
23
Environmental
value
Water type/ area
(refer Table 1
and Plan
WQ1454)
Water quality objectives to protect EV
(refer to specified codes and guidelines for full details)
Suitability for
visual recreation
coastal,
estuarine and
freshwaters
Objectives as per NHMRC (2008), including:
• Recreational water bodies should be aesthetically acceptable to recreational users. The water should be free from visible materials that may settle to form objectionable deposits; floating debris, oil, scum and other matter; substances producing objectionable colour, odour, taste or turbidity; and substances and conditions that produce undesirable aquatic life.
Protection of
cultural and
spiritual values
coastal,
estuarine and
freshwaters,
groundwaters
Protect or restore indigenous and non-indigenous cultural heritage
consistent with relevant policies and plans.
Suitability for
industrial use
coastal,
estuarine and
freshwaters
No WQOs are provided in this scheduling document for industrial uses.
Water quality requirements for industry vary within and between
industries. The AWQG (2000) do not provide guidelines to protect
industries, and indicate that industrial water quality requirements need to
be considered on a case-by-case basis. This EV is usually protected by
other values, such as the aquatic ecosystem EV.
Suitability for
aquaculture
coastal,
estuarine and
freshwaters
Objectives as per:
• Tables 6-8; and
• AWQG (2000) and Australia New Zealand Food Standards Code,
Food Standards Australia New Zealand, 2007 and updates.
Suitability for
irrigation
All freshwaters
including
groundwaters
ANZECC objectives for pathogens and metals are provided in Tables 9
and 10. For other indicators, such as salinity, sodicity and herbicides, see
AWQG (2000).
Suitability for
stock watering
All freshwaters
including
groundwaters
Objectives as per AWQG (2000), including median faecal coliforms <100
organisms per 100 mL.
WQOs for total dissolved solids and metals are provided in Tables 11 and
12, based on AWQG (2000).
For other objectives, such as cyanobacteria and pathogens, see AWQG
(2000).
Suitability for
farm supply/use
All freshwaters
including
groundwaters
Objectives as per AWQG (2000).
Suitability for
drinking water
supply
All freshwaters
including
groundwaters
Local WQOs for drinking water supply are provided in Table 13.
Also refer to AWQG (2000) and Australian drinking water guidelines
(ADWG) that discuss how to manage the catchment to minimise the risks
to drinking water supply. ADWG also provides health guideline values for
potable water at the tap.

Logan River environmental values and water quality objectives
24
Table 5 Primary contact recreation EV: Water quality objectives for management of cyanobacteria in contact recreation areas When cyanobacteria are present in large numbers they can present a significant hazard, particularly to primary contact users of waters.
Green level surveillance mode Amber level alert mode Red level action mode
≥ 500 to <500 cells mL
-1
Microsystis aeruginosa or biovolume equivalent of >0.04 to <0.4mm
3 L
-1 for the combined total
of all cyanobacteria.
≥ 5000 to <50 000 cells mL
-1
Microsystis aeruginosa Or ≥ 0.4 to <4 mm
3 L
-1 for the
combined total of all cyanobacteria where a known toxin producer is dominant in the total biovolume Or
≥ 0.5 to <10 mm mm
3 L
-1 for the
combined total of all cyanobacteria where known toxin producers are not present.
Level 1 guideline: ≥ 10 µg L
-1 total microsystins
Or ≥ 50 000 cells mL
-1 toxic
Microsystis aeruginosa Or biovolume equivalent of ≥ 4 mm
3 L
-1 for the combined total of
all cyanobacteria where a known toxin producer is dominant
1 in the
total biovolume Or
2
Level 2 guideline: ≥ 10 mm
3 L
-1 for total biovolume of
all cyanobacterial material where known toxins are not present Or Cyanobacteria scums are consistently present
3.
Source: NHMRC Guideline for Managing Risks in Recreational Water – Cyanobacteria and algae in freshwater NHMRC, 2008. Notes: 1. The definition of “dominant” is where the known toxin producer comprises 75% or more of the total biovolume of
cyanobacteria in a representative sample 2. This applies where high cell densities or scums of “non toxic” cyanobacteria are present i.e. where the
cyanobacterial population has been tested and shown not to contain known toxins (mycrocystins, nodularian, cylindrospermopsin or saxitoxin).
3. This refers to the situation where scums occur at the recreation site each day when conditions are calm, particularly in the morning. Note that it is not likely that scums are always present and visible when there is a high population as the cells may mix down with wind and turbulence and then reform later when conditions become stable.
Logan River environmental values and water quality objectives
25
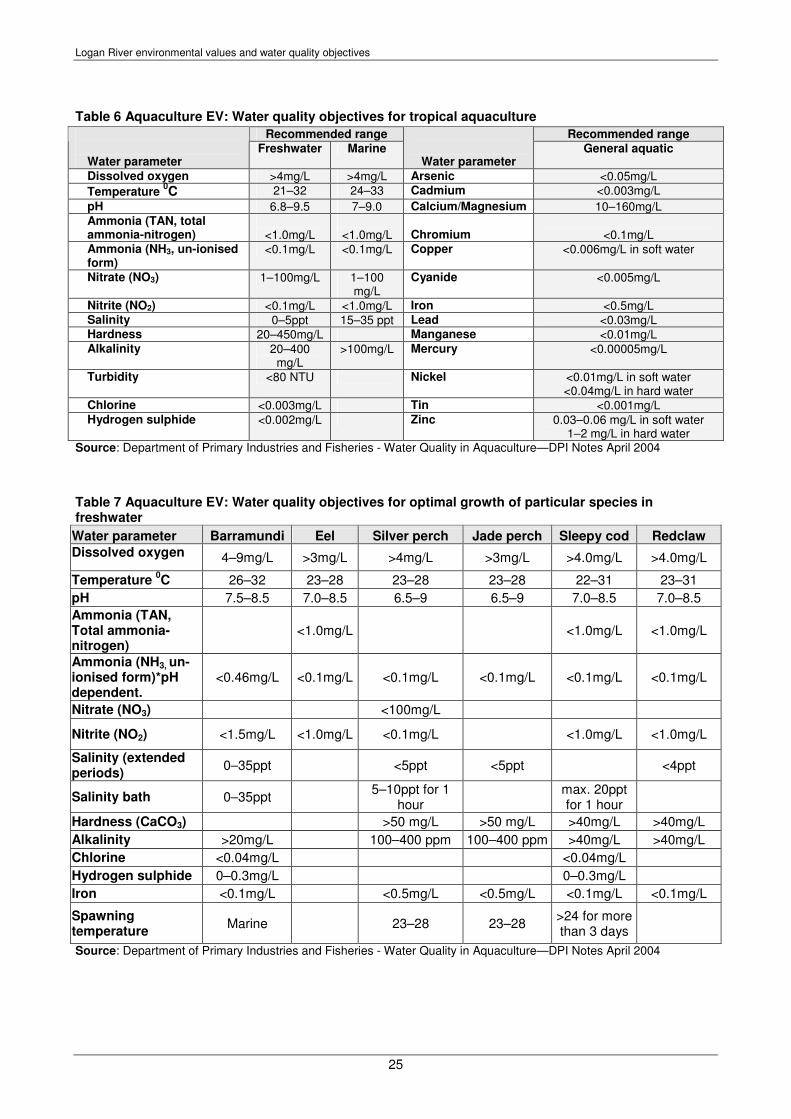
Table 6 Aquaculture EV: Water quality objectives for tropical aquaculture
Source: Department of Primary Industries and Fisheries - Water Quality in Aquaculture—DPI Notes April 2004
Table 7 Aquaculture EV: Water quality objectives for optimal growth of particular species in freshwater
Water parameter Barramundi Eel Silver perch Jade perch Sleepy cod Redclaw
Dissolved oxygen 4–9mg/L >3mg/L >4mg/L >3mg/L >4.0mg/L >4.0mg/L
Temperature 0C 26–32 23–28 23–28 23–28 22–31 23–31
pH 7.5–8.5 7.0–8.5 6.5–9 6.5–9 7.0–8.5 7.0–8.5
Ammonia (TAN, Total ammonia-nitrogen)
<1.0mg/L <1.0mg/L <1.0mg/L
Ammonia (NH3, un-ionised form)*pH dependent.
<0.46mg/L <0.1mg/L <0.1mg/L <0.1mg/L <0.1mg/L <0.1mg/L
Nitrate (NO3) <100mg/L
Nitrite (NO2) <1.5mg/L <1.0mg/L <0.1mg/L <1.0mg/L <1.0mg/L
Salinity (extended periods)
0–35ppt <5ppt <5ppt <4ppt
Salinity bath 0–35ppt 5–10ppt for 1
hour
max. 20ppt for 1 hour
Hardness (CaCO3) >50 mg/L >50 mg/L >40mg/L >40mg/L
Alkalinity >20mg/L 100–400 ppm 100–400 ppm >40mg/L >40mg/L
Chlorine <0.04mg/L <0.04mg/L
Hydrogen sulphide 0–0.3mg/L 0–0.3mg/L
Iron <0.1mg/L <0.5mg/L <0.5mg/L <0.1mg/L <0.1mg/L
Spawning temperature
Marine 23–28 23–28 >24 for more than 3 days
Source: Department of Primary Industries and Fisheries - Water Quality in Aquaculture—DPI Notes April 2004
Recommended range Recommended range Water parameter
Freshwater Marine
Water parameter General aquatic
Dissolved oxygen >4mg/L >4mg/L Arsenic <0.05mg/L
Temperature 0C 21–32 24–33 Cadmium <0.003mg/L
pH 6.8–9.5 7–9.0 Calcium/Magnesium 10–160mg/L Ammonia (TAN, total ammonia-nitrogen)
<1.0mg/L
<1.0mg/L
Chromium
<0.1mg/L
Ammonia (NH3, un-ionised form)
<0.1mg/L <0.1mg/L Copper <0.006mg/L in soft water
Nitrate (NO3) 1–100mg/L 1–100 mg/L
Cyanide <0.005mg/L
Nitrite (NO2) <0.1mg/L <1.0mg/L Iron <0.5mg/L Salinity 0–5ppt 15–35 ppt Lead <0.03mg/L Hardness 20–450mg/L Manganese <0.01mg/L Alkalinity 20–400
mg/L >100mg/L Mercury <0.00005mg/L
Turbidity <80 NTU Nickel <0.01mg/L in soft water <0.04mg/L in hard water
Chlorine <0.003mg/L Tin <0.001mg/L Hydrogen sulphide <0.002mg/L Zinc 0.03–0.06 mg/L in soft water
1–2 mg/L in hard water

Logan River environmental values and water quality objectives
26
Table 8 Aquaculture EV: Water quality objectives for optimal growth of particular marine species
Water parameter Barramundi Tiger prawn Kuruma prawn
Hatchery Grow out Hatchery Grow out Grow out
Dissolved oxygen Saturation >4.0mg/L >4.0mg/L >3.5mg/L >4.0mg/L
Temperature 0C
28–30 optimum 25–
31 range
28–30 optimum
26–32 24
pH ~ 8 ~ 8 ~ 8 7.5–8.5 7.5–8.5
Ammonia (TAN, total ammonia-nitrogen)
0.1–0.5 mg/L
Ammonia (NH3, un-ionized form)
<0.1mg/L <0.1mg/L <0.1mg/L <0.1mg/L <0.1mg/L
Nitrate (NO3) <1.0mg/L <1.0mg/L <1.0mg/L <1.0mg/L <1.0mg/L
Nitrite (NO2) <0.2mg/L <20mg/L <0.2mg/L <0.2mg/L <0.2mg/L
Salinity 28–31ppt 0–35ppt 10–25ppt optimum
30–35 ppt optimum
Alkalinity 105–125mg/L
CaCO3
Clarity 30–40cm
Secchi disk 30–40cm
Secchi disk
Hydrogen sulphide <0.3mg/L
Iron <0.02mg/L <1.0mg/L
Spawning temperature
28–32 *strain
dependent 27–32
Source: Department of Primary Industries and Fisheries - Water Quality in Aquaculture—DPI Notes April 2004
Logan River environmental values and water quality objectives
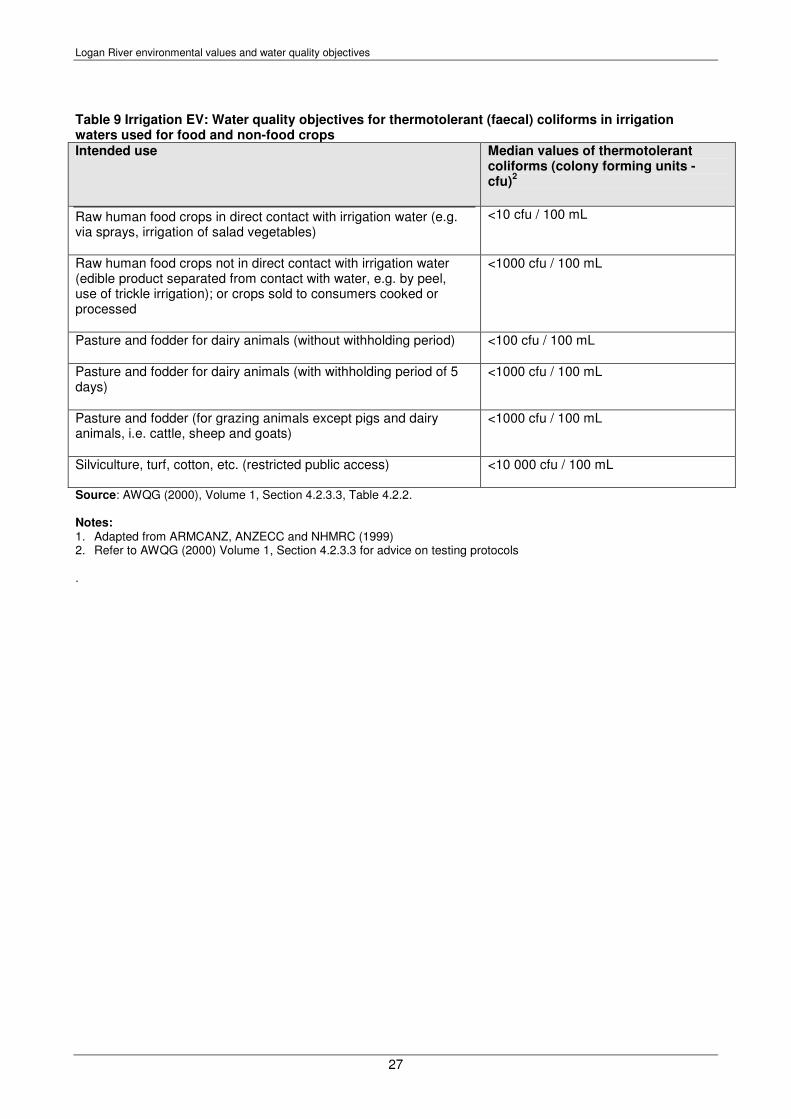
27
Table 9 Irrigation EV: Water quality objectives for thermotolerant (faecal) coliforms in irrigation waters used for food and non-food crops
Intended use Median values of thermotolerant coliforms (colony forming units - cfu)
2
Raw human food crops in direct contact with irrigation water (e.g. via sprays, irrigation of salad vegetables)
<10 cfu / 100 mL
Raw human food crops not in direct contact with irrigation water (edible product separated from contact with water, e.g. by peel, use of trickle irrigation); or crops sold to consumers cooked or processed
<1000 cfu / 100 mL
Pasture and fodder for dairy animals (without withholding period)
<100 cfu / 100 mL
Pasture and fodder for dairy animals (with withholding period of 5 days)
<1000 cfu / 100 mL
Pasture and fodder (for grazing animals except pigs and dairy animals, i.e. cattle, sheep and goats)
<1000 cfu / 100 mL
Silviculture, turf, cotton, etc. (restricted public access) <10 000 cfu / 100 mL
Source: AWQG (2000), Volume 1, Section 4.2.3.3, Table 4.2.2. Notes: 1. Adapted from ARMCANZ, ANZECC and NHMRC (1999) 2. Refer to AWQG (2000) Volume 1, Section 4.2.3.3 for advice on testing protocols .

Logan River environmental values and water quality objectives
28
Table 10 Irrigation EV: Water quality objectives for heavy metals and metalloids in agricultural irrigation water
1 – long-term trigger value (LTV), short-term trigger value (STV) and soil cumulative
contamination loading limit (CCL) Element Soil cumulative
contaminant loading limit (CCL - kg/ha)
2
Long-term trigger value (LTV) in irrigation water (up to 100 yrs) (mg/L)
Short-term trigger value (STV) in irrigation water (up to 20 yrs) (mg/L)
Aluminium ND 5 20
Arsenic 20 0.1 2.0 Beryllium ND 0.1 0.5
Boron ND 0.5 Refer to AWQG (2000) Vol 3,Table 9.2.18
Cadmium 2 0.01 0.05
Chromium ND 0.1 1
Cobalt ND 0.05 0.1
Copper 140 0.2 5
Fluoride ND 1 2
Iron ND 0.2 10
Lead 260 2 5
Lithium ND 2.5 (0.075 for Citrus crops)
2.5 (0.075 for Citrus crops)
Manganese ND 0.2 10
Mercury 2 0.002 0.002
Molybdenum ND 0.01 0.05
Nickel 85 0.2 2
Selenium 10 0.02 0.05
Uranium ND 0.01 0.1
Vanadium ND 0.1 0.5
Zinc 300 2 5
Source: AWQG (2000), Volume 1, Section 4.2.6, Table 4.2.10 Notes: 1. Concentrations in irrigation water should be less than the trigger values. Trigger values should only be used in
conjunction with information on each individual element and the potential for off-site transport of contaminants (refer AWQG [2000], Volume 3, Section 9.2.5)
2. ND = Not determined; insufficient background data to calculate CCL
Logan River environmental values and water quality objectives
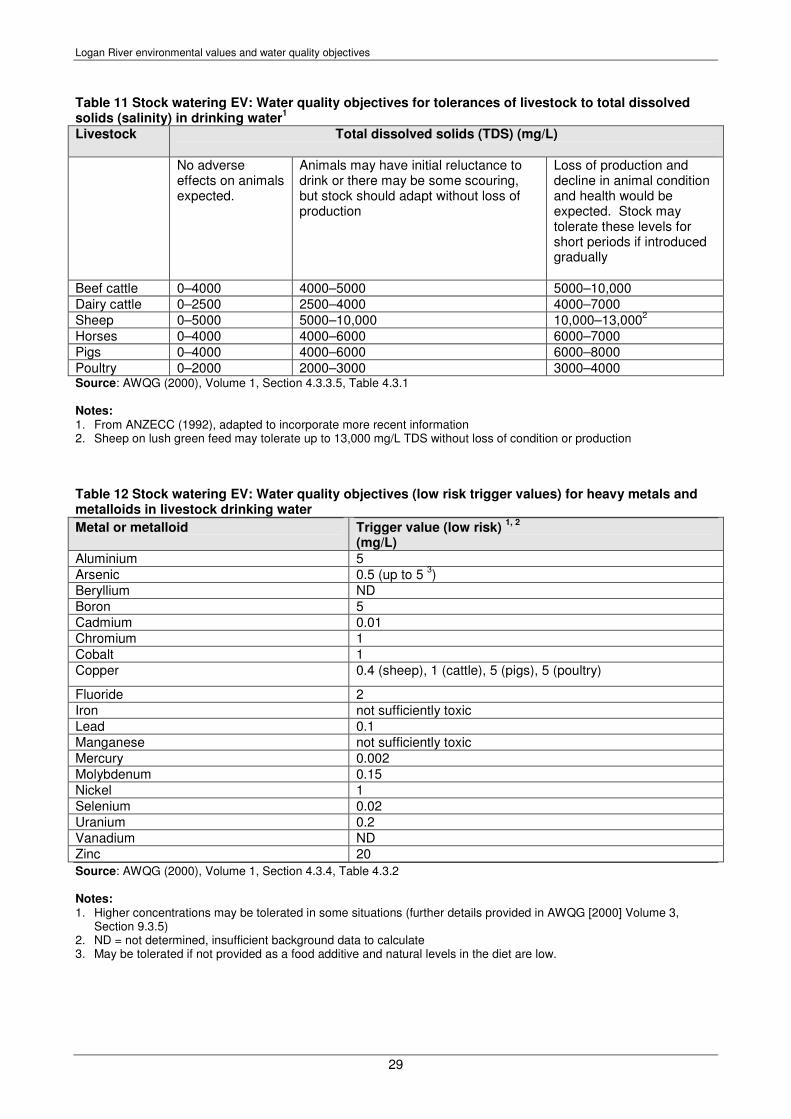
29
Table 11 Stock watering EV: Water quality objectives for tolerances of livestock to total dissolved solids (salinity) in drinking water
1
Livestock Total dissolved solids (TDS) (mg/L)
No adverse effects on animals expected.
Animals may have initial reluctance to drink or there may be some scouring, but stock should adapt without loss of production
Loss of production and decline in animal condition and health would be expected. Stock may tolerate these levels for short periods if introduced gradually
Beef cattle 0–4000 4000–5000 5000–10,000
Dairy cattle 0–2500 2500–4000 4000–7000
Sheep 0–5000 5000–10,000 10,000–13,0002
Horses 0–4000 4000–6000 6000–7000
Pigs 0–4000 4000–6000 6000–8000
Poultry 0–2000 2000–3000 3000–4000 Source: AWQG (2000), Volume 1, Section 4.3.3.5, Table 4.3.1 Notes: 1. From ANZECC (1992), adapted to incorporate more recent information 2. Sheep on lush green feed may tolerate up to 13,000 mg/L TDS without loss of condition or production
Table 12 Stock watering EV: Water quality objectives (low risk trigger values) for heavy metals and metalloids in livestock drinking water
Metal or metalloid Trigger value (low risk) 1, 2
(mg/L)
Aluminium 5
Arsenic 0.5 (up to 5 3)
Beryllium ND
Boron 5
Cadmium 0.01
Chromium 1
Cobalt 1
Copper 0.4 (sheep), 1 (cattle), 5 (pigs), 5 (poultry)
Fluoride 2
Iron not sufficiently toxic
Lead 0.1
Manganese not sufficiently toxic
Mercury 0.002
Molybdenum 0.15
Nickel 1
Selenium 0.02
Uranium 0.2
Vanadium ND
Zinc 20
Source: AWQG (2000), Volume 1, Section 4.3.4, Table 4.3.2 Notes: 1. Higher concentrations may be tolerated in some situations (further details provided in AWQG [2000] Volume 3,
Section 9.3.5) 2. ND = not determined, insufficient background data to calculate 3. May be tolerated if not provided as a food additive and natural levels in the diet are low.

Logan River environmental values and water quality objectives
30
Table 13 Drinking water EV: Priority water quality objectives for drinking water supply in the vicinity of off-takes, including groundwater, before treatment
Indicator Water quality objectives
Hardness
60-200 mg/L (as CaCO3) Refer ADWG (treated water guideline)
Taste and odour
5 µg/L Geosmin or 10 µg/L MIB or 10 µg/L combined Geosmin & MIB
Cyanotoxins (specific
assessment of
treatment step
efficiencies for each
toxin is required)
Saxitoxin 3 µg/L (ADWG health alert value for acute exposure; and
SEQWater Toxic Cyanobacteria Risk Assessment 2006)
Mycrocystin 1.3 µg/L (ADWG treated water guideline)
Cylindrospermopsin 1 µg/L
Cryptosporidium
0 oocyst
Giardia
0 cyst
E. coli 100 cfu/100mL
(ensure sufficient turbidity reduction and chlorine contact:dose)
Manganese (soluble)
50 µg/L
Iron (soluble)
50 µg/L
Turbidity 25 NTU for WTP designed for offtakes from open water storages
50 NTU for WTP designed for offtakes in riverine (weir) systems
Colour
50 Hazen Units
Conductivity/TDS See ADWG (no treatment options to remove salt) 500 mg/L TDS. Site
specific conversion to conductivity required. ADWG recommends
average multiplication factor of 2 to derive conductivity (µs/cm):
1000 µs/cm
Dissolved oxygen
4 mg/L at water surface
Pesticides Presence at detectable levels (detection limits specified by Qld Health
Scientific Services)
Dissolved Organic
Carbon
10 mg/L
Source: Queensland Bulk Water Supply Authority Trading as: Seqwater

Logan River environmental values and water quality objectives
31
4 Ways to improve water quality The following documents are relevant in considering ways to improve water quality in the Logan River catchment. The document list below is additional to the plans, guidelines and other sources referred to in previous sections, and is provided for information only.
• Council planning scheme and supporting codes, policies
• Logan River Catchment and Stormwater Management Plan Stage 1 2008
• Logan River Processes Study
• Development guidelines for water quality management in drinking water catchments (Seqwater)
• South East Queensland Regional Plan 2009 - 2031
• South East Queensland Natural Resource Management Plan 2009-2031
• South East Queensland Healthy Waterways Strategy 2007-2012
• South East Queensland Regional Water Quality Management Strategy September 2001
• Queensland Water Quality Guidelines 2009 (DERM)
• Monitoring and Sampling Manual 2009 (DERM)
• Draft Queensland Coastal Plan
• Memorandum of Understanding between the Queensland Government and Queensland Farmers’ Federation relating to Farm Management Systems 2005
• Queensland Water Plan 2005 – 2010 An action plan to meet our future water needs, Queensland Government, August 2005
• Managing riparian widths to achieve multiple objectives, fact sheet 13, Land and Water Australia, Australian Government, 2004.
• Improving water quality, fact sheet 3, Land & Water Australia, Australian Government, 2002.
• Riparian Land Management Technical Guidelines – Volume 1 and 2, November 1999, Land and Water Resources Research and Development Corporation (LWRRDC)
• Guidelines for Queensland Streambank Stabilisation with Riparian Vegetation, CRC for Catchment Hydrology, September 1999
• Restoration of Fish Habitats – Fisheries Guidelines for Marine Areas, FHG002, Fisheries Group, Department of Primary Industries, October 1998
• Fisheries Guidelines for Fish Habitat Buffer Zones, FHG003, Fisheries Group, Department of Primary Industries, August 2000
• Guidelines for Riparian Filter Strips for Queensland Irrigators, CSIRO Land and Water, September 1999

Logan River environmental values and water quality objectives
32
5 Dictionary AMTD means the adopted middle thread distance which is the distance in kilometres, measured along the middle of a watercourse, that a specific point in the watercourse is from the watercourse’s mouth or junction with the main watercourse (definition based on Water Regulation 2002). ANZECC means the Australian and New Zealand Environment and Conservation Council. Aquatic ecosystems (defined in the AWQG, 2000): comprise the animals, plants and micro-organisms that live in water, and the physical and chemical environment and climatic regime in which they interact. It is predominantly the physical components (eg light, temperature, mixing, flow, habitat) and chemical components (eg organic and inorganic carbon, oxygen, nutrients) of an ecosystem that determine what lives and breeds in it, and therefore the structure of the food web. Biological interactions (eg grazing and predation) can also play a part in structuring many aquatic ecosystems. ARMCANZ means the Agriculture and Resource Management Council of Australia and New Zealand. Basin means the Basin name and number provided by Geoscience Australia, Canberra (3
rd edition, 2004).
Biological integrity, of water, means the water’s ability to support and maintain a balanced, integrative, adaptive community of organisms having a species composition, diversity and functional organisation comparable to that of the natural habitat of the locality in which the water is situated. Catchment means the total area draining into a river, creek, reservoir or other body of water. The limits of a given catchment are the heights of land (such as hills or mountains) separating it from neighbouring catchments. Catchments can be made up of smaller sub-catchments. Ecological health (defined in the AWQG, 2000): means the ‘health’ or ‘condition’ of an ecosystem. It is the ability of an ecosystem to support and maintain key ecological processes and organisms so that their species compositions, diversity and functional organisations are as comparable as possible to those occurring in natural habitats within a region (also termed ecological integrity). Environmental value (EV) means: (a) a quality or physical characteristic of the environment that is conducive to ecological health or public amenity or safety; or (b) another quality of the environment identified and declared to be an environmental value under an Environmental Protection Policy or Regulation (e.g. water suitable for swimming in or drinking). The EVs for water that can be identified for protection are outlined in Table 14 Highest astronomical tide (HAT) (defined in Marine Parks (Declaration) Regulation 2006): means the highest level of the tides that can be predicted to occur under average meteorological conditions and under any combination of astronomical conditions. High water mark (defined in Coastal Protection and Management Act 1995): means the ordinary high water mark at spring tides. Mean high water spring: refer high water mark. Queensland waters (as defined in Acts Interpretation Act 1954): means all waters that are a) within the limits of the State; or b) coastal waters of the State. Sub-catchment means part of a catchment.

Logan River environmental values and water quality objectives
33
Table 14 Suite of environmental values that can be chosen for protection
Environmental values and definitions
ICON
Aquatic ecosystem: “a community of organisms living within or adjacent to water, including riparian or foreshore areas”. (EPPW, schedule 2) The intrinsic value of aquatic ecosystems, habitat and wildlife in waterways and riparian areas – for example, biodiversity, ecological interactions, plants, animals, key species (such as turtles, platypus, seagrass and dugongs) and their habitat, food and drinking water. Waterways include perennial and intermittent surface waters, groundwaters, tidal and non-tidal waters, lakes, storages, reservoirs, dams, wetlands, swamps, marshes, lagoons, canals, natural and artificial channels and the bed and banks of waterways. (This EV incorporates the “Wildlife habitat” EV used in the South East Queensland Regional Water Quality Management Strategy - SEQRWQMS.) See below for more details on aquatic ecosystems, based on the EPP Water.
High ecological/conservation value waters “Waters in which the biological integrity of the water is effectively unmodified or highly valued.” (EPPW, schedule 2)
None
Slightly–disturbed waters “Waters that have the biological integrity of high ecological value waters with slightly modified physical or chemical indicators but effectively unmodified biological indicators” (EPPW, schedule 2)
None
Moderately disturbed waters “Waters in which the biological integrity of the water is adversely affected by human activity to a relatively small but measurable degree.” (EPPW, schedule 2)
None
Highly disturbed waters “Waters that are significantly degraded by human activity and have lower ecological value than high ecological value waters or slightly or moderately disturbed waters.” (EPPW, schedule 2)
None
Seagrass (Goal within the Aquatic ecosystem EV): Maintenance or rehabilitation of seagrass habitat. (Applies only to tidal waterways.)
Irrigation: Suitability of water supply for irrigation - for example, irrigation of crops, pastures, parks, gardens and recreational areas.
Farm Water Supply/use: Suitability of domestic farm water supply, other than drinking water. For example, water used for laundry and produce preparation.

Logan River environmental values and water quality objectives
34
Environmental values and definitions
ICON
Stock Watering: Suitability of water supply for production of healthy livestock.
Aquaculture: Health of aquaculture species and humans consuming aquatic foods (such as fish, molluscs and crustaceans) from commercial ventures.
Human consumers of aquatic foods: Health of humans consuming aquatic foods — such as fish, crustaceans and shellfish from natural waterways. Note that in some areas oystering is a more specific goal identified under the human consumer EV (see below).
Oystering (Goal within the EV of Human consumers of aquatic foods): Health of humans consuming oysters from natural waterways and commercial ventures. (Applies only to tidal waterways.)
Primary recreation: Health of humans during recreation which involves direct contact and a high probability of water being swallowed — for example, swimming, surfing, windsurfing, diving and water-skiing. Primary recreational use, of water, means full body contact with the water, including, for example, diving, swimming, surfing, waterskiing and windsurfing. (EPPW, s6)
Secondary recreation: Health of humans during recreation which involves indirect contact and a low probability of water being swallowed — for example, wading, boating, rowing and fishing. Secondary recreational use, of water, means contact other than full body contact with the water, including, for example, boating and fishing. (EPPW, s6)
Visual recreation: Amenity of waterways for recreation which does not involve any contact with water — for example, walking and picnicking adjacent to a waterway.
Visual recreational use, of a water, means viewing the water without contact with it. (EPPW, s6)
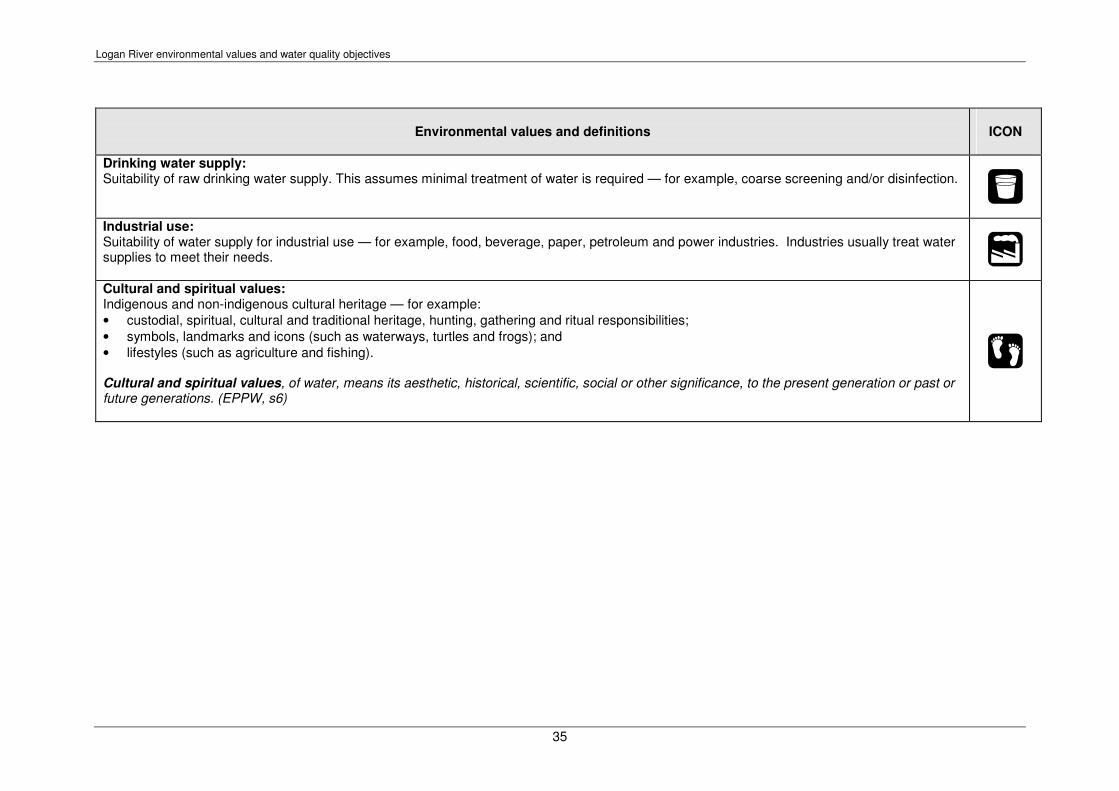
Logan River environmental values and water quality objectives
35
Environmental values and definitions
ICON
Drinking water supply: Suitability of raw drinking water supply. This assumes minimal treatment of water is required — for example, coarse screening and/or disinfection. Industrial use: Suitability of water supply for industrial use — for example, food, beverage, paper, petroleum and power industries. Industries usually treat water supplies to meet their needs.
Cultural and spiritual values: Indigenous and non-indigenous cultural heritage — for example:
• custodial, spiritual, cultural and traditional heritage, hunting, gathering and ritual responsibilities;
• symbols, landmarks and icons (such as waterways, turtles and frogs); and
• lifestyles (such as agriculture and fishing). Cultural and spiritual values, of water, means its aesthetic, historical, scientific, social or other significance, to the present generation or past or future generations. (EPPW, s6)


![Water Plan (Logan Basin) 2007queenslandwaterbrokers.com/.../2016/12/WatResLBP07.pdf · [s 1] Water Plan (Logan Basin) 2007 Part 1 Preliminary Current as at 6 December 2016 Page 5](https://static.fdocuments.in/doc/165x107/5b627ae67f8b9a4f488d9730/water-plan-logan-basin-2007qu-s-1-water-plan-logan-basin-2007-part-1-preliminary.jpg)