Locational analysis
16
Fakta Østergade, Frederikssund Mapicture Catchment area analysis - Week , Year
-
Upload
samo-olsen -
Category
Real Estate
-
view
38 -
download
0
Transcript of Locational analysis
Fakta Østergade, FrederikssundMapicture Catchment area analysis - Week 37, Year 2016
Imprint
Publisher: MapictureAuthor: Samo Olsen
SourcesData: Danmarks Statistik or Mapicture ReportsMap: The �ee basic data (De �ie grunddata) �om the Danish Geodata Agency, July2015Trasport times: Rejseplanen and AAU Speedmap data.
RightsMapicture may not rent, lease or transfer these analyses and data to othercompanies within the group. Any transfer of data and analyses to other companiescan be done only with the prior written permission of Mapicture ApS. Any kind of rulein�ingement is considered a material breach.Mapicture alone has a literal responsibility towards third parties.It is considered the reservation for a revised legislation if the data delivered toMapicture or the right of Mapicture to provide data ApS should change.

Table of contentsFakta Østergade, Frederikssund 1
1 Introduction 4
2 Catchment areas with Bicycle in 10 min. 5
3 Population change 6
4 Population change 2008-2015 7
5 Population change on city level 8
6 Households which are being competed for 9
7 Market share 11
8 Socio-economic situation 15
9 Tra�c 16
M a p i c t u r e C a t c h m e n t a r e a a n a l y s i s
3

1 IntroductionGraphical catchment area analysis
The aim of this report is to document the terms and conditions for the placement of supermarkets. Themethod is based on reports of data �om di�erent sources. The results represent the best possible calcu-lations of the catchment areas (measure in transport time) and are used to build up new methods.
Analysis points
Name Category Transport Interval TimeFakta Frederikssund Fakta Bicycle 10 min. 2016-09-16 16:00
Statistics for within the catchment areaThe calculation of the number of households, income and market shares is based on data that are eithergrouped or averaged. The results are therefore always subject to some uncertainty. The placement ofa new supermarket can therefor change the existing conditions and can thus change the in�uence, thedevelopment of transport and much more.
With this in mind, you should conservatively apply conditions and decide on that basis.
Have fun reading!
Samo OlsenMapicture
M a p i c t u r e C a t c h m e n t a r e a a n a l y s i s
4

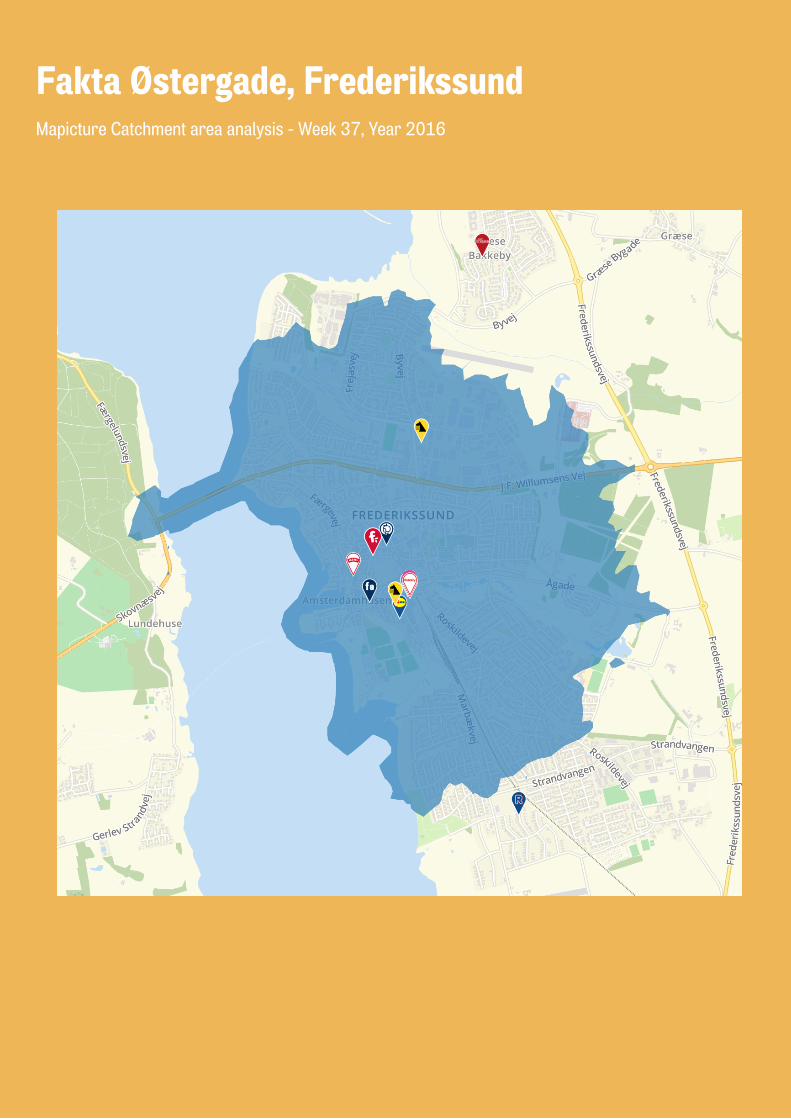
2 Catchment areas with Bicycle in 10 min.Fakta Frederikssund
The map shows the catchment areas �om Fakta Frederikssund.
The total market is 336,276,277 DKK including VAT. The total number of households in the catchment area is 6,334.
M a p i c t u r e C a t c h m e n t a r e a a n a l y s i s
5

3 Population changeFrederikssund Municipalities
M a p i c t u r e C a t c h m e n t a r e a a n a l y s i s
6
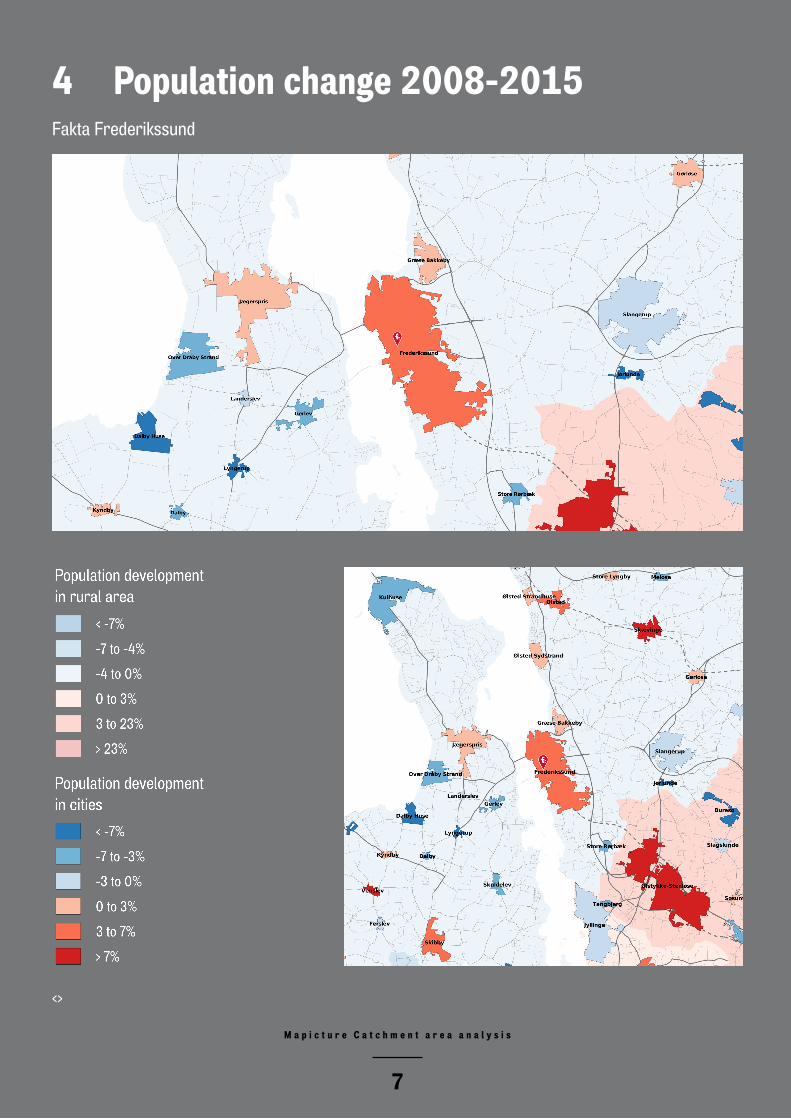
4 Population change 2008-2015Fakta Frederikssund
<>
M a p i c t u r e C a t c h m e n t a r e a a n a l y s i s
7

5 Population change on city levelFrederikssund
Immigrated persons by city
København 166Græse Bakkeby 88Jægerspris 58Ølstykke-Stenløse 56Slangerup 39
Emigrated persons by city
København 147Græse Bakkeby 76Jægerspris 60Landdistrikter 38Slangerup 32
M a p i c t u r e C a t c h m e n t a r e a a n a l y s i s
8

6 Households which are being compe-ted for
Fakta Frederikssund
Competition single chains
The cicle diagram and the table show the division of the households �om with the catchment area �omFakta Frederikssund that are also being covered by competing supermarkets.
Netto
17%
Føtex Dagligvarer
10%
MENY Dagligvarer
10%Irma Dagligvarer
10%
Kvickly Dagligvarer10%
Fakta
10%
ALDI
10%
Normal
10%LIDL
9%
Others4%
Chain Address % Household Income % CarIrma Dagligvarer Lundevej 1,3600 Frederikssund 10.0 577,524 51Kvickly Dagligvarer Nygade 1,3600 Frederikssund 9.9 575,294 51MENY Dagligvarer Havnegade 9,3600 Frederikssund 9.8 573,244 51ALDI Nygade 8-10,3600 3600 Frederikssund 9.8 574,260 51Normal Nygade 1,3600 Frederikssund 9.8 574,349 51Føtex Dagligvarer Kalvøvej 2 A,3600 Frederikssund 9.7 573,063 51Fakta Nygade 1 Lokale 1 Lokale,3600 Frederikssund 9.7 573,006 51Netto Nygade 16-18,3600 Frederikssund 9.7 572,200 51LIDL A.C. Hansensvej 2,3600 Frederikssund 9.3 569,350 51Netto Holmensvej 2,3600 Frederikssund 7.8 534,746 50REMA 1000 Marbækvej 43 B,3600 Frederikssund 3.2 632,821 53DagliBrugsen Højvang 5,3600 Frederikssund 1.4 573,685 54
M a p i c t u r e C a t c h m e n t a r e a a n a l y s i s
9

The map shows the competition per inhabited 100 meter square grid cell in the catchment area.
The numbers in the grid cells indicate how many supermarkets can be reached �om a household withina given transport time.
Large Symbol = Focus supermarketNormal symbol = Other supermarkets
M a p i c t u r e C a t c h m e n t a r e a a n a l y s i s
10

7 Market shareFakta Frederikssund
This section shows the calculation of real key data in the catchment area.
The method is based on a weighting of the number of households per municipality, the average consump-tion per household (incl. VAT), the average household income, the percentage distribution of householdswith or without cars and the level of training.
Yearly consumption and market by household type
Household type Consumption p. household Count Market
Single 31,074 2,371 73,676,454
Single w. child 46,638 469 21,873,222
Couple 59,065 1,677 99,052,005
Couple w. child 76,588 1,297 99,334,636
Others 81,423 520 42,339,960
Sum - 6,334 336,276,277
Market share
Lokation No. of households Market total in DKK Market share in % Turnover in DKK
Fakta Frede-rikssund
6,334 336,276,277 8.2 27,500,000
Summerhouses by municipality
Municipality Count Weeks booked Yerly consumption p. house
Frederikssund 111 1,796 20,904
This table shows the calculated consumption per summer house for every municipality intersecting thecatchment area. The di�erences in the yearly consumption arise �om di�erences in the ratio ofdanish/foreign tourists and in the degree of capacity utilization.
M a p i c t u r e C a t c h m e n t a r e a a n a l y s i s
11

Market by consumption categories
Consumption category Consumption p. household* Market*Rice 690 773,198Flours and other cereals 733 748,131Bread 10,679 11,674,221Other bakery products 5,864 6,696,731Pizza and quiche 736 831,454Pasta products and couscous 1,486 1,540,481Breakfast cereals 1,707 1,827,844Other cereal products 827 856,316Beef and veal 11,085 12,228,555Pork 7,460 8,496,877Lamb and goat 1,010 1,220,906Poultry 6,850 7,508,424Dried, salted or smoked meat 8,099 9,120,320Other meat preparations 9,050 10,314,330Fresh or chilled �sh 1,689 2,159,196Frozen �sh 674 776,558Fresh or chilled seafood 499 615,372Frozen seafood 325 406,148Dried, smoked or salted �sh and seafood 1,010 1,175,147Other preserved or processed �sh and seafood 3,203 3,763,618Milk, whole, �esh 1,986 2,204,150Milk, low fat, �esh 3,373 3,431,049Milk, preserved 46 45,519Yoghurt 3,148 3,457,104Cheese and curd 7,985 9,358,650Other milk products 2,830 3,164,496Eggs 2,739 3,153,612Butter 2,012 2,185,841Margarine and other vegetable fats 519 627,275Olive oil 497 536,860Other edible oils 394 415,185Other edible animal fats 39 59,701Fresh or chilled �uit 12,694 14,010,617Frozen �uit 509 482,673Dried �uit and nuts 3,221 3,569,064Preserved �uit and �uit-based products 748 831,153Fresh or chilled vegetables other tubers 13,288 14,395,460Frozen vegetables other than tubers 1,212 1,420,648Dried and other preserved or processed vegetables 2,561 2,870,184Potatoes 2,956 3,279,168Crisps 1,407 1,504,446Other tubers and products of tuber vegetables 398 452,415Sugar 641 737,823Jams, marmalades and honey 1,019 1,224,174Chocolate 5,195 5,770,392
M a p i c t u r e C a t c h m e n t a r e a a n a l y s i s
12

Confectionery products 6,143 6,678,354Edible ices and ice cream 3,314 3,654,497Arti�cial sugar substitutes 77 85,526Sauces, condiments 3,396 3,866,622Salt, spices and culinary herbs 1,998 2,112,909Baby food 394 455,097Ready-made meals 266 308,641Other food products n.e.c. 1,146 1,337,206Co�ee 3,796 4,720,013Tea 972 1,098,187Cocoa and powdered chocolate 285 278,505Mineral or spring waters 788 953,096So drinks 4,867 5,422,989Fruit and vegetable juices 3,049 3,340,029Spirits and liqueurs 2,700 3,505,517Alcoholic so drinks 124 94,953Wine �om grapes 11,756 14,587,697Wine �om other �uits 329 387,833Forti�ed wines 437 490,468Wine-based drinks 109 119,157Lager beer 4,431 5,644,304Other alcoholic beer 54 68,791Low and non-alcoholic beer 31 54,148Cigarettes 6,942 9,119,829Cigars 115 182,483Clothing materials 191 312,375Clothing accessories 422 687,444Footwear for men 6,085 6,083,909Footwear for women 6,482 6,965,811Bed linen 3,657 4,258,374Table linen and bathroom linen 687 709,150Co�ee machines, tea makers and similar appliances 599 644,810Irons 65 102,345Toasters and grills 67 51,386Other small electric household appliances 989 920,148Non-electric kitchen utensils and articles 7,022 7,746,118Non-motorized small tools 1,646 1,880,426Miscellaneous small tool accessories 2,830 3,367,414Cleaning and maintenance products 4,459 5,078,255Other non-durable small household articles 5,473 6,459,446Toys and celebration articles 12,169 14,056,787Plants and �owers 7,671 9,395,288Products for pets 5,107 5,707,797Newspapers 2,986 4,390,217Magazines and periodicals 2,069 2,823,858Electric appliances for personal care 1,279 1,163,510Non-electrical appliances 1,144 1,274,117Articles for personal hygiene, wellness, esoteric, beauty 19,081 21,710,777
M a p i c t u r e C a t c h m e n t a r e a a n a l y s i s
13

*: Measured in DKK per household
M a p i c t u r e C a t c h m e n t a r e a a n a l y s i s
14

8 Socio-economic situationSocioeconomic Benchmarking of Fakta Frederikssund
Opland 10 min. Frederikssund +/-No. of households 6,334 - -Average size of household 2.2 2.3 -0.1Average age 44.3 43.5 0.8% Households with cars 79 72 7Average household income 630,339 521,063 109,276% Primary school 14 28 -14% Secondary school 3 6 -3% Vocational training 46 42 4% Further education/University 25 15 10% Research 11 5 6
M a p i c t u r e C a t c h m e n t a r e a a n a l y s i s
15

9 Tra�cFakta Frederikssund
Tra�c count
The nearest tra�ccount at Østergade 15was 5,000 cars peryear in unknown.
was counting 19,200cars in 2015.
Public transport
The nearest stop Frede-rikssund Posthus has 1connections per day.
Stop Frederikssund St.has 298 connectionsper day.
M a p i c t u r e C a t c h m e n t a r e a a n a l y s i s
16