Location Strategies of Multinationals from Emerging ... Discussion Paper Series... · Location...
42
Location Strategies of Multinationals LSE ‘Europe in Question’ Discussion Paper Series Location Strategies of Multinationals from Emerging Countries in the EU Regions Riccardo Crescenzi, Carlo Pietrobelli & Roberta Rabellotti LEQS Paper No. 93/2015 May 2015 LEQS is generously supported by the LSE Annual Fund
Transcript of Location Strategies of Multinationals from Emerging ... Discussion Paper Series... · Location...

Location Strategies of Multinationals
LSE ‘Europe in Question’ Discussion Paper Series
Location Strategies of Multinationals from Emerging Countries in the EU Regions Riccardo Crescenzi, Carlo Pietrobelli & Roberta Rabellotti
LEQS Paper No. 93/2015
May 2015
LEQS is generously supported by the LSE Annual Fund

All views expressed in this paper are those of the author(s) and do not necessarily represent the views of the editors or the LSE. © Riccardo Crescenzi, Carlo Pietrobelli & Roberta Rabellotti
Editorial Board Dr Joan Costa-i-Font
Dr Vassilis Monastiriotis
Dr Sara Hagemann
Dr Katjana Gattermann
Ms Sonja Avlijas

Location Strategies of Multinationals from
Emerging Countries in the EU Regions
Riccardo Crescenzi*, Carlo Pietrobelli** & Roberta Rabellotti***
Abstract This paper contributes to the current debate in both Economic Geography and International Business on the nature and strategies of Multinational Enterprises (MNEs) from emerging countries (EMNEs). The paper fills a relevant gap in the existing literature by shedding new light on the location strategies of EMNEs at the national and regional level, looking at their investment drivers and systematically comparing them with those of multinationals from advanced countries (AMNEs). The empirical analysis looks at the location choices of MNEs in the European Union (EU-25) regions and unveils that EMNEs follow distinctive location strategies. Their attraction into large regional markets is similar to AMNEs as well as their irresponsiveness to efficiency seeking motives. Conversely, the most knowledge-intensive investments of EMNEs respond mainly to two ‘attraction’ factors: strategic assets (in the form of local technological dynamism) and the agglomeration of foreign investments in the same business functions. In addition, both the national and the regional levels are simultaneously relevant to EMNEs decisions.
Keywords: Multinationals, Emerging Countries, Regions, European Union
JEL Codes: F21, F23, O33, R12, R58
* Department of Geography and Environment, London School of Economics and Political Science Email: [email protected] ** Inter-American Development Bank and Università Roma Tre Email: [email protected] *** Dipartimento di Scienze Politiche e Sociali Università di Pavia Email: [email protected]

Location Strategies of Multinationals
Table of Contents 1. Introduction 1 2. A framework for comparative analysis: MNEs and their location drivers 4 3. Empirical Strategy 8 3.1 The model 8 3.2 Data 11 3.3 The explanatory variables 12 4. Empirical results 14 4.1 Location determinants of EMNEs and AMNEs in the European regions 16 4.2 Regional vs. national drivers 22 5. Conclusions 24 References 29 Appendix A 33 Appendix B 35
Acknowledgements The opinions expressed in this paper are those of the authors and do not necessarily reflect the views of the Inter-American Development Bank, its Board of Directors, or the countries they represent. The authors wish to thank participants at the 2014 EUROLIO Geography of Innovation workshop in Utrecht and at the North American Regional Science Conference in Washington D.C. for their helpful comments. All errors and omissions are our own.

Riccardo Crescenzi, Carlo Pietrobelli & Roberta Rabellotti
1
Location Strategies of Multinationals from
Emerging Countries in the EU Regions
1. Introduction
The unprecedented international expansion of firms from emerging economies is
one of the most striking recent evolutions in the global Foreign Direct
Investments (FDIs) landscape. Outflows of FDIs from developing economies
have reached the record level of $553 billion in 2013, corresponding to 39% of
global FDI outflows, up from 16% in 2007 (UNCTAD, 2014). Multinational
enterprises (MNEs) from emerging countries (EMNEs) have attracted a
mounting interest in the academic literature. Scholars have looked at the reasons
for the expansion of EMNEs, at their similarities and differences with advanced
countries’ MNEs (AMNEs), and at the coherence of their behaviour with the
predictions of mainstream theories about multinational firms (Ramamurti and
Singh, 2009). More than thirty years ago, the seminal contributions in this now
thriving literature suggested that MNEs from developing countries possessed
specific and distinctive features that distinguished them from MNEs based in
developed countries (e.g. Kumar and McLeod, 1981; Lall and Chen, 1983). In the
1970s and 1980s the first ‘wave’ of outward FDI from developing countries (such
as India, Russia, Argentina) was pioneered by MNEs that differed considerably
from that of ‘conventional’ industrialised countries MNEs, in terms of their
ownership advantages, motivation, geographical orientation and mode of
overseas activity.

Location Strategies of Multinationals
2
A second wave of FDI by EMNEs emerged in the 1990s and was considered as
the result of an evolutionary process from the first wave (Dunning, 1998). This
second surge targeted simultaneously less-developed countries - in order to
exploit their comparative advantages in activities intensive in natural resources
and cheap labour - and more developed countries with both market-seeking and
asset-augmenting motives.
Looking at the most recent waves of EMNEs investments in the 2000s, Narula
(2010) suggests that they should be seen as an intermediate stage in the long-
term evolution of MNEs’ activities fostered by increased market liberalisations
and greater cross-border competition. In this perspective EMNEs would
progressively converge towards AMNEs in terms of their behaviour and
strategies: over the past 30 years EMNEs have developed from ‘infant’ into
‘adolescent’ MNEs and they are currently in the process of evolving into fully
‘mature’ MNEs (Ramamurti, 2012). In contrast, other authors argue that the most
recent ‘third wave’ of EMNEs investments show remarkable structural
differences with no sign of ‘convergence’ towards the same ‘model’ (Mathews,
2006; Gammeltoft, 2008).
This paper aims to contribute to this on-going debate by shedding new light on
one particular aspect of EMNEs strategies that remains significantly under-
explored in the existing literature both in International Business Studies and
Economic Geography (Dunning 2009): their location decisions at both the
national and sub-national levels. The choice of appropriate locations for their
subsidiaries is strictly related to the internalization motivations of MNEs
(Belderbos et al, 2011; Dunning, 2009) and a systematic comparative analysis of
the spatial location behaviour of EMNEs and AMNEs makes it possible to unveil
similarities and differences in their investment motives comparing the

Riccardo Crescenzi, Carlo Pietrobelli & Roberta Rabellotti
3
importance of national-level vs. regional characteristics. The purpose of paper is
answering a set of fundamental questions linked to the location strategies and
spatial behaviour of EMNEs: what are the characteristics of the destination areas
that matter the most for EMNEs? Are these local attraction factors and
behaviours different from the drivers of AMNEs’ investments? Do EMNEs target
primarily countries or specific regions/sub-national units?
In order to address these questions the paper bridges the Economic Geography
and International Business Studies literature. The former has extensively studied
the sub-national location strategies of MNEs by means of both qualitative and
quantitative methods but has devoted very limited attention to EMNEs location.
The latter has extensively debated the nature and strategies of EMNEs with no
attention to the subnational dimension of location strategies. The empirical
analysis systematically compares the location drivers of EMNEs and AMNEs
investments in the regions of the European Union (EU-25) over the 2003-2008
(pre-crisis) period. The EU is a unique case study for such a comparative
exercise: it is a large recipient of FDI from both developed and emerging
countries and it is an integrated economic space (single market) with substantial
economic heterogeneity both at the member state/country level and at the sub-
national/regional level. The quantitative analysis, based on a Nested Logit
approach, makes it possible to explore the location determinants of a large
number of investments, assessing the relative importance of the investments
drivers at the centre of the theoretical debate.
Overall, the innovative contribution of the paper to the existing literature is two-
fold. First the paper offers a systematic comparative analysis of the similarities
and differences among the location strategies of AMNEs and EMNEs. Second the
paper provides an examination of the diverse role of national vs. regional factors

Location Strategies of Multinationals
4
in these strategies that is also unexplored in the existing literature. The empirical
results suggest that AMNEs and EMNEs search for a diverse set of drivers when
investing in the EU regions: there is no ‘general’ common model for the
behaviour of MNEs and EMNEs do display some relevant behavioural
differences when compared to other Multinationals. While for market seeking
investments EMNEs resemble their North American counterparts when it comes
to strategic asset seeking investments EMNEs do follow a distinct logic in their
location strategies. EMNEs are attracted by the availability of technological
competences (i.e. patent intensity) only when their subsidiaries pursue more
sophisticated and technology-intensive functions. The structural and socio-
institutional pre-conditions for establishing fully functional regional systems of
innovation - ‘soft’ factors in regional innovation - are not relevant to EMNEs.
Conversely EMNEs share some behavioural similarities with AMNEs in their
response to the spatial agglomeration of investments: they do tend to invest in
the regions where investments in the same function or sector are already present.
The results also suggest that a regional perspective is highly relevant to the
comparative analysis of MNEs’ behaviour: regional and national drivers are
differently valued by MNEs from different origins.
The paper is organized as follows. The next section reviews the literature dealing
with the location of MNEs introducing the determinants analysed in the
empirical analysis. Section 3 explains the empirical strategy and the dataset. The
empirical results are presented in Section 4. Section 5 concludes with some policy
considerations.

Riccardo Crescenzi, Carlo Pietrobelli & Roberta Rabellotti
5
2. A framework for comparative analysis: MNEs and their
location drivers
There is a widespread consensus in the literature that the understanding of the
location behavior of MNEs is still underdeveloped. Referring to the Ownership-
Location-Internalization (OLI) paradigm developed by Dunning (1977), the
economic and international business theory has dealt widely with the questions
related to the why a firm becomes a multinational (O) and how it carries out its
international adventure (I) but so far the discussion about where it goes to
internationalize its activities (L) has remained rather fuzzy (Iammarino and
McCann, 2013; McCann and Mudambi, 2005). Beugelsdijk and Mudambi (2013)
identify a significant limitation of the analysis of MNEs location choices in the
almost exclusive national-level focus of the existing studies. Nowadays “MNEs
location decisions are becoming increasingly complex and dependent on the variety and
quality of highly localized assets” (Iammarino and McCann, 2013: 360). However,
when looking at EMNEs, the analysis of their location strategies has remained
very limited and it has mainly focused on the alternative between the decision to
invest in advanced economies vs. other developing/emerging countries with very
limited or no attention to sub-national factors. The main conclusion in the
existing literature is that EMNEs direct their FDIs towards developed countries
when they aim at accessing new technologies and markets, on the contrary they
invest in developing countries when they have labour seeking motivations
(Kedia et al. 2012; Makino et al, 2002). In addition the literature emphasizes that
the likelihood for MNEs to invest in a particular location is also influenced by the
characteristics and the capabilities of the investing company. Therefore, the
different nature of EMNEs and AMNEs suggests that their investments might

Location Strategies of Multinationals
6
respond differently to national and sub-national drivers (Cuervo-Cazurra and
Ramamurti, 2014).
In order to move beyond the simple location behavior dichotomy South-South
vs. South-North investments, it is necessary to identify (and operationalize) the
key ‘motives’ attracting foreign investments in different (sub-national) locations.
The comparison of the relative importance of these motives for AMNEs and
EMNs makes it possible to shed light on the heterogeneity (if any) of their
preferences in terms of location strategies.
The literature on location choices identifies ‘market-seeking’, ‘strategic asset-
seeking’ and ‘efficiency-seeking’ motives as well as ‘imitative behaviors’ leading
to the spatial agglomeration of (similar) MNEs’ investments.
‘Market-seeking’ motivations have been at the center of the literature on location
advantages, suggesting that both AMNEs and EMNEs are attracted by the size
and the potential of their prospective host markets (Flores and Aguilera, 2007;
Loree and Guisinger, 1995). Over and above national markets, MNEs can target
specific customer segments and/or be attracted by the richest regions within
countries (Beugelsdijk and Mudambi, 2013; Crescenzi et al. 2014). In those cases,
in their location decisions MNEs take into account the subnational (i.e. regional
or urban-level) characteristics of the markets rather than the national ones. Kedia
et al. 2012 suggest that market-seeking motives play an important role for
EMNEs using their investments in advanced economies as platforms for their
products to be tailored to the requirements of geographically and culturally
distant partners (Goldstein, 2009). The investments undertaken in Italy by Haier -
a Chinese white goods manufacturer - are a case in point: the objective of
improving the capability to design, develop and manufacture products suitable

Riccardo Crescenzi, Carlo Pietrobelli & Roberta Rabellotti
7
for the European markets is a key driver of its location strategy (Pietrobelli et al.
2011).
The expectations on the behavior of AMNEs and EMNEs are more diversified
when it comes to ‘asset seeking’ investments. When MNEs search for host
locations endowed with specialized knowledge-related assets that are highly
localised and often linked to agglomeration economies and spatially bound
knowledge flows their behaviour is inherently more diversified (e.g. Cantwell
and Piscitello, 1999; Dunning, 2009; Iammarino and McCann, 2013) depending
on the ways in which ‘internal’ knowledge assets and resources can be balanced
and matched with external factors (Alcacer and Delgado 2013). The literature
suggests that this motivation is especially relevant for EMNEs. Several empirical
studies on large samples of firms show that this is a major reason to invest in
developed countries (Bertoni et al. 2013; Buckley et al. 2007). Furthermore, the
intention to acquire knowledge, technology and other strategic assets (such as
commercial brands and networks) is reported in case studies on well-known
companies such as Haier from China and Tata from India (Duysters et al. 2009).
Ramamurti and Singh (2009) add that the effective acquisition of strategic assets
is significantly mediated by the technological capabilities of the investing firms.
As shown in Makino et al. (2002) EMNEs that do not possess adequate
experience are not particularly attracted towards location characterised by
technological assets. Given the spatial heterogeneity of these factors, behavioural
differences emerge even more clearly when analysed at the sub-national level as
in this paper.
In a similar vein, ‘efficiency-seeking’ investments both from AMNEs and EMNEs
are attracted to specific sub-national locations for reasons related to abundant
labour supply in excess of local demand and availability of skilled and unskilled

Location Strategies of Multinationals
8
workers (Disdier and Mayer, 2004). However, nominal wage differentials tend to
emerge more at the national rather than at the sub-national level (e.g. in the EU,
nominal wages are often set by means of national-level collective employment
contracts), making this factor less relevant to regional analysis although still
captured by national controls.
Finally, both the Economic Geography and the International Business literature
have emphasised the importance of ‘imitative behaviours’ that induce MNEs to
concentrate their investments in pre-existing agglomerations of Multinational
investments, often following a sectorial or a functional logic (Alfaro and
Xiaoyang Chen, 2014; Crescenzi et al. 2014). Given the diversity (and the constant
evolution) of their investment motives, MNEs constantly learn about the
potential advantages of alternative locations by observing the entry choices of
previous investors.
If MNEs are uncertain about alternative locations they tend to follow other firms,
and in particular companies from the same country and in the same industry
(Belderbos et al. 2011).
MNEs also benefit from co-location with other multinationals due to
agglomeration economies such as shared infrastructure, labour market pooling,
availability of specialised and qualified input suppliers and service providers
and localised knowledge flows (Basile et al, 2008; Devereux et al, 2007; Head et
al, 1995 and 1999).
EMNEs in developed countries have limited knowledge and little previous
foreign investment experience: they face high uncertainty and are likely to follow
similar firms with previous experience in the same host market (Ramamurti and

Riccardo Crescenzi, Carlo Pietrobelli & Roberta Rabellotti
9
Singh, 2009). In other words, agglomeration and co-location are likely to play a
key role in EMNEs location decisions, due to the high informational value
generated by other pre-existing foreign investments.
2. Empirical strategy
3.1 The model
In line with most of the empirical literature on the location decisions of
multinational enterprises the analysis of the choice between multiple alternatives
is modelled by means of a Nested Logit Model (NLM) (McFadden 1984). In the
NLM the alternative locations (the EU NUTS1/2 regions in this case), are
organised into subgroups - the countries to which regions belong to - and the
selection process is conceived as involving two simultaneous decisions: 1) the
choice of a country i among I (1…,i,…ni) corresponding to the set of possible
countries and 2) the selection of a specific region J (1…,j,…ni ) in the chosen i
country. Although simultaneous, these decisions are based on a heterogeneous
set of characteristics because, given their dissimilar national characteristics (from
tax systems to institutional conditions), regions in different countries cannot be
considered – ceteris paribus in terms of their local conditions – perfect substitutes.
The estimated model takes the following form:
¸¸¸¸
¹
·
¨¨¨¨
©
§
¦
�
�
l
m
IY
IY
I
X
iijijmmm
iii
i
ij
e
eeePPP
1
/VJ
VJE

Location Strategies of Multinationals
10
Where is the dependent variable, measuring the probability of a certain
region j being chosen as a destination of a foreign investment conditioned by the
choice of country I. This depends on the characteristics of the ni regions
belonging to country i. Some location characteristics vary across both countries
and regions ( ), while other characteristics only vary across countries ( ). β
and γ are the coefficients to be estimated.
In the NLM model the probability of a certain region to be chosen as a
destination of a foreign investment (dependent variable) is a function of a set of
two types of regional drivers: 1) regional characteristics that remain the same for
all investments, such as for example the regional unemployment rate and the
total number of investments in the region, and 2) drivers that vary with the
specific investment under analysis, such as the number of regional investments
in the same sector as the new investment.
Moreover, with the coefficients of the inclusive value σ the model assesses the
strength of the nested structure of the location process of the investments. When
σ=1 regions are all equivalent options for MNEs, irrespective of the country they
belong to, suggesting complete independence in the location decisions with no
nested structure. If instead, σ=0 the upper nest (the country level decision) is the
only relevant decision in the location choice, as all regions within the destination
country are all perfect substitutes. As a consequence, by testing the nested
structure of the investment decisions we are able to shed light on the relative
weight the investors ascribe to national vs. regional attractors.
All country-level observable and unobservable characteristics (from corporate
tax policies to business climate and institutional conditions) are controlled for by
the national ‘nested’ structure of the model. Within the European Union, the
ijP /
ijX iY

Riccardo Crescenzi, Carlo Pietrobelli & Roberta Rabellotti
11
degree of national level heterogeneity that can be captured with quantitative
indicators is very limited and qualitative differences in terms of national-level
attractiveness are prevalent and better captured when explicitly treated – as in
this paper – as unobservable factors common to all the regions belonging to the
same country and conceptually equivalent to ‘country’ fixed effects in location
choices.
3.2 Data
The empirical analysis is based on 22,065 projects undertaken by MNEs from
three selected groups of countries (intra-EU, North America, Emerging
Countries) into the EU25. Appendix A includes a detailed discussion of the
source of FDI data (FdiMarkets database) and Table A-1 shows the distribution
of the investment projects in the EU27 by country of origin, also showing the
exact composition of each country group.
The regional analysis is based on a mix of NUTS1 and NUTS2 regions, selected in
order to maximise their homogeneity in terms of the relevant socio-institutional
structure and also considering data availability. Consequently, the analysis uses
NUTS1 regions for Belgium, Germany and the United Kingdom and NUTS2 for
all other countries (Austria, Czech Republic, Finland, France, Greece, Hungary,
Italy, the Netherlands, Poland, Portugal, Slovakia, Spain).2
Furthermore, investments are classified by FdiMarkets in 18 functions including:
Manufacturing, Logistic and Distribution, Sales and Marketing, R&D,
Headquarters. Following Defever (2006), we have aggregated them in two
2 Countries without equivalent sub-national regions (Cyprus, Estonia, Denmark, Ireland, Latvia, Lithuania, Luxembourg and Malta) are necessarily excluded from the econometric analysis. Sweden is also excluded due to the lack of regional data for some of its regions.

Location Strategies of Multinationals
12
categories: production-oriented (PRODUCTION) and non-production functions
(HQ/R&D/SALES/DIS), including headquarters, R&D, design, sales and
marketing, logistics and distribution. Although we cannot measure directly the
sophistication of these sets of functions, we reasonably assume that the non-
production functions are more sophisticated and possibly more knowledge
intensive, likely to bring high value added shares (Ali-Yrkkö, et al., 2011;
Kraemer et al., 2011). The location drivers of the investments from different
origins are compared across the two different functional sub-samples.
3.3. The explanatory variables
The investment drivers included in the econometric model reflect the conceptual
framework presented in the previous section and are based on the
operationalization of the various investment motives discussed above (Table B-1
in the Appendix provides detailed information about definitions and sources):
1) Market seeking motivations are operationalized by capturing the relevance
attached by MNEs to the Regional GDP per capita of their host regions.
2) Strategic asset seeking motivations are captured by two key dimensions of
regional innovative dynamism: the innovation output intensity and the existence
of socio-economic conditions favourable to innovation. Patent Intensity captures
the extent to which MNEs expect to benefit from localised innovative dynamism
and knowledge spillovers from indigenous firms (Mariotti et al., 2010; McCann
and Mudambi 2005). Moreover, to go beyond formal innovation, we introduce
the Social Filter Index (Crescenzi et al. 2012; Crescenzi and Rodríguez-Pose 2011),
which is an indicator resulting from the combination of a broader set of
structural socio-economic characteristics, playing a crucial role in the definition

Riccardo Crescenzi, Carlo Pietrobelli & Roberta Rabellotti
13
of the profile of an innovation prone environment. This indicator is based on a
number of characteristics of the local economy selected as measures of the
structural pre-conditions for establishing fully functional regional systems of
innovation and socio-institutional conditions favourable to the establishment of
MNEs activities (Phelps et al., 2003; Phelps and Waley, 2004; Fuller, 2005). Under
the constraint of the limited availability of regional data for the EU 25 regions,
the Social Filter includes two major domains: 1) educational achievements
corresponding to human capital accumulation both in the regional population
and among employed people (Malecki 1997; Marrocu and Paci, 2012) and 2)
productive employment of human resources measured by the percentage of the
labour force employed in agriculture and the long-term component of
unemployment (Fagerberg et al. 1997; Gordon 2001). These two domains, when
assessed simultaneously, generate a unique socioeconomic profile that fosters
(hinders) the innovative capacity of each region.3
We expect that both Patent Intensity and the Social Filter positively influence
investments aimed at seeking strategic assets. According to the existing literature
this scope is crucial for EMNEs investing in the EU.
3) Efficiency seeking motivation. Regional unemployment is a proxy of the labour
market conditions in terms of the excess of labour supply over demand (Py and
Hatem, 2009). The lack of regional data about labour costs/wages precludes a
direct control of the differential across regions, although in the EU a large part of
these differences is represented by national differences and country-level effects
control for them. In the case of EMNEs investing in the EU, we do not expect
efficiency seeking motivation playing a key role.
3 The structural variables for each dimension (Table B-2) are combined by means of Principal Component Analysis on the basis of the scores presented in Table B-2.

Location Strategies of Multinationals
14
4) Regional agglomeration of foreign investments. The impact of pre-existing
investments on the location of MNEs is captured by means of the total number of
pre-existing foreign investments in the region. Moreover, the model also accounts for
the ‘attractiveness’ of the total number of investments in the same sector of activity as
the new investment and the number of investments pursuing the same function. Due to
their little previous experience in the EU, EMNEs are expected to strongly rely
on the informational spillovers deriving from the concentration of similar firms
in both functional and sectorial terms.
3. Empirical results
This section includes the results of the Nested Logit estimation: sub-section 4.1
presents the regional-level analysis (referring to the upper part of Tables 1 and 2)
that assesses the relative importance of market, strategic asset and efficiency
seeking strategies and of the agglomeration factors. The significance of these
location determinants is estimated for all investors (Column 1), for investors
from within the EU (Column 2: EU), from North America (Column 3: NA) and
from emerging economies (Column 4: EMNE). The comparison of the relative
importance of the different drivers of MNEs location decisions sheds light on the
different strategies adopted by these firms depending on their origin.
In the second sub-section (4.2) - which makes reference to the lower part of the
Tables 1 and 2 - the weight ascribed by the investors to the regional drivers with
respect to the national common factors is assessed through the analysis of the
Inclusive Values (IV) or dissimilarity parameters. Furthermore in order to test
how MNEs strategies differ across production-oriented and non-production
functions the location drivers are assessed for all investments (Table 1) first and

Riccardo Crescenzi, Carlo Pietrobelli & Roberta Rabellotti
15
then separately for the sub-sample of non-production investments in order to
capture the distinctive location patterns of possibly more knowledge-intensive
and sophisticated functions (Tables 2).
All the explanatory variables are introduced in the regressions with a one-year
lag in order to minimise the impact of simultaneity between the investment
decisions and local economic conditions (Spies, 2010). Besides, in order to
resolve the problem of different accounting units, explanatory variables are
generally expressed for each region as a percentage of the respective GDP or
population. The first year covered by the dataset (2003) is used as the basis for
the calculation of the (lagged) cumulative number of investments and therefore
is not included in the empirical analysis. The nested logit procedure only takes
into account regions chosen at least once as investment destinations (Spies, 2010).
When interpreting the results it is important to bear in mind that the focus is
mainly on the sign and significance of the coefficients, rather than on the size of
specific point estimates. In addition the results should not be interpreted in terms
of causality relations. Finally, it is worth reminding that the ‘country-level’
nested structure allows us to control for ‘unobserved’ factors that regions
belonging to the same country have in common, such as the ‘macro’ institutional
framework, rule of law, tax rates and fiscal regimes. In a robustness check
discussed in section 4.2 we also test an alternative nest structure for the EU
regions comparing the regional belonging to the EU10 vs. EU154 in order to
assess the relevance of the diversity of the business environment between Central
and Eastern European countries (EU10) and the EU most advanced economies
(EU15) as the relevant ‘nest’ in the regional allocation of foreign investments.
4 EU 10 includes: Cyprus, Czech Republic, Estonia, Hungry Lithuania, Latvia, Malta Poland, Slovenia, Slovakia. EU15 includes Austria, Belgium, Denmark, Finland, France, Germany, Greece, Ireland, Italy, Luxembourg, Netherlands, Portugal, Spain, Sweden, and United Kingdom. For the sake of brevity, these results are not included in the paper but they are available from the authors.

Location Strategies of Multinationals
16
4.1. Location determinants of EMNEs and AMNEs in the European
regions
In this section our attention focuses on how the regional level location
determinants (reported in the upper part of Tables 1 and 2) impact on the
regional probability of attracting MNEs investments.
Table 1 - Location of MNEs in the EU regions by origin (1) (2) (3) (4) VARIABLES ALL Intra-EU North America EME Regional pc GDP -1.24e-06* -2.81e-06*** 6.44e-06*** 1.73e-05** (7.12e-07) (7.47e-07) (2.40e-06) (8.43e-06) Patents per capita 0.000208*** 9.52e-05*** 0.000408*** 0.000811 (3.47e-05) (3.40e-05) (9.64e-05) (0.000659) Social filter 0.00800 0.0143*** 0.0211 0.0163 (0.00503) (0.00509) (0.0179) (0.0816) Region.unemployment 0.000646 0.000976 -0.00340 -0.00404 (0.000976) (0.00104) (0.00314) (0.0192) Total # of investments same FUNCTION
0.00537*** 0.00484*** 0.00817*** 0.00751***
(0.000381) (0.000385) (0.000770) (0.00189) Total # of investments same SECTOR
0.0142*** 0.0140*** 0.0117*** 0.00764**
(0.000574) (0.000813) (0.00106) (0.00326) Total # of existing investments
-0.000113 -0.000328* 0.000254 0.00205
(0.000182) (0.000198) (0.000478) (0.00131) IV Parameters Austria 0.0674*** (0.0080) 0.0592*** (0.0088) 0.0851*** (0.0187) 0.133** (0.0667) Belgium 0.132*** (0.0178) 0.101*** (0.0154) 0.311*** (0.0895) 0.358 (0.243) CzechRep 0.122*** (0.0144) 0.104*** (0.0131) 0.216*** (0.0518) 0.470 (0.344) Germany 0.225*** (0.0273) 0.135*** (0.0165) 0.498*** (0.0460) 0.717*** (0.129) Spain 0.150*** (0.0109) 0.131*** (0.0117) 0.283*** (0.0420) 0.245** (0.0971) Finland 0.0431*** (0.0086) 0.0313*** (0.0075) -0.547*** (0.176) -0.586 (0.359) France 0.382*** (0.0180) 0.351*** (0.0202) 0.505*** (0.0347) 0.269*** (0.0735) Greece 0.0599*** (0.0095) 0.0582*** (0.0105) 0.0619*** (0.0201) 0.00211 (104.7) Hungary 0.197*** (0.0192) 0.184*** (0.0200) 0.152*** (0.0278) 0.264 (0.167) Italy 0.163*** (0.0127) 0.146*** (0.0139) 0.253*** (0.0351) 0.330* (0.187) Netherlands 0.113*** (0.0115) 0.0800*** (0.0109) 0.171*** (0.0313) 0.319 (0.258) Poland 0.146*** (0.0172) 0.222 (0) 0.177*** (0.0402) 0.188 (0.122) Portugal 0.0864*** (0.0134) 0.0927*** (0.0176) 0.116*** (0.0318) 0.747* (0.420) Slovakia 0.138*** (0.0217) 0.136*** (0.0263) 0.183*** (0.0635) 0.376 (0.581) UK 0.666*** (0.0154) 0.516*** (0.0189) 0.902*** (0.0267) 0.791*** (0.0932) Log likelihood -18413,131 -11657,179 -5777,207 -802,53648 LR Test (IIA) 1057.17*** 566.12*** 441.48*** 76.08*** Observations 571,740 349,085 195,249 27,406
Standard errors in parentheses *** p<0.01, ** p<0.05,* p<0.1
Riccardo Crescenzi, Carlo Pietrobelli & Roberta Rabellotti
17
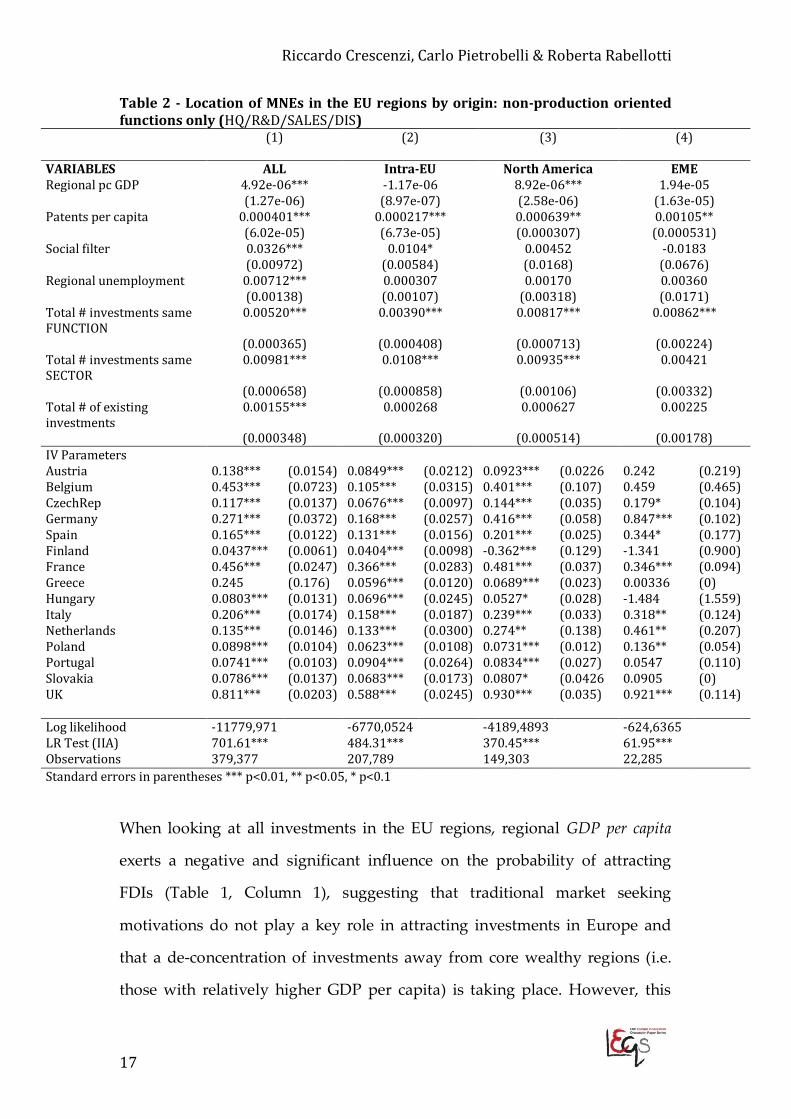
Table 2 - Location of MNEs in the EU regions by origin: non-production oriented functions only (HQ/R&D/SALES/DIS)
(1)
(2)
(3)
(4)
VARIABLES ALL Intra-EU North America EME Regional pc GDP 4.92e-06*** -1.17e-06 8.92e-06*** 1.94e-05 (1.27e-06) (8.97e-07) (2.58e-06) (1.63e-05) Patents per capita 0.000401*** 0.000217*** 0.000639** 0.00105** (6.02e-05) (6.73e-05) (0.000307) (0.000531) Social filter 0.0326*** 0.0104* 0.00452 -0.0183 (0.00972) (0.00584) (0.0168) (0.0676) Regional unemployment 0.00712*** 0.000307 0.00170 0.00360 (0.00138) (0.00107) (0.00318) (0.0171) Total # investments same FUNCTION
0.00520*** 0.00390*** 0.00817*** 0.00862***
(0.000365) (0.000408) (0.000713) (0.00224) Total # investments same SECTOR
0.00981*** 0.0108*** 0.00935*** 0.00421
(0.000658) (0.000858) (0.00106) (0.00332) Total # of existing investments
0.00155*** 0.000268 0.000627 0.00225
(0.000348) (0.000320) (0.000514) (0.00178) IV Parameters Austria 0.138*** (0.0154) 0.0849*** (0.0212) 0.0923*** (0.0226 0.242 (0.219) Belgium 0.453*** (0.0723) 0.105*** (0.0315) 0.401*** (0.107) 0.459 (0.465) CzechRep 0.117*** (0.0137) 0.0676*** (0.0097) 0.144*** (0.035) 0.179* (0.104) Germany 0.271*** (0.0372) 0.168*** (0.0257) 0.416*** (0.058) 0.847*** (0.102) Spain 0.165*** (0.0122) 0.131*** (0.0156) 0.201*** (0.025) 0.344* (0.177) Finland 0.0437*** (0.0061) 0.0404*** (0.0098) -0.362*** (0.129) -1.341 (0.900) France 0.456*** (0.0247) 0.366*** (0.0283) 0.481*** (0.037) 0.346*** (0.094) Greece 0.245 (0.176) 0.0596*** (0.0120) 0.0689*** (0.023) 0.00336 (0) Hungary 0.0803*** (0.0131) 0.0696*** (0.0245) 0.0527* (0.028) -1.484 (1.559) Italy 0.206*** (0.0174) 0.158*** (0.0187) 0.239*** (0.033) 0.318** (0.124) Netherlands 0.135*** (0.0146) 0.133*** (0.0300) 0.274** (0.138) 0.461** (0.207) Poland 0.0898*** (0.0104) 0.0623*** (0.0108) 0.0731*** (0.012) 0.136** (0.054) Portugal 0.0741*** (0.0103) 0.0904*** (0.0264) 0.0834*** (0.027) 0.0547 (0.110) Slovakia 0.0786*** (0.0137) 0.0683*** (0.0173) 0.0807* (0.0426 0.0905 (0) UK 0.811*** (0.0203) 0.588*** (0.0245) 0.930*** (0.035) 0.921*** (0.114) Log likelihood -11779,971 -6770,0524 -4189,4893 -624,6365 LR Test (IIA) 701.61*** 484.31*** 370.45*** 61.95*** Observations 379,377 207,789 149,303 22,285 Standard errors in parentheses *** p<0.01, ** p<0.05, * p<0.1
When looking at all investments in the EU regions, regional GDP per capita
exerts a negative and significant influence on the probability of attracting
FDIs (Table 1, Column 1), suggesting that traditional market seeking
motivations do not play a key role in attracting investments in Europe and
that a de-concentration of investments away from core wealthy regions (i.e.
those with relatively higher GDP per capita) is taking place. However, this

Location Strategies of Multinationals
18
somewhat unexpected result - contrasting with some existing literature (e.g.
Head and Mayer, 2004 and Loore and Guisinger, 1995) - changes when FDIs
are differentiated by country of origin. In fact, the negative and significant
impact is confirmed only for intra-EU investments (Column 2), while non-EU
FDIs, from both North America (Column 3) and from emerging countries
(Column 4) are attracted by regions with high per capita GDP. This difference
in the behaviour of MNEs is motivated by the fact that EU companies do not
need to undertake market-seeking investments within the EU: in the common
market they do not face trade barriers and transaction costs are low due to the
geographic and cultural proximity among countries. On the contrary, both for
NA multinationals and for EMNEs the market seeking motivation is strong
and driven by the aim to be present in the largest EU markets. As a
consequence, in this case a clear behavioural difference emerges between
intra-EU and extra-EU investments (both from NA and emerging countries)
as a result of their diverse, market-seeking strategies. Further evidence in this
regard is shown in Table 2 where the empirical analysis focuses on more
knowledge-intensive functions by excluding purely production-oriented
investments. In this case, the market seeking motivation is only confirmed for
NA investments, while the coefficients become insignificant both for intra-EU
investments and for EMNEs, which, as discussed below, seem to be driven
more by strategic asset seeking motivations (Table 2, Columns 2, 3 and 4).
When considering strategic asset seeking motivations, the empirical results
unveil additional behavioural heterogeneity according to the origin of the
investments. In Column 1 (Table 1), regional Patent intensity has a positive
and statistically significant impact on the probability of attracting all MNEs,
confirming the importance of the availability of technological competences
and resources in the location decisions of multinational companies. However,
when the sample is disaggregated by the origin of the investing companies,

Riccardo Crescenzi, Carlo Pietrobelli & Roberta Rabellotti
19
this relationship is confirmed only for investments generated from within the
EU and from North America (Table 1, Columns 2 and 3). In the case of
EMNEs, patent intensity exerts a positive and significant influence only on
investments in the more sophisticated (non-production) functions (Table 2,
Column 4). This evidence is particularly important because it confirms the
diversified internationalisation strategy of EMNEs that invest in Europe to
seek both markets and high-value strategic assets, the latter involving
functions such as R&D, design and development (Amighini et al., 2013).
The analysis of the role of broad socio-economic factors supporting
innovation sheds additional light on strategic asset seeking behaviours. In
Table 1 the Social Filter – our proxy for ‘soft’ innovation factors and socio-
economic innovation proneness - is positive and significant only for intra-EU
investments. Extra-EU companies are less likely to respond to ‘soft’
innovation factors given their lack of socio-cultural and cognitive proximity
(Boschma, 2005) and their more limited degree of local embeddedness
(Granovetter, 1985; Phelps et al., 2003; Phelps and Waley, 2004; Fuller, 2005).
This result is further reinforced when the sample is restricted to non-
production functions (HQ/R&D/SALE/DIST) (Table 2). In addition, the Social
Filter becomes positive and significant for North American companies when –
in our robustness check - the two macro-aggregated groups EU10 and EU15
replace the country-level nests. This suggests that for North American
companies the importance of ‘soft’ factors is fully accounted for by the
country-level characteristics: regional social-filters are not significant when
common characteristics at the national level are fully controlled for (as in
Table 2) and only emerge when ‘broader’ controls (EU15 vs. EU 10) are
included.

Location Strategies of Multinationals
20
Regional unemployment – our proxy for efficiency-seeking motivations – does
not seem to play a relevant role as an explanatory factor for the location of
MNEs. This variable is never significant in the aggregated model (Table 1) but
it turns out positive and significant in non-production-oriented functions
(Table 2, Column 1) when investments are not separated by country of origin
while it remains insignificant for all origins (Columns 2 to 4). This suggests a
strong ‘composition effect’: when all non-manufacturing investments are
assessed together efficiency seeking motivations seem to be relevant
explanations for FDI in the EU. However, once origin-country heterogeneity
is accounted for by means of separate sub-samples, their impact disappears.
Column 1 in Table 2 shows that investments in non-production and
supposedly more knowledge-intensive functions are sensitive to a number of
different drivers: market seeking (GDP per capita); strategic asset seeking
(Patent per capita and Social Filter) and efficiency seeking (Regional
unemployment). However, while all other factors remain significant for one
or more groups of countries (suggesting that the area of origin does influence
MNEs preferences in their regard) the same is not true for regional
unemployment. In line with previous research (e.g. Disdier and Mayer 2004)
these results suggest that efficiency-seeking motives should be assessed on a
case-by-case basis being so hard to draw any ‘general’ conclusion on their
role. In addition, in the very nationally centralised EU labour markets, regions
might play a relatively minor role in this regard: as a matter of facts in our
robustness check - where national ‘controls’ are replaced by broader EU15 vs.
EU 10 nests – in line with our results for market seeking motives intra-EU
investments favour locations where the supply of labour is more abundant
and potentially cheaper (i.e. those with a higher unemployment rate) while
North American investments prefer ‘core’ low unemployment locations. In
other words, if NA MNEs decide to invest in the EU, they rather seek strategic

Riccardo Crescenzi, Carlo Pietrobelli & Roberta Rabellotti
21
assets than higher efficiency (lower costs) locations. The same does not apply
to EU MNEs that, when investing within the EU, look for ‘cheaper’ locations.
The process of agglomeration of MNEs investments is an additional important
explanation of their location behaviour: Table 1 shows a negative, although
only marginally significant, coefficient for intra-EU investments (Column 2),
confirming a process of de-concentration of EU investments towards less
congested regions, in line with the findings discussed above on GDP per
capita and regional unemployment. Then considering the two other indicators
of agglomeration - the cumulative number of pre-existing investments in the
same sector and in the same function in the region – a completely different
story emerges. Both agglomeration proxies exert a significant and positive
influence on the location of all investments. The cumulative nature of
investment location choices confirms the expected role of specialised
agglomeration economies and informational spillovers (Guimaraes et al.,
2000; Head and Mayer, 2004; Spies, 2010; Belderbos et al. 2011). Location
decisions are driven by two agglomeration forces: (i) the search for ‘vertical’
interactions when investments are attracted by the presence of other
investments in the same sector and (ii) ‘horizontal’ spillovers, such as labour
market specialization and supply of specialised services and infrastructures,
when they agglomerate on the basis of the same function across sector. It is
worth noticing that the agglomeration effect for all sets of functions is
consistent for all MNEs notwithstanding their origin while the sectorial
agglomeration becomes insignificant for EMNEs investing in non-production
functions (Tables 2, Columns 4). This is a new original finding about the
location behaviour of EMNEs: given the high uncertainty characterizing their
early explorations in the EU regions, multinationals from emerging countries
choose to locate in regions specialised in the same sets of functions as their
foreign investments, searching for informational spillovers and agglomeration

Location Strategies of Multinationals
22
economies when undertaking strategic asset-seeking FDIs in higher value-
added functions.
4.2 Regional vs. national drivers
Turning our attention to the lower sections of Tables 1 and 2 the analysis of
the Inclusive Values (IV) or dissimilarity parameters assesses the weight
ascribed by the investors to regional level drivers vs. national common
factors. This analysis contributes to undertake a much needed fine-grained
understanding of the location behaviour of MNEs (Beugelsdijk and Mudambi,
2013; Iammarino and McCann, 2013). The interpretation of the values
assumed by the dissimilarity parameters allows us to shed new light on the
relative importance of subnational spatial heterogeneity against national
factors.
Dissimilarity parameters measure the level of independence of the
alternatives in each nest (i.e. countries in Tables 1 and 2 and group of
countries in the EU10 vs. EU15 robustness check) with respect to the
unobserved portions of utility: the closer a parameter is to 1, the greater is the
independence (lower correlation) between the alternatives (regions) in the
same nest (country and group of countries). Therefore, if the IVs are close to 1
the regional drivers have a stronger role than the national common factors in
attracting MNEs, while if they are close to 0 the national drivers prevail.5 In
the econometric tests undertaken, the fitted models in general behave well
and the dissimilarity parameters are mostly within the 0-1 ranges. The LR
statistics confirm the validity of the nested structures presented in Tables 1 e 2
5 The Random Utility model restricts dissimilarity parameters to a range between 0 and 1 and values outside this range mean that while the model is mathematically correct, the fitted model is inconsistent with the random-utility theory (Cameron & Trivedi 2008).

Riccardo Crescenzi, Carlo Pietrobelli & Roberta Rabellotti
23
and support the robustness of our empirical model. However, significant
differences emerge in the ways in which MNEs balance national and regional
drivers in their investment strategies depending on their origin and on the
functions undertaken.
In what follows, our discussion in based on the IVs in Table 2 only, given that
they do not differ substantially from IVs in Table 1. The analysis of the
inclusive values for intra-EU investments shows that country-level
considerations still play an important role: inclusive values are all statistically
significant and far from 1 (Column 2 in Table 2). The location decisions in
regions belonging to the same country are closely correlated and driven by
stronger common national factors as opposed to investments in a different
country. Investments in the UK represent an exception because they are
strongly guided by subnational drivers, as shown by the relatively higher
inclusive values and reflecting the unique role of some specific investment
hubs, such as London and the Southwest.
Investments from North America (Column 3) are also sensitive to country-
level common factors (as confirmed by the LR Test and the significant
inclusive values) but regional-level considerations play a more important role
than for intra-EU investments because the values of all IVs are generally
higher.
When it comes to EMNEs the picture is again different. LR Test confirms the
significance of country-level nests (Column 4). Furthermore, the analysis of
the parameters associated to individual countries shows that the IVs for the
UK, Germany and France are significant and relatively large and IVs for The
Netherlands and Italy are also significant but smaller. On the contrary, many
other IVs are either marginally significant or insignificant. This suggests that

Location Strategies of Multinationals
24
EMNEs attach great importance to both the regional and national common
features of those countries that have historically received the larger shares of
their investments and with the closer ‘cultural’ proximity (these same
emerging countries have often hosted investments from European countries).
EMNEs do not seem to take into account any additional common factor (on
top of the regional drivers discussed in the previous section) when taking
their locations decisions outside the UK, Germany, France and to a less extent
The Netherland and Italy.
4. Conclusions
This paper fills a relevant gap in the existing literature in both Economic
Geography and International Business Studies by exploring whether EMNEs
differ from AMNEs in their location decisions at the national and sub-national
levels. Table 3 summarizes the main findings of the paper.
The first key result is that MNEs from countries at different technological and
developmental stages do follow a diverse set of sub-national investment
motives. The wealthy markets of the ‘core’ EU regions attract investments
from extra-EU MNEs - both from emerging countries and from North
America - while intra-EU investments tend to target less affluent and less
congested regions. Coherently with this evidence of intra-EU de-
concentration, the spatial agglomeration of pre-existing foreign investments
in the same region appears to discourage FDI from within the Union while
EMNEs and AMNEs are not influenced by the agglomeration of investments
per se: what matters for all MNEs (including EMNEs) are functional and

Riccardo Crescenzi, Carlo Pietrobelli & Roberta Rabellotti
25
sectorial agglomeration forces. Conversely, efficiency-seeking motives are
generally less important and largely captured by national effects.
Table 3 – The location determinants of MNEs in the EU regions: A summary Source of foreign investment
Determinants of foreign investments
EU NA EME
Market-seeking* (-) (+) (+) Strategic asset-seeking*
x Hard drivers (patents)
(+) (+) (+) Only for NON-
PRODUCTION FDI x Soft drivers (+) (+)
Only without full country controls)
Never significant
Efficiency-seeking* (+) (Only without full country controls)
(-) (Only without full country controls)
Never significant
Agglomeration* x # of FDI (-) Not significant. Not significant
x Same Function (+) (+) (+) x Same Sector (+) (+) (+)
Only for PRODUCTION FDI
Dissimilarity parameters** x Sub-national drivers UK, FR UK, FR, D, BE UK, D, NL FR, I
x National drivers All remaining countries
All remaining countries Most of remaining countries are not
significant Source: Authors’ estimates in Tables 1 and 2.
* (+) and (-) reflect respectively positive and negative significant coefficients ** >0.3 in Table 2
The second key result is that strategic asset seeking motives are central to the
understanding of the specificities of EMNEs’ spatial behavior in comparison
to all other MNEs. EMNEs seek technological competences (i.e. patent
intensity) when they invest in higher value added functions. However, ‘soft’
regional innovation conditions (i.e. the Social Filter) are never significant
attraction factors for EMNEs. The large innovation and technological gap still
prevents EMNEs from fully taking advantage of an innovation-prone regional
context. This implies that EMNEs are still rather inexperienced when

Location Strategies of Multinationals
26
undertaking strategic asset seeking investments because they might lack
adequate absorptive capacity.
Third, the analysis shows that EMNEs attach great importance to both the
regional and national location factors. In the UK, France, Germany, The
Netherlands and Italy regional factors are prevalent while their location
choices in all other EU countries are driven more by national common factors.
The paper shares a number of limitations with the existing literature. The
investment dataset—although robust relative to other similar datasets—is
limited to greenfield investments with no information on other typologies of
FDI (e.g. mergers and acquisitions) or on non-equity forms of
internationalization. Moreover, the dataset does not allow including any
‘parent company’ controls for repeated investments by the same firm in
different locations. These investments are certainly not independent but the
current dataset does not allow reconstructing the ownership structure of
MNEs, and capturing the linkages among investments. However, having
acknowledged these limitations, our results could still provide some relevant
insights for national and regional policy-makers. In a context of limited
capital availability in the aftermath of a major economic crisis the attraction of
foreign investment is crucially important to re-launch national and regional
economic growth. In this context, EMNEs can play a key role: the relatively
more solid performance of their domestic markets and their strong average
capitalization make them ideal investors to be targeted by national and
regional attraction policies and incentive packages. As a consequence,
understanding the specificities of their location strategies remains of
paramount importance. From our empirical analysis it clearly appears that
these new actors are not moved by efficiency-seeking motives. Their interest
for large markets – that cannot easily be influenced by public policies – is
coupled by two other ‘attraction’ factors: strategic assets and functional and

Riccardo Crescenzi, Carlo Pietrobelli & Roberta Rabellotti
27
sectorial agglomeration economies. Moreover, their spatial behavior is
different from other MNEs in particular when it comes to the most
sophisticated knowledge intensive functions that also display the strongest
potential for spillovers and growth in recipient economies.
Policy makers can play a multiple and diversified role. In order to leverage
strategic asset seeking motives policy makers should not only reinforce
national and regional technological capabilities but also support the
development of ‘institutional bridges’ able to facilitate EMNEs in their
understanding of ‘soft’ innovation drivers. Helping EMNEs to capture the
advantages of the rich national and regional eco-system landscape in the EU
might be the key to attract their investments in the most ‘valuable’ functions.
In this regard the support of connections with local firms (e.g. joint ventures
but also non-equity alliances) and universities might be a possible policy tool
to facilitate connectivity into local innovation systems. This would also
generate opportunities for advanced host countries’ managers and
entrepreneurs to learn from new investors, bridging the cultural and market
distance with emerging economies. This for example was sought after by
Costa Rica’s investment promotion organization CINDE (Coalition of
Development Initiatives) in its selective strategy to attract Intel and other
foreign investors (Blyde et al., 2014). The establishment of networking
opportunities involving both new investors and host countries’ local actors is
key in order to reduce the risk of a “take and leave” attitude of EMNEs
(Giuliani et al., 2014) as well as the opportunistic acquisition of cheap assets
with respect to technology and other strategic assets, which is diffusely feared
in European countries.6 Policy makers would benefit from a better
6 See for instance a recent article in the Financial Times http://www.ft.com/cms/s/2/53b7a268-44a6-11e4-ab0c-00144feabdc0.html, accessed 17 February 2015.

Location Strategies of Multinationals
28
understanding of EMNE behaviour in Europe in order to minimize predatory
investments and attract FDIs contributing to the local economy.
In addition, the possibility to leverage functional and sectorial agglomerations
is premised on a careful diagnosis of the national and regional economy, in
order to make these agglomeration benefits apparent to EMNEs (and other
investors as well). In this regard, policy makers should facilitate the
development of functional and sectorial integrated systems comprising both
domestic and foreign firms.
Finally, our results highlight that both national and regional governments and
policy makers are relevant to EMNEs, suggesting that coordination and joint
action among different government levels is of primary importance.

Riccardo Crescenzi, Carlo Pietrobelli & Roberta Rabellotti
29
References Alcacer, J., Delgado, M. 2013, Spatial organization of firms and location choices through the value chain.
HBS Working Paper 13-025.
Alfaro, L. and Xiaoyang Chen M. 2014, The global agglomeration of multinational firms, Journal of
International Economics 94, 263–276
Amighini A., Cozza C.,.Rabellotti R. and Sanfilippo M., 2014, Chinese Outward FDI: What Can Be Done
with Firm-level Data?, China and the World Economy, 22, 6: 44-63.
Amighini A, Rabellotti R., Sanfilippo M., 2013, Do Chinese State-Owned and private Enterprises Differ
in their Internationalization Strategies?, China Economic Review, 27, 312-325.
Ali-Yrkkö J., Rouvinen P., Seppälä T., Ylä-Anttila P., 2011, Who Captures Value in Global Supply
Chains? Case Nokia N95 Smartphone, ETLA Discussion Papers No.1240, 28 Feb. 2011.
Basile, R., Castellani, D., & Zanfei, A., 2008, Location choices of multinational firms in Europe: The role
of EU cohesion policy. Journal of International Economics, 74(2), 328-340.
Belderbos, R., Olffen, W. V., & Zou, J. 2011. Generic and specific social learning mechanisms in foreign
entry location choice. Strategic Management Journal, 32(12), 1309-1330.
Bertoni, F., Elia, S., & Rabbiosi, L. 2013. Outward FDI from the BRICS: Trends and patters of acquisitions
in advanced countries. In M. A. Marinov, & S. T. Marinova (Eds.), Emerging economies and firms in
the global crisis. Basingstoke: Palgrave Macmillan.
Beugelsdijk, S., & Mudambi, R. 2013. MNEs as border-crossing multi-location enterprises: The role of
discontinuities in geographic space. Journal of International Business Studies, 44(5), 413-426.
Blyde J., Pietrobelli C. and Volpe C., 2014, “A World of Possibilities: Internationalization for Productive
Development“, G. Crespi, E. Fernández-Arias and E.H. Stein (Eds.) Rethinking Productive
Development: Sound Policies and Institutions for Economic Transformation, Palgrave for Inter-
American Development Bank.
Boschma R. A. 2005 “Proximity and innovation: a critical assessment”, Regional Studies 39 (1), 1-14.
Buckley, P. J., Clegg, J., Cross, A. R., Liu, X., Voss, H., & Zheng, P. 2007. The determinants of Chinese
outward foreign direct investment. Journal of International Business Studies, 38 (4), 499- 518.
Cantwell, J., & Piscitello, L. 1999. The emergence of corporate international networks for the
accumulation of dispersed technological competences. MIR: Management International Review, 123-
147.
Castellani, D., and Pieri, F. 2013. R&D off shoring and the productivity growth of European regions.
Research Policy, 42(9), 1581-1594.
Crescenzi R. and Rodríguez-Pose A. 2011. “Innovation and regional growth in the European Union”,
Springer-Verlag, Berlin and New York
Crescenzi R., Rodríguez-Pose A. & Storper M. 2012. “The territorial dynamics of innovation in China
and India”, Journal of Economic Geography, 12, 1055–1085.

Location Strategies of Multinationals
30
Crescenzi R., Pietrobelli C., and Rabellotti R., 2014, “Innovation drivers, value chains and the geography
of multinational corporations in Europe”, Journal of Economic Geography 14, 1053-1086.
Cuervo-Cazurra A. and Ramamurti R. (eds) (2014) Understanding Multinationals from Emerging
Markets Cambridge University Press: Cambridge, UK
Defever, D. (2006) Functional fragmentation and the location of multinationals firms in the enlarged
Europe. Regional Science and Urban Economics, 36: 658–677.
Devereux, M., Griffith, R., Simpson, H., 2007. Firm location decisions, regional grants and
agglomeration externalities. Journal of Public Economics 91, 413–435.
Disdier, A. C., Mayer, T. 2004 How different is Eastern Europe? Structure and determinants of location
choices by French firms in Eastern and Western Europe. Journal of Comparative Economics, 32: 280–
296.
Dunning J. H., 1977 Trade, location of economic activity and the multinational enterprise: a search for an
eclectic approach, in B. Ohlin, P.O. Hesselborn and P.M. Wijkman (eds.), The international allocation
of economic activity, London, Macmillan: 19-51.
Dunning, J. H. 1998. Globalization and the new geography of foreign direct investment. Oxford
Development Studies, 26(1), 47-69.
Dunning, J. H. 2009. Location and the multinational enterprise: A neglected factor?, Journal of
international business studies, 40(1), 5-19.
Duysters, G., Jacob, J., Lemmens, C., & Jintian, Y. 2009. Internationalization and technological catching
up of emerging multinationals: A comparative case study of China’s Haier Group. Industrial and
Corporate Change, 18(2), 325-349.
Fagerberg J., Verspagen, B., and Caniels, M. 1997. “Technology, growth and unemployment across
European Regions”. Regional Studies, (31:5), pp. 457-466.
Flores, R. G., & Aguilera, R. V. 2007. Globalization and location choice: an analysis of US multinational
firms in 1980 and 2000. Journal of International Business Studies, 38(7), 1187-1210.
Fuller C., 2005. Corporate Repeat Investment and Regional Institutional Capacity. The Case of After-
care Services in Wales. European Urban and Regional Studies 12, 5–21.
Gammeltoft, P. 2008. Emerging multinationals: outward FDI from the BRICS countries. International
Journal of Technology and Globalisation, 4(1), 5-22.
Goldstein, A. (2009). Multinational Companies from Emerging Economies. Palgrave Macmillan.
Gordon I.R. 2001. Unemployment and spatial labour markets: strong adjustment and persistent
concentration in R. Martin and P. Morrison (eds.) Geographies of Labour Market Inequality,
Routledge, London.
Giuliani E., Gorgoni S., Guenther C. and Rabellotti R., 2014, “Emerging-market MNEs investing in
Europe. A typology of subsidiary global–local connections”, International Business Review, 23: 680-
691.
Granovetter, M., 1985. “Economic action and social structure: the problem of embeddedness”, American
Journal of Sociology, 91(3), 481-510.

Riccardo Crescenzi, Carlo Pietrobelli & Roberta Rabellotti
31
Guimarães P. Figueiredo O. and Woodward D. 2000. “Agglomeration and the Location of Foreign
Direct Investment in Portugal”, Journal of Urban Economics, 47, 1: 115-135.
Jordaan J.A. 2009. Foreign Direct Investment, Agglomeration and Externalities, Ashgate, Farnham.
Head, K. and Mayer T. 2004. "Market potential and the location of Japanese investments in the
European Union." Review of Economics and Statistics 86, 4: 949-972.
Head, C.K., Ries J.C. and D. L. Swenson 1995. "Agglomeration benefits and location choice: Evidence
from Japanese manufacturing investment in the United States." Journal of International Economics
38, 3-4: 223-247.
Head, C.K., J.C. Ries and D. L. Swenson 1999. “Attracting foreign manufacturing: Investment promotion
and agglomeration”, Regional Science and Urban Economics, 29, 197-218.
Iammarino S. and McCann P. 2013, Multinationals and Economic Geography, Edward Elgar,
Cheltenham (UK) and Northampton (USA)
Kedia, B., Gaffney, N., & Clampit, J. 2012. EMNEs and Knowledge-seeking FDI. Management
International Review, 52(2), 155-173.
Kumar, K., & McLeod, M. G. 1981. Multinationals from developing countries. Free Press.
Lall, S., & Chen, E. 1983. The new multinationals: The spread of third world enterprises. Chichester:
Wiley.
Loree, D. W., & Guisinger, S. E. 1995. Policy and non-policy determinants of US equity foreign direct
investment. Journal of International Business Studies, 26, 2, 281-299.
Makino, S., Lau, C.M., & Yeh, R.S. 2002. Asset- Exploitation versus Asset Seeking: Implication for
Location Choice of Foreign Direct Investment from Newly Industrialized Economies. Journal of
International Business Studies, 33 (3), 403-421.
Malecki E. 1997. Technology and Economic Development: The Dynamics of Local, Regional and
National Competitiveness, 2nd edition Addison Wesley Longman, London.
Mariotti. S., Piscitello, L. Elia, S., 2010. Spatial agglomeration of multinational enterprises: the role of
information externalities and knowledge spillovers, Journal of Economic Geography, 10 (4): 519-538
Marrocu E. and Paci R., 2012. Education or Creativity: What Matters Most for Economic Performance?,
Economic Geography, 88(4): 369-401.
Mathews, J. A. 2006. Dragon multinationals: New players in 21st century globalization. Asia Pacific
journal of management, 23(1), 5-27.
McCann, P. and R. Mudambi, 2005. Analytical differences in the economies of geography: the case of the
multinational firm. Environment and Planning A, 37: 1857-1876.
McFadden, D. L. 1984. Econometric analysis of qualitative response models. In: Griliches, Zvi,
Intriligator, Michael D. (Eds.), Handbook of Econometrics, Vol.2. Amsterdam, Elsevier/North-
Holland: 1396-1457.
Narula, R. 2010. “Much ado about nothing, or sirens of a brave new world?: MNE activity from
developing countries and its significance for development”. OECD Background paper for the
Perspectives on Global Development 2010, Paris:OECD.

Location Strategies of Multinationals
32
Phelps N. A., MacKinnon D., Stone I. and Braidford P., 2003. Embedding the multinationals?
Institutions and the development of overseas manufacturing affiliates in Wales and North East
England, Regional Studies 37, 27–40.
Phelps N. A., Waley P. 2004, Capital Versus the Districts: A Tale of One Multinational Company's
Attempt to Disembed Itself, Economic Geography 80, 191-215.
Pietrobelli C. and Rabellotti R. 2007. Upgrading to Compete. Clusters and Value Chains in Latin
America, Cambridge Ma.: Harvard University Press.
Pietrobelli C., Rabellotti R and Sanfilippo M. 2011 The “Marco Polo” effect: Chinese FDI in Italy, Int. J.
Technological Learning, Innovation and Development, , 4(4), 277-291.
Py L. and Hantem F. 2009. Internationalisation et Localisation des Services: une Analyse Sectorielle et
Fonctionelle Appliquee aux Firmes Multinationales en Europe, Economie et Statistique, 426, 67-95
Ramamurti, R., & Singh, J.V. 2009. Emerging Multinationals in emerging markets. Cambridge UK:
Cambridge University Press.
Ramamurti, R. 2012. What is really different about emerging market multinationals? Global Strategy
Journal, 2: 41-47.
Ramasamy, B., Yeung M. and Laforet S., 2012, “China’s outward foreign direct investment: Location
choice and firm ownership,” Journal of World Business, Vol. 47, pp. 17-25
Spies J. 2010. Network and border effects: Where do foreign multinationals locate in Germany?,
Regional Science and Urban Economics, 40, 20-32
Sutherland, D., and Anderson, J. 2014. The Pitfalls of Using Foreign Direct Investment Data to Measure
Chinese Multinational Enterprise Activity. Forthcoming in The China Quarterly, 1-28.
UNCTAD. 2014. World Investment Report 2014: Investing in the SDGs: An Action Plan. Geneva: United
Nations Conference on Trade and Development.

Riccardo Crescenzi, Carlo Pietrobelli & Roberta Rabellotti
33
Appendix A
Data on FDI
FDI data are from fDi Markets, a database maintained by fDi Intelligence, a
specialist division of the Financial Times, which monitors cross border
greenfield investments covering all sectors and countries worldwide since
2003. In the period 2003-2008, the database includes around 72,000 worldwide
projects with no minimum investment amount required.7
Individual location decisions are a more appropriate unit of analysis than the
value of the investment when looking at the location strategies of
multinationals and their motives because the choice of a specific country and
the motivation of the investment have been shown to be largely independent
from the amount of capital invested (Amighini et al., 2014; Sutherland and
Anderson, 2014). Moreover, the investment size varies widely across sectors,
with resource-intensive sectors showing higher average investment size than
consumer goods sectors or services. This is the main reason why several
empirical studies have chosen the number of deals (and not the investment
size) as their unit of analysis (among others see Castellani and Pieri, 2013;
Crescenzi et al., 2014; Ramasamy et al., 2012).8
With regard to emerging countries, there is not an official definition, but there
are several alternative classifications utilized by different research
institutions. Different classifications are available at 7 The accuracy and robustness of the information reported in fDi Markets has been checked using different methodologies: a) comparison with UNCTAD information on FDI flows at the country level; b) comparison of regional-level distribution of investments with Euromonitor database, which provides information about FDI in Europe based on a completely independent source. All these checks confirm the reliability of the fDi Markets database on the spatial distribution of FDI. 8 There is an additional reason for this choice: even if the database provides information on the value of the investment, in most of the cases this is estimated.

Location Strategies of Multinationals
34
http://en.wikipedia.org/wiki/Emerging_markets (accessed June, 19rd 2013). In
order to check the robustness of our definition of emerging in countries in the
empirical analysis we have also tested an enlarged group including
Argentina, Malaysia and Ukraine obtaining very similar results.
Table A-1 – Number of new investments in EU27: Countries of origin
Country Group Country of origin
# of new investments
% of total
EU 25 13100 59.55
Germany 3090 14.05
UK 1934 8.79
France 1510 6.86
Austria 882 4.01
Netherlands 865 3.93
Sweden 779 3.54
Italy 764 3.47
Spain 691 3.14
Belgium 427 1.94
Finland 425 1.93
Denmark 390 1.77
Ireland 253 1.15
Greece 231 1.05
Lithuania 126 0.57
Estonia 109 0.50
Luxembourg 97 0.44
Czech Republic 93 0.42
Slovenia 93 0.42
Hungary 85 0.39
Portugal 83 0.38
Poland 78 0.35
Latvia 49 0,22
Cyprus 29 0.13
Slovakia 12 0.05
Malta 5 0.02 EU 27 13154 59.80
Romania 32 0.15
Bulgaria 22 0.10 EU27 + 2 13943 63,19
Switzerland 585 2.66 Norway 204 0.93

Riccardo Crescenzi, Carlo Pietrobelli & Roberta Rabellotti
35
North America 5367 24.32
USA 4990 22.68 Canada 377 1.71
Emerging countries 1064 4.81
India 237 1.08
China 211 0.96
Russia 195 0.89
Turkey 127 0.58
Hong Kong 109 0.50
Brazil 44 0.20
Mexico 27 0.12
South Africa 34 0.15
Thailand 6 0.03
Chile 6 0.03
978 4.43 Others Japan 771 3.51 Australia 207 0.94
Rest of the World 713 3.23
Total 22065 100.00
Source: Authors’ elaboration on fDi Markets - 2003-2008
Appendix B
Data sources and detailed description of regional variables
Table B-1 – Variables’ definitions and sources
Dependent Variable Source(s) Location decisions of greenfield investments in the regions FDi Markets Explanatory variables Characteristics of the host regions Regional GDP per capita EUROSTAT Patents per capita EPO patent applications per capita EUROSTAT
Social Filter The index combines, by means of Principal Component Analysis (Table A-2), the variables describing the socio-economic realm of the region (listed below)
EUROSTAT
Education Employed People % Employed People with Tertiary Education Level (Isced 79 79 levels 5-7) EUROSTAT
Education Population % Population with Tertiary Education Level (Isced 79 levels 5-7) EUROSTAT
Agricultural Labour Force Agricultural employment as % of total employment EUROSTAT

Location Strategies of Multinationals
36
Table B-2 – ‘Social Filter’ Index – Results of the Principal Components Analysis (PCA)
Table B-2.1- PCA Eigen Analysis of the Correlation Matrix EU 25
Comp1 2,30323 1,3384 0,5758 0,5758 Comp2 0,964829 0,250263 0,2412 0,817 Comp3 0,714565 0,697188 0,1786 0,9957 Comp4 0,0173775 . 0,0043 1 Table B-2.2 - PCA: Principal Components' Coefficients
EU 25
Agricultural Labor Force -0,4009 0,3471 0,8478 0,0046
Long Term Unemployment -0,2662 0,8389 -0,4697 0,0686
Education Population 0,6271 0,2478 0,1912 0,7133 Education Employed People 0,6125 0,3381 0,1549 -0,6975
Long Term Unemployment Long term unemployed as % of total unemployment. EUROSTAT Regional Unemployment Rate EUROSTAT Agglomeration indicators: for each region/investment pair
Total # of Investments Cumulative #of total FDI in the region (all sectors, all functions) fDi Markets
Total # of investments same FUNCTIONS
Cumulative # of FDI in the region in the same FUNCTION as the investment under analysis fDi Markets
Total # of investments same SECTOR
Cumulative # of FDI in the region in the same sector as the investment under analysis fDi Markets

37
Recent LEQS papers
Burger, Anna S. “Extreme working hours in Western Europe and North America: A new aspect of polarization” Paper No. 92, May 2015 Bojar, Abel.” Biting the Hand that Feeds: Reconsidering Partisanship in an Age of Permanent
Austerity” Paper No. 91, April 2015 Cesaroni , Tatiana & De Santis, Roberta. “Current account “Core-periphery dualism” in the EMU”
Paper No. 90, March 2015 Glendinning, Simon. “Varieties of Neoliberalism” LEQS Paper No. 89, March 2015 Haverland, Marcus, De Ruiter, Minou & Van de Walle, Stefan. “Producing salience or keeping silence?
An exploration of topics and non-topics of Special Eurobarometers.” LEQS Paper No. 88, February 2015
Johnston, Alison & Regan, Aidan. “Taming Global Finance in an Age of Capital? Wage-Setting
Institutions' Mitigating Effects on Housing Bubbles” LEQS Paper No. 87, February 2015 D’Errico, Marco, Macchiarelli, Corrado & Serafini, Roberta. “Differently unequal. Zooming-in on the
distributional dimensions on the crisis in euro area countries” LEQS Paper No. 86, January 2015 Crescenzi, Ricardo & Giua, Mara. “The EU Cohesion policy in context: regional growth and the
influence of agricultural and rural development policies” LEQS Paper No. 85, December 2014 Bartlett, Will. “Shut out? South East Europe and the EU’s New Industrial Policy” LEQS Paper No. 84,
December 2014 Guiso, Luigi, Sapienza, Paola & Zingales, Luigi. ‘’Monet’s Error?’’ LEQS Paper No. 83, November 2014 Costa-i-Font, Joan & Zigante, Valentina. ‘’The Choice Agenda’ in European Health Systems: The Role
of ‘Middle Class Demands’’ LEQS Paper No. 82, November 2014 Woodroof, David M. ‘Governing by Panic: the Politics of Eurozone Crisis’ LEQS Paper No. 81, October
2014 Monastiriotis, Vassilis, Kallioras, Dimitris & Petrakos, George. ‘The regional impact of EU association
agreements: lessons for the ENP from the CEE experience’ LEQS Paper No. 80, October 2014 Bugarič, Bojan. ‘Protecting Democracy and the Rule of Law in the European Union: The Hungarian
Challenge’ LEQS Paper No. 79, July 2014 Bertsou, Eri. ‘The 2014 EP Elections: A Victory for European Democracy? A Report on the LEQS Annual
Event 2014’ LEQS Paper No. 78, July 2014 Innerarity, Daniel. ‘Does Europe Need a Demos to Be Truly Democratic?’ LEQS Paper No. 77, July 2014 Hassel, Anke. ‘Adjustments in the Eurozone: Varieties of Capitalism and the Crisis in Southern Europe’
LEQS Paper No. 76, May 2014 Mabbett, Deborah & Schelkle, Waltraud. 'Searching under the lamp-post: the evolution of fiscal
surveillance' LEQS Paper No. 75, May 2014

38
LEQS European Institute London School of Economics Houghton Street WC2A 2AE London Email: [email protected] http://www2.lse.ac.uk/europeanInstitute/LEQS/Home.aspx