Location of Education: Impacts on Returns to Degrees for ...
33
Skidmore College Skidmore College Creative Matter Creative Matter Sociology Senior Seminar Papers Sociology Fall 2019 Location of Education: Impacts on Returns to Degrees for Asians Location of Education: Impacts on Returns to Degrees for Asians Kelly Tran Skidmore College, [email protected] Follow this and additional works at: https://creativematter.skidmore.edu/socio_stu_stu_schol Recommended Citation Recommended Citation Tran, Kelly, "Location of Education: Impacts on Returns to Degrees for Asians" (2019). Sociology Senior Seminar Papers. 46. https://creativematter.skidmore.edu/socio_stu_stu_schol/46 This Thesis is brought to you for free and open access by the Sociology at Creative Matter. It has been accepted for inclusion in Sociology Senior Seminar Papers by an authorized administrator of Creative Matter. For more information, please contact [email protected].
Transcript of Location of Education: Impacts on Returns to Degrees for ...

Skidmore College Skidmore College
Creative Matter Creative Matter
Sociology Senior Seminar Papers Sociology
Fall 2019
Location of Education: Impacts on Returns to Degrees for Asians Location of Education: Impacts on Returns to Degrees for Asians
Kelly Tran Skidmore College, [email protected]
Follow this and additional works at: https://creativematter.skidmore.edu/socio_stu_stu_schol
Recommended Citation Recommended Citation Tran, Kelly, "Location of Education: Impacts on Returns to Degrees for Asians" (2019). Sociology Senior Seminar Papers. 46. https://creativematter.skidmore.edu/socio_stu_stu_schol/46
This Thesis is brought to you for free and open access by the Sociology at Creative Matter. It has been accepted for inclusion in Sociology Senior Seminar Papers by an authorized administrator of Creative Matter. For more information, please contact [email protected].

*Please direct all correspondence to Kelly Tran by email at [email protected] and mail at
Skidmore College, 815 North Broadway, Saratoga Springs, NY 12866. The author wishes to
acknowledge the generous support of Professor Catherine Berheide, Professor Andrew Linder
and her seminar colleagues.
Running Head = LOCATION OF EDUCATION
Location of Education:
Impacts on Returns to Degrees for Asians*
Kelly Tran
Skidmore College
Word Count = 6,534

LOCATION OF EDUCATION
2
Location of Education: Impacts on Returns to Degrees for Asians
ABSTRACT
How might an Asian immigrant who earned a college degree abroad experience different
returns to their degree than an Asian American with an American degree? Human capital theory
suggests that additional schooling is rewarded in the labor market because employers value the
skills, training, and knowledge that come from additional education. However, I propose that
foreign education lessens the returns to degrees (job relatedness, income, and job satisfaction) for
Asians in the U.S. labor market. I analyze a subset of 12,372 Asian-identifying respondents from
the 2017 National Survey of College Graduates, a biennial survey of college graduates in the
United States. At the bivariate and multivariate level, foreign educated Asians report their jobs
being more related to their highest degree than U.S. educated Asians. Additionally, there is no
statistically significant relationship between income, job satisfaction, and foreign education.
Thus, my hypotheses are disconfirmed and human capital theory is supported. Of my
independent and control variables, the proportion of a respondent’s life spent in the U.S. is the
largest predictor of job relatedness and income. The more time a respondent has spent in the
U.S., the less related their principal job is to their highest degree and the more income the
respondent earns. This study invites further research on returns to degrees for Asians by
disaggregating the generalized racial identity into ethnic groups to uncover differences within the
Asian racial group.

LOCATION OF EDUCATION
3
Location of Education: Returns to Degrees for Asians
In the past decades, an extensive body of literature has emerged that investigates
education as a stratifying mechanism. In 2017, there were more than 22 million Asian Americans
living in the United States, comprising more than 6 percent of the national population. The Pew
Research Center reports Asian Americans as the fastest growing community of any major
racial/ethnic group. In the particular case of Asian Americans, a long period of discrimination
severely impacted their opportunities for mobility with in the United States. The term “model
minority” has been used to characterize Asian Americans, based on the observations that they
compare favorably to their white counterparts, and seemingly outperform other racial minorities,
in education, occupational attainment and socioeconomic status (Barringer, Takeuchi, and Xenos
1990; Zeng and Xie 2004; Dukhong 2015).
While the U.S. Asian population overall does well on measures of economic well-being
compared with the population as a whole, few studies examine how an American degree is a
form of human capital in the assimilation process for immigrants coming to the United States
(Barringer, Takeuchi, and Xenos 1990; Zeng and Xie 2004; Painter 2013; Painter and Qian 2016;
Lancee and Bol 2017). Fewer studies examine how the place of education influences the returns
to degree-holding Asian Americans (Barringer et al. 1990; Zeng and Xie 2004). Educational
degrees should ease the acculturation and assimilation processes for immigrant populations.
However, human capital attained abroad may not be compatible with that obtained in the United
States.
This paper aims to test the human capital theory within a group with high levels of
education attainment. Specifically, this study will be assessing the transferability of human
capital cross-culturally. By the logic of the human capital theory, high levels of education, no

LOCATION OF EDUCATION
4
matter the origin, should be rewarded in the labor market. Foreign degrees do not translate
directly into the American labor market, creating barriers to employment commensurate with
educational background and ultimately leading to lower paying occupations (Basran and Li
1998; Gurcharn and Zong 1998; Arbeit and Warren 2013; Painter 2013). A recurrent finding is
that compared to the native population, immigrants earn lower wages (Barringer et al. 1990;
Zeng and Xie 2004) and are unable to obtain desirable jobs (Painter 2013).
Using the National Survey of College Graduates, this research paper seeks to answer the
following questions: how does the place of education affect the returns to degrees for Asian
Americans? More specifically, to what extent do foreign-educated and U.S.-educated Asian
Americans differ, if at all? Based on previous studies, I hypothesize that:
1. Foreign educated Asians report less job to degree relatedness than U.S. educated
Asian Americans,
2. Foreign educated Asian immigrants earn less income than U.S. educated Asian
Americans, and
3. Foreign educated Asians report lower job satisfaction than their U.S. educated
counterparts.
THEORETICAL BACKGROUND
Why might an Asian immigrant who earned a college degree abroad experience different
returns to their degree than an Asian American with an American degree? To think about this
question thoroughly, I find it useful to draw on human capital theory to consider the processes
through which educational attainment translates into labor market outcomes.

LOCATION OF EDUCATION
5
Human Capital Theory
Human capital theory suggests that additional schooling is rewarded in the labor market
because employers value the skills, training, and knowledge that come from additional education
(Arbeit and Warren 2013; Barringer et al. 1990; Lancee and Bol 2017; Torres Stone,
Purkayastha, and Berdahl 2006). Educational attainment acts as an indicator of skills that a
potential employee brings to the labor market (Arbeit and Warren 2013). Based on this approach,
human capital theory holds that high levels of education should result in greater returns to
degrees. In evaluating lower returns to foreign degrees, scholars focus on the transferability of
human capital. Degrees function as a signal on the basis of which employers screen potential
employees. From this perspective, the relative value of a foreign degree in the labor market is a
function of employers’ assessments of whether a foreign educational institution imparts the same
quantity and quality of skills, and knowledge as an American institution (Lancee and Bol 2017).
Some researchers (Basran and Zong 1998; Feliciano and Lanuza 2017; Lancee and Bol
2017; Painter 2013; Zeng and Xie 2004) have suggested that the fault with human capital theory
is that foreign capital may be limited in transferability for two reasons: skills and the quality of
education. Previous studies argue that most human capital has a country-specific component.
Skills acquired in one country might not be compatible in another country. Highly skilled
immigrants may be underutilized and relegated to jobs not commensurate with education (Arbeit
and Warren 2013; Painter 2013). Skills acquired in one country may translate into greater returns
in the labor market in that respective country, but not in that of other countries.
Secondly, degrees attained abroad, specifically non-Western countries, may be from
lower quality institutions (Feliciano and Lanuza 2017; Kim and Zhao 2004; Lancee and Bol
2017). This is especially harmful for immigrants who do not continue their education in the

LOCATION OF EDUCATION
6
United States. Since the educational requirements for occupational access are predominantly
defined for American degrees, immigrants with foreign degrees and skillsets will have
difficulties in getting formal access to occupations. The unfamiliarity with foreign institutions
and the quality of education creates a barrier to the labor market, leading to the decreased
transferability of foreign degrees and experience.
The empirical expectation is that American employers will more richly reward American
college degrees over foreign degrees, resulting in immigrants’ earnings disadvantage (Basran and
Li 1998). This paper utilizes the National Survey of College Graduates to examine the
relationships between location of education and returns to degrees, testing the transferability of
human capital theory, specifically that of foreign capital.
LITERATURE REVIEW
In this section, I discuss the unique positionality of Asians as model minorities in the
United States. Next, I examine the effects of the model minority image on the integration of
Asians into the United States and possible causal mechanisms for lower returns to degrees for the
foreign educated.
Model Minority Myth
In the 1960’s, the New York Times published an article based on the observation that
Asians fare favorably to their minority counterparts on measures of socioeconomic status, giving
rise to the popular term “model minority” (Zeng and Xie 2004). The triangulation and portrayal
of Asian Americans as a "model minority" serves the purpose of maintaining the existing racial
order and racial power by defining Asians according to a two-dimensional standard:
superior/inferior and insider/foreigner (Dukhong 2015). Within the racial hierarchy system in the
LOCATION OF EDUCATION
7
U.S., Asians are categorized as being between Whiteness and Blackness. Asians Americans are
uniquely positioned in that not all groups are able to fulfill the “model minority” myth.
The model minority myth has conflated Asians into a singular group with a singular
identity. The conflated identity obscures the differences within the racial group (Hirschman and
Wong 1986; Kim and Sakamoto 2010). A key contention of the model minority myth is that the
labor market continues to discriminate against Asians Americans and Asian immigrants.
Hirschman and Wong’s (1984:584) study concludes that “Asian Americans approach
socioeconomic parity with whites because of their overachievement in educational attainment.”
Although the average earnings and occupational attainment of Asian Americans do not differ
greatly from that of Whites, Asians tend to overachieve. In order to receive the same
socioeconomic rewards as Whites, Asians must make a higher investment in their human capital
and obtain more education (Hirschman and Wong 1984).
Although Asians are able to mobilize, they are unable to reach economic parity with
Whites. With lower levels of educational attainment (Feliciano and Lanuza 2017) and
increasingly high poverty rates (Lo Iacono and Demireva 2018; Takei and Sakamoto 2011),
recent Asian immigrants face challenges obscured by the model minority myth. While some
established groups, such as Chinese and Japanese, have established economic success, recent
immigrants, such as Vietnamese and Cambodian, face difficult circumstances to social and
economic integration (Arbeit and Warren 2013; Barringer et al. 1990; Lueck 2018). The model
minority myth masks barriers in achieving full equality in the workplace, especially within the
Asian racial group (Torres et al. 2006).
Lower Returns for Higher Degrees

LOCATION OF EDUCATION
8
The integration of immigrants into the U.S. is an interesting point to explore in relation to
highly-skilled migrants. The immigration process is complicated and only a select few from any
one country can migrate to the United States. Those who tend to migrate tend to be more
educated than their non-migrating counterparts (Feliciano and Lanuza 2017; Lueck 2018). Many
Asian immigrants take a different path to immigration than others. In 2012, Asian immigrants
had become the largest group of immigrants receiving permanent resident status through
employment (Lueck 2018; Omori 2016). Other immigrant groups from North America and South
America were granted permanent residency through family reunification (Omori 2016). Though
high in demand (Basran and Zong 1998; Lo Iacono and Demireva 2018), highly-skilled
immigrants face various obstacles to positive socioeconomic attainments, including racial
prejudices in the U.S., lack of transferability of foreign degrees, and lower wages as a result.
Alba and Nee (2005) argue that the social boundaries based in racial/ethnic identity are so
deeply rooted that attitudes and behaviors are formed upon these ideas. This suggests that
racial/ethnic minority immigrants may not integrate well into U.S. society because they are
subject to similar, if not more severe, prejudices as their native-born counterparts (Barringer et
al. 1990; Dukhong 2015; Friedman and Krackhardt 1997; Painter and Qian 2016).
To better understand the extent of disadvantages, it is important to examine the impact of
a foreign degree. According to human capital theory, educational credentials do not transfer
cross-culturally due to country specific skills and unfamiliarity with foreign institutions,
specifically non-Western ones. A degree acquired in the U.S. has been shown to have a greater
impact on the economic integration and opportunities available to migrants (Arbeit and Warren
2013; Basran and Li 1998; Lancee and Bol 2017; Lo Iacono and Demireva 2018; Painter 2013;
Painter and Qian 2016; Tong 2010). Foreign degrees are less rewarded in the job market, as

LOCATION OF EDUCATION
9
employers are unsure of the quantity and quality of skills, and knowledge imparted in those
institutions.
Human capital appears to be moderated by group membership (Friedman and Krackhardt
1997). Previous studies (Friedman and Krackhardt 1997; Kim and Sakamoto 2010; Kim and
Sakamoto 2014; Kim and Zhao 2014; Zeng and Xie 2004) have found that in general, Asians,
both foreign and U.S. educated, face an earnings disadvantage compared to the White majority
group. Due to the lower value of human capital attained abroad, Zeng and Xie (2004) find that
foreign educated Asian immigrants earn 16 percent less than U.S. educated Asian Americans,
U.S. educated Asian immigrants, and U.S. educated Whites. Similarly, it was found that there
was overachievement by Asians at all levels (Kim and Sakamoto 2010) and an 8 percent
earnings disadvantage for Asian men (Kim and Sakamoto 2010; Kim and Sakamoto 2014). Kim
and Zhao (2014) find a similar pattern of disadvantage for Asian women. In their study, Asian
women were less likely to be employed than White women. Accounting for generational status,
none of the groups of Asian women were found to be advantaged in comparison to White
women. These studies suggest that returns to education is significantly smaller for Asian
employees.
Using the data available from the 2017 National Survey of College Graduates, this
research paper aims to add to the current body of literature by examining these causal
mechanisms of stratification for Asian Americans and immigrants. I hypothesize that foreign
educated Asian immigrants will earn fewer returns to degrees than similarly educated U.S.
educated Asian Americans.

LOCATION OF EDUCATION
10
METHODS
Data Source
For this study, I use the 2017 National Survey of College Graduates (2017 NSCG)
public-use data files. The 2017 NCSG is a biennial survey of non-institutionalized college
graduates, under the age of 76, residing in the United States administered by the Census Bureau
and sponsored by the National Science Foundation. The survey provides data on the number and
characteristics of individuals with a bachelor’s or higher degree (National Science Foundation
2017).
Data Collection
The current NSCG uses a rotating panel sample design. A new cohort is selected for each
decennial census. College degree-holders were identified using the American Community
Survey (ACS). Every panel receives a baseline survey interview and three biennial follow-up
interviews before rotating out. The 2017 NSCG includes 124,000 sample cases and a weighted
response rate of 71 percent, including samples from the 2009, 2010, 2013, and 2015 ACS.
The NSCG uses three primary methods of data collection: online survey, mail
questionnaire, telephone interview. At any time during data collection, respondents can choose to
complete the survey using any of the three data collection modes. For further information on how
the data were collected, see the 2017 National Survey of College Graduates, available online at
https://www.nsf.gov/statistics/srvygrads/#sd (National Science Foundation 2017).
Population and Sample
I created a subset of the NSCG data for self-identified Asian respondents. This analysis
includes only single-race Asians, because multi-racial Asians cannot be identified in the NSCG. I
restricted the analysis to the adults age 25 to 64 years participating in the labor force, employed

LOCATION OF EDUCATION
11
and unemployed. In using the NSCG, my analysis cannot investigate Asians who do not have a
college degree. Thus, my subset for this study is composed of 12,372 individuals.
Independent Variable
For the purposes of this study, I use the self-reported locations of the first bachelor’s
degree. The 2017 NSCG asks respondents “From which academic institution did you receive
your first BA degree (country code)?” The survey further differentiates between U.S. and non-
U.S. institutions in the code book using the reported country code. Using the NSCG derived data,
I created a dummy variable for the place of education, coded as 1 for foreign educated
respondents, and 0 for U.S. educated respondents. Due to the limited sample of this study, I
include Asian immigrants who received their schooling abroad in any country outside of the
United States. I exclude those who do not report a location code.
Dependent Variable
The dependent variable is returns to degree. Using the NSCG, I will be using three
variables to measure the expected gains from education: the relationship between the principal
job and highest degree, income, and job satisfaction.
Job-degree relatedness. The survey asked respondents “To what extent was your work on
your principal job related to your highest degree?” This question measures the degree to which
the respondent believes their highest degree is related to their main job. I reverse coded the
original variable in order to measure relatedness. 1 is coded as not related, 2 for somewhat
related, and 3 for very related. I exclude cases with missing responses.
Income. The NSCG asks respondents “Counting all jobs held in 2016, what was your
total earned income for 2016, before deductions?” Respondents are prompted to write in the
LOCATION OF EDUCATION
12
answers. Income is coded between 0 and 2 million dollars. I exclude respondents who do not
report an income for 2016.
Job satisfaction. To measure job satisfaction, the NSCG asks “How would you rate your
overall satisfaction with the principal job you held during the week of February 1, 2017?” This
was reverse coded to measure satisfaction as 1 for very dissatisfied, 2 for somewhat dissatisfied,
3 for somewhat satisfied, and 4 for very satisfied. I exclude missing cases.
Control Variables
The control variables are sex, birthplace, and length of residency in the U.S. Sex is coded
as 0 for men and 1 for women. Birthplace indicates the country of birth. Residents born in the
U.S. are coded as 0 and foreign born as 1.
For their length of residency, the survey asks “In what year did you first come to the
United States for six months or longer?” To account for both U.S. citizens and immigrants, I
create a variable to measure the proportion of the respondent's life spent in the U.S., ranging
from 0 percent to 100 percent. Assuming respondents did not spend significant amounts of time
abroad, the length of residency in years was calculated. For U.S. born respondents, residency is
equivalent to age. For foreign born respondents, this is calculated by subtracting the year they
report arriving from the survey year, 2017. To calculate the proportion, I divide length of
residency by age, and multiply by 100 to generate a percentage. Due to several discrepancies in
age and length of residency, I exclude 66 respondents whose proportions were greater than 100
percent.

LOCATION OF EDUCATION
13
FINDINGS
Univariate
Table 1 presents the means, medians, and standard deviations of all the variables. Figure
1 shows the distribution of the independent variable, place of education. According to Table 1
and Figure 1, about 46 percent of respondents are foreign educated and 54 percent are U.S.
educated.
[Insert Table 1 about here]
[Insert Figure 1 about here]
Figure 2 displays the distribution of one of the dependent variables, job to degree
relatedness. Table 1 indicates that on average, respondents report that their jobs are somewhat
related to their highest degree. According to Figure 2, most respondents report that their job is
very related their highest degrees.
[Insert Figure 2 about here]
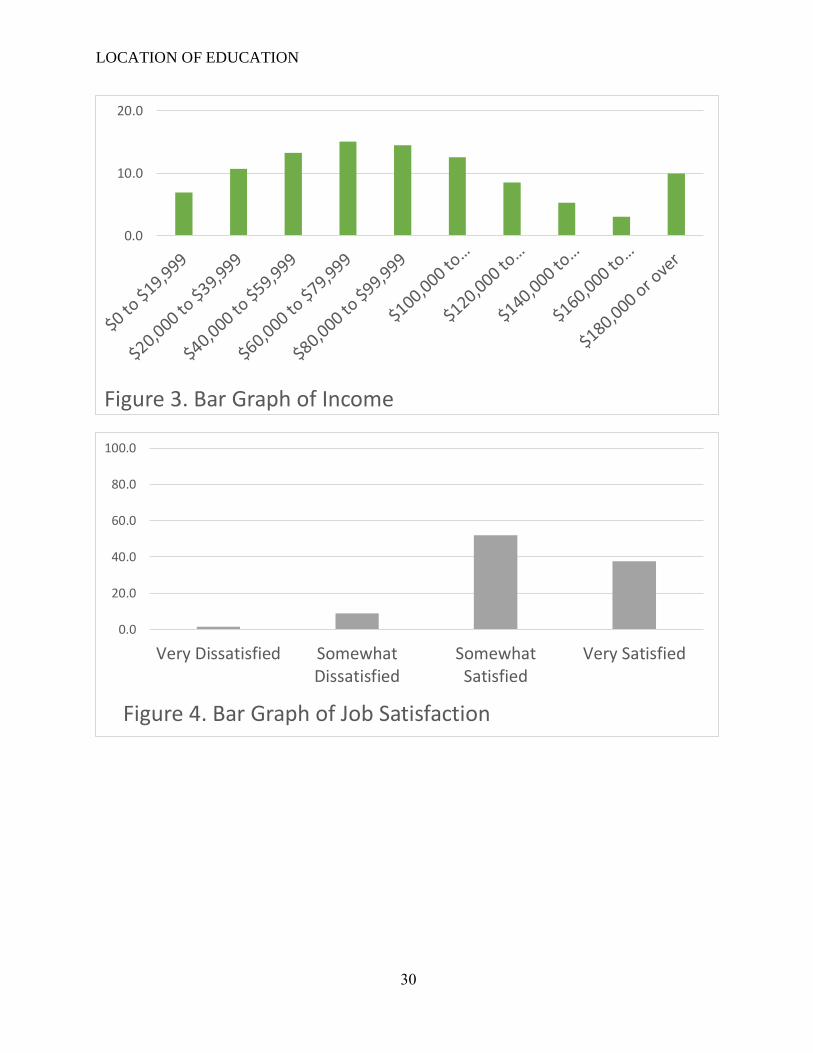
Table 1 indicates that the average personal income of the sample is $108,059.53 with a
standard deviation of $162,980.71. Figure 3 shows the distribution of the income variable in
increments of $20,000. The median income of $84,000 is drastically different from the mean.
Therefore, the distribution is heavily skewed to the right. The largest categories for personal
income are $60,000 to $70,000 and $80,000 to $99,999, with about 15% of the sample in each.
About eight percent of respondents have an income between $0 to $19,999 and about 10% of
respondents have an income of $170,000 or greater.
[Insert Figure 3 about here]
Figure 4 shows the distribution of job satisfaction. Table 1 indicates that the average
respondent is somewhat satisfied with his/her job. The standard deviation for this variable was

LOCATION OF EDUCATION
14
0.682, revealing that 68 percent of all respondents are composed of somewhat dissatisfied to very
satisfied with their jobs. According to Figure 4, most respondents are somewhat satisfied to very
satisfied with their current job.
[Insert Figure 4 about here]
Figure 5 displays the distribution of sex. According to Table 1 and Figure 5, 42% of the
sample are women and 58 percent are men.
[Insert Figure 5 about here]
Figure 6 shows the distribution of birthplace. Table 1 and Figure 7 show that 71 percent
of respondents are foreign born and 29 percent are U.S. born.
[Insert Figure 6 about here]
Figure 7 displays the distribution of the proportion of life spent in the U.S. Table 1
indicates that on average, respondents spend 80% percent of their lives in the U.S. In Figure 8, a
bimodal distribution is present, with fewer than 10 percent of respondents spending 40 percent to
99.99 percent of their lives in the U.S. Most respondents have spent 100 percent of their lives in
the U.S. According to Table 1, 68 percent of respondent spend between 46 and 100 percent of
their lives in the U.S.
[Insert Figure 7 about here]
Bivariate
Table 2 shows the correlation between the returns to degree variables and all other
variables.
[Insert Table 2 about here]
The relationships between job relatedness and all other variables are statistically significant.
There is a weak and positive relationship between income and job relatedness. The more related
LOCATION OF EDUCATION
15
the respondent’s job is to their highest degree, the more income the respondent earns. There is a
weak and positive relationship between job relatedness and job satisfaction. The more related
one’s job is to their highest degree, the greater satisfaction with one’s job. There is a weak and
positive relationship between being foreign educated and job relatedness, meaning that foreign
educated Asians are more likely to have greater job relatedness to their highest degree. There is a
statistically significant, weak, and negative relationship between job relatedness and the
proportion of life spent in the United States. The more time one has spent in the United States,
the more related their job is to their highest degree.
There is a statistically significant, weak, and positive relationship between income and
job satisfaction. The more income one earns, the greater one’s satisfaction with their job. There
is no relationship between income and being foreign educated. There is a statistically significant,
weak, and negative relationship between being a woman and income. On average, women earn
less income. There is no relationship between being foreign born and income. There is a
statistically significant, weak, and positive relationship between income and proportion of life
spent in the United States. The more time one has spent in the United States, the more income
one earns.
There are no statistically significant relationships between job satisfaction and all other
variables. There is a statistically significant, weak, and negative relationship between being a
woman and being foreign educated. Women are less likely to be foreign educated. There is a
statistically significant, strong and positive relationship between being foreign educated and
being foreign born. Foreign born respondents are more likely to be foreign education. There is a
statistically significant, strong and negative relationship between being foreign educated and

LOCATION OF EDUCATION
16
proportion of life spent in the U.S. Foreign educated respondents spend less of their lives in the
U.S.
There is a statistically significant, weak and negative relationship between being a
woman and being foreign born. Foreign born respondents are less likely to be women. There is a
statistically significant, weak and positive relationship between being a woman and proportion of
life spent in the U.S. Women spend more of their lives in the United States. There is a
statistically significant, moderately strong and negative relationship between being a foreign
born and proportion of life spent in the U.S. Foreign born respondents spend less of their lives in
the United States.
Multivariate
Job relatedness. As shown in Table 3, 4.6 percent of the variance in job relatedness can
be explained by foreign education, being a woman, and the proportion of life spent in the U.S
(R2 = .046). With an F value of 150.533, the regression equation is significant at the .01 level
(p < .001). The significant predictors of job relatedness (p < .001), ordered from largest to
smallest, are the proportion of life spent in the U.S. (ß = -.155), foreign education (ß = .060), and
being a woman (ß = -.052). The foreign born variable is not statistically significant at the .001
level.
[Insert Table 3 about here]
Table 4 displays an iterative regression of job relatedness on all variables. In models one
through four, all significant variables remain significant (p < .001). Additionally, the regression
equation remains significant through model 4 (F = 150.533). As seen in the R2 values,
explanatory power increases with the introduction of each control variable. Model 4 displays the
regression coefficients of job relatedness on all variables. On average, foreign educated Asians

LOCATION OF EDUCATION
17
have jobs related to their highest degree. More time in the U.S. is related to lower job
relatedness. Women report less job relatedness, on average.
[Insert Table 4 about here]
Income. As seen in Table 3, two percent of the variability in income can be explained by
foreign education, being a woman, being foreign born, and the proportion of life spent in the U.S
(R2 = .020). The regression is significant at the .001 alpha level (F = 64.333). The significant
predictors), ordered from largest to smallest, of income are the proportion of life spent in the
U.S. (ß = .115), being a woman (ß = -.108), and being foreign born (ß = .041). The primary
independent variable, foreign education, is not statistically significant (p > .001).
Table 5 shows an iterative regression of income on all variables. In all four models, the
regression equation is significant (p < .001). As shown in all R2 values, explanatory power
increases with the addition of each control variable. Foreign education is not a significant
predictor of income in any model. Being a woman remains significant in all models. Controlling
for all else, on average, Asian women earn about $36,000 less than Asian men. Foreign born
becomes significant with the introduction of proportion of life in the U.S. All else being equal,
foreign born Asians earn about $15,000 more than U.S. born Asians. For each additional
percentage increase in proportion of life spent in the U.S., respondents earn about $600 more.
[Insert Table 5 about here]
Job satisfaction. In Table 3, 0.1 percent of the variability in job satisfaction can be
explained by foreign education, being a woman, being foreign born, and the proportion of life
spent in the U.S (R2 = .001). The regression equation is not statistically significant at the .001

LOCATION OF EDUCATION
18
alpha level (F = 3.332). All of the independent and control variables are not statistically
significant (p > .001).
DISCUSSION
In this study, I sought to answer the following questions: how does the place of education
affect the returns to degrees for Asian Americans? More specifically, to what extent do foreign-
educated and U.S.-educated Asian Americans differ, if at all? The results support the human
capital theory and disconfirm my hypotheses. The bivariate results (see Table 2) indicate that
foreign educated Asians experience greater relatedness between their highest degree and
principal job than do U.S. educated Asians. There is no significant difference in income and job
satisfaction between those educated abroad and those educated domestically.
The multivariate results (see Table 3) are consistent with the bivariate results. Contrary to
my first hypothesis, foreign educated immigrants are employed in jobs related to their highest
degree. Though both findings are in contrast to the country-specific human capital argument
found in the literature, they are consistent with those by Lueck (2018) and Omori (2016). As
cited in the literature review, by 2012, Asian immigrants had become the largest group of
immigrants receiving permanent resident status through employment (Lueck 2018; Omori 2016).
Through employment-based visas, an employer can sponsor a foreign national for permanent
residency in the United States based on a permanent job offer.
Employment-based visas fall into three tiers of preference (U.S. Citizenship and
Immigration Services, n.d.). First preference includes those with extraordinary ability in the arts,
sciences, athletics, education or business, such as multinational executives or outstanding
researchers. Second tier includes those who have advanced degrees or who have an exceptional

LOCATION OF EDUCATION
19
ability of national interest. Skilled workers, professionals, and unskilled workers constitute the
third preferences. In all of the above cases, employment-based immigration requires proof of the
relationship between the person’s education/experience and relationship to the employment
offers. For example, a research university in the New Jersey must prove to the Department of
Homeland Security and U.S. Citizenship and Immigration Services that an economics professor
from Thailand is uniquely qualified to be employed in the university, as opposed to a professor
based in North Dakota.
With greater time spent in the United States, specifically for those who have spent the
majority of their lives in the country, there may not be an employment pipeline as direct as
employment-based immigration in the United States. Additionally, women experience decreased
relatedness between their degree and principal jobs, which could be an effect of the gendering of
immigration abroad. It is more common for a man to migrate first and establish roots in the
destination country, before the woman migrates. Through the path of family reunification, there
is no requirement to demonstrate the abilities of the spouse in relation to an occupation.
The second hypothesis is also disconfirmed. There is no significant difference in income
between those who are foreign educated and U.S. educated. Once in the United States, foreign
educated Asians do not generally experience a disparity in income as originally hypothesized.
However, there may be the presence of a disparity by ethnic membership as cited by Barringer et
al. Being a woman has substantial negative impacts on income in the United States. As seen in
Table 5, model four shows that Asian women earn $36,000 less than Asian men when
controlling for all else. This is to be expected with the gendered wage gap in the United States.
Foreign born Asians earn $15,000 more than U.S. born Asians, as shown in Table 5’s
model 4. Given the high correlation between the foreign educated and foreign born variables (r =

LOCATION OF EDUCATION
20
.569), it is possible that foreign born respondents are foreign educated and may be entering the
United States through employment-based visas as discussed previously. Contrary to job
relatedness, income increases as more time is spent in the United States. For each additional
percentage of a respondent’s life spent in the country, they earn $600 more. Respondents who
spend half of their lives in the United States earn $28,000 more. As respondents spend more time
in the United States, they acquire English language skills, cultural knowledge, and build
connections with others around them. These skills are valued in the job market and are positive
factors in social mobility, especially for immigrants.
Turning to job satisfaction, none of the variables are significant predictors of job
satisfaction. While job relatedness and income are partially explained, job satisfaction remains
unexplained in this study for Asians in the United States. There are many plausible reasons for
this, but I believe this might be the result of prioritizing financial security and stability. In the
current job market, immigrants and nationals alike are looking for jobs that pay the bills and put
food on the table. Coming out of school, many students look to secure a job, related or not to
their degree, and begin earning income to sustain themselves. It is possible that demographic
characteristics, such as place of education and gender, do not influence satisfaction. However,
when looking at the correlations between the three dependent variables, there is a statistically
significant relationship present between them. This suggests that job satisfaction is a result of job
and financial security. Whether employment results in job satisfaction is unknown and unable to
be predicted for this study’s population using the variables analyzed.
By investigating the association between place of education and returns to degrees, I have
been able to evaluate the human capital theory and whether skills are country-specific.
According to the findings presented previously, foreign educated Asians experience greater

LOCATION OF EDUCATION
21
returns to degrees than U.S. educated immigrants in the form of job relatedness. This indicates
that skills attained in another country can be transferred to the United States, most likely through
employment based-visas. Additionally, all else being constant, there is no difference in income
nor job satisfaction between foreign educated Asians and U.S. educated Asians. This means that
two Asians who possess a bachelor’s degree will earn the similar incomes and report similar
levels of job satisfaction, regardless of place of education. Thus, human capital theory is
supported by my findings.
CONCLUSION
This study analyzed the impact of place of education on the returns to degrees for Asians
in the United States. Drawing on human capital theory, I used the 2017 National Survey of
College Graduates to analyze a subset of 12,372 Asians in the labor force in the United States
between the ages of 25-64 years old. The regression analysis revealed findings that contrast with
my original hypotheses. After controlling for other potential predictors for returns to degrees,
including gender, birthplace, and time spent in the United States, I found that foreign educated
Asians experience more returns to degrees to an extent. Those educated abroad experience more
job to degree relatedness that those educated domestically, rejecting my first hypothesis. The
second and third hypotheses are also disconfirmed, because the multivariate results suggest that
there is no significant difference in income and job satisfaction between the two groups. The
results partially support the human capital theory, suggesting that skills may be transferable
across cultures and have no country-specific component.
The differences, or lack thereof, between both groups reflect past and present U.S.
immigration policies. Different Asian groups have taken different pathways towards immigration
since the passage of the Hart-Cellar Act of 1965. Prior to the act, immigration was dictated by

LOCATION OF EDUCATION
22
the National Origins Act. Most countries were assigned an immigration quota by the United
States, limiting the number of immigrants that could enter the United States in a given year. With
the passage of the Hart-Cellar Act, national quotas were eliminated and substantial waves of
immigration increased. Particularly, this act gave preference to relatives and highly-specialized
workers. With this new standard, highly educated and skilled immigrants began migrating to the
U.S.
These patterns may have carried over into the relationship between foreign education and
the returns to degrees, particularly job relatedness. The current political climate under the Trump
administration has tightened the requirements to enter the United States, specifically requiring
more specialized abilities and talents from immigrants. The selective process is intended to
lessen the competition between immigrants and natives for jobs and social mobility. According
to Investopedia, the denial rate for employment based visas rose 15 percent (Investopedia 2019).
Asian immigrants who fall under the third tier preference for employment-based visas may be
unable to migrate into the United States. Other tiered Asian migrates may experience greater
difficulties applying for and being granted the employment-based visas.
Limitations and Future Research
This study has several limitations. For the subset, I was only able to identify single-race
Asian respondents due to the design of the NSCG. Multiracial respondents were asked to identify
one race and or ethnicity on the NCSG, thereby excluding respondents with any Asian heritage.
Additionally, though my sample was robust, I did not have large enough samples of individual
Asian ethnic groups. I was not able to disaggregate Asian ethnic identity, instead analyzing the
racial group as a whole. By doing so, differences and disadvantages within the race may be
obscured. Finally, this study is performed with data from 2017 containing information from

LOCATION OF EDUCATION
23
immigrants who came at different points in time. Without the context of time, this study is
unable to identify which Asian immigrants experience advantage, with respect to time and ethnic
group membership.
For future study, I recommend a quantitative study on the immigration and assimilation
of separate Asian ethnic groups during periods of mass migration from respective countries into
the U.S. For example, a potential study could examine Vietnamese immigrants coming into the
United States during and after the Vietnam War, with a focus on integration into the U.S. labor
market.
Despite such limitations, this study provides support for human capital theory,
underscoring the partial advantage of foreign educated Asians in contrast to U.S. educated
Asians. As research on education as a stratifying mechanism grows, we should keep these
findings in mind.

LOCATION OF EDUCATION
24
REFERENCES
Arbeit, Caren A., and John R. Warren. 2013. "Labor Market Penalties for Foreign Degrees
among College Educated Immigrants." Social Science Research 42(3):852-71.
Barringer, Herbert R., David T. Takeuchi and Peter Xenos. 1990. "Education, Occupational
Prestige, and Income of Asian Americans." Sociology of Education 63(1):27-43.
Basran, Gurcharn S., and Zong Li. 1998. "Devaluation of Foreign Credentials as Perceived by
Visible Minority Professional Immigrants." Canadian Ethnic Studies 30(3):7-23.
Feliciano, Cynthia, and Yader R. Lanuza. 2017. "An Immigrant Paradox? Contextual Attainment
and Intergenerational Educational Mobility." American Sociological Review 82(1):211-
41.
Friedman, Raymond A., and David Krackhardt. 1997. "Social Capital and Career Mobility." The
Journal of Applied Behavioral Science 33(3):316-34.
Hirschman, Charles, and Morrison G. Wong. 1986. "The Extraordinary Educational Attainment
of Asian-Americans: A Search for Historical Evidence and Explanations." Social
Forces 65(1):1-27.
-----. 1984. "Socioeconomic Gains of Asian Americans, Blacks, and Hispanics: 1960-
1976." American Journal of Sociology 90(3):584-607.
Investopedia. 2019. “The Impact of Trump's H-1B Visa Crackdown in 5 Charts.”
https://www.investopedia.com/news/impact-trumps-h1b-visa-crackdown-5-charts/
Kim, ChangHwan, and Arthur Sakamoto. 2010. "Have Asian American Men Achieved Labor
Market Parity with White Men?" American Sociological Review 75(6):934-57.
-----. 2014. "The Earnings of Less Educated Asian American Men: Educational Selectivity and
the Model Minority Image." Social Problems 61(2):283-304.
LOCATION OF EDUCATION
25
Kim, Chang Hwan, and Yang Zhao. 2014. "Are Asian American Women Advantaged? Labor
Market Performance of College Educated Female Workers." Social Forces 93(2):623-52.
Kim, Dukhong. 2015. "White Americans' Racial Attitudes in Multiracial Contexts: The Role of
Perceptions of Minority Groups' Socioeconomic Status and Opportunities." Race, Gender
& Class 22(1/2):358-75.
Lancee, Bram, and Thijs Bol. 2017. "The Transferability of Skills and Degrees: Why the Place of
Education Affects Immigrant Earnings." Social Forces 96(2):691-716.
Lo Iacono, Sergio, and Neli Demireva. 2018. "Returns to Foreign and Host Country
Qualifications: Evidence from the US on the Labour Market Placement of Migrants and
the Second Generation." Social Inclusion 6(3):142-52.
Lueck, Kerstin. 2018. "Socioeconomic Success of Asian Immigrants in the United
States." Journal of Ethnic & Migration Studies 44(3):425-38.
National Science Foundation. 2017. “Overview: National Survey of College Graduates.”
https://www.nsf.gov/statistics/srvygrads/#sd.
Ormori, Megumi. 2016. "Educated and Staying at Home: Asian Immigrant Wives' Labor Force
Participation in the U.S." Journal of Comparative Family Studies 47(4):463-81.
Painter, Matthew A. 2013. "Immigrant and Native Financial Well-being: The Roles of Place of
Education and Race/Ethnicity." Social Science Research 42(5):1375-89.
Painter, Matthew A., II, and Zhenchao Qian. 2016. "Wealth Inequality among Immigrants:
Consistent Racial/Ethnic Inequality in the United States." Population Research and
Policy Review 35(2):147-75.
Takei, Isao, and Arthur Sakamoto. 2011. "Poverty among Asian Americans in the 21st Century."
Sociological Perspectives 54(2):251-76.
LOCATION OF EDUCATION
26
Tong, Yuying. 2010. "Place of Education, Gender Disparity, and Assimilation of Immigrant
Scientists and Engineers Earnings." Social Science Research 39(4):610-26.
Torres Stone, Rosalie A., Bandana Purkayastha and Terceira A. Berdahl. 2006. "Beyond Asian
American: Examining Conditions and Mechanisms of Earnings Inequality for Filipina
and Asian Indian Women." Sociological Perspectives 49(2):261-81.
U.S. Citizenship and Immigration Services. n.d. “Green Card for Employment-Based
Immigrants.” Accessed November 19, 2019. https://www.uscis.gov/green-
card/employment-based.
Zhen Zeng, David R., and Yu Xie. 2004. "Asian-Americans' Earnings Disadvantage
Reexamined: The Role of Place of Education." American Journal of Sociology
109(5):1075-108.

LOCATION OF EDUCATION
27

LOCATION OF EDUCATION
28

LOCATION OF EDUCATION
29
0.0
20.0
40.0
60.0
80.0
100.0
U.S. Educated Foreign Educated
Figure 1. Bar Graph of Country of Education
0.0
20.0
40.0
60.0
80.0
100.0
Not Related Somewhat Related Very Related
Figure 2. Bar Graph of Job Relatedness
LOCATION OF EDUCATION
30
0.0
10.0
20.0
Figure 3. Bar Graph of Income
0.0
20.0
40.0
60.0
80.0
100.0
Very Dissatisfied SomewhatDissatisfied
SomewhatSatisfied
Very Satisfied
Figure 4. Bar Graph of Job Satisfaction

LOCATION OF EDUCATION
31
0.0
20.0
40.0
60.0
80.0
100.0
Men Women
Figure 5. Bar Graph of Sex
0.0
20.0
40.0
60.0
80.0
100.0
U.S. Born Foreign Born
Figure 6. Bar Graph of Birthplace

LOCATION OF EDUCATION
32
0.0
10.0
20.0
30.0
40.0
50.0
60.0
70.0
0% to 19.99% 20% to 39.99% 40% to 59.99% 60% to 79.99% 80% to 99.99% 100%
Figure 7. Bar Graph of Percentage of Life Spent in the U.S.