Location attractiveness of Münster according to soft...
31
Location attractiveness of Münster according to soft person-related locational factors: trends during the last years. Bachelor Thesis Academic Year 2011/2012 First Supervisor: Jochen Dehling M.A., University of Münster Second Supervisor: Dr. Minna van Gerven, University of Twente Josephine Öhmke Hansaring 40a 48155 Münster Germany E-Mail: [email protected] B.A./B.Sc. Public Administration Student ID WWU Münster: 355974 Student ID UT Enschede: s1130196 Submission Date: August 6, 2012
-
Upload
nguyenliem -
Category
Documents
-
view
216 -
download
2
Transcript of Location attractiveness of Münster according to soft...
Location attractiveness of Münster according to soft
person-related locational factors: trends during the
last years.
Bachelor Thesis
Academic Year 2011/2012
First Supervisor: Jochen Dehling M.A., University of Münster
Second Supervisor: Dr. Minna van Gerven, University of Twente
Josephine Öhmke Hansaring 40a 48155 Münster Germany E-Mail: [email protected] B.A./B.Sc. Public Administration Student ID WWU Münster: 355974 Student ID UT Enschede: s1130196
Submission Date: August 6, 2012

Content
1. Introduction .................................................................................................................................. 3
2. Theoretical considerations ............................................................................................................ 6
2.1. Definition of “region of Münster” .................................................................................................6
2.2. Quality of life as a key concept .....................................................................................................7
2.3. Grabow’s theory of soft locational factors ...................................................................................9
2.4. Choice of the soft person-related locational factors to be examined .........................................10
3. Empirical considerations ............................................................................................................. 11
3.1. Operationalization of the chosen soft person-related locational factors ...................................11
3.2. Analysis of the soft person-related locational factors ................................................................13
3.2.1. Locational factor: housing and living environment ............................................................13
3.2.1.1. Dimension: attractive offer of living space .................................................................14
3.2.1.2. Dimension: cost-performance-ratio ...........................................................................16
3.2.1.3. Dimension: Availability of parking space ....................................................................17
3.2.2. Locational factor: recreational value ..................................................................................18
3.2.2.1. Dimension: Access to water based activities ..............................................................18
3.2.3. Locational factor: environmental quality ............................................................................20
3.2.3.1. Dimension: green areas and parks ..............................................................................20
3.2.3.2. Dimension: cleanness .................................................................................................21
3.3. Closing soft person-related factor assessment .......................................................................22
4. Conclusion ................................................................................................................................... 24
5. References................................................................................................................................... 26

3 Introduction
1. Introduction
Today’s social development is affected by several megatrends which influence political activities in all
fields of action. Two of these megatrends can also be seen as the groundwork for the problem this
thesis deals with. On the one hand, demographical change as the first megatrend describes the shift
within the age pattern. Meaning that due to lower mortality and lower rate of birth the overall
population rate shrinks. Furthermore, the share of the population of older people - compared to the
share of population of younger people - rises. “The demographical change influences the scope and
structure of the potential of the working population”1 (Deutscher Bundestag, 2002, p. 67). The second
megatrend influencing the problem is the tertiarization meaning the process of transformation from an
industrial society towards a society based on the provision of services. For the labor market, this
tertiarization implies a change of employees' requirements. The Enquête-Commission of the German
Federal Parliament arrives at the conclusion that “The trend shows a shift towards more ambitious
activities and - as a consequence - an increase of job specifications. Therefore, the demand for university
and college graduates will further increase within Germany”2
If these two trends are combined, the core difficulty will arise: The demand for highly skilled
(Deutscher Bundestag, 2002, p. 73).
3 workers
will increase - whereas the overall quote of working people will decrease. For the main part, this is an
economic problem; the link between the availability of human capital and a positive economic
development has been carried out by several scholars according to Haisch and Klöpper (2007), for
example by Büchel, Frick and Witte: “The continuous economic structural change towards more
complex production processes leads in all relevant developed countries to a growing demand of higher
qualifications […]. It follows that the production factor “human capital” […] gains more relevance.”4
The effects of this lack of highly skilled do not only occur within an economical framework but also
evolve a political issue. Because if the company’s competiveness and therefore economic success is
threatened, this also influences the region the company is settled in. The region will be directly
influenced by lower fiscal earnings but also indirectly because the lack of economic growth makes a
region itself unattractive for new investors. With lower fiscal earnings, the region’s possibilities to invest
their money in making the region more attractive for new investors, shrink and the overall welfare of
(Büchel, Frick, & Witte, 2002, p.207) For a single company, fewer highly skilled workers lead to a lack of
innovation and creativity - core values of a service-based society. Thus, the competiveness of that
company is threatened and the company becomes less attractive for potentially new employees. Again,
it is heading to a lack of human capital. A race to the bottom begins.
1 Translated by the author: „Der demographische Wandel beeinflusst Umfang und Struktur des Erwerbspersonenpotenzials.“ 2 Translated by the author: „Der Trend geht zu immer anspruchsvolleren Tätigkeiten mit der Folge weiter steigender
Qualifikationsanforderungen. So wird der Bedarf an Hoch- und Fachhochschulabsolventen in Deutschland auch weiterhin
wachsen.“ 3 Within this thesis „highly skilled“ refers to people with college or university degree. 4 Translated by the author: „Der anhaltende wirtschaftliche Strukturwandel hin zu komplexeren Produktionsprozessen führt in
allen wesentlichen Industrieländern zu einem wachsenden Bedarf an höheren Qualifikationen […].In der Folge gewinnt der
Produktionsfaktor „Humankapital“ […] an Bedeutung.“

4 Introduction
the region sinks. Thus, the problem's political aspect eventually deals with welfare-policy. To manage
the welfare problem mentioned above, politics have to break up the vicious circle or - even better - act
preventatively to minimize the risk of entering the race to the bottom.
Referring to the human capital theory, this can only succeed by attracting more highly skilled workers
for the region and its companies. To find a proper way to do so, one must understand how the highly
skilled make their locational choice. There must be added another element to the core difficulty
resulting from the demographical change and tertiarization: the regional mobility of the highly skilled.
Bötken, Bucher and Janich describe regional mobility as follows: “Regional mobility is in general a result
of perceived deficits and disparity within the general living conditions and chances. A change of the
place of residence will be considered if the improvement of the quality of life due to the relocation or
migration is of higher estimation as the economic and social costs of it.”5
The quality of life issue is not limited to a single region or country. Also the European Union considers
this issue as very important: “Challenges arising from low employment rates, an ageing population,
changing family structures and social exclusion have put quality of life issues at the top of the EU social
policy agenda.” (Eurofond, 2010). Especially in matters of being attractive for the highly skilled,
improvements have been made to assure that the Union itself stays competitive within a transferring
knowledge based society against the USA or Asia for example. An example for this is the introduction of
the Bachelor and Master program, which was established in 1998 to give students the opportunity to
study in other EU countries with barely any barriers. Also cross-border university cooperation have been
established to foster the understanding for the European Union itself. This helps to higher the
attractiveness European Higher Education Area and to commit the students to stay within the Union
instead of studying and working outside of it. Besides strengthening the Union’s competiveness as a
whole, tools in regional policy like the European Union’s Structural Funds have been established to
support regional growth within the Union. These European efforts emphasize the high importance of
bettering the level of quality of life to attractive for the highly skilled in order to be competitive in a
knowledge based society.
(Böltken, Bucher, & Janich,
1997, p. 35) It is therefore important to continuously improve the living conditions in order to keep or
make a region attractive. This theory derives from the assumption that the highly skilled, due to their
better qualification, receive more job offers compared to non graduates. They thus have a wider range
of choices where they want to live. Next to availability of work and salary requirements, they
increasingly choose their location according to the local quality of life (Jochmann, 2010, p. 99). Since the
second half of the 20th century, the buzzword “quality of life” occurred in this regard. Attractiveness and
therefore livability especially for the individual workers is nowadays broadly measures by the level of
quality of life.
5 Translated by the author: „Räumliche Mobilität ist im allgemeinen Folge wahrgenommener Defizite und Disparitäten in den
Lebensbedingungen oder -chancen. Ein Wohnungs- oder Wohnortswechsel wird erwogen, wenn die mit einem Umzug oder einer
Wanderung verbundenen Verbesserungen der Lebensqualität höher eingeschätzt werden als die dabei entstehenden
ökonomischen und sozialen Kosten.“

5 Introduction
This thesis’ focus should lie on one of those single regions in Europe and how certain factors, that
determine its attractiveness developed during the last years. In 2004 the city of Münster (Germany) won
the LivCom-Award and could therefore call itself “most livable city” within its category. This implicates
that Münster holds a high quality of life. But how did the soft-person related locational factors that
determine quality of life actually develop in Münster? To evaluate whether Münster’s local authorities
actually recognized the trend of ensuring the quality of life within the region this thesis will investigate
the question:
“How did the soft person-related locational factors in Münster develop during the last years in order
to be attractive for the highly skilled?”
To identify relevant soft person-related locational factors and measure their development within the
last years in Münster, the work of Grabow et al. (1995) will be my starting point. According to Grabow et
al. (1995), locational factors can be divided into three types: hard factors, soft enterprise-related factors
and soft person-related factors. In the recent scientific debate soft locational factors gained more
importance, this can most notably be attributed to the shift towards a knowledge-based economy. A key
concept of the kind of economy is the importance of the highly skilled workers namely people that push
technology by using their knowledge. That makes the individual a very important component of the
success a company can have. Unlike companies, individuals make a locational choice based on soft
person-related locational factors rather than the hard ones. Hence to attract the highly skilled
companies have to settle within – according to soft-personal factors – attractive regions. So regions (and
thus the local affairs) must improve their attractiveness to foster regional growth. A deeper insight how
all these components build a puzzle will also be developed within chapter 2 (theoretical considerations)
of my thesis. Furthermore in this part I will go on by choosing the important soft personal-related
factors to measure the attractiveness of the city Münster. Due to the limited space I will not analyze all
possible factors but instead but my focus on one out of two metafactors developed by Grabow et al.
(1995): the metafactors housing/recreational value.
Grabow’s theory will only be seen as a groundwork for the empirical analysis, however in the empirical
part of the thesis the metafactors will be broken down into single dimension by referring to the work of
Judith Jochmann (2010), who examined the general influence of several dimension on the satisfaction of
highly skilled within a region in the south of Germany. This thesis' focus will therefore be an empirical
one. It lies on the analysis of the development of a selection of these dimensions during the last years
as. From their development an inference to the trends in locational attractiveness of the city for highly
skilled can be drawn.
After elaborating the choice, which of Jochmann’s dimension will be examined, I will develop indicators
to operationalize them since - so far - the dimensions are only conceptual. I use others studies that have
already been conducted to find proper indicators for each dimension of the metafactor. Where there’s
no available research, I will also generate indicators myself. Based on former developed indicators, I will
analyze the empirical dataset. The data will for the most part be extracted from the annual statistical
6 Theoretical considerations
reports the city of Münster published yearly between 2001 and 2011 and the statistical database of
North Rhine-Westphalia (Landesdatenbank NRW). This measurement of the development of these
dimensions will enable me to give an elaborated statement on the trends they indicate for the locational
attractiveness of Münster. The focus thereby will not be to point out whether a particular soft locational
factor is good or not but rather how the availability of the factors has evolved within the last years and
what tendency lies within it to give a proper answer to the research question.
2. Theoretical considerations
2.1. Definition of “region of Münster”
When choosing a region as an object of statistical investigation, it is crucial to determine what areas are
actually covered within the research. In case of the region Münster there are several possibilities in
order to in- or exclude certain areas.
In terms of the administrative region (dt. “Regierungsbezirk”) Münster one would account an area
covering about 6.900 square kilometer and a population of 2.6 million. The administrative region
includes next to the independent cities (dt. “kreisfreie Städte”) Bottrop, Gelsenkirchen and Münster also
the districts Borken, Coesfeld, Steinfurt, Warendorf and Recklinghausen (Bezirksregierung Münster,
2010). The administrative region Münster can be equated with the International Chamber of
Commerce’s sector North-Westphalia (dt. “IHK-Bezirk Nord-Westfalen” (IHK Nord-Westfalen, 2012). The
administrative region Münster therefore could be an adequate term especially in a political and
economic sense. Even if – as shown in the first part of the thesis – locational factors as a term are mostly
used in economic science and the consequences of their absence gains more and more political
relevance, it is still the (highly skilled) individual which is the core of the problem. Therefore, using a
political or economic term to define the region would not be appropriate.
Considering the individual recognition, the investigated region I chose is the independent city of
Münster itself instead. This is not just due to the individual recognition but rather out of political scope
of action, because the decisions crucial in terms of soft locational factors (e.g. the use of land) fall to the
municipality and not to the administrative region. The independent city of Münster covers an area of
302.9 square kilometer and a population of 288.050 (in June 2011) (Information und Technik Nordrhein-
Westfalen, 2012) and includes 45 (statistical) urban districts. The relevant departments of the
municipality for this thesis are the department for planning, construction, economy and marketing as
well as the department for law, social affairs, integration, health, environmental and consumer
protection and the department of education, family, youth, sports and culture. Those departments play
the key role for the distribution of attractive soft person-related locational factors in the field of
housing, leisure and environment (first metafactor according to Grabow et al., 1995, p.23) and cultural
facilities, attractiveness, image (second metafactor).

7 Theoretical considerations
2.2. Quality of life as a key concept
If regions and the companies within fail to attract highly skilled, economic growth will be threatened and
the lack of highly skilled workers will eventually lead to a welfare problem. But in how far is this linked
to the quality of life concept? The quality of life concept has been established in the 1960s in the USA
and also gained relevance in the political discourse in Germany only a few years later. The Social
Democratic Party of Germany for example used the concept as a leading topic in their 1972 election
campaign. Heinz-Herbert Noll (1999), current Director of the Social Indicators Department, Centre for
Survey Research and Methodology (ZUMA) in Germany, described the link between welfare and quality
of life:
“Prosperity – or as well standard of living – in most cases subsumes the material
dimension of welfare, the availability of income and assets as well as the possession
and consumption of goods and services. […] Quality of life instead is a
multidimensional concept , which includes material as well as immaterial, objective
and subjective, individual and common welfare components at the same time, and
emphasizes the “better” compared to the “more”.”6
Within the empirical welfare research two main approaches of analyzing quality of life established since
1960: the Scandinavian “level of living - approach” and the American “quality of life – approach”. The
American approach emphasizes the subjective perception of quality of life and derives from the social
psychology. The operationalization is mainly based on subjective indicators which determine the
individual well-being such as satisfaction and personal fortune. The Scandinavian “level of living –
approach” in contrast emphasizes the resources available to the individual,these are for example
income and assets but also education for example. General living conditions such as the environment or
the labor market are seen as areas of social action which determine the value of the individual
resources. The Scandinavian measurement is therefore based on objective indicators and can be seen as
the more economic one (see Noll, 1999, p. 8).
(Noll, 1999, p. 3)
A popular representative of the American quality of life approach is the American urban study theorist
Richard Florida. In his publication „The Rise of the Creative Class“ (2002), he introduces the concepts of
the creative class, which „can best be defined as those workers whose productive output depends on
thinking rather than doing.“ (Stolarick, 2005, p. 74) The creative class (in Florida’s research seen as the
human capital especially for the innovative high-tech industry) clusters at certain locations based on
their attractiveness. According to Stolarick (2005) for this approach the attractiveness depends on three
„soft factors”: technology, talent and tolerance. For the measurement of each factor several indices
6 Translated by the author: „Unter Wohlstand – oder auch Lebensstandard – werden zumeist die materiellen Dimensionen der
Wohlfahrt, die Verfügung von Einkommen und Vermögen sowie der Besitz und Konsum von Gütern und Dienstleistungen,
subsumiert. […] Lebensqualität ist demgegenüber ein multidimensionales Konzept, das sowohl materielle wie auch immaterielle,
objektive und subjektive, individuelle und kollektive Wohlfahrtskomponenten gleiczeit umfaßt und das “besser“ gegenüner dem
“mehr“ betont.“

8 Theoretical considerations
have been established. For example the melting pot index and the gay index as indicators of diversity
and thus tolerance and the bohemian index as an indicator of “a region’s high-technology base and its
overall population and job growth.” (Stolarick, 2005, p. 83) Summarized, the outcome of Florida’s
approach is that the success of a region depends on the interaction of the three factors technology,
talent and tolerance: „A region that offers a balance of all 3 of the T’s of economic development is one
that will prosper.“ (Stolarick, 2005, p. 90) This approach therefore could be a theoretical base for the
measurement of the developing attractiveness of Münster in order to attract the highly skilled.
Yet, it has some weaknesses because it is strongly tailored to the American labor market. The melting
pot for example is a term strongly linked to the American culture which is historically affected by
migration and diversity of culture. People thus are more sensitized for these topics and assumably
appreciate tolerance more than people elsewhere in the world. It therefore seems not adequate to
measure a German region on this scale since the highly skilled that should be attracted are not American
but mostly German instead and might thus value the soft factors elaborated in the American quality of
life approach less.
I want therefore fallback on the Scandinavian level of living approach which is, as mentioned above, a
rather economic one. Among the German scholars, Busso Grabow, graduated economist of regional
science currently working for the German Institute of Urbanistic (Deutsches Institut für Urbanistik, DIfU)
set a milestone in 1995 when he published his book “Weiche Standortfaktoren”. Based on the industrial
location theory, he examined the location decision of companies and the influence of soft locational
factors on this decision. As Grabow et al. (1995, p.67) mentioned, a key characteristic of soft person-
related factors is that they depend on the subjective rating of each individual person: „For example the
green areas within a city can be counted by numbers, but eventually the opinion about the scope and
quality of this green areas is mandatory.”7
7 Translated by the author: “So lassen sich beispielsweise die in einer Stadt vorhandenen Grünflächen zahlenmäßig ausdrücken;
letzendlich sind jedoch die Meinungen über Umfang und Qualität dieser Grünflächen entscheidend.”
Since the theory of the soft-person-related factors that
Grabow conducted is closer to the subject of examination within this thesis than Florida’s approach, I
chose to base the empirical considerations on Grabow’s concept. (Grabow et al., 1995, p. 66) Grabow et
al. suggest to compare the results of the evaluation of objective facts with for example the results of
equivalent surveys. This would be linking the objectively based Scandinavian approach to the
subjectively based American approach. The soft person-related locational factors by Grabow et al. will
be the basis for my thesis, however, evaluating them objectively and subjectively is not feasible due to
the limited time and space given within this research. Therefor, I will concentrate on evaluating selected
factors objectively on the basis of an existing empirical dataset extracted from several statistical reports
the city of Münster and the state North Rhine-Westphalia publishes annually. This will lead to an
objective evaluation of the given locational factors and therefore rather enables to make assumptions
based on the Scandinavian approach.

9 Theoretical considerations
2.3. Grabow’s theory of soft locational factors
In the past, most of the literature analyzing locational decision focused on the entrepreneurial point of
view by analyzing why companies settled down in a particular region. For regional growth, it is very
important to be attractive for companies since they foster economic strength. Based on the traditional
approach, companies usually refer to so called “hard locational factors” to choose their best location.
Accordingly a region is more successful if it can offer those hard locational factors.
Contrary to this traditional perception, the so called “soft locational factors” lately gained more and
more influence. In 1995 Grabow et al. conducted a research to measure the importance of those soft
locational factors. Grabow picked up the scientific debate on quality of life in 1995 by accounting that so
called soft locational factors did gain significance within the last years. However, no empirical evidence
has been provided thitherto. Between 1993 and 1995 the German Institute of Urbanistic therefore
conducted a survey upon the significance of soft locational factors on location decision of 2000
questioned companies. Since – at least in Germany – there has been no later research covering such a
wide area, Grabow’s book can be seen as the basis for the debate on quality of life improving locational
factors in Germany.
According to Grabow et al. (1995) parameters of location decisions can be divided into three groups:
hard, soft company-related and soft person-related locational factors. Because the hard and soft
locational factors can be seen as complementary an explicit definition of the one implicates the
definition of the other. Although a clear distinction between hard and soft factors is hardly feasible, soft
and hard factors combined represent all possible influences on location decision. As defined by Grabow
soft locational factors either “a) […] have a direct impact on company or business activity, but are
characteristically difficult to measure, or fact is eclipsed or supplanted by opinion or b) they have little or
no direct impact on company or business activity, but they are relevant for the employees or decision-
makers.” (Grabow et al., 1995, p. 29) Especially part b of the definition is taken in account to link
Grabow’s finding to the concept of quality of life. This is also mirrored within the distinction between
the two types of soft factors:
„Soft enterprise-related factors: they directly affect business or company activity.
These include the behaviour of administrative authorities or political decision-makers;
soft person-related factors: they include entrepreneurs‘ personal preferences, in other
words subjective appraisal of local living and working conditions. This applies, for
example, to the quality of life and leisure, or to educational and cultural resources.“
(Grabow et al., 1995, p. 29)
The survey showed that about 20% of the decision-makers take soft locational factors in account when
making a location choice. Most of them include the soft locational factors in their decision when the
hard factors appear to be nearly the same for all possible choices. Also, it is possible for soft locational
factors to compensate missing quality of hard factors. In 2005, Grabow reflected the findings of his

10 Theoretical considerations
research 10 years ago with the result that soft locational factors gained even more importance which is
due to the ongoing tertiarization, the growing demand on qualified workers and also the increased
importance of the work-life-balance (Grabow, 2005, p. 40)..
2.4. Choice of the soft person-related locational factors to be examined
Grabow et al. (1995) carry out a division into nine different soft person-related locational factors:
housing and living environment, environmental quality, schools and education, recreational value,
attractiveness of the region, attractiveness of the city, high culture, cabaret and tranquility. To gain
comprehensive assessment on the development of Münster’s attractiveness based on soft person-
related locational factors one should examine all the mentioned factors. Due to the limited space within
this thesis I had to make an appropriate choice of the factors I will actually investigate. To do so, I
analyzed the survey used by Grabow et al. (1995) conducted by the German Institute of Urbanistic
(DIFU). The interpretation provides information about the importance and satisfaction of the people
questioned. They were (among other things) questioned how important each locational factor is when
choosing a concrete location for their company. It can’t be abstracted away from the finding that
person-related factors on general only influence the location decision by nine percent (Grabow et al.,
1995, p.221) but more important is the distinction between each individual factor. To determine the
importance and satisfaction each factor could be rated on a scale: 1 (very important/satisfied), 2 (rather
important/satisfied), 3 (rather not important/satisfied) and 4 (not important/satisfied at all). Table 1
shows the average rating of importance and satisfaction for soft person-related locational factors.
Table 1: Average rating of importance and satisfaction for soft person-related locational factors
Factor importance* Satisfaction
housing and living environment 1,87 (83,4 %) 2,19
environmental quality 2,04 (72,3 %) 2,07
schools and education facilities 2,12 (70,5 %) 1,97
recreational value 2,24 (65,8 %) 2,05
attractiveness of the region 2,33 (56,7 %) 2,04
attractiveness of the city 2,48 (48,1 %) 2,04
high culture 2,70 (38,7 %) 2,11
Tranquility 2,71 (38,2 %) 2,12
Cabaret 2,74 (36,6 %) 2,15
Source: Compiled by the author after Grabow et al. (1995)
Notes: *bracketed: The percentage of people rating a factor very or rather important
As table 1 shows, the four most important factors are housing, environment, education and recreation
with more than 65 % (almost 2/3) of the questioned people rating them very important or rather
important. Also the factor with the highest importance (housing) is rated with the lowest satisfaction.

11 Empirical considerations
That makes it even more crucial to local authorities in order to attract highly skilled workers. The factor
schools and educational affairs show the highest satisfaction instead. Based on the rating of importance
and satisfaction it seems like to pick the most important factors with low satisfaction. Following this only
three out of nine factors will be considered in my thesis: housing and living environment, recreational
value and environmental quality.
3. Empirical considerations
For local authorities it is of high importance not just to foster but also to broaden the amenities of the
region in order to attract and oblige the highly skilled. Based on this general finding, I will analyze the
development of the chosen soft person-related locational within the region of Münster from the
viewpoint of highly skilled workers in the following. Therefore it will be necessary to define which
indicators will be used to evaluate the trends that evolved during the last years and where the examined
data comes from.
3.1. Operationalization of the chosen soft person-related locational factors
In chapter 2.4., I made a choice of the factors I will evaluate based on their importance and satisfaction
as detected by Grabow et al. (1995). These are housing/living environment, environmental quality and
recreational value. To value the development of those factors for the case of Münster they now have to
be operationalized. Therefore, dimensions describing each factor must be identified and adequate
indicators to measure the development of this dimension must be designed. To define adequate
dimensions I will make use of an existing survey (“Standortfaktor Lebensqualität: Die subjektive
Wahrnehmung Hochqualifizierter in der Region Ingolstadt”) conducted by Judith Jochmann (Jochmann,
2010). Jochmann examined the general influence of several dimensions on the satisfaction of highly
skilled within a region in the south of Germany based on a two-stage evaluation conducted in 2009 and
2010. The survey has been conducted for the target group of highly skilled workers and therefore deals
with the same target group as this thesis does. Furthermore it is settled within the same country as my
thesis deals with (Germany). Therefore transferability of the outcome of Jochmann’s research on my
thesis by all means exists. The advantage of falling back on this survey and use existing data is to base
the choice on already scientifically discussed dimensions and therefore includes the know-how of other
scientists. Using other methods (e.g. mind-mapping) would in contrast only include the knowledge of
the author herself.
Judith Jochmann found that thitherto no commonly accepted concept regarding quality of life in
conjunction with locational factors has been carried out. But quality of life as a locational factor can be
seen as a construct out of factors like housing, recreational value, educational facilities (Jochmann,
2010). Jochmann thus falls back on the soft locational factors Grabow introduced in 1995. The superior
aim of Jochmann’s empirical research was “[…] to capture the subjective perception and rating of the

12 Empirical considerations
local quality of life of the region of Ingolstadt from the viewpoint of the highly skilled.”8 (Jochmann,
2010, p. 91) Especially because it explicitly deals with the target group of the highly skilled, Jochmann’s
survey is a capable point of contact for the identification of proper dimensions because the “[…]
identification of the factors for local quality of life, which - from the highly skilled's point of view - have
influence on the overall satisfaction with the quality of life at the location.“ 9 Jochmann (2010, p. 91)
circumscribes the factors10
To identify the factors, Jochmann uses the importance grid method dividing them into four groups: basic
factors, performance factors that are important, performance factors that are unimportant and
excitement factors. To fulfill the expectations the highly skilled have considering the site-related quality
of life, first of all the basic factors must be ensured to enhance the important performance factors in a
further step. Only if both of these factors are on a perceived high level, the excitement factors can make
an actual difference between one location and another (Jochmann, 2010, p. 103). For choosing proper
dimension, I focus on the basic factors since those are the minimum requirements when highly skilled
make location decisions. Basic factors were carved out for all three of soft person-related locational
factors I focus my research on: housing, environment and recreation. For those basic dimensions (or
factors in terms of Jochmann), indicators will have to be built. Also, it must be checked whether those
indicators can be measured with the existing data set.
that are relevant for each constructed locational factor.
Some of the dimensions where easy to indicate since the dimension itself described a proper indicator.
For example it seems likely to measure the availability of parking space by using data about the actual
number of parking lots. Other indicators required an extensive literature review instead. All revealed
indicators were then checked on their measurement feasibility. Even though several sources where
included to find proper data to measure each indicator, qualified data could not be found for all of
them. This circumstance led to the perception that not all basic dimensions could be indicated.
Furthermore, it should be noted that Jochmann uses a different classification of factors. Unlike Grabow
et al. she builds a more sophisticated classification of person-related locational factors that could
influence the location decision. Additional factors she uses are: shopping and gastronomy, labor market,
social settings, range of services offered, public health sector, safety, traffic and mobility. Each of these
factors has its own dimension including a variety of further basic and important performance factors. To
achieve a preferably wide range of dimension, I chose to expand the locational factors in the table
above by adding a few of the addition dimensions carved out by Jochmann. The conditions therefore
were, first of all, that they fit with regards to the content and ,secondly, that – like I explained above for
the prior dimension – indicators could be build upon them and measured with the existing data set.
8 Translated by the author: „[…] die subjektive Wahrnehmung und Beurteilung der standörtlichen Lebensqualität der Region
Ingolstadt aus der Perspektive Hochqualifizierter zu erfassen.“ 9 Translated by the author: „[…] Identifizierung derjenigen Faktoren standörtlicher Lebensqualität, die aus der Sicht der
Hochqualifizierten Einfluss auf die Gesamtzufriedenheit mit der Lebensqualität des Standortes haben […]” 10 The term “factor“ as used by Jochman and within the importance grid is not equatable to the term “factor” used within this
thesis but can be seen as what I refer to as a “dimension”.

13 Empirical considerations
The result of cutting of dimension due to lack of feasibility in a first step and add some new relevant
dimension in the second step led to the following table of dimension, which I will finally base the
evaluation of the research question on:
Table 2: Final choice of dimensions to be examined for each locational factor
locational factor dimension
housing and living environment
attractive offer of living space
cost-performance ratio
availability of parking space
recreational value access to water-based activities
environment green areas and parks
cleanness
Source: Compiled by the author
To answer my actual research question “How did the soft person-related locational factors in Münster
develop during the last years in order to be attractive for the highly skilled?” it must now be evaluated,
how each of the dimensions developed within the recent years. Therefore, indicators showing the
development have to be build and examined on their progression. With reference to the considerations
about dimension priority prior to this, the basic assumption is that each of the dimensions should have
been changed for the better or at least should have stayed the same in order to ensure a positive trend
in attracting the highly skilled. In the following, I will go into detail of each dimension regarding the
indicators and their measurement as well as the analysis of the outcome.
3.2. Analysis of the soft person-related locational factors
3.2.1. Locational factor: housing and living environment
Housing and living environment has been identified by Grabow et al. as the most important person-
related soft locational factor - but also the factor with the lowest satisfaction. Also they account housing
as a pull-factor rather than a push-factor. This means that a poor housing situation would not
necessarily lead individuals to migrate out of a certain area, but can be of high significance within
considerations to relocate and immigrate into another area if the expected housing situation is better
than the individual’s current (Grabow et al., 1995, p.227ff). The factor itself correlates with other factors
like environmental quality and recreational value; in Grabow et al.’s survey for example people tend to
be more satisfied with their housing situation in smaller cities and rural areas. Also, people in East-
Germany are less satisfied compared to those in West-Germany. Münster as a large city in West of
Germany might lie somewhere in between. Since I do not aim to measure the actual satisfaction of
Münster’s population I will only examine how certain dimension that influence the satisfaction have
developed within the last years.

14 Empirical considerations
3.2.1.1. Dimension: attractive offer of living space
To measure the evolvement of this dimension, it has to be defined what an “attractive offer of living
space” actually is. “Living space” is seen as all habitable surfaces within residential and also non-
residential buildings. The “Landesdatenbank NRW” (statistical database for North-Rhine Westphalia)
conducts this habitable surface in square meters once a year for each city. Also data about the actual
number of apartments is conducted, which can basically also be seen as an indicator for living space. For
my research it is, however, more appropriate to take the surface in square meters as a reference for
“living space”, since the number of apartments does not say anything about the particular size and
possible number of residents. An attractive offer of square meters therefore should be projected to
every single citizen of Münster. Even if “attractive” does not always imply that it has to be “more of
something” in terms of living space, it can be seen as common sense that a higher amount of square
meters per citizen means a better housing situation.
The last concern within this definition now, is what will be seen as a citizen. Official statistics usually just
count those people as citizens who have their first residence registered within the target city. This is in
so far comprehensible as if one would count also non-first registered residents, the total number of
population of a country would be lower than the added up number from each city within a country.
However I will stretch out my considerations also to non-first registered residents. This is due to the
special characteristic of Münster being a city with a significant percentage of collegiate inhabitants
(about 45.000 students) and about a quarter of them do not have a registered first-residence within the
city of Münster11
Figure 1 shows that between 2001 and 2010 the square meter per citizen increased continuously. Based
on the assumption made above, the offer of living space has been enlarged not just in relation to the
increased number of citizens but also in actual size (see second column in table 3). For the dimension
“attractive offer of living space” therefore generally a positive trend can be derived. Due to the high
importance of the factor living, this can be counted as a plus for Münster regarding the attractiveness
for highly skilled workers. The indicator still might be questioned since it only takes the quantitative
viewpoint in account by asking about the size of living space and not the quality. Besides the fact that
in 2010. This is however not due to the fact that they don’t actually live in the city
most time of the year but due to fiscal reasons – because it appeals more worthwhile to keep the first
residence at their parents home. Since this circumstance must be taken into account the living space
must be put in relation to the number of “wohnberechtigte Bevölkerung” (as the annual statistical
report of Münster accumulates citizens from with main and also further residence in Münster). The
indicator for the dimension “attractive offer of living space” thus is the number of square meters per
citizen (referred to as “wohnberechtigte Bevölkerung”). Table 3 shows the data. Data concerning the
living space was extracted from the Landesdatenbank NRW, data about the “wohnberechtigte
Bevölkerung” was extracted from annual statistical report of the city of Münster 2010. The number of
square meters per citizen has been projected out of both data sets.
11 Own projection out of data received from annual statistical report of Münster 2010 and
http://www.wn.de/Muenster/2010/03/Hochschule-Muenster-Zweitwohnsitzsteuer-11.000-Studenten-muessen-sich-entscheiden.

15 Empirical considerations
quality is hard to measure because it depends on the subjective opinion of the individual using the space
Dipl.-Ing in regional planning (University of Dortmund) Andreas Montz showed that the highly skilled
workers in Düsseldorf and Neuss he examined showed an above-average demand for large amounts of
square meters for their apartments. Therefore, the quantitative size itself can be seen as a very
important factor for the attractiveness of living space (see Montz, 2008, p.92ff).
Figure 1
Source: Compiled by the author
Table 3: Living space per citizen
Source: Compiled by the author
37,5 38
38,5 39
39,5 40
40,5 41
41,5 42
sqm/citizen
year living space (in sq.m)
„wohnberechtigte
Bevölkerung“
(number of citizens)
sq.m per citizen
2010 11.854.900 285.180 41,56989
2009 11.714.800 282.718 41,43634
2008 11.617.100 281.050 41,33464
2007 11.504.500 280.199 41,05832
2006 11.367.000 280.023 40,59309
2005 11.257.200 278.925 40,35924
2004 11.164.600 280.201 39,84497
2003 11.054.300 281.285 39,29929
2002 10.956.600 279.489 39,20226
2001 10.890.200 278.740 39,06938

16 Empirical considerations
3.2.1.2. Dimension: cost-performance-ratio
By cost-performance-ration in terms of housing one must see performance as the usage of a square
meter of living space and cost as the rent that must be paid for the usage. As we have seen in the
former dimension the living space is an important part of the factor housing. If the highly skilled prefer
larger apartments it is great if the square meter per citizen rate grows. Still the living space must not just
be available but also citizens must be willing and able to pay for it. According to the LEG Housing Market
Report NRW 2011 for Münster there is barely a vacancy of living space in the city. Only 2.0% of living
space was vacant in 2004 and the percentage has even decreased to 1.7% in 2009 (LEG, 2011, p.34)
whereas in Düsseldorf as a reference within the same time the vacancy has increased from 2.7% in 2004
to 3.0% in 2009 and the vacancy in North Rhine-Westphalia even holds 3,6% (LEG, 2011, p.27).
The vacancy rate could be a proper indicator to measure the cost-performance-ratio, one could assume
that lower vacancy shows a higher affinity of the population to rent apartments and therefore it could
be expected living-space got more affordable. But on the other hand if individuals have to rent because
they need a place to live it might not necessarily mean that they are actually willing to pay that much
but just that they need to pay a certain amount to find proper housing without actually regarding the
cost-performance-ration. The rent index instead can be seen as a more significant indicator since it
mirrors the objectively measurable prices per square meter and doesn’t have any subjective influences.
The rent index indicates the average rent without utilities per square meter and month. Figure 2 shows
the development. It has to be acknowledge that the figures itself can’t be found as 100% precise. Since
the city itself does not conduct the actual rent this is done by different research institutes. Depending
on the exact way of measurement the figures differ. The data used for the compilation in figure 2 is
drawn from the research institute BulwienGesa AG and used by the Wirtschaftsförderung Münster
GmbH (Wirtschaftsförderung Münster GmbH, 2012). Other institutes are for example the Inwis research
institute which conducted a study for the Verband der Wohnungs- und Immobilienwirtschaft (VdW). The
actual figures of the average rent differ between both studys. For example the average rent for newly
build apartments in 2010 according to Inwis is at 7,85€ per square meter (Kalitschke, 2012) whereas
BulwienGesa AG numbers it at 8,5€ per square meter (Wirtschaftsförderung Münster GmbH, 2012).
Nevertheless both surveys show the same trend, namely that the average rent significantly increased
within the last decade. Translated into the cost-performance-ratio that means for the same
performance (rent of a square meter per month) a higher price has to be paid. The cost-performance-
ratio therefore deteriorated. This development also takes effect for Münster’s position on the North
Rhine-Westphalian housing market: “In the statewide comparison Münster therewith for the first time
lies on the third place behind the cities of Cologne […] and Düsseldorf […],whereas before the city of
Bonn was on third place.” (Kalitschke, 2012) 12
12 Translated by the author: “ Im landesweiten Vergleich liegt Münster damit erstmalig hinter Köln […] und Düsseldorf […] auf Platz
drei, auf dem sich bislang Bonn befunden hatte.“

17 Empirical considerations
Figure 2
Source: Compiled by the author
3.2.1.3. Dimension: Availability of parking space
Out of all examined dimensions within this thesis, the dimension “availability of parking space” is the
one for which finding an adequate indicator is comparatively “easy”. This is due to the fact that it is
commonly comprehendible that the availability of parking space can be measured by the number of
public parking lots within the city. Additionally the number must also be put in relation to the number of
passenger cars. With regard to the feasibility passenger cars in this case are all passenger cars licensed
for the city of Münster (license plate beginning with “MS”). Even if the numbers for both – passenger
cars and parking lots – are available for the last decade (and longer ago) only the data since 2007 can be
used. This is due to a change in the way passenger cars are counted (until 2006 also cars that have be
partially shut down were counted which accounting for about 12% of the number of passenger cars as a
whole). Table 4 and figure 3 show the development between 2007 and 2010. The data shows that the
available parking space does not show a consistent trend but between 2007 and 2010 it the overall
availability of parking space has slightly bettered. But even in 2010 still 19 cars would have to share one
parking lot in theory. Of course this number doesn’t take in account that there are also passenger cars
not licensed within Münster that occupy the parking lots if for example people living in other regions
visit Münster for recreational purpose.
Table 4: Passenger car per parking lot
year number of passenger cars number of parking
lots passenger car per parking lot
2007 142931 7501 19,05492601
2008 143225 7452 19,21967257
2009 145204 7933 18,30379428
2010 147962 7785 19,00603725
Source: Compiled by the author
6,6 6,8
7 7,2 7,4 7,6 7,8
8
2001 2002 2003 2004 2005 2006 2007 2008 2009 2010
Ø rent without utilities in €

18 Empirical considerations
Figure 3
Source: Compiled by the author
According to Montz (2008) the highly skilled living in Düsseldorf and Neuss spend most of their spare
time within the city they live in instead of visiting other cities to use the recreational facilities (see
Montz, 2008, p.96ff). Assumably this applies also for the highly skilled within Münster. The recreational
facilities within Münster are more important than those out of town and consequently also the
possibility to reach these facilities is important. The availability of parking space plays an important role
within this consideration. Nevertheless also in this case the special characteristics of Münster must be
taken into account.
According to the citizen’s survey from 2006 (Stadt Münster, 2007a, p. 13) the number of roadworthy
bicycles doubles the number of citizens. Only 1% of households do not own a bicycle. Münster is
therefore not for nothing seen as the main capital for bicyclist. According to ADFC in 2007 36,3% of the
population uses the passenger car as main transportation means whereas 37,6% take their bikes. In
comparison to 2001 (40,5% using passenger cars and 35,2% using bicycles) the bicycles gained more
importance (ADFC, 2010). Bearing this fact in mind one must take a slightly differentiated point of view
on the development of parking space and the fact that it hasn’t gone worse but rather stayed the same.
3.2.2. Locational factor: recreational value
3.2.2.1. Dimension: Access to water based activities
Recreational value according to Grabow et al. (1995) is not the most important soft person-related
locational factor still since it correlates with factor housing (see chapter 3.2.1.1.). In Jochmann’s survey
however also one dimension accounted to this factor has been rated as a basic factor and must
therefore be given to ensure the satisfaction of the highly skilled with the region of living. This
dimension regards the accessibility to water based activities. To measure this dimension it must be clear
what a water based activity actually is. No common definition for this could be found but due to
common sense one could account every activity that either is done in, on or near an expanse of water to
its definition. Most of these activities are sportive nature like swimming, canoeing, sailing, water polo
and so on. Some have a more cultural background like trick fountains or special events held near the
17,5
18
18,5
19
19,5
2007 2008 2009 2010
passenger car/parking lot

19 Empirical considerations
water (in Münster for example the “AaSeerenaden”, a number of concerts played before the coulisse of
the Aasee, started for the second time in July 2012). In fact Münster has some expanse of water to offer.
First of all the lake “Aasee” which is Münster’s biggest stretch of water located right in the city center. It
includes 39.5 ha of water expanse and a capacity of 790.000m³. People use the Aasee to sail, riding the
paddleboat or take a walk around the waterside, due to the water quality swimming is not aloud. For
this purpose people rather use the Dortmund-Ems-Channel that crosses Münster for several kilometers
on its course. Both of these water expanses could be a proper starting points to measure the
accessibility of water based activities, however, since the local authorities neither have an influence on
the course of the Dortmund-Ems-Channel nor the size or accessibility of the Aasee considering both of
them won’t be eligible to measure the dimension regarding the political extent of the research question.
The only place for executing water based activities that is influenced mainly by the local authorities are
the urban baths. Local authorities have multiple ways to influence the access to water based activities in
public baths. They can either shape them in size or open new public baths to give actually more bathing
space or they can change the opening hours of existing baths to better the accessibility. Since expanding
or building a new bath is rather a long-term attempt I will take a look on the opening hours of Münster’s
public baths because this is a most appropriate way for local authorities to influence the accessibility
with the proper input of time and money. Figure 4 shows the development between 2009 and 2011.
According to the data derived from the annual financial statement of the local authorities of Münster
the eight public baths (two of them outdoor and six indoor) opened about 6200 hours longer in 2011
than in 2009, which is about 2 hours more per bath per day. This can be seen as a very positive trend.
Obviously the local authorities saw a potential lying within the access to public baths and took an
appropriate step to enhance it. The basic factor “access to water based activities” therefore emerged in
a positive way giving the city a good basis to satisfy the needs of the highly skilled in regard of
recreational value.
Figure 4
Source: Compiled by the author
2009 2010 2011 accumulated opening
hours 20.871 24.643 27.042
0 5.000
10.000 15.000 20.000 25.000 30.000

20 Empirical considerations
3.2.3. Locational factor: environmental quality
3.2.3.1. Dimension: green areas and parks
Nearly three-fourths (72,3%) of the questioned people in Grabow et al.’s survey found a liveable
environment very or rather important. Whereas most of the dimensions (for example air quality)
accounted to this soft-person-related locational factor can only be captured passively by the citizens the
existence of public green areas can be actively consumed. Especially in urban surroundings public parks
build a key factor for experiencing nature’s amenities right outside the door. The German Coucil of
Economic Experts (2010) asserted that: “[…] good environmental conditions are a prerequisite for
recreation purposes. Access to natural space as parks, woods or lakes can enhance the variety of
potential leisure-time pursuits and is thus one driver of quality of life.” (German Council of Economic
Experts, 2010, p.90) As already mentioned in the previous chapter Montz (2008) found that people
rather stay within their city to use recreational facilities. By investing in public parks local authorities can
visibly better the environmental quality and even make it visible to the citizens. The indicator to
evaluate the development of this dimension must therefore include the number of citizens itself to
show how many expanse of green areas is actually available for each citizen. The expanse can be found
within the statistical reports of the Landesdatenbank NRW it does neither include forest areas nor
camping facilities. For the number of citizen I will again refer to the number of “wohnberechtigte
Bevölkerung” for the same reason as explained earlier (see 3.2.1.1.). Table 5 and figure 5 show the
outcome measuring the number of citizens that have to share one hectar of public parks. The
development here shows a very positive trend with special positive steps between 2003 and 2004 as
well as between 2007 and 2008. In 2010 the number of citizens sharing a hectar decreased to 344
meaning that in theory about 170 fewer people have to share a hectare of green areas compared to
2001.
Table 5: Citizen per ha of public parks
year public parks in ha "wohnberechtigte Bevölkerung" citizen per ha of public parks
2010 828,2 285.180 344,3371166
2009 800,96 282.718 352,9739313
2008 727,97 281.050 386,0736019
2007 660,52 280.199 424,2097136
2006 648,9 280.023 431,5349052
2005 647,64 278.925 430,679081
2004 634,34 280.201 441,7205284
2003 583,11 281.285 482,3875427
2002 550,29 279.489 507,8940195
2001 542,71 278.740 513,6076358
Source: Compiled by the author

21 Empirical considerations
Figure 5
Source: Compiled by the author
3.2.3.2. Dimension: cleanness
The measurement of cleanness first of all needs some consideration about what cleanness should
actually be measured. One could think of the cleanness of the streets which could probably be
measured by the amount of waste recycled by the local authorities. But that would actually only give a
hint about how the working performance of the garbage disposal and not how clean the streets actually
are. Air pollution instead is a commonly used point of reference to measure a clean environment.
Furthermore early researches declare air quality is seen as a disturbance for life quality and thus for the
reputation of a region (Bullinger & Hasford, 1992, p. 79). Air quality can be measured using several
indicators of pollution like the amount of CO2, SO2 or NOx. For my evaluation however I choose to put
the focus on PM10 as an indicator for the cleanness of air (and therefore the environment). The reason
for choosing this particular indicator lies within the joint report published by The German council of
Economic Experts in 2010 “Monitoring economic performance, quality of life and sustainability” saying
that:
“General environmental conditions indicators of quality of life are rare, with the
notable exemption of air quality. Given our focus on output measures and the lack of
existing composite indicators, we select the “urban population exposure to air
pollution by particulate matter” of diameter less than 10 micrometers (PM10) as the
headline indicator. PM10 can be carried deep into the lungs where they can cause
inflammation and a worsening of the condition of people with heart and lung
diseases.”
(The German Coucil of Economic Experts, 2010, p.75f)
The Landesamt für Natur, Umwelt und Verbraucherschutz NRW monitors the development of PM10.
The indicator shows the annual average of PM10-pollution within the urban neighborhood. It is only
taken at measurement stations with no direct influence of emissions from cars or industries. It is
therefore of good use to show the average exposition of the citizens. The critical value set by the
European Union is 40µg/m3 (Landesamt für Natur, Umwelt und Verbraucherschutz NRW, 2008a). For
0 100 200 300 400 500 600
2001 2002 2003 2004 2005 2006 2007 2008 2009 2010
citizen per ha of public parks

22 Empirical considerations
the chosen period of observations this results in the measured value illustrated in figure 6. An overall
improvement of the pollution by particulate matter can be deduced. Also the measured value is far
away from reaching the critical value of 40µg/m3. According to Jochmann (2010) for the highly skilled
cleanness is a basic factor for their satisfaction with the region. A less polluted air can be seen as a major
improvement for the overall cleanness and therefore a positive development of the attractiveness of
the region of Münster for the highly skilled.
Figure 6
Source: Compiled by the author
3.3. Closing soft person-related factor assessment
The prior chapters showed how the single dimension developed within the last decade. Not all of them
were measured during this whole period but since for every indicator more than two measurements
were available a trend for each dimension could be deduced taken into account the point of view of the
highly skilled. The following compilation in table 6 summarizes the findings in order to answer the
research question: “How did the soft person-related locational factors in Münster develop during the
last years in order to be attractive for the highly skilled?”
Table 6: Trends for each examined dimension
Factor dimension dimension trend factor trend
housing and living environment
attractive offer of living space +
o cost-performance-ratio -
availability of parking space o
recreational value access to water based
activities + +
environmental quality green areas and parks +
+ cleanness +
Source: Compiled by the author
Notes: +: positive trend | o: neither positive nor negative trend | – : negative trend
2004 2005 2006 2007 2008 2009 2010 annual average of PM10 (μg/m³) (measurement
station: "Münster-Geist") 23 24 25 23 20 20 21
0 5
10 15 20 25 30
23 Empirical considerations
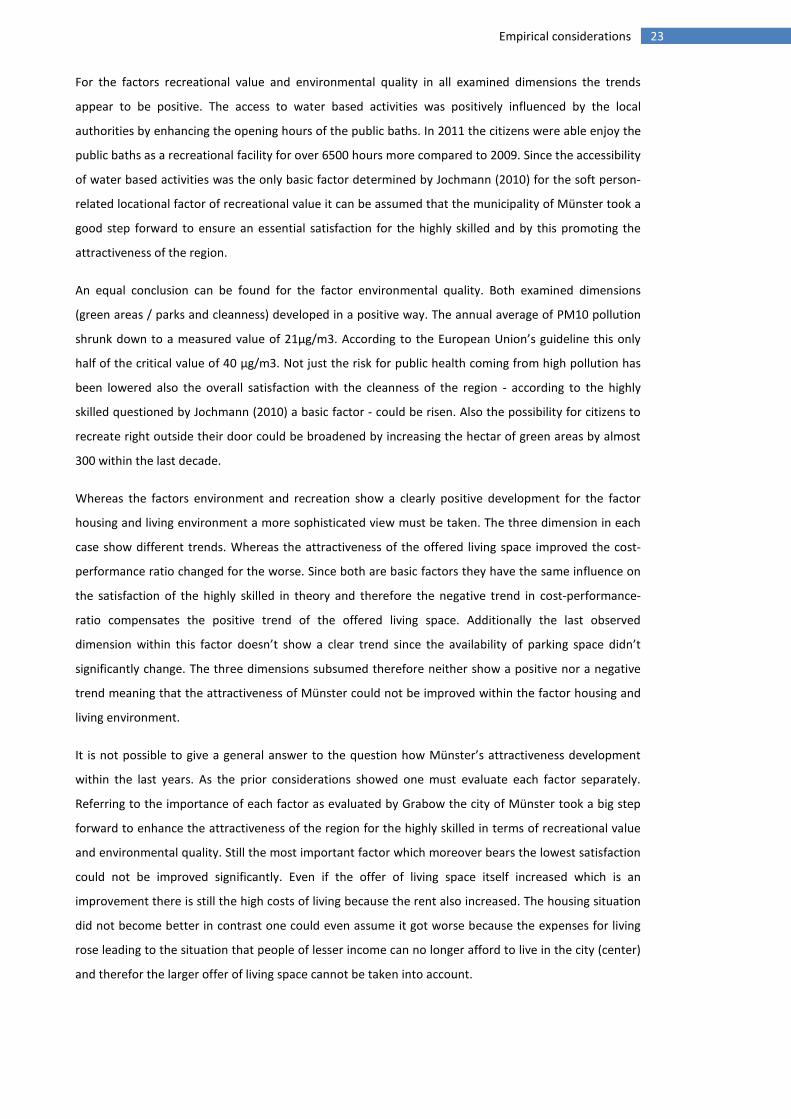
For the factors recreational value and environmental quality in all examined dimensions the trends
appear to be positive. The access to water based activities was positively influenced by the local
authorities by enhancing the opening hours of the public baths. In 2011 the citizens were able enjoy the
public baths as a recreational facility for over 6500 hours more compared to 2009. Since the accessibility
of water based activities was the only basic factor determined by Jochmann (2010) for the soft person-
related locational factor of recreational value it can be assumed that the municipality of Münster took a
good step forward to ensure an essential satisfaction for the highly skilled and by this promoting the
attractiveness of the region.
An equal conclusion can be found for the factor environmental quality. Both examined dimensions
(green areas / parks and cleanness) developed in a positive way. The annual average of PM10 pollution
shrunk down to a measured value of 21µg/m3. According to the European Union’s guideline this only
half of the critical value of 40 µg/m3. Not just the risk for public health coming from high pollution has
been lowered also the overall satisfaction with the cleanness of the region - according to the highly
skilled questioned by Jochmann (2010) a basic factor - could be risen. Also the possibility for citizens to
recreate right outside their door could be broadened by increasing the hectar of green areas by almost
300 within the last decade.
Whereas the factors environment and recreation show a clearly positive development for the factor
housing and living environment a more sophisticated view must be taken. The three dimension in each
case show different trends. Whereas the attractiveness of the offered living space improved the cost-
performance ratio changed for the worse. Since both are basic factors they have the same influence on
the satisfaction of the highly skilled in theory and therefore the negative trend in cost-performance-
ratio compensates the positive trend of the offered living space. Additionally the last observed
dimension within this factor doesn’t show a clear trend since the availability of parking space didn’t
significantly change. The three dimensions subsumed therefore neither show a positive nor a negative
trend meaning that the attractiveness of Münster could not be improved within the factor housing and
living environment.
It is not possible to give a general answer to the question how Münster’s attractiveness development
within the last years. As the prior considerations showed one must evaluate each factor separately.
Referring to the importance of each factor as evaluated by Grabow the city of Münster took a big step
forward to enhance the attractiveness of the region for the highly skilled in terms of recreational value
and environmental quality. Still the most important factor which moreover bears the lowest satisfaction
could not be improved significantly. Even if the offer of living space itself increased which is an
improvement there is still the high costs of living because the rent also increased. The housing situation
did not become better in contrast one could even assume it got worse because the expenses for living
rose leading to the situation that people of lesser income can no longer afford to live in the city (center)
and therefor the larger offer of living space cannot be taken into account.
24 Conclusion
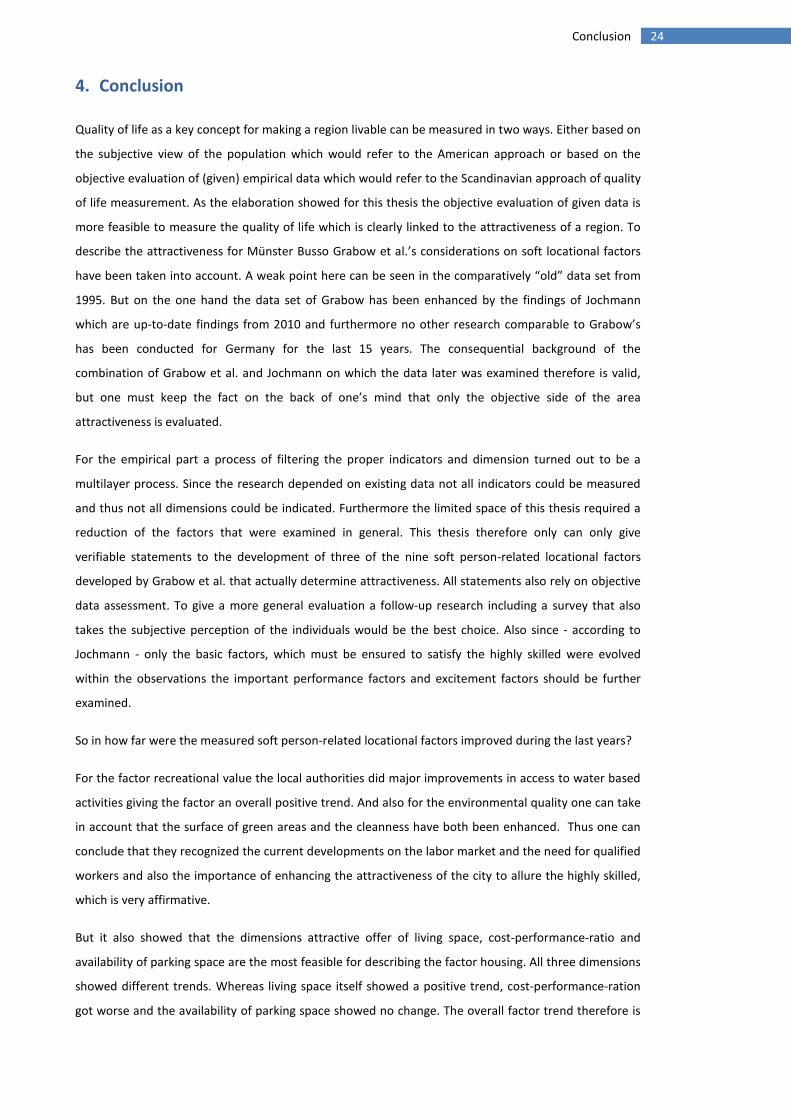
4. Conclusion
Quality of life as a key concept for making a region livable can be measured in two ways. Either based on
the subjective view of the population which would refer to the American approach or based on the
objective evaluation of (given) empirical data which would refer to the Scandinavian approach of quality
of life measurement. As the elaboration showed for this thesis the objective evaluation of given data is
more feasible to measure the quality of life which is clearly linked to the attractiveness of a region. To
describe the attractiveness for Münster Busso Grabow et al.’s considerations on soft locational factors
have been taken into account. A weak point here can be seen in the comparatively “old” data set from
1995. But on the one hand the data set of Grabow has been enhanced by the findings of Jochmann
which are up-to-date findings from 2010 and furthermore no other research comparable to Grabow’s
has been conducted for Germany for the last 15 years. The consequential background of the
combination of Grabow et al. and Jochmann on which the data later was examined therefore is valid,
but one must keep the fact on the back of one’s mind that only the objective side of the area
attractiveness is evaluated.
For the empirical part a process of filtering the proper indicators and dimension turned out to be a
multilayer process. Since the research depended on existing data not all indicators could be measured
and thus not all dimensions could be indicated. Furthermore the limited space of this thesis required a
reduction of the factors that were examined in general. This thesis therefore only can only give
verifiable statements to the development of three of the nine soft person-related locational factors
developed by Grabow et al. that actually determine attractiveness. All statements also rely on objective
data assessment. To give a more general evaluation a follow-up research including a survey that also
takes the subjective perception of the individuals would be the best choice. Also since - according to
Jochmann - only the basic factors, which must be ensured to satisfy the highly skilled were evolved
within the observations the important performance factors and excitement factors should be further
examined.
So in how far were the measured soft person-related locational factors improved during the last years?
For the factor recreational value the local authorities did major improvements in access to water based
activities giving the factor an overall positive trend. And also for the environmental quality one can take
in account that the surface of green areas and the cleanness have both been enhanced. Thus one can
conclude that they recognized the current developments on the labor market and the need for qualified
workers and also the importance of enhancing the attractiveness of the city to allure the highly skilled,
which is very affirmative.
But it also showed that the dimensions attractive offer of living space, cost-performance-ratio and
availability of parking space are the most feasible for describing the factor housing. All three dimensions
showed different trends. Whereas living space itself showed a positive trend, cost-performance-ration
got worse and the availability of parking space showed no change. The overall factor trend therefore is
25 Conclusion
neither positive nor negative. But if the rating concerning the satisfaction and importance of the single
factors Grabow elaborated is taken into account, one must conclude that the local authorities were not
able to improve the factor housing although it is according to Grabow et al. the soft person-related
factor with the lowest satisfaction and the highest importance.
In my personal view the housing situation plays such an important key role that the development of the
attractiveness according to the examined soft person-related factors could not be seen as positive until
cost-performance-ration could be lowered. As mentioned earlier regional growth could only be fostered
if people support regional companies with their knowledge to drive economic success. This leads to an
overall regional growth. If people can’t afford to rent an apartment they would rather choose a to
accept a job offer in another city with a better housing situation no matter how positive recreational
value or the environment is, because housing is the most important factor according to Grabow. Thus if
the cost-performance-ratio can be lowered a major step forward would be achieved and an overall
positive result could be drawn. In the future therefore the local authorities should sharply focus on the
improvement of the housing situation especially in terms of cost-performance-ratio.
The LivCom-Award has been awarded to the city of Münster in 2004 thitherto and also within the last
years the local authorities took significant investments in the fields, which – by several scholars like
Jochmann and Montz – where found to be crucial in attracting the highly skilled. Yet not all soft person-
related factors could be significantly bettered. If this challenge is faced and carried out in a positive way
within the near future the city is on a proper way not just to become but also to stay attractive for the
highly skilled. These investments will eventually foster the economic growth and the welfare within and
thus, make it competitive not just within Germany but also within the European Union in order to
ensure the availability for highly skilled within the region.

26 References
5. References
ADFC. (2010). Eine Stadt fährt Rad. Abgerufen am 8. Juli 2012 von ADFC Kreisverband
Münster/Münsterland e. V.: http://www.adfc-nrw.de/kreisverbaende/kv-
muenster/radverkehr/fahrradhauptstadt-muenster.html
Amiani, S. I., Schwamb, N., & Hammer, V. (2011). Studentische Lebensqualität und Lebensstile: Wohnen,
Mobilität, Soziales, Freizeit und Berufschancen. Wiesbaden: VS Verlag.
Atteslander, P. (2010). Methoden der empirischen Sozialforschung (11 Ausg.). Berlin: Erich Schmidt
Verlag.
Baumeister, K. (10. März 2010). Zweitwohnsitzsteuer: 11.000 Studenten müssen sich entscheiden.
Abgerufen am 8. Juli 2012 von Westfälische Nachrichten:
http://www.wn.de/Muenster/2010/03/Hochschule-Muenster-Zweitwohnsitzsteuer-11.000-
Studenten-muessen-sich-entscheiden
Bezirksregierung Münster. (2010). Der Regierungsbezirk Münster. Abgerufen am 8. Juli 2012 von
http://www.bezreg-muenster.nrw.de/startseite/Behoerde/die_bezirksregierung/index.html
Böltken, F., Bucher, H., & Janich, H. (1997). Wanderungsverpflechtung und Hintergründe räumlicher
Mobilität in der Bundesrepublik seit 1990. Informationen zur Raumentwicklung(1/2), S. 35-50.
Büchel, F., Frick, J., & Witte, J. C. (2002). Regionale und berufliche Mobilität von Hochqualifizierten - Ein
Vergleich Deutschland - USA. In L. Bellmann, & J. Velling, Beiträge zur Arbeitsmarkt- und
Berufsforschung:Arbeitsmärkte für Hochqualifizierte (S. 207-244). Nürnberg: Bundesagentur für
Arbeit.
Bullinger, M., & Hasford, J. (1992). Umweltbedingung und menschliche Lebensqualität:
Belastungsfaktoren, Wirkungen, Einflußmöglichkeiten. In G. Seifert, Lebensqualität in unserer
Zeit. Modebegriff oder neues Denken? (S. 73-87). Göttingen: Vandenhoeck & Ruprecht.
Cernavin, O., & Thießen, F. (2003). Von der Industrie- zur Wissensökonomie: Arbeit und
Arbeitsorganisation im Zeitalter der Wissensgesellschaft. In F. Thießen, & M. Moldaschl, Neue
Ökonomie der Arbeit (S. 175-198). Marburg: Metropolis-Verlag.
Clark, T. N., Lloyd, R., Wong, K. K., & Jain, P. (2002). Amenities drive urban growth. Journal of urban
affairs, 24(4), S. 493-515.
Deutscher Bundestag. (2002). Schlussbericht der Enquête-Kommission „Demographischer Wandel –
Herausforderungen unserer älter werdenden Gesellschaft an den Einzelnen und die Politik“.
Abgerufen am 13. Juli 2012 von http://dipbt.bundestag.de/dip21/btd/14/088/1408800.pdf
Eurofond. (February 2010). Quality of life. Abgerufen am 30. Juli 2012 von
http://www.eurofound.europa.eu/areas/qualityoflife/index.htm

27 References
Florida, R. (2002). The Rise of the Creative Class and how it‘s transforming work, leisure, community and
everyday life. New York: Basic Books.
Fürst, D., & Löb, S. (2005). Kulturlandschaften – wachsende Bedeutung für regionalpolitische Strategien?
In F. Thießen, O. Cernavin, M. Führ, & M. Kaltenbach, Weiche Standortfaktoren. Erfolgsfaktoren
regionaler Wirtschaftsentwicklung. Interdisziplinäre Beiträge zur regionalen
Wirtschaftsforschung (S. 53-72). Berlin: Duncker & Humblot.
Glatzer, W. (1992). Lebensqualität aus sozio-ökonomischer Sicht. In G. Seifert, Lebensqualität in unserer
Zeit. Modebegriff oder neues Denken? (S. 47-59). Göttingen: Vandenhoek & Ruprecht.
Götze, U. (2003). Der Faktor Arbeit in der industriellen Standorttheorie. In M. Moldaschl, & F. Thießen,
Neue Ökonomie der Arbeit (S. 27-49). Marburg: Metropolis-Verlag.
Grabow, B. (2005). Weiche Standortfaktoren in Theorie und Empirie – ein Überblick. In F. Thießen, O.
Cernavin, M. Führ, & M. Kaltenbach, Weiche Standortfaktoren. Erfolgsfaktoren regionaler
Wirtschaftsentwicklung. Interdisziplinäre Beiträge zur regionalen Wirtschaftsforschung (S. 37-
52). Berlin: Duncker & Humblot.
Grabow, B., Henckel, D., & Hollbach-Gröming, B. (1995). Weiche Standortfaktoren. Stuttgart:
Kohlhammer.
Haisch, T., & Klöpper, C. (2007). Akademisch Gebildete versus beruflich Kreative: eine Analyse der
Wohnstandortwahl Hochqualifizierter in der Region Basel. Geographica Helvetica, 62(2).
Hill, H. (2002). Indikator Lebensqualität: Internationale Recherche zur kommunalen Steuerung.
Gütersloh: Bertelsmann Stiftung.
IHK Nord-Westfalen. (Mai 2012). Zahlen und Fakten zur Wirtschaft. Abgerufen am 8. Juli 2012 von IHK
Nord-Westfalen: http://www.ihk-
nordwestfalen.de/fileadmin/medien/01_Mittelstand/03_Wirtschaftsregion/Statistik/Zahlen_Fa
kten_2012_05_online.pdf
Information und Technik Nordrhein-Westfalen. (2012). Bevölkerung im Regierungsbezirk Münster.
Abgerufen am 8. Juli 2012 von Information und Technik Nordrhein-Westfalen:
http://www.it.nrw.de/statistik/a/daten/amtlichebevoelkerungszahlen/rb5_juni2011.html
Jochmann, J. (2010). Standortfaktor Lebensqualität: Die subjektive Wahrnehmung Hochqualifizierter in
der Region Ingolstadt. In H. Pechlander, & M. Bachinger, Lebensqualität und
Standortattraktivität: Kultur, Mobilität und regionale Marken als Erfolgsfaktoren (S. 89-116).
Berlin: Erich Schmidt Verlag.
Kalitschke, M. (13. Oktober 2012). Mietpreise: Münster überholt Bonn. Abgerufen am 8. Juli 2012 von
Westfälische Nachrichten: http://www.wn.de/Muenster/2010/10/Nachrichten-Muenster-
Mietpreise-Muenster-ueberholt-Bonn

28 References
Korczak, D. (1995). Lebensqualität-Atlas: Umwelt, Kultur, Wohlstand, Versorgung, Sicherheit und
Gesundheit in Deutschland. Opladen: Westdeutscher Verlag.
Kromrey, H. (2009). Empirische Sozialforschung (11 Ausg.). Stuttgart: Lucius & Lucius.
Lambiri, S., Biagi, B., & Royuela, V. (2007). Quality of life in the economic and urban economic literature.
Social Indicators Research, 84, S. 1-25.
Landesamt für Natur, Umwelt und Verbraucherschutz NRW. (6. April 2005). EU-Jahreskenngrößen 2004.
Abgerufen am 8. Juli 2012 von
http://www.lanuv.nrw.de/luft/immissionen/ber_trend/eu_kenn_2004.pdf
Landesamt für Natur, Umwelt und Verbraucherschutz NRW. (9. Mai 2006). EU-Jahreskenngrößen 2005.
Abgerufen am 8. Juli 2012 von
http://www.lanuv.nrw.de/luft/immissionen/ber_trend/eu_kenn_2005.pdf
Landesamt für Natur, Umwelt und Verbraucherschutz NRW. (2007). EU-Jahreskenngrößen 2006.
Abgerufen am 8. Juli 2012 von http://www.lanuv.nrw.de/luft/immissionen/ber_trend/EU-
Kenngr2007-E2.pdf
Landesamt für Natur, Umwelt und Verbraucherschutz NRW. (25. April 2008). EU-Jahreskenngrößen
2007. Abgerufen am 7. Juli 2012 von
http://www.lanuv.nrw.de/luft/immissionen/ber_trend/EU-Kenngr2007-E2.pdf
Landesamt für Natur, Umwelt und Verbraucherschutz NRW. (2008a). Feinstaubkonzentration im
städtischen Hintergrund. Abgerufen am 8. Juli 2012 von
http://www.lanuv.nrw.de/umweltindikatoren-nrw/index.php?
indikator=3&mode=indi&aufzu=1
Landesamt für Natur, Umwelt und Verbraucherschutz NRW. (2. April 2009). EU-Jahreskenngrößen 2008.
Abgerufen am 8. Juli 2012 von http://www.lanuv.nrw.de/luft/immissionen/ber_trend/EU-
Kenngr-2008_F-komplett.pdf
Landesamt für Natur, Umwelt und Verbraucherschutz NRW. (12. Oktober 2010). EU-Jahreskenngrößen
2009. Abgerufen am 8. Juli 2012 von
http://www.lanuv.nrw.de/luft/immissionen/ber_trend/EU-Kenngr%C3%B6%C3%9Fen-2009-
E.pdf
Landesamt für Natur, Umwelt und Verbraucherschutz NRW. (1. März 2011). EU-Jahreskenngrößen 2010.
Abgerufen am 8. Juli 2012 von http://www.lanuv.nrw.de/luft/immissionen/ber_trend/EU-
Kenngroessen_2010_C.pdf
Landesamt für Natur, Umwelt und Verbraucherschutz NRW. (7. Mai 2012). EU-Jahreskenngrößen 2011.
Abgerufen am 8. Juli 2012 von http://www.lanuv.nrw.de/luft/immissionen/ber_trend/EU-
Kenngroessen_2011-V-2012-05-07.pdf
29 References
LEG NRW GmbH. (2011). LEG Wohnungsmarktreport NRW 2011. Abgerufen am 8. Juli 2012 von
http://www.leg-nrw.de/unternehmen/presse/leg-wohnungsmarktreport-nrw-2011/
(1999). Lokale und regionale Standortpolitik – Konzepte und Instrumente jenseits von Industriepolitik und
traditioneller Wirtschaftsförderung. INEF. Duisburg: INEF.
Lorenzen, M. (3. Juli 2012). Konzerte vor der Aasee-Kulisse in Münster. Abgerufen am 8. Juli 2012 von
Westfälische Nachrichten: http://www.wn.de/Freizeit/Aaseerenaden-Konzerte-vor-der-Aasee-
Kulisse-in-Muenster
Matzler, K., & Sauerwein, E. (2002). The factor structure of customer satisfaction: An empirical test of
the importance grid and the penalty-reward-contrast analysis. International Journal of Service,
13(4).
Mittmann, J., & Zühlke, W. (1982). Regionale Mobilität in Nordrhein-Westfalen. Dortmund: ILS.
Mohr, H. (2002). Räumliche Mobilität von Hochschulabsolventen. In L. Bellmann, & J. Velling, Beiträge
zur Arbeitsmarkt- und Berufsforschung:Arbeitsmärkte für Hochqualifizierte (S. 249-278).
Nürnberg: Bundesagentur für Arbeit.
Montz, A. (2008). Weiche Standortfaktoren aus Arbeitnehmersicht: Die Wahl des Wohnortes
qualifizierter Fachkräfte. Saarbrücken: VDM Verlag.
Niebuhr, A., & Stiller, S. (2004). Zur Bedeutung von Standortfaktoren: Was macht einen Standort
attraktiv für qualifizierte Arbeitskräfte und Kapital? In E. Hönekopp, R. Jungnickel, & T.
Straubhaar, Beiträge zur Arbeitsmarkt- und Berufsforschung: Internationalisierung der
Arbeitsmärkte (Bd. 282, S. 233-257). Nürnberg: Bundesagentur für Arbeit.
Noll, H.-H. (1989). Indikatoren des subjektiven Wohlbefindens: Instrumente für die gesellschaftliche
Dauerbeobachtung und Sozialberichterstattung? ZUMA-Nachrichten, 24, S. 26-41.
Noll, H.-H. (1999). Konzepte der Wohlfahrtsentwicklung: Lebensqualität und "neue" Wohlfahrtskonzepte.
EuReporting, Working Paper No. 3.
Opp, K.-D. (2005). Methodologie der Sozialwissenschaften: Einführung in die Probleme ihrer
Theoriebildung und praktische Anwendung (6 Ausg.). Opladen/Wiesbaden: VS Verlag für
Sozialwissenschaften.
Sauer, P. (6. März 2012). In Münster fehlt Wohnraum. Abgerufen am 8. Juli 2012 von Westfälische
Nachrichten: http://www.wn.de/Muenster/2012/03/Diskussion-ueber-aktuelle-und-kuenftige-
Konzepte-In-Muenster-fehlt-Wohnraum
Stadt Münster. (2003). Jahres-Statistik 2001/2002. Abgerufen am 8. Juli 2012 von
http://www.muenster.de/stadt/stadtplanung/pdf/JS2001-2002.pdf

30 References
Stadt Münster. (2004). Jahres-Statistik 2003. Abgerufen am 8. Juli 2012 von
http://www.muenster.de/stadt/stadtplanung/pdf/Jahres-Statistik-2003.pdf
Stadt Münster. (2005). Jahres-Statistik 2004. Abgerufen am 8. Juli 2012 von
http://www.muenster.de/stadt/stadtplanung/pdf/Jahres-Statistik-2004_2.pdf
Stadt Münster. (2006). Jahres-Statistik 2005. Abgerufen am 8. Juli 2012 von
http://www.muenster.de/stadt/stadtentwicklung/pdf/Jahres-Statistik-2005.pdf
Stadt Münster. (2007). Beiträge zur Statistik Nr. 100: Bürgerumfrage 2006. Abgerufen am 8. Juli 2012
von http://www.muenster.de/stadt/stadtplanung/pdf/Beitraege_zur_Statistik_Nr_100.pdf
Stadt Münster. (2007). Jahres-Statistik 2006. Abgerufen am 8. Juli 2012 von
http://www.muenster.de/stadt/stadtplanung/pdf/Jahres-Statistik-2006.pdf
Stadt Münster. (2008). Jahres-Statistik 2007. Abgerufen am 8. Juli 2012 von
http://www.muenster.de/stadt/stadtplanung/pdf/Jahres-Statistik-2007.pdf
Stadt Münster. (2009). Jahres-Statistik 2008. Abgerufen am 8. Juli 2012 von
http://www.muenster.de/stadt/stadtplanung/pdf/Jahres-Statistik_2008.pdf
Stadt Münster. (2010). Jahresabschluss 2009 Entwurf Band 2. Abgerufen am 8. Juli 2012 von
http://www.muenster.de/stadt/finanzen/pdf/JA_2009__Band_2_Entwurf_m_Lesez_.pdf
Stadt Münster. (2010). Jahres-Statistik 2009. Abgerufen am 8. Juli 2012 von
http://www.muenster.de/stadt/stadtplanung/pdf/Jahres-Statistik_2009.pdf
Stadt Münster. (2011). Jahresabschluss 2010 Entwurf Band 2. Abgerufen am 8. Juli 2012 von
http://www.muenster.de/stadt/finanzen/pdf/Entwurf_JA_2010_Band_2.pdf
Stadt Münster. (2011). Jahres-Statistik 2010. Abgerufen am 8. Juli 2012 von
http://www.muenster.de/stadt/stadtplanung/pdf/Jahres-Statistik_2010.pdf
Stadt Münster. (2012). Jahresabschluss 2011 Entwurf Band 2. Abgerufen am 8. Juli 2012 von
http://www.muenster.de/stadt/finanzen/pdf/JA_2011_Band__2.pdf
Stolarick, K. (2005). The „Soft“ Factors of Regional Growth: Technology, Talent and Tolerance. In F.
Thießen, O. Cernavin, M. Führ, & M. Kaltenbach, Weiche Standortfaktoren. Erfolgsfaktoren
regionaler Wirtschaftsentwicklung. Interdisziplinäre Beiträge zur regionalen
Wirtschaftsforschung (S. 73-102). Berlin: Duncker & Humblot.
Teltemann, J. (2008). Methodische Anforderungen an quantitative Städte- und Regionenvergleiche.
ForStaR Arbeitspapiere Nr. 3, Universität Bremen, Forschungsinstitut Stadt und Region,
Bremen.

31 References
The German Council of Economic Experts. (2011). Monitoring economic performance, quality of life and
sustainability. Wiesbaden: Statistisches Bundesamt.
Thiel, T. (6. Februar 2012). Bevölkerungsrekord: Münster kratzt an der 300.000-Einwohner-Marke.
Abgerufen am 8. Juli 2012 von Münstersche Zeitung:
http://www.muensterschezeitung.de/lokales/muenster/Muenster-kratzt-an-der-300-000-
Einwohner-Marke;art993,1548793
Wendt, C. (1992). Lebensqualität und gebaute Umgebung. In G. Seifert, Lebensqualität in unserer Zeit.
Modebegriff oder neues Denken? (S. 61-71). Göttingen: Vandenhoeck & Ruprecht.
Weyers, S. (2008). Abgerufen am 08. 07 2012 von http://www.uni-
frankfurt.de/fb/fb04/personen/weyerss/SoSe08_MeS/6Operationalisierung1.pdf
Wirtschaftsförderung Münster GmbH. (7. Februar 2012). Immobilienmarkt Münster: Kauf- und
Mietpreise. Abgerufen am 8. Juli 2012 von Wirtschaftsförderung Münster GmbH:
http://www.wfm-muenster.de/immobilien__grundstuecke/kauf_und_mietpreise/index24.htm