Location and estimated net gambling revenue generated … poker machines report... · Location and...
18
Location and estimated net gambling revenue generated by ALH Group Pty Ltd poker machine venues Report for GetUp! Ltd Charles Livingstone School of Public Health and Preventive Medicine Monash University
-
Upload
hoangquynh -
Category
Documents
-
view
216 -
download
1
Transcript of Location and estimated net gambling revenue generated … poker machines report... · Location and...
Location and estimated net gambling revenue generated by ALH Group Pty Ltd poker machine venues Report for GetUp! Ltd Charles Livingstone School of Public Health and Preventive Medicine Monash University

Contents'
CONTENTS' 2!DISCLAIMER' 3!ACKNOWLEDGEMENTS' 3!INTRODUCTION'AND'SUMMARY' 4!METHODOLOGY' 6!VICTORIA' 7!METHODOLOGY'FOR'VICTORIA' 7!ALH'VICTORIAN'OPERATIONS' 7!SOCIO<ECONOMIC'DISTRIBUTION'OF'ALH'EGM'OPERATIONS'IN'VICTORIA.' 8!NEW'SOUTH'WALES' 9!METHODOLOGY'FOR'NEW'SOUTH'WALES' 9!ALH'NEW'SOUTH'WALES'OPERATIONS' 9!SOCIO<ECONOMIC'DISTRIBUTION'OF'ALH'EGMS'IN'NEW'SOUTH'WALES' 9!QUEENSLAND' 11!METHODOLOGY'FOR'QUEENSLAND' 11!ALH'QUEENSLAND'OPERATIONS' 11!SOCIO<ECONOMIC'DISTRIBUTION'OF'ALH'EGMS'IN'QUEENSLAND' 11!SOUTH'AUSTRALIA' 13!METHODOLOGY'FOR'SOUTH'AUSTRALIA' 13!ALH'SOUTH'AUSTRALIAN'OPERATIONS' 13!SOCIO<ECONOMIC'DISTRIBUTION'OF'ALH'EGMS'IN'SOUTH'AUSTRALIA' 13!OVERALL'SOCIO<ECONOMIC'DISTRIBUTION'OF'ALH'EGMS' 14!APPLICATION'OF'GAMBLING'TAX' 15!REFERENCES' 18!
Disclaimer'This report was prepared in order to support better-informed debate and discussion of issues relevant to the regulation of poker machine gambling in Australia. Although the authors have been careful to incorporate and apply all available data and evidence to the calculation of the NGR estimates in this report, it is not intended to constitute advice or information for investors or potential investors and it should not be relied upon for that or any related purpose.
Acknowledgements'This author of this report is Dr Charles Livingstone of the School of Public Health and Preventive Medicine at Monash University. Significant research assistance was provided by Ms Margaret Brand. However, responsibility for the contents of this report including any errors or omissions rests with the author.
Introduction'and'summary' We were commissioned by GetUp! Ltd to estimate the annual revenues from poker machine operations undertaken by the Woolworth’s Ltd (Woolworth’s) subsidiary ALH Group Pty Ltd (ALH). We were also asked to identify any discernible patterns in the distribution of ALH owned or controlled poker machines and venues. ALH is a joint venture which is majority owned by Woolworth’s with a minority shareholding owned by the Bruce Mathieson Group (ALH 2012). At the time of writing, ALH operated 294 hotel venues across Australia (ALH 2012). Of these, 277 (94.2%) operated poker machines in 2010-11, including 8 club venues in Victoria with which ALH have management agreements. This equates to about 4.9% of Australia’s 5,700 pub and club gambling venues. The total net gambling revenue (NGR) generated by ALH poker machine venues in 2010-11 is estimated at $1,292 million, or 12.4% of total hotel and club poker machine NGR for Australia ($10,450 million). ALH operated a total of 12,650 poker machines, including 549 in Victorian club venues. This amounted to 6.8% of Australia’s 185,514 hotel and club poker machines, or, if hotel-only poker machines are included, 17.4% of the total. These operations generated an average NGR of $102,128 p.a. for all poker machines in ALH venues, or $103,174 p.a. for each poker machine in ALH hotel venues. By comparison, poker machines in Australian hotels and clubs generate an average $56,329 p.a. (note: averages and totals for Australia referred to above are sourced from PC 2010: 6-7, 2.26. They relate to 2008-09). In 2010-11, ALH operated 89 venues in Victoria, with 6,143 poker machines; 52 venues in NSW with 1,289 poker machines; 106 venues in Queensland with 4,228 poker machines, and 30 venues in South Australia with 990 poker machines. Data relevant to ALH’s EGM operations, together with data for all EGMs operated in Victoria, NSW, Queensland and South Australia are summarised at Table 1.

Table 1: EGM numbers, and NGR – ALH and all venues, by type, Vic, NSW, Qld and SA, 2010-11 ! EGMS!N! NGR! NGR/EGM!
State! Hotel! Club! All! Hotel! Club! All! Hotel! Club! All!ALH!EGMs!(N!&!$)!
Vic$ 5,594$ 549$ 6,143$ $792,262,807$ $43,411,056$ $835,673,863$ $141,627$ $79,073$ $136,037$NSW$ 1,289$ $ $ $139,790,889$ $ $139,790,889$ $108,449$ $ $Qld$ 4,228 $ $ $231,656,612$ $ $231,656,612$ $54,791$ $ $SA$ 990$ $ $ $84,800,371$ $ $84,800,371$ $85,657$ $ $TOTAL$ 12,101$ 549$ 12,650$ 1,248,510,679$ $43,411,056$ 1,291,921,735$ $103,174$ $ $102,128$
ALL!EGMS!(N!&!$)$Vic$ 13,512$ 13,266$ 26,778$ $1,760,233,202$ $891,135,183$ $2,651,368,385$ $130,272$ $67,174$ $99,013$NSW$ 23,625$ 70,905$ 94,530$ $1,604,791,728$ $3,389,729,129$ $4,994,520,857$ $67,928$ $47,807$ $52,835$Qld$ 18,792$ 23,370$ 42,162$ $998,978,566$ $869,378,159$ $1,868,356,725$ $53,160$ $37,201$ $44,314$SA$ 11,217$ 1,509$ 12,726$ $672,204,000$ $73,263,000$ $745,467,000$ $59,927$ $48,551$ $58,578$TOTAL$ $ $ $ $ $ $ $ $ $
ALH!EGMs!%!Vic$ 41.4%$ 4.1%$ 22.9%$ 45.0%$ 4.9%$ 31.5%$ 108.7%$ 117.7%$ 137.4%$NSW$ 5.5%$ $ 0.0%$ 8.7%$ $ $ 159.7%$ $ $Qld$ 22.5%$ $ 0.0%$ 23.2%$ $ $ 103.1%$ $ $SA$ 8.8%$ $ 0.0%$ 12.6%$ $ $ 142.9%$ $ $
Sources: VCGLR, NSWOLGR, QOGR, SAOLGC
Methodology* This report presents data related to ALH’s poker machine operations in detail on a state-by-state basis. The methodology utilised to calculate NGR in respect of each state is slightly different because of the differences between the practice of the relevant gambling regulator in each Australian state jurisdiction in relation to the publication of such data. Thus, the specific methodology adopted in the calculation of ALH’s NGR in each state is described in the relevant section of this report. We obtained median total personal income (MTPI) data for each Gazetted Locality (i.e., suburb) in which ALH venues were located, and for each state, and some LGAs from the Australian Bureau of Statistics Census data, specifically Census Basic Community Profiles. The purpose of this was to estimate the pattern of distribution of ALH venues and EGMs relative to a metric for socio-economic disadvantage. At the time of preparing this report, ABS SEIFA indices for 2011 had not been published. We therefore utilised median total personal income (MTPI) as a measure of relative socio-economic disadvantage and advantage, utilising the statewide MTPI as the benchmark of relative disadvantage or advantage. We obtained a list of ALH venues from the ALH website. In the case of Victoria, we also obtained ownership data from the website of the Victorian Commission for Gambling and Liquor Regulation.

Victoria*
Methodology*for*Victoria* In Victoria, NGR for each venue, as well as the number of poker machines operated by venues is reported for individual venues on a monthly basis. NGR data are thus actual amounts as opposed to estimates and are highly reliable. We obtained NGR data together with the number of EGMs operated for each ALH venue for the year 2010-11 from the website of the regulator (the Victorian Commission for Gambling and Liquor Regulation).
ALH*Victorian*operations* ALH reports that it operated or had management arrangements with 93 hotel or club venues in Victoria in August 2012. Of these, 81 were hotel venues operating EGMs, and 8 were club venues operating EGMs. The remainder (4) did not operate EGMs. ALH’s 81 hotel venues operated 5,594 EGMs, and generated NGR of $792,262,807 in 2010-11. This represented an average of $141,627 per EGM. This represented an average NGR/EGM of 108.7% of the average Victorian hotel based EGM (which generated NGR of $130,272 in 2010-11). However, as a proportion of the NGR/EGM for other venues located in the same local government areas as ALH venues, ALH EGMs generated NGR of about 104%.1 ALH also operated management agreements in respect of 8 club venues in Victoria. These venues operated 549 EGMs generating NGR of $43,411,056, and average NGR/EGM of $79,073, or 117.7% of the average NGR/EGM in Victoria in 2010-11. Thus total NGR generated by ALH venues in Victoria in 2010-11 was $835,673,863. This amounted to 31.5% of all EGM NGR in that state in 2010.11. ALH EGMs comprised 41.4% of all hotel EGMs operated in Victoria in 2010-11, and 4.1% of all club EGMs.2
!!!!!!!!!!!!!!!!!!!!!!!!!!!!!!!!!!!!!!!!!!!!!!!!!!!!!!!!1!ALH operates a large and carefully managed chain of EGM venues and appears to have selected venues located in areas where EGM revenue is likely to be maximized. Accordingly, the factor of 1.04 identified in Victoria has been applied to the NGR/EGM reported in local government area level data for other States for the purposes of estimating ALH NGR/EGM in those states (noting that no other Australian jurisdiction currently reports venue level EGM data). This premium in average NGR is almost certainly the consequence of the careful management of ALH venues in relation to EGM gambling operations, via such mechanisms as marketing, EGM game selection and replacement, data scrutiny, and venue design.!2 Under new regulations effective from August 2012, no single operator may control more than 35% of the total number of hotel EGMs in that jurisdiction. See note 4.!
Socio8economic*distribution*of*ALH*EGM*operations*in*Victoria.* Median total personal income (MTPI) for Victoria in 2011 was reported by ABS as $561 per week. In 2010-11, ALH operated 46 hotel venues with 3,230 EGMs, generating NGR of $516,120,405 in Gazetted Localities (i.e., suburbs) with MTPI below this figure – i.e., below the MTPI for Victoria overall. ALH operated 56.8% of its venues, with 57.7% of its EGMs, in these areas, generating 65.1% of hotel NGR from areas of relative disadvantage. It is also of note that 27 of the 31 ALH venues (87.1%) where average NGR/EGM exceeded $150,000 p.a. in 2010-11 were located in areas of comparative disadvantage.
New*South*Wales*
Methodology*for*New*South*Wales* The NSW gambling regulator (the Office of Liquor, Gambling and Racing) provides EGM data at LGA (or, in cases of suburbs with relatively few EGM venues, at an aggregated LGA level). These data include EGM numbers and NGR, at the LGA or aggregated LGA level. It also supplies a listing of EGM venues with their EGM holdings. These data are available on application for a fee. We obtained a data set listing hotel EGM venues including EGM numbers for such venues. We also obtained data describing EGM numbers and NGR at LGA level. We then calculated the average NGR/EGM for LGAs where ALH venues were located. We then applied a factor of 1.04 as outlined in note 1 (above) in order to estimate the likely relative performance of ALH EGMs within their local setting. Thus, our estimate of the NGR generated by ALH EGMs is related to the average NGR of hotel EGMs within their immediate vicinity, with a modest factor applied in acknowledgement of the careful management of venues we attributed to ALH operations.
ALH*New*South*Wales*operations* ALH reports that it operated 53 hotel venues in New South Wales in August 2012. Of these, 52 operated EGMs. One such hotel did not operate EGMs. These 52 EGM venues operated a total of 1,289 EGMs (5.5% of the total hotel EGMs in NSW), generating estimated NGR of $139,790,889 (8.7% of the total hotel NGR in NSW), an average of $108,449 or 159.7% of the average hotel NGR/EGM in NSW. This estimate reflects the location of ALH EGM venues, which are overwhelmingly located in areas where high average NGR/EGM is reported.
Socio8economic*distribution*of*ALH*EGMs*in*New*South*Wales* Median total personal income for NSW was reported by ABS as $561 per week in 2011. In 2010-11, ALH operated 36 venues (69.2% of its total) with 883 EGMs (68.5%) in Gazetted Localities (i.e., suburbs) with MTPI below the statewide MTPI. These EGMs generated estimated NGR of $100,852,776, representing 72.1% of its estimated total. Thus, 72.1% of ALH’s NGR in NSW in 2010-11 was generated in areas of relative disadvantage.

The pattern of distribution of ALH’s EGMs in NSW is quite distinct. ALH operates 25% or more of the hotel EGMs in four Sydney localities – Bankstown, where it operates 5 venues with 119 EGMs (26.4% of the total hotel EGMs), Fairfield, where it operates 5 venues with147 EGMs, (31.2% of the total), Holroyd, where it operates 2 venues with 60 EGMs (33.9% of the total), and Penrith, where it operates 4 venues with 106 EGMs (25.7% of the total). These EGMs generate estimated NGR of, $17.6 million (Bankstown), $26.5 million (Fairfield)(its largest NGR from a single municipality), $8.9 million (Holroyd), and $10 million (Penrith). Thus, these four localities alone generate about $63 million (45%) of ALH’s NSW NGR. Three of these localities (Bankstown, Fairfield and Holroyd) are amongst Sydney’s most disadvantaged local government areas, with MTPI of, respectively, $428 (76% of the statewide MTPI), $369 (66%), and $517 (92%). Penrith’s MTPI is $623 (111%).

Queensland*
Methodology*for*Queensland* As is the case in NSW, the Queensland Office of Liquor and Gambling Regulation provides EGM data at the LGA (or, in the case of LGAs with few venues, multi-LGA level). Unlike NSW, these data are regularly published on the internet and are freely available. We obtained a data set listing hotel EGM venues including EGM numbers for such venues. We also obtained data describing EGM numbers and NGR at LGA level. We then calculated the average NGR/EGM for LGAs where ALH venues were located. We then applied a of 1.04 as outlined in note 1 (above) in order to estimate the likely relative performance of ALH EGMs within their local setting. Thus, our estimate of the NGR generated by ALH EGMs is related to the average NGR of hotel EGMs within their immediate vicinity, with a modest factor applied in acknowledgement of the careful management of venues we attributed to ALH operations.
ALH*Queensland*operations* ALH reports that it operated 111 hotel venues in Qld in August 2012. Of these, 106 operated EGMs. Five venues did not operate EGMs. ALH’s 106 Qld venues operated 4,228 EGMs, amounting to 22.5% of the hotel EGMs in Qld. These generated NGR of $231,656,612, (23.2% of the total Qld hotel NGR), representing an average NGR/EGM of $54,791, or about 103% of the average hotel NGR/EGM in Queensland. This relatively modest performance by ALH’s Qld operations is likely to reflect the specificity of Qld licensing regulations, which require retail liquor outlets to hold a hotel licence. In such circumstances, the distribution of EGM venues will be less discretionary than is the case in other states, where packaged liquor outlets are permitted to operate without the necessity of holding such a licence. The distribution of ALH EGM venues in Qld would therefore be expected to conform more closely to a normal (i.e., unskewed) distribution than in other Australian states.
Socio8economic*distribution*of*ALH*EGMs*in*Queensland* ABS reports a median total personal income (MTPI) for Qld of $587 per week in 2011. In 2010-11, ALH operated 1,933 EGMs (45.7% of its Qld total) in 49 of its venues (46.2% of the total) in Gazetted Localities (i.e., suburbs) with

MTPI below this level. These generated estimated NGR of $102.5 million, representing 44.3% of the total NGR generated by ALH EGMs in Qld. The distribution of ALH EGMs and venues in Qld thus appears to be less skewed towards areas of disadvantage than is the case in other Australian states. This reflects the liquor licensing requirements in Qld, which indicate the ALH has less discretion about where to place EGM venues having regard to its interest in balancing the location of EGM venues against its interest in operating hotels for the purpose of simultaneously operating packaged liquor outlets.
South*Australia*
Methodology*for*South*Australia* As is the case in NSW and Qld, the South Australian Commissioner for Liquor and Gambling Regulation provides EGM data at the LGA. Unlike NSW, these data are regularly published on the internet and are freely available. We obtained a data set listing hotel EGM venues including EGM numbers for such venues. We also obtained data describing EGM numbers and NGR at LGA level. We then calculated the average NGR/EGM for LGAs where ALH venues were located. We then applied a of 1.04 as outlined in note 1 (above) in order to estimate the likely relative performance of ALH EGMs within their local setting. Thus, our estimate of the NGR generated by ALH EGMs is related to the average NGR of hotel EGMs within their immediate vicinity, with a modest factor applied in acknowledgement of the careful management of venues we attributed to ALH operations.
ALH*South*Australian*operations* In 2010-11, ALH operated a total of 32 hotel venues in South Australia, of which 30 operated EGMs. Two venues did not operate EGMs. These 30 venues operated a total of 990 EGMs (8.8% of the SA total), generating estimated total NGR of $84,800,371, 12.6% of the SA total. The average NGR/EGM in ALH venues is estimated at $85,657, or 142.9% of the SA average of $59,927. This high average NGR/EGM suggests that the distribution of ALH EGMs in SA is skewed towards areas of relatively high performing EGM venues.
Socio8economic*distribution*of*ALH*EGMs*in*South*Australia* ABS reports a median total personal income (MTPI) of $534 for SA in 2011. In 2010-11, 17 ALH venues (56.7% of the total) with 560 EGMs (56.6%) were located in Gazetted Localities (i.e., suburbs) with MTPI below this level. Estimated NGR of $50.8 million, representing 60% of ALH’s EGM NGR in South Australia, was generated in these venues. Thus, ALH generated 60% of its SA NGR from areas of comparative disadvantage in 2010-11.
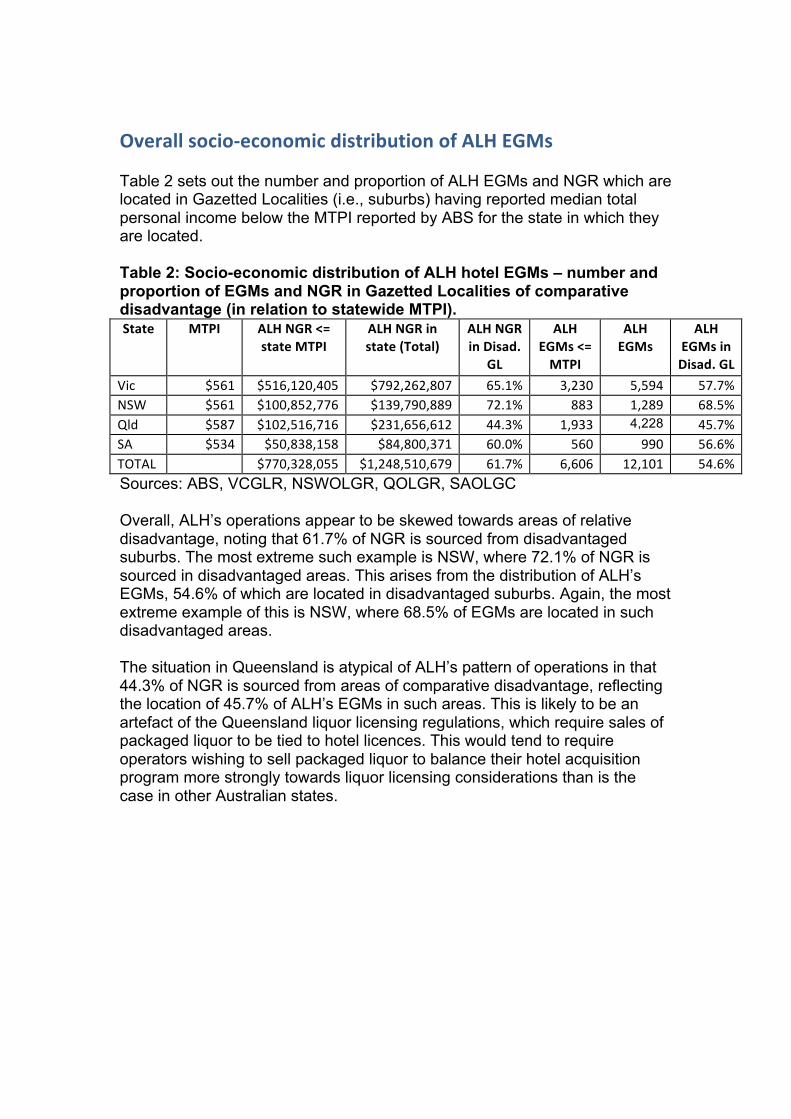
Overall*socio8economic*distribution*of*ALH*EGMs* Table 2 sets out the number and proportion of ALH EGMs and NGR which are located in Gazetted Localities (i.e., suburbs) having reported median total personal income below the MTPI reported by ABS for the state in which they are located. Table 2: Socio-economic distribution of ALH hotel EGMs – number and proportion of EGMs and NGR in Gazetted Localities of comparative disadvantage (in relation to statewide MTPI). State* MTPI* ALH*NGR*<=*
state*MTPI*ALH*NGR*in*state*(Total)*
ALH*NGR*in*Disad.*
GL*
ALH*EGMs*<=*MTPI*
ALH*EGMs*
ALH*EGMs*in*Disad.*GL*
Vic$ $561$ $516,120,405$ $792,262,807$ 65.1%$ 3,230$ 5,594$ 57.7%$NSW$ $561$ $100,852,776$ $139,790,889$ 72.1%$ 883$ 1,289$ 68.5%$Qld$ $587$ $102,516,716$ $231,656,612$ 44.3%$ 1,933$ 4,228 45.7%$SA$ $534$ $50,838,158$ $84,800,371$ 60.0%$ 560$ 990$ 56.6%$TOTAL$ $ $770,328,055$ $1,248,510,679$ 61.7%$ 6,606$ 12,101$ 54.6%$Sources: ABS, VCGLR, NSWOLGR, QOLGR, SAOLGC Overall, ALH’s operations appear to be skewed towards areas of relative disadvantage, noting that 61.7% of NGR is sourced from disadvantaged suburbs. The most extreme such example is NSW, where 72.1% of NGR is sourced in disadvantaged areas. This arises from the distribution of ALH’s EGMs, 54.6% of which are located in disadvantaged suburbs. Again, the most extreme example of this is NSW, where 68.5% of EGMs are located in such disadvantaged areas. The situation in Queensland is atypical of ALH’s pattern of operations in that 44.3% of NGR is sourced from areas of comparative disadvantage, reflecting the location of 45.7% of ALH’s EGMs in such areas. This is likely to be an artefact of the Queensland liquor licensing regulations, which require sales of packaged liquor to be tied to hotel licences. This would tend to require operators wishing to sell packaged liquor to balance their hotel acquisition program more strongly towards liquor licensing considerations than is the case in other Australian states.
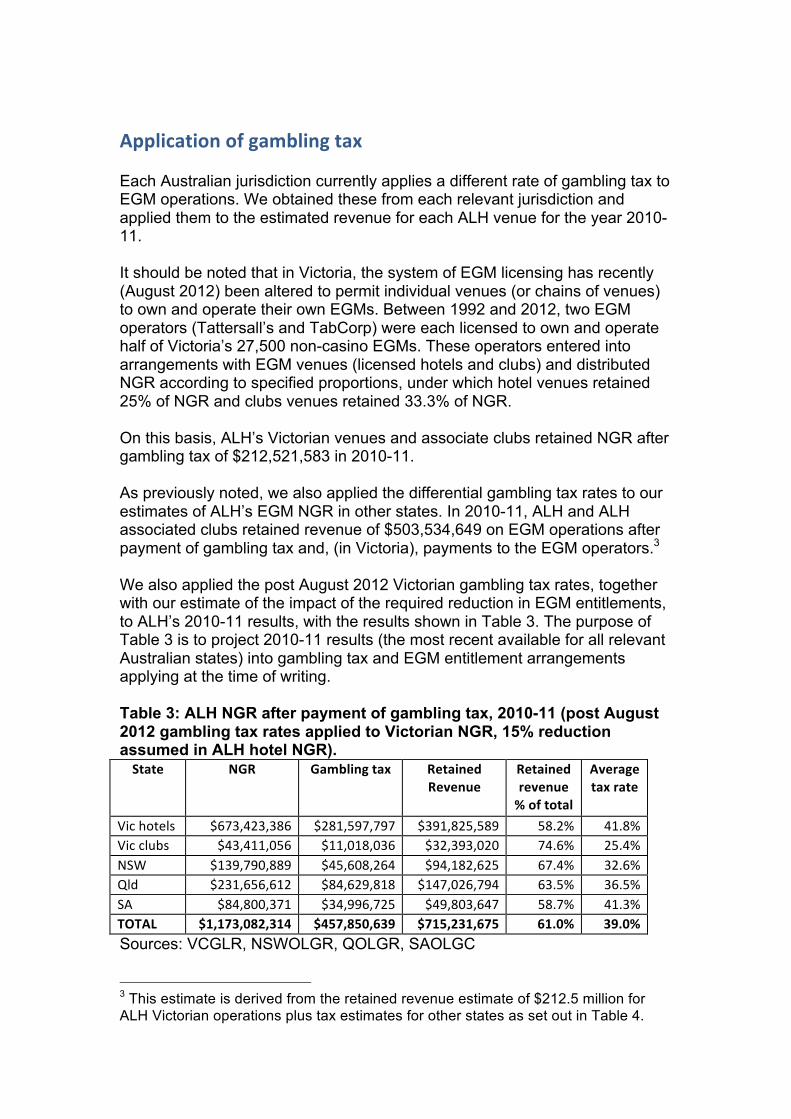
Application*of*gambling*tax* Each Australian jurisdiction currently applies a different rate of gambling tax to EGM operations. We obtained these from each relevant jurisdiction and applied them to the estimated revenue for each ALH venue for the year 2010-11. It should be noted that in Victoria, the system of EGM licensing has recently (August 2012) been altered to permit individual venues (or chains of venues) to own and operate their own EGMs. Between 1992 and 2012, two EGM operators (Tattersall’s and TabCorp) were each licensed to own and operate half of Victoria’s 27,500 non-casino EGMs. These operators entered into arrangements with EGM venues (licensed hotels and clubs) and distributed NGR according to specified proportions, under which hotel venues retained 25% of NGR and clubs venues retained 33.3% of NGR. On this basis, ALH’s Victorian venues and associate clubs retained NGR after gambling tax of $212,521,583 in 2010-11. As previously noted, we also applied the differential gambling tax rates to our estimates of ALH’s EGM NGR in other states. In 2010-11, ALH and ALH associated clubs retained revenue of $503,534,649 on EGM operations after payment of gambling tax and, (in Victoria), payments to the EGM operators.3 We also applied the post August 2012 Victorian gambling tax rates, together with our estimate of the impact of the required reduction in EGM entitlements, to ALH’s 2010-11 results, with the results shown in Table 3. The purpose of Table 3 is to project 2010-11 results (the most recent available for all relevant Australian states) into gambling tax and EGM entitlement arrangements applying at the time of writing. Table 3: ALH NGR after payment of gambling tax, 2010-11 (post August 2012 gambling tax rates applied to Victorian NGR, 15% reduction assumed in ALH hotel NGR). State* NGR* Gambling*tax* Retained*
Revenue*Retained*revenue*%*of*total*
Average*tax*rate*
Vic$hotels$ $673,423,386$ $281,597,797$ $391,825,589$ 58.2%$ 41.8%$Vic$clubs$ $43,411,056$ $11,018,036$ $32,393,020$ 74.6%$ 25.4%$NSW$ $139,790,889$ $45,608,264$ $94,182,625$ 67.4%$ 32.6%$Qld$ $231,656,612$ $84,629,818$ $147,026,794$ 63.5%$ 36.5%$SA$ $84,800,371$ $34,996,725$ $49,803,647$ 58.7%$ 41.3%$TOTAL* $1,173,082,314* $457,850,639* $715,231,675* 61.0%* 39.0%*Sources: VCGLR, NSWOLGR, QOLGR, SAOLGC !!!!!!!!!!!!!!!!!!!!!!!!!!!!!!!!!!!!!!!!!!!!!!!!!!!!!!!!3 This estimate is derived from the retained revenue estimate of $212.5 million for ALH Victorian operations plus tax estimates for other states as set out in Table 4.
Table 3 indicates that ALH and ALH associated clubs would retain revenue of $715.2 million after payment of gambling taxes on 2010-11 NGR data under post August 2012 gambling tax and EGM entitlement arrangements in Victoria. The impact of the new Victorian tax arrangements on ALH’s Victorian revenues is significant, principally because ALH operates a significant number of EGMs in that state. As noted above, ALH venues and associated clubs retained $212.5 million of total NGR of $792.3 million in 2010-11 under then existing arrangements. The impact of the new tax arrangements will result in an estimated increase in retained revenue to $391.8 million, an increase of 84%. This estimate also takes into account the expected decline in overall NGR associated with the reduction in EGM entitlements required of ALH under the post-August 2012 arrangements.4 As noted, ALH has reduced its EGM entitlements from 5,594 to 4,460 (a reduction of 1,134, or 20.3%). Although such a reduction will most likely be accompanied by a reduction in aggregate NGR, any such revenue reduction is unlikely to be concomitant with the reduction in EGM entitlements (see SACES 2005 for a discussion of the effects of moderate reductions in EGM numbers). This is because ALH, as a carefully managed gambling operator, would be most likely to manage the EGM reduction so as to (i) reduce EGM numbers in, or dispose of, those venues performing least profitably; (ii) dispose of EGM games with the lowest NGR across all venues; and (iii) ensure that utilisation rates of remaining EGMs are at high average levels. Accordingly, for the purposes of estimating the effects of the reduction in ALH’s EGM entitlements we have assumed that ALH hotel NGR will decline by 15%. (i.e., by two-thirds of the reported reduction in ALH hotel EGM entitlements in Victoria). We believe that this is a conservative estimate of the revenue impact of the reduction in ALH’s EGM entitlements in Victoria. We note that the 2012 Annual Report for Woolworths Ltd (2012) sets out certain strategies and acquisitions regarding their hotel and gambling businesses, including an allowance of $26 million for purchase of EGMs and $164 million for acquisition of EGM entitlements in Victoria. In addition, Woolworth’s announced the acquisition of 40 new hotels. These statements appear to be entirely consistent with the estimates and assumptions set out above. It should also be noted that ALH is a joint venture between Woolworths and the Mathieson group. Accordingly, revenue, profits and costs will be shared between Woolworths and the Mathieson group. It should also be noted that !!!!!!!!!!!!!!!!!!!!!!!!!!!!!!!!!!!!!!!!!!!!!!!!!!!!!!!!4!The new arrangements applying in Victoria after August 2012 also require that no single hotel operator may control more than 35% of the available EGMs in that market. On this basis, ALH is permitted to operate no more than 4,812 EGMs in the Victorian hotel market, 780 fewer than it operated in 2010-11. As at August 2012, ALH Group was reported by the VCGLR to hold 4,460 entitlements.!http://www.vcgr.vic.gov.au/CA256F800017E8D4/LicInfo/66ECCD9CA3AA259FCA2577C000200210?Open !
details of management arrangements applying to clubs with which ALH has an arrangement are not disclosed and the financial implications of these for ALH’s revenue, profit and costs are not known.
References* ALH Group Pty Ltd 2012. ALH Group website. ‘About ALH Group’ http://www.alhgroup.com.au/about.html ‘Our venues’ http://www.alhgroup.com.au/our_venues.php Australian Bureau of Statistics 2012. Basic Community Profiles (various) Gazetted Localities, States and Local Government Areas. Accessed via: http://www.abs.gov.au/websitedbs/censushome.nsf/home/communityprofiles?opendocument&navpos=230 NSW Office of Liquor, Gaming and Racing 2012. EGM approval data for hotels. EGM data for hotels. Data provided on request. NSW Office of Liquor, Gaming and Racing 2012. Hotel Gaming Machine Tax rates. http://www.olgr.nsw.gov.au/gaming_info_taxrates_hotel.asp Productivity Commission 2010. Gambling. Inquiry No 50. Canberra Qld Office of Liquor and Gaming Regulation 2012. Gaming machine statistics. https://secure.olgr.qld.gov.au/dcm/Gaming Qld Office of Liquor and Gaming Regulation 2012. Machine gaming fees and charges. http://www.olgr.qld.gov.au/industry/FeesAndCharges/machinegamingfees.shtml South Australia Office of the Liquor and Gambling Commissioner 2012. Annual Report 2010-11. Adelaide South Australia Office of the Liquor and Gambling Commissioner 2006. Gaming Tax Booklet South Australia, Dept of Consumer and Business Services 2012. Gaming Machine Entitlements Register. Adelaide South Australian Centre for Economic Studies 2005. Study of the Impact of Caps on Electronic Gaming Machines. Dept. of Justice, Melbourne Victorian Commission for Gambling and Liquor Regulation 2012. EGM venue data 2010-11. www.vcgr.vic.gov.au Victorian Commission for Gambling and Liquor Regulation 2012. Gambling Information Sheet. Taxation Thresholds and Marginal Tax Rates in 2012. Melbourne. Woolworths Ltd 2012. Annual Report. http://www.asx.com.au/asxpdf/20120924/pdf/428xcsbzvrrnd1.pdf