LOCATING DITCH RELIEF CULVERTS TO REDUCE SEDIMENT DELIVERY TO STREAMS...
15
1 LOCATING DITCH RELIEF CULVERTS TO REDUCE SEDIMENT DELIVERY TO STREAMS - AN INTERACTIVE DESIGN TOOL Peter Schiess, Finn Krogstad and Florentiu Damian Paper presented at the Joint Conference of IUFRO 3.06 Forest Operations under Mountainous Conditions and the 12th International Mountain Logging Conference June 13-16 2004, Vancouver B.C. ABSTRACT A model has been developed which allows a designer to optimize the location of ditch relief culverts to minimize sediment deliveries to streams. The model provides immediate visual feedback allowing the designer to rapidly evaluate and optimize various ditch relief culvert locations. The model’s sediment delivery and routing algorithms are based on existing methodologies. Current as well as planned road systems can be evaluated and the potential for improvements documented in a quantifiable and repeatable way. The model was tested on a portion of the Tahoma State Forest, situated south of Mt. Rainier. Two existing road systems with 28 and 39 stream crossings and 82 and 86 ditch relief culverts respectively were analyzed. Interactively relocating 20 and 35 ditch relief culverts resulted in a 76% reduction in sediments delivered to each stream system. The last culvert was usually placed 100 to 200 feet from a stream. CROSS DRAIN LOCATION, SEDIMENT DELIVERY AND TOPOGRAPHY Cross drain systems were originally devised for reducing the adverse effects of excess water within the roadway. The recent evolution of road design into a more environmentally aware paradigm lead to a new challenge for the cross drain systems design. They emerged as a potential solution to the stream sedimentation problem by intercepting and rerouting sediment- laden ditch water. Thus, in addition to the functionality dictated by the prism health state, another prerequisite was added: to reduce sediment delivery to stream networks (FAO, 1989; Washington State Forest Practices Board, 2000). Ditch relief culverts can reduce road sediment delivery to streams by diverting sediment laden ditch water onto the forest floor where it can infiltrate and be filtered (Figure 1). Below the last ditch relief culvert, all the sediment delivered to the ditch will be delivered directly to the stream, so the last ditch relief culvert should be as close to the stream crossing as possible. If the ditch relief culvert is close to the stream however, then there is little space between the culvert outfall and the stream for sediment filtering. This tradeoff between minimizing the amount of water delivered directly to the stream and maximizing the distance for outflow filtration poses a question of where the last ditch relief culvert should be placed.
Transcript of LOCATING DITCH RELIEF CULVERTS TO REDUCE SEDIMENT DELIVERY TO STREAMS...
1
LOCATING DITCH RELIEF CULVERTS TO REDUCE SEDIMENT DELIVERY TO STREAMS -
AN INTERACTIVE DESIGN TOOL
Peter Schiess, Finn Krogstad and Florentiu Damian
Paper presented at the Joint Conference of IUFRO 3.06 Forest Operations under Mountainous Conditions and the 12th International Mountain Logging Conference
June 13-16 2004, Vancouver B.C. ABSTRACT A model has been developed which allows a designer to optimize the location of ditch relief culverts to minimize sediment deliveries to streams. The model provides immediate visual feedback allowing the designer to rapidly evaluate and optimize various ditch relief culvert locations. The model’s sediment delivery and routing algorithms are based on existing methodologies. Current as well as planned road systems can be evaluated and the potential for improvements documented in a quantifiable and repeatable way. The model was tested on a portion of the Tahoma State Forest, situated south of Mt. Rainier. Two existing road systems with 28 and 39 stream crossings and 82 and 86 ditch relief culverts respectively were analyzed. Interactively relocating 20 and 35 ditch relief culverts resulted in a 76% reduction in sediments delivered to each stream system. The last culvert was usually placed 100 to 200 feet from a stream. CROSS DRAIN LOCATION, SEDIMENT DELIVERY AND TOPOGRAPHY Cross drain systems were originally devised for reducing the adverse effects of excess water within the roadway. The recent evolution of road design into a more environmentally aware paradigm lead to a new challenge for the cross drain systems design. They emerged as a potential solution to the stream sedimentation problem by intercepting and rerouting sediment-laden ditch water. Thus, in addition to the functionality dictated by the prism health state, another prerequisite was added: to reduce sediment delivery to stream networks (FAO, 1989; Washington State Forest Practices Board, 2000). Ditch relief culverts can reduce road sediment delivery to streams by diverting sediment laden ditch water onto the forest floor where it can infiltrate and be filtered (Figure 1). Below the last ditch relief culvert, all the sediment delivered to the ditch will be delivered directly to the stream, so the last ditch relief culvert should be as close to the stream crossing as possible. If the ditch relief culvert is close to the stream however, then there is little space between the culvert outfall and the stream for sediment filtering. This tradeoff between minimizing the amount of water delivered directly to the stream and maximizing the distance for outflow filtration poses a question of where the last ditch relief culvert should be placed.

2
But how many culverts are needed, and where should they be placed? In one approach, cross drains are to be spaced at regular prescribed intervals along a forest road to disperse ditch water runoff onto the forest floor (Washington Forest Practices Board Manual, 2000). The distance between culverts is determined as a function of road grade, side slope, average distance above streams, road surface condition and use, precipitation, and soil erosion potential. The rules also specify that the distance between a stream crossing and the first upslope cross drain is important to the volume of sediment delivered and recommend that a culvert should be installed 50 to 100 feet above all stream crossings.
a. Initial set-up
b. Culvert moved towards the stream crossing
c. Culvert moved away from stream crossing
Figure 1: The ditch relief culvert C divides sediment produced on a forest road into an overland delivery component OD, the fraction which is filtered and not delivered ND, and the part below the culvert that is delivered directly to the stream DD. Moving cutoff culvert C towards the stream (b) reduces direct delivery DD but reduces filtering and increases OD. Moving C away from the stream (c) increases filtering but also increases DD. Several software programs exist that estimate the amount of road sediment delivered to streams (Elliot et al., 1999a, 1999b, 1999c; NCASI, 2002; Megahan, 2003). These software tools
Stream
Road
DDND
OD C
DDND
OD
Stream
Road C OD
ND DD
Stream
Road
3
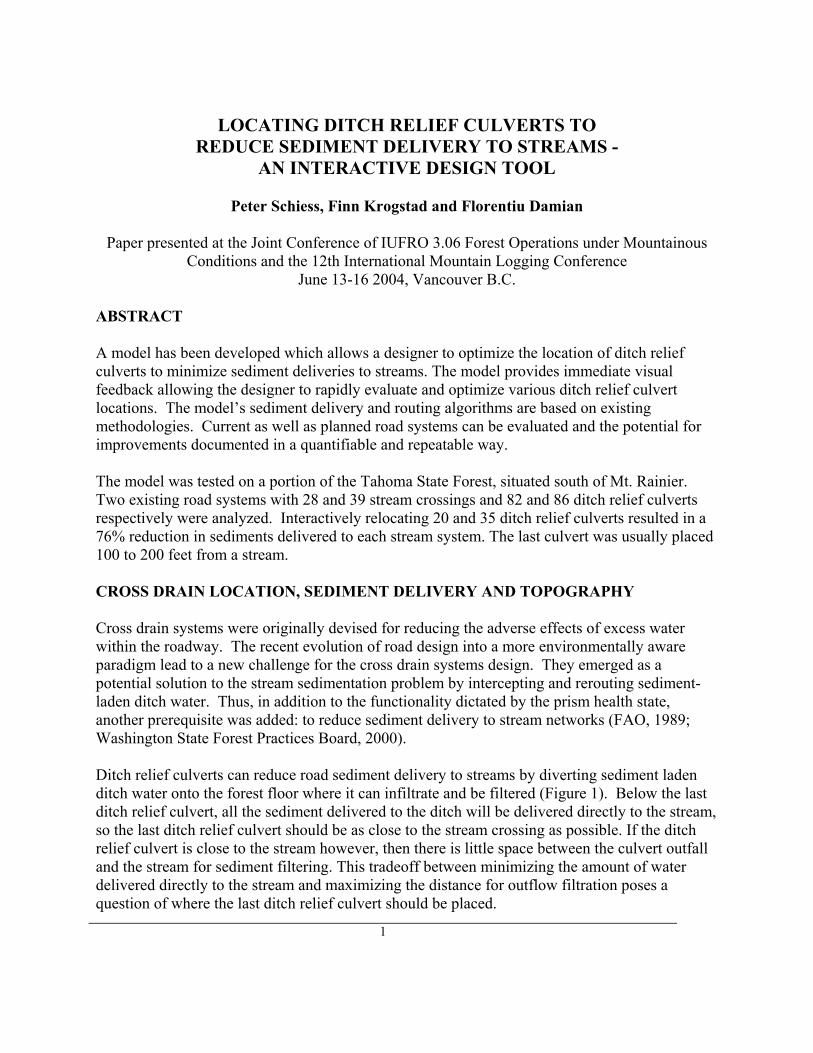
perform well when used for estimating total sediment delivered from a road network or for general identification of sedimentation problem areas. However, as illustrated in Figure 1, optimal culvert placement is an iterative process, in which several alternate locations must be evaluated. Iterative investigation requires rapid feedback in which the sediment impacts of each alternate location is immediately displayed so that the designer can attempt to improve on it. The longer the delay between culvert placement and estimation of resulting sediment delivery, the less likely the designer will attempt an additional improvement on the existing location. A slow road sediment analysis tool is thus not a tool for culvert optimization. Unfortunately, none of the existing road sediment models allow instant feedback, so a new tool is needed for culvert location optimization. CULSED- A DECISION SUPPORT TOOL FOR CROSS DRAIN SYSTEM DESIGN A specialized computer program named “CULvert Locator for SEDiment Reduction” (CULSED), was developed to help optimize cross drain locations (Damian, 2003). It assesses the sediment delivery at each culvert location and graphically displays it on the computer screen so that users can immediately evaluate their design decision. CULSED gives users the ability to add, move and remove cross-drain culverts, dynamically evaluating the total sediment impact to the stream network from the analyzed road system. Culverts are represented with graduated symbols proportional to their sediment delivery. Minimizing sediment delivery is thus transposed to a question of minimizing symbols on screen. The total sediment delivered is displayed at all times during the analysis stages and changes with every modification performed to the cross drain system. The program has no automated procedures for achieving absolute minimization of total delivery but provides the users with the means to compare culvert locations and identify good solutions. CULSED is implemented as an ArcGIS extension that seamlessly integrates with the standard ArcGIS package. It is able to access all the existing functionality and providing a familiar interface and ease of use. Running CULSED requires a GIS road layer, a stream layer, and a digital elevation model. Additional information such as: road surface, road age, road grade, soil and parent material and side slope vegetation cover may also be incorporated to improve accuracy. At the core of CULSED is a suite of three modeler modules: the Road Ditch Model, Sediment Production Model and Side Slope Filtering Model. The Road Ditch Model is a simplified representation of the road’s drain ditch, modeling the flow of water along it. This module makes the following assumptions:
• All roads are in-sloped. • There is continuous ditch along every road segment in the network. • Water flows along the ditch and spills out only at culverts and ditch ends. • All culverts are functioning within designed parameters.
4
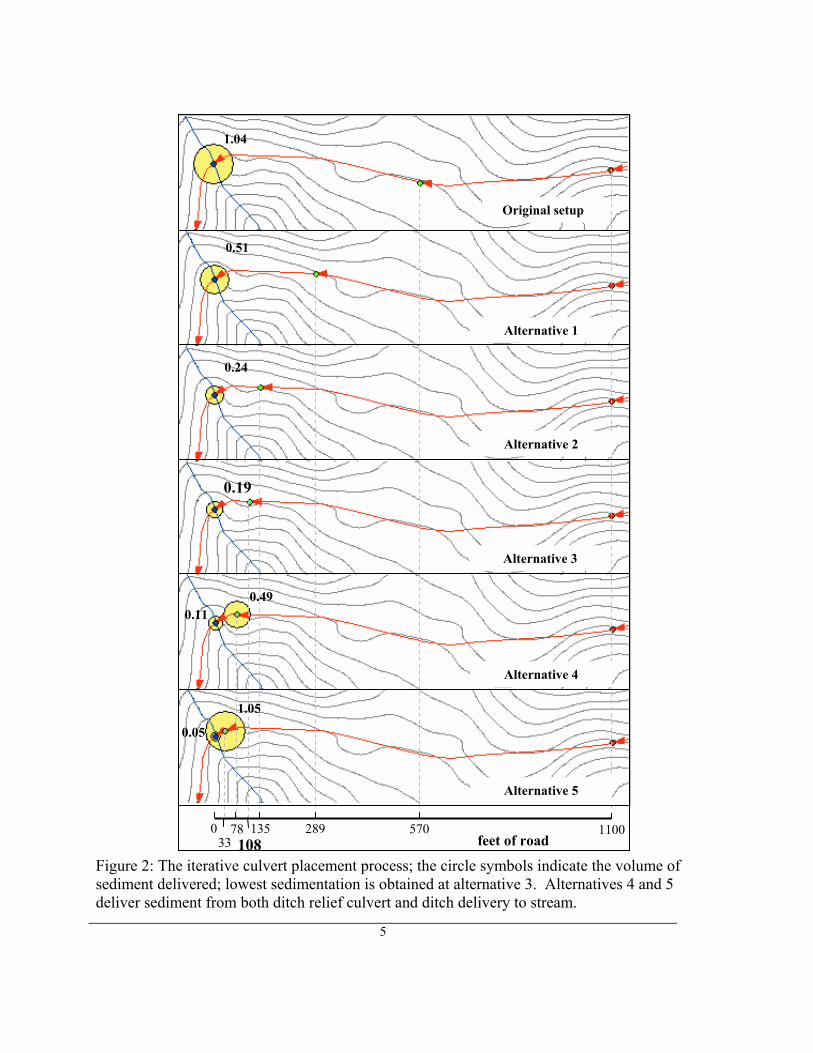
Sediment production from road prism and delivery potential associated with each culvert are computed with empirical models derived for particular conditions in the Northwest of the United States (Washington Forest Practices Board, 1997; Ketcheson and Megahan 1996). The sediment delivered by each culvert is the sum of the sediment produced by all contributing road segments multiplied by the fraction delivered from that particular location. The fraction of sediment delivered from a given location is estimated from the sediment delivery distances in Ketcheson and Megahan (1996). The process of identifying a near optimal cross drain location is shown in Figure 2. Starting with the original culvert configuration, a cross drain was relocated progressively towards the stream crossing in five iterations. Sedimentation was graphically displayed with proportional symbols making the effects of each of these possible culvert configurations readily apparent. The goal of the road designer using CULSED was to minimize the sum of sediment delivered by all culverts involved in this operation, expressed in this case by the area of the yellow circles. The examination of sediment delivery potential at each of the five steps revealed a minimum at the third iteration with the cut-off culvert placed 108 feet away from the stream crossing.
5
Figure 2: The iterative culvert placement process; the circle symbols indicate the volume of sediment delivered; lowest sedimentation is obtained at alternative 3. Alternatives 4 and 5 deliver sediment from both ditch relief culvert and ditch delivery to stream.
1.04
0.51
0.24
0.19
0.11 0.49
1.05
0.05
Original setup
Alternative 1
Alternative 2
Alternative 3
Alternative 4
Alternative 5
0 33
78 108
135 289 570 1100 feet of road

6
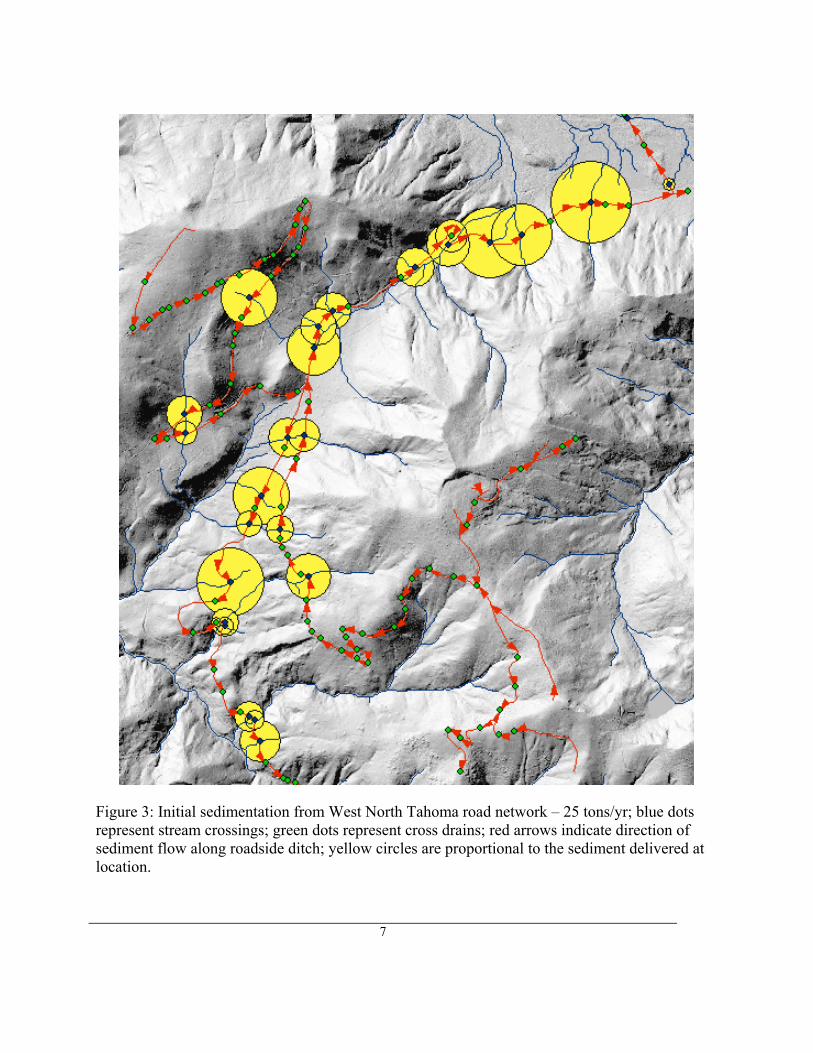
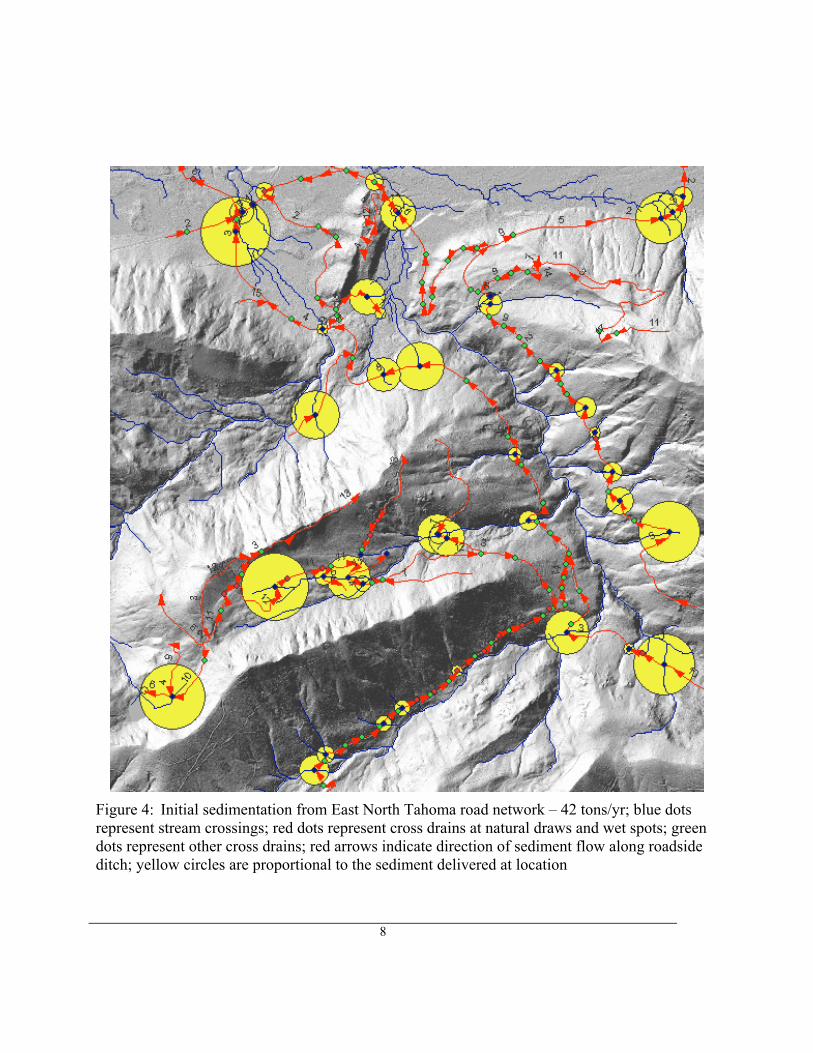
RESULTS OF A CROSS DRAIN REDESIGN APPLICATION To evaluate the applicability of CULSED in a real-world scenario, a road system on the Mt. Tahoma State Forest was examined within the context of a forest harvest plan (Schiess and Tryall, 2003). The goal of this design process was to reduce the total sedimentation from an existing road network by redesigning its cross drain system so as to focus on culvert location, design alterations were limited to the current number of culverts. The North Tahoma State Forest is an area of approximately 25,000 acres of forested terrain on steep topography, with a well developed road network. It is located south of the Nisqually River, near Ashford, Washington. Digital datasets of existing cross drains, roads and high resolution digital elevation models (6-foot grid spacing) were obtained from Washington State Department of Natural Resources. The study area had approximately 42 miles of roads with 67 stream crossings. The road grade varied between 1% and 19% with an average of 6%. The majority of roads were the typical one-lane forest road, 12 foot width, surfaced with gravel and maintained in good condition. A cross drain system was already in place and contained 168 culverts placed according to the standard Washington State Department of Natural Resources regulation. The study area had two major drainages, the East drainage and West drainage. The East drainage contained 39 stream crossings and 86 ditch relief culverts, the West drainage had 28 stream crossings and 82 ditch relief culverts. Based on local site conditions CULSED estimated the sediment delivery for the existing culvert locations for both the East and West halves of our planning area of 42 and 25 tons per year respectively (Table 1 and Figures 3 & 4).
Table 1: Sediment delivery for an existing culvert system of an active road system and the sediment reduction possible by relocating some culverts using CULSED.
West Drainage
East Drainage Total
Number of stream crossings 28 39 67
Ditch relief culverts 82 86 168
Original sediment delivery (Tons/year) 25 42 67
Number of relocated ditch relief culverts 20 35 55
Sediment delivery after culvert relocations (Tons/year) 6 10 16
Reduction in sediment delivery (Percent) 76 76 76
7
Figure 3: Initial sedimentation from West North Tahoma road network – 25 tons/yr; blue dots represent stream crossings; green dots represent cross drains; red arrows indicate direction of sediment flow along roadside ditch; yellow circles are proportional to the sediment delivered at location.
8
Figure 4: Initial sedimentation from East North Tahoma road network – 42 tons/yr; blue dots represent stream crossings; red dots represent cross drains at natural draws and wet spots; green dots represent other cross drains; red arrows indicate direction of sediment flow along roadside ditch; yellow circles are proportional to the sediment delivered at location

9
SEDIMENT REDUCTION BY CROSS DRAIN SYSTEM REDESIGN The original culvert configuration for the West half of North Tahoma consisted of 28 stream crossings, 27 unmovable drainage culverts and 55 cut-off culverts. This configuration yielded a total of 25 tons/year of sediment to the stream network (Figure 3). By applying methods described earlier, a number of culverts were relocated to achieve sediment reduction for the project area. The culverts originally designed for reasons of prism health, were considered “unmovable” and kept unchanged. After repositioning 20 cut-off culverts, the total sedimentation of the West area was reduced to 6 tons/year, a 76 % percent drop from the original delivery (Figure 5). The sediment reduction becomes obvious when comparing the relative size of the proportional symbols with the original configuration (Figure 3 and 5). An similar design process was conducted for the East part of North Tahoma. The original cross drain system containing 39 stream crossings, 22 unmovable drainage culverts and 64 cut-off cross drains, was potentially delivering 42 tons of sediment/year. Redesigning this system involved relocation of 35 cross drains. The final sediment delivery was dropped to 10 tons/year, achieving a 76 % reduction from the initial amount (Figure 6). The graphic quantification of this improvement can be easily noticed when contrasted with the original setup (Figure 4). The average distance from the first cut-off culvert to the stream crossing at the end of the design process was 140 feet with a minimum of 55 feet, maximum of 289 feet and a standard deviation of 59 feet. These results contrast with the Forest Practices Board recommendation of placing the first culvert within 50 – 100 feet of a stream crossing. The larger distance may be due to the delivery model used in CULSED, which was calibrated for dryer sites in the Idaho Batholith (Ketcheson and Megahan, 1996)

10
Figure 5: Sediment delivery from West North Tahoma road network after redesigning the cross drain system is reduced from 25 to 6 tons/year. Yellow circles are proportional to the sediment delivered at the respective locations, a 76% sedimentation reduction from the original design shown in Figure 3.

11
Figure 6: Sediment delivery from East North Tahoma road network after redesigning the cross drain system is reduced from 42 to 10 tons/year. Yellow circles are proportional with sedimentation at the respective location, a 76% sedimentation reduction from the original design shown in Figure 4.
12
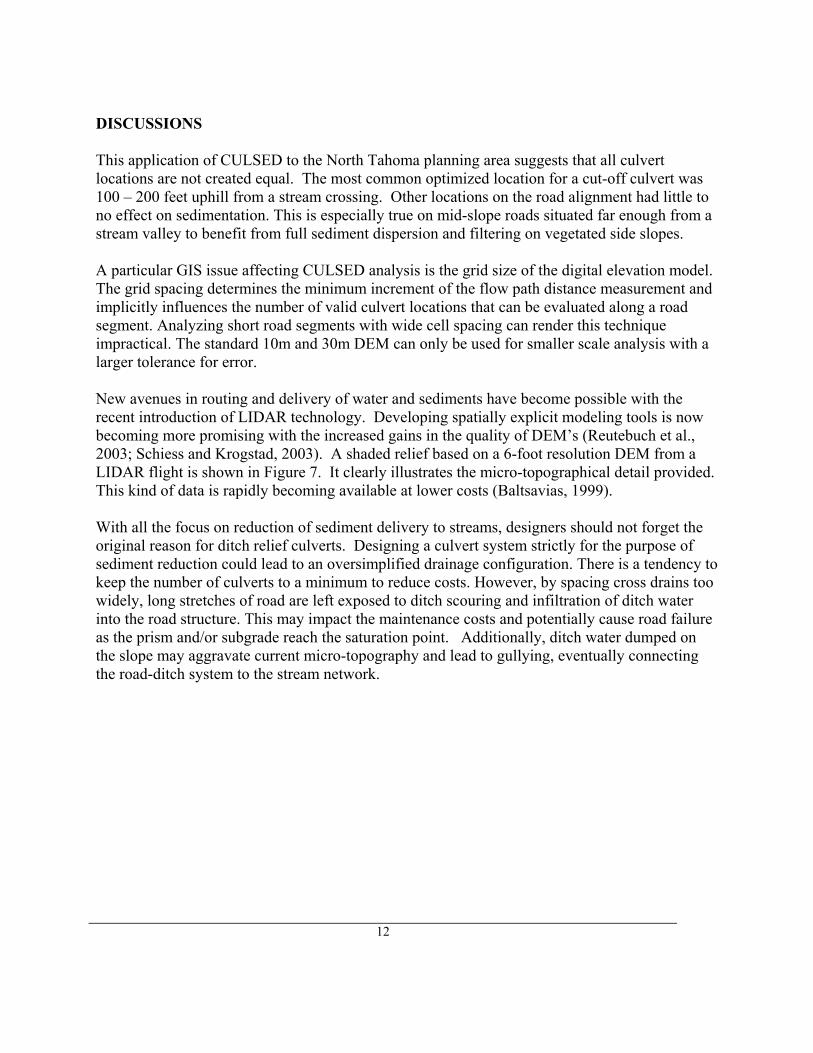
DISCUSSIONS This application of CULSED to the North Tahoma planning area suggests that all culvert locations are not created equal. The most common optimized location for a cut-off culvert was 100 – 200 feet uphill from a stream crossing. Other locations on the road alignment had little to no effect on sedimentation. This is especially true on mid-slope roads situated far enough from a stream valley to benefit from full sediment dispersion and filtering on vegetated side slopes. A particular GIS issue affecting CULSED analysis is the grid size of the digital elevation model. The grid spacing determines the minimum increment of the flow path distance measurement and implicitly influences the number of valid culvert locations that can be evaluated along a road segment. Analyzing short road segments with wide cell spacing can render this technique impractical. The standard 10m and 30m DEM can only be used for smaller scale analysis with a larger tolerance for error. New avenues in routing and delivery of water and sediments have become possible with the recent introduction of LIDAR technology. Developing spatially explicit modeling tools is now becoming more promising with the increased gains in the quality of DEM’s (Reutebuch et al., 2003; Schiess and Krogstad, 2003). A shaded relief based on a 6-foot resolution DEM from a LIDAR flight is shown in Figure 7. It clearly illustrates the micro-topographical detail provided. This kind of data is rapidly becoming available at lower costs (Baltsavias, 1999). With all the focus on reduction of sediment delivery to streams, designers should not forget the original reason for ditch relief culverts. Designing a culvert system strictly for the purpose of sediment reduction could lead to an oversimplified drainage configuration. There is a tendency to keep the number of culverts to a minimum to reduce costs. However, by spacing cross drains too widely, long stretches of road are left exposed to ditch scouring and infiltration of ditch water into the road structure. This may impact the maintenance costs and potentially cause road failure as the prism and/or subgrade reach the saturation point. Additionally, ditch water dumped on the slope may aggravate current micro-topography and lead to gullying, eventually connecting the road-ditch system to the stream network.
13
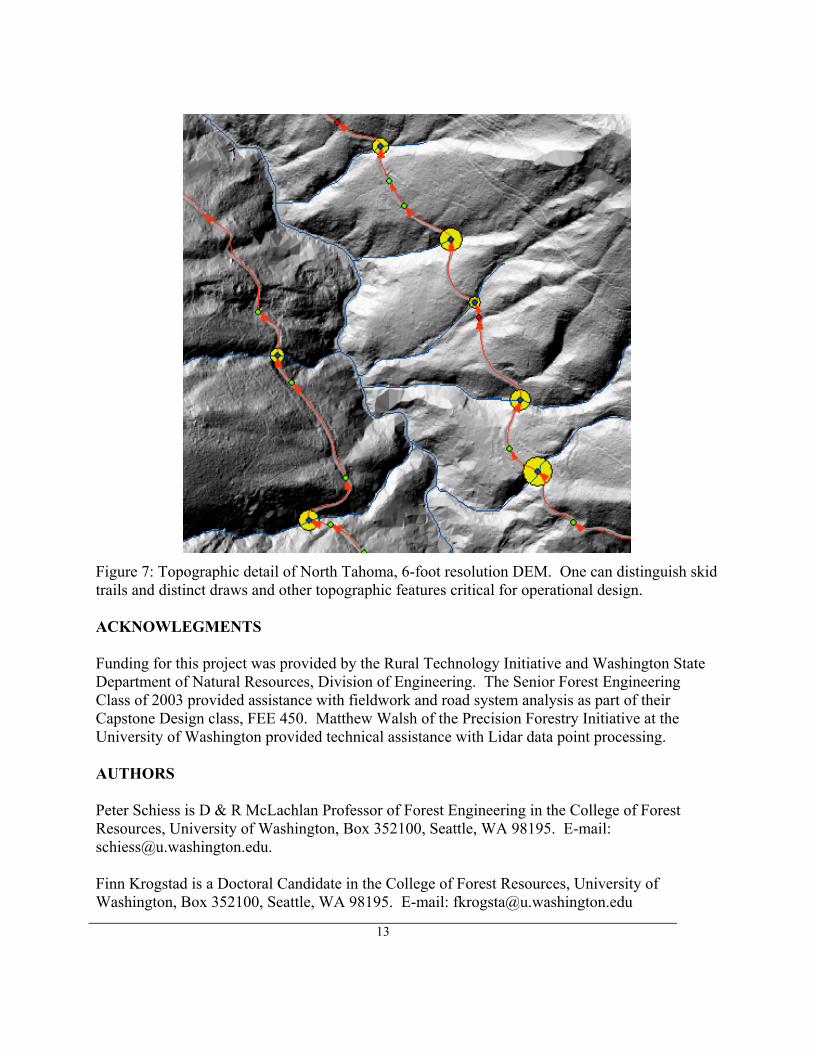
Figure 7: Topographic detail of North Tahoma, 6-foot resolution DEM. One can distinguish skid trails and distinct draws and other topographic features critical for operational design. ACKNOWLEGMENTS Funding for this project was provided by the Rural Technology Initiative and Washington State Department of Natural Resources, Division of Engineering. The Senior Forest Engineering Class of 2003 provided assistance with fieldwork and road system analysis as part of their Capstone Design class, FEE 450. Matthew Walsh of the Precision Forestry Initiative at the University of Washington provided technical assistance with Lidar data point processing. AUTHORS Peter Schiess is D & R McLachlan Professor of Forest Engineering in the College of Forest Resources, University of Washington, Box 352100, Seattle, WA 98195. E-mail: [email protected]. Finn Krogstad is a Doctoral Candidate in the College of Forest Resources, University of Washington, Box 352100, Seattle, WA 98195. E-mail: [email protected]
14
Florentiu Damian is GIS Analyst for the Northwest Fisheries Science Center, with the National Oceanography & Atmospheric Administration, Seattle, WA 98115. E-mail: [email protected]
LIST OF REFERENCES Baltsavias, E. 1999. Airborne laser scanning: Existing systems and firms and other resources.
ISPRS J. Photogramm. Remote Sensing 54(1999) 164-198
Damian, F. 2003. Cross-drain Placement to Reduce Sediment Delivery from Forest Roads to Streams. MS Thesis, University of Washington, Seattle, WA. 207 pp.
Elliot, W. J., D. E. Hall, and D. L. Scheele. 1999a. The X-DRAIN Cross Drain
Spacing and Sediment Yield Program Version 2.00. U.S. Department of Agriculture, Forest Service, Rocky Mountain Research Station, San Dimas Technology and Development Center.
Elliot, W. J., D. E. Hall, and D. L. Scheele. 1999b. Forest Service Interfaces for the Water Erosion Prediction Project Computer Model. U.S. Department of Agriculture, Forest Service, Rocky Mountain Research Station, San Dimas Technology and Development Center.
Elliot, W. J., D. E. Hall, and D. L. Scheele. 1999c. WEPP Interface for Predicting Forest Road Runoff, Erosion and Sediment Delivery. U.S. Department of Agriculture, Forest Service, Rocky Mountain Research Station, San Dimas Technology and Development Center.
FAO. 1989. Watershed management field manual: road design and construction in sensitive watersheds. Conservation Guide 13/5. Rome, FAO. 196 pp.
Ketcheson, G. L. and W. F. Megahan. 1996. Sediment Production and Downslope Sediment Transport from Forest Roads in Granitic Watersheds. U.S. Department of Agriculture, Forest
Service, Intermountain Research Station. Megahan, W. F. 2003. Washington Road Surface Erosion Model. Watershed GeoDynamics.
Techn. Report, Washington State Department of Natural Resources, Olympia, WA. 54 pp.
.NCASI. 2002. Technical Documentation for SEDMODL version 2. National Council for Air and Stream Improvement
15
Reutebuch, S. E., R. J. McGaughey, H. –E. Andersen and W. W. Carson. 2003. Accuracy of a High-Resolution Lidar Terrain Model under a Conifer Forest Canopy. Can. J. Remote Sensing, Vol. 29, No. 5, pp. 527-535.
Schiess, P. and F. Krogstad, 2003. LIDAR-Based Topographic Maps Improve Agreement
Between Office-Designed and Field-Verified Road Locations. Proceedings of the 26th Annual Meeting of the Council on Forest Engineering, Bar Harbor, Maine, 7-10 September, 2003
Schiess, P. and J. Tryall. 2003. Developing a Road System Strategy for the Tahoma State
Forest. Techn. Report, University of Washington, Seattle, WA. Washington Forest Practices Boards. 1997. Standard Methodology for Conducting
Watershed Analysis Manual, version 4., Washington State Department of Natural Resources, Olympia, WA.
Washington Forest Practices Board. 2000. Forest Practices Board Manual, Section 3. WA Department of Natural Resources, Olympia, WA.