Localization of Amplitude-Panned Virtual Sources I: Stereophonic...
14
PAPERS Localization of Amplitude-Panned Virtual Sources I: Stereophonic Panning* VILLE PULKKI, AES Member, AND MATTI KARJALAINEN, AES Fellow Laboratory of Acoustics and Audio Signal Processing, Helsinki University of Technology, FIN-02015 HUT, Finland The localization of amplitude-panned virtual sources is investigated in a stereophonic setup with listening tests and with a model of directional hearing. The interaural time difference (ITD) cue is found to be consistent at low frequencies, which is in agreement with earlier studies. It is also shown that the high-frequency interaural level difference (ILD) cues roughly propose the same directions as low-frequency ITD cues However, the ITD and ILD cues suggest different directions at most frequencies, and both cues deviate from general behavior near 1700 Hz 0 INTRODUCTION In amplitude panning [1] the same sound signal is applied to two or more loudspeakers equidistant from a listener with appropriate amplitudes. The listener per- ceives an auditory object in a location that does not necessarily coincide with any of the physical sound sources. The perceived auditory object is called a virtual source, or phantom source. In standard stereophonic listening the amplitude- panned virtual source is localized fairly consistently to the same direction at most frequencies. However, direc- tion perception deviates considerably at some frequen- cies, which can be dependent on the temporal structure of the signal. The mechanisms producing the localization of a vir- tual source have been explained only at low frequencies. The reasons why high-frequency virtual sources are lo- calized consistently with low-frequency virtual sources have remained unexplained. Also the dependence of di- rection perception on frequency and temporal structure has not been studied. Leakey [2] conducted listening tests in standard ste- reophonic listening with broad-band and narrow-band speech, noise, and impulses. A perceived virtual source direction was compared with the perceived direction of a real source, and the listener reported whether the real source was to the right or the left of the virtual source. The test was repeated for real sources in multiple direc- * Manuscript received 2000 October 10; revised 2001 May 17. tions. He suggested that the virtual source formation at high frequencies was also based on interaural time difference (ITD) cues. He used a shadowless head model to calculate ITDs, similarly as in [3]. However, he did not take into account head shadowing, and he did not monitor other major auditory cues, such as interaural level difference (ILD). In [4], the results of several similar tests by various scientists are reprinted. The frequency dependence of virtual source localization can be observed in the results. Also, it can be seen that the different temporal structures of sound signals affect localization as well. The models that were presented to explain the performance of test subjects were applicable with low frequencies and with ITD only. The localization of amplitude-panned virtual sources is revisited in this study. Modern knowledge of spatial hearing and the use of digital computers provide a new framework for understanding the underlying mecha- nisms in the perception of virtual sources. The method of amplitude panning is of interest in audio engineering since it is the most used panning method. In spatial hearing research it is of interest because it may produce directional cues that are not necessarily consistent. The way humans assess weights to these cues, which suggest multiple directions, reflects something about the func- tioning of human spatial hearing. An important feature is: which auditory cues do listeners rely on most when inconsistent cues are present? One application for which the study of virtual source localization is of great interest is three-dimensional sound in headphone, stereophonic, or multichannel lis- J Audio Eng Soc, Vol 49, No 9, 2001 September 739
Transcript of Localization of Amplitude-Panned Virtual Sources I: Stereophonic...
PAPERS
Localization of Amplitude-Panned Virtual Sources I: Stereophonic Panning*
VILLE PULKKI, AES Member, AND MATTI KARJALAINEN, AES Fellow
Laboratory of Acoustics and Audio Signal Processing, Helsinki University of Technology, FIN-02015 HUT, Finland
The localization of amplitude-panned virtual sources is investigated in a stereophonic setup with listening tests and with a model of directional hearing. The interaural time difference (ITD) cue is found to be consistent at low frequencies, which is in agreement with earlier studies. It is also shown that the high-frequency interaural level difference (ILD) cues roughly propose the same directions as low-frequency ITD cues However, the ITD and ILD cues suggest different directions at most frequencies, and both cues deviate from general behavior near 1700 Hz
0 INTRODUCTION
In amplitude panning [1] the same sound signal is applied to two or more loudspeakers equidistant from a listener with appropriate amplitudes. The listener per- ceives an auditory object in a location that does not necessarily coincide with any of the physical sound sources. The perceived auditory object is called a virtual source, or phantom source.
In standard stereophonic listening the amplitude- panned virtual source is localized fairly consistently to the same direction at most frequencies. However, direc- tion perception deviates considerably at some frequen- cies, which can be dependent on the temporal structure of the signal.
The mechanisms producing the localization of a vir- tual source have been explained only at low frequencies. The reasons why high-frequency virtual sources are lo- calized consistently with low-frequency virtual sources have remained unexplained. Also the dependence of di- rection perception on frequency and temporal structure has not been studied.
Leakey [2] conducted listening tests in standard ste- reophonic listening with broad-band and narrow-band speech, noise, and impulses. A perceived virtual source direction was compared with the perceived direction of a real source, and the listener reported whether the real source was to the right or the left of the virtual source. The test was repeated for real sources in multiple direc-
* Manuscript received 2000 October 10; revised 2001 May 17.
tions. He suggested that the virtual source formation at high frequencies was also based on interaural time difference (ITD) cues. He used a shadowless head model to calculate ITDs, similarly as in [3]. However, he did not take into account head shadowing, and he did not monitor other major auditory cues, such as interaural level difference (ILD).
In [4], the results of several similar tests by various scientists are reprinted. The frequency dependence of virtual source localization can be observed in the results. Also, it can be seen that the different temporal structures of sound signals affect localization as well. The models that were presented to explain the performance of test subjects were applicable with low frequencies and with ITD only.
The localization of amplitude-panned virtual sources is revisited in this study. Modern knowledge of spatial hearing and the use of digital computers provide a new framework for understanding the underlying mecha- nisms in the perception of virtual sources. The method of amplitude panning is of interest in audio engineering since it is the most used panning method. In spatial hearing research it is of interest because it may produce directional cues that are not necessarily consistent. The way humans assess weights to these cues, which suggest multiple directions, reflects something about the func- tioning of human spatial hearing. An important feature is: which auditory cues do listeners rely on most when inconsistent cues are present?
One application for which the study of virtual source localization is of great interest is three-dimensional sound in headphone, stereophonic, or multichannel lis-
J Audio Eng Soc, Vol 49, No 9, 2001 September 739
PULKKI AND KARJALAINEN PAPERS
tening. The problem investigated in the present paper is closely related to this field.
In this paper the perceived direction of amplitude- panned virtual sources is studied in a stereophonic loud- speaker setup. A set of listening tests is reported in which the subjects adjusted narrow- or broad-band vir- tual sources to find the best direction match to a known real source Phenomena existing in the listening test results are explained using a computational model of direction perception. The results with a specific listening test setup are generalized using the model of spatial hearing. A theory of human spatial hearing mechanisms and a theory of amplitude panning are reported in Section 1. A model of virtual source direction perception is pre- sented in Section 2. The methodology of the listening tests and simulations that were conducted is reviewed in Section 3. The results are reported and interpreted in Section 4.
In a companion paper amplitude panning with arbi- trary two- or three-loudspeaker setups is investigated [5], where listening test results and their analysis with the auditory model are reported. The results are not included in this paper because the localization of virtual sources in such setups may rely on different localization mechanisms than those considered in the present paper.
1 THEORY
1.1 Spatial Hearing Spatial and directional hearing have been studied in-
tensively. For overviews see, for example, [4] or [6]. In this study loudspeaker listening is of interest; thus the scope is limited to far-field localization mechanisms. The duplex theory of sound localization states that the two main cues of sound source localization are the in- teraural time difference (ITD) and the interaural level difference (ILD), which are caused by the wave propaga- tion time difference (primarily below 1.5 kHz) and the shadowing effect by the head (primarily above 1.5 kHz), respectively. The auditory system decodes the cues in a frequency-dependent manner. The ITD is decoded as a shift of carrier signals primarily below 1.5 kHz, and as a shift of envelopes primarily above 1.5 kHz [4].
In spatial hearing an important concept is the cone of confusion. The cone is defined as a set of points which all satisfy the following condition: the difference of the distances from both ears to any point on the cone is constant When a sound source is shifted within a cone
~.,of confusion, ITD and ILD remain constant, although there might be some frequency-dependent changes in ILD [7]. A cone of confusion can be approximated by a cone having its axis of symmetry along a line passing through the listener's ears and having the apex in the centerpoint between the listener's ears. Direction per- ception within a cone of confusion is refined using other effects, such as spectral cues and head rotation Spectral cues and head rotation are considered to carry elevation and f ront -back information.
In spatial sound reproduction, a sound source may be perceived at a location within the confusion cone other
than where it was intended. The most common problems are front-to-back and back-to-front confusions.
Both main cues of spatial hearing are decoded across the audible spectral range. However, the relative impor- tance of the cues is unclear. Wightman and Kistler [8] have proposed that when the cues are distorted, the audi- tory mechanism uses the cue that is most consistent. A cue is consistent if it suggests the same direction in a broad frequency band.
1.2 Amplitude Panning Amplitude panning (also known as intensity panning)
is the most frequently used panning method. Two or more loudspeakers are placed in different directions and at equal distances from the listener. The same sound signal x( t ) is applied to each loudspeaker with different amplitudes, which can be formulated as
x i ( t ) = g?c( t ) , i = 1 , 2 . . . . N (1)
where xi( t ) is the signal to be applied to loudspeaker i, gi is the gain factor of the corresponding channel, t is the time variable, and N is the number of loudspeakers. When the sound signal from each loudspeaker arrives at each ear, the signals are summed at the ear canals, forming new signals. The attributes of these signals specify the perceived localization. This is called sum- ming localization [4].
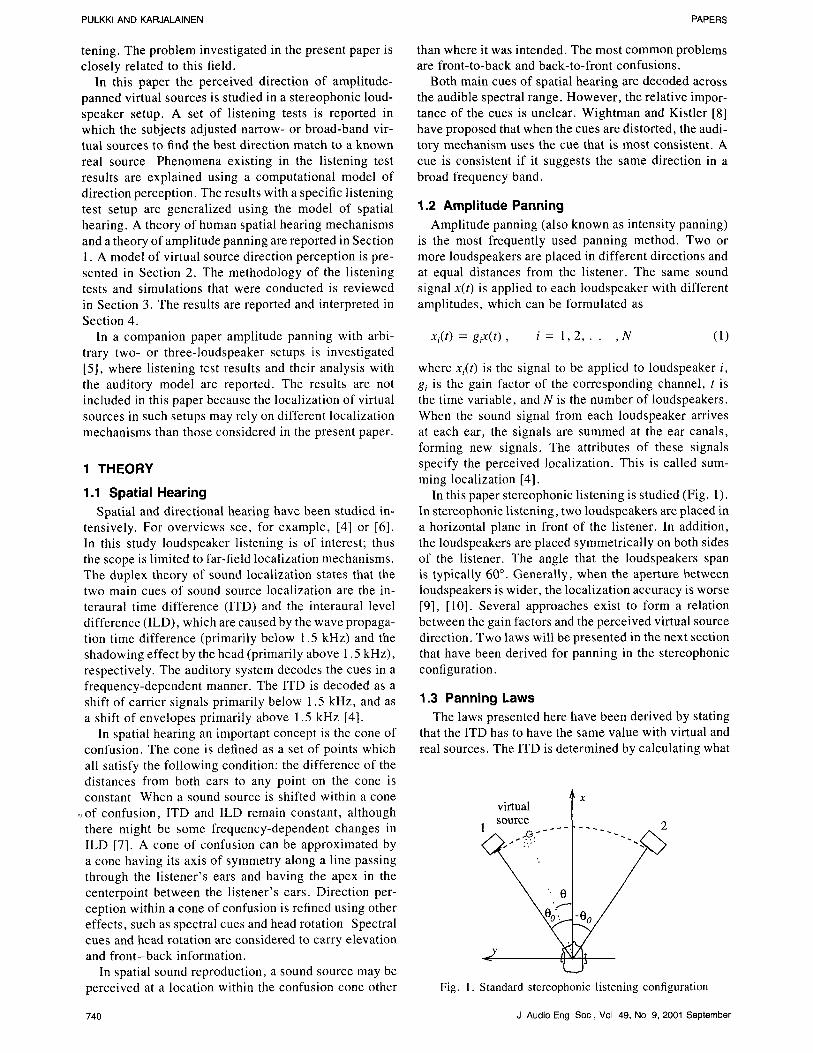
In this paper stereophonic listening is studied (Fig. 1). In stereophonic listening, two loudspeakers are placed in a horizontal plane in front of the listener. In addition, the loudspeakers are placed symmetrically on both sides of the listener. The angle that the loudspeakers span is typically 60 ~ . Generally, when the aperture between loudspeakers is wider, the localization accuracy is worse [9], [10]. Several approaches exist to form a relation between the gain factors and the perceived virtual source direction. Two laws will be presented in the next section that have been derived for panning in the stereophonic configuration.
1.3 Panning Laws The laws presented here have been derived by stating
that the ITD has to have the same value with virtual and real sources. The ITD is determined by calculating what
Fig. 1. Standard stereophonic listening configuration
740 J Audio Eng Soc, Vol 49, No 9, 2001 September
PAPERS STEREOPHONIC PANNING
will appear at a listener's ears when both loudspeaker signals arrive at each ear. The sound signal from the contralateral loudspeaker reaching one ear is delayed when compared with the signal arriving from the ipsilat- eral loudspeaker. The signals are therefore summed to- gether having different phases. The phase of the re- sulting signal in each ear is different. This produces ITD between the ears. The amplitude difference between loudspeaker signals is therefore converted to the ITD between ear signals.
In the first model the listener's hbad is approximated by two spaced ears with no acoustic shadow from the head. The complex behavior of the sound waves near the head is not taken into account. Therefore the law is an approximation that is valid only at low frequencies and only for ITD. In the derivation of these laws, the ILD cue is not taken into account at all.
Bauer [3] derived the sine law for setups in which the listener is situated symmetrically between the loud- speakers and facing along the x axis, as shown in Fig. 1,
sin 0s _ g= - g2 ( 2 )
sin 00 gl + g2
where 0 s is the perceived azimuth angle of a virtual source and 00 is the loudspeaker base angle, as defined in Fig. 1.
Bennett et al. [ 10] derived a panning law by improving the head model used in the derivation of the sine law by approximating the propagation path from the contra- lateral loudspeaker to the ear with a curved line around the head. They ended up with a law that had been pro- posed earlier in [ 1 !] for different listening conditions,
t anOT_ gl - g2
tan 0o gl + g2 (3)
where 0 x is the perceived angle of a virtual source and the other variables are the same as in the sine law. Both laws behave similarly. If 00 = 30 ~ the laws propose values for 0s and 0T that deviate by maximally 1.7 ~ from each other, regardless of the gain factors.
This paper originated from the problem of evaluating the quality of the spatial attributes of virtual sources created using the vector base amplitude panning (VBAP) method [12]. VBAP is a reformulation of the tangent law, which can be generalized to three-dimensional loudspeaker setups.
2 COMPUTATIONAL MODEL OF DIRECTION PERCEPTION
To simulate the perception of virtual sources, a binau- ral auditory model was used in this study to calculate the localization cues for the audio signals arriving at the ear canals, similarly as in [13], [14]. Recent research on auditory models and the rapid progress in digital computing provided powerful facilities to simulate the mechanisms of directional hearing more accurately.
However, some simplifications must be tolerated since
some parts of auditory perception are not understood well enough. In this study we have restricted our scope by eliminating the influence of the precedence effect as much as possible so that it does not have to be modeled. The precedence effect [4], [15] is an assisting mecha- nism of spatial hearing. It is a suppression of early de- layed versions of the direct sound in source direction perception.
When the model lacks the precedence effect, it gives reliable results only if all incidents of a sound signal arrive at the ears within about a 1-ms time window. This can only be achieved in anechoic conditions, since in all rooms there exist reflections and reverberation that violate the 1-ms window. Qualitatively the results are also valid in moderately reverberant conditions.
The model of auditory localization used in this study consists of the following parts:
�9 Simulation of ear canal signals with measured head- related transfer functions (HRTFs)
�9 Binaural model of neural decoding of directional cues �9 Model of high-level perceptual processing.
Since the use of the model is described elsewhere [ 16], it is discussed here only briefly.
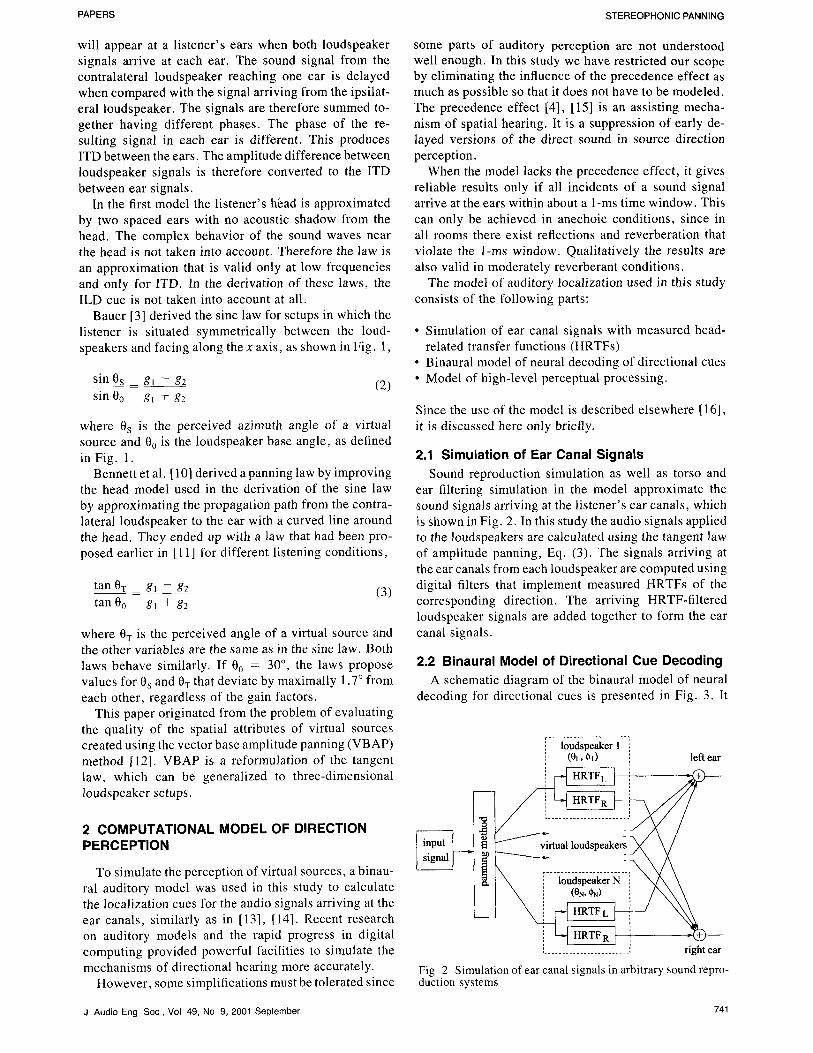
2.1 Simulation of Ear Canal Signals Sound reproduction simulation as well as torso and
ear filtering simulation in the model approximate the sound signals arriving at the listener's ear canals, which is shown in Fig. 2. In this study the audio signals applied to the loudspeakers are calculated using the tangent law of amplitude panning, Eq. (3). The signals arriving at the ear canals from each loudspeaker are computed using digital filters that implement measured HRTFs of the corresponding direction. The arriving HRTF-filtered loudspeaker signals are added together to form the ear canal signals.
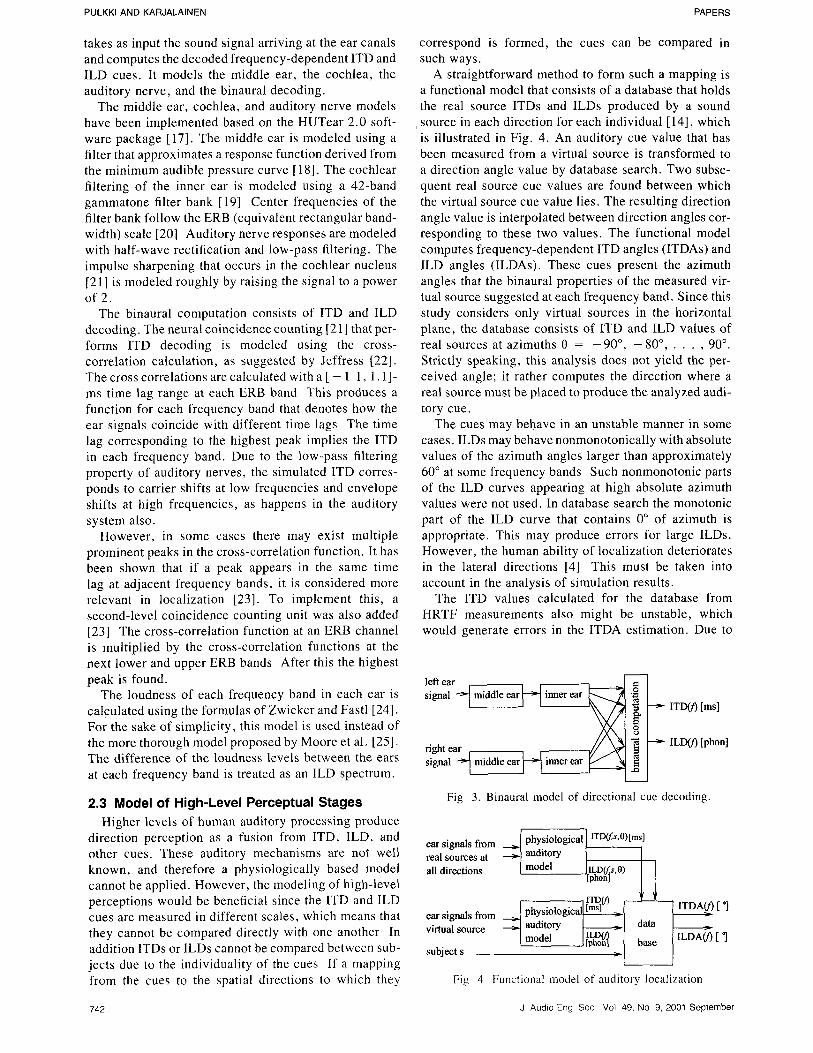
2.2 Binaural Model of Directional Cue Decoding A schematic diagram of the binaural model of neural
decoding for directional cues is presented in Fig. 3. It
,r . . . . . . . . . . . . . . . . . . . . . . ]
,, l o u d s p e a k e r 1 ', (01, (~l) left e a r
', . . . . . . . . . . . . . . . . . . . . . . . . . r i g h t e a r
Fig 2 Simulation of ear canal signals in arbitrary sound repro- duction systems
J Audio Eng Soc, Vol 49, No 9, 2001 September 741
PULKKI AND KARJALAINEN PAPERS
takes as input the sound signal arriving at the ear canals and computes the decoded frequency-dependent ITD and ILD cues. It models the middle ear, the cochlea, the auditory nerve, and the binaural decoding.
The middle ear, cochlea, and auditory nerve models have been implemented based on the HUTear 2.0 soft- ware package [17]. The middle ear is modeled using a filter that approximates a response function derived from the minimum audible pressure curve [ 18]. The cochlear filtering of the inner ear is modeled using a 42-band gammatone filter bank [19] Center frequencies of the filter bank follow the ERB (equivalent rectangular band- width) scale [20] Auditory nerve responses are modeled with half-wave rectification and low-pass filtering. The impulse sharpening that occurs in the cochlear nucleus [21 ] is modeled roughly by raising the signal to a power of 2.
The binaural computation consists of ITD and ILD decoding. The neural coincidence counting [21 ] that per- forms ITD decoding is modeled using the cross- correlation calculation, as suggested by Jeffress [22]. The cross correlations are calculated with a [ - 1 1, 1.1]- ms time lag range at each ERB band This produces a function for each frequency band that denotes how the ear signals coincide with different time lags The time lag corresponding to the highest peak implies the ITD in each frequency band. Due to the low-pass filtering property of auditory nerves, the simulated ITD corres- ponds to carrier shifts at low frequencies and envelope shifts at high frequencies, as happens in the auditory system also.
However, in some cases there may exist multiple prominent peaks in the cross-correlation function. It has been shown that if a peak appears in the same time lag at adjacent frequency bands, it is considered more relevant in localization [23]. To implement this, a second-level coincidence counting unit was also added [23] The cross-correlation function at an ERB channel is multiplied by the cross-correlation functions at the next lower and upper ERB bands After this the highest peak is found.
The loudness of each frequency band in each ear is calculated using the formulas of Zwicker and Fastl [24]. For the sake of simplicity, this model is used instead of the more thorough model proposed by Moore et al. [25]. The difference of the loudness levels between the ears at each frequency band is treated as an ILD spectrum.
2.3 Model of High-Level Perceptual Stages Higher levels of human auditory processing produce
direction perception as a fusion from ITD, ILD, and other cues. These auditory mechanisms are not well known, and therefore a physiologically based model cannot be applied. However, the modeling of high-level perceptions would be beneficial since the ITD and ILD cues are measured in different scales, which means that they cannot be compared directly with one another In addition ITDs or ILDs cannot be compared between sub- jects due to the individuality of the cues If a mapping from the cues to the spatial directions to which they
correspond is formed, the cues can be compared in such ways.
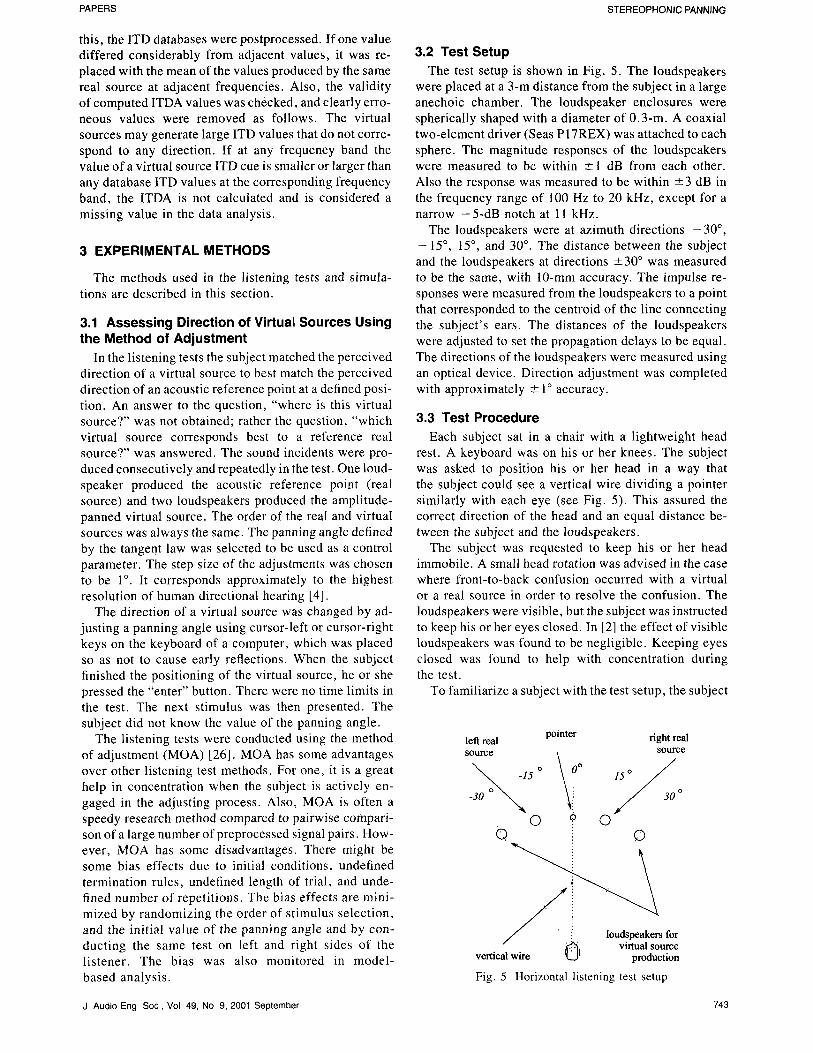
A straightforward method to form such a mapping is a functional model that consists of a database that holds the real source ITDs and ILDs produced by a sound
, source in each direction for each individual [ 14], which is illustrated in Fig. 4. An auditory cue value that has been measured from a virtual source is transformed to a direction angle value by database search. Two subse- quent real source cue values are found between which the virtual source cue value lies. The resulting direction angle value is interpolated between direction angles cor- responding to these two values. The functional model computes frequency-dependent ITD angles (ITDAs) and ILD angles (ILDAs). These cues present the azimuth angles that the binaural properties of the measured vir- tual source suggested at each frequency band. Since this study considers only virtual sources in the horizontal plane, the database consists of ITD and ILD values of real sources at azimuths 0 = - 9 0 ~ - 8 0 ~ . . . . 90 ~ Strictly speaking, this analysis does not yield the per- ceived angle; it rather computes the direction where a real source must be placed to produce the analyzed audi- tory cue.
The cues may behave in an unstable manner in some cases. ILDs may behave nonmonotonically with absolute values of the azimuth angles larger than approximately 60 ~ at some frequency bands Such nonmonotonic parts of the ILD curves appearing at high absolute azimuth values were not used. In database search the monotonic part of the ILD curve that contains 0 ~ of azimuth is appropriate. This may produce errors for large ILDs. However, the human ability of localization deteriorates in the lateral directions [4] This must be taken into account in the analysis of simulation results.
The ITD values calculated for the database from HRTF measurements also might be unstable, which would generate errors in the ITDA estimation. Due to
:ie~le~r'-~ middle ear ~ ! ~'
right ear . . / / signal -~ middle ear H inner ear ~ ~ !
ITD(D [ms]
ILD(D [phon]
Fig 3. Binaural model of directional cue decoding.
[ physiological ITD(,(s,0)[ms] ear signals from :,_:,,_ au&tory realall directionsS~ at model , ILD~s,0)
[phon]
Ixo0O l a t a ~ [ p h y s i o l o g i c a ~ - ear signals from auditory [---------~/
virtual sourCesubject s model [~pL~ / ~ase ]
Fig 4 Functional model of auditory localization
ITDA0O [ o]
ILDA~) [ *J
742 J Audio Eng Soc Vol 49, No 9, 2001 September
PAPERS STEREOPHONIC PANNING
this, the ITD databases were postprocessed. I f one value differed considerably from adjacent values, it was re- placed with the mean of the values produced by the same real source at adjacent frequencies. Also, the validity of computed ITDA values was checked, and clearly erro- neous values were removed as follows. The virtual sources may generate large ITD values that do not corre- spond to any direction. If at any frequency band the value of a virtual source ITD cue is smaller or larger than any database ITD values at the corresponding frequency band, the ITDA is not calculated and is considered a missing value in the data analysis.
3 EXPERIMENTAL METHODS
The methods used in the listening tests and simula- tions are described in this section.
3.1 Assessing Direction of Virtual Sources Using the Method of Adjustment
In the listening tests the subject matched the perceived direction of a virtual source to best match the perceived direction of an acoustic reference point at a defined posi- tion. An answer to the question, "where is this virtual source?" was not obtained; rather the question, "which virtual source corresponds best to a reference real source?" was answered. The sound incidents were pro- duced consecutively and repeatedly in the test. One loud- speaker produced the acoustic reference point (real source) and two loudspeakers produced the amplitude- panned virtual source. The order of the real and virtual sources was always the same. The panning angle defined by the tangent law was selected to be used as a control parameter. The step size of the adjustments was chosen to be 1 ~ It corresponds approximately to the highest resolution of human directional hearing [4].
The direction of a virtual source was changed by ad- justing a panning angle using cursor-left or cursor-right keys on the keyboard of a computer, which was placed so as not to cause early reflections. When the subject finished the positioning of the virtual source, he or she pressed the "enter" button. There were no time limits in the test. The next stimulus was then presented. The subject did not know the value of the panning angle.
The listening tests were conducted using the method of adjustment (MOA) [26]. MOA has some advantages over other listening test methods. For one, it is a great help in concentration when the subject is actively en- gaged in the adjusting process. Also, MOA is often a speedy research method compared to pairwise compari- son of a large number of preprocessed signal pairs. How- ever, MOA has some disadvantages. There might be some bias effects due to initial conditions, undefined termination rules, undefined length of trial, and unde- fined number of repetitions. The bias effects are mini- mized by randomizing the order of stimulus selection, and the initial value of the panning angle and by con- ducting the same test on left and right sides of the listener. The bias was also monitored in model- based analysis.
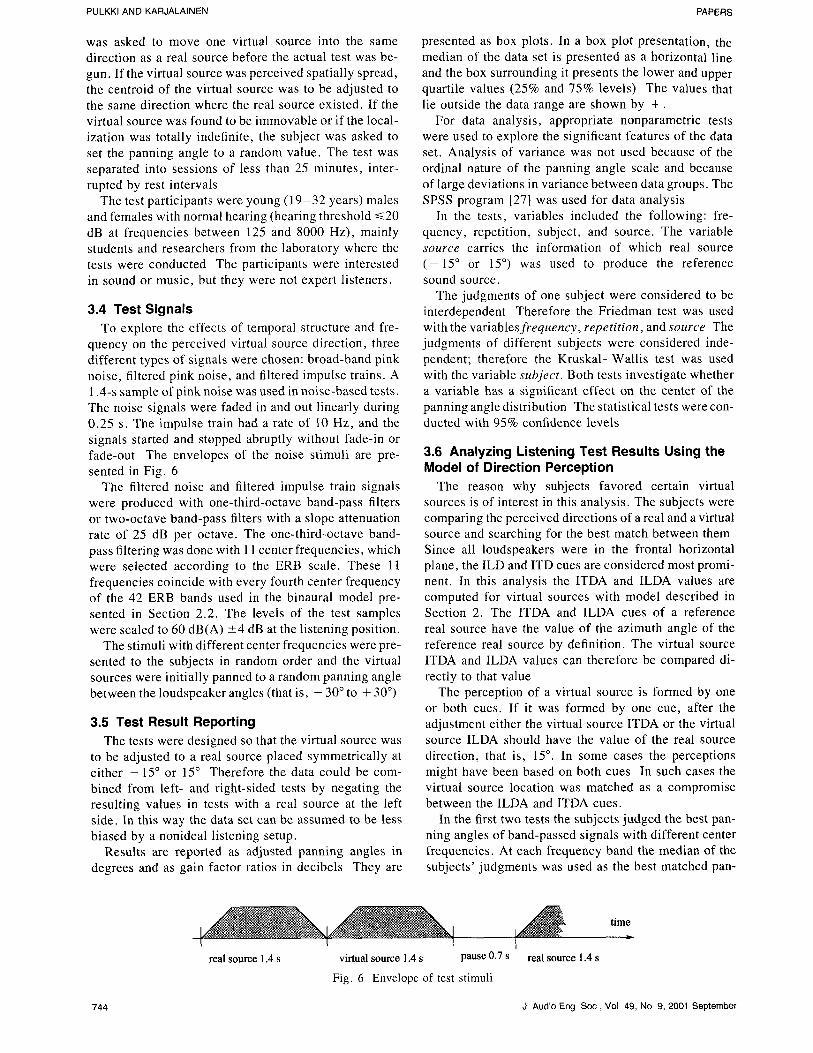
3.2 Tes t Se tup
The test setup is shown in Fig. 5. The loudspeakers were placed at a 3-m distance from the subject in a large anechoic chamber. The loudspeaker enclosures were spherically shaped with a diameter of 0.3-m. A coaxial two-element driver (Seas P17REX) was attached to each sphere. The magnitude responses of the loudspeakers were measured to be within -+ 1 dB from each other. Also the response was measured to be within -+3 dB in the frequency range of 100 Hz to 20 kHz, except for a narrow - 5 - d B notch at 11 kHz.
The loudspeakers were at azimuth directions - 3 0 ~ - 15 ~ 15 ~ and 30 ~ The distance between the subject and the loudspeakers at directions -+30 ~ was measured to be the same, with 10-mm accuracy. The impulse re- sponses were measured from the loudspeakers to a point that corresponded to the centroid of the line connecting the subject's ears. The distances of the loudspeakers were adjusted to set the propagation delays to be equal. The directions of the loudspeakers were measured using an optical device. Direction adjustment was completed with approximately -+ 1 ~ accuracy.
3.3 Test Procedure Each subject sat in a chair with a lightweight head
rest. A keyboard was on his or her knees. The subject was asked to position his or her head in a way that the subject could see a vertical wire dividing a pointer similarly with each eye (see Fig. 5). This assured the correct direction of the head and an equal distance be- tween the subject and the loudspeakers.
The subject was requested to keep his or her head immobile. A small head rotation was advised in the case where front-to-back confusion occurred with a virtual or a real source in order to resolve the confusion. The loudspeakers were visible, but the subject was instructed to keep his or her eyes closed. In [2] the effect of visible loudspeakers was found to be negligible. Keeping eyes closed was found to help with concentration during the test.
To familiarize a subject with the test setup, the subject
left real pointer right real source s o u r c e
_o~,5o ~;o f15~ -30 / 30 o
~ ' ou peak rs for virtue| source
vertical wire ~Jl production
Fig. 5 Horizontal listening test setup
J Audio Eng Soc, Vol 49, No 9, 2001 September 743
PULKKI AND KARJALAINEN PAPERS
was asked to move one virtual source into the same direction as a real source before the actual test was be- gun. If the virtual source was perceived spatially spread, the centroid of the virtual source was to be adjusted to the same direction where the real source existed. If the virtual source was found to be immovable or if the local- ization was totally indefinite, the subject was asked to set the panning angle to a random value. The test was separated into sessions of less than 25 minutes, inter- rupted by rest intervals
The test participants were young (19-32 years) males and females with normal hearing (hearing threshold ~<20 dB at frequencies between 125 and 8000 Hz), mainly students and researchers from the laboratory where the tests were conducted The participants were interested in sound or music, but they were not expert listeners.
3.4 Test Signals To explore the effects of temporal structure and fre-
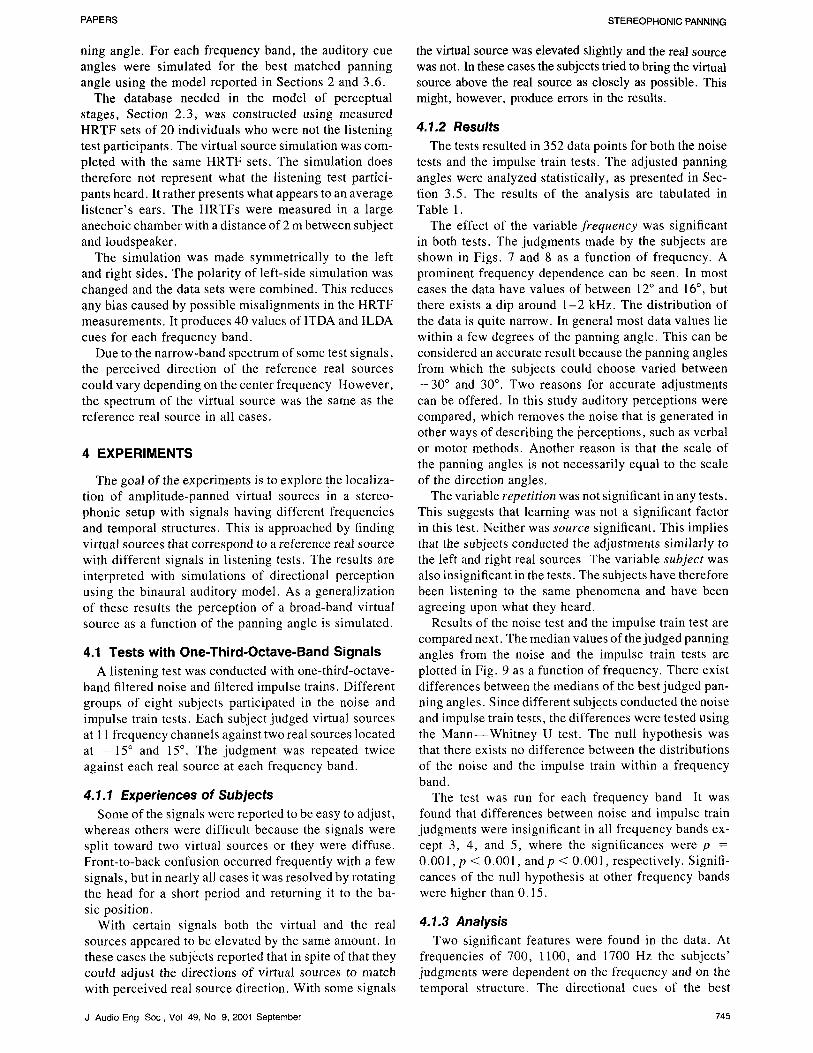
quency on the perceived virtual source direction, three different types of signals were chosen: broad-band pink noise, filtered pink noise, and filtered impulse trains. A 1.4-s sample of pink noise was used in noise-based tests. The noise signals were faded in and out linearly during 0.25 s. The impulse train had a rate of 10 Hz, and the signals started and stopped abruptly without fade-in or fade-out The envelopes of the noise stimuli are pre- sented in Fig. 6
The filtered noise and filtered impulse train signals were produced with one-third-octave band-pass filters or two-octave band-pass filters with a slope attenuation rate of 25 dB per octave. The one-third-octave band- pass filtering was done with 11 center frequencies, which were selected according to the ERB scale. These 11 frequencies coincide with every fourth center frequency of the 42 ERB bands used in the binaural model pre- sented in Section 2.2. The levels of the test samples were scaled to 60 dB(A) +4 dB at the listening position.
The stimuli with different center frequencies were pre- sented to the subjects in random order and the virtual sources were initially panned to a random panning angle between the loudspeaker angles (that is, - 30 ~ to + 30 ~
3.5 Test Result Reporting The tests were designed so that the virtual source was
to be adjusted to a real source placed symmetrically at either - 15 ~ or 15 ~ Therefore the data could be com- bined from left- and right-sided tests by negating the resulting values in tests with a real source at the left side. In this way the data set can be assumed to be less biased by a nonideal listening setup.
Results are reported as adjusted panning angles in degrees and as gain factor ratios in decibels They are
presented as box plots. In a box plot presentation, the median of the data set is presented as a horizontal line and the box surrounding it presents the lower and upper quartile values (25% and 75% levels) The values that lie outside the data range are shown by + .
For data analysis, appropriate nonparametric tests were used to explore the significant features of the data set. Analysis of variance was not used because of the ordinal nature of the panning angle scale and because of large deviations in variance between data groups. The SPSS program [27] was used for data analysis
In the tests, variables included the following: fre- quency, repetition, subject, and source. The variable source carries the information of which real source ( - 1 5 ~ or 15 ~ ) was used to produce the reference sound source.
The judgments of one subject were considered to be interdependent Therefore the Friedman test was used with the variablesfi 'equency, repeti t ion, and source The judgments of different subjects were considered inde- pendent; therefore the Kruskal-Wallis test was used with the variable subject. Both tests investigate whether a variable has a significant effect on the center of the panning angle distribution The statistical tests were con- ducted with 95% confidence levels
3.6 Analyzing Listening Test Results Using the Model of Direction Perception
The reason why subjects favored certain virtual sources is of interest in this analysis. The subjects were comparing the perceived directions of a real and a virtual source and searching for the best match between them Since all loudspeakers were in the frontal horizontal plane, the ILD and ITD cues are considered most promi- nent. In this analysis the ITDA and ILDA values are computed for virtual sources with model described in Section 2. The ITDA and ILDA cues of a reference real source have the value of the azimuth angle of the reference real source by definition. The virtual source ITDA and ILDA values can therefore be compared di- rectly to that value
The perception of a virtual source is formed by one or both cues. If it was formed by one cue, after the adjustment either the virtual source ITDA or the virtual source ILDA should have the value of the real source direction, that is, 15 ~ . In some cases the perceptions might have been based on both cues In such cases the virtual source location was matched as a compromise between the ILDA and ITDA cues.
In the first two tests the subjects judged the best pan- ning angles of band-passed signals with different center frequencies. At each frequency band the median of the subjects' judgments was used as the best matched pan-
real source 1.4 s vir tual source 1.4 s p a u s e 0 .7 s
Fig. 6 Envelope of test stimuli
t ime
I real source 1.4 s
744 J Audio Eng Soc, Vol 49, No 9, 2001 September
PAPERS STEREOPHONIC PANNING
ning angle. For each frequency band, the auditory cue angles were simulated for the best matched panning angle using the model reported in Sections 2 and 3.6.
The database needed in the model of perceptual stages, Section 2.3, was constructed using measured HRTF sets of 20 individuals who were not the listening test participants. The virtual source simulation was com- pleted with the same HRTF sets. The simulation does therefore not represent what the listening test partici- pants heard. It rather presents what appears to an average listener's ears. The HRTFs were measured in a large anechoic chamber with a distance of 2 m between subject and loudspeaker.
The simulation was made symmetrically to the left and right sides. The polarity of left-side simulation was changed and the data sets were combined. This reduces any bias caused by possible misalignments in the HRTF measurements. It produces 40 values of ITDA and ILDA cues for each frequency band.
Due to the narrow-band spectrum of some test signals, the perceived direction of the reference real sources could vary depending on the center frequency However, the spectrum of the virtual source was the same as the reference real source in all cases.
4 EXPERIMENTS
The goal of the experiments is to explore the localiza- tion of amplitude-panned virtual sources in a stereo- phonic setup with signals having different frequencies and temporal structures. This is approached by finding virtual sources that correspond to a reference real source with different signals in listening tests. The results are interpreted with simulations of directional perception using the binaural auditory model. As a generalization of these results the perception of a broad-band virtual source as a function of the panning angle is simulated.
4.1 Tests with One-Third-Octave-Band Signals A listening test was conducted with one-third-octave-
band filtered noise and filtered impulse trains. Different groups of eight subjects participated in the noise and impulse train tests. Each subject judged virtual sources at 11 frequency channels against two real sources located at - 1 5 ~ and 15 ~ The judgment was repeated twice against each real source at each frequency band.
4.1.1 Experiences of Subjects Some of the signals were reported to be easy to adjust,
whereas others were difficult because the signals were split toward two virtual sources or they were diffuse. Front-to-back confusion occurred frequently with a few signals, but in nearly all cases it was resolved by rotating the head for a short period and returning it to the ba- sic position.
With certain signals both the virtual and the real sources appeared to be elevated by the same amount. In these cases the subjects reported that in spite of that they could adjust the directions of virtual sources to match with perceived real source direction. With some signals
the virtual source was elevated slightly and the real source was not. In these cases the subjects tried to bring the virtual source above the real source as closely as possible. This might, however, produce errors in the results.
4.1.2 Results The tests resulted in 352 data points for both the noise
tests and the impulse train tests. The adjusted panning angles were analyzed statistically, as presented in Sec- tion 3.5. The results of the analysis are tabulated in Table 1.
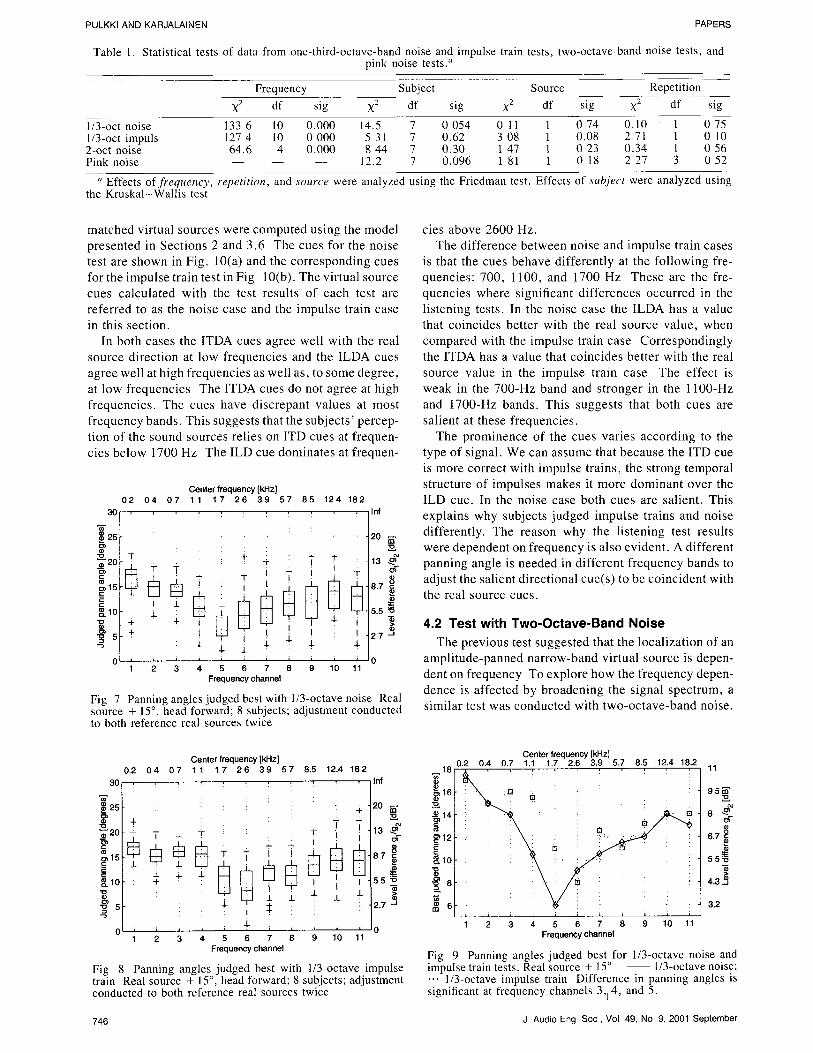
The effect of the variable frequency was significant in both tests. The judgments made by the subjects are shown in Figs. 7 and 8 as a function of frequency. A prominent frequency dependence can be seen. In most cases the data have values of between 12 ~ and 16 ~ , but there exists a dip around 1 - 2 kHz. The distribution of the data is quite narrow. In general most data values lie within a few degrees of the panning angle. This can be considered an accurate result because the panning angles from which the subjects could choose varied between - 3 0 ~ and 30 ~ Two reasons for accurate adjustments can be offered. In this study auditory perceptions were compared, which removes the noise that is generated in other ways of describing the igerceptions, such as verbal or motor methods. Another reason is that the scale of the panning angles is not necessarily equal to the scale of the direction angles.
The variable repetition was not significant in any tests. This suggests that learning was not a significant factor in this test. Neither was source significant. This implies that the subjects conducted the adjustments similarly to the left and right real sources The variable subject was also insignificant in the tests. The subjects have therefore been listening to the same phenomena and have been agreeing upon what they heard.
Results of the noise test and the impulse train test are compared next. The median values of the judged panning angles from the noise and the impulse train tests are plotted in Fig. 9 as a function of frequency. There exist differences between the medians of the best judged pan- ning angles. Since different subjects conducted the noise and impulse train tests, the differences were tested using the Mann- -Whi tney U test. The null hypothesis was that there exists no difference between the distributions of the noise and the impulse train within a frequency band.
The test was run for each frequency band It was found that differences between noise and impulse train judgments were insignificant in all frequency bands ex- cept 3, 4, and 5, where the significances were p = 0.001, p < 0.001, andp < 0.001, respectively. Signifi- cances of the null hypothesis at other frequency bands were higher than 0.15.
4.1.3 Analysis Two significant features were found in the data. At
frequencies of 700, 1100, and 1700 Hz the subjects' judgments were dependent on the frequency and on the temporal structure. The directional cues of the best
J Audio Eng Soc, Vol 49, No 9, 2001 September 745
PULKKI AND KARJALAINEN PAPERS
Table 1. Statistical tests of data from one-third-octave-band noise and impulse train tests, two-octave-band noise tests, and pink noise tests#
Frequency Subject Source Repetition
X 2 df sig • df sig X 2 df sig • df sig
1/3-oct noise 133 6 10 0.000 14.5 7 0 054 0 11 1 0 74 0.10 ' 1 0 75 1/3-oct impuls 127 4 10 0 000 5 31 7 0.62 3 08 1 0.08 2 71 1 0 10 2-oct noise 64.6 4 0.000 8 44 7 0.30 1 47 1 0 23 0,34 l 0 56 Pink noise - - - - - - 12.2 7 0.096 1 81 1 0 18 2 27 3 0 52
" Effects of frequency, repetition, and source were analyzed using the Friedman test. Effects of subject were analyzed using the Kruskal-Wallis test
matched virtual sources were computed using the model presented in Sections 2 and 3.6 The cues for the noise test are shown in Fig. 10(a) and the corresponding cues for the impulse train test in Fig 10(b). The virtual source cues calculated with the test results of each test are referred to as the noise case and the impulse train case
in this section. In both cases the ITDA cues agree well with the real
source direction at low frequencies and the ILDA cues
agree well at high frequencies as well as, to some degree, at low frequencies The ITDA cues do not agree at high
frequencies. The cues have discrepant values at most frequency bands. This suggests that the subjects ' percep- tion of the sound sources relies on ITD cues at frequen- cies below 1700 Hz The ILD cue dominates at frequen-
3O
e~ 25
~1o
0
02 04 0 7
!
I 4-
- t -
i i
1 2
! +
i
3
Center frequency [kHz] 11 1 7 2 6 3 9 57 85
" I -
I
! ' .L ~- 4- .L
i i i i
4 5 6 7 8 Frequency channel
T
J.
i
9
124 182 ! Inf
20 m
T 13
8.7 ~
- . 5.5 ~
2 7 ~ a-
i i
10 11
Fig 7 Panning angles judged best with 1/3-octave noise Real source + 15 ~ head forward; 8 subjects; adjustment conducted to both reference real sources twice
3O
25
~1o
0,2
+
Center frequency [kHz] 04 07 11
• 4 l +
i
2 3 4
17 26 39 57
i J
5 6 7 8 Frequency channel
8.5 12.4 182 ! / Inf
]20 ~'
5- ! 13 i e -
�9 i t s s 2 ! /
i ; JO ] 2'7 ''a
9 10 11
Fig 8 Panning angles judged best with 1/3-octave impulse train Real source + 15 ~ head forward; 8 subjects; adjustment conducted to both reference real sources twice
cies above 2600 Hz. The difference between noise and impulse train cases
is that the cues behave differently at the following fre- quencies: 700, 1100, and 1700 Hz These are the fre- quencies where significant differences occurred in the l istening tests. In the noise case the ILDA has a value that coincides better with the real source value, when compared with the impulse train case Correspondingly the ITDA has a value that coincides better with the real source value in the impulse train case The effect is weak in the 700-Hz band and stronger in the 1100-Hz and 1700-Hz bands. This suggests that both cues are salient at these frequencies.
The prominence of the cues varies according to the type of signal. We can assume that because the ITD cue is more correct with impulse trains, the strong temporal structure of impulses makes it more dominant over the ILD cue. In the noise case both cues are salient. This explains why subjects judged impulse trains and noise differently. The reason why the l istening test results were dependent on frequency is also evident. A different panning angle is needed in different frequency bands to adjust the salient directional cue(s) to be coincident with the real source cues.
4.2 Test with Two-Octave-Band Noise
The previous test suggested that the localization of an ampli tude-panned narrow-band virtual source is depen- dent on frequency To explore how the frequency depen- dence is affected by broadening the signal spectrum, a similar test was conducted with two-octave-band noise.
1 8
~14 ~12
g~lO
6
Fig 9
Center frequency [kHz] 0.2 0.4 0.7 1.1 1.7 2.6 3.9 5.7 8.5 12.4 18.2 ! ! ! , ! 11
":.. D ; 9 5 ~ ' • .
i ! ! m : 6.7
55~
4.3 ~,
3.2 i i i
4 5 6 7 8 9 10 11 Frequency channel
Panning angles judged best for 1/3-octave noise and impulse train tests. Real source + 15 ~ - - l/3-octave noise; �9 .. 1/3-octave impulse train Difference in panning angles is significant at frequency channels 3,! 4, and 5.
746 J Audio Eng Soc, Vol 49, No 9, 2001 September
PAPERS STEREOPHONIC PANNING
4.2.1 Results The test was conducted with five frequency bands,
which matched frequency bands 1 ,3 . . . . . 9 in the one- third-octave-band noise tests. There were eight subjects; they completed the adjustment twice to each real source, resulting in 160 data points. The subjects were the same as in the one-third-octave-band noise test.
Test results were analyzed statistically, as explained in Section 3.5. The results o f the analysis are shown in Table 1. Similarly to the tests with narrow-band signals, the variables repetition, source, and subject were not significant.
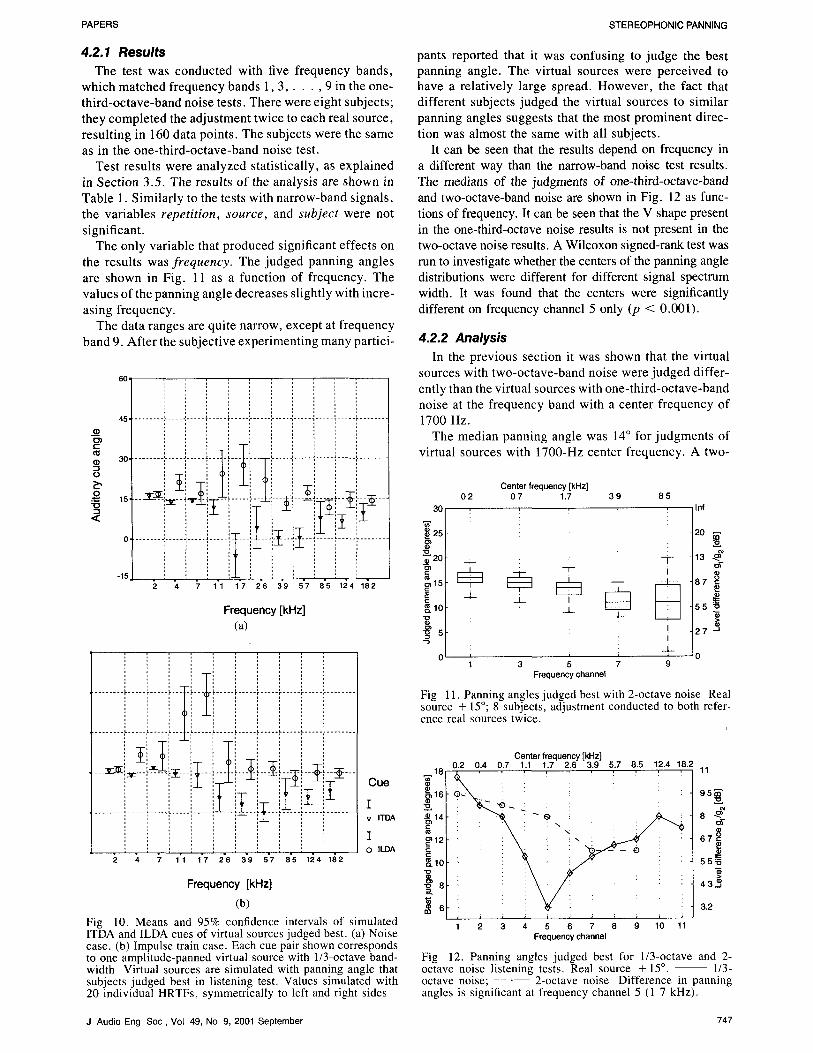
The only variable that produced significant effects on the results was frequency. The judged panning angles are shown in Fig. 11 as a function of frequency. The values of the panning angle decreases slightly with incre- asing frequency.
The data ranges are quite narrow, except at frequency band 9. After the subjective experimenting many partici-
s 0 . . . . . . . . . . ! . . . . . ~ . . . . . ~ . . . . ~ . . . . i - - : . . . . . ~, . . . . . i . . . . . i . . . . . ,~ . . . . . . . .
, . . . . . . . . . . . . . . . . . . . . .
0 . . . . . . . . . . . . . . . . . . . . . . . . . . . . . . . . . . . . i-~-- . . . . . .
- 1 5 ] _L
2 4 7 11 1 7 2 6 3 9 5 7 8 5 124 182
Frequency [kHz] (a)
, , , , , , , , ,
i i i i_l_ i - r~ i i iT-~! i ~
. . .
2 4 7 11 1 7 2 6 3 9 5 7 8 5 124 182
C u e
I v ITDA
I O ILDA
Frequency [kHz]
(b) Fig 10. Means and 95% confidence intervals of simulated ITDA and ILDA cues of virtual sources judged best. (a) Noise case. (b) Impulse train case. Each cue pair shown corresponds to one amplitude-panned virtual source with 1/3-octave band- width Virtual sources are simulated with panning angle that subjects judged best in listening test. Values simulated with 20 individual HRTFs, symmetrically to left and right sides
pants reported that it was confusing to judge the best panning angle. The virtual sources were perceived to have a relatively large spread. However , the fact that different subjects judged the virtual sources to similar panning angles suggests that the most prominent direc- tion was almost the same with all subjects.
It can be seen that the results depend on frequency in a different way than the narrow-band noise test results. The medians of the judgments of one-third-octave-band and two-octave-band noise are shown in Fig. 12 as func- tions of frequency. It can be seen that the V shape present in the one-third-octave noise results is not present in the two-octave noise results. A Wilcoxon signed-rank test was run to investigate whether the centers of the panning angle distributions were different for different signal spectrum width. It was found that the centers were significantly different on frequency channel 5 only (p < 0.001).
4.2.2 Analysis In the previous section it was shown that the virtual
sources with two-octave-band noise were judged differ- ently than the virtual sources with one-third-octave-band noise at the frequency band with a center frequency of 1700 Hz.
The median panning angle was 14 ~ for judgments of virtual sources with 1700-Hz center frequency. A two-
30
25
~20 t~ ~15
10 o .
Center frequency [kHz] 02 07 1.7 39 85
-L
- T -
_i_ i _t_
i
Inf
; I ! i
5 7 9 Frequency channel
0 0
20 Ill
13 or 8 8 7 ~
5 5 ~
2 7 ~
Fig 11. Panning angles judged best with 2-octave noise Real source + 15~ 8 subjects, adjustment conducted to both refer- ence real sources twice.
Center frequency [kHz] 0.2 0.4 0.7 1.1 1.7 2.6 3.9 5.7 8.5 12.4 18.2
1 8 ~ . . k ' ! ' ' : , , 11
~16 E)~. ; 9 5 ~ '
o7
~10 5 5 ~
8 4 3 ~
6 3.2 i i
4 5 6 7 8 9 10 11
Frequency channel
Fig 12. Panning angles judged best for 1/3-octave and 2- octave noise listening tests. Real source + 15 ~ - - 1/3- octave noise; - - . - - 2-octave noise Difference in panning angles is significant at frequency channel 5 (1 7 kHz).
J Audio Eng Soc, Vo[ 49, No 9, 2001 September 747
P U L K K I A N D K A R J A L A I N E N P A P E R S
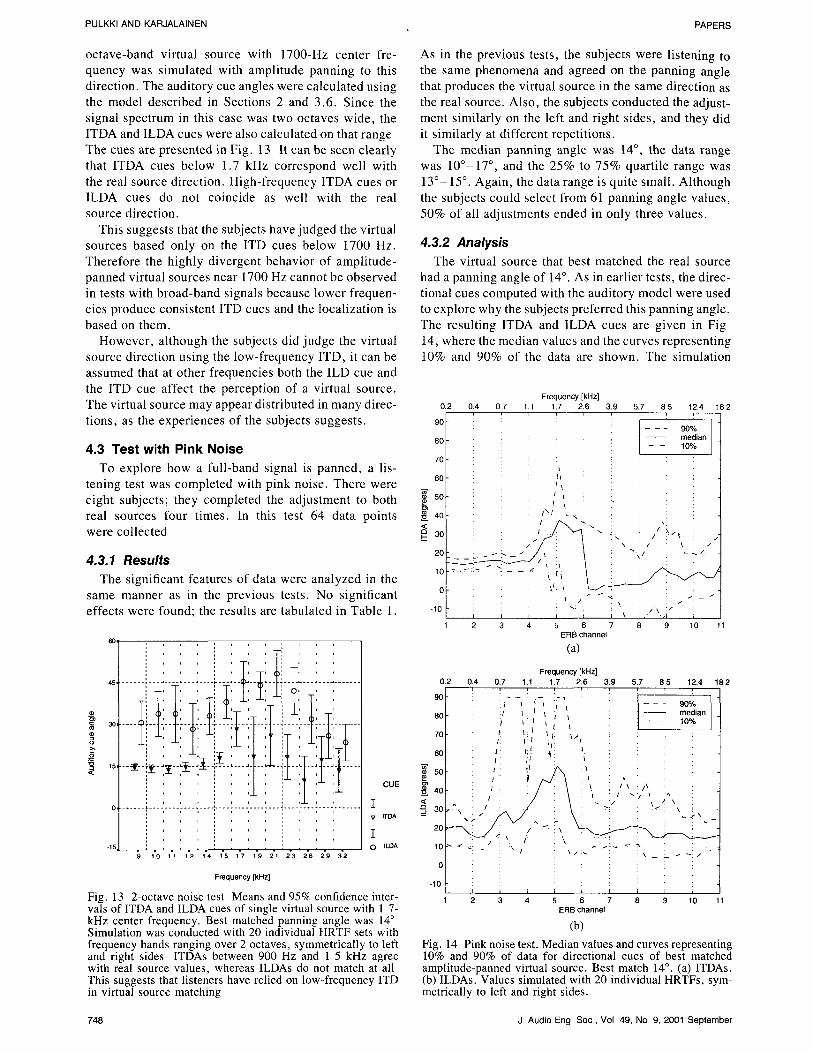
octave-band virtual source with 1700-Hz center fre- quency was s imulated with ampl i tude panning to this direct ion. The audi tory cue angles were ca lcula ted using the model descr ibed in Sections 2 and 3.6. Since the signal spectrum in this case was two octaves wide, the ITDA and ILDA cues were also ca lcula ted on that range The cues are presented in Fig. 13 It can be seen c lear ly that ITDA cues be low 1.7 kHz correspond well with the real source direct ion. High-f requency ITDA cues or 1LDA cues do not coincide as well with the real source direct ion.
This suggests that the subjects have judged the virtual sources based only on the ITD cues be low 1700 Hz. Therefore the h ighly divergent behavior of ampl i tude- panned virtual sources near 1700 Hz cannot be observed in tests with b road-band signals because lower frequen- cies produce consis tent ITD cues and the loca l iza t ion is based on them.
However , a l though the subjects did judge the virtual source direct ion using the low-frequency ITD, it can be assumed that at other f requencies both the ILD cue and the ITD cue affect the percept ion of a vir tual source. The virtual source may appear dis t r ibuted in many direc- t ions, as the exper iences of the subjects suggests .
4.3 Test with Pink Noise To explore how a fu l l -band signal is panned , a l is-
tening test was comple ted with pink noise. There were eight subjects; they comple ted the adjus tment to both real sources four t imes, In this test 64 data points were col lec ted
4.3.1 Results The signif icant features of data were ana lyzed in the
same manner as in the previous tests. No signif icant effects were found; the results are tabulated in Table 1.
60,
45.
o~ =~ 15,
-15
. . . . I ' ' ' : ' ' '
i!!ii!i!ii i! i ii! II i i III 9 10 11 12 14 15 17 19 21 23 26 29 32
CUE
T v ITDA
T O ILDA
Frequency [kHz]
Fig. 13 2-octave noise test Means and 95% confidence inter- vals of ITDA and ILDA cues of single virtual source with 1 7- kHz center frequency. Best matched panning angle was 14 ~ Simulation was conducted with 20 individual HRTF sets with frequency bands ranging over 2 octaves, symmetrically to left and right sides ITDAs between 900 Hz and 1 5 kHz agree with real source values, whereas ILDAs do not match at all This suggests that listeners have relied on low-frequency ITD in virtual source matching
As in the previous tests, the subjects were l istening to the same phenomena and agreed on the panning angle that produces the virtual source in the same direct ion as the real source. Also , the subjects conducted the adjust- ment s imilar ly on the left and r ight sides, and they did it s imilar ly at different repet i t ions .
The median panning angle was 14 ~ , the data range was 10~ ~ , and the 25% to 75% quart i le range was 13 ~ 15 ~ . Again , the data range is quite small . Al though the subjects could select from 61 panning angle values, 50% of all adjustments ended in only three values.
4.3.2 Analysis The virtual source that best matched the real source
had a panning angle of 14 ~ As in ear l ier tests, the direc- t ional cues computed with the audi tory model were used to explore why the subjects prefer red this panning angle. The resul t ing ITDA and ILDA cues are given in Fig 14, where the median values and the curves represent ing 10% and 90% of the data are shown. The s imulat ion
0.2
90
80
70
60
~ 40 <
~ ao
20
10
0
-10
<
fl
Frequency[kHz] 0.4 0 7 1.1 1.7 2.6 182
I i t
1\1: I
/ I .
i tl:
i i i
2 3 4
3.9 5.7 8 5 12.4
median 10%
/ \ �9 J :
i i \ .T \ , i 6 7 8 9 10
ERB channel
(a)
11
Frequency [kHz] 0.2 0.4 0.7 1.1 1.7 2.6 3.9 5.7 8 5 12.4 18 2
90 [- ! " ~ " " " 1
l 80 :1 : median ~ : t ~ i I : - - 10%
70 i I I I f: ~ l: I I i i i
60 Ji L!
I : I I / ~ :~ so ,! ! ~ ~ ii ,
40 I : : : \ ! x : / ~
2 0 3 0 1 0 ^ , :: ~ '~, : , . / / . ! / , 4
o ! i : i :
- l o i : : i i i i i i 3 4 6 7 8 9 10 11
ERB channel
( b )
Fig. 14 Pink noise test. Median values and curves representing 10% and 90% of data for directional cues of best matched amplitude-panned virtual source. Best match 14 ~ (a) ITDAs. (b) ILDAs. Values simulated with 20 individual HRTFs, sym- metrically to left and right sides.
7 4 8 J A u d i o Eng S o c , Vo l 49 , N o 9, 2001 September
PAPERS STEREOPHONIC PANNING
was conducted for 42 ERB channels, but they are labeled in the figure with the 11 frequency band numbers used in the listening tests.
At low frequencies the iTDA cue behaves consis- tently, and it suggests the real source direction at fre- quencies below 1.1 kHz. There exist, however, small oscillations and a slightly increasing trend in the value of the ITDA. At frequencies between 1.1 and 2.6 kHz the ITDA has considerably higher values than the real source direction. At high frequencies the ITDA value deviates by between 0 ~ and 10 ~ The 10% and 90% curves are near the median value below 1.4 kHz, they are considerably further away at high frequencies.
The ILDA cue roughly suggests directions coincident with the real source direction at frequencies above 2.6 kHz and below 500 Hz. However, the individual differ- ences are large. Between the frequencies of 500 Hz and 2.6 kHz, there is a large bump in the ILDA values.
The cues that coincide with 15 ~ are ITDAs at low frequencies and roughly ILDAs at high frequencies. It can be suggested that the subjects have judged the virtual sources based on low-frequency ITD cues. The devia- tions of both cues at frequencies near 1.5 kHz and the deviation of ITDAs at high frequencies have therefore been ignored
In the listening test the best judged panning angle was 14 ~ . The deviation from the real source angle of 15 ~ is very small. The loudspeaker gain factors were calculated with the tangent law, Eq. (3). This suggests that the tangent law describes the localization with broad-band signals well. If the sine law, Eq. (2), had been used in panning, the same loudspeaker gains would have been achieved with a panning angle of 12.4 ~ This deviates slightly more from the real source direction than when the tangent law is used.
source ILDA [Fig. 14(b)] near 1.7 kHz is also seen in this presentation. It appears at all panning angles except 0 ~ and 30 ~ The ILDA changes its values monotonically with the panning angle everywhere else but near 1.7 kHz.
The bump frequency of the ILDA is roughly 1700 Hz, which corresponds to 190-mm wavelength. The differ- ence between the propagation path lengths between one loudspeaker and two ears in a stereophonic setup is ap- proximately 80-100 mm. At this frequency region the sound signal arriving from a contralateral loudspeaker is delayed by approximately a half-period when compared with the signal coming from an ipsilateral loudspeaker. It can be assumed that signal cancellation causes the ILDA bump. Also, the ITDA unstability can be caused by this phenomenon.
The ILDA and ITDA values are zero at a panning angle of 0 ~ because of symmetry in the listening config- uration. The amplitudes of the loudspeakers are equal
0 2 0.4
50
40
~ 30
25 u p 20
15
10
4.4 Simulated Localization of Broad-Band Amplitude-Panned Virtual Sources
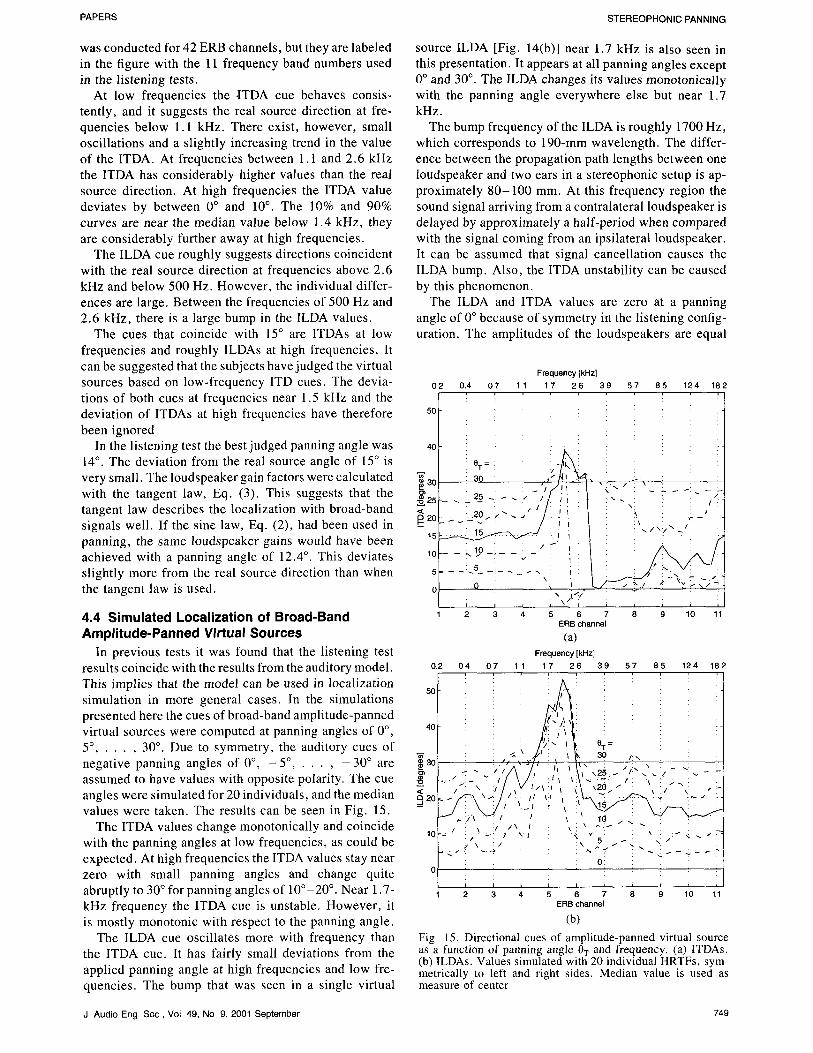
In previous tests it was found that the listening test results coincide with the results from the auditory model, o.2 This implies that the model can be used in localization 50 simulation in more general cases. In the simulations presented here the cues of broad-band amplitude-panned virtual sources were computed at panning angles of 0 ~ 40
5 ~ . . . , 30 ~ Due to symmetry, the auditory cues of negative panning angles of 0 ~ - 5 ~ . . . . - 3 0 ~ are ~ 30 assumed to have values with opposite polarity. The cue angles were simulated for 20 individuals, and the median ~, 20 values were taken. The results can be seen in Fig. 15.
The ITDA values change monotonically and coincide I~L with the panning angles at low frequencies, as could be expected. At high frequencies the ITDA values stay near zero with small panning angles and change quite abruptly to 30 ~ for panning angles of 10~ ~ Near 1.7- t kHz frequency the ITDA cue is unstable. However, it is mostly monotonic with respect to the panning angle.
The ILDA cue oscillates more with frequency than the ITDA cue. It has fairly small deviations from the applied panning angle at high frequencies and low fre- quencies. The bump that was seen in a single virtual
F r e q u e n c y [kHz]
07 11 17 26 39 57 85 124 18
OT 7
30 K i ~ ' / : j ""
25 ~; ~- ~ ~ / / : T ' - i . J !
~ :.
- - L ~ ) - L - - : - T , :
: k , 0 : : i , �9 . \ , L ~ / i i k i i i 2 3 4 5 6
04
. / . . / \ :
2 3
07 11
: " I,
~ k I . / / / i i I �9 . t /
, 'M/! i,", I , V l l t : I
/ , , ' ,~,, , i l ; ~ 1
' I / \ I
I d
~J
~ - ~ : / . : . .
: i~ ! ,_ _ ~ .
L : z ~ . . ' k a / : :
i i i i i 7 8 9 10 11
ERB channel
(a) F r e q u e n c y [kHz]
17 26 39 57 85 124 182
0 T = : :
k 3 0 I: \ " : % ' \ : �9 : \ : .
~ ",25.~ /: ... ~ / :~
~\%20 , - t : ~ : / ~ - , : ,.:.. L :-: . . ~,; "~-.. i_
10 : p
oi :
i : i i i i i i i 6 7 8 9 10 11
ERB channel
(b)
Fig 15. Directional cues of amplitude-panned virtual source as a function of panning angle 0 T and frequency. (a) ITDAs. (b) ILDAs. Values simulated with 20 individual HRTFs, sym- metrically to left and right sides. Median value is used as measure of center
J Audio Eng Soc, Vol 49, No 9, 2001 September 749
PULKKI AND KARJALAINEN PAPERS
in this case; therefore an identical sound signal arrives at each ear. This causes interaural differences to be zero. However, there might exist different perceptions due to asymmetries in the subject's HRTFs and in the reproduc- tion system.
The reason why amplitude-panned virtual sources are localized fairly consistently to the same direction across the audible spectral range and with all panning angles is due to relatively consistent low-frequency ITDs and consistent high-frequency ILDs. However, erroneous high-frequency ITDs and erroneous ILDs between 500 and 2600 Hz produce deviations in localization.
5 CONCLUSIONS
A set of listening tests was conducted in stereophonic listening with amplitude panning. The subjects adjusted the directions of virtual sources with several sound sig- nals to match a reference real source. A computational model of human directional hearing was used to interpret the listening test results.
The horizontal localization of an amplitude-panned virtual source was found to depend on both main direc- tional cues, ITD and ILD. The directions that the amplitude-panned virtual source cues suggest are depen- dent on frequency. Thus a single virtual source with a broad-band signal may be localized to multiple direc- tions. The directions proposed by ITD and ILD (ITD and ILD angles in this study) also deviate from one another considerably at most frequencies.
The ITD of an amplitude-panned virtual source be- haves consistently at frequencies below 1100 Hz. At high frequencies it deviates prominently from the low- frequency values. ILD cues at high frequencies coincide roughly with low-frequency ITD cues. However, differ- ences exist between individuals.
Between 1100 and 2600 Hz, both cue angles deviate from low-frequency ITD angles. The ITD angle has a slightly larger absolute value, and the ILD angle has a considerably larger absolute value. The cues in this frequency region affect the localization only when narrow-band signals are presented.
The localization of amplitude-panned virtual sources is based on ITD cues at low frequencies and on ILD cues at high frequencies. At frequencies roughly between 1 and 2 kHz both cues influence the perceived direction. The prominence of the cues is dependent on the temporal structure of the audio signal in this frequency region. This explains why signals with different temporal struc- tures but the same magnitude spectrum are localized differently.
The coincidence of low-frequency ITD cues and high- frequency ILD cues explains why amplitude-panned vir- tual sources are localized fairly consistently across the audible spectral range. Therefore the sine and tangent laws that were derived using low-frequency ITDs hold also at high frequencies. However, the deviations of cues at middle frequencies may produce the spreading of virtual sources.
The results presented here can also be discussed from
the standpoint of practitioners of stereophony. Most nat- ural sound signals, such as instrument and vocal sounds, are broad band, and include also frequencies below 1100 Hz. In such cases the localization of a virtual source is defined mostly by the low-frequency ITDs and high- frequency ILDs. The deviations of cue values especially near 1.7 kHz may produce a spread in the virtual source. A formed virtual source will thus be localized with fairly good accuracy and nonindividually to an intended direc- tion, though there might exist some spread in the vir- tual source.
If a virtual source contains only frequencies above 1100 Hz, such as instrument or vocal sounds at the two highest octaves in a piano scale (C6-C8) , the ITD cues of an amplitude-panned virtual source are no longer rele- vant in localization. Localization will be based mostly on ILD cues, which makes the virtual source direction more individual and spread out.
6 ACKNOWLEDGMENT
The work of Ville Pulkki has been supported by the Graduate School in Electronics, Telecommunications and Automation (GETA) of the Academy of Finland. The author would like to thank two anonymous review- ers for suggestions and corrections, all listening test participants for their contributions, Tony Verma for his help in improving the language, Klaus Riederer for HRTF measurements, and Nick Zacharov for his advice on statistical analysis.
7 REFERENCES
[1] A. D. Blumlein, U.K. patent 394,325 (1931); reprinted in Stereophonic Techniques (Audio Engi- neering Society, New York, 1986).
[2] D. M. Leakey, "Some Measurements on the Ef- fect of Interchannel Intensity and Time Difference in Two Channel Sound Systems," J. Acoust. Soc. Am., vol. 31, pp. 977-986 (1959 July).
[3] B. B. Bauer, "Phasor Analysis of Some Stereo- phonic Phenomena," J. Ar Soc. Am., vol. 33, pp. 1536-1539 (1961 Nov.).
[4] J. Blauert, Spatial Hearing, rev. ed. (MIT Press, Cambridge, MA, 1997).
[5] V. Pulkki, "Localization of Amplitude-Panned Virtual Sources, II: Two- and Three-Dimensional Pan- ning," J. Audio Eng. Soc., vol. 49, pp. 753-767 (this issue).
[6] R. H. Gilkey and T. R. Anderson, Eds., Binaural and Spatial Hearing in Real and Virtual Environments (Lawrence Erlbaum Assoc,, Mahwah, NJ, 1997).
[7] R. O. Duda, "Elevation Dependence of the In- teraural Transfer Function," in Binaural and Spatial Hearing in Real and Virtual Environments, R. H. Gilkey and T. R. Anderson, Eds. (Lawrence Erlbaum Assoc., Mahwah, NJ, 1997), pp. 49 -75 .
[8] F. L. Wightman and D. J. Kistler, "Factors Af- fecting the Relative Salience of Sound Localization Cues," in Binaural and Spatial Hearing in Real and
750 J Audio Eng Soc, Vol 49, No 9, 2001 September
PAPERS STEREOPHONIC PANNING
Virtual Environments, R. H. Gilkey and T. R. Ander- son, Eds. (Lawrence Erlbaum Assoc., Mahwah, N J, 1997).
[9] H. A. M. Clark, G. F. Dutton, and P. B. Vander- lyn, "The 'Stereosonic' Recording and Reproducing System," J. Audio Eng. Soc., vol. 6, no. 2, p. 102 (1958); reprinted in Stereophonic Techniques (Audio Engineering Society, New York, 1986).
[10] J C. Bennett, K. Barker, and F. O. Edeko, "A New Approach to the Assessment of Stereophonic Sound System Performance," J. Audio Eng Soc., vol. 33, pp. 314-321 (1985 May).
[ 11 ] B. Bernfeld, "Attempts for Better Understanding of the Directional Stereophonic Listening Mechanism," presented at the 44th Convention of the Audio Engi- neering Society, J. Audio Eng. Soc (Abstracts), vol. 21, p. 303 (1973 May).
[12] V. Pulkki, "Virtual Sound Source Positioning Using Vector Base Amplitude Panning," J. Audio Eng Soc., vol. 45, pp. 456-466 (1997 June).
[13] C. J. Mac Cabe and D. J. Furlong, "Virtual Imaging Capabilities of Surround Sound Systems," J. Audio Eng. Soc., vol. 42, pp. 38-49 (1994 Jam/Feb.).
[ 14] E. A. Macpherson, "A Computer Model for Bin- aural Localization for Stereo Imaging Measurement," J. Audio Eng. Soc., vol. 39, pp. 604-622 (1991 Sept.).
[ 15] P .M. Zurek, "The Precedence Effect," in Direc- tional Hearing, W. A. Yost and G. Gourewitch, Eds. (Springer, New York, 1987), pp. 3-25 .
[16] V. Pulkki, M. Karjalainen, and J. Huopaniemi, "Analyzing Virtual Sound Source Attributes Using a Binaural Auditory Model," J. Audio Eng. Soc., vol. 47, pp. 203-217 (1999 Apr.).
[17] A. H~irm/i and K. Palom/iki, " H U T e a r - - A Free Matlab Toolbox for Modeling of Auditory System," in Proc Matlab DSP Conf. (Espoo, Finland, 1999 Nov.), pp. 96-99 . Comsol Ltd., http://www.acoustics.hut.fi/
software/HUTear/. [18] B. C. J. Moore, An Introduction to the Psychol-
ogy of Hearing, 4th ed. (Academic Press, San Diego, CA, 1997).
[19] R. Patterson, K. Robinson, J. Holdsworth, D. Mckeown, C. Zhang, and M. H. Allerhand, "Complex Sounds and Auditory Images," in Auditory Physiology and Perception, L. Demany, Y. Cazals, and K. Horner, Eds. (Pergamon, Oxford, UK, 1992), pp. 429-446.
[20] B. C. J. Moore, R. W. Peters, and B. R. Glasb- erg, "Auditory Filter Shapes at Low Center Frequen- cies," J. Acoust. Soc. Am., vol. 88, pp. 132-140 (1990 July).
[21] T. C. T. Yin, P. X. Joris, P. H. Smith, and J. C K. Chan, "Neuronal Processing for Coding In- teraural Time Disparities," in Binaural and Spatial Hearing in Real and Virtual Environments, R. H. Gilkey and T. R. Anderson, Eds. (Lawrence Erlbaum Assoc., Mahwah, NJ, 1997), pp. 399-425.
[22] L A. Jeffress, "A Place Theory of Sound Local- ization," J. Comp. Physiol. Psych., vol. 61, pp. 468-486 (1948).
[23] R. M Stern and C. Trahiotis, "Models of Binau- ral Perception," in Binaural and Spatial Hearing in Real and Virtual Environments', R. H. Gilkey and T. R. And- erson, Eds. (Lawrence Erlbaum Assoc., Mahwah, N J, 1997), pp. 499-531.
[24] E. Zwicker and H. Fastl, Psychoacoustics: Facts and Models (Springer, Heidelberg, Germany, 1990).
[25] B. C J. Moore, B. R. Glasberg, and T. Baer, "A Model for the Prediction of Thresholds, Loudness, and Partial Loudness," J. Audio Eng. Soc., vol. 45, pp. 224-240 (1997 Apr.).
[26] B. L. Cardozo, "Adjusting the Method of Ad- justment: SD vs. DL," J. Acoust. Soc. Am., vol. 37, pp. 768-792 (1965 May).
[27] SPSS Inc., URL:http://www.spss.com, 2000.
T H E A U T H O R S
V. Pulkki
Ville Pulkki was born in Finland in 1969 He studied acoustics and computer and information sciences at the Helsinki University of Technology (HUT), Espoo, Fin- land. In 1994 he received the M.Sc. degree in engi- neering. Between 1994 and 1997 he majored in studies in the Musical Education Department at the Sibelius Academy, Helsinki, Finland Since 1997 he has been a
M. Karjalainen
Ph D. candidate at HUT Laboratory of Acoustics and Audio Signal Processing. He defended his thesis in 2001 August. He was also a visiting scholar at Center for New Music and Audio Technologies at the University of California, Berkeley, U.S.A., between August and December in 1999 His research interests are generation and evaluation of 3-D audio and perception of spatial
J Audio Eng Soc, Vol 49, No 9, 2001 September 751
PULKKI AND KARJALAINEN PAPERS
sound. Dr. Pulkki is a member of AES.
Matti Karjalainen was born in Hankasalmi, Finland, in 1946. He received the M.Sc. and Dr.Tech. degrees in electrical engineering from the Tampere University of Technology in 1970 and 1978, respectively. His doctoral thesis dealt with speech synthesis by rule in Finnish.
From 1980 he was an associate professor and since 1986 he has been a full professor in acoustics and audio signal processing at the Helsinki University of Technol- ogy on the faculty of electrical engineering In audio technology his interest is in audio signal processing, such as DSP for sound reproduction, perceptually based signal processing, as well as music DSP and sound syn- thesis. In addition to audio DSP his research activities
cover speech synthesis, analysis, and recognition, per- ceptual auditory modeling, spatial hearing, DSP hard- ware, software, and programming environments, as well as various branches of acoustics, including musical acoustics and modeling of musical instruments. He has written 250 scientific and engineering articles and con- tributed to organizing several conferences and work- shops In 1999 he served as the papers chair of the AES 16th International Conference on Spatial Sound Reproduction.
Dr Karjalainen is an AES fellow and a member of the Instittite of Electrical and Electronics Engineers, the Acoustical Society of America, the European Acoustics Association, the International Computer Music Associa- tion, the European Speech Communication Association, and several Finnish scientific and engineering societies.
752 J Audio Eng Soc, Vol 49, No 9, 2001 September