Local Telephone Competition: Status as of June 30,...
36
Local Telephone Competition: Status as of June 30, 2013 Industry Analysis and Technology Division Wireline Competition Bureau June 2014 This report is available for reference in the FCC’s Reference Information Center, Courtyard Level, 445 12th Street, SW, Washington, DC. Copies may be purchased by contacting Best Copy and Printing, Inc., 445 12th Street, SW, Room CY-B402, Washington, DC 20554, telephone (800) 378-3160, or via their website at www.bcpiweb.com. The report can also be downloaded from the Wireline Competition Bureau Statistical Reports Internet site at www.fcc.gov/wcb/stats.
Transcript of Local Telephone Competition: Status as of June 30,...

Local Telephone Competition: Status as of June 30, 2013
Industry Analysis and Technology Division Wireline Competition Bureau
June 2014
This report is available for reference in the FCC’s Reference Information Center, Courtyard Level, 445 12th Street, SW, Washington, DC. Copies may be purchased by contacting Best Copy and Printing, Inc., 445 12th Street, SW, Room CY-B402, Washington, DC 20554, telephone (800) 378-3160, or via their website at www.bcpiweb.com. The report can also be downloaded from the Wireline Competition Bureau Statistical Reports Internet site at www.fcc.gov/wcb/stats.
U.S. Federal Communications Commission Local Telephone Competition: Status as of June 30, 2013 i
Contents TEXT Introduction ............................................................................................................................................. 1 Retail local telephone service ................................................................................................................. 1 Service providers .................................................................................................................................... 3 Interconnected VoIP service ................................................................................................................... 6 Switched access lines .............................................................................................................................. 9 Wholesale relationships for switched access lines .................................................................................. 9 Remainder of the report ........................................................................................................................ 11 Technical Notes .................................................................................................................................... 30 Glossary ................................................................................................................................................ 31 FIGURES 1. Retail Local Telephone Service Connections, 2010 - 2013 ............................................................. 2
2. Wireline Retail Local Telephone Service Connections by Technology and Customer Type ................................................................................................................................. 3
3. Wireline Retail Local Telephone Service Connections by Customer Type and Regulatory Status ............................................................................................................................. 4
4. Wireline Retail Local Telephone Service Connections by Technology, Regulatory Status, and Customer Type .......................................................................................................................... 5
5. Interconnected VoIP Subscribership by Reported Service Features ................................................ 7
6. Technology of Internet Access Connections in Interconnected VoIP Broadband Bundles ............. 8
7. Technology of Retail Switched Access Lines .................................................................................. 9
8. Wholesale Relationships as Reported Respectively by CLECs and ILECs ................................... 10
TABLES 1. Total End-User Switched Access Lines and VoIP Subscriptions .................................................. 12
2. Total End-User Switched Access Lines and VoIP Subscriptions by Customer Type .................... 13
3. End-User Switched Access Lines and VoIP Subscriptions by Customer Type ............................. 14
4. End-User Switched Access Lines and VoIP Subscriptions Reported by Non-ILECs .................... 15
5. ILEC End-User (Retail) and Wholesale Switched Access Lines, VoIP Subscriptions, and UNEs ....................................................................................................................................... 16
6. End-User Switched Access Lines and VoIP Subscriptions by Type of Technology for Non-ILEC Providers ................................................................................................................. 17
7. Percentage of Switched Access Lines Presubscribed for Long Distance Service .......................... 18
8. Residential and Business Presubscribed Switched Access Lines ................................................... 19
9. Total End-User Switched Access Lines and VoIP Subscriptions by State .................................... 20
10. Residential End-User Switched Access Lines and VoIP Subscriptions by State ........................... 21

U.S. Federal Communications Commission Local Telephone Competition: Status as of June 30, 2013 ii
11. Business End-User Switched Access Lines and VoIP Subscriptions by State ............................... 22
12. Non-ILEC Share of Total End-User Switched Access Lines and VoIP Subscriptions by State ........................................................................................................................................... 23
13. Non-ILEC Total End-User Switched Access Lines and VoIP Subscriptions by State .................. 24
14. ILEC Total End-User Switched Access Lines and VoIP Subscriptions by State .......................... 25
15. Non-ILEC Methods of Providing Wireline Telephone Services by State ..................................... 26
16. Percentage of End-User Switched Access Lines and VoIP Subscriptions Provided to Residential Customers by State ...................................................................................................... 27
17. Number of Reporting ILECs, Non-ILECs, and VoIP Providers by State ...................................... 28
18. Mobile Telephone Facilities-based Carriers and Mobile Telephony Subscribers ......................... 29
CHARTS 1. Total End-User Switched Access Lines and VoIP Subscriptions .................................................. 12
2. Percent of Total Lines and VoIP Subscriptions that Serve Residential Customers........................ 13
3. VoIP Share of Total End-User Switched Access Lines and VoIP Subscriptions ........................... 14
4. Non-ILEC End-User Switched Access Lines and VoIP Subscriptions .......................................... 15
5. ILEC Total Lines and the Percent Provided to CLECs .................................................................. 16
6. End-User Switched Access Lines and VoIP Subscriptions by Type of Technology for Non-ILEC Providers ................................................................................................................. 17
7. Percent Presubscribed Interstate Long Distance Lines for ILECs.................................................. 18

Local Telephone Competition: Status as of June 30, 2013
Introduction. The Commission has used FCC Form 477 to collect subscribership information from providers of local telephone service – the incumbent local exchange carriers (ILECs), competitive local exchange carriers (CLECs), and mobile telephony providers – for more than a decade.1 The Commission has required interconnected Voice over Internet Protocol (“interconnected VoIP”) service providers to report subscribership information since December 2008 because the use of VoIP technology is growing rapidly and it increasingly is used to provide local telephone service.2 This report summarizes the information collected about telephone services as of June 30, 2013. It demonstrates continued growth in subscribership to interconnected VoIP and mobile telephony services and continued decline in subscribership to traditional wired telephone services.3 Retail local telephone service. Retail local telephone service customers are served by two wireline technologies – “end-user” switched access lines and interconnected VoIP “subscriptions” – and by mobile wireless subscriptions.
• In June 2013, there were 90 million end-user switched access lines in service, 45 million interconnected VoIP subscriptions, and 306 million mobile subscriptions in the United States, or 441 million retail local telephone service connections in total. See Figure 1.
1 See the Technical Notes and the Glossary that appear at the end of this report for more-detailed information about the Form 477 and the meaning of terms used in this report. For an overview of program history for the telephone services data, see Local Telephone Competition: Status as of December 31, 2008 (June 2010) at pp. 1-2, available at www.fcc.gov/wcb/iatd/comp.html. Readers who are interested in historical trends in the data should note the changes in reporting requirements that were effective in 2008 and earlier, in 2005.
2 The FCC’s rules (at 47 C.F.R. § 9.3) state: An interconnected Voice over Internet Protocol (VoIP) service is a service that: (1) Enables real-time, two-way voice communications; (2) Requires a broadband connection from the user’s location; (3) Requires Internet protocol-compatible customer premises equipment (CPE); and (4) Permits users generally to receive calls that originate on the public switched telephone network and to terminate calls to the public switched telephone network.
We note that the current interpretation of element (4) of the definition excludes the VoIP services that Skype offers in the United States, and subscribers to those services are not reported on Form 477. Prior to the December 2008 data, companies such as Vonage that solely provide interconnected VoIP service did not file Form 477. Telephone companies and cable companies that provided local exchange telephone service were required to file Form 477 but were not required to report interconnected VoIP subscriptions. However, some of these companies chose to include interconnected VoIP subscriptions in the number of retail (end-user) switched access lines that they reported.
3 The presentation of mobile wireless telephone subscriber counts in this report does not constitute, or imply, Commission analysis of the extent to which wireline and mobile wireless telephone services are demand substitutes or complements in general or in any particular situation. In the Form 477 program, commercial mobile radio service (CMRS) carriers who own or operate wireless networks report both their retail telephone service customers and the retail customers of mobile wireless telephone service resellers.
U.S. Federal Communications Commission Local Telephone Competition: Status as of June 30, 2013 1

• Over the three-year period presented in Figure 1, interconnected VoIP subscriptions increased at a compound annual growth rate of 16%, mobile telephony subscriptions increased at a compound annual growth rate of 3%, and retail switched access lines declined at 10% a year.4
Figure 1 Retail Local Telephone Service Connections, 2010 - 2013
(In Thousands)
• Of the 135 million wireline retail local telephone service connections (including both switched access lines and interconnected VoIP subscriptions) in June 2013, 77 million (or 57%) were residential connections and 58 million (or 43%) were business connections.5 See Figure 2.
4 The compound annual growth rate (CAGR) is a smoothed rate of growth calculated in three steps. First, divide the ending (June 2013) value by the beginning (June 2010) value. Second, raise the result of that division to a power equal to one divided by the number of years in the period (in this case, 3 years, so the power is 1/3). Third, subtract the number one from the result of the second step.
5 FCC Form 477 does not distinguish between residential and business subscribers to mobile telephony service. The information that Form 477 collects about mobile broadband service is summarized elsewhere; see Internet Access Services: Status as of June 30, 2013, available at www.fcc.gov/wcb/iatd/comp.html.
U.S. Federal Communications Commission Local Telephone Competition: Status as of June 30, 2013 2

• Cross-classified by technology and customer type, the 135 million wireline retail local telephone service connections in June 2013 were: 30% residential switched access lines, 36% business switched access lines, 27% residential interconnected VoIP subscriptions, and 7% business interconnected VoIP subscriptions. See Figure 2.
Figure 2 Wireline Retail Local Telephone Service Connections by Technology and
Customer Type as of June 30, 2013 (In Thousands)
Switched Access Interconnected Total Lines VoIP
Residential 40,946 36,409 77,355
Business 48,890 8,882 57,771
Total 89,836 45,291 135,127
Figures may not add to totals due to rounding.
Service providers. The Form 477 program – and this report – distinguishes ILEC operations from all other operations.
• Cross-classified by customer type (residential or business) and the service retailer’s regulatory status (ILEC or non-ILEC), the 135 million wireline retail local telephone service connections in June 2013 were: 34% ILEC residential service, 25% ILEC business service, 24% non-ILEC residential service, and 18% non-ILEC business service. See Figure 3.
U.S. Federal Communications Commission Local Telephone Competition: Status as of June 30, 2013 3

Figure 3 Wireline Retail Local Telephone Service Connections by Customer Type and
Regulatory Status as of June 30, 2013 (In Thousands)
Residential Business Total
ILEC 45,365 33,172 78,537
Non-ILEC 31,990 24,600 56,590
Total 77,355 57,771 135,127 Figures may not add to totals due to rounding.
• Additionally cross-classified by technology, the 77 million wireline residential connections in June 2013 were: 49.3% ILEC switched access lines, 37.8% non-ILEC interconnected VoIP subscriptions, 3.6% non-ILEC switched access lines, and 9.3% ILEC interconnected VoIP subscriptions. Similarly, the 58 million wireline business connections were: 56.0% ILEC switched access lines, 28.7% non-ILEC switched access lines, 13.9% non-ILEC interconnected VoIP subscriptions, and 1.4% ILEC interconnected VoIP subscriptions. See Figure 4.
U.S. Federal Communications Commission Local Telephone Competition: Status as of June 30, 2013 4

Figure 4
Wireline Retail Local Telephone Service Connections by Technology, Regulatory Status, and Customer Type as of June 30, 2013 (In Thousands)
Total Switched Access Interconnected Total Lines VoIP
ILEC 70,504 8,033 78,537 Non-ILEC 19,332 37,257 56,590 Total 89,836 45,291 135,127
Residential ILEC 38,169 7,196 45,365 Non-ILEC 2,777 29,213 31,990 Residential Total 40,946 36,409 77,355
Business ILEC 32,335 837 33,172 Non-ILEC 16,555 8,045 24,600 Business Total 48,890 8,882 57,771
Figures may not add to totals due to rounding.
U.S. Federal Communications Commission Local Telephone Competition: Status as of June 30, 2013 5

Interconnected VoIP service. Form 477 identifies three types of information about retail interconnected VoIP service.
• First, interconnected VoIP service retailers distinguish between the interconnected VoIP subscriptions they sell to their broadband Internet access service customers (“broadband bundle” subscriptions, in this report) and all the other interconnected VoIP subscriptions that they sell (“standalone” subscriptions).
• Second, filers report whether or not interconnected VoIP subscriptions include, as a service
feature, the capability to use the service over any broadband connection to which the customer has access, for example, at a hotel or vacation residence (“nomadic” functionality).
• Third, filers identify the different broadband technologies (for example, cable modem Internet
access service) in the broadband bundle. The Form 477 data cross-classify the first two of these three sets of information. See Figure 5.
U.S. Federal Communications Commission Local Telephone Competition: Status as of June 30, 2013 6

Figure 5 Interconnected VoIP Subscribership by Reported Service Features
as of June 30, 2013 (In Thousands)
Total Broadband Standalone Total Bundle VoIP
Nomadic 868 4,326 5,194 Not nomadic 38,322 1,774 40,096
Total 39,191 6,100 45,291 ILEC
Nomadic 38 21 58 Not nomadic 7,972 3 7,975
ILEC Total 8,010 24 8,033 Non-ILEC
Nomadic 830 4,306 5,136 Not nomadic 30,351 1,771 32,122
Non-ILEC Total 31,181 6,076 37,257 Figures may not add to totals due to rounding.
U.S. Federal Communications Commission Local Telephone Competition: Status as of June 30, 2013 7

Form 477 collects the third type of information about retail interconnected VoIP service – the technology of the Internet access connection – for broadband bundles but not for standalone interconnected VoIP. See Figure 6.6
Figure 6 Technology of Internet Access Connections in Interconnected VoIP
Broadband Bundles as of June 30, 2013 (In Thousands)
Technology ILEC Non-ILEC Total DSL or Other Wireline 4,126 3,098 7,224 FTTP 3,883 975 4,858 Cable Modem 1 26,825 26,826 Terrestrial Fixed Wireless 1 54 55 Other 0 230 230 Total 8,010 31,181 39,191
Figures may not add to totals due to rounding.
6 Internet Access Services: Status as of June 30, 2013 discusses types of Internet access connections in greater detail. The report is available at www.fcc.gov/wcb/iatd/comp.html.
U.S. Federal Communications Commission Local Telephone Competition: Status as of June 30, 2013 8

Switched access lines. ILECs as a group predominantly deliver retail switched access lines over copper local loops. This appears also to be the case for those non-ILECs who report retail switched access lines. See Figure 7.
Figure 7
Technology of Retail Switched Access Lines as of June 30, 2013 (In Thousands)
Technology ILEC Non-ILEC Total FTTP 3,450 1,994 5,443 Coaxial Cable 160 1,623 1,784 Terrestrial Fixed Wireless 15 45 60 Copper Local Loop 66,879 15,670 82,549 Total 70,504 19,332 89,836
Figures may not add to totals due to rounding.
Wholesale relationships for switched access lines. ILECs typically own the communications facilities over which they provide retail services. By contrast, CLECs use a range of methods: equipping ILEC UNE loops (“UNE-L”) as CLEC switched access lines,7 reselling services (for example, reselling ILEC
7 CLECs (as opposed to non-ILECs more generally) have certain regulatory rights to obtain ILEC local loops at cost-based UNE rates, which the CLEC may use to provide retail switched access lines or retail broadband Internet access connections. See C.F.R. § 51.307.
U.S. Federal Communications Commission Local Telephone Competition: Status as of June 30, 2013 9
switched access lines obtained at wholesale rates or reselling ILEC lines obtained under commercial agreements that replaced the UNE-Platform (“UNE-P”)), equipping leased ILEC special access circuits as switched access lines, and equipping local loops that the CLEC owns.
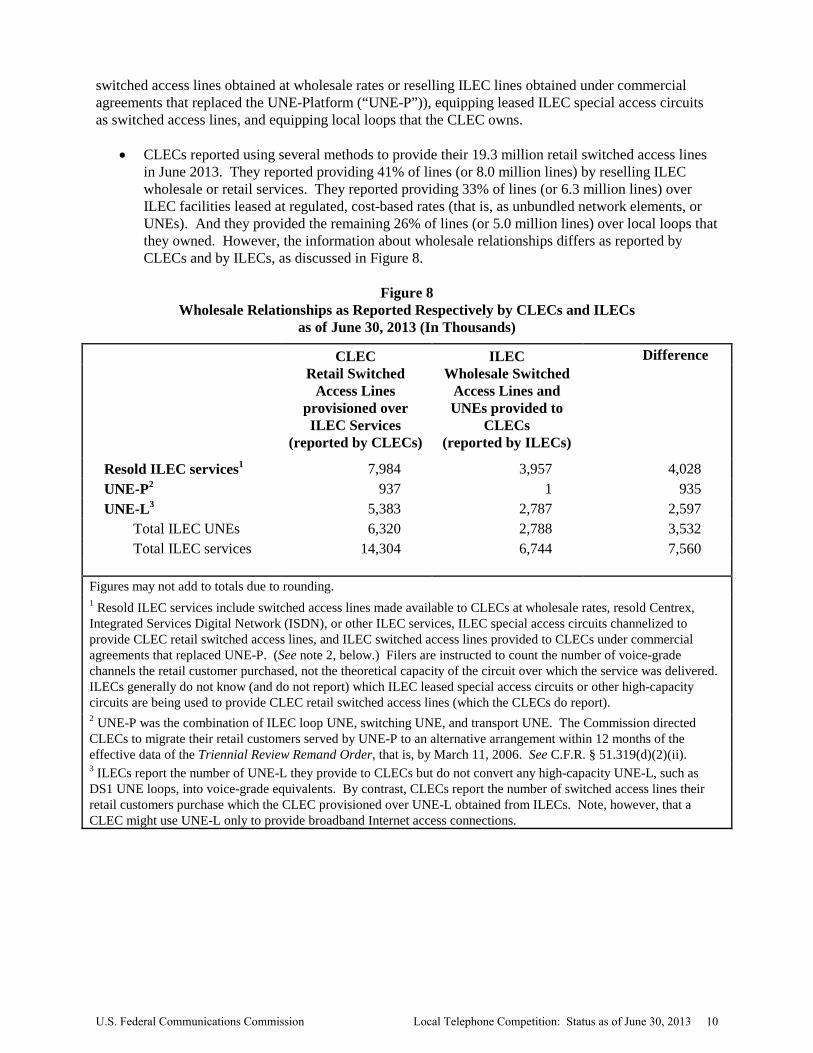
• CLECs reported using several methods to provide their 19.3 million retail switched access lines in June 2013. They reported providing 41% of lines (or 8.0 million lines) by reselling ILEC wholesale or retail services. They reported providing 33% of lines (or 6.3 million lines) over ILEC facilities leased at regulated, cost-based rates (that is, as unbundled network elements, or UNEs). And they provided the remaining 26% of lines (or 5.0 million lines) over local loops that they owned. However, the information about wholesale relationships differs as reported by CLECs and by ILECs, as discussed in Figure 8.
Figure 8
Wholesale Relationships as Reported Respectively by CLECs and ILECs as of June 30, 2013 (In Thousands)
CLEC ILEC Difference
Retail Switched Access Lines
provisioned over ILEC Services
(reported by CLECs)
Wholesale Switched Access Lines and UNEs provided to
CLECs (reported by ILECs)
Resold ILEC services1 7,984 3,957 4,028 UNE-P2 937 1 935 UNE-L3 5,383 2,787 2,597
Total ILEC UNEs 6,320 2,788 3,532 Total ILEC services 14,304 6,744 7,560
Figures may not add to totals due to rounding. 1 Resold ILEC services include switched access lines made available to CLECs at wholesale rates, resold Centrex, Integrated Services Digital Network (ISDN), or other ILEC services, ILEC special access circuits channelized to provide CLEC retail switched access lines, and ILEC switched access lines provided to CLECs under commercial agreements that replaced UNE-P. (See note 2, below.) Filers are instructed to count the number of voice-grade channels the retail customer purchased, not the theoretical capacity of the circuit over which the service was delivered. ILECs generally do not know (and do not report) which ILEC leased special access circuits or other high-capacity circuits are being used to provide CLEC retail switched access lines (which the CLECs do report). 2 UNE-P was the combination of ILEC loop UNE, switching UNE, and transport UNE. The Commission directed CLECs to migrate their retail customers served by UNE-P to an alternative arrangement within 12 months of the effective data of the Triennial Review Remand Order, that is, by March 11, 2006. See C.F.R. § 51.319(d)(2)(ii). 3 ILECs report the number of UNE-L they provide to CLECs but do not convert any high-capacity UNE-L, such as DS1 UNE loops, into voice-grade equivalents. By contrast, CLECs report the number of switched access lines their retail customers purchase which the CLEC provisioned over UNE-L obtained from ILECs. Note, however, that a CLEC might use UNE-L only to provide broadband Internet access connections.
U.S. Federal Communications Commission Local Telephone Competition: Status as of June 30, 2013 10

Remainder of the report. The remainder of the report consists of tables and charts that summarize national and state-specific data.
* * * *
We invite users of this information to provide suggestions for improved analysis of data presented in this report by using the attached customer response form or by sending comments to [email protected] for subject: June 2013 local telephone data. We encourage users of this information to provide suggestions for improved data collection by participating in any formal proceedings undertaken by the Commission to solicit comments for improvement of FCC Form 477.
U.S. Federal Communications Commission Local Telephone Competition: Status as of June 30, 2013 11

ILEC Non-ILECDec 2008 118,496 44,267 162,763 27.2Jun 2009 112,748 44,351 157,098 28.2Dec 2009 107,018 45,927 152,945 30.0Jun 2010 102,395 49,077 151,472 32.4Dec 2010 97,497 52,155 149,652 34.9Jun 2011 93,394 52,820 146,214 36.1Dec 2011 89,427 53,892 143,319 37.6Jun 2012 85,848 55,744 141,592 39.4Dec 2012 82,114 56,481 138,595 40.8Jun 2013 78,537 56,590 135,127 41.9
1 Mandatory reporting by interconnected VoIP service providers started in December 2008. Previously, individual ILECs and CLECs included VoIP subscribers in reported switched access lines to a varying and largely unknown degree. Interconnected VoIP is distinguished from VoIP service more generally by permitting users to receive calls that originate on the public switched telephone network and to terminate calls to the public switched telephone network. See 47 C.F.R. § 9.3. Form 477 counts both switched access lines and interconnected VoIP subscriptions as the maximum number of calls that may be active, simultaneously, from the end user’s location under the purchased service plan.
Provided byDate
Some previously published data have been revised.
Total Non-ILEC Share
(In Millions)
Table 1Total End-User Switched Access Lines and VoIP Subscriptions1
Total End-User Switched Access Lines and VoIP SubscriptionsChart 1
(In Thousands)
020406080
100120140160180
Dec 2008 Jun 2009 Dec 2009 Jun 2010 Dec 2010 Jun 2011 Dec 2011 Jun 2012 Dec 2012 Jun 2013Non-ILEC 44.3 44.4 45.9 49.1 52.2 52.8 53.9 55.7 56.5 56.6ILEC 118.5 112.7 107.0 102.4 97.5 93.4 89.4 85.8 82.1 78.5
ILEC Non-ILEC
U.S. Federal Communications Commission Local Telephone Competition: Status as of June 30, 2013 12
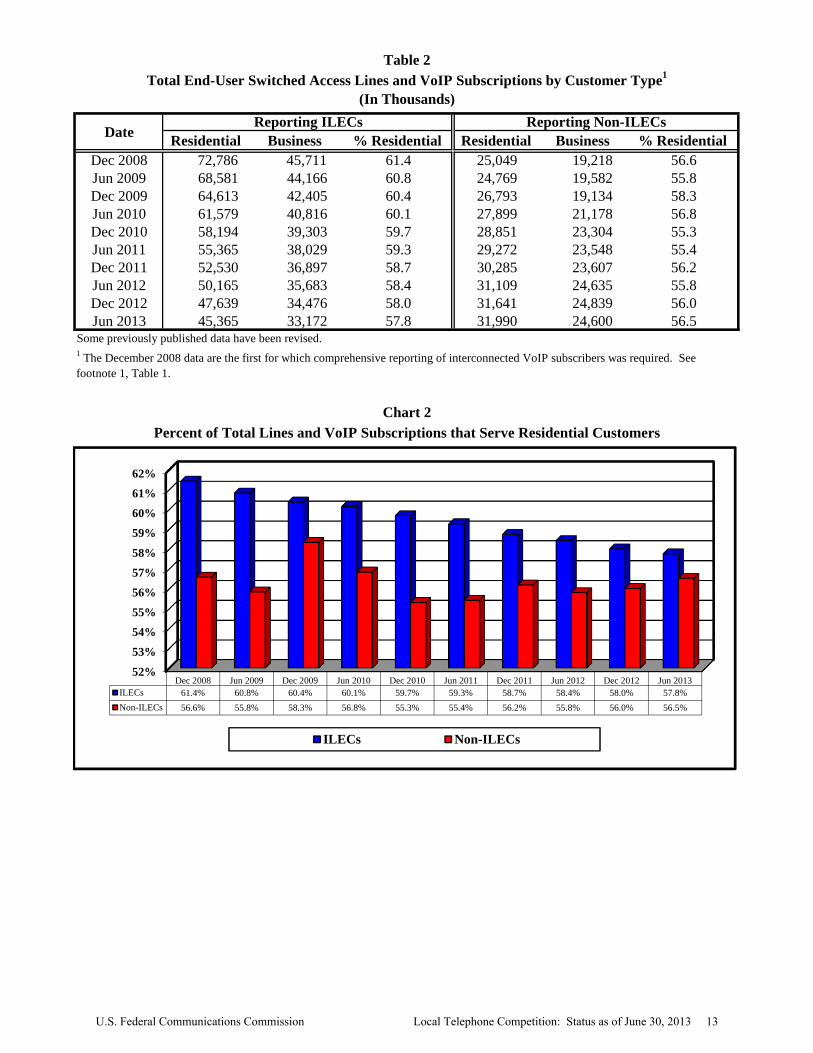
Dec 2008 72,786 45,711 61.4 25,049 19,218 56.6Jun 2009 68,581 44,166 60.8 24,769 19,582 55.8Dec 2009 64,613 42,405 60.4 26,793 19,134 58.3Jun 2010 61,579 40,816 60.1 27,899 21,178 56.8Dec 2010 58,194 39,303 59.7 28,851 23,304 55.3Jun 2011 55,365 38,029 59.3 29,272 23,548 55.4Dec 2011 52,530 36,897 58.7 30,285 23,607 56.2Jun 2012 50,165 35,683 58.4 31,109 24,635 55.8Dec 2012 47,639 34,476 58.0 31,641 24,839 56.0Jun 2013 45,365 33,172 57.8 31,990 24,600 56.5
Percent of Total Lines and VoIP Subscriptions that Serve Residential CustomersChart 2
% ResidentialBusiness
1 The December 2008 data are the first for which comprehensive reporting of interconnected VoIP subscribers was required. See footnote 1, Table 1.
Business Residential % Residential Residential
Some previously published data have been revised.
Table 2Total End-User Switched Access Lines and VoIP Subscriptions by Customer Type1
Reporting Non-ILECsReporting ILECsDate
(In Thousands)
52%
53%54%55%56%57%58%
59%60%61%62%
Dec 2008 Jun 2009 Dec 2009 Jun 2010 Dec 2010 Jun 2011 Dec 2011 Jun 2012 Dec 2012 Jun 2013ILECs 61.4% 60.8% 60.4% 60.1% 59.7% 59.3% 58.7% 58.4% 58.0% 57.8%Non-ILECs 56.6% 55.8% 58.3% 56.8% 55.3% 55.4% 56.2% 55.8% 56.0% 56.5%
ILECs Non-ILECs
U.S. Federal Communications Commission Local Telephone Competition: Status as of June 30, 2013 13

Residential Business Total Residential Business Total Residential Business TotalDec 2008 78,180 62,839 141,019 19,655 2,090 21,744 97,835 64,929 162,763
Jun 2009 73,093 60,015 133,109 20,257 3,733 23,990 93,350 63,748 157,098
Dec 2009 68,614 58,335 126,949 22,793 3,204 25,996 91,406 61,539 152,945
Jun 2010 64,463 58,152 122,615 25,015 3,842 28,857 89,478 61,994 151,472
Dec 2010 60,010 57,874 117,884 27,036 4,733 31,768 87,045 62,607 149,652
Jun 2011 56,019 56,428 112,447 28,617 5,150 33,767 84,637 61,577 146,214
Dec 2011 51,920 54,729 106,649 30,895 5,775 36,670 82,815 60,504 143,319
Jun 2012 48,337 53,495 101,832 32,937 6,823 39,760 81,274 60,318 141,592
Dec 2012 44,573 51,565 96,138 34,707 7,750 42,457 79,280 59,315 138,595
Jun 2013 40,946 48,890 89,836 36,409 8,882 45,291 77,355 57,771 135,127Some previously published data have been revised. Figures may not sum to totals due to rounding.
Chart 3VoIP Share of Total End-User Switched Access Lines and VoIP Subscriptions
End-User Switched Access Lines VoIP Subscriptions Total
Table 3 End-User Switched Access Lines and VoIP Subscriptions by Customer Type
(In Thousands)
Date
Dec2008
Jun2009
Dec2009
Jun2010
Dec2010
Jun2011
Dec2011
Jun2012
Dec2012
Jun2013
Residential 20.1% 21.7% 24.9% 28.0% 31.1% 33.8% 37.3% 40.5% 43.8% 47.1%Business 3.2% 5.9% 5.2% 6.2% 7.6% 8.4% 9.5% 11.3% 13.1% 15.4%Total 13.4% 15.3% 17.0% 19.1% 21.2% 23.1% 25.6% 28.1% 30.6% 33.5%
0%5%
10%15%20%25%30%35%40%45%50%
Residential Business Total
U.S. Federal Communications Commission Local Telephone Competition: Status as of June 30, 2013 14

705 44,267 7,083 9,612 6,359 21,216 16.0 21.7 14.4 47.9 720 44,351 6,799 8,516 6,005 23,032 15.3 19.2 13.5 51.9 758 45,927 7,100 8,029 5,993 24,802 15.5 17.5 13.0 54.0 787 49,077 8,249 7,701 6,231 26,895 16.8 15.7 12.7 54.8 809 52,155 8,634 7,313 7,294 28,912 16.6 14.0 14.0 55.4 834 52,820 8,492 6,950 7,242 30,136 16.1 13.2 13.7 57.1 874 53,892 8,201 6,769 6,937 31,978 15.2 12.6 12.9 59.3 879 55,744 8,139 6,654 7,006 33,948 14.6 11.9 12.6 60.9 920 56,481 7,696 6,890 6,300 35,593 13.6 12.2 11.2 63.0 940 56,590 7,984 6,320 5,023 37,257 14.1 11.2 8.9 65.8
3 Lines provided over CLEC-owned "last-mile" facilities.
Dec 2012
Some previously published data have been revised. Figures may not sum to totals due to rounding.
Resold LEC
service
Jun 2011
1 See footnote 1, Table 1.
CLEC-owned local loops
VoIP
Non-ILEC End-User Switched Access Lines and VoIP Subscriptions as of June 30, 2013
Jun 2009Dec 2008
Reporting Non-
ILECs
End-User Switched
Access Lines and VoIP
Subscriptions
Chart 4
Jun 2012Dec 2011
2 Includes unbundled network element (UNE) loops leased from an unaffiliated ILEC on a stand-alone basis and also UNE loops leased in combination with UNE switching or any other unbundled network element.
Table 4End-User Switched Access Lines and VoIP Subscriptions Reported by Non-ILECs1
(Lines and Subscriptions in Thousands)
Acquired from other LECs
Percent
CLEC-owned local
loops 3
End-User Switched Access Lines
Resold LEC
serviceVoIPILEC
UNEs
Dec 2010
ILEC UNEs 2
Date
Jun 2010
Jun 2013
Dec 2009
Resold LEC service 14.1%
ILEC UNEs 11.2%
CLEC-owned local loops 8.9%
VoIP 65.8%
U.S. Federal Communications Commission Local Telephone Competition: Status as of June 30, 2013 15
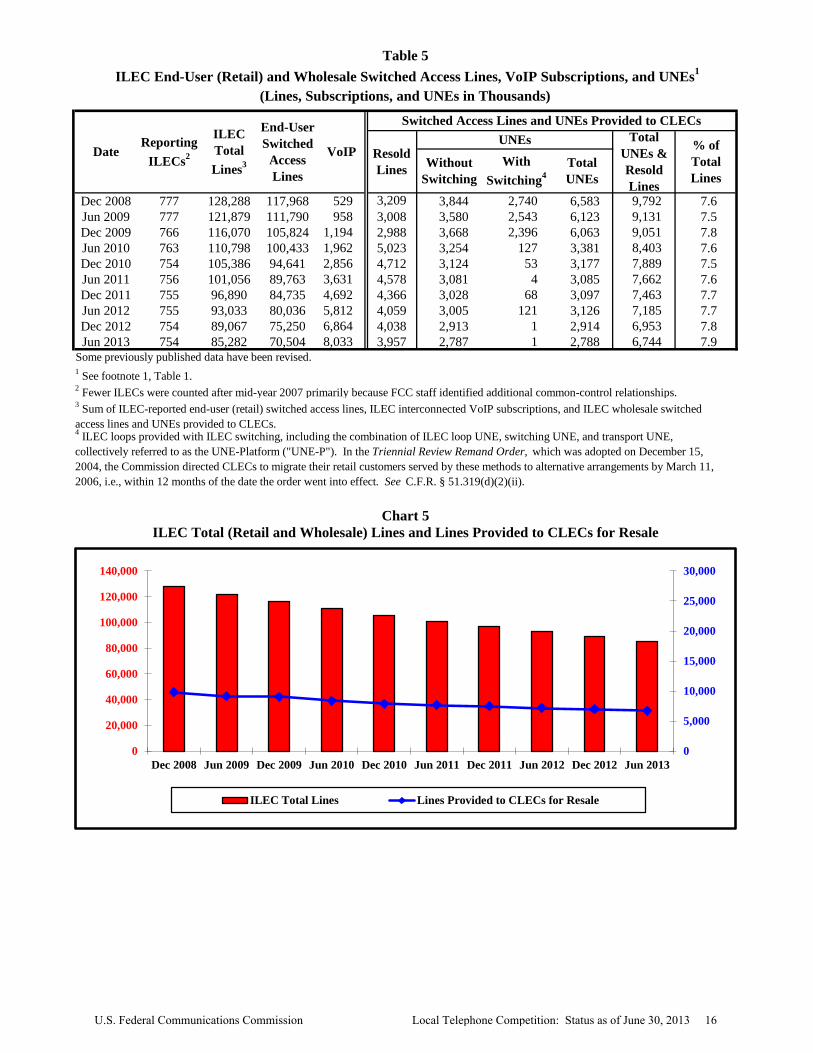
Dec 2008 777 128,288 117,968 529 3,209 3,844 2,740 6,583 9,792 7.6Jun 2009 777 121,879 111,790 958 3,008 3,580 2,543 6,123 9,131 7.5Dec 2009 766 116,070 105,824 1,194 2,988 3,668 2,396 6,063 9,051 7.8Jun 2010 763 110,798 100,433 1,962 5,023 3,254 127 3,381 8,403 7.6Dec 2010 754 105,386 94,641 2,856 4,712 3,124 53 3,177 7,889 7.5Jun 2011 756 101,056 89,763 3,631 4,578 3,081 4 3,085 7,662 7.6Dec 2011 755 96,890 84,735 4,692 4,366 3,028 68 3,097 7,463 7.7Jun 2012 755 93,033 80,036 5,812 4,059 3,005 121 3,126 7,185 7.7Dec 2012 754 89,067 75,250 6,864 4,038 2,913 1 2,914 6,953 7.8Jun 2013 754 85,282 70,504 8,033 3,957 2,787 1 2,788 6,744 7.9
2 Fewer ILECs were counted after mid-year 2007 primarily because FCC staff identified additional common-control relationships.
4 ILEC loops provided with ILEC switching, including the combination of ILEC loop UNE, switching UNE, and transport UNE, collectively referred to as the UNE-Platform ("UNE-P"). In the Triennial Review Remand Order, which was adopted on December 15, 2004, the Commission directed CLECs to migrate their retail customers served by these methods to alternative arrangements by March 11, 2006, i.e., within 12 months of the date the order went into effect. See C.F.R. § 51.319(d)(2)(ii).
3 Sum of ILEC-reported end-user (retail) switched access lines, ILEC interconnected VoIP subscriptions, and ILEC wholesale switched access lines and UNEs provided to CLECs.
ILEC Total (Retail and Wholesale) Lines and Lines Provided to CLECs for ResaleChart 5
Table 5 ILEC End-User (Retail) and Wholesale Switched Access Lines, VoIP Subscriptions, and UNEs1
(Lines, Subscriptions, and UNEs in Thousands)
UNEsDate
Total UNEs
Resold Lines
ILEC Total Lines3 Without
Switching
VoIPReporting
ILECs2% of Total Lines
Switched Access Lines and UNEs Provided to CLECs
1 See footnote 1, Table 1.
Total UNEs & Resold Lines
With Switching4
End-User Switched
Access Lines
Some previously published data have been revised.
0
5,000
10,000
15,000
20,000
25,000
30,000
0
20,000
40,000
60,000
80,000
100,000
120,000
140,000
Dec 2008 Jun 2009 Dec 2009 Jun 2010 Dec 2010 Jun 2011 Dec 2011 Jun 2012 Dec 2012 Jun 2013
ILEC Total Lines Lines Provided to CLECs for Resale
U.S. Federal Communications Commission Local Telephone Competition: Status as of June 30, 2013 16

Table 6End-User Switched Access Lines and VoIP Subscriptions
by Type of Technology for Non-ILEC Providers1
(In Thousands)
Date Coaxial Cable2 Other Technology Total
Dec 2008 20,108 24,158 44,267 45.4Jun 2009 21,547 22,804 44,351 48.6Dec 2009 23,171 22,756 45,927 50.5Jun 2010 24,339 24,738 49,077 49.6Dec 2010 25,877 26,278 52,155 49.6Jun 2011 26,645 26,175 52,820 50.4Dec 2011 27,776 26,116 53,892 51.5Jun 2012 28,541 27,203 55,744 51.2Dec 2012 29,317 27,164 56,481 51.9Jun 2013 30,205 26,384 56,590 53.4
(In Thousands)
1 See footnote 1, Table 1.2 Reported end-user switched access lines and interconnected VoIP connections that terminate on coaxial cable at the end user's premises. Starting, systematically, with the December 2008 data, interconnected VoIP service providers report subscriptions they sold in a bundle with cable modem Internet access service. For December 2008 and later dates, FCC staff used other Form 477 data to estimate the number of standalone VoIP subscriptions that terminated on coaxial cable at the end user's premises.
Percent Coaxial Cable
End-User Switched Access Lines and VoIP Subscriptionsby Type of Technology for Non-ILEC Providers
Chart 6
Some previously published data have been revised.
0
5000
10000
15000
20000
25000
30000
35000
Dec 2008 Jun 2009 Dec 2009 Jun 2010 Dec 2010 Jun 2011 Dec 2011 Jun 2012 Dec 2012 Jun 2013
Coaxial Cable Other Technology
U.S. Federal Communications Commission Local Telephone Competition: Status as of June 30, 2013 17

ILEC CLEC TotalResidential
Dec 2008 68 80 69 Jun 2009 69 80 70 Dec 2009 70 76 71 Jun 2010 70 76 71 Dec 2010 69 77 69 Jun 2011 69 78 70 Dec 2011 68 78 69 Jun 2012 66 76 66 Dec 2012 65 78 66 Jun 2013 65 79 66
BusinessDec 2008 44 70 51 Jun 2009 43 72 51 Dec 2009 43 71 51 Jun 2010 44 73 53 Dec 2010 50 76 59 Jun 2011 52 80 62 Dec 2011 52 75 59 Jun 2012 51 74 59 Dec 2012 51 73 59 Jun 2013 52 70 58
TotalDec 2008 59 73 61 Jun 2009 59 74 61 Dec 2009 60 72 62 Jun 2010 60 74 62 Dec 2010 61 76 64 Jun 2011 62 80 66 Dec 2011 61 75 64 Jun 2012 59 75 62 Dec 2012 59 74 62 Jun 2013 59 71 62
Table 7Percentage of Switched Access Lines Presubscribed for Long Distance Service
Chart 7Percent Presubscribed Interstate Long Distance Lines for ILECs
Some previously published data have been revised.
0%10%20%30%40%50%60%70%80%
Dec2008
Jun2009
Dec2009
Jun2010
Dec2010
Jun2011
Dec2011
Jun2012
Dec2012
Jun2013
Residential Business
U.S. Federal Communications Commission Local Telephone Competition: Status as of June 30, 2013 18

ILEC CLEC Total
Residential Presubscribed 24,732 2,186 26,917 Not Presubscribed 13,437 592 14,029 All Lines 38,169 2,777 40,946 Percent Presubscribed 65% 79% 66% Business Presubscribed 16,830 11,531 28,361 Not Presubscribed 15,505 5,023 20,528 All Lines 32,335 16,555 48,890 Percent Presubscribed 52% 70% 58%
Total Presubscribed 41,562 13,717 55,279 Not Presubscribed 28,942 5,615 34,557 All Lines 70,504 19,332 89,836 Percent Presubscribed 59% 71% 62%
ILEC Total CLEC Total
Residential Presubscribed 27,127 2,386 29,513 Not Presubscribed 14,378 682 15,060 All Lines 41,505 3,068 44,573 Percent Presubscribed 65% 78% 66% Business Presubscribed 17,281 13,095 30,377 Not Presubscribed 16,464 4,724 21,188 All Lines 33,746 17,820 51,565 Percent Presubscribed 51% 73% 59%
Total Presubscribed 44,408 15,482 59,889 Not Presubscribed 30,842 5,406 36,249 All Lines 75,250 20,888 96,138 Percent Presubscribed 59% 74% 62%
Some previously published data have been revised. Figures may not sum to totals due to rounding.
Table 8
June 30, 2013
December 31, 2012
Residential and Business Presubscribed Switched Access Lines(In Thousands)
U.S. Federal Communications Commission Local Telephone Competition: Status as of June 30, 2013 19
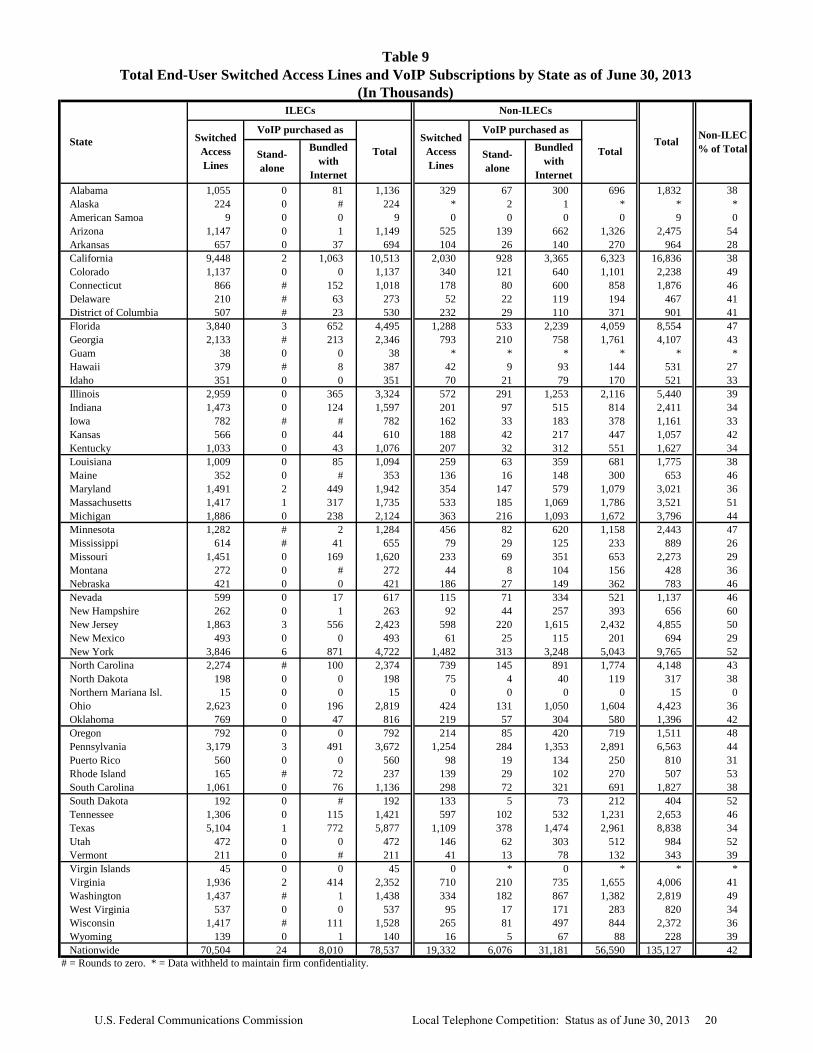
Alabama 1,055 0 81 1,136 329 67 300 696 1,832 38Alaska 224 0 # 224 * 2 1 * * *American Samoa 9 0 0 9 0 0 0 0 9 0Arizona 1,147 0 1 1,149 525 139 662 1,326 2,475 54Arkansas 657 0 37 694 104 26 140 270 964 28California 9,448 2 1,063 10,513 2,030 928 3,365 6,323 16,836 38Colorado 1,137 0 0 1,137 340 121 640 1,101 2,238 49Connecticut 866 # 152 1,018 178 80 600 858 1,876 46Delaware 210 # 63 273 52 22 119 194 467 41District of Columbia 507 # 23 530 232 29 110 371 901 41Florida 3,840 3 652 4,495 1,288 533 2,239 4,059 8,554 47Georgia 2,133 # 213 2,346 793 210 758 1,761 4,107 43Guam 38 0 0 38 * * * * * *Hawaii 379 # 8 387 42 9 93 144 531 27Idaho 351 0 0 351 70 21 79 170 521 33Illinois 2,959 0 365 3,324 572 291 1,253 2,116 5,440 39Indiana 1,473 0 124 1,597 201 97 515 814 2,411 34Iowa 782 # # 782 162 33 183 378 1,161 33Kansas 566 0 44 610 188 42 217 447 1,057 42Kentucky 1,033 0 43 1,076 207 32 312 551 1,627 34Louisiana 1,009 0 85 1,094 259 63 359 681 1,775 38Maine 352 0 # 353 136 16 148 300 653 46Maryland 1,491 2 449 1,942 354 147 579 1,079 3,021 36Massachusetts 1,417 1 317 1,735 533 185 1,069 1,786 3,521 51Michigan 1,886 0 238 2,124 363 216 1,093 1,672 3,796 44Minnesota 1,282 # 2 1,284 456 82 620 1,158 2,443 47Mississippi 614 # 41 655 79 29 125 233 889 26Missouri 1,451 0 169 1,620 233 69 351 653 2,273 29Montana 272 0 # 272 44 8 104 156 428 36Nebraska 421 0 0 421 186 27 149 362 783 46Nevada 599 0 17 617 115 71 334 521 1,137 46New Hampshire 262 0 1 263 92 44 257 393 656 60New Jersey 1,863 3 556 2,423 598 220 1,615 2,432 4,855 50New Mexico 493 0 0 493 61 25 115 201 694 29New York 3,846 6 871 4,722 1,482 313 3,248 5,043 9,765 52North Carolina 2,274 # 100 2,374 739 145 891 1,774 4,148 43North Dakota 198 0 0 198 75 4 40 119 317 38Northern Mariana Isl. 15 0 0 15 0 0 0 0 15 0Ohio 2,623 0 196 2,819 424 131 1,050 1,604 4,423 36Oklahoma 769 0 47 816 219 57 304 580 1,396 42Oregon 792 0 0 792 214 85 420 719 1,511 48Pennsylvania 3,179 3 491 3,672 1,254 284 1,353 2,891 6,563 44Puerto Rico 560 0 0 560 98 19 134 250 810 31Rhode Island 165 # 72 237 139 29 102 270 507 53South Carolina 1,061 0 76 1,136 298 72 321 691 1,827 38South Dakota 192 0 # 192 133 5 73 212 404 52Tennessee 1,306 0 115 1,421 597 102 532 1,231 2,653 46Texas 5,104 1 772 5,877 1,109 378 1,474 2,961 8,838 34Utah 472 0 0 472 146 62 303 512 984 52Vermont 211 0 # 211 41 13 78 132 343 39Virgin Islands 45 0 0 45 0 * 0 * * *Virginia 1,936 2 414 2,352 710 210 735 1,655 4,006 41Washington 1,437 # 1 1,438 334 182 867 1,382 2,819 49West Virginia 537 0 0 537 95 17 171 283 820 34Wisconsin 1,417 # 111 1,528 265 81 497 844 2,372 36Wyoming 139 0 1 140 16 5 67 88 228 39Nationwide 70,504 24 8,010 78,537 19,332 6,076 31,181 56,590 135,127 42
ILECs
VoIP purchased as
Stand-alone
Switched Access Lines
# = Rounds to zero. * = Data withheld to maintain firm confidentiality.
Total Stand-alone
Switched Access Lines
Bundled with
Internet
Table 9Total End-User Switched Access Lines and VoIP Subscriptions by State as of June 30, 2013
(In Thousands)
Non-ILEC % of TotalState
TotalTotal Bundled
with Internet
Non-ILECs
VoIP purchased as
U.S. Federal Communications Commission Local Telephone Competition: Status as of June 30, 2013 20

Alabama 643 0 74 718 68 53 241 362 1,079 33Alaska 105 0 0 105 * 2 1 * * *American Samoa 4 0 0 4 0 0 0 0 4 0Arizona 657 0 0 657 224 92 393 708 1,365 52Arkansas 386 0 33 419 10 18 106 133 552 24California 4,628 2 929 5,559 392 594 2,407 3,394 8,952 38Colorado 683 0 0 683 13 77 498 588 1,271 46Connecticut 440 # 135 575 34 57 526 617 1,192 52Delaware 100 # 60 160 3 16 111 130 290 45District of Columbia 89 # 15 105 11 11 48 69 174 40Florida 2,101 3 594 2,697 38 386 1,959 2,383 5,080 47Georgia 1,149 # 182 1,331 67 154 618 839 2,170 39Guam 22 0 0 22 * * * * * *Hawaii 197 0 0 197 # 6 84 90 287 31Idaho 209 0 0 209 17 12 54 83 291 28Illinois 1,394 0 301 1,695 50 200 1,051 1,301 2,995 43Indiana 823 0 114 938 34 65 449 548 1,486 37Iowa 497 # # 498 59 25 110 194 691 28Kansas 309 0 39 347 66 27 143 236 583 40Kentucky 628 0 26 654 43 21 271 336 989 34Louisiana 558 0 74 632 59 48 258 365 997 37Maine 252 0 0 252 8 11 133 152 404 38Maryland 662 2 427 1,092 59 95 458 612 1,704 36Massachusetts 678 1 304 983 43 127 1,004 1,173 2,156 54Michigan 939 0 204 1,143 61 172 984 1,217 2,360 52Minnesota 862 # # 862 88 60 406 553 1,415 39Mississippi 348 0 36 384 17 22 108 147 530 28Missouri 850 0 147 997 23 51 269 343 1,340 26Montana 171 0 # 171 13 4 72 90 261 34Nebraska 234 0 0 234 77 17 87 180 415 44Nevada 338 0 15 353 2 50 249 302 654 46New Hampshire 169 0 0 169 2 32 243 277 447 62New Jersey 856 3 524 1,382 49 154 1,383 1,586 2,968 53New Mexico 311 0 0 311 7 17 86 110 421 26New York 1,927 6 815 2,748 150 174 2,626 2,950 5,698 52North Carolina 1,366 # 88 1,454 21 107 754 882 2,336 38North Dakota 125 0 0 125 39 3 7 49 175 28Northern Mariana Isl. 7 0 0 7 0 0 0 0 7 0Ohio 1,473 0 165 1,638 48 81 890 1,019 2,657 38Oklahoma 435 0 42 476 96 34 212 342 818 42Oregon 497 0 0 497 12 56 365 433 931 47Pennsylvania 1,904 3 458 2,365 103 203 1,190 1,496 3,862 39Puerto Rico 411 0 0 411 1 11 106 119 529 22Rhode Island 92 # 71 163 64 18 69 150 313 48South Carolina 657 0 63 721 43 43 268 353 1,074 33South Dakota 119 0 # 119 71 4 65 139 258 54Tennessee 784 0 98 882 67 76 446 589 1,470 40Texas 2,554 1 664 3,219 141 246 1,134 1,521 4,740 32Utah 273 0 0 273 17 35 184 236 509 46Vermont 147 0 0 147 4 11 73 88 234 37Virgin Islands 28 0 0 28 0 * 0 * * *Virginia 1,020 2 385 1,406 131 134 487 752 2,158 35Washington 877 # # 877 18 132 765 914 1,791 51West Virginia 349 0 0 349 12 13 155 180 529 34Wisconsin 765 0 92 856 37 64 424 525 1,382 38Wyoming 66 0 1 67 3 3 46 52 119 44Nationwide 38,169 23 7,173 45,365 2,777 4,123 25,089 31,990 77,355 41
Non-ILECs
Stand-alone
Bundled with
Internet
Stand-alone
Bundled with
Internet
TotalSwitched
Access Lines
VoIP purchased as
Total
# = Rounds to zero. * = Data withheld to maintain firm confidentiality.
Table 10Residential End-User Switched Access Lines and VoIP Subscriptions by State as of June 30, 2013
(In Thousands)
State
ILECs
Total Non-ILEC % of Total
Switched Access Lines
VoIP purchased as
U.S. Federal Communications Commission Local Telephone Competition: Status as of June 30, 2013 21
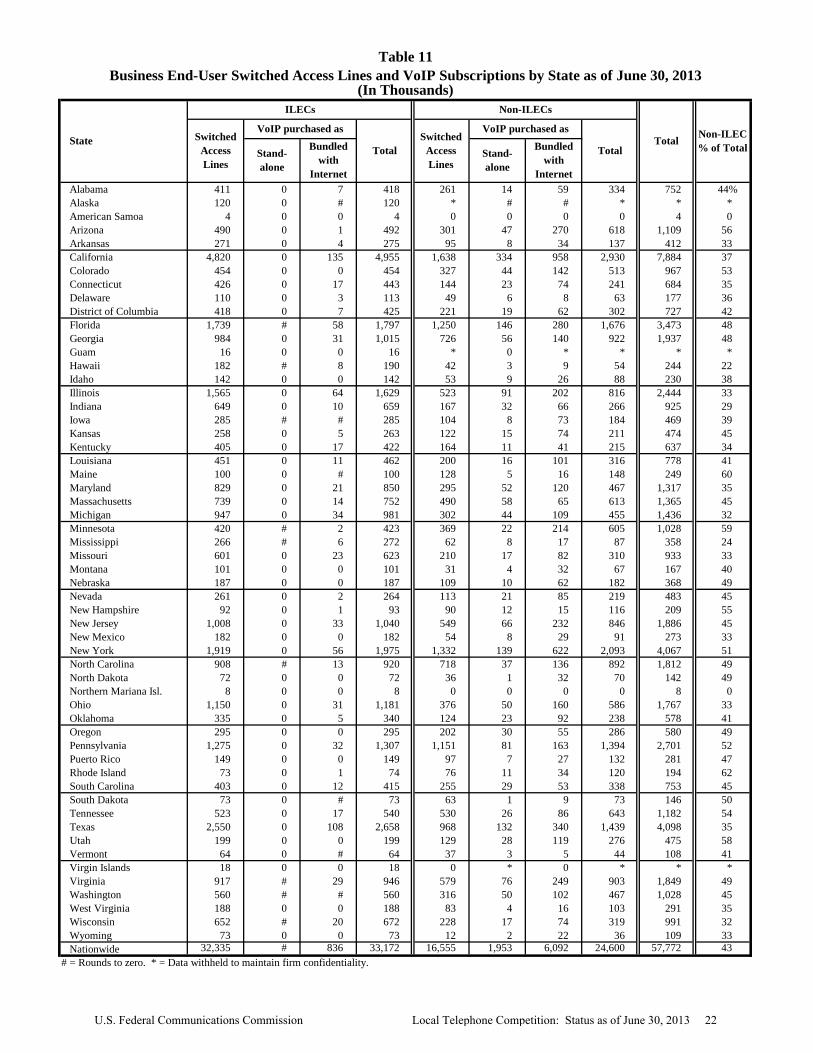
Alabama 411 0 7 418 261 14 59 334 752 44%Alaska 120 0 # 120 * # # * * * American Samoa 4 0 0 4 0 0 0 0 4 0 Arizona 490 0 1 492 301 47 270 618 1,109 56 Arkansas 271 0 4 275 95 8 34 137 412 33 California 4,820 0 135 4,955 1,638 334 958 2,930 7,884 37 Colorado 454 0 0 454 327 44 142 513 967 53 Connecticut 426 0 17 443 144 23 74 241 684 35 Delaware 110 0 3 113 49 6 8 63 177 36 District of Columbia 418 0 7 425 221 19 62 302 727 42 Florida 1,739 # 58 1,797 1,250 146 280 1,676 3,473 48 Georgia 984 0 31 1,015 726 56 140 922 1,937 48 Guam 16 0 0 16 * 0 * * * * Hawaii 182 # 8 190 42 3 9 54 244 22 Idaho 142 0 0 142 53 9 26 88 230 38 Illinois 1,565 0 64 1,629 523 91 202 816 2,444 33 Indiana 649 0 10 659 167 32 66 266 925 29 Iowa 285 # # 285 104 8 73 184 469 39 Kansas 258 0 5 263 122 15 74 211 474 45 Kentucky 405 0 17 422 164 11 41 215 637 34 Louisiana 451 0 11 462 200 16 101 316 778 41 Maine 100 0 # 100 128 5 16 148 249 60 Maryland 829 0 21 850 295 52 120 467 1,317 35 Massachusetts 739 0 14 752 490 58 65 613 1,365 45 Michigan 947 0 34 981 302 44 109 455 1,436 32 Minnesota 420 # 2 423 369 22 214 605 1,028 59 Mississippi 266 # 6 272 62 8 17 87 358 24 Missouri 601 0 23 623 210 17 82 310 933 33 Montana 101 0 0 101 31 4 32 67 167 40 Nebraska 187 0 0 187 109 10 62 182 368 49 Nevada 261 0 2 264 113 21 85 219 483 45 New Hampshire 92 0 1 93 90 12 15 116 209 55 New Jersey 1,008 0 33 1,040 549 66 232 846 1,886 45 New Mexico 182 0 0 182 54 8 29 91 273 33 New York 1,919 0 56 1,975 1,332 139 622 2,093 4,067 51 North Carolina 908 # 13 920 718 37 136 892 1,812 49 North Dakota 72 0 0 72 36 1 32 70 142 49 Northern Mariana Isl. 8 0 0 8 0 0 0 0 8 0 Ohio 1,150 0 31 1,181 376 50 160 586 1,767 33 Oklahoma 335 0 5 340 124 23 92 238 578 41 Oregon 295 0 0 295 202 30 55 286 580 49 Pennsylvania 1,275 0 32 1,307 1,151 81 163 1,394 2,701 52 Puerto Rico 149 0 0 149 97 7 27 132 281 47 Rhode Island 73 0 1 74 76 11 34 120 194 62 South Carolina 403 0 12 415 255 29 53 338 753 45 South Dakota 73 0 # 73 63 1 9 73 146 50 Tennessee 523 0 17 540 530 26 86 643 1,182 54 Texas 2,550 0 108 2,658 968 132 340 1,439 4,098 35 Utah 199 0 0 199 129 28 119 276 475 58 Vermont 64 0 # 64 37 3 5 44 108 41 Virgin Islands 18 0 0 18 0 * 0 * * * Virginia 917 # 29 946 579 76 249 903 1,849 49 Washington 560 # # 560 316 50 102 467 1,028 45 West Virginia 188 0 0 188 83 4 16 103 291 35 Wisconsin 652 # 20 672 228 17 74 319 991 32 Wyoming 73 0 0 73 12 2 22 36 109 33 Nationwide 32,335 # 836 33,172 16,555 1,953 6,092 24,600 57,772 43
Non-ILECs
Stand-alone
Bundled with
Internet
Stand-alone
Bundled with
Internet
TotalSwitched
Access Lines
VoIP purchased as
Total
# = Rounds to zero. * = Data withheld to maintain firm confidentiality.
Table 11Business End-User Switched Access Lines and VoIP Subscriptions by State as of June 30, 2013
(In Thousands)
State
ILECs
Total Non-ILEC % of Total
Switched Access Lines
VoIP purchased as
U.S. Federal Communications Commission Local Telephone Competition: Status as of June 30, 2013 22

Alabama 21 % 24 % 28 % 30 % 31 % 32 % 34 % 36 % 38 %Alaska * * * * * * * * *American Samoa 0 0 0 0 0 0 0 0 0Arizona 40 42 44 46 46 48 49 51 54Arkansas 19 20 22 22 24 24 26 27 28California 23 25 27 28 30 32 34 36 38Colorado 32 34 36 39 40 42 45 47 49Connecticut 31 33 35 37 39 41 43 44 46Delaware 31 32 34 35 37 38 39 40 41District of Columbia 20 21 31 32 34 35 37 39 41Florida 28 31 36 39 40 42 44 46 47Georgia 26 27 31 33 34 36 38 40 43Guam * * * * * * * * *Hawaii 19 21 22 24 24 26 28 26 27Idaho 18 19 25 28 26 27 30 31 33Illinois 24 25 27 30 32 33 35 37 39Indiana 19 20 23 25 27 28 30 32 34Iowa 22 24 26 27 28 29 30 32 33Kansas 31 32 34 36 37 38 40 41 42Kentucky 27 28 29 33 32 35 31 32 34Louisiana 25 27 30 32 33 34 37 37 38Maine 33 36 38 39 40 42 42 45 46Maryland 26 27 28 30 31 32 35 36 36Massachusetts 40 42 44 49 52 53 55 53 51Michigan 30 33 34 36 38 39 41 42 44Minnesota 32 34 36 37 38 43 43 45 47Mississippi 17 20 23 25 22 23 25 25 26Missouri 18 20 22 23 24 25 26 27 29Montana 22 23 24 26 29 31 33 35 36Nebraska 35 38 39 42 42 42 43 44 46Nevada 31 33 36 39 40 42 43 44 46New Hampshire 45 49 51 54 55 56 57 59 60New Jersey 36 38 40 46 47 49 50 51 50New Mexico 15 17 19 21 22 24 26 27 29New York 42 44 46 49 50 51 52 52 52North Carolina 25 27 33 35 36 37 39 41 43North Dakota 31 35 36 38 37 38 38 38 38Northern Mariana Isl. 0 0 0 0 0 0 0 0 0Ohio 26 28 29 31 32 33 34 36 36Oklahoma 30 34 35 38 39 40 41 41 42Oregon 32 34 36 39 41 42 44 46 48Pennsylvania 30 32 35 38 40 41 42 43 44Puerto Rico 25 22 26 25 25 25 27 29 31Rhode Island 53 54 54 58 60 59 59 57 53South Carolina 24 26 30 32 32 33 35 36 38South Dakota 36 44 45 47 48 50 51 52 52Tennessee 25 28 33 36 37 39 41 44 46Texas 22 23 24 25 27 28 30 32 34Utah 32 34 36 38 39 44 46 50 52Vermont 23 27 29 31 34 35 36 37 39Virgin Islands 0 * * * * * * * *Virginia 32 34 33 35 36 37 38 40 41Washington 32 35 37 40 42 44 46 47 49West Virginia 24 27 29 30 31 32 33 34 34Wisconsin 26 27 27 30 31 32 33 35 36Wyoming 21 22 24 26 29 33 36 37 39 Nationwide 28 % 30 % 32 % 35 % 36 % 38 % 39 % 41 % 42 %
20132010Dec Jun
2012Dec
Table 12Non-ILEC Share of Total End-User Switched Access Lines and VoIP Subscriptions by State1
JunJunDec Jun2011
* = Data withheld to maintain firm confidentiality. NA = Not available. Some previously published data have bee
Jun
1 See footnote 1, Table 1.
State 2009Dec
U.S. Federal Communications Commission Local Telephone Competition: Status as of June 30, 2013 23

2013Jun Dec Jun Dec Jun Dec Jun Dec Jun
Alabama 453 494 594 622 620 634 646 675 696Alaska * * * * * * * * *American Samoa 0 0 0 0 0 0 0 0 0Arizona 1,173 1,193 1,236 1,244 1,203 1,228 1,251 1,289 1,326Arkansas 224 230 248 250 257 253 262 267 270California 4,764 4,857 5,166 5,342 5,515 5,655 5,980 6,225 6,323Colorado 825 837 884 929 944 967 1,019 1,075 1,101Connecticut 644 680 706 751 782 799 830 846 858Delaware 166 165 173 174 177 179 183 184 194District of Columbia 180 190 300 314 337 343 347 364 371Florida 2,737 2,907 3,525 3,729 3,690 3,848 3,957 4,079 4,059Georgia 1,133 1,173 1,370 1,410 1,427 1,496 1,585 1,668 1,761Guam * * * * * * * * *Hawaii 117 125 128 138 137 147 154 143 144Idaho 117 123 159 177 149 150 166 168 170Illinois 1,614 1,634 1,658 1,826 1,899 1,909 2,022 2,043 2,116Indiana 562 592 647 691 719 750 767 779 814Iowa 310 322 344 354 360 363 373 376 378Kansas 413 408 429 436 440 437 445 440 447Kentucky 508 521 546 621 591 636 528 513 551Louisiana 507 539 602 642 640 635 702 671 681Maine 250 274 282 283 285 293 295 300 300Maryland 891 911 912 961 981 1,015 1,109 1,134 1,079Massachusetts 1,592 1,643 1,695 1,967 2,198 2,169 2,311 2,007 1,786Michigan 1,451 1,501 1,518 1,576 1,580 1,586 1,625 1,614 1,672Minnesota 864 905 927 942 956 1,107 1,068 1,109 1,158Mississippi 184 214 252 267 227 227 235 229 233Missouri 518 553 598 611 606 611 631 633 653Montana 103 104 109 117 127 137 147 151 156Nebraska 302 332 330 359 348 342 350 353 362Nevada 411 416 451 476 471 493 508 516 521New Hampshire 351 376 388 395 397 396 405 398 393New Jersey 1,986 2,004 2,104 2,464 2,530 2,574 2,635 2,615 2,432New Mexico 128 138 157 168 171 177 189 196 201New York 4,578 4,710 4,807 5,295 5,222 5,212 5,322 5,319 5,043North Carolina 1,137 1,200 1,480 1,557 1,535 1,589 1,648 1,718 1,774North Dakota 104 123 126 129 124 124 123 122 119Northern Mariana Isl. 0 0 0 0 0 0 0 0 0Ohio 1,450 1,492 1,550 1,615 1,563 1,589 1,614 1,656 1,604Oklahoma 504 570 572 621 619 617 628 606 580Oregon 563 582 615 631 650 659 696 706 719Pennsylvania 2,176 2,201 2,422 2,650 2,759 2,787 2,854 2,909 2,891Puerto Rico 234 170 244 231 228 224 226 238 250Rhode Island 311 311 308 353 383 360 357 313 270South Carolina 497 535 622 645 623 640 659 670 691South Dakota 136 183 188 193 199 209 211 212 212Tennessee 726 791 966 1,020 1,051 1,084 1,126 1,170 1,231Texas 2,358 2,372 2,452 2,498 2,556 2,586 2,754 2,843 2,961Utah 342 353 362 371 375 427 445 493 512Vermont 91 102 110 116 126 129 129 130 132Virgin Islands # * * * * * * * *Virginia 1,476 1,565 1,463 1,497 1,523 1,527 1,552 1,599 1,655Washington 1,025 1,095 1,162 1,221 1,229 1,257 1,334 1,349 1,382West Virginia 214 235 248 269 270 280 288 290 283Wisconsin 755 771 728 791 794 804 819 847 844Wyoming 53 54 58 62 68 79 87 86 88 Total 44,351 45,927 49,077 52,155 52,820 53,892 55,744 56,481 56,590# = Rounds to zero. * = Data withheld to maintain firm confidentiality. Some previously published data have been revised. 1 See footnote 1, Table 1.
State
Table 13Non-ILEC Total End-User Switched Access Lines and VoIP Subscriptions by State1
(In Thousands)20102009 2011 2012
U.S. Federal Communications Commission Local Telephone Competition: Status as of June 30, 2013 24

2013Jun Dec Jun Dec Jun Dec Jun Dec Jun
Alabama 1,665 1,579 1,506 1,438 1,386 1,322 1,263 1,201 1,136Alaska 282 273 271 260 257 247 243 228 224American Samoa 10 10 10 10 9 9 9 9 9Arizona 1,741 1,649 1,563 1,476 1,409 1,343 1,279 1,224 1,149Arkansas 982 941 904 865 827 789 756 725 694California 15,555 14,796 14,118 13,455 12,786 12,197 11,614 11,067 10,513Colorado 1,758 1,656 1,569 1,473 1,409 1,329 1,270 1,207 1,137Connecticut 1,463 1,389 1,326 1,268 1,214 1,165 1,111 1,060 1,018Delaware 363 344 331 317 307 297 288 279 273District of Columbia 714 697 680 679 644 627 595 561 530Florida 6,918 6,491 6,138 5,798 5,508 5,259 4,992 4,743 4,495Georgia 3,304 3,156 3,011 2,881 2,779 2,659 2,561 2,455 2,346Guam 51 49 48 48 45 42 40 40 38Hawaii 489 473 455 444 431 419 406 397 387Idaho 550 514 486 455 433 404 395 375 351Illinois 5,086 4,812 4,581 4,313 4,078 3,852 3,705 3,507 3,324Indiana 2,434 2,300 2,186 2,064 1,945 1,894 1,780 1,677 1,597Iowa 1,077 1,024 987 940 917 882 850 817 782Kansas 899 858 820 774 737 700 669 638 610Kentucky 1,387 1,352 1,317 1,272 1,238 1,195 1,155 1,111 1,076Louisiana 1,561 1,489 1,426 1,369 1,318 1,255 1,205 1,147 1,094Maine 519 482 463 438 428 407 401 367 353Maryland 2,520 2,403 2,333 2,262 2,193 2,128 2,062 1,993 1,942Massachusetts 2,369 2,238 2,149 2,065 1,991 1,926 1,858 1,797 1,735Michigan 3,323 3,113 2,952 2,757 2,619 2,513 2,382 2,240 2,124Minnesota 1,826 1,725 1,666 1,583 1,537 1,468 1,419 1,350 1,284Mississippi 922 879 848 813 783 752 723 690 655Missouri 2,367 2,259 2,162 2,055 1,961 1,866 1,788 1,711 1,620Montana 371 351 342 327 318 302 295 282 272Nebraska 564 543 521 501 489 474 460 443 421Nevada 911 856 809 759 719 691 673 646 617New Hampshire 435 385 366 342 326 312 304 279 263New Jersey 3,519 3,288 3,112 2,937 2,807 2,700 2,587 2,496 2,423New Mexico 713 682 651 618 595 569 546 522 493New York 6,234 5,900 5,653 5,416 5,258 5,099 4,943 4,823 4,722North Carolina 3,335 3,189 3,045 2,886 2,779 2,691 2,584 2,474 2,374North Dakota 233 224 220 213 210 206 204 201 198Northern Mariana Isl. 17 16 16 16 15 15 15 15 15Ohio 4,124 3,914 3,719 3,515 3,342 3,172 3,100 2,957 2,819Oklahoma 1,169 1,117 1,070 1,022 981 939 907 869 816Oregon 1,210 1,140 1,080 1,003 949 895 880 833 792Pennsylvania 5,029 4,771 4,571 4,387 4,217 4,055 3,894 3,796 3,672Puerto Rico 698 610 706 707 689 655 625 583 560Rhode Island 281 270 264 260 255 252 245 240 237South Carolina 1,561 1,488 1,429 1,368 1,330 1,284 1,236 1,183 1,136South Dakota 244 233 227 217 212 205 202 197 192Tennessee 2,170 2,061 1,962 1,846 1,774 1,681 1,599 1,512 1,421Texas 8,307 7,999 7,678 7,360 7,046 6,725 6,431 6,159 5,877Utah 725 690 657 614 586 554 529 502 472Vermont 299 280 265 253 245 237 234 218 211Virgin Islands 59 57 59 58 56 53 49 49 45Virginia 3,160 3,050 2,944 2,811 2,705 2,633 2,518 2,432 2,352Washington 2,211 2,071 1,962 1,815 1,722 1,621 1,572 1,492 1,438West Virginia 677 637 606 628 603 588 580 559 537Wisconsin 2,156 2,051 1,970 1,874 1,807 1,715 1,665 1,589 1,528Wyoming 200 190 183 175 168 160 153 146 140 Total 112,748 107,018 102,395 97,497 93,394 89,427 85,848 82,114 78,537Some previously published data have been revised. 1 See footnote 1, Table 1.
State 2009 2010 2011 2012
Table 14ILEC Total End-User Switched Access Lines and VoIP Subscriptions by State1
(In Thousands)
U.S. Federal Communications Commission Local Telephone Competition: Status as of June 30, 2013 25

Non-ILEC Methods of Providing Wireline Telephone Services by Stateas of June 30, 2013
State Resold LEC service ILEC UNEs CLEC-owned local loops
VoIP Subscriptions1 Total
Alabama 93 145 91 367 696Alaska * * * * *American Samoa 0 0 0 0 0Arizona 146 74 304 801 1,326Arkansas 22 19 63 166 270California 1,100 464 463 4,293 6,323Colorado 151 133 56 761 1,101Connecticut 51 45 82 681 858Delaware 35 17 1 141 194District of Columbia 190 21 21 139 371Florida 626 512 150 2,771 4,059Georgia 273 386 135 968 1,761Guam * * * * *Hawaii 15 # 27 102 144Idaho 17 23 29 100 170Illinois 259 199 114 1,544 2,116Indiana 61 63 77 612 814Iowa 52 31 80 216 378Kansas 38 33 117 258 447Kentucky 78 83 47 344 551Louisiana 83 98 79 422 681Maine 22 55 60 164 300Maryland 218 117 19 725 1,079Massachusetts 305 179 50 1,253 1,786Michigan 101 215 47 1,309 1,672Minnesota 127 185 144 702 1,158Mississippi 36 36 7 154 233Missouri 60 121 52 420 653Montana 7 10 27 112 156Nebraska 69 9 108 176 362Nevada 66 32 17 405 521New Hampshire 36 43 13 301 393New Jersey 380 134 84 1,835 2,432New Mexico 30 11 21 140 201New York 710 389 383 3,561 5,043North Carolina 306 304 129 1,035 1,774North Dakota 4 12 59 44 119Northern Mariana Isl. 0 0 0 0 0Ohio 155 161 108 1,180 1,604Oklahoma 67 45 108 361 580Oregon 57 102 57 505 719Pennsylvania 611 386 257 1,636 2,891Puerto Rico * 37 * 152 250Rhode Island 33 16 90 131 270South Carolina 98 107 93 393 691South Dakota 9 6 119 79 212Tennessee 215 245 137 634 1,231Texas 357 416 334 1,852 2,961Utah 52 58 37 365 512Vermont 7 18 16 91 132Virgin Islands * * * * *Virginia 342 131 236 945 1,655Washington 114 159 61 1,048 1,382West Virginia 32 49 14 188 283Wisconsin 51 164 50 579 844Wyoming 5 6 4 73 88 Total 7,984 6,320 5,023 37,257 56,590
1 See footnote 1, Table 1.
(In Thousands)
# = Rounds to zero. * = Data withheld to maintain firm confidentiality. Figures may not sum to totals due to rounding.
Table 15
U.S. Federal Communications Commission Local Telephone Competition: Status as of June 30, 2013 26
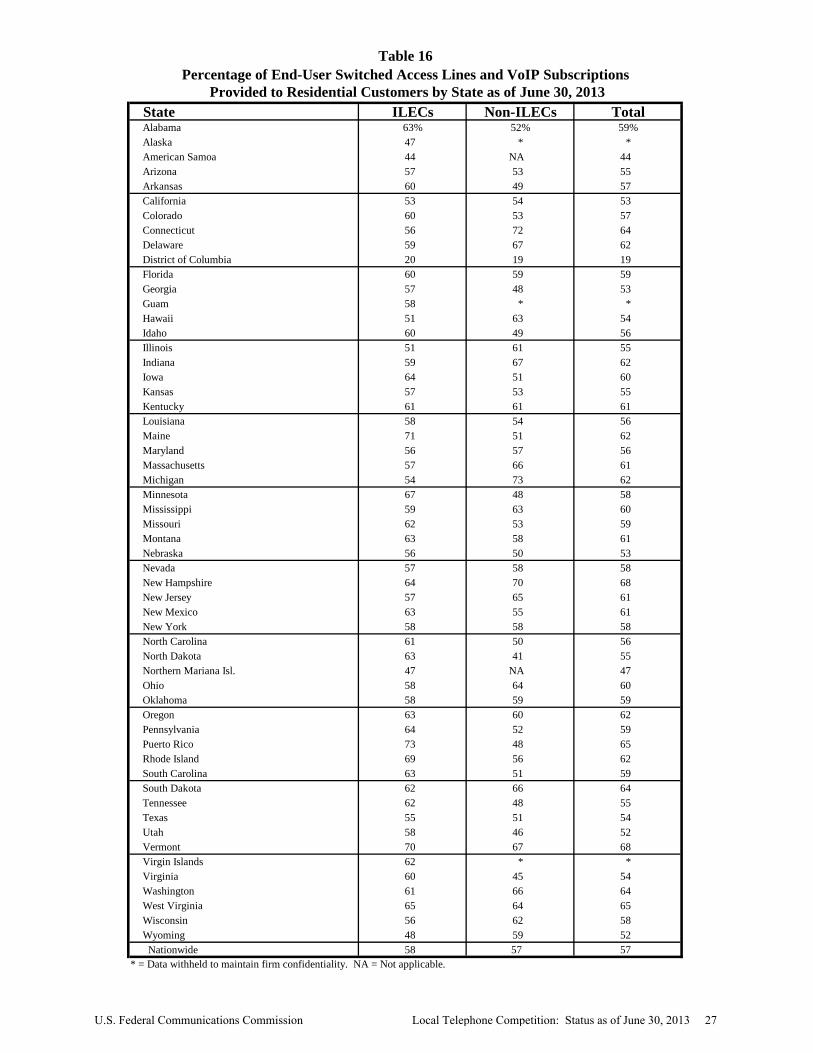
State ILECs Non-ILECs TotalAlabama 63% 52% 59%Alaska 47 * *American Samoa 44 NA 44 Arizona 57 53 55 Arkansas 60 49 57 California 53 54 53 Colorado 60 53 57 Connecticut 56 72 64 Delaware 59 67 62 District of Columbia 20 19 19 Florida 60 59 59 Georgia 57 48 53
Guam 58 * *Hawaii 51 63 54 Idaho 60 49 56 Illinois 51 61 55 Indiana 59 67 62 Iowa 64 51 60 Kansas 57 53 55 Kentucky 61 61 61 Louisiana 58 54 56 Maine 71 51 62 Maryland 56 57 56 Massachusetts 57 66 61 Michigan 54 73 62 Minnesota 67 48 58 Mississippi 59 63 60 Missouri 62 53 59 Montana 63 58 61 Nebraska 56 50 53 Nevada 57 58 58 New Hampshire 64 70 68 New Jersey 57 65 61 New Mexico 63 55 61 New York 58 58 58 North Carolina 61 50 56 North Dakota 63 41 55 Northern Mariana Isl. 47 NA 47 Ohio 58 64 60 Oklahoma 58 59 59 Oregon 63 60 62 Pennsylvania 64 52 59 Puerto Rico 73 48 65 Rhode Island 69 56 62 South Carolina 63 51 59 South Dakota 62 66 64 Tennessee 62 48 55 Texas 55 51 54 Utah 58 46 52 Vermont 70 67 68 Virgin Islands 62 * *Virginia 60 45 54 Washington 61 66 64 West Virginia 65 64 65 Wisconsin 56 62 58 Wyoming 48 59 52 Nationwide 58 57 57
* = Data withheld to maintain firm confidentiality. NA = Not applicable.
Table 16Percentage of End-User Switched Access Lines and VoIP Subscriptions
Provided to Residential Customers by State as of June 30, 2013
U.S. Federal Communications Commission Local Telephone Competition: Status as of June 30, 2013 27

State ILECs Non-ILECs Total1 VoIP Providers2
Alabama 20 134 147 112 Alaska 17 31 47 30 American Samoa 1 0 1 0 Arizona 15 140 151 125 Arkansas 20 102 118 83 California 17 198 211 167 Colorado 26 159 182 137 Connecticut 2 116 116 101 Delaware 1 92 93 78 District of Columbia 1 99 100 83 Florida 12 221 228 180 Georgia 27 186 203 153 Guam 1 4 5 3
Hawaii 2 47 48 43 Idaho 17 90 100 77 Illinois 44 191 223 152 Indiana 29 144 164 114 Iowa 134 136 241 91 Kansas 38 127 152 102 Kentucky 17 145 153 116 Louisiana 10 123 127 100 Maine 7 80 84 66 Maryland 2 154 154 129 Massachusetts 4 140 141 120 Michigan 25 148 164 119 Minnesota 47 142 173 109 Mississippi 13 107 114 87 Missouri 31 134 157 110 Montana 17 80 90 64 Nebraska 30 100 123 78 Nevada 12 111 121 102 New Hampshire 6 99 105 86 New Jersey 3 164 164 138 New Mexico 16 98 107 78 New York 25 190 204 156 North Carolina 19 160 170 132 North Dakota 23 78 94 58 Northern Mariana Isl 1 0 1 0 Ohio 33 157 180 129 Oklahoma 38 109 142 88 Oregon 23 130 149 109 Pennsylvania 22 177 190 149 Puerto Rico 1 16 16 15 Rhode Island 1 82 83 67 South Carolina 17 137 143 108 South Dakota 29 71 92 56 Tennessee 18 145 158 118 Texas 52 228 262 173 Utah 13 103 113 89 Vermont 7 74 80 63 Virgin Islands 1 1 2 1 Virginia 15 147 156 127 Washington 16 146 158 126 West Virginia 6 96 99 85 Wisconsin 40 146 170 112 Wyoming 9 84 88 71 Nationwide 754 940 1,469 626
2 The providers reporting interconnected VoIP subscribers in a state are a subset of the ILECs and non-ILECs in that state.
Table 17Number of Reporting ILECs, Non-ILECs, and VoIP Providers by State
as of June 30, 2013
1 Providers that report both ILEC and non-ILEC operations in a state are counted once in the ILECs column and once in the Non-ILECs column and once in the Total column for that state. Either type of operations might report interconnected VoIP subscribers.
U.S. Federal Communications Commission Local Telephone Competition: Status as of June 30, 2013 28
2013Jun Dec Jun Dec Jun Dec Jun Dec Jun
Alabama 8 16 % 4,003 4,228 4,211 4,328 4,350 4,486 4,545 4,549 4,504Alaska 11 6 544 586 590 608 619 634 642 649 657American Samoa * * * * * * * * * * * Arizona 7 12 5,005 5,101 5,268 5,285 5,402 5,532 5,685 5,774 5,869Arkansas 5 22 2,576 2,519 2,485 2,673 2,773 3,157 3,185 2,963 2,892California 8 5 32,215 32,938 33,548 33,839 34,299 34,844 35,103 35,616 35,791Colorado 12 9 4,357 4,503 4,647 4,687 4,705 4,767 4,817 4,878 4,945Connecticut 4 8 3,047 3,123 3,192 3,230 3,305 3,353 3,379 3,418 3,425Delaware 5 9 779 803 859 851 881 892 899 903 907District of Columbia 5 9 1,116 1,183 1,227 1,249 1,273 1,348 1,376 1,400 1,367Florida 6 11 16,425 16,744 16,895 17,251 17,613 17,893 18,135 18,369 18,514Georgia 9 16 8,562 8,863 8,869 9,063 9,137 9,648 10,051 10,054 9,911Guam 4 1 * * * * 139 * 154 153 147Hawaii 6 6 1,196 1,216 1,248 1,252 1,274 1,295 1,313 1,339 1,346Idaho 11 9 1,180 1,221 1,269 1,277 1,293 1,321 1,346 1,363 1,378Illinois 11 12 11,070 11,523 11,604 12,057 12,259 12,698 12,898 12,859 12,751Indiana 9 14 4,983 5,205 5,289 5,410 5,496 5,573 5,670 5,786 5,836Iowa 64 10 2,336 2,432 2,466 2,535 2,559 2,655 2,714 2,777 2,770Kansas 11 17 2,430 2,466 2,491 2,560 2,570 2,651 2,686 2,696 2,763Kentucky 9 15 3,439 3,631 3,654 3,726 3,754 3,812 3,879 3,976 3,951Louisiana 9 16 4,053 3,993 3,953 4,340 4,876 5,413 5,336 4,898 4,714Maine 5 25 1,006 1,065 1,040 1,124 1,090 1,176 1,192 1,204 1,207Maryland 7 12 5,260 5,323 5,500 5,560 5,665 6,024 6,146 6,116 5,869Massachusetts 4 10 6,027 6,171 6,367 6,316 6,419 6,522 6,626 6,703 6,757Michigan 7 15 8,171 8,576 8,690 8,861 9,391 9,239 9,292 9,598 9,747Minnesota 7 14 4,254 4,439 4,611 4,704 4,782 4,934 5,063 5,154 5,248Mississippi 7 14 2,361 2,345 2,322 2,440 2,516 2,656 2,718 2,656 2,642Missouri 9 14 4,985 5,129 5,141 5,309 5,458 5,629 5,708 5,668 5,653Montana 8 16 707 802 783 846 803 862 880 888 897Nebraska 10 10 1,508 1,515 1,566 1,523 1,542 1,647 1,668 1,675 1,708Nevada 7 14 2,325 2,393 2,417 2,453 2,490 2,559 2,595 2,611 2,650New Hampshire 5 14 1,075 1,125 1,141 1,170 1,171 1,204 1,212 1,225 1,221New Jersey 5 7 8,036 8,158 8,624 8,601 8,786 8,916 8,933 9,015 8,953New Mexico 8 9 1,550 1,624 1,668 1,689 1,662 1,690 1,716 1,737 1,756New York 6 13 18,193 18,882 19,303 19,504 19,938 20,202 20,387 20,715 20,810North Carolina 11 14 7,865 8,108 8,259 8,526 8,513 9,106 9,206 8,985 8,926North Dakota 6 12 562 618 590 623 615 640 666 683 689Northern Mariana Isl. * * * * * * * * * * * Ohio 9 13 9,456 10,059 10,236 10,511 10,936 11,122 11,381 11,549 11,798Oklahoma 14 21 2,988 3,077 3,109 3,188 3,259 3,432 3,593 3,940 3,889Oregon 7 9 3,112 3,235 3,297 3,340 3,355 3,423 3,456 3,519 3,545Pennsylvania 12 14 10,455 10,867 11,070 11,424 11,401 11,581 11,704 11,956 12,083Puerto Rico 5 10 2,706 2,807 2,879 3,014 3,004 2,989 2,969 3,047 3,073Rhode Island 4 15 880 893 906 920 935 957 999 1,032 1,009South Carolina 12 20 3,702 3,896 3,848 3,935 3,987 3,782 3,901 4,325 4,438South Dakota 8 14 613 681 681 728 690 724 741 750 750Tennessee 9 13 5,676 5,914 6,041 6,193 6,236 6,375 6,445 6,484 6,436Texas 16 9 21,403 21,849 22,201 23,030 23,482 23,751 24,102 24,553 24,895Utah 9 7 2,109 2,166 2,220 2,251 2,276 2,328 2,368 2,409 2,432Vermont 5 19 398 463 431 485 471 507 519 518 522Virgin Islands * * * * * * 117 117 * 113 * Virginia 8 11 6,596 7,250 7,440 7,595 7,622 7,777 7,839 7,900 7,905Washington 8 9 5,671 5,816 5,965 6,022 6,118 6,250 6,314 6,424 6,433West Virginia 8 22 1,315 1,401 1,406 1,500 1,506 1,650 1,671 1,598 1,556Wisconsin 10 13 4,317 4,546 4,599 4,730 4,895 4,931 4,945 5,037 5,070Wyoming 10 13 429 517 501 526 514 532 541 545 547Nationwide 167 12 % 265,332 274,283 278,918 285,118 290,318 297,404 301,516 304,838 305,742
Jun 2013
Carriers
* = Data withheld to maintain firm confidentiality. Some previously published data have been revised.1 Percentage of mobile telephony subscribers purchasing their service subscriptions from a mobile wireless
2011
Table 18Mobile Telephone Facilities-based Carriers and Mobile Telephony Subscribers
Subscribers (In Thousands)2009State %
Resold 12010 2012
U.S. Federal Communications Commission Local Telephone Competition: Status as of June 30, 2013 29

Technical Notes
General Detailed information about FCC Form 477 reporting requirements is available at www.fcc.gov/form477. See Glossary for definitions of terms used in this report. Counting lines and subscribers
• Form 477 counts both switched access lines and interconnected VoIP subscriptions as the maximum number of calls that may be active, simultaneously, from the end user’s location under the purchased service plan. All VoIP subscriptions discussed in this report are interconnected VoIP subscriptions.
• Form 477 data may not count all VoIP phone connections to Internet Protocol Private Branch
Exchange (IP PBX) equipment that is owned by business end users because of the variety of ways the IP PBX may connect to the public switched telephone network.
Holding company-subsidiary relationships
• When counting service providers who have any retail customers in a particular geography, we count a holding company or common-control entity no more than once in any specified sub-category of total providers.
• Nationwide counts of providers are unique counts for any specified sub-category of total
providers (for example, all non-ILECs or all interconnected VoIP providers); an entity operating in multiple states is counted only once.
ILEC-CLEC affiliations
• Lines from CLECs who have ILEC affiliates are handled at the state level in one of several ways.
We place the lines into the non-ILEC category if the affiliate is an ILEC other than AT&T or Verizon. Lines from CLEC affiliates of AT&T and Verizon are allocated between the ILEC and non-ILEC categories based on staff estimates if the CLEC operates in the AT&T or Verizon ILEC service area in the state, respectively.
U.S. Federal Communications Commission Local Telephone Competition: Status as of June 30, 2013 30

Glossary Term Definition Broadband bundle The purchase, from the same or affiliated retailers, of interconnected
VoIP service and broadband Internet access service, either for a single price or for separate prices.
Cable modem service A service which offers customers access to the Internet over a cable system at broadband speeds.
Circuit switching A method of completing electronic communications in which a transmission path is established for dedicated use by a communication; the basis of the public switched telephone network (PSTN).
CLEC Competitive Local Exchange Carrier: A new LEC that operates within the service area of an ILEC.
DSL Digital Subscriber Line: A digital local loop, typically using copper facilities, that frequently is used to offer customers access to the Internet at broadband speeds.
End users Residential, business, institutional, or government entities that use services for their own purposes and who do not resell such services to other entities.
Fixed wireless service A radio communication service between specified fixed points. FTTP or FTTH Fiber to the Premises (Home): A network access architecture in which
optical fiber is deployed all the way to the customer’s premises (home). Internet access service Service that provides end users access to the Internet. ILEC Incumbent Local Exchange Carrier: A company or cooperative that was
providing telephone service in a localized area, typically on a monopoly basis, prior to enactment of the Telecommunications Act of 1996.
Internet protocol or IP A language and set of formal rules that govern how packets transit the Internet.
Interconnected VoIP or iVoIP
A service that enables real-time, two-way voice communications; requires a broadband connection from the user’s location; requires Internet-protocol compatible customer premises equipment; and permits users generally to receive calls that originate on the public switched telephone network and to terminate calls to the public switched telephone network.
LEC Local Exchange Carrier: A company that provides telephone service within a localized area and access services that connect its customers to long-distance (Interexchange Carrier) networks.
Local loop The physical connection between the customer’s premises and the telephone company’s local switching office, typically provided using copper, fiber, or a combination of copper and fiber facilities.
Mobile wireless service A radio communication service between mobile and fixed stations, or between mobile stations.
Nomadic interconnected VoIP
A service whose terms allow use over any broadband connection available to the subscriber (such as at a hotel or vacation residence); by contrast, a non-nomadic service subscription must be used over a single predetermined broadband connection.
U.S. Federal Communications Commission Local Telephone Competition: Status as of June 30, 2013 31
Non-ILEC Any provider of communications services who does not have ILEC
regulatory status. Other ILEC An ILEC who is not an RBOC. Other wireline All copper-wire based transmission technologies other than DSL
technologies; Ethernet over copper and T-1 are examples. OTT Over-the-top: Interconnected VoIP service provided by entities that
neither own nor operate telecommunications facilities. Packet switching A method of completing electronic communications in which the
information is disassembled into discrete packets that are transmitted independently and later reassembled; IP is an example.
PBX Private Branch Exchange: A telephone switch that is owned or leased by the telephone company’s customer and generally located on the customer’s premises.
Retail local telephone service
Retail switched access lines and interconnected VoIP subscriptions.
Retail switched access lines Switched access lines for which an end user is the customer. Standalone interconnected VoIP
The purchase of interconnected VoIP service without the purchase of broadband Internet access service from the same retailer, or from an affiliated retailer.
Special access circuit A dedicated, non-switched circuit (connection or line) provided by an ILEC, commonly used to connect an end user to another communications service provider; also frequently used by wireless service providers to connect cell towers to mobile switching centers (MSCs).
Switched access line A service connection between an end user and the local telephone company’s switch; the basis of plain old telephone service (POTS).
Total ILEC lines The sum of ILEC-reported retail switched access lines, interconnected VoIP subscriptions, wholesale switched access lines, and UNEs provided to CLECs.
UNE Unbundled Network Element: A physical or functional element of an ILEC network that must be provided to a CLEC at a cost-based price, as provide for in the Telecommunications Act of 1996.
UNE-L UNE-Loop: An ILEC unbundled local loop provided to a CLEC at a cost-base price.
UNE-P UNE-Platform: The combination of ILEC unbundled local loop, switching, and transport, provided to a CLEC at cost-based prices.
Wholesale switched access lines
Local telephone service provided to an unaffiliated telephone company, which resells the service to end users; typically provided by an ILEC to a CLEC.
U.S. Federal Communications Commission Local Telephone Competition: Status as of June 30, 2013 32

Customer Response Publication: Local Telephone Competition: Status as of June 30, 2013 You can help us provide the best possible information to the public by completing this form and returning it to the Industry Analysis and Technology Division of the FCC's Wireline Competition Bureau. 1. Please check the category that best describes you: ____ press ____ current telecommunications carrier ____ potential telecommunications carrier ____ business customer evaluating vendors/service options ____ consultant, law firm, lobbyist ____ other business customer ____ academic/student ____ residential customer ____ FCC employee ____ other federal government employee ____ state or local government employee ____ Other (please specify) 2. Please rate the report: Excellent Good Satisfactory Poor No opinion Data accuracy (_) (_) (_) (_) (_) Data presentation (_) (_) (_) (_) (_) Timeliness of data (_) (_) (_) (_) (_) Completeness of data (_) (_) (_) (_) (_) Text clarity (_) (_) (_) (_) (_) Completeness of text (_) (_) (_) (_) (_) 3. Overall, how do you Excellent Good Satisfactory Poor No opinion rate this report? (_) (_) (_) (_) (_) 4. How can this report be improved? 5. May we contact you to discuss possible improvements? Name: Telephone #:
To discuss the information in this report, contact: 202-418-0940 or for users of TTY equipment, call 202-418-0484
Fax this response to or Mail this response to
202-418-0520 FCC/WCB/IATD, Mail Stop 1600 F Washington, DC 20554


![Cable-Telco-Wireless Competition In Florida...Competition in Florida THEN: Florida PSC: “Status of Competition in the Telecommunications Industry as of May 31, 2005”: § [A] report](https://static.fdocuments.in/doc/165x107/5f7128b5c0afcf281f337fc9/cable-telco-wireless-competition-in-florida-competition-in-florida-then-florida.jpg)