LOCAL STATES AND MAGNETIC INTERACTIONS STUDY OF TRANSITION...
43
1 ,,BABEŞ –BOLYAI” UNIVERSITY FACULTY OF PHYSICS SIMONA LUPŞOR LOCAL STATES AND MAGNETIC INTERACTIONS STUDY OF TRANSITION METAL IONS IN VITREOUS OXIDE MATRICES PhD Thesis Summary Scientific supervisor Prof. Univ.Dr. IOAN ARDELEAN CLUJ – NAPOCA 2010
Transcript of LOCAL STATES AND MAGNETIC INTERACTIONS STUDY OF TRANSITION...

1
BABEŞ ndashBOLYAIrdquo UNIVERSITY FACULTY OF PHYSICS
SIMONA LUPŞOR
LOCAL STATES AND MAGNETIC
INTERACTIONS STUDY OF TRANSITION
METAL IONS IN VITREOUS OXIDE
MATRICES
PhD Thesis Summary
Scientific supervisor
Prof UnivDr IOAN ARDELEAN
CLUJ ndash NAPOCA
2010
2
CONTENT
INTRODUCTION 6
CHAPTER 1 THE STUDY OF THE STRUCTURE OF As2O3 AND B2O3 BASED
GLASSES 8
11 The structure of As2O3 and B2O3 based glasses 8
12 Behaviour of manganese and iron ions in vitreous oxide matrices 14
- Behaviour of manganese ions in vitreous oxide matrices 14
- Behaviour of iron ions in vitreous oxide matrices 16
References 19
CHAPTER 2 METHODS USED IN THE STUDY OF STRUCTURE AND PROPERTIES
OF OXIDE GLASSES 21
21 Infrared absorption spectroscopy (IR) 21
22 Raman spectroscopy 23
23 Electron paramagnetic resonance (EPR) 27
24 Magnetic properties of system glasses 31
25 Magnetic behaviour of oxide vitreous system 35
251 The magnetic measurements used in the study of vitreous system
containing transition metal ions 36
References 41
CHAPTER 3 EXPERIMENTAL TECHNIQUES 43
31 The processing and the preparation of the samples 43
311 The processing of the samples 43
312 The preparation of the samples 45
32 Techniques used for samples measurements 45
321 X-ray Diffraction 45
322 Infrared absorption spectroscopy 48
323 Raman spectroscopy 50
324 Electron paramagnetic resonance (EPR) 52
325 Magnetic susceptibility measurements 57
References 57
3
CHAPTER 4 RESULTS AND DISCUSSION REGARDING THE STUDY OF xMOmiddot(100-
x)[As2O3middotTeO2] xMOmiddot(100- x)[As2O3middotPbO] and xMOmiddot(100-x)[3B2O3middotLi2O] GLASS
STRUCTURE WHERE MO =gt MnO or Fe2O3 58
41 Comparative study by FT-IR and Raman spectroscopies of xMOmiddot(100-
x)[As2O3middotTeO2] xMOmiddot(100-x)[As2O3middotPbO] and xMOmiddot(100-x)[3B2O3middotLi2O] glasses
where MO =gt MnO or Fe2O3 58
411 Comparative study by FT-IR spectroscopy of As2O3middotTeO2 and
As2O3middotPbO vitreous matrices 58
412 Comparative study by FT-IR spectroscopy of xMOmiddot(100-
x)[As2O3middotPbO] vitreous systems where MO =gt MnO or Fe2O3 61
413 Comparative study by FT-IR spectroscopy of xMOmiddot(100-
x)[As2O3middotTeO2] vitreous systems where MO =gt MnO or Fe2O3 66
414 Comparative study by FT-IR spectroscopy of xMnOmiddot(100-
x)[As2O3middotBO] vitreous systems where BO =gt TeO2 or PbO 69
415 Comparative study by FT-IR spectroscopy of xFe2O3middot(100-
x)[As2O3middotBO] vitreous systems where BO =gt TeO2 or PbO 70
416 Comparative study by Raman spectroscopy of As2O3middotTeO2 and
As2O3middotPbO vitreous matrices 71
417 Study by Raman spectroscopy of xMOmiddot(100- x)[As2O3middotPbO]
vitreous systems where MO =gt MnO or Fe2O3 73
418 Study by Raman spectroscopy of xMOmiddot(100-x)[As2O3middotTeO2]
vitreous systems where MO =gt MnO or Fe2O3 75
419 Comparative study by Raman spectroscopy of xMnOmiddot(100-
x)[As2O3middotBO] vitreous systems where BO =gt TeO2 or PbO 78
4110 Comparative study by Raman spectroscopy of xFe2O3middot(100-
x)[As2O3middotBO] vitreous systems where BO =gt TeO2 or PbO 79
42 Comparative study by FT-IR and Raman spectroscopies of
xMOmiddot(100-x)[3B2O3middotLi2O] glasses where MO =gt MnO or Fe2O3 79
421 Study by FT-IR spectroscopy of xMOmiddot(100-x)[3B2O3middotLi2O]
glasses where MO =gt MnO or Fe2O3 80
422 Study by Raman spectroscopy of xMOmiddot(100-x)[3B2O3middotLi2O]
glasses where MO =gt MnO or Fe2O3 86
4
43 Comparative study by electron paramagnetic resonance (EPR) and
magnetic susceptibility measurements of xMOmiddot(100-x)[As2O3middotTeO2] xMOmiddot(100-x)
[As2O3middotPbO] şi xMOmiddot(100-x)[3B2O3middotLi2O] glasses where MO=gt MnO or Fe2O3 88
431 Comparative study by electron paramagnetic resonance (EPR) of
xMnOmiddot(100-x)[As2O3middotBO] where BO =gt TeO2 or PbO and xMnOmiddot(100-x)
[3B2O3middotLi2O] glasses 88
432 Comparative study by magnetic susceptibility measurements of
xMnOmiddot(100-x)[As2O3middotBO] where BO =gt TeO2 or PbO nd xMnOmiddot(100-x)
[3B2O3middotLi2O] glasses 93
433 Comparative study by electron paramagnetic resonance (EPR) of
xFe2O3middot(100-x)[As2O3middotBO] where BO =gt TeO2 or PbO and x Fe2O3middot(100-x)
[3B2O3middotLi2O] glasses 98
434 Comparative study by magnetic susceptibility measurements of
xFe2O3middot(100-x)[As2O3middotBO] where BO =gt TeO2 or PbO and x Fe2O3middot(100-x)
[3B2O3middotLi2O] glasses 104
References 110
CONCLUSIONS 112
5
INTRODUCTION
Glasses are noncrystaline solid materials that have a disordered structure but have a
local order The study of materials with vitreous structures gained a special attention due to
their manifold applications in domains of science and technology The oxide glasses unfold a
large variety of properties due to the variety of their compounds these glasses have wide
technological applications
This thesis work is focused on characterizing the structure the optic and magnetical
properties of arsenolite and borate glasses The study presented in this thesis has as objective
the obtaining of new experimental data and the clarification of the physical phenomena which
determine the structural behavior of As2O3 and B2O3 based glasses doped with manganese or
iron ions In order to obtain this information of xMOmiddot(100-x)[As2O3middotTeO2] xMOmiddot(100-
x)[As2O3middotPbO] and xMOmiddot(100-x)[3B2O3middotLi2O] where MO =gt MnO or Fe2O3 glass
systems with 0 lt x lt 50 mol MnO or Fe203 they were prepared and investigated by x - ray
Diffraction FT - IR spectroscopy Raman spectroscopy electron paramagnetic resonance
(EPR) and magnetic susceptibility measurements
The thesis is structured in four chapters The first chapter presents on literature basis
the main results regarding the structure and the properties of As2O3 and B2O3 based glasses
Chapter 2 presents theoretical and experimental general aspects regarding the iron and
manganese behavior using the IR absorption Raman spectroscopies electron paramagnetic
resonance and magnetic susceptibility Chapter 3 describes the experimental techniques used in
the studies of glasses The processing and preparation of the samples are presented Chapter 4
presents and discusses the experimental results obtained for the investigated glasses In the
end the general conclusions which emphasize the most important results of this thesis are
presented
CHAPTER 1 THE STUDY OF THE STRUCTURE OF As2O3 AND B2O3 BASED
GLASSES
As2O3 and B2O3 are the most important glass forming oxides and have been
incorporated into various kinds of glass system in order to obtain the desired physical and
chemical properties for both scientific and industrial applications As2O3 is a very strong glass
formation having a configuration based on pyramidal AsO3 units determined by a special
dynamics on the As and O bonds unique properties of the glass systems [1-3] The properties
of the glasses based the B2O3 are due to the fact that the boron atom can assume triangular
6
and tetrahedral coordination and also to the different ways through which the borate buildings
units can be linked together [4-9]
The behavior of various borate species in the glass structure is determined by the nature
of modifier oxides (TeO2 PbO etc) In most binary borate glasses the glass properties change
almost linearly with composition [10-17] In binary borate glasses the properties of these show
a major deviation from linearity which depends on modifier oxide The structural reasons for
this is generally due to the change in the coordination of boron atom from 3 to 4 and back
again Many technological applications of these glasses depend of this effect since is produces
many improvements [18-23]
The introduction of MnO [24-32] or Fe2O3 [33-45] into diamagnetic glasses transform
them into paramagnetic glasses The introduction of iron and manganese in small percentages
modifies the physical properties of the glasses and the material is more accessible for a
complete structural characterization
In order to extend the available information concerning the interesting class of As2O3
and B2O3 based glasses we investigated glasses by means of different physical methods We
obtained valuable information concerning the structure and structural changes of the glasses
that occur with the addition of transitional oxide metals
CHAPTER 2 METHODS USED IN THE STUDY OF STRUCTURE AND
PROPERTIES OF OXIDE GLASSES
In this chapter some of the methods used in the investigation of the structure and
properties of vitreous systems are presented The study of the structure and properties of oxide
glasses with transitional metals ions IR and Raman spectroscopies electron paramagnetic
resonance and magnetic susceptibility measurements were chosen as investigation methods
The electromagnetic radiation (EM) with frequencies between 4000 and 400 cm -1 called
infrared radiation (IR) is used to obtain information connected to the structure of the
compound and as an analytic method to test the purity of the compound Its application in
organic chemistry is known as IR spectroscopy The radiation is absorbed by organic
molecules and converted in molecular vibration energy When the radiant energy coincides
with a specific molecular vibration the absorption appears The wave length at which the
radiation is absorbed by the organic molecule gives information regarding the functional
groups presented in the molecule [1-4]
The Raman spectroscopy brings useful contributions to the molecular vibrations study
The interraction mechanism of electromagnetic radiation with the molecular vibration which
forms the Raman spectroscopy theoretical basis differs from the one of the process which
forms the IR spectroscopy theoretical basis [4]
7
Another method used in the investigation of the glass system is the electron paramagnetic
resonance (RPE) This method is one of the most powerful techniques for local order
investigation RPE is a method widely used to describe the fundamental states and to
characterize the vicinities effect on the energetic levels of the paramagnetic centers The
method consists in the study of the electronic split levels of the atoms in the presence of an
external magnetic field [6] The Mn2+ EPR spectra are characterized by resonance absorptions
at gef 43 gef 33 and gef 20 The resonance line centered at gef 43 is
corresponding to the isolated Mn2+ ions The line from gef 20 is attributed to Mn2+ ions
involved in magnetic interactions
The Fe3+ EPR spectra are characterized by resonance absorptions at g 97 g 6 g 43
and g 20 The resonance line from g 97 is related to Fe3+ ions disposed in rhombic
environment The resonance line at g 6 was assigned to an axial distortion of the
paramagnetic ions neighborhood The resonance line at g 43 is corresponding to the isolated
Fe3+ ions situated in octahedral rhombic or tetragonal symmetric distorted neighborhoods The
line from gef 20 is attributed to Fe3+ ions involved in magnetic interactions
Along with the EPR spectroscopy the magnetic susceptibility measurements provide
useful information about the valence state and the interaction involving the transitional metal
ions in vitreous materials [7-10]
Different vitreous systems with manganese or iron ions were intensively studied by
magnetic susceptibility measurements to determine the magnetic behavior and the valence
states of these ions in these systems It was observed that the presence of the manganese or iron
ions in different valence states depends on the chemical composition of the vitreous matrix on
the valence of the vitreous network former and modifications and on the preparation of the
environment The magnetic properties of the oxide glasses with manganese or iron ions were
assigned to the antiferromagnetic couple between Mn2+-Mn2+ Mn2+-Mn3+ and Mn3+-Mn3+
[19-26] or Fe -Fe3+ Fe2+-Fe2+ and Fe3+-Fe2+ ions [11-18]
CHAPTER 3 EXPERIMENTAL TECHNIQUES
We have prepared glasses of the xMOmiddot(100-x)[As2O3middotTeO2] xMOmiddot(100-
x)[As2O3middotPbO] şi xMOmiddot(100-x)[3B2O3middotLi2O] glass structure where MO =gt MnO or Fe2O3
with 0 lt x lt 50 mol used components of reagent grade purity MnCO3 Fe2O3 As2O3
H3BO3 PbO Li2CO3 şi TeO2 in suitable proportions to obtain the desired composition The
mixtures were melted in sintered corundum crucibles introduced in an electric furnace directly
at 1250 C and kept for 5 minutes at this temperature They were quickly cooled at room
temperature by pouring onto stainless steel plates
The structure of the samples was analyzed by means of x-ray Diffraction using powders
with a Bruker D8 Advanced diffract meter
8
The FT - IR spectra have been recorded using a Bruker Equinox 55 with a spectral range
between 4000 cm -1 and 370 cm -1 A MIR GLOBAR generator cooled with air was used The
detection was carried out with a DLATGS detector with a KBr window The spectral
resolution was about 05 cm1 The samples were prepared using KBr pellet technique
The Raman spectra were recorded on bulk samples at room temperature using an
integrated FRA 106S Raman module attached to Bruker Equinox 55 with a spectral range
from 3600 cm -1 to 70 cm -1 An NdYAG laser with an output power of 500 mW and a 1064
nm radiation was used The detection was carried out with an ultra sensitive D418-T detector
cooled with liquid nitrogen The spectral resolution was about 1 cm1
The EPR spectra were obtained at room temperature with an Adani Portable EPR
Spectrometer PS8400 in X-frequency band (94 GHz) For these measurements equal
quantities of powders from the investigated samples closed in glass tubes were used
Magnetic susceptibility measurements were performed on a Faraday type balance in the 80
- 300 K temperature range The sensitivity of the equipment was 10-7 emug
CHAPTER 4 RESULTS AND DISCUSSION REGARDING THE STUDY OF
xMOmiddot(100-x)[As2O3middotTeO2] xMOmiddot(100- x)[As2O3middotPbO] şi xMOmiddot(100-x)[3B2O3middotLi2O]
GLASS STRUCTURE WHERE MO =gt MnO or Fe2O3
In this chapter the results obtained by following the study of the structure and
properties of oxide glasses with transitional metals ions by FT- IR and Raman spectroscopies
electron paramagnetic resonance and magnetic susceptibility measurements are presented The
structural changes and magnetic properties with the manganese and iron content were
followed
41 Comparative study by FT-IR and Raman spectroscopies of xMOmiddot(100-
x)[As2O3middotTeO2] xMOmiddot(100- x)[As2O3middotPbO] şi xMOmiddot(100-x)[3B2O3middotLi2O] glasses
where MO =gt MnO or Fe2O3
411 Comparative study by FT-IR spectroscopy of As2O3middotTeO2 and
As2O3middotPbO vitreous matrices
In order to obtain new information regarding the role of the modifier in the
formation of vitreous matrices comparative studies by FT-IR spectroscopy were made
The FT-IR spectroscopy is represented in figure 41(ab) The wave length and the
structural assignments of FT ndash IR spectra of As2O3middotPbO and As2O3middotTeO2 vitreous matrices
are represented in table 41
9
400 600 800 1000 1200
Wavenumber [cm-1]
Abs
orpt
ion
[au
]
407
594
821
794
1119
As2O
3PbO
a)
a
400 600 800 1000 1200
As2O3TeO2
Abs
orpt
ion
[ua
]
Wavenumber [cm-1]
85473
3
644
1119
b)
b
Fig41 FT ndash IR spectra of vitreous matrices a As2O3middotPbO şi b As2O3middotTeO2
The FT ndash IR spectrum of As2O3middotPbO glass matrix presents five absorption bands at ~
1119 cm-1 ~ 821 cm-1 ~ 794 cm-1 ~ 594 cm-1 and ~ 407 cm-1(Fig41a)
The band from ~ 1119 cm-1 is due to totally symmetric stretching vibrations of AsO3
units [5 ndash 7] The bands from ~ 821 cm-1 and ~ 794 cm-1 are due to doubly degenerate
stretching vibrations of AsO3 structural units [5 ndash 7] The large band centered at ~ 594 cm-1 can
be due to totally symmetric bending vibrations of AsO3 structural units [5-7] The band from ~
407 cm-1 can be due to vibrations of Pb ndash O bonds from PbO4 structural groups [7]
Following As2O3TeO2 glass matrix spectrum presented in Fig 41b four bands can be
observed located at ~ 644 cm-1 ~ 733 cm-1 ~ 854 cm-1 and ~ 1119 cm-1 The band from ~ 644
cm-1 can be assigned to totally symmetric bending vibrations of AsO3 units [5-7] and also
stretching vibration mode of TeO4 tbp with bridging oxygen[11] The band from ~ 733 cm-1
can be assigned to the symmetric stretching vibration mode of Te-O bonds in TeO3 units
[15] The band from ~ 854 cm-1 can be assigned to doubly degenerate stretching vibrations of
AsO3 units [5-7] and also to the stretching vibration mode of TeO3 tp with NBO [11] The band
10
from ~ 1119 cm-1 can be assigned to totally symmetric stretching vibrations of AsO3 units [5-
7] These bands presented in As2O3TeO2 glass matrix spectrum confirm the presence of
AsO3 TeO4 tbp and TeO3 tp units in the structure of the glass matrix but due to the broadness
of the bands it can not be told for sure which one of these units is predominant
Table 41Wavenumber and the structural assignments of FT ndash IR spectra of
As2O3middotPbO and As2O3middotTeO2 vitreous matrices
~ [cm 1 ]
As2O3middotPbO As2O3middotTeO2
Attribution
~1119 cm-1
~ 1119 cm-1
Totally symmetric stretching vibrations of AsO3 units
~ 821cm-1
Doubly degenerate stretching vibrations of AsO3 structural units
~ 854 cm-1
Doubly degenerate stretching vibrations of AsO3 units Stretching vibration mode of TeO3 tp with NBO
~ 794 cm-1
Doubly degenerate stretching vibrations of AsO3 structural units
~ 733 cm-1
Symmetric stretching vibration mode of Te-O bonds in TeO3 units
~ 594 cm-1
~ 644 cm-1
Totally symmetric bending vibrations of AsO3 units
~ 407 cm-1 Vibrations of Pb ndash O bonds from PbO4 structural groups
412 Comparative study by FT-IR spectroscopy of
xMOmiddot(100- x)[As2O3middotPbO] vitreous systems where MO =gt MnO or Fe2O3
The infrared absorption spectra obtained for xMOmiddot(1-x)[As2O3middotPbO] glass system
where MO =gt MnO or Fe2O3 with 0 le x le 50 mol are presented in figure 42-3 and their
structural assignments are summarized in table 41
The spectra were discussed on the basis of the method given by Tarte [3] and Condrate
[4] by comparing the experimental data of glasses with those of related crystalline compounds
The characteristic absorption bands for crystalline As2O3 [5-8] PbO [79] and characteristic
bands for Fe2O3 [1819 ] were used as a reference point in the results discussion
The FT ndash IR spectra of the investigated glasses suggest a structure formed of AsO3 and
PbO4 structural units where As2O3 plays the role of the glass former and PbO plays the role of
the glass modifier The evolution of the spectra with the addition and the increasing of the
MnO content suggest that the manganese ions break up a part of As ndash O ndash As Pb ndash O ndash Pb and
probably of As ndash O ndash Pb bonds The addition of MnO in the As2O3middotPbO glass matrix is leading
to a disordering of the glasses structure with the increasing of the MnO content
The evolution of the absorption bands for FT ndash IR spectrum of xFe2O3middot(1-x)
[As2O3middotPbO] glasses are determined by the addition of Fe2O3 content It can be observed to
11
shift the bands assigned As ndash O ndash As vibrations from AsO3 units due to changing to length As
ndash O ndash As bonds and interne angles of AsO3 units disappears PbO4 units and appears FeO6
units The addition of Fe2O3 in the As2O3middotPbO glass matrix determined a disordering of the
glasses structure with the increasing of the Fe2O3 content
400 600 800 1000 1200
610
813
449
1093
423
449
616
760 848
821
794
594
20A
bsor
ptio
n [a
u]
Wavenumber [cm-1]
05
0
35
10
35
50
1
MnO
407
1119
693
Fig 42 FT ndash IR spectra of xMnOmiddot(100- x)[As2O3middotPbO] glasses
400 600 800 1000 1200
616
462
811
407
594
Abs
orpt
ion
[au
]
Wavenumber [cm -1]
05
20
0
35
10
35
50
1
Fe2O3
821
79469
3
1119
1084
610
Fig43 FT ndash IR spectra of xFe2O3middot(100- x)[As2O3middotPbO] glasses
12
413 Comparative study by FT-IR spectroscopy of
xMOmiddot(100-x)[As2O3middotTeO2] vitreous systems where MO =gt MnO or Fe2O
The infrared absorption spectra obtained for xMOmiddot(1-x)[As2O3middotTeO2] glass system
where MO =gt MnO or Fe2O3 with 0 le x le 50 mol are presented in figure 44 -5 and their
structural assignments are summarized in table 41[1617] The characteristic absorption bands
for crystalline As2O3 [5-8] PbO [79] TeO2 [810-15] MnO2 and Mn3O4 [9] and characteristic
bands for Fe2O3 [1819 ] were used as a reference point in the results discussion
Fig 44 FT ndash IR spectra of xMnOmiddot(100- x)[As2O3middotTeO2] glasses
Fig45 FT ndash IR spectra of xFe2O3middot(100- x)[As2O3middotTeO2] glasses
400 600 800 1000 1200
565
422 690 830
05
Abs
optio
n [a
u]
Wavenumber [cm-1]
0
3
5
35 50
1
MnO
854 733 644
1119
10 20
400 600 800 1000 1200
462650
812
713
561
05
20
Wavenumber [cm-1]
Abs
orpt
ion
[au
]]
0
3 5
10
35 50
1
Fe2O3
854 733
644
1119
13
This behavior of the studied glasses with the addition and increasing of MnO content
suggests that the structure observed in the glass matrix is conserving up to 5 mol MnO
where the structure takes another form From a structure dominated by AsO3 TeO4 tbp and
TeO3 tp units the structure became dominated by TeO4 tbp and MnO2 units and in a small
measure of AsO3 and TeO3 tp units For higher concentrations it can not be specified exactly
which of the last two structural units have the biggest proportion in these glasses From FT-IR
absorption spectra of the investigated glass system it can be observed that the addition and
increasing of manganese ions concluded the contraction of As-O-As bonds from totally
symmetric stretching vibrations of AsO3 units for x ge10 mol there can be an increase in
number of As-O-As bonds from AsO3 units orand a length these linkage to doubly degenerate
stretching vibrations of AsO3 units and a stretching vibration mode of TeO3 tp with NBO It
can be remarked from the FT-IR absorption spectra the gradual transformation of symmetric
stretching vibration mode of Te-O bonds from TeO3 units in TeO4 (tbp) units and the presence
of MnO2 units Once with the addition of iron ions the xFe2O3middot(100- x)[As2O3middotTeO2]
glasses behave like xMnOmiddot(100-x)[As2O3middotTeO2] glasses but in this system the
appearance of FeO6 units can be seen
414 Comparative study by FT-IR spectroscopy of
xMnOmiddot(100- x)[As2O3middotBO] vitreous systems were BO =gt TeO2 or PbO
The infrared absorption spectra obtained for xMnOmiddot(100- x)[As2O3middotBO] vitreous
systems where BO =gt TeO2 or PbO with 0 le x le 50 mol MnO are presented in figure
42 and 44 Following the infrared absorption spectra it can be observed that for
xMnOmiddot(100- x)[As2O3middot PbO] glass system the most disordered structure to exist for 0
le x le 5 mol MnO and to xMnOmiddot(100-x)[As2O3middot TeO2] glass system for 1 le x le 5 mol
MnO For x ge 5 mol MnO manganese ions break up a part of As ndash O ndash As Pb ndash O ndash Pb
and probably of As ndash O ndash Pb bonds to favor the increase in number of PbO4 units and
appearance of MnO2 units For x ge 10 mol MnO observed comparatively in both system
glasses the addition of manganese ions suggests for the first system a modification in linkage
characteristic units and for the second system an improvement for structural units of As2O3middot
TeO2 vitreous matrice also linkage characteristic units
415 Comparative study by FT-IR spectroscopy of
xFe2O3middot(100-x)[As2O3middotBO] vitreous systems where BO =gt TeO2 or PbO
The infrared absorption spectra obtained for xFe2O3middot(100- x)[As2O3middotBO] vitreous
systems where BO =gt TeO2 or PbO with 0 le x le 50 mol Fe2O3 are presented in figure
43 and 45
14
The evolution of the spectra with the addition and the increasing of the Fe2O3 content
suggest that the iron ions break up a part of As ndash O ndash As Pb ndash O ndash Pb and probably of As ndash O
ndash Pb bonds It can be observed a shift in the bands assigned As ndash O ndash As vibrations from AsO3
units due to changing to length As ndash O ndash As bonds and interne angles of AsO3 units the PbO4
units disappear and FeO6 units appear For x ge 5 mol Fe2O3 observed comparatively in
both system glasses the addition of iron ions suggests for the first system a modification in
linkage characteristic units of As2O3middotPbO and for the second system an improvement for
structural units of As2O3middot TeO2 vitreous matrice also linkage characteristic units appearance
of FeO6 units in both system
416 Comparative study by Raman spectroscopy of
As2O3middotTeO2 and As2O3middotPbO vitreous matrices
In order to obtain new information regarding the role of the modifier in the
formation of vitreous matrices there were made comparative studies by Raman
spectroscopy The Raman spectroscopy are presented in figure 46(ab) The wave
length and the structural assignments of Raman spectra of As2O3middotPbO şi As2O3middotTeO2 vitreous
matrices are presented in table 42
Table 42Wavenumber and the structural assignements of Raman spectra
of As2O3middotPbO and As2O3middotTeO2 vitreous matrices
~ [cm 1 ]
As2O3middotPbO As2O3middotTeO2
Attribution
~826 cm-1
~ 816 cm-1
Stretching vibrations of As-O-As
~ 752 cm-1
Vibrations of the continuous TeO4 (tbp) network
~ 627 cm-1
Vibrations As ndash O ndash As bonds from As2O units
~ 580 cm-1
Stretching vibrations of As-O-As
~ 525 cm-1
Vibrations O-As-O bonds from AsO3 units
~ 438cm-1
Symmetric bending vibrations of Te ndash O ndash Te vertex linkages between different TeO4 (tbp) TeO3+1 polyhedra Stretching vibrations of As-O-As of AsO3 units
~ 345 cm-1
Bending vibrations of As ndash O ndash As from As2O units
15
200 400 600 800 1000
As2O3PbO
Ram
an In
tens
ity [a
u]
LWavenumber [cm-1]
345
826
525
627a)
a
200 400 600 800 1000
816
752
580 R
aman
Inte
nsity
[au
]
Wavenumber [cm-1]
As2O3TeO2
438
b)
b
Fig46 Raman spectra of vitreous matrices a As2O3middotPbO şi b As2O3middotTeO2
The Raman spectrum of As2O3middotPbO glass matrix presents four bands at 826 cm-1
627 cm-1 525 cm-1 and 345 cm-1 The band from 826 cm-1 can be assigned to As ndash O ndash
As stretching vibrations [20] The band centered at 627 cm-1 can be assigned to vibrations As
ndash O ndash As bonds from As2O units the band from 525 cm-1 are assigned vibrations O-As-O
bonds from AsO3 units [21] The band of 345 cm-1 are attributed to As ndash O ndash As bending
vibrations from As2O units[2021]
The Raman spectrum of As2O3middot TeO2 glass matrix presents four bands at 816 cm-1
752 cm-1 580 cm-1 and 438 cm-1 The band from 816 cm-1 can be assigned to As ndash O ndash
As stretching vibrations [20] The band centered at 752 cm-1 can be assigned to vibrations of
the continuous TeO4 (tbp) network [22] The band of 580 cm-1 are attributed to As ndash O ndash As
stretching vibrations [12] The band centered at 438 cm-1 can be assigned symmetric bending
vibrations of Te ndash O ndash Te vertex linkages between different TeO4 (tbp) TeO3+1 polyhedra and
As ndash O ndash As stretching vibrations of AsO3 units
16
417 Study by Raman spectroscopy of xMOmiddot(100- x)[As2O3middotPbO]
vitreous systems where MO =gt MnO or Fe2O3
The Raman spectra obtained for xMOmiddot(100- x)[As2O3middotPbO] vitreous systems where
MO =gt MnO or Fe2O3 with 0 le x le 50 mol are presented in figure 47-8 and their
structural assignments are summarized in table 42
200 400 600 800 1000
368
833
345
1
3
Lungimea de unda [cm-1]
Inte
nsita
te R
aman
[ua
]
20
05
0
5
10
35
50
MnO
826
525
627
Fig 47 Raman spectra of xMnOmiddot(100- x)[As2O3middotPbO] glasses
The addition of MnO in the glass matrix determined an order degree of the vitreous
matrix The intensity of the bands attributed vibrations As ndash O ndash As bonds from As2O units
and bending vibrations of As ndash O ndash As from As2O units shift to a higher wave length that
suggests an increase in the As2O units comparative to AsO3 units
To the band from 826 cm-1 the addition of manganese ions in the glass matrix
determine for x = 05 mol an decreasing in intensity whereupon increasing for higher
concentrations The intensity of bands centered at 627 cm-1 and 525 cm-1 for x = 05
mol MnO decrease and disappear for x = 1 mol MnO The band of 345 cm-1 slowly
increases with the addition of manganese ions
To the band from 826 cm-1 the addition of iron ions in the glass matrix determines
for x = 05 mol an increase in intensity a gradual decrease and disappearance for x = 35
mol Fe2O3 of the bands observed for the glass matrix For higher concentrations of
manganese these bands gradually decrease The intensity of bands centered at 627 cm-1 and
525 cm-1 for x = 05 mol Fe2O3 increase and shift to 612 cm-1 and 501 cm-1 whereas
17
they gradually decrease and disappear for x = 10 mol Fe2O3 The band of 345 cm-1
decreases with the addition of iron ions and disappears for x = 20 mol Fe2O3
200 400 600 800 1000
3
612
501
Wavenumber [cm-1]
Ram
an In
tens
ity [a
u]
05
20
0
5
10
3550
1
Fe2O3
345
826
525
627
Fig 48 Raman spectra of xFe2O3middot(100- x)[As2O3middotPbO] glasses
With the increase of iron ions content in the As2O3middotPbO glass matrix the number of
these structural units decreases due to the increasing of the disorder in the studied glasses
418 Study by Raman spectroscopy of xMOmiddot(100-x)[As2O3middotTeO2]
vitreous systems were MO =gt MnO or Fe2O3
The Raman spectra obtained for xMOmiddot(100- x)[As2O3middot TeO2] vitreous systems
where MO =gt MnO or Fe2O3 with 0 le x le 50 mol are presented in figure 49-10 and their
structural assignments are summarized in table 42
The Raman spectrum of the glass matrix suggests a structure formed from TeO4 (tbp)
and TeO3 (tp) units where the presence of As ndash O ndash As bonds can not be excluded The
addition of manganese ions is leading to a modification of the structure proposed by the
spectrum of the glass matrix Then with the increasing of manganese content the intensity of
these bands is increasing showing that the manganese content favorises the formation of TeO4
(tbp) and TeO3 (tp) units
18
200 400 600 800 1000
783
850
768
416
816
752
Wavenumber [cm -1]
Ram
an In
tens
ity [a
u]
13
20
05
0
5
10
35
50
MnO
438
580
660
Fig 49 Raman spectra of xMnOmiddot(100- x)[As2O3middot TeO2] glasses
200 400 600 800 1000
226
294
408
673 751
5
W avenumber [cm -1]
Ram
an In
tens
ity [a
u]
05
20
0
3
10
35
50
1
Fe2O
3
816
752
438
580
Fig 410 Raman spectra of xFe2O3middot(100- x)[As2O3 TeO2] glasses
The Raman spectra of xFe2O3middot(100- x)[As2O3 TeO2] glasses present a significant
advance to the TeO4 (tbp) TeO3+1 polyhedra and AsO3 units represented in Raman spectrum
by the ~ 438 cm-1 band comparative with the modifications determined by the addition of
manganese ions in vitreous matrix For high concentrations of iron ions in xFe2O3middot(100-
x)[As2O3 TeO2] system of glasses the number of As-O-As linkages appear in Raman
spectrum due to stretching vibrations of As-O-As and vibrations of the continuous TeO4 (tbp)
network show a significant decrease
19
419 Comparative study by Raman spectroscopy of xMnOmiddot(100- x)[As2O3middotBO]
vitreous systems were BO =gt TeO2 or PbO
The addition of MnO to xMnOmiddot(100- x)[As2O3middotPbO] glass system do not break As
ndash O ndash As bonds into characteristic units and contribute to their prominence The addition of
manganese ions to xMnOmiddot(100- x)[As2O3middot TeO2] glass system for x=50mol MnO
determined the splitting up of a part of As ndash O ndash As Te-O-Te and the appearance of the
TeO4 (tbp) units against the loss of continuous TeO4 (tbp) network was observed
4110 Comparative study by Raman spectroscopy of xFe2O3middot(100- x)[As2O3middotBO]
vitreous systems where BO =gt TeO2 or PbO
With the increasing of iron ions content in the As2O3middotPbO glass matrix the number of
these structural units decreased due to the increase of the disorder in the studied glasses (x gt 20
mol ) and x = 50 mol Fe2O3 for xFe2O3middot(100- x)[As2O3middotTeO2] when iron ions
brought the structural units existing in glass matrices and favoured the appearace of
new bands due to bending vibrations of As ndash O ndash As
42 Comparative study by FT-IR and Raman spectroscopies of
xMOmiddot(100-x)[3B2O3middotLi2O] glasses where MO =gt MnO or Fe2O3
421 Study by FT-IR spectroscopy of xMOmiddot(100-x)[3B2O3middotLi2O] glasses
where MO =gt MnO or Fe2O3
The infrared absorption spectra obtained for xMOmiddot(1-x)[3B2O3middotLi2O] glass system
where MO =gt MnO or Fe2O3 with 0 le x le 50 mol are presented in figure 411-13 and their
structural assignments are summarized in table 43
500 1000 1500
3B2O3Li2O
Wavenumber [cm-1]
Abs
orpt
ion
[au
]
490
1400
1230
1061
698
614
460 78
6
Fig 411 FT ndash IR spectra of vitreous matrix 3B2O3middotLi2O
20
Following the infrared absorption spectra obtained for 3B2O3middotLi2O vitreous matrix
observed on eight bands ~ 1400 cm-1 ~ 1230 cm-1 ~ 1061 cm-1 ~ 786 cm-1 ~ 698 cm-
1 ~ 614 cm-1 ~ 490 cm-1 şi ~ 460 cm-1 The band at ~ 1400 cm-1 is assigned to
asymmetric stretching vibrations from BOslash3 şi BOslash2O- groups (Oslash represent oxygen atom
bridging two boron atoms) The band at ~ 1230 cm-1 is attributed to asymmetric stretching
vibrations of B ndash O bonds from triangular ortoborate BO 33 groups [23-26]
400 600 800 1000 1200 1400 1600
0
3
5
10
20
35
50
1
Wavenumber [cm-1]
Abs
orpt
ion
[ua
]
05
MnO
490
1400
1230
1061
698
614
460 78
6
Fig 412 FT ndash IR spectra of xMnOmiddot(100-x)[3B2O3middotLi2O] glasses
400 600 800 1000 1200 1400 1600
469
Wavenumber [cm-1]
Abs
orpt
ion
[ua
]
0
3
5
10
20
35
50
1
05
Fe2O3
490
1400
1230
1061
698
614
460 78
6
Fig 413 FT ndash IR spectra of x Fe2O3middot(100-x)[3B2O3middotLi2O] glasses
21
Table 43Wavenumber and the structural assignments of FT ndash IR and Raman
spectra of 3B2O3middotLi2O vitreous matrix
~ [cm 1 ] Attribution
FT ndash IR Raman FT ndash IR Raman
~ 1400 cm-1
~ 1400 cm-1
Asymmetric stretching
vibrations from BOslash3 şi BOslash2O-
groups
BOslash2O- triangles linked to
other borate triangular units
~ 1230 cm-1
Asymmetric stretching
vibrations of B ndash O bonds from
triangular ortoborate
BO 33 groups
~ 1061 cm-1
~ 1074 cm-1
Stretching vibrations of B ndash Oslash
bonds in -4BOslash tetrahedra from
tri- tetra- and penta-borate
groups
Diborate groups
~ 902 cm-1
Vibrations of orthoborate
groups
~ 786 cm-1
~ 791 cm-1
Bending vibrations of O3B ndash O
ndash BO4 bonds
Vibrations of rings with six
member to one or two BO4
tetrahedral from tri- tetra ndash
and penta ndash borate units
~ 698 cm-1
Bending vibrations of B-O-B
bonds from pentaborate groups
~ 614cm-1 Bending vibrations of O ndash B ndash O
bonds
~ 490cm-1 ~ 471cm-1 Bending vibrations of B-O-B
bonds
Isolated diborate groups
~ 460cm-1 Bending vibrations of O ndash B ndash O
bonds
22
The band at ~ 1061 cm-1 is assigned to stretching vibrations of B ndash Oslash bonds in -4BOslash
tetrahedra from tri- tetra- and penta-borate groups and the band at ~ 786 cm-1 is assigned
to bending vibrations of O3B ndash O ndash BO4 bonds The band at ~ 698 cm-1 is attributed to
Bending vibrations of B-O-B bonds from pentaborate groups The bands at ~ 614 cm-1 and
~ 460 cm-1 are assigned to bending vibrations of O ndash B ndash O bonds and the band at ~ 490 cm-
1 is assigned to bending vibrations of B-O-B bonds
From FT-IR spectra it can be concluded that the addition of manganese or iron ions in
vitreous matrices leads to the increase of the disorder degree
Also the structural changes that appeared in 3B2O3middotLi2O vitreous matrix with an
addition MnO or Fe2O3 content can be studied Ar=A4A3 ratio(A4 - relative number of -4BOslash tetrahedral borate units A3 - relative number of triangular (BOslash3 and BOslash2O-) units
0 10 20 30 40 50
010
015
020
Ar
x [mol]
MnO Fe2O3
Fig 414 The evolution of Ar ratio with the MnO or Fe2O3 content of
xMnOmiddot(100-x)[3B2O3middotLi2O] şi xFe2O3middot(100-x)[3B2O3middotLi2O] The evolution of the value of this ratio also allows a visualization of the effects
determined by the presence of the manganese or iron ions in the matrix The value Arltlt 1
indicated that BO3 is dominant related to BO4
422 Study by Raman spectroscopy of xMOmiddot(100-x)[3B2O3middotLi2O] glasses
where MO =gt MnO or Fe2O3
The Raman spectra obtained for xMOmiddot(1-x)[3B2O3middotLi2O] glass system were MO =gt
MnO or Fe2O3 with 0 le x le 50 mol are presented in figure 414-16 and their structural
assignments are summarized in table 43
Studying the Raman spectra of xMOmiddot(1-x)[3B2O3middotLi2O] glass system where MO =gt
MnO or Fe2O3 it has been observed that the absorption bands presented in vitreous matrix
gradually decreased with an increase in the manganese or iron content in both glasses system
which suggested an increase of the disorder in these vitreous systems
23
1000 2000 3000
B2O3Li2O
Wavenumber [cm-1]
Ram
an In
tens
ity [a
u]
1430
107490
279
1471
Fig 415 Raman spectra of vitreous matrix 3B2O3middotLi2O
500 1000 1500 2000 2500 3000
1430
107490
2791
0
Wavenumber [cm-1]
Ram
an In
tens
ity [a
u]
1
3
20
05
5
10
35
50
MnO
471
Fig 416 Raman spectra of xMnOmiddot(100-x)[3B2O3middotLi2O] glasses
400 600 800 1000 1200 1400 1600
Wavenumber [cm-1]
Ram
an In
tens
ity [a
u]
0
1
3
20
05
5
10
35
50
Fe2O3
1430
1074
90279
1
471
Fig 417 Raman spectra of x Fe2O3middot(100-x)[3B2O3middotLi2O] glasses
24
43 Comparative study by electron paramagnetic resonance (EPR) and magnetic
susceptibility measurements of xMOmiddot(100-x)[As2O3middotTeO2] xMOmiddot(100-x)
[As2O3middotPbO] and xMOmiddot(100-x)[3B2O3middotLi2O] glasses where MO =gt MnO or Fe2O3
431 Comparative study by electron paramagnetic resonance (EPR) of
xMnOmiddot(100-x)[As2O3middotBO] where BO =gt TeO2 or PbO
and xMnOmiddot(100-x) [3B2O3middotLi2O] glasses
In order to obtain more information regarding the behavior of manganese ions in
different vitreous matrices [3031] xMnOmiddot(100-x)[As2O3middotBO] where BO =gt TeO2 or PbO
and xMnOmiddot(100-x) [3B2O3middotLi2O] glasses were investigated by EPR spectroscopy on a large
compositional range with 0 le x le 50 mol The EPR spectra of Mn2+ for xMnOmiddot(100-
x)[As2O3middotPbO] (S1) xMnOmiddot(100-x)[As2O3middotTeO2] (S3) and xMnOmiddot(100-x)[3B2O3middotLi2O]
(S5) are presented in figure 418-20 These spectra present two absorption lines centered at gef
43 and gef 20 in all systems
The absorption line centered at gef 43 and is due to isolated Mn2+ ions [32] The
absorption line centered at gef 20 may be attributed to Mn2+ species interacting by magnetic
coupling[33] dipolar and or super exchange the last ones forming magnetic clusters [32]
The evolution of the spectra is easier to follow considering the dependence of
concentration on the EPR parameters the line - intensity (obtained as an integral of the area
under the corresponding EPR signal) J and the line - width ΔB The evolution of J and AB
reflects the structural transformations which appear in the glass matrices due to the increase of
manganese ions content
The intensity and the line - width of the resonance line from gef 43 for all
investigated systems is represented in figure 421(ab)
The intensity of the resonance line from gef 43 for all investigated glass systems
decreases due to the decrease of the isolated manganese ions numbers The line - width from
gef 43 for (S1) and (S3) systems decreases due to decrease of Mn2+ number and to the
structural disorder in glasses with the increase of MnO content For (S5) glass system the line
- width of the resonance line there is an increase in all compositional domains
The intensity of the resonance line from gef 20 can be observed as increasing up to
x=14 mol for (S1) system up to x=8mol for (S3) system and 20 mol for (S5)
system The line - width of the resonance line from gef 20 for (S1) and (S3) systems
increases up to 3 mol and 5mol for (S5) due to Mn2+ species interacting by magnetic
coupling dipole- dipole as the main broadening mechanism Over this concentration line ndash the
width of the resonance line from gef 20 is straight and it can be assumed that the
manganese ions begin to manifest super exchange magnetic interactions
25
1000 2000 3000 4000 5000
Firs
t der
ivat
ive
of a
bsor
ptio
n [u
a]
05
1
3
5
10
20
35
50
x [mol Mn2O3]amplif
B [G]
10
200
40
80
400
5
1
1
Fig 418 The EPR spectra of Mn2+ for xMnOmiddot(100-x)[As2O3middotPbO] (S1)
glass system
1000 2000 3000 4000 5000
Firs
t der
ivat
ive
of a
bsor
ptio
n [u
a]
x [mol MnO]
051
3
5
10
20
35
50
9
500
400
50
100
4
1
amplif
B [G]
1
Fig 419 The EPR spectra of Mn2+ for xMnOmiddot(100-x)[As2O3middotTeO2] (S3)
glass system
26
1000 2000 3000 4000 5000
501
B [G]
Firs
t der
ivat
ive
of a
bsor
ptio
n [u
a]
1
4
9
10
30
60
100
amplif
05
1
3
5
10
20
35
x [mol MnO]
Fe3+
Fig 420 The EPR spectra of Mn2+ for xMnOmiddot(100-x)[3B2O3middotLi2O] (S5)
glass system
0 2 4 6 8 10 12 14 16 18 20 22
x [mol]
J [ u
a]
S1 S3 S5
-2 0 2 4 6 8 10 12 14 16 18 20 22
50
100
150
200
250
300
S1 S3 S5
x [mol]
B
[G]
a b
Fig 421 The dependence on MnO content of the intensity (a) and width(b) of resonance
line at gef 43 for xMnOmiddot(100-x)[As2O3middotPbO] (S1) xMnOmiddot(100-x)[As2O3middotTeO2] (S3) şi
xMnOmiddot(100-x)[3B2O3middotLi2O] (S5) system glasses
27
0 10 20 30 40 50
x [mol]
J [ u
a]
S1 S3 S5
0 10 20 30 40 50
400
500
600
700
800
900
S1 S3 S5
x [mol]
B[G
]
a b
Fig 422 The dependence on MnO content of the intensity (a) and width b) of resonance
line at gef 20 for xMnOmiddot(100-x)[As2O3middotPbO] (S1) xMnOmiddot(100-x)[As2O3middotTeO2] (S3) and
xMnOmiddot(100-x)[3B2O3middotLi2O] (S5) system glasses
Following figure 418-20 it can be observed that (S1) and (S3) have had a similar
evolution but (S5) system presented for 05 le x le 5 mol (fig420) has a hyperfine
sextet[33] at gef 20due to Mn2+ isolated ions
432 Comparative study by magnetic susceptibility measurements of
xMnOmiddot(100-x)[As2O3middotBO] where BO =gt TeO2 or PbO and
xMnOmiddot(100-x)[3B2O3middotLi2O] glasses
The magnetic susceptibility data are in good agreement with the EPR result The
magnetic behavior of the glasses from xMnOmiddot(100-x)[As2O3middotBO] where BO =gt TeO2 (S3)
or PbO (S1) and xMnOmiddot(100-x)[3B2O3middotLi2O] (S5) glasses for 3 le x le 50 mol MnO are
presented in figure 423 - 25
For (S1) and (S3) system glasses up to x 3 mol and x 5 mol (S5) glass
system the temperature dependence of the reciprocal magnetic susceptibility obeys a Curie
law In this concentration range the manganese ions are predominantly isolated orand
participate in dipole-dipole interractions At higher concentrations the reciprocal magnetic
susceptibility obeys a Curie-Weiss law with negative paramagnetic Curie temperature (p)
characteristic to antiferromagnetic coupled ions by means of super exchange interractions(fig
426) This behavior of manganese ions is confirmed by the shape of the EPR spectra
28
100 150 200 250
2
4
6
8
10
12
14
16
18
20
22
T [K]
[
emu
mol
]-1
3 mol 5 mol 10 mol 20 mol 35 mol 50 mol
Fig423 The temperature dependence of -1 for xMnOmiddot(100-x)[As2O3middotPbO]
(S1) 3 le x le 50 mol
50 100 150 200 2500
2
4
6
8
10
12
14
16
18
20
22
3 mol 5 mol 10 mol 20 mol 35 mol 50 mol
T [K]
[
emu
mol
]-1
Fig424 The temperature dependence of -1 for xMnOmiddot(100-x)[ As2O3middotTeO2]
(S1) 3 le x le 50 mol
100 150 200 250
2
4
6
8
10
12
14
16
18
20
22
[em
u m
ol]-1
T [K]
3 mol 5 mol 10 mol 20 mol 35 mol 50 mol
Fig425 The temperature dependence of -1 for xMnOmiddot(100-x)[3B2O3middotLi2O]
(S5) 3 le x le 50 mol
29
0 10 20 30 40 50
0
20
40
60
80
100
x [mol]
-p [K
]
(S1) (S3) (S5)
Fig426Concentration dependence of (p) for sistemele xMnOmiddot(100-x)[As2O3middotPbO]
(S1) xMnOmiddot(100-x)[As2O3middotTeO2] (S3) şi xMnOmiddot(100-x)[3B2O3middotLi2O] (S5)
Using the representation 1 =f(T) the molar Curie constants CM the effective
magnetic moments and molar fraction of Mn2+(x1) şi Mn3+(x2) ions were calculated and
represented in tables 44 -6
Tabel 44 Molar Curie constants effective magnetic moments and molar fraction of Mn2+(x1) şi Mn3+(x2) ions in xMnOmiddot(100-x)[As2O3middotPbO] (S1) glasses
x
[mol MnO2] CMtimes102
[emu mol] ef
[microB] x1
[mol Mn2+O2] x2
[mol Mn3+O2] 3 1272 582 268 032 5 1979 562 343 157 10 3777 549 555 445 20 6688 517 492 1508 35 12239 502 377 3123 50 15427 496 268 4732
Tabel 45 Molar Curie constants effective magnetic moments and molar fraction of Mn2+(x1) şi Mn3+(x2) ions in xMnOmiddot(100-x)[As2O3middotTeO2] (S3)glasses
x
[mol MnO2] CMtimes102
[emu mol] ef
[microB] x1
[mol Mn2+O2] x2
[mol Mn3+O2] 3 1297 588 287 013 5 1938 556 312 188 10 3804 551 575 425 20 6766 52 549 1451 35 11148 504 441 3059 50 15528 498 358 4642
30
Tabel 46 Molar Curie constants effective magnetic moments and molar fraction of Mn2+(x1) şi Mn3+(x2) ions in xMnOmiddot(100-x)[3B2O3middotLi2O] (S5) glasses
x
[mol MnO2] CMtimes102
[emu mol] ef
[microB] x1
[mol Mn2+O2] x2
[mol Mn3+O2] 3 127 581 265 035 5 1919 554 303 197 10 3681 542 486 514 20 7215 519 53 147 35 1121 506 505 2995 50 15898 501 493 4507
433 Comparative study by electron paramagnetic resonance (EPR) of
xFe2O3middot(100-x)[As2O3middotBO] where BO =gt TeO2 or PbO and
x Fe2O3middot(100-x) [3B2O3middotLi2O] glasses
In order to obtain more information regarding the behavior of iron ions in
xFe2O3middot(100-x)[As2O3middotBO] where BO =gt TeO2 (S4) or PbO (S2) şi xFe2O3middot(100-
x)[3B2O3middotLi2O] glasses were investigated by EPR spectroscopy on a large compositional
range with 05 le x le 35 mol Fe2O3 The EPR spectra of Fe3+ in xFe2O3middot(100-
x)[As2O3middotPbO] (S2) xFe2O3middot(100-x)[As2O3middotTeO2] (S4) and xFe2O3middot(1-x)[3B2O3middotLi2O]
(S6) are presented in figure 427-29 These spectra present two absorption lines centered at
gef 43 and gef 20 up to x le 35mol Fe2O3 systems studied
The absorption line centered at gef 43 is due to isolated Fe3+ ions [34-36] The
absorption line centered at gef 20 may be attributed to Fe3+ species interacting by magnetic
coupling dipolar and or super exchange the last ones forming magnetic clusters [37-41]
The evolution of the spectra is easier to follow considering the dependence of
concentration on the EPR parameters the line - intensity (obtained as an integral of the area
under the corresponding EPR signal) J and the line - width ΔB The evolution of J and AB
reflects the structural transformations which appear in the glass matrices due to the increasing
of iron ions content
The intensity and the line - width of the resonance line from gef 43 for all
investigated systems is represented in figure 430 (a b) The intensity of the resonance line
from gef 43 increases for (S2) and (S4) up to 3 mol and up to 5 mol for (S6) then
decreases for all systems investigated A line broadening up to 3 mol from gef 43 for
these systems can be observed due to increasing of Fe3+ isolated number of ions
31
1000 2000 3000 4000 5000
40
Firs
t der
ivat
ive
of a
bsor
ptio
n [u
a]
B [G]
x [mol Fe2O3]
05
1
3
5
1020
35 2
40
20
10
10
10
amplif
Fig427 The EPR spectra of Fe3+ for xFe2O3middot(100-x)[As2O3middotPbO] (S2)
glass system
1000 2000 3000 4000 5000
100
B [G]
Firs
t der
ivat
ive
of a
bsor
ptio
n [u
a]
10080
20
50
20
20
3
05
1
5
102035
x [mol Fe2O3] amplif
Fig428 The EPR spectra of Fe3+ for xFe2O3middot(100-x)[As2O3middotTeO2] (S4)
glass system
32
1000 2000 3000 4000 5000
Firs
t der
ivat
ive
of a
bsor
ptio
n [u
a]
B [G]
3
05
1
5
10
20
35
x [mol Fe2O3]
30
50
20
20
10
30
30
amplif
Fig429 The EPR spectra of Fe3+ for xFe2O3middot(100-x)[3B2O3middotLi2O] (S6)
glass system
The intensity and the line - width of the resonance line from gef 43 for all
investigated systems is represented in figure 430 (a b)The resonance line from gef 20 is
attributed to Fe3+ ions that interact by magnetic coupling dipolar orand super exchange
interractions can be observed in all compositional domains
The intensity of the resonance line from gef 20 can be observed as increasing up to
x=35 mol for (S2) and (S6) system and 10 mol for (S4) system with increased iron
ions content The line - width of the resonance line from gef 20 increased up to 10mol
for (S2) system and up to 3 mol for (S4) and 5mol for (S6) due to Fe3+species
interacting by magnetic coupling dipole-dipole Above this concentration line - width of the
resonance line from gef 20 can be attributed to dipolar and super exchange magnetic
interactions The ΔB = f(x) dependence reflects the competion between the broadening
mechanism (dipole ndash dipole interactions the interactions between ions in diferent
valence state and structural disorder) and the narrowing ones (super exchange
interactions)
33
0 5 10 15 20 25 30 35 40
x [mol]
J [ u
a]
S2 S4 S6
a)
0 5 10 15 20 25 30 35 4040
60
80
100
120
140
160
180
200
220 S2 S4 S6
B[G
]
x [mol]
a b
Fig 430 The dependence on Fe2O3 content of the intensity (a) and width (b) of
resonance line at gef 43 for xFe2O3middot(100-x)[As2O3middotPbO] (S2)
xFe2O3middot(100-x)[As2O3middotTeO2] (S4) and xFe2O3middot(100-x)[3B2O3middotLi2O] (S6) glasses
0 5 10 15 20 25 30 35 40
x [mol]
J [ u
a]
S2 S4 S6
a)
0 5 10 15 20 25 30 35 40
200
400
600
800
1000
1200
1400
1600
x [mol]
B
[G] S2
S4 S6
a b
Fig 431 The dependence on Fe2O3 content of the intensity (a) and width (b) of
resonance line at gef 20 for xFe2O3middot(100-x)[As2O3middotPbO] (S2)
xFe2O3middot(100-x)[As2O3middotTeO2] (S4) and xFe2O3middot(100-x)[3B2O3middotLi2O] (S6) glasses
34
434 Comparative study by magnetic susceptibility measurements of
xFe2O3middot(100-x)[As2O3middotBO] where BO =gt TeO2 or PbO and
xFe2O3middot(100-x) [3B2O3middotLi2O] glasses
The magnetic susceptibility data are in good agreement with the EPR result The magnetic
behavior of the glasses xFe2O3middot(100-x)[As2O3middotPbO] (S2) xFe2O3middot(100-x)[As2O3middotTeO2]
(S4) and xFe2O3middot(100-x)[3B2O3middotLi2O] (S6) for 3 x 50 mol Fe2O3 are presented in
figure 432 - 34
For (S2) glass systems up to x 10 mol x 3 mol (S5) glass systems and x 5
mol (S6) glass systems the temperature dependence of the reciprocal magnetic susceptibility
obeys a Curie law In this concentration range the iron ions are predominantly isolated orand
participate in dipole-dipole interactions At higher concentrations the reciprocal magnetic
susceptibility obeys a Curie-Weiss law with negative paramagnetic Curie temperature (p)
characteristic to antiferromagnetic coupled ions by means of super exchange interactions(fig
435) This behavior of iron ions is confirmed by the shape of the EPR spectra
80 100 120 140 160 180 200 220 240 260 2800
1
2
3
4
5
6
7
8
9
10
11
[
emu
mol
]-1
T [K]
3 mol 5 mol 10 mol 20 mol 35 mol 50 mol
Fig432 The temperature dependence of -1 for xFe2O3middot(100-x)[As2O3middotPbO] (S2)
3 x 50 mol
35
80 100 120 140 160 180 200 220 240 260 2800
1
2
3
4
5
6
7
8
9
10
T [K]
[
emu
mol
]-1
3 mol 5 mol 10 mol 20 mol 35 mol 50 mol
Fig433 The temperature dependence of -1 for xFe2O3middot(100-x)[As2O3middotTeO2] (S4)
3 x 50 mol
80 100 120 140 160 180 200 220 240 260 2800
1
2
3
4
5
6
7
8
9
10
11
3 mol 5 mol 10 mol 20 mol 35 mol 50 mol
T [K]
[
emu
mol
]-1
Fig434 The temperature dependence of -1 for xFe2O3middot(100-x)[3B2O3middotLi2O] (S6)
3 x 50 mol
36
0 10 20 30 40 50
0
10
20
30
40
50
x [mol]-
p [K]
(S2) (S4) (S6)
Fig435Concentration dependence of (p) for sistemele xFe2O3middot(100-x)[As2O3middotPbO] (S2) xFe2O3middot(100-x)[As2O3middotTeO2] (S4) and xFe2O3middot(100-x)[3B2O3middotLi2O] (S6)
for 3 x 50 mol Fe2O3
Using the representation 1 = f(T) the molar Curie constants CM the effective
magnetic moments and molar fraction of Fe3+(x1) şi Fe2+(x2) ions were calculated and
represented in tables 47-9
Table 47 Molar Curie constants effective magnetic moments and molar fraction of
Fe3+(x1) şi Fe2+(x2) ions in xFe2O3middot(100-x)[As2O3middotPbO] glasses (S2)
x [mol Fe2O3]
CMtimes102
[emu mol] ef
[microB] x1
[mol Fe23+O3]
x2 [mol Fe2
2+O3] 3 2526 58 261 039 5 393 56 332 168 10 7326 541 476 524 20 13459 519 53 147 35 23364 516 829 2671 50 32154 507 767 4233
Table 48 Molar Curie constants effective magnetic moments and molar fraction of
Fe3+(x1) şi Fe2+(x2) ions in xFe2O3middot(100-x)[As2O3middotTeO2] glasses (S4)
x [mol Fe2O3]
CMtimes102
[emu mol] ef
[microB] x1
[mol Fe23+O3]
x2 [mol Fe2
2+O3] 3 2571 585 277 023 5 4016 566 363 137 10 7911 562 686 314 20 14992 521 643 929 35 22676 509 601 2899 50 30959 497 313 4687
37
Table 49 Molar Curie constants effective magnetic moments and molar fraction of Fe3+(x1) şi Fe2+(x2) ions in xFe2O3middot(100-x)[3B2O3middotLi2O] glasses (S6)
The results allowed to consider that the magnetic properties of the studied glasses can
be explained through magnetic interractions between Fe3+ - Fe3+ Fe3+- Fe2+ and Fe2+- Fe2+ that
explain the dependences of RPE parameters concentration
SELECTED CONCLUSIONS
In this thesis xMOmiddot(100-x)[As2O3middotTeO2] xMOmiddot(100-x) [As2O3middotPbO] and
xMOmiddot(100-x)[3B2O3middotLi2O] glasses where MO =gt MnO or Fe2O3 were comparatively
studied in 0 le x le 50 mol The structural modifications of investigated glass matrices were
comparatively followed in function of the manganese or iron ions on the investigated glass
matrices were followed
The study by FT-IR spectroscopy shows that the evolution of the spectra of
xMnOmiddot(100-x) [As2O3middotPbO] with the addition and the increasing of the MnO content suggest
that the manganese ions break up a part of As ndash O ndash As Pb ndash O ndash Pb and probably of As ndash O ndash
Pb bonds The addition of MnO in the As2O3middotPbO glass matrix is leading to a disordering of
the glasses structure with the increasing of the MnO content
The evolution of the absorption bands for FT ndash IR spectrum of xFe2O3middot(1-x)
[As2O3middotPbO] glasses are determined by the addition of Fe2O3 content It can be observed to
shift the bands assigned As ndash O ndash As vibrations from AsO3 units due to changing to length As
ndash O ndash As bonds and interne angles of AsO3 units disappears PbO4 units and appears FeO6
units The addition of Fe2O3 in the As2O3middotPbO glass matrix determined a disordering of the
glasses structure with the increasing of the Fe2O3 content
From FT-IR absorption spectra of the investigated xMOmiddot(100-x)[As2O3middotTeO2] glasses
system where MO =gt MnO or Fe2O3 it can be observed that the addition and increasing of
manganese ions concluded the contraction of As-O-As bonds from totally symmetric
x [mol Fe2O3]
CMtimes102
[emu mol] ef
[microB] x1
[mol Fe23+O3]
x2 [mol Fe2
2+O3] 3 2542 582 268 032 5 3943 561 338 162 10 7423 544 506 494 20 13568 520 549 1451 35 23094 513 731 2769 50 31746 503 584 4416
38
stretching vibrations of AsO3 units for x ge10 mol there can be an increase in number of As-
O-As bonds from AsO3 units orand a length these linkage to doubly degenerate stretching
vibrations of AsO3 units and a stretching vibration mode of TeO3 tp with NBO It can be
remarked from the FT-IR absorption spectra the gradual transformation of symmetric
stretching vibration mode of Te-O bonds from TeO3 units in TeO4 (tbp) units and the presence
of MnO2 units Once with the addition of iron ions the xFe2O3middot(100- x)[As2O3middotTeO2]
glasses behave like xMnOmiddot(100-x)[As2O3middotTeO2] glasses but in this system the
appearance of FeO6 units can be seen
From FT-IR spectra in xMOmiddot(100-x)[3B2O3middotLi2O] glasses where MO =gt MnO or
Fe2O3 can be concluded that the addition of manganese or iron ions in vitreous matrices leads
to the increase of the disorder degree
The study by Raman spectroscopy shows that the evolution of the spectra the addition
of MnO in the [As2O3middotPbO]glass matrix determined an order degree of the vitreous matrix
The intensity of the bands attributed vibrations As ndash O ndash As bonds from As2O units and
bending vibrations of As ndash O ndash As from As2O units shift to a higher wave length that suggests
an increase in the As2O units comparative to AsO3 units With the increase of iron ions content
in the As2O3middotPbO glass matrix the number of these structural units decreases due to the
increasing of the disorder in the studied glasses
With the increasing of manganese content in As2O3TeO2 glass matrix the intensity
of these bands is increasing showing that the manganese content favorites the formation of
TeO4 (tbp) and TeO3 (tp) units For high concentrations of iron ions in xFe2O3middot(100-
x)[As2O3 TeO2] system of glasses the number of As-O-As linkages appear in Raman
spectrum due to stretching vibrations of As-O-As and vibrations of the continuous TeO4 (tbp)
network show a significant decrease
Studying the Raman spectra of xMOmiddot(1-x)[3B2O3middotLi2O] glass system where MO =gt
MnO or Fe2O3 it has been observed that the absorption bands presented in vitreous matrix
gradually decreased with an increase in the manganese or iron content in both glasses system
which suggested an increase of the disorder in these vitreous systems
The EPR spectra presents the behavior of manganese or iron ions in different vitreous
matrices xMOmiddot(100-x)[As2O3middotBO] where MO=gtMnO or Fe2O3 and BO =gt TeO2 or
PbO and xMOmiddot(100-x) [3B2O3middotLi2O] Glasses were investigated by EPR spectroscopy on a
large compositional range with 0 le x le 50 mol The absorption line centered at gef 43 and
is due to isolated Mn2+ ions The absorption line centered at gef 20 may be attributed to
Mn2+ species interacting by magnetic coupling dipolar and or super exchange the last ones
forming magnetic clusters The EPR spectra of Fe3+ in xFe2O3middot(100-x)[As2O3middotPbO]
xFe2O3middot(100-x)[As2O3middotTeO2] and xFe2O3middot(1-x)[3B2O3middotLi2O] are presented two absorption
lines centered at gef 43 and gef 20 up to x le 35mol Fe2O3 systems studied
39
The absorption line centered at gef 43 is due to isolated Fe3+ ions The absorption
line centered at gef 20 may be attributed to Fe3+ species interacting by magnetic coupling
dipolar and or super exchange the last ones forming magnetic clusters
The evolution of the spectra is easier to follow considering the dependence of
concentration on the EPR parameters the line - intensity (obtained as an integral of the area
under the corresponding EPR signal) J and the line - width ΔB The evolution of J and AB
reflects the structural transformations which appear in the glass matrices due to the increase of
manganese ions content
The magnetic susceptibility data are in good agreement with the EPR result The
magnetic behavior of the glasses from xMnOmiddot(100-x)[As2O3middotBO] where BO =gt TeO2 (S3)
or PbO (S1) and xMnOmiddot(100-x)[3B2O3middotLi2O] (S5) glasses for 3 le x le 50 mol MnO
For (S1) and (S3) system glasses up to x 3 mol and x 5 mol (S5) glass
system the temperature dependence of the reciprocal magnetic susceptibility obeys a Curie
law In this concentration range the manganese ions are predominantly isolated orand
participate in dipole-dipole interractions At higher concentrations the reciprocal magnetic
susceptibility obeys a Curie-Weiss law with negative paramagnetic Curie temperature (p)
characteristic to antiferromagnetic coupled ions by means of super exchange interractions This
behavior of manganese ions is confirmed by the shape of the EPR spectra Using the
representation 1 =f(T) the molar Curie constants CM the effective magnetic moments
and molar fraction of Mn2+(x1) şi Mn3+(x2) ions were calculated The magnetic susceptibility
data are in good agreement with the EPR result
The magnetic behavior of the glasses xFe2O3middot(100-x)[As2O3middotPbO] (S2)
xFe2O3middot(100-x)[As2O3middotTeO2] (S4) and xFe2O3middot(100-x)[3B2O3middotLi2O] (S6) for 3 x 50
mol Fe2O3 are presented For (S2) glass systems up to x 10 mol x 3 mol (S5)
glass systems and x 5 mol (S6) glass systems the temperature dependence of the
reciprocal magnetic susceptibility obeys a Curie law In this concentration range the iron ions
are predominantly isolated orand participate in dipole-dipole interactions At higher
concentrations the reciprocal magnetic susceptibility obeys a Curie-Weiss law with negative
paramagnetic Curie temperature (p) characteristic to antiferromagnetic coupled ions by
means of super exchange interactions(fig 435) This behavior of iron ions is confirmed by the
shape of the EPR spectra Using the representation 1 = f(T) the molar Curie constants
CM the effective magnetic moments and molar fraction of Fe3+(x1) şi Fe2+(x2) ions were
calculated
40
REFERENCES
Chapter 1
[1] I Ardelean bdquoIntroducere icircn studiul materialelor oxidice cu structură vitroasă EdNapocaStar Cluj Napoca 2002 [2] G Srinivasarao N Veeraiah J All Com 327 52-65(2001) [3] G Srinivasarao N Veeraiah J Phys Chem Solids 63705-717(2002) [4] DBecherescu VCristea FMarx IMenessz FWinter Chimia stării solide Ed Şt şi Encicl Bucucureştivol 1 1983 [5] J Wong CAAngell Glass-Structure by Spectroscopy Dekker Inc New York 1976 [6] BEWarren HKKrutter O Morningstat J Am Ceram Soc 19 202 (1936) [7] LLSperry JD Mackenzie Phys Chem Glasses 9 91 (1968) [8] WLKonijnendijk JMStevels J Non-Cryst Solids 18 307 (1975) [9] FCEversteyn JM Stevels HJ Naterman Phys Chem Glasses 1 134 (1963) [10] G Fuxi Optical and Spectroscopie Properties of Glass Springer-Verlag Shanghai Scientific Technical Pub Shanghai 1991 [11] YDYiannopoulos GDChryssikos EIKamitsos Phys Chem Glasses 42(3) 164 (2001) [12] MGFerreira da Silva BFOCosta J Non-Cryst Solids 293-295 534 (2001) [13] RYordanova YDimitriev VDimitriev S Kassabov DKlissurski JNon-Cryst Solids 201 141 (1996) [14] W L Konijnendijk J M Stevels J Non-Cryst Solids 18 307 (1980) [15] M Iron M Couzi ALevasseur JBrethous JSolidState Chem 31 285 (1980) [16] TFurukawa WBWhite PhzsChemGlasses 21 85 (1980) [17] E I Kamitsos M A Karakassides GD Chryssikos J Phys Chem 90 4528 (1986) [18] E I Kamitsos M A Karakassides GD Chryssikos J Phys Chem 91 1073 (1987) [19] TWBril Philips Res Rep Suppl 2 117 (1976) [20] E I Kamitsos M A Karakassides GD Chryssikos J Phys Chem 30 203 (1989) [21] BNMeera JRamakrishna J Non-Cryst Solids 159 1 (1993) [22] KWitke THubert PReich JRamanSpectr 24 407 (1993) [23] E I Kamitsos M A Karakassides Phys Chem Glasses 30 19 (1989) [24] MPeteanu Teză de doctoratrdquo Universitatea Babeş-Bolyairdquo Cluj Napoca (1989) [25] PCTaylor PJBray JPhys Chem Solids 33 43 (1972) [26] IArdelean MPeteanu GhIlonca DPop Solid State Commun 33 653 (1980) [27] AV De Wijn RE Van Balderen JKemPhys 46 4 (1967) [28] DL Griscom RE Griscom J Phys Chem Glasses 12 19 (1971) [29] JWH Schreurs JChem Phys 69 2151 (1978) [30] AlNicula M Peteanu IArdelean Studia Univ Babeş-Bolyai Physica 2 65 (1979) [31] M Peteanu IArdelean SFilip ITodor GSalvan Studia Univ Babeş-Bolyai Physica XL 2 9 (1995) [32] IArdelean M Peteanu SFilipV Simon ITodor Solid State Commun 105 (5) 339 (1998) [33] SKMendiratta EGuedes de Sousa JMatSci Lett7 733 (1988) [34] IArdelean M Peteanu SFilip V Simon GGyorffy Solid State Commun 102 (4) 341 (1997) [35] IArdelean M Peteanu SFilip V Simon FCiorcas ITodor JMagnMagn Mat 196-197 257 (1999) [36] JKliava RBerger YServant JEmery JMGreneche JTrokss J Non-Cryst Solids 202 205 (1996) [37] LDBogomolova NA Krasilnikova VLBogdanov VDKhaliev VV Mitrofanov J Non-Cryst Solids 188 130 (1995) [38] DLoveridge SPark PhysChem Glasses 12 19 (1971) [39] IArdelean G Salvan M Peteanu V Simon FCiorcas Mod PhysLett B 13 (22-23) 801 (1999)
41
[40] JLRao AMuraly EDRao J Non-Cryst Solids 202 215 (1996) [41] CPrakash S Husain RJ Singh SMollah JAlloys Compon 326 47 (2001) [42] EGuedes de Sousa SKMendiratta JMMachado Da Silva Portugal Phys 17 (3-4) 203 (1986) [43] TCastner GSNewell WCHolton CP Slichter JChem Phys 32 668 (1960) [44] SPChaudhuri SKPatra JMatSci 35 4735 (2000) [45] IArdelean HH Qiu HSakata Matt Lett 32 335 (1997) Chapter 2 [1] J Wong C A Angel Glass Structure by Spectroscopy Marcel Dekker inc New-York 1976 [2] I Ardelean bdquoIntroducere icircn studiul materialelor oxidice cu structură vitroasă EdNapocastar Cluj-Napoca 2002 [3] N Avram GH Mateescu Spectroscopia icircn infraroşu Aplicaţii icircn chimia organică Ed Tehnică Bucureşti 1968 [4] TIliescu Spectroscopie optică moleculară vibraţională şi electronică Ed Casa Cărţii de Ştiinţă Cluj- Napoca 2000 [5] S Aştilean bdquoMetode şi tehnici moderne de spectroscopie optică Ed Casa Cărţii de Ştiinţă Cluj - Napoca 2002 p 5 [6] I Ursu Rezonanţă Electronică de Spinrdquo Ed AcademieiBucureşti (1965) [7] CHHurd ContempPhys 23 (5) 469 (1982) [8] GWAnderson WDCompton JChemPhys52 6166 (1970) [9] MS Seehra GSrinivasan Landolt-Bornstein (New Series) SubVolume F3 Springer-Verlag Berlin 1994 [10] GToulouse ContempPhys 2115 (1977) [11] NMMurayMagnetic susceptybility EdInterscience New York P1773 1963 [12] JBGoodenough Magnetism and Chemical Bond EdInterscience New York 1963 [13] IArdelean G Salvan M Peteanu V Simon FCiorcas Mod PhysLett B 13 (22-23) 801 (1999) [14] IArdelean MPeteanu R Ciceo Lucăcel Studii de rezonanţă paramagnetică electronică şi magnetice ale unor ioni 3d icircn sticle pe bază de B2O3 Ed Presa Univesitară Clujeană 2005 [15] IArdelean PhysStatSol (b) 87K137 (1978) [16] IArdelean Solid State Commun 31 75 (1979) [17] EJFrieble LKWilson AWDozier DLKinser PhysStatSol (b) 45 323 (1971) [18] DWMoon JMAitken RKMcCrone GS Ciloszik PhysChe Glasses 16 (5) 91 (1975) [19] SFilip Teză de doctorat UnivBabeş-Bolyai Cluj Napoca 1996 [20] CJSchinkel GWRathenou Physics of Non-Crystaline Solids North Holland Publ Co Amsterdam 215 1965 [21] EJFrieble LKWilson NCKoon DLKinser JAm Ceram Soc 57-237 (1974) [22] RJLandry JT Fournier CGYoung JChemPhys 46 1285 (1967) [23] WSimpson PhysStatSolidi b40 207 (1970) [24] RHasegawa PhysRevB b(5) 1631 (1971) [25] IArdelean GhIlonca MPeteanu Solid State Commun 52 145 (1984) [26] IArdelean GhIlonca OCozar J Physique 49 C8 1107 (1988) Chapter 3 [1] LFBates Modern Magnetism p133 Cambridge University Press London 1962 [2] IArdelean GhIlonca DBarbos Solid State Commun 40 769 (1981) [3] EBurzo IUrsu DUngur IArdelean JMatSci 15 581 (1980) [4] EBurzo IUrsu DUngur IArdelean MatResBull 15 1273 (1980) [5] DLGriscom Glass Science and Technology 48 151 (1990) [6] PJBray AH Silver Modern aspects of the vitreous state vol1 Butterworth
42
London 1960 [7] IArdelean Teza de doctorat UnivBabeş-Bolyai Cluj Napoca 1979 [8] SAştilean bdquoMetode şi tehnici moderne de spectroscopie opticărdquo EdCasa Cărţii de Ştiinţă Cluj ndash Napoca 2002 p5 [9] IArdelean RCiceo-Lucăcel ldquoFizica şi Tehnologia Materialelor Oxidice Lucrări Practicerdquo Ed Univ ldquoBabeş-Bolyairdquo Cluj-Napoca 2000 [10] VPop IChicinaş NJumate Fizica materialelor Metode experimentalerdquo EdPresa Universitară Clujeană 2001 [11] IUrsu Rezonanţă electronică de spinrdquo EdAcademiei Bucureşti 1965 Chapter 4 [1] I Ardelean S Lupşor D Rusu Solid State Sci 10 1384(2008) [2] I Ardelean S Lupşor D Rusu trimis spre publicare la Physica B decembrie 2009 [3] P Tarte Spectrochim Acta 18 467 (1962) [4] R A Condrate J Non ndash Cryst Solids 84 26 (1986) [5] G Srinivasarao N Veeraiah Phys Stat Sol (a) 191 370(2002) [6] G Srinivasarao N Veeraiah J Phys Chem Solids 63 705(2002) [7] G Srinivasarao N Veeraiah J All Com 327 52 (2001) [8] DK Durga N Veeraiah Bull Mater Sci 24 (4) 421 (2001) [9] F F Bentley L D Smithson A L Rozek InfraredndashSpectra and Characteristic Frequencies 700-300 cm-1 Interscience New York 1968 p 103 [10] O Noguera T Merle-Mejean AP Mirgorodsky MB Smirnov P Thomas J-C Champarnaud-Mesjard J Non-Cryst Solids 330 50 (2003) [11] BVR Chowdari KL Tan Fang Ling Solid State Ionics 113 ndash 115 711(1998) [12] C Jiang J Zhang H Mao F Gan Glass Technol 39(6) 200(1998) [13] MR Sahar K Sulhadi MS Rohani J Mater Sci 42 824(2007) [14] C Horea D Rusu I Ardelean J Mater Sci Mater Electron 20 905(2009) [15] GE Rachkovskaya GB Zakharevich J Appl Spectrosc 74 86(2007) [16] I Ardelean S Lupşor D Rusu trimis spre publicare la Journal of Materials Science Materials in Electronics decembrie 2009 [17] I Ardelean S Lupşor D Rusu trimis spre publicare la Modern Physics Letters B decembrie 2009 [18] R Iordanova Y Dimitriev V Dimitrov S Kassabov D Klissurski J Non ndash Cryst Solids 231 227 (1998) [19] R Iordanova Y Dimitriev S Kassabov D Klissurski J Non ndash Cryst Solids 204 141 (1996) [20] J O Jensen S J Gilliam A Banerjee D Zeroka S J Kirkby C N Merrow J Mol Struct (Theochem) 664 145 (2003) [21] G N Papatheodorou S A Solin Solid State Commun 16 5 (1975) [22] BVR Chowdari KL Tan Fang Ling J Mat Sci 35 2015 (2000) [23] R C Lucacel C Marcus V Timar I Ardelean Solid State Sci 9 850 (2007) [24] CP Varsamis EI Kamitsos GD Chryssikos Solid State Ionics 136ndash137 1031 (2000) [25] Sherief M Abo-Naf Fatma H El Batal Moenis A Azooz Mat Chem Phys 77 846 (2002) [26] SG Motke SP Yawale SS Yawale Bull Mater Sci 25 (10) (2002) [27] R Akagi N Ohtori N Umesaki J Non ndash Cryst Solids 293 471(2001) [28] E I Kamitsos M A Karakassides G D Chryssikos J Phys Chem 91(5) 1073 (1987) [29] H Ushida Y Iwadate T Hattori S Nishiyama K Fukushima Y Ikeda M Yamaguchi M Misawa T Fukunaga T Nakazawa S Jitsukawa J Alloys Compd 377 167 (2004) [30] I Ardelean F Ciorcas M Peteanu S Lupşor G Salvan Balkan Phys Lett 5 860 (1997)
43
[31] I Ardelean M Peteanu V Simon O Cozar F Ciorcas S Lupşor J Magn Magn Mater 196 253 (1999) [32] IArdelean MPeteanu GhIlonca Phys Stat Sol (a) 58 K33(1980) [33] IArdelean MPeteanu R Ciceo-Lucăcel ldquoStudii de rezonanţă paramagnetică electronică şi magnetice ale unor ioni 3d icircn sticle pe bază de B2O3rdquo Ed Presa Univ Clujeană Cluj Napoca 2005 p 171 [34] JLRao AMuraly EDRao J Non-Cryst Solids 202 215 (1996) [35] RPSChakradhar AMurali JLRao Optical Mat 10 109 (1998) [36] IArdelean MPeteanu SFilip VSimon GGyorffy Solid State Commun 102(4) 341 (1997) [37] IArdelean MPeteanu VSimon SFilip FCiorcaş ITodor J Magn Magn Mat 196-197 257 (1999) [38] IArdelean GSalvan MPeteanu VSimon CHimcinschi FCiorcas Mod Phys Lett B 13(22-23) 801 (1999) [39] IArdelean HHQiu HSakata Mat Lett 32 335 (1997) [40] SPChaudhuri SKPatra J Mat Sci 35 4735 (2000) [41] I Ardelean M Peteanu V Simon G Salvan J Mat Sci Technol 18 (3) 1 (2002)

2
CONTENT
INTRODUCTION 6
CHAPTER 1 THE STUDY OF THE STRUCTURE OF As2O3 AND B2O3 BASED
GLASSES 8
11 The structure of As2O3 and B2O3 based glasses 8
12 Behaviour of manganese and iron ions in vitreous oxide matrices 14
- Behaviour of manganese ions in vitreous oxide matrices 14
- Behaviour of iron ions in vitreous oxide matrices 16
References 19
CHAPTER 2 METHODS USED IN THE STUDY OF STRUCTURE AND PROPERTIES
OF OXIDE GLASSES 21
21 Infrared absorption spectroscopy (IR) 21
22 Raman spectroscopy 23
23 Electron paramagnetic resonance (EPR) 27
24 Magnetic properties of system glasses 31
25 Magnetic behaviour of oxide vitreous system 35
251 The magnetic measurements used in the study of vitreous system
containing transition metal ions 36
References 41
CHAPTER 3 EXPERIMENTAL TECHNIQUES 43
31 The processing and the preparation of the samples 43
311 The processing of the samples 43
312 The preparation of the samples 45
32 Techniques used for samples measurements 45
321 X-ray Diffraction 45
322 Infrared absorption spectroscopy 48
323 Raman spectroscopy 50
324 Electron paramagnetic resonance (EPR) 52
325 Magnetic susceptibility measurements 57
References 57
3
CHAPTER 4 RESULTS AND DISCUSSION REGARDING THE STUDY OF xMOmiddot(100-
x)[As2O3middotTeO2] xMOmiddot(100- x)[As2O3middotPbO] and xMOmiddot(100-x)[3B2O3middotLi2O] GLASS
STRUCTURE WHERE MO =gt MnO or Fe2O3 58
41 Comparative study by FT-IR and Raman spectroscopies of xMOmiddot(100-
x)[As2O3middotTeO2] xMOmiddot(100-x)[As2O3middotPbO] and xMOmiddot(100-x)[3B2O3middotLi2O] glasses
where MO =gt MnO or Fe2O3 58
411 Comparative study by FT-IR spectroscopy of As2O3middotTeO2 and
As2O3middotPbO vitreous matrices 58
412 Comparative study by FT-IR spectroscopy of xMOmiddot(100-
x)[As2O3middotPbO] vitreous systems where MO =gt MnO or Fe2O3 61
413 Comparative study by FT-IR spectroscopy of xMOmiddot(100-
x)[As2O3middotTeO2] vitreous systems where MO =gt MnO or Fe2O3 66
414 Comparative study by FT-IR spectroscopy of xMnOmiddot(100-
x)[As2O3middotBO] vitreous systems where BO =gt TeO2 or PbO 69
415 Comparative study by FT-IR spectroscopy of xFe2O3middot(100-
x)[As2O3middotBO] vitreous systems where BO =gt TeO2 or PbO 70
416 Comparative study by Raman spectroscopy of As2O3middotTeO2 and
As2O3middotPbO vitreous matrices 71
417 Study by Raman spectroscopy of xMOmiddot(100- x)[As2O3middotPbO]
vitreous systems where MO =gt MnO or Fe2O3 73
418 Study by Raman spectroscopy of xMOmiddot(100-x)[As2O3middotTeO2]
vitreous systems where MO =gt MnO or Fe2O3 75
419 Comparative study by Raman spectroscopy of xMnOmiddot(100-
x)[As2O3middotBO] vitreous systems where BO =gt TeO2 or PbO 78
4110 Comparative study by Raman spectroscopy of xFe2O3middot(100-
x)[As2O3middotBO] vitreous systems where BO =gt TeO2 or PbO 79
42 Comparative study by FT-IR and Raman spectroscopies of
xMOmiddot(100-x)[3B2O3middotLi2O] glasses where MO =gt MnO or Fe2O3 79
421 Study by FT-IR spectroscopy of xMOmiddot(100-x)[3B2O3middotLi2O]
glasses where MO =gt MnO or Fe2O3 80
422 Study by Raman spectroscopy of xMOmiddot(100-x)[3B2O3middotLi2O]
glasses where MO =gt MnO or Fe2O3 86
4
43 Comparative study by electron paramagnetic resonance (EPR) and
magnetic susceptibility measurements of xMOmiddot(100-x)[As2O3middotTeO2] xMOmiddot(100-x)
[As2O3middotPbO] şi xMOmiddot(100-x)[3B2O3middotLi2O] glasses where MO=gt MnO or Fe2O3 88
431 Comparative study by electron paramagnetic resonance (EPR) of
xMnOmiddot(100-x)[As2O3middotBO] where BO =gt TeO2 or PbO and xMnOmiddot(100-x)
[3B2O3middotLi2O] glasses 88
432 Comparative study by magnetic susceptibility measurements of
xMnOmiddot(100-x)[As2O3middotBO] where BO =gt TeO2 or PbO nd xMnOmiddot(100-x)
[3B2O3middotLi2O] glasses 93
433 Comparative study by electron paramagnetic resonance (EPR) of
xFe2O3middot(100-x)[As2O3middotBO] where BO =gt TeO2 or PbO and x Fe2O3middot(100-x)
[3B2O3middotLi2O] glasses 98
434 Comparative study by magnetic susceptibility measurements of
xFe2O3middot(100-x)[As2O3middotBO] where BO =gt TeO2 or PbO and x Fe2O3middot(100-x)
[3B2O3middotLi2O] glasses 104
References 110
CONCLUSIONS 112
5
INTRODUCTION
Glasses are noncrystaline solid materials that have a disordered structure but have a
local order The study of materials with vitreous structures gained a special attention due to
their manifold applications in domains of science and technology The oxide glasses unfold a
large variety of properties due to the variety of their compounds these glasses have wide
technological applications
This thesis work is focused on characterizing the structure the optic and magnetical
properties of arsenolite and borate glasses The study presented in this thesis has as objective
the obtaining of new experimental data and the clarification of the physical phenomena which
determine the structural behavior of As2O3 and B2O3 based glasses doped with manganese or
iron ions In order to obtain this information of xMOmiddot(100-x)[As2O3middotTeO2] xMOmiddot(100-
x)[As2O3middotPbO] and xMOmiddot(100-x)[3B2O3middotLi2O] where MO =gt MnO or Fe2O3 glass
systems with 0 lt x lt 50 mol MnO or Fe203 they were prepared and investigated by x - ray
Diffraction FT - IR spectroscopy Raman spectroscopy electron paramagnetic resonance
(EPR) and magnetic susceptibility measurements
The thesis is structured in four chapters The first chapter presents on literature basis
the main results regarding the structure and the properties of As2O3 and B2O3 based glasses
Chapter 2 presents theoretical and experimental general aspects regarding the iron and
manganese behavior using the IR absorption Raman spectroscopies electron paramagnetic
resonance and magnetic susceptibility Chapter 3 describes the experimental techniques used in
the studies of glasses The processing and preparation of the samples are presented Chapter 4
presents and discusses the experimental results obtained for the investigated glasses In the
end the general conclusions which emphasize the most important results of this thesis are
presented
CHAPTER 1 THE STUDY OF THE STRUCTURE OF As2O3 AND B2O3 BASED
GLASSES
As2O3 and B2O3 are the most important glass forming oxides and have been
incorporated into various kinds of glass system in order to obtain the desired physical and
chemical properties for both scientific and industrial applications As2O3 is a very strong glass
formation having a configuration based on pyramidal AsO3 units determined by a special
dynamics on the As and O bonds unique properties of the glass systems [1-3] The properties
of the glasses based the B2O3 are due to the fact that the boron atom can assume triangular
6
and tetrahedral coordination and also to the different ways through which the borate buildings
units can be linked together [4-9]
The behavior of various borate species in the glass structure is determined by the nature
of modifier oxides (TeO2 PbO etc) In most binary borate glasses the glass properties change
almost linearly with composition [10-17] In binary borate glasses the properties of these show
a major deviation from linearity which depends on modifier oxide The structural reasons for
this is generally due to the change in the coordination of boron atom from 3 to 4 and back
again Many technological applications of these glasses depend of this effect since is produces
many improvements [18-23]
The introduction of MnO [24-32] or Fe2O3 [33-45] into diamagnetic glasses transform
them into paramagnetic glasses The introduction of iron and manganese in small percentages
modifies the physical properties of the glasses and the material is more accessible for a
complete structural characterization
In order to extend the available information concerning the interesting class of As2O3
and B2O3 based glasses we investigated glasses by means of different physical methods We
obtained valuable information concerning the structure and structural changes of the glasses
that occur with the addition of transitional oxide metals
CHAPTER 2 METHODS USED IN THE STUDY OF STRUCTURE AND
PROPERTIES OF OXIDE GLASSES
In this chapter some of the methods used in the investigation of the structure and
properties of vitreous systems are presented The study of the structure and properties of oxide
glasses with transitional metals ions IR and Raman spectroscopies electron paramagnetic
resonance and magnetic susceptibility measurements were chosen as investigation methods
The electromagnetic radiation (EM) with frequencies between 4000 and 400 cm -1 called
infrared radiation (IR) is used to obtain information connected to the structure of the
compound and as an analytic method to test the purity of the compound Its application in
organic chemistry is known as IR spectroscopy The radiation is absorbed by organic
molecules and converted in molecular vibration energy When the radiant energy coincides
with a specific molecular vibration the absorption appears The wave length at which the
radiation is absorbed by the organic molecule gives information regarding the functional
groups presented in the molecule [1-4]
The Raman spectroscopy brings useful contributions to the molecular vibrations study
The interraction mechanism of electromagnetic radiation with the molecular vibration which
forms the Raman spectroscopy theoretical basis differs from the one of the process which
forms the IR spectroscopy theoretical basis [4]
7
Another method used in the investigation of the glass system is the electron paramagnetic
resonance (RPE) This method is one of the most powerful techniques for local order
investigation RPE is a method widely used to describe the fundamental states and to
characterize the vicinities effect on the energetic levels of the paramagnetic centers The
method consists in the study of the electronic split levels of the atoms in the presence of an
external magnetic field [6] The Mn2+ EPR spectra are characterized by resonance absorptions
at gef 43 gef 33 and gef 20 The resonance line centered at gef 43 is
corresponding to the isolated Mn2+ ions The line from gef 20 is attributed to Mn2+ ions
involved in magnetic interactions
The Fe3+ EPR spectra are characterized by resonance absorptions at g 97 g 6 g 43
and g 20 The resonance line from g 97 is related to Fe3+ ions disposed in rhombic
environment The resonance line at g 6 was assigned to an axial distortion of the
paramagnetic ions neighborhood The resonance line at g 43 is corresponding to the isolated
Fe3+ ions situated in octahedral rhombic or tetragonal symmetric distorted neighborhoods The
line from gef 20 is attributed to Fe3+ ions involved in magnetic interactions
Along with the EPR spectroscopy the magnetic susceptibility measurements provide
useful information about the valence state and the interaction involving the transitional metal
ions in vitreous materials [7-10]
Different vitreous systems with manganese or iron ions were intensively studied by
magnetic susceptibility measurements to determine the magnetic behavior and the valence
states of these ions in these systems It was observed that the presence of the manganese or iron
ions in different valence states depends on the chemical composition of the vitreous matrix on
the valence of the vitreous network former and modifications and on the preparation of the
environment The magnetic properties of the oxide glasses with manganese or iron ions were
assigned to the antiferromagnetic couple between Mn2+-Mn2+ Mn2+-Mn3+ and Mn3+-Mn3+
[19-26] or Fe -Fe3+ Fe2+-Fe2+ and Fe3+-Fe2+ ions [11-18]
CHAPTER 3 EXPERIMENTAL TECHNIQUES
We have prepared glasses of the xMOmiddot(100-x)[As2O3middotTeO2] xMOmiddot(100-
x)[As2O3middotPbO] şi xMOmiddot(100-x)[3B2O3middotLi2O] glass structure where MO =gt MnO or Fe2O3
with 0 lt x lt 50 mol used components of reagent grade purity MnCO3 Fe2O3 As2O3
H3BO3 PbO Li2CO3 şi TeO2 in suitable proportions to obtain the desired composition The
mixtures were melted in sintered corundum crucibles introduced in an electric furnace directly
at 1250 C and kept for 5 minutes at this temperature They were quickly cooled at room
temperature by pouring onto stainless steel plates
The structure of the samples was analyzed by means of x-ray Diffraction using powders
with a Bruker D8 Advanced diffract meter
8
The FT - IR spectra have been recorded using a Bruker Equinox 55 with a spectral range
between 4000 cm -1 and 370 cm -1 A MIR GLOBAR generator cooled with air was used The
detection was carried out with a DLATGS detector with a KBr window The spectral
resolution was about 05 cm1 The samples were prepared using KBr pellet technique
The Raman spectra were recorded on bulk samples at room temperature using an
integrated FRA 106S Raman module attached to Bruker Equinox 55 with a spectral range
from 3600 cm -1 to 70 cm -1 An NdYAG laser with an output power of 500 mW and a 1064
nm radiation was used The detection was carried out with an ultra sensitive D418-T detector
cooled with liquid nitrogen The spectral resolution was about 1 cm1
The EPR spectra were obtained at room temperature with an Adani Portable EPR
Spectrometer PS8400 in X-frequency band (94 GHz) For these measurements equal
quantities of powders from the investigated samples closed in glass tubes were used
Magnetic susceptibility measurements were performed on a Faraday type balance in the 80
- 300 K temperature range The sensitivity of the equipment was 10-7 emug
CHAPTER 4 RESULTS AND DISCUSSION REGARDING THE STUDY OF
xMOmiddot(100-x)[As2O3middotTeO2] xMOmiddot(100- x)[As2O3middotPbO] şi xMOmiddot(100-x)[3B2O3middotLi2O]
GLASS STRUCTURE WHERE MO =gt MnO or Fe2O3
In this chapter the results obtained by following the study of the structure and
properties of oxide glasses with transitional metals ions by FT- IR and Raman spectroscopies
electron paramagnetic resonance and magnetic susceptibility measurements are presented The
structural changes and magnetic properties with the manganese and iron content were
followed
41 Comparative study by FT-IR and Raman spectroscopies of xMOmiddot(100-
x)[As2O3middotTeO2] xMOmiddot(100- x)[As2O3middotPbO] şi xMOmiddot(100-x)[3B2O3middotLi2O] glasses
where MO =gt MnO or Fe2O3
411 Comparative study by FT-IR spectroscopy of As2O3middotTeO2 and
As2O3middotPbO vitreous matrices
In order to obtain new information regarding the role of the modifier in the
formation of vitreous matrices comparative studies by FT-IR spectroscopy were made
The FT-IR spectroscopy is represented in figure 41(ab) The wave length and the
structural assignments of FT ndash IR spectra of As2O3middotPbO and As2O3middotTeO2 vitreous matrices
are represented in table 41
9
400 600 800 1000 1200
Wavenumber [cm-1]
Abs
orpt
ion
[au
]
407
594
821
794
1119
As2O
3PbO
a)
a
400 600 800 1000 1200
As2O3TeO2
Abs
orpt
ion
[ua
]
Wavenumber [cm-1]
85473
3
644
1119
b)
b
Fig41 FT ndash IR spectra of vitreous matrices a As2O3middotPbO şi b As2O3middotTeO2
The FT ndash IR spectrum of As2O3middotPbO glass matrix presents five absorption bands at ~
1119 cm-1 ~ 821 cm-1 ~ 794 cm-1 ~ 594 cm-1 and ~ 407 cm-1(Fig41a)
The band from ~ 1119 cm-1 is due to totally symmetric stretching vibrations of AsO3
units [5 ndash 7] The bands from ~ 821 cm-1 and ~ 794 cm-1 are due to doubly degenerate
stretching vibrations of AsO3 structural units [5 ndash 7] The large band centered at ~ 594 cm-1 can
be due to totally symmetric bending vibrations of AsO3 structural units [5-7] The band from ~
407 cm-1 can be due to vibrations of Pb ndash O bonds from PbO4 structural groups [7]
Following As2O3TeO2 glass matrix spectrum presented in Fig 41b four bands can be
observed located at ~ 644 cm-1 ~ 733 cm-1 ~ 854 cm-1 and ~ 1119 cm-1 The band from ~ 644
cm-1 can be assigned to totally symmetric bending vibrations of AsO3 units [5-7] and also
stretching vibration mode of TeO4 tbp with bridging oxygen[11] The band from ~ 733 cm-1
can be assigned to the symmetric stretching vibration mode of Te-O bonds in TeO3 units
[15] The band from ~ 854 cm-1 can be assigned to doubly degenerate stretching vibrations of
AsO3 units [5-7] and also to the stretching vibration mode of TeO3 tp with NBO [11] The band
10
from ~ 1119 cm-1 can be assigned to totally symmetric stretching vibrations of AsO3 units [5-
7] These bands presented in As2O3TeO2 glass matrix spectrum confirm the presence of
AsO3 TeO4 tbp and TeO3 tp units in the structure of the glass matrix but due to the broadness
of the bands it can not be told for sure which one of these units is predominant
Table 41Wavenumber and the structural assignments of FT ndash IR spectra of
As2O3middotPbO and As2O3middotTeO2 vitreous matrices
~ [cm 1 ]
As2O3middotPbO As2O3middotTeO2
Attribution
~1119 cm-1
~ 1119 cm-1
Totally symmetric stretching vibrations of AsO3 units
~ 821cm-1
Doubly degenerate stretching vibrations of AsO3 structural units
~ 854 cm-1
Doubly degenerate stretching vibrations of AsO3 units Stretching vibration mode of TeO3 tp with NBO
~ 794 cm-1
Doubly degenerate stretching vibrations of AsO3 structural units
~ 733 cm-1
Symmetric stretching vibration mode of Te-O bonds in TeO3 units
~ 594 cm-1
~ 644 cm-1
Totally symmetric bending vibrations of AsO3 units
~ 407 cm-1 Vibrations of Pb ndash O bonds from PbO4 structural groups
412 Comparative study by FT-IR spectroscopy of
xMOmiddot(100- x)[As2O3middotPbO] vitreous systems where MO =gt MnO or Fe2O3
The infrared absorption spectra obtained for xMOmiddot(1-x)[As2O3middotPbO] glass system
where MO =gt MnO or Fe2O3 with 0 le x le 50 mol are presented in figure 42-3 and their
structural assignments are summarized in table 41
The spectra were discussed on the basis of the method given by Tarte [3] and Condrate
[4] by comparing the experimental data of glasses with those of related crystalline compounds
The characteristic absorption bands for crystalline As2O3 [5-8] PbO [79] and characteristic
bands for Fe2O3 [1819 ] were used as a reference point in the results discussion
The FT ndash IR spectra of the investigated glasses suggest a structure formed of AsO3 and
PbO4 structural units where As2O3 plays the role of the glass former and PbO plays the role of
the glass modifier The evolution of the spectra with the addition and the increasing of the
MnO content suggest that the manganese ions break up a part of As ndash O ndash As Pb ndash O ndash Pb and
probably of As ndash O ndash Pb bonds The addition of MnO in the As2O3middotPbO glass matrix is leading
to a disordering of the glasses structure with the increasing of the MnO content
The evolution of the absorption bands for FT ndash IR spectrum of xFe2O3middot(1-x)
[As2O3middotPbO] glasses are determined by the addition of Fe2O3 content It can be observed to
11
shift the bands assigned As ndash O ndash As vibrations from AsO3 units due to changing to length As
ndash O ndash As bonds and interne angles of AsO3 units disappears PbO4 units and appears FeO6
units The addition of Fe2O3 in the As2O3middotPbO glass matrix determined a disordering of the
glasses structure with the increasing of the Fe2O3 content
400 600 800 1000 1200
610
813
449
1093
423
449
616
760 848
821
794
594
20A
bsor
ptio
n [a
u]
Wavenumber [cm-1]
05
0
35
10
35
50
1
MnO
407
1119
693
Fig 42 FT ndash IR spectra of xMnOmiddot(100- x)[As2O3middotPbO] glasses
400 600 800 1000 1200
616
462
811
407
594
Abs
orpt
ion
[au
]
Wavenumber [cm -1]
05
20
0
35
10
35
50
1
Fe2O3
821
79469
3
1119
1084
610
Fig43 FT ndash IR spectra of xFe2O3middot(100- x)[As2O3middotPbO] glasses
12
413 Comparative study by FT-IR spectroscopy of
xMOmiddot(100-x)[As2O3middotTeO2] vitreous systems where MO =gt MnO or Fe2O
The infrared absorption spectra obtained for xMOmiddot(1-x)[As2O3middotTeO2] glass system
where MO =gt MnO or Fe2O3 with 0 le x le 50 mol are presented in figure 44 -5 and their
structural assignments are summarized in table 41[1617] The characteristic absorption bands
for crystalline As2O3 [5-8] PbO [79] TeO2 [810-15] MnO2 and Mn3O4 [9] and characteristic
bands for Fe2O3 [1819 ] were used as a reference point in the results discussion
Fig 44 FT ndash IR spectra of xMnOmiddot(100- x)[As2O3middotTeO2] glasses
Fig45 FT ndash IR spectra of xFe2O3middot(100- x)[As2O3middotTeO2] glasses
400 600 800 1000 1200
565
422 690 830
05
Abs
optio
n [a
u]
Wavenumber [cm-1]
0
3
5
35 50
1
MnO
854 733 644
1119
10 20
400 600 800 1000 1200
462650
812
713
561
05
20
Wavenumber [cm-1]
Abs
orpt
ion
[au
]]
0
3 5
10
35 50
1
Fe2O3
854 733
644
1119
13
This behavior of the studied glasses with the addition and increasing of MnO content
suggests that the structure observed in the glass matrix is conserving up to 5 mol MnO
where the structure takes another form From a structure dominated by AsO3 TeO4 tbp and
TeO3 tp units the structure became dominated by TeO4 tbp and MnO2 units and in a small
measure of AsO3 and TeO3 tp units For higher concentrations it can not be specified exactly
which of the last two structural units have the biggest proportion in these glasses From FT-IR
absorption spectra of the investigated glass system it can be observed that the addition and
increasing of manganese ions concluded the contraction of As-O-As bonds from totally
symmetric stretching vibrations of AsO3 units for x ge10 mol there can be an increase in
number of As-O-As bonds from AsO3 units orand a length these linkage to doubly degenerate
stretching vibrations of AsO3 units and a stretching vibration mode of TeO3 tp with NBO It
can be remarked from the FT-IR absorption spectra the gradual transformation of symmetric
stretching vibration mode of Te-O bonds from TeO3 units in TeO4 (tbp) units and the presence
of MnO2 units Once with the addition of iron ions the xFe2O3middot(100- x)[As2O3middotTeO2]
glasses behave like xMnOmiddot(100-x)[As2O3middotTeO2] glasses but in this system the
appearance of FeO6 units can be seen
414 Comparative study by FT-IR spectroscopy of
xMnOmiddot(100- x)[As2O3middotBO] vitreous systems were BO =gt TeO2 or PbO
The infrared absorption spectra obtained for xMnOmiddot(100- x)[As2O3middotBO] vitreous
systems where BO =gt TeO2 or PbO with 0 le x le 50 mol MnO are presented in figure
42 and 44 Following the infrared absorption spectra it can be observed that for
xMnOmiddot(100- x)[As2O3middot PbO] glass system the most disordered structure to exist for 0
le x le 5 mol MnO and to xMnOmiddot(100-x)[As2O3middot TeO2] glass system for 1 le x le 5 mol
MnO For x ge 5 mol MnO manganese ions break up a part of As ndash O ndash As Pb ndash O ndash Pb
and probably of As ndash O ndash Pb bonds to favor the increase in number of PbO4 units and
appearance of MnO2 units For x ge 10 mol MnO observed comparatively in both system
glasses the addition of manganese ions suggests for the first system a modification in linkage
characteristic units and for the second system an improvement for structural units of As2O3middot
TeO2 vitreous matrice also linkage characteristic units
415 Comparative study by FT-IR spectroscopy of
xFe2O3middot(100-x)[As2O3middotBO] vitreous systems where BO =gt TeO2 or PbO
The infrared absorption spectra obtained for xFe2O3middot(100- x)[As2O3middotBO] vitreous
systems where BO =gt TeO2 or PbO with 0 le x le 50 mol Fe2O3 are presented in figure
43 and 45
14
The evolution of the spectra with the addition and the increasing of the Fe2O3 content
suggest that the iron ions break up a part of As ndash O ndash As Pb ndash O ndash Pb and probably of As ndash O
ndash Pb bonds It can be observed a shift in the bands assigned As ndash O ndash As vibrations from AsO3
units due to changing to length As ndash O ndash As bonds and interne angles of AsO3 units the PbO4
units disappear and FeO6 units appear For x ge 5 mol Fe2O3 observed comparatively in
both system glasses the addition of iron ions suggests for the first system a modification in
linkage characteristic units of As2O3middotPbO and for the second system an improvement for
structural units of As2O3middot TeO2 vitreous matrice also linkage characteristic units appearance
of FeO6 units in both system
416 Comparative study by Raman spectroscopy of
As2O3middotTeO2 and As2O3middotPbO vitreous matrices
In order to obtain new information regarding the role of the modifier in the
formation of vitreous matrices there were made comparative studies by Raman
spectroscopy The Raman spectroscopy are presented in figure 46(ab) The wave
length and the structural assignments of Raman spectra of As2O3middotPbO şi As2O3middotTeO2 vitreous
matrices are presented in table 42
Table 42Wavenumber and the structural assignements of Raman spectra
of As2O3middotPbO and As2O3middotTeO2 vitreous matrices
~ [cm 1 ]
As2O3middotPbO As2O3middotTeO2
Attribution
~826 cm-1
~ 816 cm-1
Stretching vibrations of As-O-As
~ 752 cm-1
Vibrations of the continuous TeO4 (tbp) network
~ 627 cm-1
Vibrations As ndash O ndash As bonds from As2O units
~ 580 cm-1
Stretching vibrations of As-O-As
~ 525 cm-1
Vibrations O-As-O bonds from AsO3 units
~ 438cm-1
Symmetric bending vibrations of Te ndash O ndash Te vertex linkages between different TeO4 (tbp) TeO3+1 polyhedra Stretching vibrations of As-O-As of AsO3 units
~ 345 cm-1
Bending vibrations of As ndash O ndash As from As2O units
15
200 400 600 800 1000
As2O3PbO
Ram
an In
tens
ity [a
u]
LWavenumber [cm-1]
345
826
525
627a)
a
200 400 600 800 1000
816
752
580 R
aman
Inte
nsity
[au
]
Wavenumber [cm-1]
As2O3TeO2
438
b)
b
Fig46 Raman spectra of vitreous matrices a As2O3middotPbO şi b As2O3middotTeO2
The Raman spectrum of As2O3middotPbO glass matrix presents four bands at 826 cm-1
627 cm-1 525 cm-1 and 345 cm-1 The band from 826 cm-1 can be assigned to As ndash O ndash
As stretching vibrations [20] The band centered at 627 cm-1 can be assigned to vibrations As
ndash O ndash As bonds from As2O units the band from 525 cm-1 are assigned vibrations O-As-O
bonds from AsO3 units [21] The band of 345 cm-1 are attributed to As ndash O ndash As bending
vibrations from As2O units[2021]
The Raman spectrum of As2O3middot TeO2 glass matrix presents four bands at 816 cm-1
752 cm-1 580 cm-1 and 438 cm-1 The band from 816 cm-1 can be assigned to As ndash O ndash
As stretching vibrations [20] The band centered at 752 cm-1 can be assigned to vibrations of
the continuous TeO4 (tbp) network [22] The band of 580 cm-1 are attributed to As ndash O ndash As
stretching vibrations [12] The band centered at 438 cm-1 can be assigned symmetric bending
vibrations of Te ndash O ndash Te vertex linkages between different TeO4 (tbp) TeO3+1 polyhedra and
As ndash O ndash As stretching vibrations of AsO3 units
16
417 Study by Raman spectroscopy of xMOmiddot(100- x)[As2O3middotPbO]
vitreous systems where MO =gt MnO or Fe2O3
The Raman spectra obtained for xMOmiddot(100- x)[As2O3middotPbO] vitreous systems where
MO =gt MnO or Fe2O3 with 0 le x le 50 mol are presented in figure 47-8 and their
structural assignments are summarized in table 42
200 400 600 800 1000
368
833
345
1
3
Lungimea de unda [cm-1]
Inte
nsita
te R
aman
[ua
]
20
05
0
5
10
35
50
MnO
826
525
627
Fig 47 Raman spectra of xMnOmiddot(100- x)[As2O3middotPbO] glasses
The addition of MnO in the glass matrix determined an order degree of the vitreous
matrix The intensity of the bands attributed vibrations As ndash O ndash As bonds from As2O units
and bending vibrations of As ndash O ndash As from As2O units shift to a higher wave length that
suggests an increase in the As2O units comparative to AsO3 units
To the band from 826 cm-1 the addition of manganese ions in the glass matrix
determine for x = 05 mol an decreasing in intensity whereupon increasing for higher
concentrations The intensity of bands centered at 627 cm-1 and 525 cm-1 for x = 05
mol MnO decrease and disappear for x = 1 mol MnO The band of 345 cm-1 slowly
increases with the addition of manganese ions
To the band from 826 cm-1 the addition of iron ions in the glass matrix determines
for x = 05 mol an increase in intensity a gradual decrease and disappearance for x = 35
mol Fe2O3 of the bands observed for the glass matrix For higher concentrations of
manganese these bands gradually decrease The intensity of bands centered at 627 cm-1 and
525 cm-1 for x = 05 mol Fe2O3 increase and shift to 612 cm-1 and 501 cm-1 whereas
17
they gradually decrease and disappear for x = 10 mol Fe2O3 The band of 345 cm-1
decreases with the addition of iron ions and disappears for x = 20 mol Fe2O3
200 400 600 800 1000
3
612
501
Wavenumber [cm-1]
Ram
an In
tens
ity [a
u]
05
20
0
5
10
3550
1
Fe2O3
345
826
525
627
Fig 48 Raman spectra of xFe2O3middot(100- x)[As2O3middotPbO] glasses
With the increase of iron ions content in the As2O3middotPbO glass matrix the number of
these structural units decreases due to the increasing of the disorder in the studied glasses
418 Study by Raman spectroscopy of xMOmiddot(100-x)[As2O3middotTeO2]
vitreous systems were MO =gt MnO or Fe2O3
The Raman spectra obtained for xMOmiddot(100- x)[As2O3middot TeO2] vitreous systems
where MO =gt MnO or Fe2O3 with 0 le x le 50 mol are presented in figure 49-10 and their
structural assignments are summarized in table 42
The Raman spectrum of the glass matrix suggests a structure formed from TeO4 (tbp)
and TeO3 (tp) units where the presence of As ndash O ndash As bonds can not be excluded The
addition of manganese ions is leading to a modification of the structure proposed by the
spectrum of the glass matrix Then with the increasing of manganese content the intensity of
these bands is increasing showing that the manganese content favorises the formation of TeO4
(tbp) and TeO3 (tp) units
18
200 400 600 800 1000
783
850
768
416
816
752
Wavenumber [cm -1]
Ram
an In
tens
ity [a
u]
13
20
05
0
5
10
35
50
MnO
438
580
660
Fig 49 Raman spectra of xMnOmiddot(100- x)[As2O3middot TeO2] glasses
200 400 600 800 1000
226
294
408
673 751
5
W avenumber [cm -1]
Ram
an In
tens
ity [a
u]
05
20
0
3
10
35
50
1
Fe2O
3
816
752
438
580
Fig 410 Raman spectra of xFe2O3middot(100- x)[As2O3 TeO2] glasses
The Raman spectra of xFe2O3middot(100- x)[As2O3 TeO2] glasses present a significant
advance to the TeO4 (tbp) TeO3+1 polyhedra and AsO3 units represented in Raman spectrum
by the ~ 438 cm-1 band comparative with the modifications determined by the addition of
manganese ions in vitreous matrix For high concentrations of iron ions in xFe2O3middot(100-
x)[As2O3 TeO2] system of glasses the number of As-O-As linkages appear in Raman
spectrum due to stretching vibrations of As-O-As and vibrations of the continuous TeO4 (tbp)
network show a significant decrease
19
419 Comparative study by Raman spectroscopy of xMnOmiddot(100- x)[As2O3middotBO]
vitreous systems were BO =gt TeO2 or PbO
The addition of MnO to xMnOmiddot(100- x)[As2O3middotPbO] glass system do not break As
ndash O ndash As bonds into characteristic units and contribute to their prominence The addition of
manganese ions to xMnOmiddot(100- x)[As2O3middot TeO2] glass system for x=50mol MnO
determined the splitting up of a part of As ndash O ndash As Te-O-Te and the appearance of the
TeO4 (tbp) units against the loss of continuous TeO4 (tbp) network was observed
4110 Comparative study by Raman spectroscopy of xFe2O3middot(100- x)[As2O3middotBO]
vitreous systems where BO =gt TeO2 or PbO
With the increasing of iron ions content in the As2O3middotPbO glass matrix the number of
these structural units decreased due to the increase of the disorder in the studied glasses (x gt 20
mol ) and x = 50 mol Fe2O3 for xFe2O3middot(100- x)[As2O3middotTeO2] when iron ions
brought the structural units existing in glass matrices and favoured the appearace of
new bands due to bending vibrations of As ndash O ndash As
42 Comparative study by FT-IR and Raman spectroscopies of
xMOmiddot(100-x)[3B2O3middotLi2O] glasses where MO =gt MnO or Fe2O3
421 Study by FT-IR spectroscopy of xMOmiddot(100-x)[3B2O3middotLi2O] glasses
where MO =gt MnO or Fe2O3
The infrared absorption spectra obtained for xMOmiddot(1-x)[3B2O3middotLi2O] glass system
where MO =gt MnO or Fe2O3 with 0 le x le 50 mol are presented in figure 411-13 and their
structural assignments are summarized in table 43
500 1000 1500
3B2O3Li2O
Wavenumber [cm-1]
Abs
orpt
ion
[au
]
490
1400
1230
1061
698
614
460 78
6
Fig 411 FT ndash IR spectra of vitreous matrix 3B2O3middotLi2O
20
Following the infrared absorption spectra obtained for 3B2O3middotLi2O vitreous matrix
observed on eight bands ~ 1400 cm-1 ~ 1230 cm-1 ~ 1061 cm-1 ~ 786 cm-1 ~ 698 cm-
1 ~ 614 cm-1 ~ 490 cm-1 şi ~ 460 cm-1 The band at ~ 1400 cm-1 is assigned to
asymmetric stretching vibrations from BOslash3 şi BOslash2O- groups (Oslash represent oxygen atom
bridging two boron atoms) The band at ~ 1230 cm-1 is attributed to asymmetric stretching
vibrations of B ndash O bonds from triangular ortoborate BO 33 groups [23-26]
400 600 800 1000 1200 1400 1600
0
3
5
10
20
35
50
1
Wavenumber [cm-1]
Abs
orpt
ion
[ua
]
05
MnO
490
1400
1230
1061
698
614
460 78
6
Fig 412 FT ndash IR spectra of xMnOmiddot(100-x)[3B2O3middotLi2O] glasses
400 600 800 1000 1200 1400 1600
469
Wavenumber [cm-1]
Abs
orpt
ion
[ua
]
0
3
5
10
20
35
50
1
05
Fe2O3
490
1400
1230
1061
698
614
460 78
6
Fig 413 FT ndash IR spectra of x Fe2O3middot(100-x)[3B2O3middotLi2O] glasses
21
Table 43Wavenumber and the structural assignments of FT ndash IR and Raman
spectra of 3B2O3middotLi2O vitreous matrix
~ [cm 1 ] Attribution
FT ndash IR Raman FT ndash IR Raman
~ 1400 cm-1
~ 1400 cm-1
Asymmetric stretching
vibrations from BOslash3 şi BOslash2O-
groups
BOslash2O- triangles linked to
other borate triangular units
~ 1230 cm-1
Asymmetric stretching
vibrations of B ndash O bonds from
triangular ortoborate
BO 33 groups
~ 1061 cm-1
~ 1074 cm-1
Stretching vibrations of B ndash Oslash
bonds in -4BOslash tetrahedra from
tri- tetra- and penta-borate
groups
Diborate groups
~ 902 cm-1
Vibrations of orthoborate
groups
~ 786 cm-1
~ 791 cm-1
Bending vibrations of O3B ndash O
ndash BO4 bonds
Vibrations of rings with six
member to one or two BO4
tetrahedral from tri- tetra ndash
and penta ndash borate units
~ 698 cm-1
Bending vibrations of B-O-B
bonds from pentaborate groups
~ 614cm-1 Bending vibrations of O ndash B ndash O
bonds
~ 490cm-1 ~ 471cm-1 Bending vibrations of B-O-B
bonds
Isolated diborate groups
~ 460cm-1 Bending vibrations of O ndash B ndash O
bonds
22
The band at ~ 1061 cm-1 is assigned to stretching vibrations of B ndash Oslash bonds in -4BOslash
tetrahedra from tri- tetra- and penta-borate groups and the band at ~ 786 cm-1 is assigned
to bending vibrations of O3B ndash O ndash BO4 bonds The band at ~ 698 cm-1 is attributed to
Bending vibrations of B-O-B bonds from pentaborate groups The bands at ~ 614 cm-1 and
~ 460 cm-1 are assigned to bending vibrations of O ndash B ndash O bonds and the band at ~ 490 cm-
1 is assigned to bending vibrations of B-O-B bonds
From FT-IR spectra it can be concluded that the addition of manganese or iron ions in
vitreous matrices leads to the increase of the disorder degree
Also the structural changes that appeared in 3B2O3middotLi2O vitreous matrix with an
addition MnO or Fe2O3 content can be studied Ar=A4A3 ratio(A4 - relative number of -4BOslash tetrahedral borate units A3 - relative number of triangular (BOslash3 and BOslash2O-) units
0 10 20 30 40 50
010
015
020
Ar
x [mol]
MnO Fe2O3
Fig 414 The evolution of Ar ratio with the MnO or Fe2O3 content of
xMnOmiddot(100-x)[3B2O3middotLi2O] şi xFe2O3middot(100-x)[3B2O3middotLi2O] The evolution of the value of this ratio also allows a visualization of the effects
determined by the presence of the manganese or iron ions in the matrix The value Arltlt 1
indicated that BO3 is dominant related to BO4
422 Study by Raman spectroscopy of xMOmiddot(100-x)[3B2O3middotLi2O] glasses
where MO =gt MnO or Fe2O3
The Raman spectra obtained for xMOmiddot(1-x)[3B2O3middotLi2O] glass system were MO =gt
MnO or Fe2O3 with 0 le x le 50 mol are presented in figure 414-16 and their structural
assignments are summarized in table 43
Studying the Raman spectra of xMOmiddot(1-x)[3B2O3middotLi2O] glass system where MO =gt
MnO or Fe2O3 it has been observed that the absorption bands presented in vitreous matrix
gradually decreased with an increase in the manganese or iron content in both glasses system
which suggested an increase of the disorder in these vitreous systems
23
1000 2000 3000
B2O3Li2O
Wavenumber [cm-1]
Ram
an In
tens
ity [a
u]
1430
107490
279
1471
Fig 415 Raman spectra of vitreous matrix 3B2O3middotLi2O
500 1000 1500 2000 2500 3000
1430
107490
2791
0
Wavenumber [cm-1]
Ram
an In
tens
ity [a
u]
1
3
20
05
5
10
35
50
MnO
471
Fig 416 Raman spectra of xMnOmiddot(100-x)[3B2O3middotLi2O] glasses
400 600 800 1000 1200 1400 1600
Wavenumber [cm-1]
Ram
an In
tens
ity [a
u]
0
1
3
20
05
5
10
35
50
Fe2O3
1430
1074
90279
1
471
Fig 417 Raman spectra of x Fe2O3middot(100-x)[3B2O3middotLi2O] glasses
24
43 Comparative study by electron paramagnetic resonance (EPR) and magnetic
susceptibility measurements of xMOmiddot(100-x)[As2O3middotTeO2] xMOmiddot(100-x)
[As2O3middotPbO] and xMOmiddot(100-x)[3B2O3middotLi2O] glasses where MO =gt MnO or Fe2O3
431 Comparative study by electron paramagnetic resonance (EPR) of
xMnOmiddot(100-x)[As2O3middotBO] where BO =gt TeO2 or PbO
and xMnOmiddot(100-x) [3B2O3middotLi2O] glasses
In order to obtain more information regarding the behavior of manganese ions in
different vitreous matrices [3031] xMnOmiddot(100-x)[As2O3middotBO] where BO =gt TeO2 or PbO
and xMnOmiddot(100-x) [3B2O3middotLi2O] glasses were investigated by EPR spectroscopy on a large
compositional range with 0 le x le 50 mol The EPR spectra of Mn2+ for xMnOmiddot(100-
x)[As2O3middotPbO] (S1) xMnOmiddot(100-x)[As2O3middotTeO2] (S3) and xMnOmiddot(100-x)[3B2O3middotLi2O]
(S5) are presented in figure 418-20 These spectra present two absorption lines centered at gef
43 and gef 20 in all systems
The absorption line centered at gef 43 and is due to isolated Mn2+ ions [32] The
absorption line centered at gef 20 may be attributed to Mn2+ species interacting by magnetic
coupling[33] dipolar and or super exchange the last ones forming magnetic clusters [32]
The evolution of the spectra is easier to follow considering the dependence of
concentration on the EPR parameters the line - intensity (obtained as an integral of the area
under the corresponding EPR signal) J and the line - width ΔB The evolution of J and AB
reflects the structural transformations which appear in the glass matrices due to the increase of
manganese ions content
The intensity and the line - width of the resonance line from gef 43 for all
investigated systems is represented in figure 421(ab)
The intensity of the resonance line from gef 43 for all investigated glass systems
decreases due to the decrease of the isolated manganese ions numbers The line - width from
gef 43 for (S1) and (S3) systems decreases due to decrease of Mn2+ number and to the
structural disorder in glasses with the increase of MnO content For (S5) glass system the line
- width of the resonance line there is an increase in all compositional domains
The intensity of the resonance line from gef 20 can be observed as increasing up to
x=14 mol for (S1) system up to x=8mol for (S3) system and 20 mol for (S5)
system The line - width of the resonance line from gef 20 for (S1) and (S3) systems
increases up to 3 mol and 5mol for (S5) due to Mn2+ species interacting by magnetic
coupling dipole- dipole as the main broadening mechanism Over this concentration line ndash the
width of the resonance line from gef 20 is straight and it can be assumed that the
manganese ions begin to manifest super exchange magnetic interactions
25
1000 2000 3000 4000 5000
Firs
t der
ivat
ive
of a
bsor
ptio
n [u
a]
05
1
3
5
10
20
35
50
x [mol Mn2O3]amplif
B [G]
10
200
40
80
400
5
1
1
Fig 418 The EPR spectra of Mn2+ for xMnOmiddot(100-x)[As2O3middotPbO] (S1)
glass system
1000 2000 3000 4000 5000
Firs
t der
ivat
ive
of a
bsor
ptio
n [u
a]
x [mol MnO]
051
3
5
10
20
35
50
9
500
400
50
100
4
1
amplif
B [G]
1
Fig 419 The EPR spectra of Mn2+ for xMnOmiddot(100-x)[As2O3middotTeO2] (S3)
glass system
26
1000 2000 3000 4000 5000
501
B [G]
Firs
t der
ivat
ive
of a
bsor
ptio
n [u
a]
1
4
9
10
30
60
100
amplif
05
1
3
5
10
20
35
x [mol MnO]
Fe3+
Fig 420 The EPR spectra of Mn2+ for xMnOmiddot(100-x)[3B2O3middotLi2O] (S5)
glass system
0 2 4 6 8 10 12 14 16 18 20 22
x [mol]
J [ u
a]
S1 S3 S5
-2 0 2 4 6 8 10 12 14 16 18 20 22
50
100
150
200
250
300
S1 S3 S5
x [mol]
B
[G]
a b
Fig 421 The dependence on MnO content of the intensity (a) and width(b) of resonance
line at gef 43 for xMnOmiddot(100-x)[As2O3middotPbO] (S1) xMnOmiddot(100-x)[As2O3middotTeO2] (S3) şi
xMnOmiddot(100-x)[3B2O3middotLi2O] (S5) system glasses
27
0 10 20 30 40 50
x [mol]
J [ u
a]
S1 S3 S5
0 10 20 30 40 50
400
500
600
700
800
900
S1 S3 S5
x [mol]
B[G
]
a b
Fig 422 The dependence on MnO content of the intensity (a) and width b) of resonance
line at gef 20 for xMnOmiddot(100-x)[As2O3middotPbO] (S1) xMnOmiddot(100-x)[As2O3middotTeO2] (S3) and
xMnOmiddot(100-x)[3B2O3middotLi2O] (S5) system glasses
Following figure 418-20 it can be observed that (S1) and (S3) have had a similar
evolution but (S5) system presented for 05 le x le 5 mol (fig420) has a hyperfine
sextet[33] at gef 20due to Mn2+ isolated ions
432 Comparative study by magnetic susceptibility measurements of
xMnOmiddot(100-x)[As2O3middotBO] where BO =gt TeO2 or PbO and
xMnOmiddot(100-x)[3B2O3middotLi2O] glasses
The magnetic susceptibility data are in good agreement with the EPR result The
magnetic behavior of the glasses from xMnOmiddot(100-x)[As2O3middotBO] where BO =gt TeO2 (S3)
or PbO (S1) and xMnOmiddot(100-x)[3B2O3middotLi2O] (S5) glasses for 3 le x le 50 mol MnO are
presented in figure 423 - 25
For (S1) and (S3) system glasses up to x 3 mol and x 5 mol (S5) glass
system the temperature dependence of the reciprocal magnetic susceptibility obeys a Curie
law In this concentration range the manganese ions are predominantly isolated orand
participate in dipole-dipole interractions At higher concentrations the reciprocal magnetic
susceptibility obeys a Curie-Weiss law with negative paramagnetic Curie temperature (p)
characteristic to antiferromagnetic coupled ions by means of super exchange interractions(fig
426) This behavior of manganese ions is confirmed by the shape of the EPR spectra
28
100 150 200 250
2
4
6
8
10
12
14
16
18
20
22
T [K]
[
emu
mol
]-1
3 mol 5 mol 10 mol 20 mol 35 mol 50 mol
Fig423 The temperature dependence of -1 for xMnOmiddot(100-x)[As2O3middotPbO]
(S1) 3 le x le 50 mol
50 100 150 200 2500
2
4
6
8
10
12
14
16
18
20
22
3 mol 5 mol 10 mol 20 mol 35 mol 50 mol
T [K]
[
emu
mol
]-1
Fig424 The temperature dependence of -1 for xMnOmiddot(100-x)[ As2O3middotTeO2]
(S1) 3 le x le 50 mol
100 150 200 250
2
4
6
8
10
12
14
16
18
20
22
[em
u m
ol]-1
T [K]
3 mol 5 mol 10 mol 20 mol 35 mol 50 mol
Fig425 The temperature dependence of -1 for xMnOmiddot(100-x)[3B2O3middotLi2O]
(S5) 3 le x le 50 mol
29
0 10 20 30 40 50
0
20
40
60
80
100
x [mol]
-p [K
]
(S1) (S3) (S5)
Fig426Concentration dependence of (p) for sistemele xMnOmiddot(100-x)[As2O3middotPbO]
(S1) xMnOmiddot(100-x)[As2O3middotTeO2] (S3) şi xMnOmiddot(100-x)[3B2O3middotLi2O] (S5)
Using the representation 1 =f(T) the molar Curie constants CM the effective
magnetic moments and molar fraction of Mn2+(x1) şi Mn3+(x2) ions were calculated and
represented in tables 44 -6
Tabel 44 Molar Curie constants effective magnetic moments and molar fraction of Mn2+(x1) şi Mn3+(x2) ions in xMnOmiddot(100-x)[As2O3middotPbO] (S1) glasses
x
[mol MnO2] CMtimes102
[emu mol] ef
[microB] x1
[mol Mn2+O2] x2
[mol Mn3+O2] 3 1272 582 268 032 5 1979 562 343 157 10 3777 549 555 445 20 6688 517 492 1508 35 12239 502 377 3123 50 15427 496 268 4732
Tabel 45 Molar Curie constants effective magnetic moments and molar fraction of Mn2+(x1) şi Mn3+(x2) ions in xMnOmiddot(100-x)[As2O3middotTeO2] (S3)glasses
x
[mol MnO2] CMtimes102
[emu mol] ef
[microB] x1
[mol Mn2+O2] x2
[mol Mn3+O2] 3 1297 588 287 013 5 1938 556 312 188 10 3804 551 575 425 20 6766 52 549 1451 35 11148 504 441 3059 50 15528 498 358 4642
30
Tabel 46 Molar Curie constants effective magnetic moments and molar fraction of Mn2+(x1) şi Mn3+(x2) ions in xMnOmiddot(100-x)[3B2O3middotLi2O] (S5) glasses
x
[mol MnO2] CMtimes102
[emu mol] ef
[microB] x1
[mol Mn2+O2] x2
[mol Mn3+O2] 3 127 581 265 035 5 1919 554 303 197 10 3681 542 486 514 20 7215 519 53 147 35 1121 506 505 2995 50 15898 501 493 4507
433 Comparative study by electron paramagnetic resonance (EPR) of
xFe2O3middot(100-x)[As2O3middotBO] where BO =gt TeO2 or PbO and
x Fe2O3middot(100-x) [3B2O3middotLi2O] glasses
In order to obtain more information regarding the behavior of iron ions in
xFe2O3middot(100-x)[As2O3middotBO] where BO =gt TeO2 (S4) or PbO (S2) şi xFe2O3middot(100-
x)[3B2O3middotLi2O] glasses were investigated by EPR spectroscopy on a large compositional
range with 05 le x le 35 mol Fe2O3 The EPR spectra of Fe3+ in xFe2O3middot(100-
x)[As2O3middotPbO] (S2) xFe2O3middot(100-x)[As2O3middotTeO2] (S4) and xFe2O3middot(1-x)[3B2O3middotLi2O]
(S6) are presented in figure 427-29 These spectra present two absorption lines centered at
gef 43 and gef 20 up to x le 35mol Fe2O3 systems studied
The absorption line centered at gef 43 is due to isolated Fe3+ ions [34-36] The
absorption line centered at gef 20 may be attributed to Fe3+ species interacting by magnetic
coupling dipolar and or super exchange the last ones forming magnetic clusters [37-41]
The evolution of the spectra is easier to follow considering the dependence of
concentration on the EPR parameters the line - intensity (obtained as an integral of the area
under the corresponding EPR signal) J and the line - width ΔB The evolution of J and AB
reflects the structural transformations which appear in the glass matrices due to the increasing
of iron ions content
The intensity and the line - width of the resonance line from gef 43 for all
investigated systems is represented in figure 430 (a b) The intensity of the resonance line
from gef 43 increases for (S2) and (S4) up to 3 mol and up to 5 mol for (S6) then
decreases for all systems investigated A line broadening up to 3 mol from gef 43 for
these systems can be observed due to increasing of Fe3+ isolated number of ions
31
1000 2000 3000 4000 5000
40
Firs
t der
ivat
ive
of a
bsor
ptio
n [u
a]
B [G]
x [mol Fe2O3]
05
1
3
5
1020
35 2
40
20
10
10
10
amplif
Fig427 The EPR spectra of Fe3+ for xFe2O3middot(100-x)[As2O3middotPbO] (S2)
glass system
1000 2000 3000 4000 5000
100
B [G]
Firs
t der
ivat
ive
of a
bsor
ptio
n [u
a]
10080
20
50
20
20
3
05
1
5
102035
x [mol Fe2O3] amplif
Fig428 The EPR spectra of Fe3+ for xFe2O3middot(100-x)[As2O3middotTeO2] (S4)
glass system
32
1000 2000 3000 4000 5000
Firs
t der
ivat
ive
of a
bsor
ptio
n [u
a]
B [G]
3
05
1
5
10
20
35
x [mol Fe2O3]
30
50
20
20
10
30
30
amplif
Fig429 The EPR spectra of Fe3+ for xFe2O3middot(100-x)[3B2O3middotLi2O] (S6)
glass system
The intensity and the line - width of the resonance line from gef 43 for all
investigated systems is represented in figure 430 (a b)The resonance line from gef 20 is
attributed to Fe3+ ions that interact by magnetic coupling dipolar orand super exchange
interractions can be observed in all compositional domains
The intensity of the resonance line from gef 20 can be observed as increasing up to
x=35 mol for (S2) and (S6) system and 10 mol for (S4) system with increased iron
ions content The line - width of the resonance line from gef 20 increased up to 10mol
for (S2) system and up to 3 mol for (S4) and 5mol for (S6) due to Fe3+species
interacting by magnetic coupling dipole-dipole Above this concentration line - width of the
resonance line from gef 20 can be attributed to dipolar and super exchange magnetic
interactions The ΔB = f(x) dependence reflects the competion between the broadening
mechanism (dipole ndash dipole interactions the interactions between ions in diferent
valence state and structural disorder) and the narrowing ones (super exchange
interactions)
33
0 5 10 15 20 25 30 35 40
x [mol]
J [ u
a]
S2 S4 S6
a)
0 5 10 15 20 25 30 35 4040
60
80
100
120
140
160
180
200
220 S2 S4 S6
B[G
]
x [mol]
a b
Fig 430 The dependence on Fe2O3 content of the intensity (a) and width (b) of
resonance line at gef 43 for xFe2O3middot(100-x)[As2O3middotPbO] (S2)
xFe2O3middot(100-x)[As2O3middotTeO2] (S4) and xFe2O3middot(100-x)[3B2O3middotLi2O] (S6) glasses
0 5 10 15 20 25 30 35 40
x [mol]
J [ u
a]
S2 S4 S6
a)
0 5 10 15 20 25 30 35 40
200
400
600
800
1000
1200
1400
1600
x [mol]
B
[G] S2
S4 S6
a b
Fig 431 The dependence on Fe2O3 content of the intensity (a) and width (b) of
resonance line at gef 20 for xFe2O3middot(100-x)[As2O3middotPbO] (S2)
xFe2O3middot(100-x)[As2O3middotTeO2] (S4) and xFe2O3middot(100-x)[3B2O3middotLi2O] (S6) glasses
34
434 Comparative study by magnetic susceptibility measurements of
xFe2O3middot(100-x)[As2O3middotBO] where BO =gt TeO2 or PbO and
xFe2O3middot(100-x) [3B2O3middotLi2O] glasses
The magnetic susceptibility data are in good agreement with the EPR result The magnetic
behavior of the glasses xFe2O3middot(100-x)[As2O3middotPbO] (S2) xFe2O3middot(100-x)[As2O3middotTeO2]
(S4) and xFe2O3middot(100-x)[3B2O3middotLi2O] (S6) for 3 x 50 mol Fe2O3 are presented in
figure 432 - 34
For (S2) glass systems up to x 10 mol x 3 mol (S5) glass systems and x 5
mol (S6) glass systems the temperature dependence of the reciprocal magnetic susceptibility
obeys a Curie law In this concentration range the iron ions are predominantly isolated orand
participate in dipole-dipole interactions At higher concentrations the reciprocal magnetic
susceptibility obeys a Curie-Weiss law with negative paramagnetic Curie temperature (p)
characteristic to antiferromagnetic coupled ions by means of super exchange interactions(fig
435) This behavior of iron ions is confirmed by the shape of the EPR spectra
80 100 120 140 160 180 200 220 240 260 2800
1
2
3
4
5
6
7
8
9
10
11
[
emu
mol
]-1
T [K]
3 mol 5 mol 10 mol 20 mol 35 mol 50 mol
Fig432 The temperature dependence of -1 for xFe2O3middot(100-x)[As2O3middotPbO] (S2)
3 x 50 mol
35
80 100 120 140 160 180 200 220 240 260 2800
1
2
3
4
5
6
7
8
9
10
T [K]
[
emu
mol
]-1
3 mol 5 mol 10 mol 20 mol 35 mol 50 mol
Fig433 The temperature dependence of -1 for xFe2O3middot(100-x)[As2O3middotTeO2] (S4)
3 x 50 mol
80 100 120 140 160 180 200 220 240 260 2800
1
2
3
4
5
6
7
8
9
10
11
3 mol 5 mol 10 mol 20 mol 35 mol 50 mol
T [K]
[
emu
mol
]-1
Fig434 The temperature dependence of -1 for xFe2O3middot(100-x)[3B2O3middotLi2O] (S6)
3 x 50 mol
36
0 10 20 30 40 50
0
10
20
30
40
50
x [mol]-
p [K]
(S2) (S4) (S6)
Fig435Concentration dependence of (p) for sistemele xFe2O3middot(100-x)[As2O3middotPbO] (S2) xFe2O3middot(100-x)[As2O3middotTeO2] (S4) and xFe2O3middot(100-x)[3B2O3middotLi2O] (S6)
for 3 x 50 mol Fe2O3
Using the representation 1 = f(T) the molar Curie constants CM the effective
magnetic moments and molar fraction of Fe3+(x1) şi Fe2+(x2) ions were calculated and
represented in tables 47-9
Table 47 Molar Curie constants effective magnetic moments and molar fraction of
Fe3+(x1) şi Fe2+(x2) ions in xFe2O3middot(100-x)[As2O3middotPbO] glasses (S2)
x [mol Fe2O3]
CMtimes102
[emu mol] ef
[microB] x1
[mol Fe23+O3]
x2 [mol Fe2
2+O3] 3 2526 58 261 039 5 393 56 332 168 10 7326 541 476 524 20 13459 519 53 147 35 23364 516 829 2671 50 32154 507 767 4233
Table 48 Molar Curie constants effective magnetic moments and molar fraction of
Fe3+(x1) şi Fe2+(x2) ions in xFe2O3middot(100-x)[As2O3middotTeO2] glasses (S4)
x [mol Fe2O3]
CMtimes102
[emu mol] ef
[microB] x1
[mol Fe23+O3]
x2 [mol Fe2
2+O3] 3 2571 585 277 023 5 4016 566 363 137 10 7911 562 686 314 20 14992 521 643 929 35 22676 509 601 2899 50 30959 497 313 4687
37
Table 49 Molar Curie constants effective magnetic moments and molar fraction of Fe3+(x1) şi Fe2+(x2) ions in xFe2O3middot(100-x)[3B2O3middotLi2O] glasses (S6)
The results allowed to consider that the magnetic properties of the studied glasses can
be explained through magnetic interractions between Fe3+ - Fe3+ Fe3+- Fe2+ and Fe2+- Fe2+ that
explain the dependences of RPE parameters concentration
SELECTED CONCLUSIONS
In this thesis xMOmiddot(100-x)[As2O3middotTeO2] xMOmiddot(100-x) [As2O3middotPbO] and
xMOmiddot(100-x)[3B2O3middotLi2O] glasses where MO =gt MnO or Fe2O3 were comparatively
studied in 0 le x le 50 mol The structural modifications of investigated glass matrices were
comparatively followed in function of the manganese or iron ions on the investigated glass
matrices were followed
The study by FT-IR spectroscopy shows that the evolution of the spectra of
xMnOmiddot(100-x) [As2O3middotPbO] with the addition and the increasing of the MnO content suggest
that the manganese ions break up a part of As ndash O ndash As Pb ndash O ndash Pb and probably of As ndash O ndash
Pb bonds The addition of MnO in the As2O3middotPbO glass matrix is leading to a disordering of
the glasses structure with the increasing of the MnO content
The evolution of the absorption bands for FT ndash IR spectrum of xFe2O3middot(1-x)
[As2O3middotPbO] glasses are determined by the addition of Fe2O3 content It can be observed to
shift the bands assigned As ndash O ndash As vibrations from AsO3 units due to changing to length As
ndash O ndash As bonds and interne angles of AsO3 units disappears PbO4 units and appears FeO6
units The addition of Fe2O3 in the As2O3middotPbO glass matrix determined a disordering of the
glasses structure with the increasing of the Fe2O3 content
From FT-IR absorption spectra of the investigated xMOmiddot(100-x)[As2O3middotTeO2] glasses
system where MO =gt MnO or Fe2O3 it can be observed that the addition and increasing of
manganese ions concluded the contraction of As-O-As bonds from totally symmetric
x [mol Fe2O3]
CMtimes102
[emu mol] ef
[microB] x1
[mol Fe23+O3]
x2 [mol Fe2
2+O3] 3 2542 582 268 032 5 3943 561 338 162 10 7423 544 506 494 20 13568 520 549 1451 35 23094 513 731 2769 50 31746 503 584 4416
38
stretching vibrations of AsO3 units for x ge10 mol there can be an increase in number of As-
O-As bonds from AsO3 units orand a length these linkage to doubly degenerate stretching
vibrations of AsO3 units and a stretching vibration mode of TeO3 tp with NBO It can be
remarked from the FT-IR absorption spectra the gradual transformation of symmetric
stretching vibration mode of Te-O bonds from TeO3 units in TeO4 (tbp) units and the presence
of MnO2 units Once with the addition of iron ions the xFe2O3middot(100- x)[As2O3middotTeO2]
glasses behave like xMnOmiddot(100-x)[As2O3middotTeO2] glasses but in this system the
appearance of FeO6 units can be seen
From FT-IR spectra in xMOmiddot(100-x)[3B2O3middotLi2O] glasses where MO =gt MnO or
Fe2O3 can be concluded that the addition of manganese or iron ions in vitreous matrices leads
to the increase of the disorder degree
The study by Raman spectroscopy shows that the evolution of the spectra the addition
of MnO in the [As2O3middotPbO]glass matrix determined an order degree of the vitreous matrix
The intensity of the bands attributed vibrations As ndash O ndash As bonds from As2O units and
bending vibrations of As ndash O ndash As from As2O units shift to a higher wave length that suggests
an increase in the As2O units comparative to AsO3 units With the increase of iron ions content
in the As2O3middotPbO glass matrix the number of these structural units decreases due to the
increasing of the disorder in the studied glasses
With the increasing of manganese content in As2O3TeO2 glass matrix the intensity
of these bands is increasing showing that the manganese content favorites the formation of
TeO4 (tbp) and TeO3 (tp) units For high concentrations of iron ions in xFe2O3middot(100-
x)[As2O3 TeO2] system of glasses the number of As-O-As linkages appear in Raman
spectrum due to stretching vibrations of As-O-As and vibrations of the continuous TeO4 (tbp)
network show a significant decrease
Studying the Raman spectra of xMOmiddot(1-x)[3B2O3middotLi2O] glass system where MO =gt
MnO or Fe2O3 it has been observed that the absorption bands presented in vitreous matrix
gradually decreased with an increase in the manganese or iron content in both glasses system
which suggested an increase of the disorder in these vitreous systems
The EPR spectra presents the behavior of manganese or iron ions in different vitreous
matrices xMOmiddot(100-x)[As2O3middotBO] where MO=gtMnO or Fe2O3 and BO =gt TeO2 or
PbO and xMOmiddot(100-x) [3B2O3middotLi2O] Glasses were investigated by EPR spectroscopy on a
large compositional range with 0 le x le 50 mol The absorption line centered at gef 43 and
is due to isolated Mn2+ ions The absorption line centered at gef 20 may be attributed to
Mn2+ species interacting by magnetic coupling dipolar and or super exchange the last ones
forming magnetic clusters The EPR spectra of Fe3+ in xFe2O3middot(100-x)[As2O3middotPbO]
xFe2O3middot(100-x)[As2O3middotTeO2] and xFe2O3middot(1-x)[3B2O3middotLi2O] are presented two absorption
lines centered at gef 43 and gef 20 up to x le 35mol Fe2O3 systems studied
39
The absorption line centered at gef 43 is due to isolated Fe3+ ions The absorption
line centered at gef 20 may be attributed to Fe3+ species interacting by magnetic coupling
dipolar and or super exchange the last ones forming magnetic clusters
The evolution of the spectra is easier to follow considering the dependence of
concentration on the EPR parameters the line - intensity (obtained as an integral of the area
under the corresponding EPR signal) J and the line - width ΔB The evolution of J and AB
reflects the structural transformations which appear in the glass matrices due to the increase of
manganese ions content
The magnetic susceptibility data are in good agreement with the EPR result The
magnetic behavior of the glasses from xMnOmiddot(100-x)[As2O3middotBO] where BO =gt TeO2 (S3)
or PbO (S1) and xMnOmiddot(100-x)[3B2O3middotLi2O] (S5) glasses for 3 le x le 50 mol MnO
For (S1) and (S3) system glasses up to x 3 mol and x 5 mol (S5) glass
system the temperature dependence of the reciprocal magnetic susceptibility obeys a Curie
law In this concentration range the manganese ions are predominantly isolated orand
participate in dipole-dipole interractions At higher concentrations the reciprocal magnetic
susceptibility obeys a Curie-Weiss law with negative paramagnetic Curie temperature (p)
characteristic to antiferromagnetic coupled ions by means of super exchange interractions This
behavior of manganese ions is confirmed by the shape of the EPR spectra Using the
representation 1 =f(T) the molar Curie constants CM the effective magnetic moments
and molar fraction of Mn2+(x1) şi Mn3+(x2) ions were calculated The magnetic susceptibility
data are in good agreement with the EPR result
The magnetic behavior of the glasses xFe2O3middot(100-x)[As2O3middotPbO] (S2)
xFe2O3middot(100-x)[As2O3middotTeO2] (S4) and xFe2O3middot(100-x)[3B2O3middotLi2O] (S6) for 3 x 50
mol Fe2O3 are presented For (S2) glass systems up to x 10 mol x 3 mol (S5)
glass systems and x 5 mol (S6) glass systems the temperature dependence of the
reciprocal magnetic susceptibility obeys a Curie law In this concentration range the iron ions
are predominantly isolated orand participate in dipole-dipole interactions At higher
concentrations the reciprocal magnetic susceptibility obeys a Curie-Weiss law with negative
paramagnetic Curie temperature (p) characteristic to antiferromagnetic coupled ions by
means of super exchange interactions(fig 435) This behavior of iron ions is confirmed by the
shape of the EPR spectra Using the representation 1 = f(T) the molar Curie constants
CM the effective magnetic moments and molar fraction of Fe3+(x1) şi Fe2+(x2) ions were
calculated
40
REFERENCES
Chapter 1
[1] I Ardelean bdquoIntroducere icircn studiul materialelor oxidice cu structură vitroasă EdNapocaStar Cluj Napoca 2002 [2] G Srinivasarao N Veeraiah J All Com 327 52-65(2001) [3] G Srinivasarao N Veeraiah J Phys Chem Solids 63705-717(2002) [4] DBecherescu VCristea FMarx IMenessz FWinter Chimia stării solide Ed Şt şi Encicl Bucucureştivol 1 1983 [5] J Wong CAAngell Glass-Structure by Spectroscopy Dekker Inc New York 1976 [6] BEWarren HKKrutter O Morningstat J Am Ceram Soc 19 202 (1936) [7] LLSperry JD Mackenzie Phys Chem Glasses 9 91 (1968) [8] WLKonijnendijk JMStevels J Non-Cryst Solids 18 307 (1975) [9] FCEversteyn JM Stevels HJ Naterman Phys Chem Glasses 1 134 (1963) [10] G Fuxi Optical and Spectroscopie Properties of Glass Springer-Verlag Shanghai Scientific Technical Pub Shanghai 1991 [11] YDYiannopoulos GDChryssikos EIKamitsos Phys Chem Glasses 42(3) 164 (2001) [12] MGFerreira da Silva BFOCosta J Non-Cryst Solids 293-295 534 (2001) [13] RYordanova YDimitriev VDimitriev S Kassabov DKlissurski JNon-Cryst Solids 201 141 (1996) [14] W L Konijnendijk J M Stevels J Non-Cryst Solids 18 307 (1980) [15] M Iron M Couzi ALevasseur JBrethous JSolidState Chem 31 285 (1980) [16] TFurukawa WBWhite PhzsChemGlasses 21 85 (1980) [17] E I Kamitsos M A Karakassides GD Chryssikos J Phys Chem 90 4528 (1986) [18] E I Kamitsos M A Karakassides GD Chryssikos J Phys Chem 91 1073 (1987) [19] TWBril Philips Res Rep Suppl 2 117 (1976) [20] E I Kamitsos M A Karakassides GD Chryssikos J Phys Chem 30 203 (1989) [21] BNMeera JRamakrishna J Non-Cryst Solids 159 1 (1993) [22] KWitke THubert PReich JRamanSpectr 24 407 (1993) [23] E I Kamitsos M A Karakassides Phys Chem Glasses 30 19 (1989) [24] MPeteanu Teză de doctoratrdquo Universitatea Babeş-Bolyairdquo Cluj Napoca (1989) [25] PCTaylor PJBray JPhys Chem Solids 33 43 (1972) [26] IArdelean MPeteanu GhIlonca DPop Solid State Commun 33 653 (1980) [27] AV De Wijn RE Van Balderen JKemPhys 46 4 (1967) [28] DL Griscom RE Griscom J Phys Chem Glasses 12 19 (1971) [29] JWH Schreurs JChem Phys 69 2151 (1978) [30] AlNicula M Peteanu IArdelean Studia Univ Babeş-Bolyai Physica 2 65 (1979) [31] M Peteanu IArdelean SFilip ITodor GSalvan Studia Univ Babeş-Bolyai Physica XL 2 9 (1995) [32] IArdelean M Peteanu SFilipV Simon ITodor Solid State Commun 105 (5) 339 (1998) [33] SKMendiratta EGuedes de Sousa JMatSci Lett7 733 (1988) [34] IArdelean M Peteanu SFilip V Simon GGyorffy Solid State Commun 102 (4) 341 (1997) [35] IArdelean M Peteanu SFilip V Simon FCiorcas ITodor JMagnMagn Mat 196-197 257 (1999) [36] JKliava RBerger YServant JEmery JMGreneche JTrokss J Non-Cryst Solids 202 205 (1996) [37] LDBogomolova NA Krasilnikova VLBogdanov VDKhaliev VV Mitrofanov J Non-Cryst Solids 188 130 (1995) [38] DLoveridge SPark PhysChem Glasses 12 19 (1971) [39] IArdelean G Salvan M Peteanu V Simon FCiorcas Mod PhysLett B 13 (22-23) 801 (1999)
41
[40] JLRao AMuraly EDRao J Non-Cryst Solids 202 215 (1996) [41] CPrakash S Husain RJ Singh SMollah JAlloys Compon 326 47 (2001) [42] EGuedes de Sousa SKMendiratta JMMachado Da Silva Portugal Phys 17 (3-4) 203 (1986) [43] TCastner GSNewell WCHolton CP Slichter JChem Phys 32 668 (1960) [44] SPChaudhuri SKPatra JMatSci 35 4735 (2000) [45] IArdelean HH Qiu HSakata Matt Lett 32 335 (1997) Chapter 2 [1] J Wong C A Angel Glass Structure by Spectroscopy Marcel Dekker inc New-York 1976 [2] I Ardelean bdquoIntroducere icircn studiul materialelor oxidice cu structură vitroasă EdNapocastar Cluj-Napoca 2002 [3] N Avram GH Mateescu Spectroscopia icircn infraroşu Aplicaţii icircn chimia organică Ed Tehnică Bucureşti 1968 [4] TIliescu Spectroscopie optică moleculară vibraţională şi electronică Ed Casa Cărţii de Ştiinţă Cluj- Napoca 2000 [5] S Aştilean bdquoMetode şi tehnici moderne de spectroscopie optică Ed Casa Cărţii de Ştiinţă Cluj - Napoca 2002 p 5 [6] I Ursu Rezonanţă Electronică de Spinrdquo Ed AcademieiBucureşti (1965) [7] CHHurd ContempPhys 23 (5) 469 (1982) [8] GWAnderson WDCompton JChemPhys52 6166 (1970) [9] MS Seehra GSrinivasan Landolt-Bornstein (New Series) SubVolume F3 Springer-Verlag Berlin 1994 [10] GToulouse ContempPhys 2115 (1977) [11] NMMurayMagnetic susceptybility EdInterscience New York P1773 1963 [12] JBGoodenough Magnetism and Chemical Bond EdInterscience New York 1963 [13] IArdelean G Salvan M Peteanu V Simon FCiorcas Mod PhysLett B 13 (22-23) 801 (1999) [14] IArdelean MPeteanu R Ciceo Lucăcel Studii de rezonanţă paramagnetică electronică şi magnetice ale unor ioni 3d icircn sticle pe bază de B2O3 Ed Presa Univesitară Clujeană 2005 [15] IArdelean PhysStatSol (b) 87K137 (1978) [16] IArdelean Solid State Commun 31 75 (1979) [17] EJFrieble LKWilson AWDozier DLKinser PhysStatSol (b) 45 323 (1971) [18] DWMoon JMAitken RKMcCrone GS Ciloszik PhysChe Glasses 16 (5) 91 (1975) [19] SFilip Teză de doctorat UnivBabeş-Bolyai Cluj Napoca 1996 [20] CJSchinkel GWRathenou Physics of Non-Crystaline Solids North Holland Publ Co Amsterdam 215 1965 [21] EJFrieble LKWilson NCKoon DLKinser JAm Ceram Soc 57-237 (1974) [22] RJLandry JT Fournier CGYoung JChemPhys 46 1285 (1967) [23] WSimpson PhysStatSolidi b40 207 (1970) [24] RHasegawa PhysRevB b(5) 1631 (1971) [25] IArdelean GhIlonca MPeteanu Solid State Commun 52 145 (1984) [26] IArdelean GhIlonca OCozar J Physique 49 C8 1107 (1988) Chapter 3 [1] LFBates Modern Magnetism p133 Cambridge University Press London 1962 [2] IArdelean GhIlonca DBarbos Solid State Commun 40 769 (1981) [3] EBurzo IUrsu DUngur IArdelean JMatSci 15 581 (1980) [4] EBurzo IUrsu DUngur IArdelean MatResBull 15 1273 (1980) [5] DLGriscom Glass Science and Technology 48 151 (1990) [6] PJBray AH Silver Modern aspects of the vitreous state vol1 Butterworth
42
London 1960 [7] IArdelean Teza de doctorat UnivBabeş-Bolyai Cluj Napoca 1979 [8] SAştilean bdquoMetode şi tehnici moderne de spectroscopie opticărdquo EdCasa Cărţii de Ştiinţă Cluj ndash Napoca 2002 p5 [9] IArdelean RCiceo-Lucăcel ldquoFizica şi Tehnologia Materialelor Oxidice Lucrări Practicerdquo Ed Univ ldquoBabeş-Bolyairdquo Cluj-Napoca 2000 [10] VPop IChicinaş NJumate Fizica materialelor Metode experimentalerdquo EdPresa Universitară Clujeană 2001 [11] IUrsu Rezonanţă electronică de spinrdquo EdAcademiei Bucureşti 1965 Chapter 4 [1] I Ardelean S Lupşor D Rusu Solid State Sci 10 1384(2008) [2] I Ardelean S Lupşor D Rusu trimis spre publicare la Physica B decembrie 2009 [3] P Tarte Spectrochim Acta 18 467 (1962) [4] R A Condrate J Non ndash Cryst Solids 84 26 (1986) [5] G Srinivasarao N Veeraiah Phys Stat Sol (a) 191 370(2002) [6] G Srinivasarao N Veeraiah J Phys Chem Solids 63 705(2002) [7] G Srinivasarao N Veeraiah J All Com 327 52 (2001) [8] DK Durga N Veeraiah Bull Mater Sci 24 (4) 421 (2001) [9] F F Bentley L D Smithson A L Rozek InfraredndashSpectra and Characteristic Frequencies 700-300 cm-1 Interscience New York 1968 p 103 [10] O Noguera T Merle-Mejean AP Mirgorodsky MB Smirnov P Thomas J-C Champarnaud-Mesjard J Non-Cryst Solids 330 50 (2003) [11] BVR Chowdari KL Tan Fang Ling Solid State Ionics 113 ndash 115 711(1998) [12] C Jiang J Zhang H Mao F Gan Glass Technol 39(6) 200(1998) [13] MR Sahar K Sulhadi MS Rohani J Mater Sci 42 824(2007) [14] C Horea D Rusu I Ardelean J Mater Sci Mater Electron 20 905(2009) [15] GE Rachkovskaya GB Zakharevich J Appl Spectrosc 74 86(2007) [16] I Ardelean S Lupşor D Rusu trimis spre publicare la Journal of Materials Science Materials in Electronics decembrie 2009 [17] I Ardelean S Lupşor D Rusu trimis spre publicare la Modern Physics Letters B decembrie 2009 [18] R Iordanova Y Dimitriev V Dimitrov S Kassabov D Klissurski J Non ndash Cryst Solids 231 227 (1998) [19] R Iordanova Y Dimitriev S Kassabov D Klissurski J Non ndash Cryst Solids 204 141 (1996) [20] J O Jensen S J Gilliam A Banerjee D Zeroka S J Kirkby C N Merrow J Mol Struct (Theochem) 664 145 (2003) [21] G N Papatheodorou S A Solin Solid State Commun 16 5 (1975) [22] BVR Chowdari KL Tan Fang Ling J Mat Sci 35 2015 (2000) [23] R C Lucacel C Marcus V Timar I Ardelean Solid State Sci 9 850 (2007) [24] CP Varsamis EI Kamitsos GD Chryssikos Solid State Ionics 136ndash137 1031 (2000) [25] Sherief M Abo-Naf Fatma H El Batal Moenis A Azooz Mat Chem Phys 77 846 (2002) [26] SG Motke SP Yawale SS Yawale Bull Mater Sci 25 (10) (2002) [27] R Akagi N Ohtori N Umesaki J Non ndash Cryst Solids 293 471(2001) [28] E I Kamitsos M A Karakassides G D Chryssikos J Phys Chem 91(5) 1073 (1987) [29] H Ushida Y Iwadate T Hattori S Nishiyama K Fukushima Y Ikeda M Yamaguchi M Misawa T Fukunaga T Nakazawa S Jitsukawa J Alloys Compd 377 167 (2004) [30] I Ardelean F Ciorcas M Peteanu S Lupşor G Salvan Balkan Phys Lett 5 860 (1997)
43
[31] I Ardelean M Peteanu V Simon O Cozar F Ciorcas S Lupşor J Magn Magn Mater 196 253 (1999) [32] IArdelean MPeteanu GhIlonca Phys Stat Sol (a) 58 K33(1980) [33] IArdelean MPeteanu R Ciceo-Lucăcel ldquoStudii de rezonanţă paramagnetică electronică şi magnetice ale unor ioni 3d icircn sticle pe bază de B2O3rdquo Ed Presa Univ Clujeană Cluj Napoca 2005 p 171 [34] JLRao AMuraly EDRao J Non-Cryst Solids 202 215 (1996) [35] RPSChakradhar AMurali JLRao Optical Mat 10 109 (1998) [36] IArdelean MPeteanu SFilip VSimon GGyorffy Solid State Commun 102(4) 341 (1997) [37] IArdelean MPeteanu VSimon SFilip FCiorcaş ITodor J Magn Magn Mat 196-197 257 (1999) [38] IArdelean GSalvan MPeteanu VSimon CHimcinschi FCiorcas Mod Phys Lett B 13(22-23) 801 (1999) [39] IArdelean HHQiu HSakata Mat Lett 32 335 (1997) [40] SPChaudhuri SKPatra J Mat Sci 35 4735 (2000) [41] I Ardelean M Peteanu V Simon G Salvan J Mat Sci Technol 18 (3) 1 (2002)

3
CHAPTER 4 RESULTS AND DISCUSSION REGARDING THE STUDY OF xMOmiddot(100-
x)[As2O3middotTeO2] xMOmiddot(100- x)[As2O3middotPbO] and xMOmiddot(100-x)[3B2O3middotLi2O] GLASS
STRUCTURE WHERE MO =gt MnO or Fe2O3 58
41 Comparative study by FT-IR and Raman spectroscopies of xMOmiddot(100-
x)[As2O3middotTeO2] xMOmiddot(100-x)[As2O3middotPbO] and xMOmiddot(100-x)[3B2O3middotLi2O] glasses
where MO =gt MnO or Fe2O3 58
411 Comparative study by FT-IR spectroscopy of As2O3middotTeO2 and
As2O3middotPbO vitreous matrices 58
412 Comparative study by FT-IR spectroscopy of xMOmiddot(100-
x)[As2O3middotPbO] vitreous systems where MO =gt MnO or Fe2O3 61
413 Comparative study by FT-IR spectroscopy of xMOmiddot(100-
x)[As2O3middotTeO2] vitreous systems where MO =gt MnO or Fe2O3 66
414 Comparative study by FT-IR spectroscopy of xMnOmiddot(100-
x)[As2O3middotBO] vitreous systems where BO =gt TeO2 or PbO 69
415 Comparative study by FT-IR spectroscopy of xFe2O3middot(100-
x)[As2O3middotBO] vitreous systems where BO =gt TeO2 or PbO 70
416 Comparative study by Raman spectroscopy of As2O3middotTeO2 and
As2O3middotPbO vitreous matrices 71
417 Study by Raman spectroscopy of xMOmiddot(100- x)[As2O3middotPbO]
vitreous systems where MO =gt MnO or Fe2O3 73
418 Study by Raman spectroscopy of xMOmiddot(100-x)[As2O3middotTeO2]
vitreous systems where MO =gt MnO or Fe2O3 75
419 Comparative study by Raman spectroscopy of xMnOmiddot(100-
x)[As2O3middotBO] vitreous systems where BO =gt TeO2 or PbO 78
4110 Comparative study by Raman spectroscopy of xFe2O3middot(100-
x)[As2O3middotBO] vitreous systems where BO =gt TeO2 or PbO 79
42 Comparative study by FT-IR and Raman spectroscopies of
xMOmiddot(100-x)[3B2O3middotLi2O] glasses where MO =gt MnO or Fe2O3 79
421 Study by FT-IR spectroscopy of xMOmiddot(100-x)[3B2O3middotLi2O]
glasses where MO =gt MnO or Fe2O3 80
422 Study by Raman spectroscopy of xMOmiddot(100-x)[3B2O3middotLi2O]
glasses where MO =gt MnO or Fe2O3 86
4
43 Comparative study by electron paramagnetic resonance (EPR) and
magnetic susceptibility measurements of xMOmiddot(100-x)[As2O3middotTeO2] xMOmiddot(100-x)
[As2O3middotPbO] şi xMOmiddot(100-x)[3B2O3middotLi2O] glasses where MO=gt MnO or Fe2O3 88
431 Comparative study by electron paramagnetic resonance (EPR) of
xMnOmiddot(100-x)[As2O3middotBO] where BO =gt TeO2 or PbO and xMnOmiddot(100-x)
[3B2O3middotLi2O] glasses 88
432 Comparative study by magnetic susceptibility measurements of
xMnOmiddot(100-x)[As2O3middotBO] where BO =gt TeO2 or PbO nd xMnOmiddot(100-x)
[3B2O3middotLi2O] glasses 93
433 Comparative study by electron paramagnetic resonance (EPR) of
xFe2O3middot(100-x)[As2O3middotBO] where BO =gt TeO2 or PbO and x Fe2O3middot(100-x)
[3B2O3middotLi2O] glasses 98
434 Comparative study by magnetic susceptibility measurements of
xFe2O3middot(100-x)[As2O3middotBO] where BO =gt TeO2 or PbO and x Fe2O3middot(100-x)
[3B2O3middotLi2O] glasses 104
References 110
CONCLUSIONS 112
5
INTRODUCTION
Glasses are noncrystaline solid materials that have a disordered structure but have a
local order The study of materials with vitreous structures gained a special attention due to
their manifold applications in domains of science and technology The oxide glasses unfold a
large variety of properties due to the variety of their compounds these glasses have wide
technological applications
This thesis work is focused on characterizing the structure the optic and magnetical
properties of arsenolite and borate glasses The study presented in this thesis has as objective
the obtaining of new experimental data and the clarification of the physical phenomena which
determine the structural behavior of As2O3 and B2O3 based glasses doped with manganese or
iron ions In order to obtain this information of xMOmiddot(100-x)[As2O3middotTeO2] xMOmiddot(100-
x)[As2O3middotPbO] and xMOmiddot(100-x)[3B2O3middotLi2O] where MO =gt MnO or Fe2O3 glass
systems with 0 lt x lt 50 mol MnO or Fe203 they were prepared and investigated by x - ray
Diffraction FT - IR spectroscopy Raman spectroscopy electron paramagnetic resonance
(EPR) and magnetic susceptibility measurements
The thesis is structured in four chapters The first chapter presents on literature basis
the main results regarding the structure and the properties of As2O3 and B2O3 based glasses
Chapter 2 presents theoretical and experimental general aspects regarding the iron and
manganese behavior using the IR absorption Raman spectroscopies electron paramagnetic
resonance and magnetic susceptibility Chapter 3 describes the experimental techniques used in
the studies of glasses The processing and preparation of the samples are presented Chapter 4
presents and discusses the experimental results obtained for the investigated glasses In the
end the general conclusions which emphasize the most important results of this thesis are
presented
CHAPTER 1 THE STUDY OF THE STRUCTURE OF As2O3 AND B2O3 BASED
GLASSES
As2O3 and B2O3 are the most important glass forming oxides and have been
incorporated into various kinds of glass system in order to obtain the desired physical and
chemical properties for both scientific and industrial applications As2O3 is a very strong glass
formation having a configuration based on pyramidal AsO3 units determined by a special
dynamics on the As and O bonds unique properties of the glass systems [1-3] The properties
of the glasses based the B2O3 are due to the fact that the boron atom can assume triangular
6
and tetrahedral coordination and also to the different ways through which the borate buildings
units can be linked together [4-9]
The behavior of various borate species in the glass structure is determined by the nature
of modifier oxides (TeO2 PbO etc) In most binary borate glasses the glass properties change
almost linearly with composition [10-17] In binary borate glasses the properties of these show
a major deviation from linearity which depends on modifier oxide The structural reasons for
this is generally due to the change in the coordination of boron atom from 3 to 4 and back
again Many technological applications of these glasses depend of this effect since is produces
many improvements [18-23]
The introduction of MnO [24-32] or Fe2O3 [33-45] into diamagnetic glasses transform
them into paramagnetic glasses The introduction of iron and manganese in small percentages
modifies the physical properties of the glasses and the material is more accessible for a
complete structural characterization
In order to extend the available information concerning the interesting class of As2O3
and B2O3 based glasses we investigated glasses by means of different physical methods We
obtained valuable information concerning the structure and structural changes of the glasses
that occur with the addition of transitional oxide metals
CHAPTER 2 METHODS USED IN THE STUDY OF STRUCTURE AND
PROPERTIES OF OXIDE GLASSES
In this chapter some of the methods used in the investigation of the structure and
properties of vitreous systems are presented The study of the structure and properties of oxide
glasses with transitional metals ions IR and Raman spectroscopies electron paramagnetic
resonance and magnetic susceptibility measurements were chosen as investigation methods
The electromagnetic radiation (EM) with frequencies between 4000 and 400 cm -1 called
infrared radiation (IR) is used to obtain information connected to the structure of the
compound and as an analytic method to test the purity of the compound Its application in
organic chemistry is known as IR spectroscopy The radiation is absorbed by organic
molecules and converted in molecular vibration energy When the radiant energy coincides
with a specific molecular vibration the absorption appears The wave length at which the
radiation is absorbed by the organic molecule gives information regarding the functional
groups presented in the molecule [1-4]
The Raman spectroscopy brings useful contributions to the molecular vibrations study
The interraction mechanism of electromagnetic radiation with the molecular vibration which
forms the Raman spectroscopy theoretical basis differs from the one of the process which
forms the IR spectroscopy theoretical basis [4]
7
Another method used in the investigation of the glass system is the electron paramagnetic
resonance (RPE) This method is one of the most powerful techniques for local order
investigation RPE is a method widely used to describe the fundamental states and to
characterize the vicinities effect on the energetic levels of the paramagnetic centers The
method consists in the study of the electronic split levels of the atoms in the presence of an
external magnetic field [6] The Mn2+ EPR spectra are characterized by resonance absorptions
at gef 43 gef 33 and gef 20 The resonance line centered at gef 43 is
corresponding to the isolated Mn2+ ions The line from gef 20 is attributed to Mn2+ ions
involved in magnetic interactions
The Fe3+ EPR spectra are characterized by resonance absorptions at g 97 g 6 g 43
and g 20 The resonance line from g 97 is related to Fe3+ ions disposed in rhombic
environment The resonance line at g 6 was assigned to an axial distortion of the
paramagnetic ions neighborhood The resonance line at g 43 is corresponding to the isolated
Fe3+ ions situated in octahedral rhombic or tetragonal symmetric distorted neighborhoods The
line from gef 20 is attributed to Fe3+ ions involved in magnetic interactions
Along with the EPR spectroscopy the magnetic susceptibility measurements provide
useful information about the valence state and the interaction involving the transitional metal
ions in vitreous materials [7-10]
Different vitreous systems with manganese or iron ions were intensively studied by
magnetic susceptibility measurements to determine the magnetic behavior and the valence
states of these ions in these systems It was observed that the presence of the manganese or iron
ions in different valence states depends on the chemical composition of the vitreous matrix on
the valence of the vitreous network former and modifications and on the preparation of the
environment The magnetic properties of the oxide glasses with manganese or iron ions were
assigned to the antiferromagnetic couple between Mn2+-Mn2+ Mn2+-Mn3+ and Mn3+-Mn3+
[19-26] or Fe -Fe3+ Fe2+-Fe2+ and Fe3+-Fe2+ ions [11-18]
CHAPTER 3 EXPERIMENTAL TECHNIQUES
We have prepared glasses of the xMOmiddot(100-x)[As2O3middotTeO2] xMOmiddot(100-
x)[As2O3middotPbO] şi xMOmiddot(100-x)[3B2O3middotLi2O] glass structure where MO =gt MnO or Fe2O3
with 0 lt x lt 50 mol used components of reagent grade purity MnCO3 Fe2O3 As2O3
H3BO3 PbO Li2CO3 şi TeO2 in suitable proportions to obtain the desired composition The
mixtures were melted in sintered corundum crucibles introduced in an electric furnace directly
at 1250 C and kept for 5 minutes at this temperature They were quickly cooled at room
temperature by pouring onto stainless steel plates
The structure of the samples was analyzed by means of x-ray Diffraction using powders
with a Bruker D8 Advanced diffract meter
8
The FT - IR spectra have been recorded using a Bruker Equinox 55 with a spectral range
between 4000 cm -1 and 370 cm -1 A MIR GLOBAR generator cooled with air was used The
detection was carried out with a DLATGS detector with a KBr window The spectral
resolution was about 05 cm1 The samples were prepared using KBr pellet technique
The Raman spectra were recorded on bulk samples at room temperature using an
integrated FRA 106S Raman module attached to Bruker Equinox 55 with a spectral range
from 3600 cm -1 to 70 cm -1 An NdYAG laser with an output power of 500 mW and a 1064
nm radiation was used The detection was carried out with an ultra sensitive D418-T detector
cooled with liquid nitrogen The spectral resolution was about 1 cm1
The EPR spectra were obtained at room temperature with an Adani Portable EPR
Spectrometer PS8400 in X-frequency band (94 GHz) For these measurements equal
quantities of powders from the investigated samples closed in glass tubes were used
Magnetic susceptibility measurements were performed on a Faraday type balance in the 80
- 300 K temperature range The sensitivity of the equipment was 10-7 emug
CHAPTER 4 RESULTS AND DISCUSSION REGARDING THE STUDY OF
xMOmiddot(100-x)[As2O3middotTeO2] xMOmiddot(100- x)[As2O3middotPbO] şi xMOmiddot(100-x)[3B2O3middotLi2O]
GLASS STRUCTURE WHERE MO =gt MnO or Fe2O3
In this chapter the results obtained by following the study of the structure and
properties of oxide glasses with transitional metals ions by FT- IR and Raman spectroscopies
electron paramagnetic resonance and magnetic susceptibility measurements are presented The
structural changes and magnetic properties with the manganese and iron content were
followed
41 Comparative study by FT-IR and Raman spectroscopies of xMOmiddot(100-
x)[As2O3middotTeO2] xMOmiddot(100- x)[As2O3middotPbO] şi xMOmiddot(100-x)[3B2O3middotLi2O] glasses
where MO =gt MnO or Fe2O3
411 Comparative study by FT-IR spectroscopy of As2O3middotTeO2 and
As2O3middotPbO vitreous matrices
In order to obtain new information regarding the role of the modifier in the
formation of vitreous matrices comparative studies by FT-IR spectroscopy were made
The FT-IR spectroscopy is represented in figure 41(ab) The wave length and the
structural assignments of FT ndash IR spectra of As2O3middotPbO and As2O3middotTeO2 vitreous matrices
are represented in table 41
9
400 600 800 1000 1200
Wavenumber [cm-1]
Abs
orpt
ion
[au
]
407
594
821
794
1119
As2O
3PbO
a)
a
400 600 800 1000 1200
As2O3TeO2
Abs
orpt
ion
[ua
]
Wavenumber [cm-1]
85473
3
644
1119
b)
b
Fig41 FT ndash IR spectra of vitreous matrices a As2O3middotPbO şi b As2O3middotTeO2
The FT ndash IR spectrum of As2O3middotPbO glass matrix presents five absorption bands at ~
1119 cm-1 ~ 821 cm-1 ~ 794 cm-1 ~ 594 cm-1 and ~ 407 cm-1(Fig41a)
The band from ~ 1119 cm-1 is due to totally symmetric stretching vibrations of AsO3
units [5 ndash 7] The bands from ~ 821 cm-1 and ~ 794 cm-1 are due to doubly degenerate
stretching vibrations of AsO3 structural units [5 ndash 7] The large band centered at ~ 594 cm-1 can
be due to totally symmetric bending vibrations of AsO3 structural units [5-7] The band from ~
407 cm-1 can be due to vibrations of Pb ndash O bonds from PbO4 structural groups [7]
Following As2O3TeO2 glass matrix spectrum presented in Fig 41b four bands can be
observed located at ~ 644 cm-1 ~ 733 cm-1 ~ 854 cm-1 and ~ 1119 cm-1 The band from ~ 644
cm-1 can be assigned to totally symmetric bending vibrations of AsO3 units [5-7] and also
stretching vibration mode of TeO4 tbp with bridging oxygen[11] The band from ~ 733 cm-1
can be assigned to the symmetric stretching vibration mode of Te-O bonds in TeO3 units
[15] The band from ~ 854 cm-1 can be assigned to doubly degenerate stretching vibrations of
AsO3 units [5-7] and also to the stretching vibration mode of TeO3 tp with NBO [11] The band
10
from ~ 1119 cm-1 can be assigned to totally symmetric stretching vibrations of AsO3 units [5-
7] These bands presented in As2O3TeO2 glass matrix spectrum confirm the presence of
AsO3 TeO4 tbp and TeO3 tp units in the structure of the glass matrix but due to the broadness
of the bands it can not be told for sure which one of these units is predominant
Table 41Wavenumber and the structural assignments of FT ndash IR spectra of
As2O3middotPbO and As2O3middotTeO2 vitreous matrices
~ [cm 1 ]
As2O3middotPbO As2O3middotTeO2
Attribution
~1119 cm-1
~ 1119 cm-1
Totally symmetric stretching vibrations of AsO3 units
~ 821cm-1
Doubly degenerate stretching vibrations of AsO3 structural units
~ 854 cm-1
Doubly degenerate stretching vibrations of AsO3 units Stretching vibration mode of TeO3 tp with NBO
~ 794 cm-1
Doubly degenerate stretching vibrations of AsO3 structural units
~ 733 cm-1
Symmetric stretching vibration mode of Te-O bonds in TeO3 units
~ 594 cm-1
~ 644 cm-1
Totally symmetric bending vibrations of AsO3 units
~ 407 cm-1 Vibrations of Pb ndash O bonds from PbO4 structural groups
412 Comparative study by FT-IR spectroscopy of
xMOmiddot(100- x)[As2O3middotPbO] vitreous systems where MO =gt MnO or Fe2O3
The infrared absorption spectra obtained for xMOmiddot(1-x)[As2O3middotPbO] glass system
where MO =gt MnO or Fe2O3 with 0 le x le 50 mol are presented in figure 42-3 and their
structural assignments are summarized in table 41
The spectra were discussed on the basis of the method given by Tarte [3] and Condrate
[4] by comparing the experimental data of glasses with those of related crystalline compounds
The characteristic absorption bands for crystalline As2O3 [5-8] PbO [79] and characteristic
bands for Fe2O3 [1819 ] were used as a reference point in the results discussion
The FT ndash IR spectra of the investigated glasses suggest a structure formed of AsO3 and
PbO4 structural units where As2O3 plays the role of the glass former and PbO plays the role of
the glass modifier The evolution of the spectra with the addition and the increasing of the
MnO content suggest that the manganese ions break up a part of As ndash O ndash As Pb ndash O ndash Pb and
probably of As ndash O ndash Pb bonds The addition of MnO in the As2O3middotPbO glass matrix is leading
to a disordering of the glasses structure with the increasing of the MnO content
The evolution of the absorption bands for FT ndash IR spectrum of xFe2O3middot(1-x)
[As2O3middotPbO] glasses are determined by the addition of Fe2O3 content It can be observed to
11
shift the bands assigned As ndash O ndash As vibrations from AsO3 units due to changing to length As
ndash O ndash As bonds and interne angles of AsO3 units disappears PbO4 units and appears FeO6
units The addition of Fe2O3 in the As2O3middotPbO glass matrix determined a disordering of the
glasses structure with the increasing of the Fe2O3 content
400 600 800 1000 1200
610
813
449
1093
423
449
616
760 848
821
794
594
20A
bsor
ptio
n [a
u]
Wavenumber [cm-1]
05
0
35
10
35
50
1
MnO
407
1119
693
Fig 42 FT ndash IR spectra of xMnOmiddot(100- x)[As2O3middotPbO] glasses
400 600 800 1000 1200
616
462
811
407
594
Abs
orpt
ion
[au
]
Wavenumber [cm -1]
05
20
0
35
10
35
50
1
Fe2O3
821
79469
3
1119
1084
610
Fig43 FT ndash IR spectra of xFe2O3middot(100- x)[As2O3middotPbO] glasses
12
413 Comparative study by FT-IR spectroscopy of
xMOmiddot(100-x)[As2O3middotTeO2] vitreous systems where MO =gt MnO or Fe2O
The infrared absorption spectra obtained for xMOmiddot(1-x)[As2O3middotTeO2] glass system
where MO =gt MnO or Fe2O3 with 0 le x le 50 mol are presented in figure 44 -5 and their
structural assignments are summarized in table 41[1617] The characteristic absorption bands
for crystalline As2O3 [5-8] PbO [79] TeO2 [810-15] MnO2 and Mn3O4 [9] and characteristic
bands for Fe2O3 [1819 ] were used as a reference point in the results discussion
Fig 44 FT ndash IR spectra of xMnOmiddot(100- x)[As2O3middotTeO2] glasses
Fig45 FT ndash IR spectra of xFe2O3middot(100- x)[As2O3middotTeO2] glasses
400 600 800 1000 1200
565
422 690 830
05
Abs
optio
n [a
u]
Wavenumber [cm-1]
0
3
5
35 50
1
MnO
854 733 644
1119
10 20
400 600 800 1000 1200
462650
812
713
561
05
20
Wavenumber [cm-1]
Abs
orpt
ion
[au
]]
0
3 5
10
35 50
1
Fe2O3
854 733
644
1119
13
This behavior of the studied glasses with the addition and increasing of MnO content
suggests that the structure observed in the glass matrix is conserving up to 5 mol MnO
where the structure takes another form From a structure dominated by AsO3 TeO4 tbp and
TeO3 tp units the structure became dominated by TeO4 tbp and MnO2 units and in a small
measure of AsO3 and TeO3 tp units For higher concentrations it can not be specified exactly
which of the last two structural units have the biggest proportion in these glasses From FT-IR
absorption spectra of the investigated glass system it can be observed that the addition and
increasing of manganese ions concluded the contraction of As-O-As bonds from totally
symmetric stretching vibrations of AsO3 units for x ge10 mol there can be an increase in
number of As-O-As bonds from AsO3 units orand a length these linkage to doubly degenerate
stretching vibrations of AsO3 units and a stretching vibration mode of TeO3 tp with NBO It
can be remarked from the FT-IR absorption spectra the gradual transformation of symmetric
stretching vibration mode of Te-O bonds from TeO3 units in TeO4 (tbp) units and the presence
of MnO2 units Once with the addition of iron ions the xFe2O3middot(100- x)[As2O3middotTeO2]
glasses behave like xMnOmiddot(100-x)[As2O3middotTeO2] glasses but in this system the
appearance of FeO6 units can be seen
414 Comparative study by FT-IR spectroscopy of
xMnOmiddot(100- x)[As2O3middotBO] vitreous systems were BO =gt TeO2 or PbO
The infrared absorption spectra obtained for xMnOmiddot(100- x)[As2O3middotBO] vitreous
systems where BO =gt TeO2 or PbO with 0 le x le 50 mol MnO are presented in figure
42 and 44 Following the infrared absorption spectra it can be observed that for
xMnOmiddot(100- x)[As2O3middot PbO] glass system the most disordered structure to exist for 0
le x le 5 mol MnO and to xMnOmiddot(100-x)[As2O3middot TeO2] glass system for 1 le x le 5 mol
MnO For x ge 5 mol MnO manganese ions break up a part of As ndash O ndash As Pb ndash O ndash Pb
and probably of As ndash O ndash Pb bonds to favor the increase in number of PbO4 units and
appearance of MnO2 units For x ge 10 mol MnO observed comparatively in both system
glasses the addition of manganese ions suggests for the first system a modification in linkage
characteristic units and for the second system an improvement for structural units of As2O3middot
TeO2 vitreous matrice also linkage characteristic units
415 Comparative study by FT-IR spectroscopy of
xFe2O3middot(100-x)[As2O3middotBO] vitreous systems where BO =gt TeO2 or PbO
The infrared absorption spectra obtained for xFe2O3middot(100- x)[As2O3middotBO] vitreous
systems where BO =gt TeO2 or PbO with 0 le x le 50 mol Fe2O3 are presented in figure
43 and 45
14
The evolution of the spectra with the addition and the increasing of the Fe2O3 content
suggest that the iron ions break up a part of As ndash O ndash As Pb ndash O ndash Pb and probably of As ndash O
ndash Pb bonds It can be observed a shift in the bands assigned As ndash O ndash As vibrations from AsO3
units due to changing to length As ndash O ndash As bonds and interne angles of AsO3 units the PbO4
units disappear and FeO6 units appear For x ge 5 mol Fe2O3 observed comparatively in
both system glasses the addition of iron ions suggests for the first system a modification in
linkage characteristic units of As2O3middotPbO and for the second system an improvement for
structural units of As2O3middot TeO2 vitreous matrice also linkage characteristic units appearance
of FeO6 units in both system
416 Comparative study by Raman spectroscopy of
As2O3middotTeO2 and As2O3middotPbO vitreous matrices
In order to obtain new information regarding the role of the modifier in the
formation of vitreous matrices there were made comparative studies by Raman
spectroscopy The Raman spectroscopy are presented in figure 46(ab) The wave
length and the structural assignments of Raman spectra of As2O3middotPbO şi As2O3middotTeO2 vitreous
matrices are presented in table 42
Table 42Wavenumber and the structural assignements of Raman spectra
of As2O3middotPbO and As2O3middotTeO2 vitreous matrices
~ [cm 1 ]
As2O3middotPbO As2O3middotTeO2
Attribution
~826 cm-1
~ 816 cm-1
Stretching vibrations of As-O-As
~ 752 cm-1
Vibrations of the continuous TeO4 (tbp) network
~ 627 cm-1
Vibrations As ndash O ndash As bonds from As2O units
~ 580 cm-1
Stretching vibrations of As-O-As
~ 525 cm-1
Vibrations O-As-O bonds from AsO3 units
~ 438cm-1
Symmetric bending vibrations of Te ndash O ndash Te vertex linkages between different TeO4 (tbp) TeO3+1 polyhedra Stretching vibrations of As-O-As of AsO3 units
~ 345 cm-1
Bending vibrations of As ndash O ndash As from As2O units
15
200 400 600 800 1000
As2O3PbO
Ram
an In
tens
ity [a
u]
LWavenumber [cm-1]
345
826
525
627a)
a
200 400 600 800 1000
816
752
580 R
aman
Inte
nsity
[au
]
Wavenumber [cm-1]
As2O3TeO2
438
b)
b
Fig46 Raman spectra of vitreous matrices a As2O3middotPbO şi b As2O3middotTeO2
The Raman spectrum of As2O3middotPbO glass matrix presents four bands at 826 cm-1
627 cm-1 525 cm-1 and 345 cm-1 The band from 826 cm-1 can be assigned to As ndash O ndash
As stretching vibrations [20] The band centered at 627 cm-1 can be assigned to vibrations As
ndash O ndash As bonds from As2O units the band from 525 cm-1 are assigned vibrations O-As-O
bonds from AsO3 units [21] The band of 345 cm-1 are attributed to As ndash O ndash As bending
vibrations from As2O units[2021]
The Raman spectrum of As2O3middot TeO2 glass matrix presents four bands at 816 cm-1
752 cm-1 580 cm-1 and 438 cm-1 The band from 816 cm-1 can be assigned to As ndash O ndash
As stretching vibrations [20] The band centered at 752 cm-1 can be assigned to vibrations of
the continuous TeO4 (tbp) network [22] The band of 580 cm-1 are attributed to As ndash O ndash As
stretching vibrations [12] The band centered at 438 cm-1 can be assigned symmetric bending
vibrations of Te ndash O ndash Te vertex linkages between different TeO4 (tbp) TeO3+1 polyhedra and
As ndash O ndash As stretching vibrations of AsO3 units
16
417 Study by Raman spectroscopy of xMOmiddot(100- x)[As2O3middotPbO]
vitreous systems where MO =gt MnO or Fe2O3
The Raman spectra obtained for xMOmiddot(100- x)[As2O3middotPbO] vitreous systems where
MO =gt MnO or Fe2O3 with 0 le x le 50 mol are presented in figure 47-8 and their
structural assignments are summarized in table 42
200 400 600 800 1000
368
833
345
1
3
Lungimea de unda [cm-1]
Inte
nsita
te R
aman
[ua
]
20
05
0
5
10
35
50
MnO
826
525
627
Fig 47 Raman spectra of xMnOmiddot(100- x)[As2O3middotPbO] glasses
The addition of MnO in the glass matrix determined an order degree of the vitreous
matrix The intensity of the bands attributed vibrations As ndash O ndash As bonds from As2O units
and bending vibrations of As ndash O ndash As from As2O units shift to a higher wave length that
suggests an increase in the As2O units comparative to AsO3 units
To the band from 826 cm-1 the addition of manganese ions in the glass matrix
determine for x = 05 mol an decreasing in intensity whereupon increasing for higher
concentrations The intensity of bands centered at 627 cm-1 and 525 cm-1 for x = 05
mol MnO decrease and disappear for x = 1 mol MnO The band of 345 cm-1 slowly
increases with the addition of manganese ions
To the band from 826 cm-1 the addition of iron ions in the glass matrix determines
for x = 05 mol an increase in intensity a gradual decrease and disappearance for x = 35
mol Fe2O3 of the bands observed for the glass matrix For higher concentrations of
manganese these bands gradually decrease The intensity of bands centered at 627 cm-1 and
525 cm-1 for x = 05 mol Fe2O3 increase and shift to 612 cm-1 and 501 cm-1 whereas
17
they gradually decrease and disappear for x = 10 mol Fe2O3 The band of 345 cm-1
decreases with the addition of iron ions and disappears for x = 20 mol Fe2O3
200 400 600 800 1000
3
612
501
Wavenumber [cm-1]
Ram
an In
tens
ity [a
u]
05
20
0
5
10
3550
1
Fe2O3
345
826
525
627
Fig 48 Raman spectra of xFe2O3middot(100- x)[As2O3middotPbO] glasses
With the increase of iron ions content in the As2O3middotPbO glass matrix the number of
these structural units decreases due to the increasing of the disorder in the studied glasses
418 Study by Raman spectroscopy of xMOmiddot(100-x)[As2O3middotTeO2]
vitreous systems were MO =gt MnO or Fe2O3
The Raman spectra obtained for xMOmiddot(100- x)[As2O3middot TeO2] vitreous systems
where MO =gt MnO or Fe2O3 with 0 le x le 50 mol are presented in figure 49-10 and their
structural assignments are summarized in table 42
The Raman spectrum of the glass matrix suggests a structure formed from TeO4 (tbp)
and TeO3 (tp) units where the presence of As ndash O ndash As bonds can not be excluded The
addition of manganese ions is leading to a modification of the structure proposed by the
spectrum of the glass matrix Then with the increasing of manganese content the intensity of
these bands is increasing showing that the manganese content favorises the formation of TeO4
(tbp) and TeO3 (tp) units
18
200 400 600 800 1000
783
850
768
416
816
752
Wavenumber [cm -1]
Ram
an In
tens
ity [a
u]
13
20
05
0
5
10
35
50
MnO
438
580
660
Fig 49 Raman spectra of xMnOmiddot(100- x)[As2O3middot TeO2] glasses
200 400 600 800 1000
226
294
408
673 751
5
W avenumber [cm -1]
Ram
an In
tens
ity [a
u]
05
20
0
3
10
35
50
1
Fe2O
3
816
752
438
580
Fig 410 Raman spectra of xFe2O3middot(100- x)[As2O3 TeO2] glasses
The Raman spectra of xFe2O3middot(100- x)[As2O3 TeO2] glasses present a significant
advance to the TeO4 (tbp) TeO3+1 polyhedra and AsO3 units represented in Raman spectrum
by the ~ 438 cm-1 band comparative with the modifications determined by the addition of
manganese ions in vitreous matrix For high concentrations of iron ions in xFe2O3middot(100-
x)[As2O3 TeO2] system of glasses the number of As-O-As linkages appear in Raman
spectrum due to stretching vibrations of As-O-As and vibrations of the continuous TeO4 (tbp)
network show a significant decrease
19
419 Comparative study by Raman spectroscopy of xMnOmiddot(100- x)[As2O3middotBO]
vitreous systems were BO =gt TeO2 or PbO
The addition of MnO to xMnOmiddot(100- x)[As2O3middotPbO] glass system do not break As
ndash O ndash As bonds into characteristic units and contribute to their prominence The addition of
manganese ions to xMnOmiddot(100- x)[As2O3middot TeO2] glass system for x=50mol MnO
determined the splitting up of a part of As ndash O ndash As Te-O-Te and the appearance of the
TeO4 (tbp) units against the loss of continuous TeO4 (tbp) network was observed
4110 Comparative study by Raman spectroscopy of xFe2O3middot(100- x)[As2O3middotBO]
vitreous systems where BO =gt TeO2 or PbO
With the increasing of iron ions content in the As2O3middotPbO glass matrix the number of
these structural units decreased due to the increase of the disorder in the studied glasses (x gt 20
mol ) and x = 50 mol Fe2O3 for xFe2O3middot(100- x)[As2O3middotTeO2] when iron ions
brought the structural units existing in glass matrices and favoured the appearace of
new bands due to bending vibrations of As ndash O ndash As
42 Comparative study by FT-IR and Raman spectroscopies of
xMOmiddot(100-x)[3B2O3middotLi2O] glasses where MO =gt MnO or Fe2O3
421 Study by FT-IR spectroscopy of xMOmiddot(100-x)[3B2O3middotLi2O] glasses
where MO =gt MnO or Fe2O3
The infrared absorption spectra obtained for xMOmiddot(1-x)[3B2O3middotLi2O] glass system
where MO =gt MnO or Fe2O3 with 0 le x le 50 mol are presented in figure 411-13 and their
structural assignments are summarized in table 43
500 1000 1500
3B2O3Li2O
Wavenumber [cm-1]
Abs
orpt
ion
[au
]
490
1400
1230
1061
698
614
460 78
6
Fig 411 FT ndash IR spectra of vitreous matrix 3B2O3middotLi2O
20
Following the infrared absorption spectra obtained for 3B2O3middotLi2O vitreous matrix
observed on eight bands ~ 1400 cm-1 ~ 1230 cm-1 ~ 1061 cm-1 ~ 786 cm-1 ~ 698 cm-
1 ~ 614 cm-1 ~ 490 cm-1 şi ~ 460 cm-1 The band at ~ 1400 cm-1 is assigned to
asymmetric stretching vibrations from BOslash3 şi BOslash2O- groups (Oslash represent oxygen atom
bridging two boron atoms) The band at ~ 1230 cm-1 is attributed to asymmetric stretching
vibrations of B ndash O bonds from triangular ortoborate BO 33 groups [23-26]
400 600 800 1000 1200 1400 1600
0
3
5
10
20
35
50
1
Wavenumber [cm-1]
Abs
orpt
ion
[ua
]
05
MnO
490
1400
1230
1061
698
614
460 78
6
Fig 412 FT ndash IR spectra of xMnOmiddot(100-x)[3B2O3middotLi2O] glasses
400 600 800 1000 1200 1400 1600
469
Wavenumber [cm-1]
Abs
orpt
ion
[ua
]
0
3
5
10
20
35
50
1
05
Fe2O3
490
1400
1230
1061
698
614
460 78
6
Fig 413 FT ndash IR spectra of x Fe2O3middot(100-x)[3B2O3middotLi2O] glasses
21
Table 43Wavenumber and the structural assignments of FT ndash IR and Raman
spectra of 3B2O3middotLi2O vitreous matrix
~ [cm 1 ] Attribution
FT ndash IR Raman FT ndash IR Raman
~ 1400 cm-1
~ 1400 cm-1
Asymmetric stretching
vibrations from BOslash3 şi BOslash2O-
groups
BOslash2O- triangles linked to
other borate triangular units
~ 1230 cm-1
Asymmetric stretching
vibrations of B ndash O bonds from
triangular ortoborate
BO 33 groups
~ 1061 cm-1
~ 1074 cm-1
Stretching vibrations of B ndash Oslash
bonds in -4BOslash tetrahedra from
tri- tetra- and penta-borate
groups
Diborate groups
~ 902 cm-1
Vibrations of orthoborate
groups
~ 786 cm-1
~ 791 cm-1
Bending vibrations of O3B ndash O
ndash BO4 bonds
Vibrations of rings with six
member to one or two BO4
tetrahedral from tri- tetra ndash
and penta ndash borate units
~ 698 cm-1
Bending vibrations of B-O-B
bonds from pentaborate groups
~ 614cm-1 Bending vibrations of O ndash B ndash O
bonds
~ 490cm-1 ~ 471cm-1 Bending vibrations of B-O-B
bonds
Isolated diborate groups
~ 460cm-1 Bending vibrations of O ndash B ndash O
bonds
22
The band at ~ 1061 cm-1 is assigned to stretching vibrations of B ndash Oslash bonds in -4BOslash
tetrahedra from tri- tetra- and penta-borate groups and the band at ~ 786 cm-1 is assigned
to bending vibrations of O3B ndash O ndash BO4 bonds The band at ~ 698 cm-1 is attributed to
Bending vibrations of B-O-B bonds from pentaborate groups The bands at ~ 614 cm-1 and
~ 460 cm-1 are assigned to bending vibrations of O ndash B ndash O bonds and the band at ~ 490 cm-
1 is assigned to bending vibrations of B-O-B bonds
From FT-IR spectra it can be concluded that the addition of manganese or iron ions in
vitreous matrices leads to the increase of the disorder degree
Also the structural changes that appeared in 3B2O3middotLi2O vitreous matrix with an
addition MnO or Fe2O3 content can be studied Ar=A4A3 ratio(A4 - relative number of -4BOslash tetrahedral borate units A3 - relative number of triangular (BOslash3 and BOslash2O-) units
0 10 20 30 40 50
010
015
020
Ar
x [mol]
MnO Fe2O3
Fig 414 The evolution of Ar ratio with the MnO or Fe2O3 content of
xMnOmiddot(100-x)[3B2O3middotLi2O] şi xFe2O3middot(100-x)[3B2O3middotLi2O] The evolution of the value of this ratio also allows a visualization of the effects
determined by the presence of the manganese or iron ions in the matrix The value Arltlt 1
indicated that BO3 is dominant related to BO4
422 Study by Raman spectroscopy of xMOmiddot(100-x)[3B2O3middotLi2O] glasses
where MO =gt MnO or Fe2O3
The Raman spectra obtained for xMOmiddot(1-x)[3B2O3middotLi2O] glass system were MO =gt
MnO or Fe2O3 with 0 le x le 50 mol are presented in figure 414-16 and their structural
assignments are summarized in table 43
Studying the Raman spectra of xMOmiddot(1-x)[3B2O3middotLi2O] glass system where MO =gt
MnO or Fe2O3 it has been observed that the absorption bands presented in vitreous matrix
gradually decreased with an increase in the manganese or iron content in both glasses system
which suggested an increase of the disorder in these vitreous systems
23
1000 2000 3000
B2O3Li2O
Wavenumber [cm-1]
Ram
an In
tens
ity [a
u]
1430
107490
279
1471
Fig 415 Raman spectra of vitreous matrix 3B2O3middotLi2O
500 1000 1500 2000 2500 3000
1430
107490
2791
0
Wavenumber [cm-1]
Ram
an In
tens
ity [a
u]
1
3
20
05
5
10
35
50
MnO
471
Fig 416 Raman spectra of xMnOmiddot(100-x)[3B2O3middotLi2O] glasses
400 600 800 1000 1200 1400 1600
Wavenumber [cm-1]
Ram
an In
tens
ity [a
u]
0
1
3
20
05
5
10
35
50
Fe2O3
1430
1074
90279
1
471
Fig 417 Raman spectra of x Fe2O3middot(100-x)[3B2O3middotLi2O] glasses
24
43 Comparative study by electron paramagnetic resonance (EPR) and magnetic
susceptibility measurements of xMOmiddot(100-x)[As2O3middotTeO2] xMOmiddot(100-x)
[As2O3middotPbO] and xMOmiddot(100-x)[3B2O3middotLi2O] glasses where MO =gt MnO or Fe2O3
431 Comparative study by electron paramagnetic resonance (EPR) of
xMnOmiddot(100-x)[As2O3middotBO] where BO =gt TeO2 or PbO
and xMnOmiddot(100-x) [3B2O3middotLi2O] glasses
In order to obtain more information regarding the behavior of manganese ions in
different vitreous matrices [3031] xMnOmiddot(100-x)[As2O3middotBO] where BO =gt TeO2 or PbO
and xMnOmiddot(100-x) [3B2O3middotLi2O] glasses were investigated by EPR spectroscopy on a large
compositional range with 0 le x le 50 mol The EPR spectra of Mn2+ for xMnOmiddot(100-
x)[As2O3middotPbO] (S1) xMnOmiddot(100-x)[As2O3middotTeO2] (S3) and xMnOmiddot(100-x)[3B2O3middotLi2O]
(S5) are presented in figure 418-20 These spectra present two absorption lines centered at gef
43 and gef 20 in all systems
The absorption line centered at gef 43 and is due to isolated Mn2+ ions [32] The
absorption line centered at gef 20 may be attributed to Mn2+ species interacting by magnetic
coupling[33] dipolar and or super exchange the last ones forming magnetic clusters [32]
The evolution of the spectra is easier to follow considering the dependence of
concentration on the EPR parameters the line - intensity (obtained as an integral of the area
under the corresponding EPR signal) J and the line - width ΔB The evolution of J and AB
reflects the structural transformations which appear in the glass matrices due to the increase of
manganese ions content
The intensity and the line - width of the resonance line from gef 43 for all
investigated systems is represented in figure 421(ab)
The intensity of the resonance line from gef 43 for all investigated glass systems
decreases due to the decrease of the isolated manganese ions numbers The line - width from
gef 43 for (S1) and (S3) systems decreases due to decrease of Mn2+ number and to the
structural disorder in glasses with the increase of MnO content For (S5) glass system the line
- width of the resonance line there is an increase in all compositional domains
The intensity of the resonance line from gef 20 can be observed as increasing up to
x=14 mol for (S1) system up to x=8mol for (S3) system and 20 mol for (S5)
system The line - width of the resonance line from gef 20 for (S1) and (S3) systems
increases up to 3 mol and 5mol for (S5) due to Mn2+ species interacting by magnetic
coupling dipole- dipole as the main broadening mechanism Over this concentration line ndash the
width of the resonance line from gef 20 is straight and it can be assumed that the
manganese ions begin to manifest super exchange magnetic interactions
25
1000 2000 3000 4000 5000
Firs
t der
ivat
ive
of a
bsor
ptio
n [u
a]
05
1
3
5
10
20
35
50
x [mol Mn2O3]amplif
B [G]
10
200
40
80
400
5
1
1
Fig 418 The EPR spectra of Mn2+ for xMnOmiddot(100-x)[As2O3middotPbO] (S1)
glass system
1000 2000 3000 4000 5000
Firs
t der
ivat
ive
of a
bsor
ptio
n [u
a]
x [mol MnO]
051
3
5
10
20
35
50
9
500
400
50
100
4
1
amplif
B [G]
1
Fig 419 The EPR spectra of Mn2+ for xMnOmiddot(100-x)[As2O3middotTeO2] (S3)
glass system
26
1000 2000 3000 4000 5000
501
B [G]
Firs
t der
ivat
ive
of a
bsor
ptio
n [u
a]
1
4
9
10
30
60
100
amplif
05
1
3
5
10
20
35
x [mol MnO]
Fe3+
Fig 420 The EPR spectra of Mn2+ for xMnOmiddot(100-x)[3B2O3middotLi2O] (S5)
glass system
0 2 4 6 8 10 12 14 16 18 20 22
x [mol]
J [ u
a]
S1 S3 S5
-2 0 2 4 6 8 10 12 14 16 18 20 22
50
100
150
200
250
300
S1 S3 S5
x [mol]
B
[G]
a b
Fig 421 The dependence on MnO content of the intensity (a) and width(b) of resonance
line at gef 43 for xMnOmiddot(100-x)[As2O3middotPbO] (S1) xMnOmiddot(100-x)[As2O3middotTeO2] (S3) şi
xMnOmiddot(100-x)[3B2O3middotLi2O] (S5) system glasses
27
0 10 20 30 40 50
x [mol]
J [ u
a]
S1 S3 S5
0 10 20 30 40 50
400
500
600
700
800
900
S1 S3 S5
x [mol]
B[G
]
a b
Fig 422 The dependence on MnO content of the intensity (a) and width b) of resonance
line at gef 20 for xMnOmiddot(100-x)[As2O3middotPbO] (S1) xMnOmiddot(100-x)[As2O3middotTeO2] (S3) and
xMnOmiddot(100-x)[3B2O3middotLi2O] (S5) system glasses
Following figure 418-20 it can be observed that (S1) and (S3) have had a similar
evolution but (S5) system presented for 05 le x le 5 mol (fig420) has a hyperfine
sextet[33] at gef 20due to Mn2+ isolated ions
432 Comparative study by magnetic susceptibility measurements of
xMnOmiddot(100-x)[As2O3middotBO] where BO =gt TeO2 or PbO and
xMnOmiddot(100-x)[3B2O3middotLi2O] glasses
The magnetic susceptibility data are in good agreement with the EPR result The
magnetic behavior of the glasses from xMnOmiddot(100-x)[As2O3middotBO] where BO =gt TeO2 (S3)
or PbO (S1) and xMnOmiddot(100-x)[3B2O3middotLi2O] (S5) glasses for 3 le x le 50 mol MnO are
presented in figure 423 - 25
For (S1) and (S3) system glasses up to x 3 mol and x 5 mol (S5) glass
system the temperature dependence of the reciprocal magnetic susceptibility obeys a Curie
law In this concentration range the manganese ions are predominantly isolated orand
participate in dipole-dipole interractions At higher concentrations the reciprocal magnetic
susceptibility obeys a Curie-Weiss law with negative paramagnetic Curie temperature (p)
characteristic to antiferromagnetic coupled ions by means of super exchange interractions(fig
426) This behavior of manganese ions is confirmed by the shape of the EPR spectra
28
100 150 200 250
2
4
6
8
10
12
14
16
18
20
22
T [K]
[
emu
mol
]-1
3 mol 5 mol 10 mol 20 mol 35 mol 50 mol
Fig423 The temperature dependence of -1 for xMnOmiddot(100-x)[As2O3middotPbO]
(S1) 3 le x le 50 mol
50 100 150 200 2500
2
4
6
8
10
12
14
16
18
20
22
3 mol 5 mol 10 mol 20 mol 35 mol 50 mol
T [K]
[
emu
mol
]-1
Fig424 The temperature dependence of -1 for xMnOmiddot(100-x)[ As2O3middotTeO2]
(S1) 3 le x le 50 mol
100 150 200 250
2
4
6
8
10
12
14
16
18
20
22
[em
u m
ol]-1
T [K]
3 mol 5 mol 10 mol 20 mol 35 mol 50 mol
Fig425 The temperature dependence of -1 for xMnOmiddot(100-x)[3B2O3middotLi2O]
(S5) 3 le x le 50 mol
29
0 10 20 30 40 50
0
20
40
60
80
100
x [mol]
-p [K
]
(S1) (S3) (S5)
Fig426Concentration dependence of (p) for sistemele xMnOmiddot(100-x)[As2O3middotPbO]
(S1) xMnOmiddot(100-x)[As2O3middotTeO2] (S3) şi xMnOmiddot(100-x)[3B2O3middotLi2O] (S5)
Using the representation 1 =f(T) the molar Curie constants CM the effective
magnetic moments and molar fraction of Mn2+(x1) şi Mn3+(x2) ions were calculated and
represented in tables 44 -6
Tabel 44 Molar Curie constants effective magnetic moments and molar fraction of Mn2+(x1) şi Mn3+(x2) ions in xMnOmiddot(100-x)[As2O3middotPbO] (S1) glasses
x
[mol MnO2] CMtimes102
[emu mol] ef
[microB] x1
[mol Mn2+O2] x2
[mol Mn3+O2] 3 1272 582 268 032 5 1979 562 343 157 10 3777 549 555 445 20 6688 517 492 1508 35 12239 502 377 3123 50 15427 496 268 4732
Tabel 45 Molar Curie constants effective magnetic moments and molar fraction of Mn2+(x1) şi Mn3+(x2) ions in xMnOmiddot(100-x)[As2O3middotTeO2] (S3)glasses
x
[mol MnO2] CMtimes102
[emu mol] ef
[microB] x1
[mol Mn2+O2] x2
[mol Mn3+O2] 3 1297 588 287 013 5 1938 556 312 188 10 3804 551 575 425 20 6766 52 549 1451 35 11148 504 441 3059 50 15528 498 358 4642
30
Tabel 46 Molar Curie constants effective magnetic moments and molar fraction of Mn2+(x1) şi Mn3+(x2) ions in xMnOmiddot(100-x)[3B2O3middotLi2O] (S5) glasses
x
[mol MnO2] CMtimes102
[emu mol] ef
[microB] x1
[mol Mn2+O2] x2
[mol Mn3+O2] 3 127 581 265 035 5 1919 554 303 197 10 3681 542 486 514 20 7215 519 53 147 35 1121 506 505 2995 50 15898 501 493 4507
433 Comparative study by electron paramagnetic resonance (EPR) of
xFe2O3middot(100-x)[As2O3middotBO] where BO =gt TeO2 or PbO and
x Fe2O3middot(100-x) [3B2O3middotLi2O] glasses
In order to obtain more information regarding the behavior of iron ions in
xFe2O3middot(100-x)[As2O3middotBO] where BO =gt TeO2 (S4) or PbO (S2) şi xFe2O3middot(100-
x)[3B2O3middotLi2O] glasses were investigated by EPR spectroscopy on a large compositional
range with 05 le x le 35 mol Fe2O3 The EPR spectra of Fe3+ in xFe2O3middot(100-
x)[As2O3middotPbO] (S2) xFe2O3middot(100-x)[As2O3middotTeO2] (S4) and xFe2O3middot(1-x)[3B2O3middotLi2O]
(S6) are presented in figure 427-29 These spectra present two absorption lines centered at
gef 43 and gef 20 up to x le 35mol Fe2O3 systems studied
The absorption line centered at gef 43 is due to isolated Fe3+ ions [34-36] The
absorption line centered at gef 20 may be attributed to Fe3+ species interacting by magnetic
coupling dipolar and or super exchange the last ones forming magnetic clusters [37-41]
The evolution of the spectra is easier to follow considering the dependence of
concentration on the EPR parameters the line - intensity (obtained as an integral of the area
under the corresponding EPR signal) J and the line - width ΔB The evolution of J and AB
reflects the structural transformations which appear in the glass matrices due to the increasing
of iron ions content
The intensity and the line - width of the resonance line from gef 43 for all
investigated systems is represented in figure 430 (a b) The intensity of the resonance line
from gef 43 increases for (S2) and (S4) up to 3 mol and up to 5 mol for (S6) then
decreases for all systems investigated A line broadening up to 3 mol from gef 43 for
these systems can be observed due to increasing of Fe3+ isolated number of ions
31
1000 2000 3000 4000 5000
40
Firs
t der
ivat
ive
of a
bsor
ptio
n [u
a]
B [G]
x [mol Fe2O3]
05
1
3
5
1020
35 2
40
20
10
10
10
amplif
Fig427 The EPR spectra of Fe3+ for xFe2O3middot(100-x)[As2O3middotPbO] (S2)
glass system
1000 2000 3000 4000 5000
100
B [G]
Firs
t der
ivat
ive
of a
bsor
ptio
n [u
a]
10080
20
50
20
20
3
05
1
5
102035
x [mol Fe2O3] amplif
Fig428 The EPR spectra of Fe3+ for xFe2O3middot(100-x)[As2O3middotTeO2] (S4)
glass system
32
1000 2000 3000 4000 5000
Firs
t der
ivat
ive
of a
bsor
ptio
n [u
a]
B [G]
3
05
1
5
10
20
35
x [mol Fe2O3]
30
50
20
20
10
30
30
amplif
Fig429 The EPR spectra of Fe3+ for xFe2O3middot(100-x)[3B2O3middotLi2O] (S6)
glass system
The intensity and the line - width of the resonance line from gef 43 for all
investigated systems is represented in figure 430 (a b)The resonance line from gef 20 is
attributed to Fe3+ ions that interact by magnetic coupling dipolar orand super exchange
interractions can be observed in all compositional domains
The intensity of the resonance line from gef 20 can be observed as increasing up to
x=35 mol for (S2) and (S6) system and 10 mol for (S4) system with increased iron
ions content The line - width of the resonance line from gef 20 increased up to 10mol
for (S2) system and up to 3 mol for (S4) and 5mol for (S6) due to Fe3+species
interacting by magnetic coupling dipole-dipole Above this concentration line - width of the
resonance line from gef 20 can be attributed to dipolar and super exchange magnetic
interactions The ΔB = f(x) dependence reflects the competion between the broadening
mechanism (dipole ndash dipole interactions the interactions between ions in diferent
valence state and structural disorder) and the narrowing ones (super exchange
interactions)
33
0 5 10 15 20 25 30 35 40
x [mol]
J [ u
a]
S2 S4 S6
a)
0 5 10 15 20 25 30 35 4040
60
80
100
120
140
160
180
200
220 S2 S4 S6
B[G
]
x [mol]
a b
Fig 430 The dependence on Fe2O3 content of the intensity (a) and width (b) of
resonance line at gef 43 for xFe2O3middot(100-x)[As2O3middotPbO] (S2)
xFe2O3middot(100-x)[As2O3middotTeO2] (S4) and xFe2O3middot(100-x)[3B2O3middotLi2O] (S6) glasses
0 5 10 15 20 25 30 35 40
x [mol]
J [ u
a]
S2 S4 S6
a)
0 5 10 15 20 25 30 35 40
200
400
600
800
1000
1200
1400
1600
x [mol]
B
[G] S2
S4 S6
a b
Fig 431 The dependence on Fe2O3 content of the intensity (a) and width (b) of
resonance line at gef 20 for xFe2O3middot(100-x)[As2O3middotPbO] (S2)
xFe2O3middot(100-x)[As2O3middotTeO2] (S4) and xFe2O3middot(100-x)[3B2O3middotLi2O] (S6) glasses
34
434 Comparative study by magnetic susceptibility measurements of
xFe2O3middot(100-x)[As2O3middotBO] where BO =gt TeO2 or PbO and
xFe2O3middot(100-x) [3B2O3middotLi2O] glasses
The magnetic susceptibility data are in good agreement with the EPR result The magnetic
behavior of the glasses xFe2O3middot(100-x)[As2O3middotPbO] (S2) xFe2O3middot(100-x)[As2O3middotTeO2]
(S4) and xFe2O3middot(100-x)[3B2O3middotLi2O] (S6) for 3 x 50 mol Fe2O3 are presented in
figure 432 - 34
For (S2) glass systems up to x 10 mol x 3 mol (S5) glass systems and x 5
mol (S6) glass systems the temperature dependence of the reciprocal magnetic susceptibility
obeys a Curie law In this concentration range the iron ions are predominantly isolated orand
participate in dipole-dipole interactions At higher concentrations the reciprocal magnetic
susceptibility obeys a Curie-Weiss law with negative paramagnetic Curie temperature (p)
characteristic to antiferromagnetic coupled ions by means of super exchange interactions(fig
435) This behavior of iron ions is confirmed by the shape of the EPR spectra
80 100 120 140 160 180 200 220 240 260 2800
1
2
3
4
5
6
7
8
9
10
11
[
emu
mol
]-1
T [K]
3 mol 5 mol 10 mol 20 mol 35 mol 50 mol
Fig432 The temperature dependence of -1 for xFe2O3middot(100-x)[As2O3middotPbO] (S2)
3 x 50 mol
35
80 100 120 140 160 180 200 220 240 260 2800
1
2
3
4
5
6
7
8
9
10
T [K]
[
emu
mol
]-1
3 mol 5 mol 10 mol 20 mol 35 mol 50 mol
Fig433 The temperature dependence of -1 for xFe2O3middot(100-x)[As2O3middotTeO2] (S4)
3 x 50 mol
80 100 120 140 160 180 200 220 240 260 2800
1
2
3
4
5
6
7
8
9
10
11
3 mol 5 mol 10 mol 20 mol 35 mol 50 mol
T [K]
[
emu
mol
]-1
Fig434 The temperature dependence of -1 for xFe2O3middot(100-x)[3B2O3middotLi2O] (S6)
3 x 50 mol
36
0 10 20 30 40 50
0
10
20
30
40
50
x [mol]-
p [K]
(S2) (S4) (S6)
Fig435Concentration dependence of (p) for sistemele xFe2O3middot(100-x)[As2O3middotPbO] (S2) xFe2O3middot(100-x)[As2O3middotTeO2] (S4) and xFe2O3middot(100-x)[3B2O3middotLi2O] (S6)
for 3 x 50 mol Fe2O3
Using the representation 1 = f(T) the molar Curie constants CM the effective
magnetic moments and molar fraction of Fe3+(x1) şi Fe2+(x2) ions were calculated and
represented in tables 47-9
Table 47 Molar Curie constants effective magnetic moments and molar fraction of
Fe3+(x1) şi Fe2+(x2) ions in xFe2O3middot(100-x)[As2O3middotPbO] glasses (S2)
x [mol Fe2O3]
CMtimes102
[emu mol] ef
[microB] x1
[mol Fe23+O3]
x2 [mol Fe2
2+O3] 3 2526 58 261 039 5 393 56 332 168 10 7326 541 476 524 20 13459 519 53 147 35 23364 516 829 2671 50 32154 507 767 4233
Table 48 Molar Curie constants effective magnetic moments and molar fraction of
Fe3+(x1) şi Fe2+(x2) ions in xFe2O3middot(100-x)[As2O3middotTeO2] glasses (S4)
x [mol Fe2O3]
CMtimes102
[emu mol] ef
[microB] x1
[mol Fe23+O3]
x2 [mol Fe2
2+O3] 3 2571 585 277 023 5 4016 566 363 137 10 7911 562 686 314 20 14992 521 643 929 35 22676 509 601 2899 50 30959 497 313 4687
37
Table 49 Molar Curie constants effective magnetic moments and molar fraction of Fe3+(x1) şi Fe2+(x2) ions in xFe2O3middot(100-x)[3B2O3middotLi2O] glasses (S6)
The results allowed to consider that the magnetic properties of the studied glasses can
be explained through magnetic interractions between Fe3+ - Fe3+ Fe3+- Fe2+ and Fe2+- Fe2+ that
explain the dependences of RPE parameters concentration
SELECTED CONCLUSIONS
In this thesis xMOmiddot(100-x)[As2O3middotTeO2] xMOmiddot(100-x) [As2O3middotPbO] and
xMOmiddot(100-x)[3B2O3middotLi2O] glasses where MO =gt MnO or Fe2O3 were comparatively
studied in 0 le x le 50 mol The structural modifications of investigated glass matrices were
comparatively followed in function of the manganese or iron ions on the investigated glass
matrices were followed
The study by FT-IR spectroscopy shows that the evolution of the spectra of
xMnOmiddot(100-x) [As2O3middotPbO] with the addition and the increasing of the MnO content suggest
that the manganese ions break up a part of As ndash O ndash As Pb ndash O ndash Pb and probably of As ndash O ndash
Pb bonds The addition of MnO in the As2O3middotPbO glass matrix is leading to a disordering of
the glasses structure with the increasing of the MnO content
The evolution of the absorption bands for FT ndash IR spectrum of xFe2O3middot(1-x)
[As2O3middotPbO] glasses are determined by the addition of Fe2O3 content It can be observed to
shift the bands assigned As ndash O ndash As vibrations from AsO3 units due to changing to length As
ndash O ndash As bonds and interne angles of AsO3 units disappears PbO4 units and appears FeO6
units The addition of Fe2O3 in the As2O3middotPbO glass matrix determined a disordering of the
glasses structure with the increasing of the Fe2O3 content
From FT-IR absorption spectra of the investigated xMOmiddot(100-x)[As2O3middotTeO2] glasses
system where MO =gt MnO or Fe2O3 it can be observed that the addition and increasing of
manganese ions concluded the contraction of As-O-As bonds from totally symmetric
x [mol Fe2O3]
CMtimes102
[emu mol] ef
[microB] x1
[mol Fe23+O3]
x2 [mol Fe2
2+O3] 3 2542 582 268 032 5 3943 561 338 162 10 7423 544 506 494 20 13568 520 549 1451 35 23094 513 731 2769 50 31746 503 584 4416
38
stretching vibrations of AsO3 units for x ge10 mol there can be an increase in number of As-
O-As bonds from AsO3 units orand a length these linkage to doubly degenerate stretching
vibrations of AsO3 units and a stretching vibration mode of TeO3 tp with NBO It can be
remarked from the FT-IR absorption spectra the gradual transformation of symmetric
stretching vibration mode of Te-O bonds from TeO3 units in TeO4 (tbp) units and the presence
of MnO2 units Once with the addition of iron ions the xFe2O3middot(100- x)[As2O3middotTeO2]
glasses behave like xMnOmiddot(100-x)[As2O3middotTeO2] glasses but in this system the
appearance of FeO6 units can be seen
From FT-IR spectra in xMOmiddot(100-x)[3B2O3middotLi2O] glasses where MO =gt MnO or
Fe2O3 can be concluded that the addition of manganese or iron ions in vitreous matrices leads
to the increase of the disorder degree
The study by Raman spectroscopy shows that the evolution of the spectra the addition
of MnO in the [As2O3middotPbO]glass matrix determined an order degree of the vitreous matrix
The intensity of the bands attributed vibrations As ndash O ndash As bonds from As2O units and
bending vibrations of As ndash O ndash As from As2O units shift to a higher wave length that suggests
an increase in the As2O units comparative to AsO3 units With the increase of iron ions content
in the As2O3middotPbO glass matrix the number of these structural units decreases due to the
increasing of the disorder in the studied glasses
With the increasing of manganese content in As2O3TeO2 glass matrix the intensity
of these bands is increasing showing that the manganese content favorites the formation of
TeO4 (tbp) and TeO3 (tp) units For high concentrations of iron ions in xFe2O3middot(100-
x)[As2O3 TeO2] system of glasses the number of As-O-As linkages appear in Raman
spectrum due to stretching vibrations of As-O-As and vibrations of the continuous TeO4 (tbp)
network show a significant decrease
Studying the Raman spectra of xMOmiddot(1-x)[3B2O3middotLi2O] glass system where MO =gt
MnO or Fe2O3 it has been observed that the absorption bands presented in vitreous matrix
gradually decreased with an increase in the manganese or iron content in both glasses system
which suggested an increase of the disorder in these vitreous systems
The EPR spectra presents the behavior of manganese or iron ions in different vitreous
matrices xMOmiddot(100-x)[As2O3middotBO] where MO=gtMnO or Fe2O3 and BO =gt TeO2 or
PbO and xMOmiddot(100-x) [3B2O3middotLi2O] Glasses were investigated by EPR spectroscopy on a
large compositional range with 0 le x le 50 mol The absorption line centered at gef 43 and
is due to isolated Mn2+ ions The absorption line centered at gef 20 may be attributed to
Mn2+ species interacting by magnetic coupling dipolar and or super exchange the last ones
forming magnetic clusters The EPR spectra of Fe3+ in xFe2O3middot(100-x)[As2O3middotPbO]
xFe2O3middot(100-x)[As2O3middotTeO2] and xFe2O3middot(1-x)[3B2O3middotLi2O] are presented two absorption
lines centered at gef 43 and gef 20 up to x le 35mol Fe2O3 systems studied
39
The absorption line centered at gef 43 is due to isolated Fe3+ ions The absorption
line centered at gef 20 may be attributed to Fe3+ species interacting by magnetic coupling
dipolar and or super exchange the last ones forming magnetic clusters
The evolution of the spectra is easier to follow considering the dependence of
concentration on the EPR parameters the line - intensity (obtained as an integral of the area
under the corresponding EPR signal) J and the line - width ΔB The evolution of J and AB
reflects the structural transformations which appear in the glass matrices due to the increase of
manganese ions content
The magnetic susceptibility data are in good agreement with the EPR result The
magnetic behavior of the glasses from xMnOmiddot(100-x)[As2O3middotBO] where BO =gt TeO2 (S3)
or PbO (S1) and xMnOmiddot(100-x)[3B2O3middotLi2O] (S5) glasses for 3 le x le 50 mol MnO
For (S1) and (S3) system glasses up to x 3 mol and x 5 mol (S5) glass
system the temperature dependence of the reciprocal magnetic susceptibility obeys a Curie
law In this concentration range the manganese ions are predominantly isolated orand
participate in dipole-dipole interractions At higher concentrations the reciprocal magnetic
susceptibility obeys a Curie-Weiss law with negative paramagnetic Curie temperature (p)
characteristic to antiferromagnetic coupled ions by means of super exchange interractions This
behavior of manganese ions is confirmed by the shape of the EPR spectra Using the
representation 1 =f(T) the molar Curie constants CM the effective magnetic moments
and molar fraction of Mn2+(x1) şi Mn3+(x2) ions were calculated The magnetic susceptibility
data are in good agreement with the EPR result
The magnetic behavior of the glasses xFe2O3middot(100-x)[As2O3middotPbO] (S2)
xFe2O3middot(100-x)[As2O3middotTeO2] (S4) and xFe2O3middot(100-x)[3B2O3middotLi2O] (S6) for 3 x 50
mol Fe2O3 are presented For (S2) glass systems up to x 10 mol x 3 mol (S5)
glass systems and x 5 mol (S6) glass systems the temperature dependence of the
reciprocal magnetic susceptibility obeys a Curie law In this concentration range the iron ions
are predominantly isolated orand participate in dipole-dipole interactions At higher
concentrations the reciprocal magnetic susceptibility obeys a Curie-Weiss law with negative
paramagnetic Curie temperature (p) characteristic to antiferromagnetic coupled ions by
means of super exchange interactions(fig 435) This behavior of iron ions is confirmed by the
shape of the EPR spectra Using the representation 1 = f(T) the molar Curie constants
CM the effective magnetic moments and molar fraction of Fe3+(x1) şi Fe2+(x2) ions were
calculated
40
REFERENCES
Chapter 1
[1] I Ardelean bdquoIntroducere icircn studiul materialelor oxidice cu structură vitroasă EdNapocaStar Cluj Napoca 2002 [2] G Srinivasarao N Veeraiah J All Com 327 52-65(2001) [3] G Srinivasarao N Veeraiah J Phys Chem Solids 63705-717(2002) [4] DBecherescu VCristea FMarx IMenessz FWinter Chimia stării solide Ed Şt şi Encicl Bucucureştivol 1 1983 [5] J Wong CAAngell Glass-Structure by Spectroscopy Dekker Inc New York 1976 [6] BEWarren HKKrutter O Morningstat J Am Ceram Soc 19 202 (1936) [7] LLSperry JD Mackenzie Phys Chem Glasses 9 91 (1968) [8] WLKonijnendijk JMStevels J Non-Cryst Solids 18 307 (1975) [9] FCEversteyn JM Stevels HJ Naterman Phys Chem Glasses 1 134 (1963) [10] G Fuxi Optical and Spectroscopie Properties of Glass Springer-Verlag Shanghai Scientific Technical Pub Shanghai 1991 [11] YDYiannopoulos GDChryssikos EIKamitsos Phys Chem Glasses 42(3) 164 (2001) [12] MGFerreira da Silva BFOCosta J Non-Cryst Solids 293-295 534 (2001) [13] RYordanova YDimitriev VDimitriev S Kassabov DKlissurski JNon-Cryst Solids 201 141 (1996) [14] W L Konijnendijk J M Stevels J Non-Cryst Solids 18 307 (1980) [15] M Iron M Couzi ALevasseur JBrethous JSolidState Chem 31 285 (1980) [16] TFurukawa WBWhite PhzsChemGlasses 21 85 (1980) [17] E I Kamitsos M A Karakassides GD Chryssikos J Phys Chem 90 4528 (1986) [18] E I Kamitsos M A Karakassides GD Chryssikos J Phys Chem 91 1073 (1987) [19] TWBril Philips Res Rep Suppl 2 117 (1976) [20] E I Kamitsos M A Karakassides GD Chryssikos J Phys Chem 30 203 (1989) [21] BNMeera JRamakrishna J Non-Cryst Solids 159 1 (1993) [22] KWitke THubert PReich JRamanSpectr 24 407 (1993) [23] E I Kamitsos M A Karakassides Phys Chem Glasses 30 19 (1989) [24] MPeteanu Teză de doctoratrdquo Universitatea Babeş-Bolyairdquo Cluj Napoca (1989) [25] PCTaylor PJBray JPhys Chem Solids 33 43 (1972) [26] IArdelean MPeteanu GhIlonca DPop Solid State Commun 33 653 (1980) [27] AV De Wijn RE Van Balderen JKemPhys 46 4 (1967) [28] DL Griscom RE Griscom J Phys Chem Glasses 12 19 (1971) [29] JWH Schreurs JChem Phys 69 2151 (1978) [30] AlNicula M Peteanu IArdelean Studia Univ Babeş-Bolyai Physica 2 65 (1979) [31] M Peteanu IArdelean SFilip ITodor GSalvan Studia Univ Babeş-Bolyai Physica XL 2 9 (1995) [32] IArdelean M Peteanu SFilipV Simon ITodor Solid State Commun 105 (5) 339 (1998) [33] SKMendiratta EGuedes de Sousa JMatSci Lett7 733 (1988) [34] IArdelean M Peteanu SFilip V Simon GGyorffy Solid State Commun 102 (4) 341 (1997) [35] IArdelean M Peteanu SFilip V Simon FCiorcas ITodor JMagnMagn Mat 196-197 257 (1999) [36] JKliava RBerger YServant JEmery JMGreneche JTrokss J Non-Cryst Solids 202 205 (1996) [37] LDBogomolova NA Krasilnikova VLBogdanov VDKhaliev VV Mitrofanov J Non-Cryst Solids 188 130 (1995) [38] DLoveridge SPark PhysChem Glasses 12 19 (1971) [39] IArdelean G Salvan M Peteanu V Simon FCiorcas Mod PhysLett B 13 (22-23) 801 (1999)
41
[40] JLRao AMuraly EDRao J Non-Cryst Solids 202 215 (1996) [41] CPrakash S Husain RJ Singh SMollah JAlloys Compon 326 47 (2001) [42] EGuedes de Sousa SKMendiratta JMMachado Da Silva Portugal Phys 17 (3-4) 203 (1986) [43] TCastner GSNewell WCHolton CP Slichter JChem Phys 32 668 (1960) [44] SPChaudhuri SKPatra JMatSci 35 4735 (2000) [45] IArdelean HH Qiu HSakata Matt Lett 32 335 (1997) Chapter 2 [1] J Wong C A Angel Glass Structure by Spectroscopy Marcel Dekker inc New-York 1976 [2] I Ardelean bdquoIntroducere icircn studiul materialelor oxidice cu structură vitroasă EdNapocastar Cluj-Napoca 2002 [3] N Avram GH Mateescu Spectroscopia icircn infraroşu Aplicaţii icircn chimia organică Ed Tehnică Bucureşti 1968 [4] TIliescu Spectroscopie optică moleculară vibraţională şi electronică Ed Casa Cărţii de Ştiinţă Cluj- Napoca 2000 [5] S Aştilean bdquoMetode şi tehnici moderne de spectroscopie optică Ed Casa Cărţii de Ştiinţă Cluj - Napoca 2002 p 5 [6] I Ursu Rezonanţă Electronică de Spinrdquo Ed AcademieiBucureşti (1965) [7] CHHurd ContempPhys 23 (5) 469 (1982) [8] GWAnderson WDCompton JChemPhys52 6166 (1970) [9] MS Seehra GSrinivasan Landolt-Bornstein (New Series) SubVolume F3 Springer-Verlag Berlin 1994 [10] GToulouse ContempPhys 2115 (1977) [11] NMMurayMagnetic susceptybility EdInterscience New York P1773 1963 [12] JBGoodenough Magnetism and Chemical Bond EdInterscience New York 1963 [13] IArdelean G Salvan M Peteanu V Simon FCiorcas Mod PhysLett B 13 (22-23) 801 (1999) [14] IArdelean MPeteanu R Ciceo Lucăcel Studii de rezonanţă paramagnetică electronică şi magnetice ale unor ioni 3d icircn sticle pe bază de B2O3 Ed Presa Univesitară Clujeană 2005 [15] IArdelean PhysStatSol (b) 87K137 (1978) [16] IArdelean Solid State Commun 31 75 (1979) [17] EJFrieble LKWilson AWDozier DLKinser PhysStatSol (b) 45 323 (1971) [18] DWMoon JMAitken RKMcCrone GS Ciloszik PhysChe Glasses 16 (5) 91 (1975) [19] SFilip Teză de doctorat UnivBabeş-Bolyai Cluj Napoca 1996 [20] CJSchinkel GWRathenou Physics of Non-Crystaline Solids North Holland Publ Co Amsterdam 215 1965 [21] EJFrieble LKWilson NCKoon DLKinser JAm Ceram Soc 57-237 (1974) [22] RJLandry JT Fournier CGYoung JChemPhys 46 1285 (1967) [23] WSimpson PhysStatSolidi b40 207 (1970) [24] RHasegawa PhysRevB b(5) 1631 (1971) [25] IArdelean GhIlonca MPeteanu Solid State Commun 52 145 (1984) [26] IArdelean GhIlonca OCozar J Physique 49 C8 1107 (1988) Chapter 3 [1] LFBates Modern Magnetism p133 Cambridge University Press London 1962 [2] IArdelean GhIlonca DBarbos Solid State Commun 40 769 (1981) [3] EBurzo IUrsu DUngur IArdelean JMatSci 15 581 (1980) [4] EBurzo IUrsu DUngur IArdelean MatResBull 15 1273 (1980) [5] DLGriscom Glass Science and Technology 48 151 (1990) [6] PJBray AH Silver Modern aspects of the vitreous state vol1 Butterworth
42
London 1960 [7] IArdelean Teza de doctorat UnivBabeş-Bolyai Cluj Napoca 1979 [8] SAştilean bdquoMetode şi tehnici moderne de spectroscopie opticărdquo EdCasa Cărţii de Ştiinţă Cluj ndash Napoca 2002 p5 [9] IArdelean RCiceo-Lucăcel ldquoFizica şi Tehnologia Materialelor Oxidice Lucrări Practicerdquo Ed Univ ldquoBabeş-Bolyairdquo Cluj-Napoca 2000 [10] VPop IChicinaş NJumate Fizica materialelor Metode experimentalerdquo EdPresa Universitară Clujeană 2001 [11] IUrsu Rezonanţă electronică de spinrdquo EdAcademiei Bucureşti 1965 Chapter 4 [1] I Ardelean S Lupşor D Rusu Solid State Sci 10 1384(2008) [2] I Ardelean S Lupşor D Rusu trimis spre publicare la Physica B decembrie 2009 [3] P Tarte Spectrochim Acta 18 467 (1962) [4] R A Condrate J Non ndash Cryst Solids 84 26 (1986) [5] G Srinivasarao N Veeraiah Phys Stat Sol (a) 191 370(2002) [6] G Srinivasarao N Veeraiah J Phys Chem Solids 63 705(2002) [7] G Srinivasarao N Veeraiah J All Com 327 52 (2001) [8] DK Durga N Veeraiah Bull Mater Sci 24 (4) 421 (2001) [9] F F Bentley L D Smithson A L Rozek InfraredndashSpectra and Characteristic Frequencies 700-300 cm-1 Interscience New York 1968 p 103 [10] O Noguera T Merle-Mejean AP Mirgorodsky MB Smirnov P Thomas J-C Champarnaud-Mesjard J Non-Cryst Solids 330 50 (2003) [11] BVR Chowdari KL Tan Fang Ling Solid State Ionics 113 ndash 115 711(1998) [12] C Jiang J Zhang H Mao F Gan Glass Technol 39(6) 200(1998) [13] MR Sahar K Sulhadi MS Rohani J Mater Sci 42 824(2007) [14] C Horea D Rusu I Ardelean J Mater Sci Mater Electron 20 905(2009) [15] GE Rachkovskaya GB Zakharevich J Appl Spectrosc 74 86(2007) [16] I Ardelean S Lupşor D Rusu trimis spre publicare la Journal of Materials Science Materials in Electronics decembrie 2009 [17] I Ardelean S Lupşor D Rusu trimis spre publicare la Modern Physics Letters B decembrie 2009 [18] R Iordanova Y Dimitriev V Dimitrov S Kassabov D Klissurski J Non ndash Cryst Solids 231 227 (1998) [19] R Iordanova Y Dimitriev S Kassabov D Klissurski J Non ndash Cryst Solids 204 141 (1996) [20] J O Jensen S J Gilliam A Banerjee D Zeroka S J Kirkby C N Merrow J Mol Struct (Theochem) 664 145 (2003) [21] G N Papatheodorou S A Solin Solid State Commun 16 5 (1975) [22] BVR Chowdari KL Tan Fang Ling J Mat Sci 35 2015 (2000) [23] R C Lucacel C Marcus V Timar I Ardelean Solid State Sci 9 850 (2007) [24] CP Varsamis EI Kamitsos GD Chryssikos Solid State Ionics 136ndash137 1031 (2000) [25] Sherief M Abo-Naf Fatma H El Batal Moenis A Azooz Mat Chem Phys 77 846 (2002) [26] SG Motke SP Yawale SS Yawale Bull Mater Sci 25 (10) (2002) [27] R Akagi N Ohtori N Umesaki J Non ndash Cryst Solids 293 471(2001) [28] E I Kamitsos M A Karakassides G D Chryssikos J Phys Chem 91(5) 1073 (1987) [29] H Ushida Y Iwadate T Hattori S Nishiyama K Fukushima Y Ikeda M Yamaguchi M Misawa T Fukunaga T Nakazawa S Jitsukawa J Alloys Compd 377 167 (2004) [30] I Ardelean F Ciorcas M Peteanu S Lupşor G Salvan Balkan Phys Lett 5 860 (1997)
43
[31] I Ardelean M Peteanu V Simon O Cozar F Ciorcas S Lupşor J Magn Magn Mater 196 253 (1999) [32] IArdelean MPeteanu GhIlonca Phys Stat Sol (a) 58 K33(1980) [33] IArdelean MPeteanu R Ciceo-Lucăcel ldquoStudii de rezonanţă paramagnetică electronică şi magnetice ale unor ioni 3d icircn sticle pe bază de B2O3rdquo Ed Presa Univ Clujeană Cluj Napoca 2005 p 171 [34] JLRao AMuraly EDRao J Non-Cryst Solids 202 215 (1996) [35] RPSChakradhar AMurali JLRao Optical Mat 10 109 (1998) [36] IArdelean MPeteanu SFilip VSimon GGyorffy Solid State Commun 102(4) 341 (1997) [37] IArdelean MPeteanu VSimon SFilip FCiorcaş ITodor J Magn Magn Mat 196-197 257 (1999) [38] IArdelean GSalvan MPeteanu VSimon CHimcinschi FCiorcas Mod Phys Lett B 13(22-23) 801 (1999) [39] IArdelean HHQiu HSakata Mat Lett 32 335 (1997) [40] SPChaudhuri SKPatra J Mat Sci 35 4735 (2000) [41] I Ardelean M Peteanu V Simon G Salvan J Mat Sci Technol 18 (3) 1 (2002)

4
43 Comparative study by electron paramagnetic resonance (EPR) and
magnetic susceptibility measurements of xMOmiddot(100-x)[As2O3middotTeO2] xMOmiddot(100-x)
[As2O3middotPbO] şi xMOmiddot(100-x)[3B2O3middotLi2O] glasses where MO=gt MnO or Fe2O3 88
431 Comparative study by electron paramagnetic resonance (EPR) of
xMnOmiddot(100-x)[As2O3middotBO] where BO =gt TeO2 or PbO and xMnOmiddot(100-x)
[3B2O3middotLi2O] glasses 88
432 Comparative study by magnetic susceptibility measurements of
xMnOmiddot(100-x)[As2O3middotBO] where BO =gt TeO2 or PbO nd xMnOmiddot(100-x)
[3B2O3middotLi2O] glasses 93
433 Comparative study by electron paramagnetic resonance (EPR) of
xFe2O3middot(100-x)[As2O3middotBO] where BO =gt TeO2 or PbO and x Fe2O3middot(100-x)
[3B2O3middotLi2O] glasses 98
434 Comparative study by magnetic susceptibility measurements of
xFe2O3middot(100-x)[As2O3middotBO] where BO =gt TeO2 or PbO and x Fe2O3middot(100-x)
[3B2O3middotLi2O] glasses 104
References 110
CONCLUSIONS 112
5
INTRODUCTION
Glasses are noncrystaline solid materials that have a disordered structure but have a
local order The study of materials with vitreous structures gained a special attention due to
their manifold applications in domains of science and technology The oxide glasses unfold a
large variety of properties due to the variety of their compounds these glasses have wide
technological applications
This thesis work is focused on characterizing the structure the optic and magnetical
properties of arsenolite and borate glasses The study presented in this thesis has as objective
the obtaining of new experimental data and the clarification of the physical phenomena which
determine the structural behavior of As2O3 and B2O3 based glasses doped with manganese or
iron ions In order to obtain this information of xMOmiddot(100-x)[As2O3middotTeO2] xMOmiddot(100-
x)[As2O3middotPbO] and xMOmiddot(100-x)[3B2O3middotLi2O] where MO =gt MnO or Fe2O3 glass
systems with 0 lt x lt 50 mol MnO or Fe203 they were prepared and investigated by x - ray
Diffraction FT - IR spectroscopy Raman spectroscopy electron paramagnetic resonance
(EPR) and magnetic susceptibility measurements
The thesis is structured in four chapters The first chapter presents on literature basis
the main results regarding the structure and the properties of As2O3 and B2O3 based glasses
Chapter 2 presents theoretical and experimental general aspects regarding the iron and
manganese behavior using the IR absorption Raman spectroscopies electron paramagnetic
resonance and magnetic susceptibility Chapter 3 describes the experimental techniques used in
the studies of glasses The processing and preparation of the samples are presented Chapter 4
presents and discusses the experimental results obtained for the investigated glasses In the
end the general conclusions which emphasize the most important results of this thesis are
presented
CHAPTER 1 THE STUDY OF THE STRUCTURE OF As2O3 AND B2O3 BASED
GLASSES
As2O3 and B2O3 are the most important glass forming oxides and have been
incorporated into various kinds of glass system in order to obtain the desired physical and
chemical properties for both scientific and industrial applications As2O3 is a very strong glass
formation having a configuration based on pyramidal AsO3 units determined by a special
dynamics on the As and O bonds unique properties of the glass systems [1-3] The properties
of the glasses based the B2O3 are due to the fact that the boron atom can assume triangular
6
and tetrahedral coordination and also to the different ways through which the borate buildings
units can be linked together [4-9]
The behavior of various borate species in the glass structure is determined by the nature
of modifier oxides (TeO2 PbO etc) In most binary borate glasses the glass properties change
almost linearly with composition [10-17] In binary borate glasses the properties of these show
a major deviation from linearity which depends on modifier oxide The structural reasons for
this is generally due to the change in the coordination of boron atom from 3 to 4 and back
again Many technological applications of these glasses depend of this effect since is produces
many improvements [18-23]
The introduction of MnO [24-32] or Fe2O3 [33-45] into diamagnetic glasses transform
them into paramagnetic glasses The introduction of iron and manganese in small percentages
modifies the physical properties of the glasses and the material is more accessible for a
complete structural characterization
In order to extend the available information concerning the interesting class of As2O3
and B2O3 based glasses we investigated glasses by means of different physical methods We
obtained valuable information concerning the structure and structural changes of the glasses
that occur with the addition of transitional oxide metals
CHAPTER 2 METHODS USED IN THE STUDY OF STRUCTURE AND
PROPERTIES OF OXIDE GLASSES
In this chapter some of the methods used in the investigation of the structure and
properties of vitreous systems are presented The study of the structure and properties of oxide
glasses with transitional metals ions IR and Raman spectroscopies electron paramagnetic
resonance and magnetic susceptibility measurements were chosen as investigation methods
The electromagnetic radiation (EM) with frequencies between 4000 and 400 cm -1 called
infrared radiation (IR) is used to obtain information connected to the structure of the
compound and as an analytic method to test the purity of the compound Its application in
organic chemistry is known as IR spectroscopy The radiation is absorbed by organic
molecules and converted in molecular vibration energy When the radiant energy coincides
with a specific molecular vibration the absorption appears The wave length at which the
radiation is absorbed by the organic molecule gives information regarding the functional
groups presented in the molecule [1-4]
The Raman spectroscopy brings useful contributions to the molecular vibrations study
The interraction mechanism of electromagnetic radiation with the molecular vibration which
forms the Raman spectroscopy theoretical basis differs from the one of the process which
forms the IR spectroscopy theoretical basis [4]
7
Another method used in the investigation of the glass system is the electron paramagnetic
resonance (RPE) This method is one of the most powerful techniques for local order
investigation RPE is a method widely used to describe the fundamental states and to
characterize the vicinities effect on the energetic levels of the paramagnetic centers The
method consists in the study of the electronic split levels of the atoms in the presence of an
external magnetic field [6] The Mn2+ EPR spectra are characterized by resonance absorptions
at gef 43 gef 33 and gef 20 The resonance line centered at gef 43 is
corresponding to the isolated Mn2+ ions The line from gef 20 is attributed to Mn2+ ions
involved in magnetic interactions
The Fe3+ EPR spectra are characterized by resonance absorptions at g 97 g 6 g 43
and g 20 The resonance line from g 97 is related to Fe3+ ions disposed in rhombic
environment The resonance line at g 6 was assigned to an axial distortion of the
paramagnetic ions neighborhood The resonance line at g 43 is corresponding to the isolated
Fe3+ ions situated in octahedral rhombic or tetragonal symmetric distorted neighborhoods The
line from gef 20 is attributed to Fe3+ ions involved in magnetic interactions
Along with the EPR spectroscopy the magnetic susceptibility measurements provide
useful information about the valence state and the interaction involving the transitional metal
ions in vitreous materials [7-10]
Different vitreous systems with manganese or iron ions were intensively studied by
magnetic susceptibility measurements to determine the magnetic behavior and the valence
states of these ions in these systems It was observed that the presence of the manganese or iron
ions in different valence states depends on the chemical composition of the vitreous matrix on
the valence of the vitreous network former and modifications and on the preparation of the
environment The magnetic properties of the oxide glasses with manganese or iron ions were
assigned to the antiferromagnetic couple between Mn2+-Mn2+ Mn2+-Mn3+ and Mn3+-Mn3+
[19-26] or Fe -Fe3+ Fe2+-Fe2+ and Fe3+-Fe2+ ions [11-18]
CHAPTER 3 EXPERIMENTAL TECHNIQUES
We have prepared glasses of the xMOmiddot(100-x)[As2O3middotTeO2] xMOmiddot(100-
x)[As2O3middotPbO] şi xMOmiddot(100-x)[3B2O3middotLi2O] glass structure where MO =gt MnO or Fe2O3
with 0 lt x lt 50 mol used components of reagent grade purity MnCO3 Fe2O3 As2O3
H3BO3 PbO Li2CO3 şi TeO2 in suitable proportions to obtain the desired composition The
mixtures were melted in sintered corundum crucibles introduced in an electric furnace directly
at 1250 C and kept for 5 minutes at this temperature They were quickly cooled at room
temperature by pouring onto stainless steel plates
The structure of the samples was analyzed by means of x-ray Diffraction using powders
with a Bruker D8 Advanced diffract meter
8
The FT - IR spectra have been recorded using a Bruker Equinox 55 with a spectral range
between 4000 cm -1 and 370 cm -1 A MIR GLOBAR generator cooled with air was used The
detection was carried out with a DLATGS detector with a KBr window The spectral
resolution was about 05 cm1 The samples were prepared using KBr pellet technique
The Raman spectra were recorded on bulk samples at room temperature using an
integrated FRA 106S Raman module attached to Bruker Equinox 55 with a spectral range
from 3600 cm -1 to 70 cm -1 An NdYAG laser with an output power of 500 mW and a 1064
nm radiation was used The detection was carried out with an ultra sensitive D418-T detector
cooled with liquid nitrogen The spectral resolution was about 1 cm1
The EPR spectra were obtained at room temperature with an Adani Portable EPR
Spectrometer PS8400 in X-frequency band (94 GHz) For these measurements equal
quantities of powders from the investigated samples closed in glass tubes were used
Magnetic susceptibility measurements were performed on a Faraday type balance in the 80
- 300 K temperature range The sensitivity of the equipment was 10-7 emug
CHAPTER 4 RESULTS AND DISCUSSION REGARDING THE STUDY OF
xMOmiddot(100-x)[As2O3middotTeO2] xMOmiddot(100- x)[As2O3middotPbO] şi xMOmiddot(100-x)[3B2O3middotLi2O]
GLASS STRUCTURE WHERE MO =gt MnO or Fe2O3
In this chapter the results obtained by following the study of the structure and
properties of oxide glasses with transitional metals ions by FT- IR and Raman spectroscopies
electron paramagnetic resonance and magnetic susceptibility measurements are presented The
structural changes and magnetic properties with the manganese and iron content were
followed
41 Comparative study by FT-IR and Raman spectroscopies of xMOmiddot(100-
x)[As2O3middotTeO2] xMOmiddot(100- x)[As2O3middotPbO] şi xMOmiddot(100-x)[3B2O3middotLi2O] glasses
where MO =gt MnO or Fe2O3
411 Comparative study by FT-IR spectroscopy of As2O3middotTeO2 and
As2O3middotPbO vitreous matrices
In order to obtain new information regarding the role of the modifier in the
formation of vitreous matrices comparative studies by FT-IR spectroscopy were made
The FT-IR spectroscopy is represented in figure 41(ab) The wave length and the
structural assignments of FT ndash IR spectra of As2O3middotPbO and As2O3middotTeO2 vitreous matrices
are represented in table 41
9
400 600 800 1000 1200
Wavenumber [cm-1]
Abs
orpt
ion
[au
]
407
594
821
794
1119
As2O
3PbO
a)
a
400 600 800 1000 1200
As2O3TeO2
Abs
orpt
ion
[ua
]
Wavenumber [cm-1]
85473
3
644
1119
b)
b
Fig41 FT ndash IR spectra of vitreous matrices a As2O3middotPbO şi b As2O3middotTeO2
The FT ndash IR spectrum of As2O3middotPbO glass matrix presents five absorption bands at ~
1119 cm-1 ~ 821 cm-1 ~ 794 cm-1 ~ 594 cm-1 and ~ 407 cm-1(Fig41a)
The band from ~ 1119 cm-1 is due to totally symmetric stretching vibrations of AsO3
units [5 ndash 7] The bands from ~ 821 cm-1 and ~ 794 cm-1 are due to doubly degenerate
stretching vibrations of AsO3 structural units [5 ndash 7] The large band centered at ~ 594 cm-1 can
be due to totally symmetric bending vibrations of AsO3 structural units [5-7] The band from ~
407 cm-1 can be due to vibrations of Pb ndash O bonds from PbO4 structural groups [7]
Following As2O3TeO2 glass matrix spectrum presented in Fig 41b four bands can be
observed located at ~ 644 cm-1 ~ 733 cm-1 ~ 854 cm-1 and ~ 1119 cm-1 The band from ~ 644
cm-1 can be assigned to totally symmetric bending vibrations of AsO3 units [5-7] and also
stretching vibration mode of TeO4 tbp with bridging oxygen[11] The band from ~ 733 cm-1
can be assigned to the symmetric stretching vibration mode of Te-O bonds in TeO3 units
[15] The band from ~ 854 cm-1 can be assigned to doubly degenerate stretching vibrations of
AsO3 units [5-7] and also to the stretching vibration mode of TeO3 tp with NBO [11] The band
10
from ~ 1119 cm-1 can be assigned to totally symmetric stretching vibrations of AsO3 units [5-
7] These bands presented in As2O3TeO2 glass matrix spectrum confirm the presence of
AsO3 TeO4 tbp and TeO3 tp units in the structure of the glass matrix but due to the broadness
of the bands it can not be told for sure which one of these units is predominant
Table 41Wavenumber and the structural assignments of FT ndash IR spectra of
As2O3middotPbO and As2O3middotTeO2 vitreous matrices
~ [cm 1 ]
As2O3middotPbO As2O3middotTeO2
Attribution
~1119 cm-1
~ 1119 cm-1
Totally symmetric stretching vibrations of AsO3 units
~ 821cm-1
Doubly degenerate stretching vibrations of AsO3 structural units
~ 854 cm-1
Doubly degenerate stretching vibrations of AsO3 units Stretching vibration mode of TeO3 tp with NBO
~ 794 cm-1
Doubly degenerate stretching vibrations of AsO3 structural units
~ 733 cm-1
Symmetric stretching vibration mode of Te-O bonds in TeO3 units
~ 594 cm-1
~ 644 cm-1
Totally symmetric bending vibrations of AsO3 units
~ 407 cm-1 Vibrations of Pb ndash O bonds from PbO4 structural groups
412 Comparative study by FT-IR spectroscopy of
xMOmiddot(100- x)[As2O3middotPbO] vitreous systems where MO =gt MnO or Fe2O3
The infrared absorption spectra obtained for xMOmiddot(1-x)[As2O3middotPbO] glass system
where MO =gt MnO or Fe2O3 with 0 le x le 50 mol are presented in figure 42-3 and their
structural assignments are summarized in table 41
The spectra were discussed on the basis of the method given by Tarte [3] and Condrate
[4] by comparing the experimental data of glasses with those of related crystalline compounds
The characteristic absorption bands for crystalline As2O3 [5-8] PbO [79] and characteristic
bands for Fe2O3 [1819 ] were used as a reference point in the results discussion
The FT ndash IR spectra of the investigated glasses suggest a structure formed of AsO3 and
PbO4 structural units where As2O3 plays the role of the glass former and PbO plays the role of
the glass modifier The evolution of the spectra with the addition and the increasing of the
MnO content suggest that the manganese ions break up a part of As ndash O ndash As Pb ndash O ndash Pb and
probably of As ndash O ndash Pb bonds The addition of MnO in the As2O3middotPbO glass matrix is leading
to a disordering of the glasses structure with the increasing of the MnO content
The evolution of the absorption bands for FT ndash IR spectrum of xFe2O3middot(1-x)
[As2O3middotPbO] glasses are determined by the addition of Fe2O3 content It can be observed to
11
shift the bands assigned As ndash O ndash As vibrations from AsO3 units due to changing to length As
ndash O ndash As bonds and interne angles of AsO3 units disappears PbO4 units and appears FeO6
units The addition of Fe2O3 in the As2O3middotPbO glass matrix determined a disordering of the
glasses structure with the increasing of the Fe2O3 content
400 600 800 1000 1200
610
813
449
1093
423
449
616
760 848
821
794
594
20A
bsor
ptio
n [a
u]
Wavenumber [cm-1]
05
0
35
10
35
50
1
MnO
407
1119
693
Fig 42 FT ndash IR spectra of xMnOmiddot(100- x)[As2O3middotPbO] glasses
400 600 800 1000 1200
616
462
811
407
594
Abs
orpt
ion
[au
]
Wavenumber [cm -1]
05
20
0
35
10
35
50
1
Fe2O3
821
79469
3
1119
1084
610
Fig43 FT ndash IR spectra of xFe2O3middot(100- x)[As2O3middotPbO] glasses
12
413 Comparative study by FT-IR spectroscopy of
xMOmiddot(100-x)[As2O3middotTeO2] vitreous systems where MO =gt MnO or Fe2O
The infrared absorption spectra obtained for xMOmiddot(1-x)[As2O3middotTeO2] glass system
where MO =gt MnO or Fe2O3 with 0 le x le 50 mol are presented in figure 44 -5 and their
structural assignments are summarized in table 41[1617] The characteristic absorption bands
for crystalline As2O3 [5-8] PbO [79] TeO2 [810-15] MnO2 and Mn3O4 [9] and characteristic
bands for Fe2O3 [1819 ] were used as a reference point in the results discussion
Fig 44 FT ndash IR spectra of xMnOmiddot(100- x)[As2O3middotTeO2] glasses
Fig45 FT ndash IR spectra of xFe2O3middot(100- x)[As2O3middotTeO2] glasses
400 600 800 1000 1200
565
422 690 830
05
Abs
optio
n [a
u]
Wavenumber [cm-1]
0
3
5
35 50
1
MnO
854 733 644
1119
10 20
400 600 800 1000 1200
462650
812
713
561
05
20
Wavenumber [cm-1]
Abs
orpt
ion
[au
]]
0
3 5
10
35 50
1
Fe2O3
854 733
644
1119
13
This behavior of the studied glasses with the addition and increasing of MnO content
suggests that the structure observed in the glass matrix is conserving up to 5 mol MnO
where the structure takes another form From a structure dominated by AsO3 TeO4 tbp and
TeO3 tp units the structure became dominated by TeO4 tbp and MnO2 units and in a small
measure of AsO3 and TeO3 tp units For higher concentrations it can not be specified exactly
which of the last two structural units have the biggest proportion in these glasses From FT-IR
absorption spectra of the investigated glass system it can be observed that the addition and
increasing of manganese ions concluded the contraction of As-O-As bonds from totally
symmetric stretching vibrations of AsO3 units for x ge10 mol there can be an increase in
number of As-O-As bonds from AsO3 units orand a length these linkage to doubly degenerate
stretching vibrations of AsO3 units and a stretching vibration mode of TeO3 tp with NBO It
can be remarked from the FT-IR absorption spectra the gradual transformation of symmetric
stretching vibration mode of Te-O bonds from TeO3 units in TeO4 (tbp) units and the presence
of MnO2 units Once with the addition of iron ions the xFe2O3middot(100- x)[As2O3middotTeO2]
glasses behave like xMnOmiddot(100-x)[As2O3middotTeO2] glasses but in this system the
appearance of FeO6 units can be seen
414 Comparative study by FT-IR spectroscopy of
xMnOmiddot(100- x)[As2O3middotBO] vitreous systems were BO =gt TeO2 or PbO
The infrared absorption spectra obtained for xMnOmiddot(100- x)[As2O3middotBO] vitreous
systems where BO =gt TeO2 or PbO with 0 le x le 50 mol MnO are presented in figure
42 and 44 Following the infrared absorption spectra it can be observed that for
xMnOmiddot(100- x)[As2O3middot PbO] glass system the most disordered structure to exist for 0
le x le 5 mol MnO and to xMnOmiddot(100-x)[As2O3middot TeO2] glass system for 1 le x le 5 mol
MnO For x ge 5 mol MnO manganese ions break up a part of As ndash O ndash As Pb ndash O ndash Pb
and probably of As ndash O ndash Pb bonds to favor the increase in number of PbO4 units and
appearance of MnO2 units For x ge 10 mol MnO observed comparatively in both system
glasses the addition of manganese ions suggests for the first system a modification in linkage
characteristic units and for the second system an improvement for structural units of As2O3middot
TeO2 vitreous matrice also linkage characteristic units
415 Comparative study by FT-IR spectroscopy of
xFe2O3middot(100-x)[As2O3middotBO] vitreous systems where BO =gt TeO2 or PbO
The infrared absorption spectra obtained for xFe2O3middot(100- x)[As2O3middotBO] vitreous
systems where BO =gt TeO2 or PbO with 0 le x le 50 mol Fe2O3 are presented in figure
43 and 45
14
The evolution of the spectra with the addition and the increasing of the Fe2O3 content
suggest that the iron ions break up a part of As ndash O ndash As Pb ndash O ndash Pb and probably of As ndash O
ndash Pb bonds It can be observed a shift in the bands assigned As ndash O ndash As vibrations from AsO3
units due to changing to length As ndash O ndash As bonds and interne angles of AsO3 units the PbO4
units disappear and FeO6 units appear For x ge 5 mol Fe2O3 observed comparatively in
both system glasses the addition of iron ions suggests for the first system a modification in
linkage characteristic units of As2O3middotPbO and for the second system an improvement for
structural units of As2O3middot TeO2 vitreous matrice also linkage characteristic units appearance
of FeO6 units in both system
416 Comparative study by Raman spectroscopy of
As2O3middotTeO2 and As2O3middotPbO vitreous matrices
In order to obtain new information regarding the role of the modifier in the
formation of vitreous matrices there were made comparative studies by Raman
spectroscopy The Raman spectroscopy are presented in figure 46(ab) The wave
length and the structural assignments of Raman spectra of As2O3middotPbO şi As2O3middotTeO2 vitreous
matrices are presented in table 42
Table 42Wavenumber and the structural assignements of Raman spectra
of As2O3middotPbO and As2O3middotTeO2 vitreous matrices
~ [cm 1 ]
As2O3middotPbO As2O3middotTeO2
Attribution
~826 cm-1
~ 816 cm-1
Stretching vibrations of As-O-As
~ 752 cm-1
Vibrations of the continuous TeO4 (tbp) network
~ 627 cm-1
Vibrations As ndash O ndash As bonds from As2O units
~ 580 cm-1
Stretching vibrations of As-O-As
~ 525 cm-1
Vibrations O-As-O bonds from AsO3 units
~ 438cm-1
Symmetric bending vibrations of Te ndash O ndash Te vertex linkages between different TeO4 (tbp) TeO3+1 polyhedra Stretching vibrations of As-O-As of AsO3 units
~ 345 cm-1
Bending vibrations of As ndash O ndash As from As2O units
15
200 400 600 800 1000
As2O3PbO
Ram
an In
tens
ity [a
u]
LWavenumber [cm-1]
345
826
525
627a)
a
200 400 600 800 1000
816
752
580 R
aman
Inte
nsity
[au
]
Wavenumber [cm-1]
As2O3TeO2
438
b)
b
Fig46 Raman spectra of vitreous matrices a As2O3middotPbO şi b As2O3middotTeO2
The Raman spectrum of As2O3middotPbO glass matrix presents four bands at 826 cm-1
627 cm-1 525 cm-1 and 345 cm-1 The band from 826 cm-1 can be assigned to As ndash O ndash
As stretching vibrations [20] The band centered at 627 cm-1 can be assigned to vibrations As
ndash O ndash As bonds from As2O units the band from 525 cm-1 are assigned vibrations O-As-O
bonds from AsO3 units [21] The band of 345 cm-1 are attributed to As ndash O ndash As bending
vibrations from As2O units[2021]
The Raman spectrum of As2O3middot TeO2 glass matrix presents four bands at 816 cm-1
752 cm-1 580 cm-1 and 438 cm-1 The band from 816 cm-1 can be assigned to As ndash O ndash
As stretching vibrations [20] The band centered at 752 cm-1 can be assigned to vibrations of
the continuous TeO4 (tbp) network [22] The band of 580 cm-1 are attributed to As ndash O ndash As
stretching vibrations [12] The band centered at 438 cm-1 can be assigned symmetric bending
vibrations of Te ndash O ndash Te vertex linkages between different TeO4 (tbp) TeO3+1 polyhedra and
As ndash O ndash As stretching vibrations of AsO3 units
16
417 Study by Raman spectroscopy of xMOmiddot(100- x)[As2O3middotPbO]
vitreous systems where MO =gt MnO or Fe2O3
The Raman spectra obtained for xMOmiddot(100- x)[As2O3middotPbO] vitreous systems where
MO =gt MnO or Fe2O3 with 0 le x le 50 mol are presented in figure 47-8 and their
structural assignments are summarized in table 42
200 400 600 800 1000
368
833
345
1
3
Lungimea de unda [cm-1]
Inte
nsita
te R
aman
[ua
]
20
05
0
5
10
35
50
MnO
826
525
627
Fig 47 Raman spectra of xMnOmiddot(100- x)[As2O3middotPbO] glasses
The addition of MnO in the glass matrix determined an order degree of the vitreous
matrix The intensity of the bands attributed vibrations As ndash O ndash As bonds from As2O units
and bending vibrations of As ndash O ndash As from As2O units shift to a higher wave length that
suggests an increase in the As2O units comparative to AsO3 units
To the band from 826 cm-1 the addition of manganese ions in the glass matrix
determine for x = 05 mol an decreasing in intensity whereupon increasing for higher
concentrations The intensity of bands centered at 627 cm-1 and 525 cm-1 for x = 05
mol MnO decrease and disappear for x = 1 mol MnO The band of 345 cm-1 slowly
increases with the addition of manganese ions
To the band from 826 cm-1 the addition of iron ions in the glass matrix determines
for x = 05 mol an increase in intensity a gradual decrease and disappearance for x = 35
mol Fe2O3 of the bands observed for the glass matrix For higher concentrations of
manganese these bands gradually decrease The intensity of bands centered at 627 cm-1 and
525 cm-1 for x = 05 mol Fe2O3 increase and shift to 612 cm-1 and 501 cm-1 whereas
17
they gradually decrease and disappear for x = 10 mol Fe2O3 The band of 345 cm-1
decreases with the addition of iron ions and disappears for x = 20 mol Fe2O3
200 400 600 800 1000
3
612
501
Wavenumber [cm-1]
Ram
an In
tens
ity [a
u]
05
20
0
5
10
3550
1
Fe2O3
345
826
525
627
Fig 48 Raman spectra of xFe2O3middot(100- x)[As2O3middotPbO] glasses
With the increase of iron ions content in the As2O3middotPbO glass matrix the number of
these structural units decreases due to the increasing of the disorder in the studied glasses
418 Study by Raman spectroscopy of xMOmiddot(100-x)[As2O3middotTeO2]
vitreous systems were MO =gt MnO or Fe2O3
The Raman spectra obtained for xMOmiddot(100- x)[As2O3middot TeO2] vitreous systems
where MO =gt MnO or Fe2O3 with 0 le x le 50 mol are presented in figure 49-10 and their
structural assignments are summarized in table 42
The Raman spectrum of the glass matrix suggests a structure formed from TeO4 (tbp)
and TeO3 (tp) units where the presence of As ndash O ndash As bonds can not be excluded The
addition of manganese ions is leading to a modification of the structure proposed by the
spectrum of the glass matrix Then with the increasing of manganese content the intensity of
these bands is increasing showing that the manganese content favorises the formation of TeO4
(tbp) and TeO3 (tp) units
18
200 400 600 800 1000
783
850
768
416
816
752
Wavenumber [cm -1]
Ram
an In
tens
ity [a
u]
13
20
05
0
5
10
35
50
MnO
438
580
660
Fig 49 Raman spectra of xMnOmiddot(100- x)[As2O3middot TeO2] glasses
200 400 600 800 1000
226
294
408
673 751
5
W avenumber [cm -1]
Ram
an In
tens
ity [a
u]
05
20
0
3
10
35
50
1
Fe2O
3
816
752
438
580
Fig 410 Raman spectra of xFe2O3middot(100- x)[As2O3 TeO2] glasses
The Raman spectra of xFe2O3middot(100- x)[As2O3 TeO2] glasses present a significant
advance to the TeO4 (tbp) TeO3+1 polyhedra and AsO3 units represented in Raman spectrum
by the ~ 438 cm-1 band comparative with the modifications determined by the addition of
manganese ions in vitreous matrix For high concentrations of iron ions in xFe2O3middot(100-
x)[As2O3 TeO2] system of glasses the number of As-O-As linkages appear in Raman
spectrum due to stretching vibrations of As-O-As and vibrations of the continuous TeO4 (tbp)
network show a significant decrease
19
419 Comparative study by Raman spectroscopy of xMnOmiddot(100- x)[As2O3middotBO]
vitreous systems were BO =gt TeO2 or PbO
The addition of MnO to xMnOmiddot(100- x)[As2O3middotPbO] glass system do not break As
ndash O ndash As bonds into characteristic units and contribute to their prominence The addition of
manganese ions to xMnOmiddot(100- x)[As2O3middot TeO2] glass system for x=50mol MnO
determined the splitting up of a part of As ndash O ndash As Te-O-Te and the appearance of the
TeO4 (tbp) units against the loss of continuous TeO4 (tbp) network was observed
4110 Comparative study by Raman spectroscopy of xFe2O3middot(100- x)[As2O3middotBO]
vitreous systems where BO =gt TeO2 or PbO
With the increasing of iron ions content in the As2O3middotPbO glass matrix the number of
these structural units decreased due to the increase of the disorder in the studied glasses (x gt 20
mol ) and x = 50 mol Fe2O3 for xFe2O3middot(100- x)[As2O3middotTeO2] when iron ions
brought the structural units existing in glass matrices and favoured the appearace of
new bands due to bending vibrations of As ndash O ndash As
42 Comparative study by FT-IR and Raman spectroscopies of
xMOmiddot(100-x)[3B2O3middotLi2O] glasses where MO =gt MnO or Fe2O3
421 Study by FT-IR spectroscopy of xMOmiddot(100-x)[3B2O3middotLi2O] glasses
where MO =gt MnO or Fe2O3
The infrared absorption spectra obtained for xMOmiddot(1-x)[3B2O3middotLi2O] glass system
where MO =gt MnO or Fe2O3 with 0 le x le 50 mol are presented in figure 411-13 and their
structural assignments are summarized in table 43
500 1000 1500
3B2O3Li2O
Wavenumber [cm-1]
Abs
orpt
ion
[au
]
490
1400
1230
1061
698
614
460 78
6
Fig 411 FT ndash IR spectra of vitreous matrix 3B2O3middotLi2O
20
Following the infrared absorption spectra obtained for 3B2O3middotLi2O vitreous matrix
observed on eight bands ~ 1400 cm-1 ~ 1230 cm-1 ~ 1061 cm-1 ~ 786 cm-1 ~ 698 cm-
1 ~ 614 cm-1 ~ 490 cm-1 şi ~ 460 cm-1 The band at ~ 1400 cm-1 is assigned to
asymmetric stretching vibrations from BOslash3 şi BOslash2O- groups (Oslash represent oxygen atom
bridging two boron atoms) The band at ~ 1230 cm-1 is attributed to asymmetric stretching
vibrations of B ndash O bonds from triangular ortoborate BO 33 groups [23-26]
400 600 800 1000 1200 1400 1600
0
3
5
10
20
35
50
1
Wavenumber [cm-1]
Abs
orpt
ion
[ua
]
05
MnO
490
1400
1230
1061
698
614
460 78
6
Fig 412 FT ndash IR spectra of xMnOmiddot(100-x)[3B2O3middotLi2O] glasses
400 600 800 1000 1200 1400 1600
469
Wavenumber [cm-1]
Abs
orpt
ion
[ua
]
0
3
5
10
20
35
50
1
05
Fe2O3
490
1400
1230
1061
698
614
460 78
6
Fig 413 FT ndash IR spectra of x Fe2O3middot(100-x)[3B2O3middotLi2O] glasses
21
Table 43Wavenumber and the structural assignments of FT ndash IR and Raman
spectra of 3B2O3middotLi2O vitreous matrix
~ [cm 1 ] Attribution
FT ndash IR Raman FT ndash IR Raman
~ 1400 cm-1
~ 1400 cm-1
Asymmetric stretching
vibrations from BOslash3 şi BOslash2O-
groups
BOslash2O- triangles linked to
other borate triangular units
~ 1230 cm-1
Asymmetric stretching
vibrations of B ndash O bonds from
triangular ortoborate
BO 33 groups
~ 1061 cm-1
~ 1074 cm-1
Stretching vibrations of B ndash Oslash
bonds in -4BOslash tetrahedra from
tri- tetra- and penta-borate
groups
Diborate groups
~ 902 cm-1
Vibrations of orthoborate
groups
~ 786 cm-1
~ 791 cm-1
Bending vibrations of O3B ndash O
ndash BO4 bonds
Vibrations of rings with six
member to one or two BO4
tetrahedral from tri- tetra ndash
and penta ndash borate units
~ 698 cm-1
Bending vibrations of B-O-B
bonds from pentaborate groups
~ 614cm-1 Bending vibrations of O ndash B ndash O
bonds
~ 490cm-1 ~ 471cm-1 Bending vibrations of B-O-B
bonds
Isolated diborate groups
~ 460cm-1 Bending vibrations of O ndash B ndash O
bonds
22
The band at ~ 1061 cm-1 is assigned to stretching vibrations of B ndash Oslash bonds in -4BOslash
tetrahedra from tri- tetra- and penta-borate groups and the band at ~ 786 cm-1 is assigned
to bending vibrations of O3B ndash O ndash BO4 bonds The band at ~ 698 cm-1 is attributed to
Bending vibrations of B-O-B bonds from pentaborate groups The bands at ~ 614 cm-1 and
~ 460 cm-1 are assigned to bending vibrations of O ndash B ndash O bonds and the band at ~ 490 cm-
1 is assigned to bending vibrations of B-O-B bonds
From FT-IR spectra it can be concluded that the addition of manganese or iron ions in
vitreous matrices leads to the increase of the disorder degree
Also the structural changes that appeared in 3B2O3middotLi2O vitreous matrix with an
addition MnO or Fe2O3 content can be studied Ar=A4A3 ratio(A4 - relative number of -4BOslash tetrahedral borate units A3 - relative number of triangular (BOslash3 and BOslash2O-) units
0 10 20 30 40 50
010
015
020
Ar
x [mol]
MnO Fe2O3
Fig 414 The evolution of Ar ratio with the MnO or Fe2O3 content of
xMnOmiddot(100-x)[3B2O3middotLi2O] şi xFe2O3middot(100-x)[3B2O3middotLi2O] The evolution of the value of this ratio also allows a visualization of the effects
determined by the presence of the manganese or iron ions in the matrix The value Arltlt 1
indicated that BO3 is dominant related to BO4
422 Study by Raman spectroscopy of xMOmiddot(100-x)[3B2O3middotLi2O] glasses
where MO =gt MnO or Fe2O3
The Raman spectra obtained for xMOmiddot(1-x)[3B2O3middotLi2O] glass system were MO =gt
MnO or Fe2O3 with 0 le x le 50 mol are presented in figure 414-16 and their structural
assignments are summarized in table 43
Studying the Raman spectra of xMOmiddot(1-x)[3B2O3middotLi2O] glass system where MO =gt
MnO or Fe2O3 it has been observed that the absorption bands presented in vitreous matrix
gradually decreased with an increase in the manganese or iron content in both glasses system
which suggested an increase of the disorder in these vitreous systems
23
1000 2000 3000
B2O3Li2O
Wavenumber [cm-1]
Ram
an In
tens
ity [a
u]
1430
107490
279
1471
Fig 415 Raman spectra of vitreous matrix 3B2O3middotLi2O
500 1000 1500 2000 2500 3000
1430
107490
2791
0
Wavenumber [cm-1]
Ram
an In
tens
ity [a
u]
1
3
20
05
5
10
35
50
MnO
471
Fig 416 Raman spectra of xMnOmiddot(100-x)[3B2O3middotLi2O] glasses
400 600 800 1000 1200 1400 1600
Wavenumber [cm-1]
Ram
an In
tens
ity [a
u]
0
1
3
20
05
5
10
35
50
Fe2O3
1430
1074
90279
1
471
Fig 417 Raman spectra of x Fe2O3middot(100-x)[3B2O3middotLi2O] glasses
24
43 Comparative study by electron paramagnetic resonance (EPR) and magnetic
susceptibility measurements of xMOmiddot(100-x)[As2O3middotTeO2] xMOmiddot(100-x)
[As2O3middotPbO] and xMOmiddot(100-x)[3B2O3middotLi2O] glasses where MO =gt MnO or Fe2O3
431 Comparative study by electron paramagnetic resonance (EPR) of
xMnOmiddot(100-x)[As2O3middotBO] where BO =gt TeO2 or PbO
and xMnOmiddot(100-x) [3B2O3middotLi2O] glasses
In order to obtain more information regarding the behavior of manganese ions in
different vitreous matrices [3031] xMnOmiddot(100-x)[As2O3middotBO] where BO =gt TeO2 or PbO
and xMnOmiddot(100-x) [3B2O3middotLi2O] glasses were investigated by EPR spectroscopy on a large
compositional range with 0 le x le 50 mol The EPR spectra of Mn2+ for xMnOmiddot(100-
x)[As2O3middotPbO] (S1) xMnOmiddot(100-x)[As2O3middotTeO2] (S3) and xMnOmiddot(100-x)[3B2O3middotLi2O]
(S5) are presented in figure 418-20 These spectra present two absorption lines centered at gef
43 and gef 20 in all systems
The absorption line centered at gef 43 and is due to isolated Mn2+ ions [32] The
absorption line centered at gef 20 may be attributed to Mn2+ species interacting by magnetic
coupling[33] dipolar and or super exchange the last ones forming magnetic clusters [32]
The evolution of the spectra is easier to follow considering the dependence of
concentration on the EPR parameters the line - intensity (obtained as an integral of the area
under the corresponding EPR signal) J and the line - width ΔB The evolution of J and AB
reflects the structural transformations which appear in the glass matrices due to the increase of
manganese ions content
The intensity and the line - width of the resonance line from gef 43 for all
investigated systems is represented in figure 421(ab)
The intensity of the resonance line from gef 43 for all investigated glass systems
decreases due to the decrease of the isolated manganese ions numbers The line - width from
gef 43 for (S1) and (S3) systems decreases due to decrease of Mn2+ number and to the
structural disorder in glasses with the increase of MnO content For (S5) glass system the line
- width of the resonance line there is an increase in all compositional domains
The intensity of the resonance line from gef 20 can be observed as increasing up to
x=14 mol for (S1) system up to x=8mol for (S3) system and 20 mol for (S5)
system The line - width of the resonance line from gef 20 for (S1) and (S3) systems
increases up to 3 mol and 5mol for (S5) due to Mn2+ species interacting by magnetic
coupling dipole- dipole as the main broadening mechanism Over this concentration line ndash the
width of the resonance line from gef 20 is straight and it can be assumed that the
manganese ions begin to manifest super exchange magnetic interactions
25
1000 2000 3000 4000 5000
Firs
t der
ivat
ive
of a
bsor
ptio
n [u
a]
05
1
3
5
10
20
35
50
x [mol Mn2O3]amplif
B [G]
10
200
40
80
400
5
1
1
Fig 418 The EPR spectra of Mn2+ for xMnOmiddot(100-x)[As2O3middotPbO] (S1)
glass system
1000 2000 3000 4000 5000
Firs
t der
ivat
ive
of a
bsor
ptio
n [u
a]
x [mol MnO]
051
3
5
10
20
35
50
9
500
400
50
100
4
1
amplif
B [G]
1
Fig 419 The EPR spectra of Mn2+ for xMnOmiddot(100-x)[As2O3middotTeO2] (S3)
glass system
26
1000 2000 3000 4000 5000
501
B [G]
Firs
t der
ivat
ive
of a
bsor
ptio
n [u
a]
1
4
9
10
30
60
100
amplif
05
1
3
5
10
20
35
x [mol MnO]
Fe3+
Fig 420 The EPR spectra of Mn2+ for xMnOmiddot(100-x)[3B2O3middotLi2O] (S5)
glass system
0 2 4 6 8 10 12 14 16 18 20 22
x [mol]
J [ u
a]
S1 S3 S5
-2 0 2 4 6 8 10 12 14 16 18 20 22
50
100
150
200
250
300
S1 S3 S5
x [mol]
B
[G]
a b
Fig 421 The dependence on MnO content of the intensity (a) and width(b) of resonance
line at gef 43 for xMnOmiddot(100-x)[As2O3middotPbO] (S1) xMnOmiddot(100-x)[As2O3middotTeO2] (S3) şi
xMnOmiddot(100-x)[3B2O3middotLi2O] (S5) system glasses
27
0 10 20 30 40 50
x [mol]
J [ u
a]
S1 S3 S5
0 10 20 30 40 50
400
500
600
700
800
900
S1 S3 S5
x [mol]
B[G
]
a b
Fig 422 The dependence on MnO content of the intensity (a) and width b) of resonance
line at gef 20 for xMnOmiddot(100-x)[As2O3middotPbO] (S1) xMnOmiddot(100-x)[As2O3middotTeO2] (S3) and
xMnOmiddot(100-x)[3B2O3middotLi2O] (S5) system glasses
Following figure 418-20 it can be observed that (S1) and (S3) have had a similar
evolution but (S5) system presented for 05 le x le 5 mol (fig420) has a hyperfine
sextet[33] at gef 20due to Mn2+ isolated ions
432 Comparative study by magnetic susceptibility measurements of
xMnOmiddot(100-x)[As2O3middotBO] where BO =gt TeO2 or PbO and
xMnOmiddot(100-x)[3B2O3middotLi2O] glasses
The magnetic susceptibility data are in good agreement with the EPR result The
magnetic behavior of the glasses from xMnOmiddot(100-x)[As2O3middotBO] where BO =gt TeO2 (S3)
or PbO (S1) and xMnOmiddot(100-x)[3B2O3middotLi2O] (S5) glasses for 3 le x le 50 mol MnO are
presented in figure 423 - 25
For (S1) and (S3) system glasses up to x 3 mol and x 5 mol (S5) glass
system the temperature dependence of the reciprocal magnetic susceptibility obeys a Curie
law In this concentration range the manganese ions are predominantly isolated orand
participate in dipole-dipole interractions At higher concentrations the reciprocal magnetic
susceptibility obeys a Curie-Weiss law with negative paramagnetic Curie temperature (p)
characteristic to antiferromagnetic coupled ions by means of super exchange interractions(fig
426) This behavior of manganese ions is confirmed by the shape of the EPR spectra
28
100 150 200 250
2
4
6
8
10
12
14
16
18
20
22
T [K]
[
emu
mol
]-1
3 mol 5 mol 10 mol 20 mol 35 mol 50 mol
Fig423 The temperature dependence of -1 for xMnOmiddot(100-x)[As2O3middotPbO]
(S1) 3 le x le 50 mol
50 100 150 200 2500
2
4
6
8
10
12
14
16
18
20
22
3 mol 5 mol 10 mol 20 mol 35 mol 50 mol
T [K]
[
emu
mol
]-1
Fig424 The temperature dependence of -1 for xMnOmiddot(100-x)[ As2O3middotTeO2]
(S1) 3 le x le 50 mol
100 150 200 250
2
4
6
8
10
12
14
16
18
20
22
[em
u m
ol]-1
T [K]
3 mol 5 mol 10 mol 20 mol 35 mol 50 mol
Fig425 The temperature dependence of -1 for xMnOmiddot(100-x)[3B2O3middotLi2O]
(S5) 3 le x le 50 mol
29
0 10 20 30 40 50
0
20
40
60
80
100
x [mol]
-p [K
]
(S1) (S3) (S5)
Fig426Concentration dependence of (p) for sistemele xMnOmiddot(100-x)[As2O3middotPbO]
(S1) xMnOmiddot(100-x)[As2O3middotTeO2] (S3) şi xMnOmiddot(100-x)[3B2O3middotLi2O] (S5)
Using the representation 1 =f(T) the molar Curie constants CM the effective
magnetic moments and molar fraction of Mn2+(x1) şi Mn3+(x2) ions were calculated and
represented in tables 44 -6
Tabel 44 Molar Curie constants effective magnetic moments and molar fraction of Mn2+(x1) şi Mn3+(x2) ions in xMnOmiddot(100-x)[As2O3middotPbO] (S1) glasses
x
[mol MnO2] CMtimes102
[emu mol] ef
[microB] x1
[mol Mn2+O2] x2
[mol Mn3+O2] 3 1272 582 268 032 5 1979 562 343 157 10 3777 549 555 445 20 6688 517 492 1508 35 12239 502 377 3123 50 15427 496 268 4732
Tabel 45 Molar Curie constants effective magnetic moments and molar fraction of Mn2+(x1) şi Mn3+(x2) ions in xMnOmiddot(100-x)[As2O3middotTeO2] (S3)glasses
x
[mol MnO2] CMtimes102
[emu mol] ef
[microB] x1
[mol Mn2+O2] x2
[mol Mn3+O2] 3 1297 588 287 013 5 1938 556 312 188 10 3804 551 575 425 20 6766 52 549 1451 35 11148 504 441 3059 50 15528 498 358 4642
30
Tabel 46 Molar Curie constants effective magnetic moments and molar fraction of Mn2+(x1) şi Mn3+(x2) ions in xMnOmiddot(100-x)[3B2O3middotLi2O] (S5) glasses
x
[mol MnO2] CMtimes102
[emu mol] ef
[microB] x1
[mol Mn2+O2] x2
[mol Mn3+O2] 3 127 581 265 035 5 1919 554 303 197 10 3681 542 486 514 20 7215 519 53 147 35 1121 506 505 2995 50 15898 501 493 4507
433 Comparative study by electron paramagnetic resonance (EPR) of
xFe2O3middot(100-x)[As2O3middotBO] where BO =gt TeO2 or PbO and
x Fe2O3middot(100-x) [3B2O3middotLi2O] glasses
In order to obtain more information regarding the behavior of iron ions in
xFe2O3middot(100-x)[As2O3middotBO] where BO =gt TeO2 (S4) or PbO (S2) şi xFe2O3middot(100-
x)[3B2O3middotLi2O] glasses were investigated by EPR spectroscopy on a large compositional
range with 05 le x le 35 mol Fe2O3 The EPR spectra of Fe3+ in xFe2O3middot(100-
x)[As2O3middotPbO] (S2) xFe2O3middot(100-x)[As2O3middotTeO2] (S4) and xFe2O3middot(1-x)[3B2O3middotLi2O]
(S6) are presented in figure 427-29 These spectra present two absorption lines centered at
gef 43 and gef 20 up to x le 35mol Fe2O3 systems studied
The absorption line centered at gef 43 is due to isolated Fe3+ ions [34-36] The
absorption line centered at gef 20 may be attributed to Fe3+ species interacting by magnetic
coupling dipolar and or super exchange the last ones forming magnetic clusters [37-41]
The evolution of the spectra is easier to follow considering the dependence of
concentration on the EPR parameters the line - intensity (obtained as an integral of the area
under the corresponding EPR signal) J and the line - width ΔB The evolution of J and AB
reflects the structural transformations which appear in the glass matrices due to the increasing
of iron ions content
The intensity and the line - width of the resonance line from gef 43 for all
investigated systems is represented in figure 430 (a b) The intensity of the resonance line
from gef 43 increases for (S2) and (S4) up to 3 mol and up to 5 mol for (S6) then
decreases for all systems investigated A line broadening up to 3 mol from gef 43 for
these systems can be observed due to increasing of Fe3+ isolated number of ions
31
1000 2000 3000 4000 5000
40
Firs
t der
ivat
ive
of a
bsor
ptio
n [u
a]
B [G]
x [mol Fe2O3]
05
1
3
5
1020
35 2
40
20
10
10
10
amplif
Fig427 The EPR spectra of Fe3+ for xFe2O3middot(100-x)[As2O3middotPbO] (S2)
glass system
1000 2000 3000 4000 5000
100
B [G]
Firs
t der
ivat
ive
of a
bsor
ptio
n [u
a]
10080
20
50
20
20
3
05
1
5
102035
x [mol Fe2O3] amplif
Fig428 The EPR spectra of Fe3+ for xFe2O3middot(100-x)[As2O3middotTeO2] (S4)
glass system
32
1000 2000 3000 4000 5000
Firs
t der
ivat
ive
of a
bsor
ptio
n [u
a]
B [G]
3
05
1
5
10
20
35
x [mol Fe2O3]
30
50
20
20
10
30
30
amplif
Fig429 The EPR spectra of Fe3+ for xFe2O3middot(100-x)[3B2O3middotLi2O] (S6)
glass system
The intensity and the line - width of the resonance line from gef 43 for all
investigated systems is represented in figure 430 (a b)The resonance line from gef 20 is
attributed to Fe3+ ions that interact by magnetic coupling dipolar orand super exchange
interractions can be observed in all compositional domains
The intensity of the resonance line from gef 20 can be observed as increasing up to
x=35 mol for (S2) and (S6) system and 10 mol for (S4) system with increased iron
ions content The line - width of the resonance line from gef 20 increased up to 10mol
for (S2) system and up to 3 mol for (S4) and 5mol for (S6) due to Fe3+species
interacting by magnetic coupling dipole-dipole Above this concentration line - width of the
resonance line from gef 20 can be attributed to dipolar and super exchange magnetic
interactions The ΔB = f(x) dependence reflects the competion between the broadening
mechanism (dipole ndash dipole interactions the interactions between ions in diferent
valence state and structural disorder) and the narrowing ones (super exchange
interactions)
33
0 5 10 15 20 25 30 35 40
x [mol]
J [ u
a]
S2 S4 S6
a)
0 5 10 15 20 25 30 35 4040
60
80
100
120
140
160
180
200
220 S2 S4 S6
B[G
]
x [mol]
a b
Fig 430 The dependence on Fe2O3 content of the intensity (a) and width (b) of
resonance line at gef 43 for xFe2O3middot(100-x)[As2O3middotPbO] (S2)
xFe2O3middot(100-x)[As2O3middotTeO2] (S4) and xFe2O3middot(100-x)[3B2O3middotLi2O] (S6) glasses
0 5 10 15 20 25 30 35 40
x [mol]
J [ u
a]
S2 S4 S6
a)
0 5 10 15 20 25 30 35 40
200
400
600
800
1000
1200
1400
1600
x [mol]
B
[G] S2
S4 S6
a b
Fig 431 The dependence on Fe2O3 content of the intensity (a) and width (b) of
resonance line at gef 20 for xFe2O3middot(100-x)[As2O3middotPbO] (S2)
xFe2O3middot(100-x)[As2O3middotTeO2] (S4) and xFe2O3middot(100-x)[3B2O3middotLi2O] (S6) glasses
34
434 Comparative study by magnetic susceptibility measurements of
xFe2O3middot(100-x)[As2O3middotBO] where BO =gt TeO2 or PbO and
xFe2O3middot(100-x) [3B2O3middotLi2O] glasses
The magnetic susceptibility data are in good agreement with the EPR result The magnetic
behavior of the glasses xFe2O3middot(100-x)[As2O3middotPbO] (S2) xFe2O3middot(100-x)[As2O3middotTeO2]
(S4) and xFe2O3middot(100-x)[3B2O3middotLi2O] (S6) for 3 x 50 mol Fe2O3 are presented in
figure 432 - 34
For (S2) glass systems up to x 10 mol x 3 mol (S5) glass systems and x 5
mol (S6) glass systems the temperature dependence of the reciprocal magnetic susceptibility
obeys a Curie law In this concentration range the iron ions are predominantly isolated orand
participate in dipole-dipole interactions At higher concentrations the reciprocal magnetic
susceptibility obeys a Curie-Weiss law with negative paramagnetic Curie temperature (p)
characteristic to antiferromagnetic coupled ions by means of super exchange interactions(fig
435) This behavior of iron ions is confirmed by the shape of the EPR spectra
80 100 120 140 160 180 200 220 240 260 2800
1
2
3
4
5
6
7
8
9
10
11
[
emu
mol
]-1
T [K]
3 mol 5 mol 10 mol 20 mol 35 mol 50 mol
Fig432 The temperature dependence of -1 for xFe2O3middot(100-x)[As2O3middotPbO] (S2)
3 x 50 mol
35
80 100 120 140 160 180 200 220 240 260 2800
1
2
3
4
5
6
7
8
9
10
T [K]
[
emu
mol
]-1
3 mol 5 mol 10 mol 20 mol 35 mol 50 mol
Fig433 The temperature dependence of -1 for xFe2O3middot(100-x)[As2O3middotTeO2] (S4)
3 x 50 mol
80 100 120 140 160 180 200 220 240 260 2800
1
2
3
4
5
6
7
8
9
10
11
3 mol 5 mol 10 mol 20 mol 35 mol 50 mol
T [K]
[
emu
mol
]-1
Fig434 The temperature dependence of -1 for xFe2O3middot(100-x)[3B2O3middotLi2O] (S6)
3 x 50 mol
36
0 10 20 30 40 50
0
10
20
30
40
50
x [mol]-
p [K]
(S2) (S4) (S6)
Fig435Concentration dependence of (p) for sistemele xFe2O3middot(100-x)[As2O3middotPbO] (S2) xFe2O3middot(100-x)[As2O3middotTeO2] (S4) and xFe2O3middot(100-x)[3B2O3middotLi2O] (S6)
for 3 x 50 mol Fe2O3
Using the representation 1 = f(T) the molar Curie constants CM the effective
magnetic moments and molar fraction of Fe3+(x1) şi Fe2+(x2) ions were calculated and
represented in tables 47-9
Table 47 Molar Curie constants effective magnetic moments and molar fraction of
Fe3+(x1) şi Fe2+(x2) ions in xFe2O3middot(100-x)[As2O3middotPbO] glasses (S2)
x [mol Fe2O3]
CMtimes102
[emu mol] ef
[microB] x1
[mol Fe23+O3]
x2 [mol Fe2
2+O3] 3 2526 58 261 039 5 393 56 332 168 10 7326 541 476 524 20 13459 519 53 147 35 23364 516 829 2671 50 32154 507 767 4233
Table 48 Molar Curie constants effective magnetic moments and molar fraction of
Fe3+(x1) şi Fe2+(x2) ions in xFe2O3middot(100-x)[As2O3middotTeO2] glasses (S4)
x [mol Fe2O3]
CMtimes102
[emu mol] ef
[microB] x1
[mol Fe23+O3]
x2 [mol Fe2
2+O3] 3 2571 585 277 023 5 4016 566 363 137 10 7911 562 686 314 20 14992 521 643 929 35 22676 509 601 2899 50 30959 497 313 4687
37
Table 49 Molar Curie constants effective magnetic moments and molar fraction of Fe3+(x1) şi Fe2+(x2) ions in xFe2O3middot(100-x)[3B2O3middotLi2O] glasses (S6)
The results allowed to consider that the magnetic properties of the studied glasses can
be explained through magnetic interractions between Fe3+ - Fe3+ Fe3+- Fe2+ and Fe2+- Fe2+ that
explain the dependences of RPE parameters concentration
SELECTED CONCLUSIONS
In this thesis xMOmiddot(100-x)[As2O3middotTeO2] xMOmiddot(100-x) [As2O3middotPbO] and
xMOmiddot(100-x)[3B2O3middotLi2O] glasses where MO =gt MnO or Fe2O3 were comparatively
studied in 0 le x le 50 mol The structural modifications of investigated glass matrices were
comparatively followed in function of the manganese or iron ions on the investigated glass
matrices were followed
The study by FT-IR spectroscopy shows that the evolution of the spectra of
xMnOmiddot(100-x) [As2O3middotPbO] with the addition and the increasing of the MnO content suggest
that the manganese ions break up a part of As ndash O ndash As Pb ndash O ndash Pb and probably of As ndash O ndash
Pb bonds The addition of MnO in the As2O3middotPbO glass matrix is leading to a disordering of
the glasses structure with the increasing of the MnO content
The evolution of the absorption bands for FT ndash IR spectrum of xFe2O3middot(1-x)
[As2O3middotPbO] glasses are determined by the addition of Fe2O3 content It can be observed to
shift the bands assigned As ndash O ndash As vibrations from AsO3 units due to changing to length As
ndash O ndash As bonds and interne angles of AsO3 units disappears PbO4 units and appears FeO6
units The addition of Fe2O3 in the As2O3middotPbO glass matrix determined a disordering of the
glasses structure with the increasing of the Fe2O3 content
From FT-IR absorption spectra of the investigated xMOmiddot(100-x)[As2O3middotTeO2] glasses
system where MO =gt MnO or Fe2O3 it can be observed that the addition and increasing of
manganese ions concluded the contraction of As-O-As bonds from totally symmetric
x [mol Fe2O3]
CMtimes102
[emu mol] ef
[microB] x1
[mol Fe23+O3]
x2 [mol Fe2
2+O3] 3 2542 582 268 032 5 3943 561 338 162 10 7423 544 506 494 20 13568 520 549 1451 35 23094 513 731 2769 50 31746 503 584 4416
38
stretching vibrations of AsO3 units for x ge10 mol there can be an increase in number of As-
O-As bonds from AsO3 units orand a length these linkage to doubly degenerate stretching
vibrations of AsO3 units and a stretching vibration mode of TeO3 tp with NBO It can be
remarked from the FT-IR absorption spectra the gradual transformation of symmetric
stretching vibration mode of Te-O bonds from TeO3 units in TeO4 (tbp) units and the presence
of MnO2 units Once with the addition of iron ions the xFe2O3middot(100- x)[As2O3middotTeO2]
glasses behave like xMnOmiddot(100-x)[As2O3middotTeO2] glasses but in this system the
appearance of FeO6 units can be seen
From FT-IR spectra in xMOmiddot(100-x)[3B2O3middotLi2O] glasses where MO =gt MnO or
Fe2O3 can be concluded that the addition of manganese or iron ions in vitreous matrices leads
to the increase of the disorder degree
The study by Raman spectroscopy shows that the evolution of the spectra the addition
of MnO in the [As2O3middotPbO]glass matrix determined an order degree of the vitreous matrix
The intensity of the bands attributed vibrations As ndash O ndash As bonds from As2O units and
bending vibrations of As ndash O ndash As from As2O units shift to a higher wave length that suggests
an increase in the As2O units comparative to AsO3 units With the increase of iron ions content
in the As2O3middotPbO glass matrix the number of these structural units decreases due to the
increasing of the disorder in the studied glasses
With the increasing of manganese content in As2O3TeO2 glass matrix the intensity
of these bands is increasing showing that the manganese content favorites the formation of
TeO4 (tbp) and TeO3 (tp) units For high concentrations of iron ions in xFe2O3middot(100-
x)[As2O3 TeO2] system of glasses the number of As-O-As linkages appear in Raman
spectrum due to stretching vibrations of As-O-As and vibrations of the continuous TeO4 (tbp)
network show a significant decrease
Studying the Raman spectra of xMOmiddot(1-x)[3B2O3middotLi2O] glass system where MO =gt
MnO or Fe2O3 it has been observed that the absorption bands presented in vitreous matrix
gradually decreased with an increase in the manganese or iron content in both glasses system
which suggested an increase of the disorder in these vitreous systems
The EPR spectra presents the behavior of manganese or iron ions in different vitreous
matrices xMOmiddot(100-x)[As2O3middotBO] where MO=gtMnO or Fe2O3 and BO =gt TeO2 or
PbO and xMOmiddot(100-x) [3B2O3middotLi2O] Glasses were investigated by EPR spectroscopy on a
large compositional range with 0 le x le 50 mol The absorption line centered at gef 43 and
is due to isolated Mn2+ ions The absorption line centered at gef 20 may be attributed to
Mn2+ species interacting by magnetic coupling dipolar and or super exchange the last ones
forming magnetic clusters The EPR spectra of Fe3+ in xFe2O3middot(100-x)[As2O3middotPbO]
xFe2O3middot(100-x)[As2O3middotTeO2] and xFe2O3middot(1-x)[3B2O3middotLi2O] are presented two absorption
lines centered at gef 43 and gef 20 up to x le 35mol Fe2O3 systems studied
39
The absorption line centered at gef 43 is due to isolated Fe3+ ions The absorption
line centered at gef 20 may be attributed to Fe3+ species interacting by magnetic coupling
dipolar and or super exchange the last ones forming magnetic clusters
The evolution of the spectra is easier to follow considering the dependence of
concentration on the EPR parameters the line - intensity (obtained as an integral of the area
under the corresponding EPR signal) J and the line - width ΔB The evolution of J and AB
reflects the structural transformations which appear in the glass matrices due to the increase of
manganese ions content
The magnetic susceptibility data are in good agreement with the EPR result The
magnetic behavior of the glasses from xMnOmiddot(100-x)[As2O3middotBO] where BO =gt TeO2 (S3)
or PbO (S1) and xMnOmiddot(100-x)[3B2O3middotLi2O] (S5) glasses for 3 le x le 50 mol MnO
For (S1) and (S3) system glasses up to x 3 mol and x 5 mol (S5) glass
system the temperature dependence of the reciprocal magnetic susceptibility obeys a Curie
law In this concentration range the manganese ions are predominantly isolated orand
participate in dipole-dipole interractions At higher concentrations the reciprocal magnetic
susceptibility obeys a Curie-Weiss law with negative paramagnetic Curie temperature (p)
characteristic to antiferromagnetic coupled ions by means of super exchange interractions This
behavior of manganese ions is confirmed by the shape of the EPR spectra Using the
representation 1 =f(T) the molar Curie constants CM the effective magnetic moments
and molar fraction of Mn2+(x1) şi Mn3+(x2) ions were calculated The magnetic susceptibility
data are in good agreement with the EPR result
The magnetic behavior of the glasses xFe2O3middot(100-x)[As2O3middotPbO] (S2)
xFe2O3middot(100-x)[As2O3middotTeO2] (S4) and xFe2O3middot(100-x)[3B2O3middotLi2O] (S6) for 3 x 50
mol Fe2O3 are presented For (S2) glass systems up to x 10 mol x 3 mol (S5)
glass systems and x 5 mol (S6) glass systems the temperature dependence of the
reciprocal magnetic susceptibility obeys a Curie law In this concentration range the iron ions
are predominantly isolated orand participate in dipole-dipole interactions At higher
concentrations the reciprocal magnetic susceptibility obeys a Curie-Weiss law with negative
paramagnetic Curie temperature (p) characteristic to antiferromagnetic coupled ions by
means of super exchange interactions(fig 435) This behavior of iron ions is confirmed by the
shape of the EPR spectra Using the representation 1 = f(T) the molar Curie constants
CM the effective magnetic moments and molar fraction of Fe3+(x1) şi Fe2+(x2) ions were
calculated
40
REFERENCES
Chapter 1
[1] I Ardelean bdquoIntroducere icircn studiul materialelor oxidice cu structură vitroasă EdNapocaStar Cluj Napoca 2002 [2] G Srinivasarao N Veeraiah J All Com 327 52-65(2001) [3] G Srinivasarao N Veeraiah J Phys Chem Solids 63705-717(2002) [4] DBecherescu VCristea FMarx IMenessz FWinter Chimia stării solide Ed Şt şi Encicl Bucucureştivol 1 1983 [5] J Wong CAAngell Glass-Structure by Spectroscopy Dekker Inc New York 1976 [6] BEWarren HKKrutter O Morningstat J Am Ceram Soc 19 202 (1936) [7] LLSperry JD Mackenzie Phys Chem Glasses 9 91 (1968) [8] WLKonijnendijk JMStevels J Non-Cryst Solids 18 307 (1975) [9] FCEversteyn JM Stevels HJ Naterman Phys Chem Glasses 1 134 (1963) [10] G Fuxi Optical and Spectroscopie Properties of Glass Springer-Verlag Shanghai Scientific Technical Pub Shanghai 1991 [11] YDYiannopoulos GDChryssikos EIKamitsos Phys Chem Glasses 42(3) 164 (2001) [12] MGFerreira da Silva BFOCosta J Non-Cryst Solids 293-295 534 (2001) [13] RYordanova YDimitriev VDimitriev S Kassabov DKlissurski JNon-Cryst Solids 201 141 (1996) [14] W L Konijnendijk J M Stevels J Non-Cryst Solids 18 307 (1980) [15] M Iron M Couzi ALevasseur JBrethous JSolidState Chem 31 285 (1980) [16] TFurukawa WBWhite PhzsChemGlasses 21 85 (1980) [17] E I Kamitsos M A Karakassides GD Chryssikos J Phys Chem 90 4528 (1986) [18] E I Kamitsos M A Karakassides GD Chryssikos J Phys Chem 91 1073 (1987) [19] TWBril Philips Res Rep Suppl 2 117 (1976) [20] E I Kamitsos M A Karakassides GD Chryssikos J Phys Chem 30 203 (1989) [21] BNMeera JRamakrishna J Non-Cryst Solids 159 1 (1993) [22] KWitke THubert PReich JRamanSpectr 24 407 (1993) [23] E I Kamitsos M A Karakassides Phys Chem Glasses 30 19 (1989) [24] MPeteanu Teză de doctoratrdquo Universitatea Babeş-Bolyairdquo Cluj Napoca (1989) [25] PCTaylor PJBray JPhys Chem Solids 33 43 (1972) [26] IArdelean MPeteanu GhIlonca DPop Solid State Commun 33 653 (1980) [27] AV De Wijn RE Van Balderen JKemPhys 46 4 (1967) [28] DL Griscom RE Griscom J Phys Chem Glasses 12 19 (1971) [29] JWH Schreurs JChem Phys 69 2151 (1978) [30] AlNicula M Peteanu IArdelean Studia Univ Babeş-Bolyai Physica 2 65 (1979) [31] M Peteanu IArdelean SFilip ITodor GSalvan Studia Univ Babeş-Bolyai Physica XL 2 9 (1995) [32] IArdelean M Peteanu SFilipV Simon ITodor Solid State Commun 105 (5) 339 (1998) [33] SKMendiratta EGuedes de Sousa JMatSci Lett7 733 (1988) [34] IArdelean M Peteanu SFilip V Simon GGyorffy Solid State Commun 102 (4) 341 (1997) [35] IArdelean M Peteanu SFilip V Simon FCiorcas ITodor JMagnMagn Mat 196-197 257 (1999) [36] JKliava RBerger YServant JEmery JMGreneche JTrokss J Non-Cryst Solids 202 205 (1996) [37] LDBogomolova NA Krasilnikova VLBogdanov VDKhaliev VV Mitrofanov J Non-Cryst Solids 188 130 (1995) [38] DLoveridge SPark PhysChem Glasses 12 19 (1971) [39] IArdelean G Salvan M Peteanu V Simon FCiorcas Mod PhysLett B 13 (22-23) 801 (1999)
41
[40] JLRao AMuraly EDRao J Non-Cryst Solids 202 215 (1996) [41] CPrakash S Husain RJ Singh SMollah JAlloys Compon 326 47 (2001) [42] EGuedes de Sousa SKMendiratta JMMachado Da Silva Portugal Phys 17 (3-4) 203 (1986) [43] TCastner GSNewell WCHolton CP Slichter JChem Phys 32 668 (1960) [44] SPChaudhuri SKPatra JMatSci 35 4735 (2000) [45] IArdelean HH Qiu HSakata Matt Lett 32 335 (1997) Chapter 2 [1] J Wong C A Angel Glass Structure by Spectroscopy Marcel Dekker inc New-York 1976 [2] I Ardelean bdquoIntroducere icircn studiul materialelor oxidice cu structură vitroasă EdNapocastar Cluj-Napoca 2002 [3] N Avram GH Mateescu Spectroscopia icircn infraroşu Aplicaţii icircn chimia organică Ed Tehnică Bucureşti 1968 [4] TIliescu Spectroscopie optică moleculară vibraţională şi electronică Ed Casa Cărţii de Ştiinţă Cluj- Napoca 2000 [5] S Aştilean bdquoMetode şi tehnici moderne de spectroscopie optică Ed Casa Cărţii de Ştiinţă Cluj - Napoca 2002 p 5 [6] I Ursu Rezonanţă Electronică de Spinrdquo Ed AcademieiBucureşti (1965) [7] CHHurd ContempPhys 23 (5) 469 (1982) [8] GWAnderson WDCompton JChemPhys52 6166 (1970) [9] MS Seehra GSrinivasan Landolt-Bornstein (New Series) SubVolume F3 Springer-Verlag Berlin 1994 [10] GToulouse ContempPhys 2115 (1977) [11] NMMurayMagnetic susceptybility EdInterscience New York P1773 1963 [12] JBGoodenough Magnetism and Chemical Bond EdInterscience New York 1963 [13] IArdelean G Salvan M Peteanu V Simon FCiorcas Mod PhysLett B 13 (22-23) 801 (1999) [14] IArdelean MPeteanu R Ciceo Lucăcel Studii de rezonanţă paramagnetică electronică şi magnetice ale unor ioni 3d icircn sticle pe bază de B2O3 Ed Presa Univesitară Clujeană 2005 [15] IArdelean PhysStatSol (b) 87K137 (1978) [16] IArdelean Solid State Commun 31 75 (1979) [17] EJFrieble LKWilson AWDozier DLKinser PhysStatSol (b) 45 323 (1971) [18] DWMoon JMAitken RKMcCrone GS Ciloszik PhysChe Glasses 16 (5) 91 (1975) [19] SFilip Teză de doctorat UnivBabeş-Bolyai Cluj Napoca 1996 [20] CJSchinkel GWRathenou Physics of Non-Crystaline Solids North Holland Publ Co Amsterdam 215 1965 [21] EJFrieble LKWilson NCKoon DLKinser JAm Ceram Soc 57-237 (1974) [22] RJLandry JT Fournier CGYoung JChemPhys 46 1285 (1967) [23] WSimpson PhysStatSolidi b40 207 (1970) [24] RHasegawa PhysRevB b(5) 1631 (1971) [25] IArdelean GhIlonca MPeteanu Solid State Commun 52 145 (1984) [26] IArdelean GhIlonca OCozar J Physique 49 C8 1107 (1988) Chapter 3 [1] LFBates Modern Magnetism p133 Cambridge University Press London 1962 [2] IArdelean GhIlonca DBarbos Solid State Commun 40 769 (1981) [3] EBurzo IUrsu DUngur IArdelean JMatSci 15 581 (1980) [4] EBurzo IUrsu DUngur IArdelean MatResBull 15 1273 (1980) [5] DLGriscom Glass Science and Technology 48 151 (1990) [6] PJBray AH Silver Modern aspects of the vitreous state vol1 Butterworth
42
London 1960 [7] IArdelean Teza de doctorat UnivBabeş-Bolyai Cluj Napoca 1979 [8] SAştilean bdquoMetode şi tehnici moderne de spectroscopie opticărdquo EdCasa Cărţii de Ştiinţă Cluj ndash Napoca 2002 p5 [9] IArdelean RCiceo-Lucăcel ldquoFizica şi Tehnologia Materialelor Oxidice Lucrări Practicerdquo Ed Univ ldquoBabeş-Bolyairdquo Cluj-Napoca 2000 [10] VPop IChicinaş NJumate Fizica materialelor Metode experimentalerdquo EdPresa Universitară Clujeană 2001 [11] IUrsu Rezonanţă electronică de spinrdquo EdAcademiei Bucureşti 1965 Chapter 4 [1] I Ardelean S Lupşor D Rusu Solid State Sci 10 1384(2008) [2] I Ardelean S Lupşor D Rusu trimis spre publicare la Physica B decembrie 2009 [3] P Tarte Spectrochim Acta 18 467 (1962) [4] R A Condrate J Non ndash Cryst Solids 84 26 (1986) [5] G Srinivasarao N Veeraiah Phys Stat Sol (a) 191 370(2002) [6] G Srinivasarao N Veeraiah J Phys Chem Solids 63 705(2002) [7] G Srinivasarao N Veeraiah J All Com 327 52 (2001) [8] DK Durga N Veeraiah Bull Mater Sci 24 (4) 421 (2001) [9] F F Bentley L D Smithson A L Rozek InfraredndashSpectra and Characteristic Frequencies 700-300 cm-1 Interscience New York 1968 p 103 [10] O Noguera T Merle-Mejean AP Mirgorodsky MB Smirnov P Thomas J-C Champarnaud-Mesjard J Non-Cryst Solids 330 50 (2003) [11] BVR Chowdari KL Tan Fang Ling Solid State Ionics 113 ndash 115 711(1998) [12] C Jiang J Zhang H Mao F Gan Glass Technol 39(6) 200(1998) [13] MR Sahar K Sulhadi MS Rohani J Mater Sci 42 824(2007) [14] C Horea D Rusu I Ardelean J Mater Sci Mater Electron 20 905(2009) [15] GE Rachkovskaya GB Zakharevich J Appl Spectrosc 74 86(2007) [16] I Ardelean S Lupşor D Rusu trimis spre publicare la Journal of Materials Science Materials in Electronics decembrie 2009 [17] I Ardelean S Lupşor D Rusu trimis spre publicare la Modern Physics Letters B decembrie 2009 [18] R Iordanova Y Dimitriev V Dimitrov S Kassabov D Klissurski J Non ndash Cryst Solids 231 227 (1998) [19] R Iordanova Y Dimitriev S Kassabov D Klissurski J Non ndash Cryst Solids 204 141 (1996) [20] J O Jensen S J Gilliam A Banerjee D Zeroka S J Kirkby C N Merrow J Mol Struct (Theochem) 664 145 (2003) [21] G N Papatheodorou S A Solin Solid State Commun 16 5 (1975) [22] BVR Chowdari KL Tan Fang Ling J Mat Sci 35 2015 (2000) [23] R C Lucacel C Marcus V Timar I Ardelean Solid State Sci 9 850 (2007) [24] CP Varsamis EI Kamitsos GD Chryssikos Solid State Ionics 136ndash137 1031 (2000) [25] Sherief M Abo-Naf Fatma H El Batal Moenis A Azooz Mat Chem Phys 77 846 (2002) [26] SG Motke SP Yawale SS Yawale Bull Mater Sci 25 (10) (2002) [27] R Akagi N Ohtori N Umesaki J Non ndash Cryst Solids 293 471(2001) [28] E I Kamitsos M A Karakassides G D Chryssikos J Phys Chem 91(5) 1073 (1987) [29] H Ushida Y Iwadate T Hattori S Nishiyama K Fukushima Y Ikeda M Yamaguchi M Misawa T Fukunaga T Nakazawa S Jitsukawa J Alloys Compd 377 167 (2004) [30] I Ardelean F Ciorcas M Peteanu S Lupşor G Salvan Balkan Phys Lett 5 860 (1997)
43
[31] I Ardelean M Peteanu V Simon O Cozar F Ciorcas S Lupşor J Magn Magn Mater 196 253 (1999) [32] IArdelean MPeteanu GhIlonca Phys Stat Sol (a) 58 K33(1980) [33] IArdelean MPeteanu R Ciceo-Lucăcel ldquoStudii de rezonanţă paramagnetică electronică şi magnetice ale unor ioni 3d icircn sticle pe bază de B2O3rdquo Ed Presa Univ Clujeană Cluj Napoca 2005 p 171 [34] JLRao AMuraly EDRao J Non-Cryst Solids 202 215 (1996) [35] RPSChakradhar AMurali JLRao Optical Mat 10 109 (1998) [36] IArdelean MPeteanu SFilip VSimon GGyorffy Solid State Commun 102(4) 341 (1997) [37] IArdelean MPeteanu VSimon SFilip FCiorcaş ITodor J Magn Magn Mat 196-197 257 (1999) [38] IArdelean GSalvan MPeteanu VSimon CHimcinschi FCiorcas Mod Phys Lett B 13(22-23) 801 (1999) [39] IArdelean HHQiu HSakata Mat Lett 32 335 (1997) [40] SPChaudhuri SKPatra J Mat Sci 35 4735 (2000) [41] I Ardelean M Peteanu V Simon G Salvan J Mat Sci Technol 18 (3) 1 (2002)
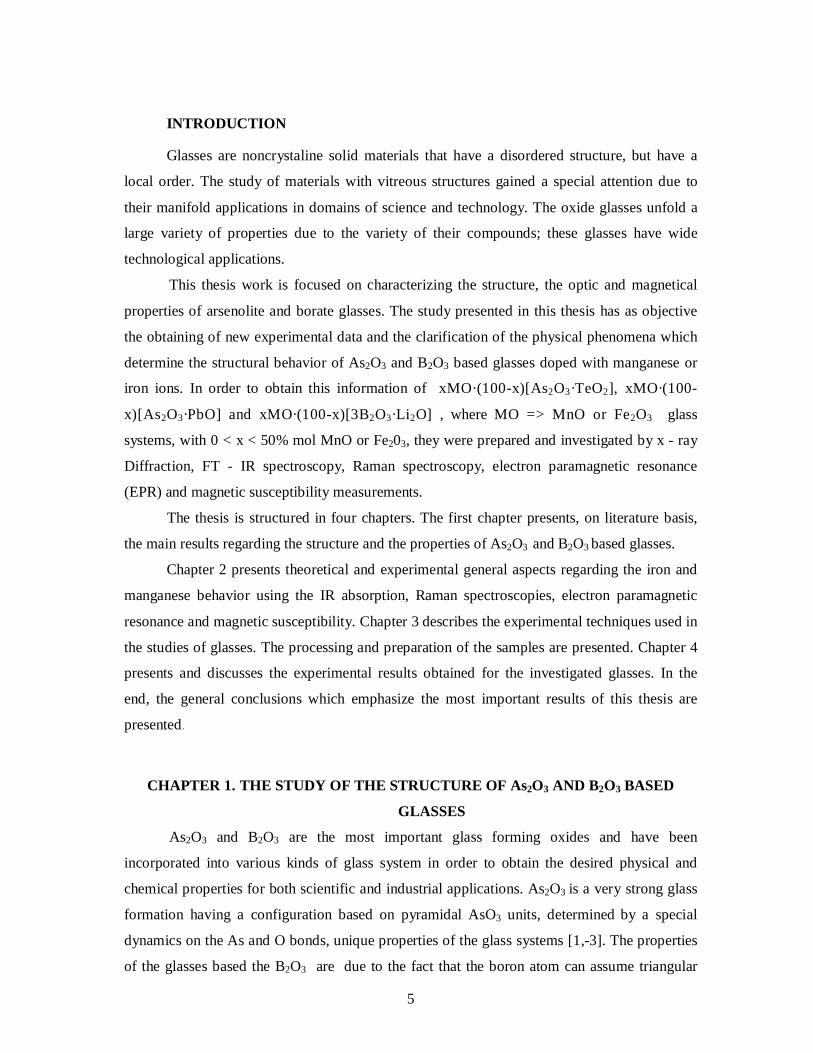
5
INTRODUCTION
Glasses are noncrystaline solid materials that have a disordered structure but have a
local order The study of materials with vitreous structures gained a special attention due to
their manifold applications in domains of science and technology The oxide glasses unfold a
large variety of properties due to the variety of their compounds these glasses have wide
technological applications
This thesis work is focused on characterizing the structure the optic and magnetical
properties of arsenolite and borate glasses The study presented in this thesis has as objective
the obtaining of new experimental data and the clarification of the physical phenomena which
determine the structural behavior of As2O3 and B2O3 based glasses doped with manganese or
iron ions In order to obtain this information of xMOmiddot(100-x)[As2O3middotTeO2] xMOmiddot(100-
x)[As2O3middotPbO] and xMOmiddot(100-x)[3B2O3middotLi2O] where MO =gt MnO or Fe2O3 glass
systems with 0 lt x lt 50 mol MnO or Fe203 they were prepared and investigated by x - ray
Diffraction FT - IR spectroscopy Raman spectroscopy electron paramagnetic resonance
(EPR) and magnetic susceptibility measurements
The thesis is structured in four chapters The first chapter presents on literature basis
the main results regarding the structure and the properties of As2O3 and B2O3 based glasses
Chapter 2 presents theoretical and experimental general aspects regarding the iron and
manganese behavior using the IR absorption Raman spectroscopies electron paramagnetic
resonance and magnetic susceptibility Chapter 3 describes the experimental techniques used in
the studies of glasses The processing and preparation of the samples are presented Chapter 4
presents and discusses the experimental results obtained for the investigated glasses In the
end the general conclusions which emphasize the most important results of this thesis are
presented
CHAPTER 1 THE STUDY OF THE STRUCTURE OF As2O3 AND B2O3 BASED
GLASSES
As2O3 and B2O3 are the most important glass forming oxides and have been
incorporated into various kinds of glass system in order to obtain the desired physical and
chemical properties for both scientific and industrial applications As2O3 is a very strong glass
formation having a configuration based on pyramidal AsO3 units determined by a special
dynamics on the As and O bonds unique properties of the glass systems [1-3] The properties
of the glasses based the B2O3 are due to the fact that the boron atom can assume triangular
6
and tetrahedral coordination and also to the different ways through which the borate buildings
units can be linked together [4-9]
The behavior of various borate species in the glass structure is determined by the nature
of modifier oxides (TeO2 PbO etc) In most binary borate glasses the glass properties change
almost linearly with composition [10-17] In binary borate glasses the properties of these show
a major deviation from linearity which depends on modifier oxide The structural reasons for
this is generally due to the change in the coordination of boron atom from 3 to 4 and back
again Many technological applications of these glasses depend of this effect since is produces
many improvements [18-23]
The introduction of MnO [24-32] or Fe2O3 [33-45] into diamagnetic glasses transform
them into paramagnetic glasses The introduction of iron and manganese in small percentages
modifies the physical properties of the glasses and the material is more accessible for a
complete structural characterization
In order to extend the available information concerning the interesting class of As2O3
and B2O3 based glasses we investigated glasses by means of different physical methods We
obtained valuable information concerning the structure and structural changes of the glasses
that occur with the addition of transitional oxide metals
CHAPTER 2 METHODS USED IN THE STUDY OF STRUCTURE AND
PROPERTIES OF OXIDE GLASSES
In this chapter some of the methods used in the investigation of the structure and
properties of vitreous systems are presented The study of the structure and properties of oxide
glasses with transitional metals ions IR and Raman spectroscopies electron paramagnetic
resonance and magnetic susceptibility measurements were chosen as investigation methods
The electromagnetic radiation (EM) with frequencies between 4000 and 400 cm -1 called
infrared radiation (IR) is used to obtain information connected to the structure of the
compound and as an analytic method to test the purity of the compound Its application in
organic chemistry is known as IR spectroscopy The radiation is absorbed by organic
molecules and converted in molecular vibration energy When the radiant energy coincides
with a specific molecular vibration the absorption appears The wave length at which the
radiation is absorbed by the organic molecule gives information regarding the functional
groups presented in the molecule [1-4]
The Raman spectroscopy brings useful contributions to the molecular vibrations study
The interraction mechanism of electromagnetic radiation with the molecular vibration which
forms the Raman spectroscopy theoretical basis differs from the one of the process which
forms the IR spectroscopy theoretical basis [4]
7
Another method used in the investigation of the glass system is the electron paramagnetic
resonance (RPE) This method is one of the most powerful techniques for local order
investigation RPE is a method widely used to describe the fundamental states and to
characterize the vicinities effect on the energetic levels of the paramagnetic centers The
method consists in the study of the electronic split levels of the atoms in the presence of an
external magnetic field [6] The Mn2+ EPR spectra are characterized by resonance absorptions
at gef 43 gef 33 and gef 20 The resonance line centered at gef 43 is
corresponding to the isolated Mn2+ ions The line from gef 20 is attributed to Mn2+ ions
involved in magnetic interactions
The Fe3+ EPR spectra are characterized by resonance absorptions at g 97 g 6 g 43
and g 20 The resonance line from g 97 is related to Fe3+ ions disposed in rhombic
environment The resonance line at g 6 was assigned to an axial distortion of the
paramagnetic ions neighborhood The resonance line at g 43 is corresponding to the isolated
Fe3+ ions situated in octahedral rhombic or tetragonal symmetric distorted neighborhoods The
line from gef 20 is attributed to Fe3+ ions involved in magnetic interactions
Along with the EPR spectroscopy the magnetic susceptibility measurements provide
useful information about the valence state and the interaction involving the transitional metal
ions in vitreous materials [7-10]
Different vitreous systems with manganese or iron ions were intensively studied by
magnetic susceptibility measurements to determine the magnetic behavior and the valence
states of these ions in these systems It was observed that the presence of the manganese or iron
ions in different valence states depends on the chemical composition of the vitreous matrix on
the valence of the vitreous network former and modifications and on the preparation of the
environment The magnetic properties of the oxide glasses with manganese or iron ions were
assigned to the antiferromagnetic couple between Mn2+-Mn2+ Mn2+-Mn3+ and Mn3+-Mn3+
[19-26] or Fe -Fe3+ Fe2+-Fe2+ and Fe3+-Fe2+ ions [11-18]
CHAPTER 3 EXPERIMENTAL TECHNIQUES
We have prepared glasses of the xMOmiddot(100-x)[As2O3middotTeO2] xMOmiddot(100-
x)[As2O3middotPbO] şi xMOmiddot(100-x)[3B2O3middotLi2O] glass structure where MO =gt MnO or Fe2O3
with 0 lt x lt 50 mol used components of reagent grade purity MnCO3 Fe2O3 As2O3
H3BO3 PbO Li2CO3 şi TeO2 in suitable proportions to obtain the desired composition The
mixtures were melted in sintered corundum crucibles introduced in an electric furnace directly
at 1250 C and kept for 5 minutes at this temperature They were quickly cooled at room
temperature by pouring onto stainless steel plates
The structure of the samples was analyzed by means of x-ray Diffraction using powders
with a Bruker D8 Advanced diffract meter
8
The FT - IR spectra have been recorded using a Bruker Equinox 55 with a spectral range
between 4000 cm -1 and 370 cm -1 A MIR GLOBAR generator cooled with air was used The
detection was carried out with a DLATGS detector with a KBr window The spectral
resolution was about 05 cm1 The samples were prepared using KBr pellet technique
The Raman spectra were recorded on bulk samples at room temperature using an
integrated FRA 106S Raman module attached to Bruker Equinox 55 with a spectral range
from 3600 cm -1 to 70 cm -1 An NdYAG laser with an output power of 500 mW and a 1064
nm radiation was used The detection was carried out with an ultra sensitive D418-T detector
cooled with liquid nitrogen The spectral resolution was about 1 cm1
The EPR spectra were obtained at room temperature with an Adani Portable EPR
Spectrometer PS8400 in X-frequency band (94 GHz) For these measurements equal
quantities of powders from the investigated samples closed in glass tubes were used
Magnetic susceptibility measurements were performed on a Faraday type balance in the 80
- 300 K temperature range The sensitivity of the equipment was 10-7 emug
CHAPTER 4 RESULTS AND DISCUSSION REGARDING THE STUDY OF
xMOmiddot(100-x)[As2O3middotTeO2] xMOmiddot(100- x)[As2O3middotPbO] şi xMOmiddot(100-x)[3B2O3middotLi2O]
GLASS STRUCTURE WHERE MO =gt MnO or Fe2O3
In this chapter the results obtained by following the study of the structure and
properties of oxide glasses with transitional metals ions by FT- IR and Raman spectroscopies
electron paramagnetic resonance and magnetic susceptibility measurements are presented The
structural changes and magnetic properties with the manganese and iron content were
followed
41 Comparative study by FT-IR and Raman spectroscopies of xMOmiddot(100-
x)[As2O3middotTeO2] xMOmiddot(100- x)[As2O3middotPbO] şi xMOmiddot(100-x)[3B2O3middotLi2O] glasses
where MO =gt MnO or Fe2O3
411 Comparative study by FT-IR spectroscopy of As2O3middotTeO2 and
As2O3middotPbO vitreous matrices
In order to obtain new information regarding the role of the modifier in the
formation of vitreous matrices comparative studies by FT-IR spectroscopy were made
The FT-IR spectroscopy is represented in figure 41(ab) The wave length and the
structural assignments of FT ndash IR spectra of As2O3middotPbO and As2O3middotTeO2 vitreous matrices
are represented in table 41
9
400 600 800 1000 1200
Wavenumber [cm-1]
Abs
orpt
ion
[au
]
407
594
821
794
1119
As2O
3PbO
a)
a
400 600 800 1000 1200
As2O3TeO2
Abs
orpt
ion
[ua
]
Wavenumber [cm-1]
85473
3
644
1119
b)
b
Fig41 FT ndash IR spectra of vitreous matrices a As2O3middotPbO şi b As2O3middotTeO2
The FT ndash IR spectrum of As2O3middotPbO glass matrix presents five absorption bands at ~
1119 cm-1 ~ 821 cm-1 ~ 794 cm-1 ~ 594 cm-1 and ~ 407 cm-1(Fig41a)
The band from ~ 1119 cm-1 is due to totally symmetric stretching vibrations of AsO3
units [5 ndash 7] The bands from ~ 821 cm-1 and ~ 794 cm-1 are due to doubly degenerate
stretching vibrations of AsO3 structural units [5 ndash 7] The large band centered at ~ 594 cm-1 can
be due to totally symmetric bending vibrations of AsO3 structural units [5-7] The band from ~
407 cm-1 can be due to vibrations of Pb ndash O bonds from PbO4 structural groups [7]
Following As2O3TeO2 glass matrix spectrum presented in Fig 41b four bands can be
observed located at ~ 644 cm-1 ~ 733 cm-1 ~ 854 cm-1 and ~ 1119 cm-1 The band from ~ 644
cm-1 can be assigned to totally symmetric bending vibrations of AsO3 units [5-7] and also
stretching vibration mode of TeO4 tbp with bridging oxygen[11] The band from ~ 733 cm-1
can be assigned to the symmetric stretching vibration mode of Te-O bonds in TeO3 units
[15] The band from ~ 854 cm-1 can be assigned to doubly degenerate stretching vibrations of
AsO3 units [5-7] and also to the stretching vibration mode of TeO3 tp with NBO [11] The band
10
from ~ 1119 cm-1 can be assigned to totally symmetric stretching vibrations of AsO3 units [5-
7] These bands presented in As2O3TeO2 glass matrix spectrum confirm the presence of
AsO3 TeO4 tbp and TeO3 tp units in the structure of the glass matrix but due to the broadness
of the bands it can not be told for sure which one of these units is predominant
Table 41Wavenumber and the structural assignments of FT ndash IR spectra of
As2O3middotPbO and As2O3middotTeO2 vitreous matrices
~ [cm 1 ]
As2O3middotPbO As2O3middotTeO2
Attribution
~1119 cm-1
~ 1119 cm-1
Totally symmetric stretching vibrations of AsO3 units
~ 821cm-1
Doubly degenerate stretching vibrations of AsO3 structural units
~ 854 cm-1
Doubly degenerate stretching vibrations of AsO3 units Stretching vibration mode of TeO3 tp with NBO
~ 794 cm-1
Doubly degenerate stretching vibrations of AsO3 structural units
~ 733 cm-1
Symmetric stretching vibration mode of Te-O bonds in TeO3 units
~ 594 cm-1
~ 644 cm-1
Totally symmetric bending vibrations of AsO3 units
~ 407 cm-1 Vibrations of Pb ndash O bonds from PbO4 structural groups
412 Comparative study by FT-IR spectroscopy of
xMOmiddot(100- x)[As2O3middotPbO] vitreous systems where MO =gt MnO or Fe2O3
The infrared absorption spectra obtained for xMOmiddot(1-x)[As2O3middotPbO] glass system
where MO =gt MnO or Fe2O3 with 0 le x le 50 mol are presented in figure 42-3 and their
structural assignments are summarized in table 41
The spectra were discussed on the basis of the method given by Tarte [3] and Condrate
[4] by comparing the experimental data of glasses with those of related crystalline compounds
The characteristic absorption bands for crystalline As2O3 [5-8] PbO [79] and characteristic
bands for Fe2O3 [1819 ] were used as a reference point in the results discussion
The FT ndash IR spectra of the investigated glasses suggest a structure formed of AsO3 and
PbO4 structural units where As2O3 plays the role of the glass former and PbO plays the role of
the glass modifier The evolution of the spectra with the addition and the increasing of the
MnO content suggest that the manganese ions break up a part of As ndash O ndash As Pb ndash O ndash Pb and
probably of As ndash O ndash Pb bonds The addition of MnO in the As2O3middotPbO glass matrix is leading
to a disordering of the glasses structure with the increasing of the MnO content
The evolution of the absorption bands for FT ndash IR spectrum of xFe2O3middot(1-x)
[As2O3middotPbO] glasses are determined by the addition of Fe2O3 content It can be observed to
11
shift the bands assigned As ndash O ndash As vibrations from AsO3 units due to changing to length As
ndash O ndash As bonds and interne angles of AsO3 units disappears PbO4 units and appears FeO6
units The addition of Fe2O3 in the As2O3middotPbO glass matrix determined a disordering of the
glasses structure with the increasing of the Fe2O3 content
400 600 800 1000 1200
610
813
449
1093
423
449
616
760 848
821
794
594
20A
bsor
ptio
n [a
u]
Wavenumber [cm-1]
05
0
35
10
35
50
1
MnO
407
1119
693
Fig 42 FT ndash IR spectra of xMnOmiddot(100- x)[As2O3middotPbO] glasses
400 600 800 1000 1200
616
462
811
407
594
Abs
orpt
ion
[au
]
Wavenumber [cm -1]
05
20
0
35
10
35
50
1
Fe2O3
821
79469
3
1119
1084
610
Fig43 FT ndash IR spectra of xFe2O3middot(100- x)[As2O3middotPbO] glasses
12
413 Comparative study by FT-IR spectroscopy of
xMOmiddot(100-x)[As2O3middotTeO2] vitreous systems where MO =gt MnO or Fe2O
The infrared absorption spectra obtained for xMOmiddot(1-x)[As2O3middotTeO2] glass system
where MO =gt MnO or Fe2O3 with 0 le x le 50 mol are presented in figure 44 -5 and their
structural assignments are summarized in table 41[1617] The characteristic absorption bands
for crystalline As2O3 [5-8] PbO [79] TeO2 [810-15] MnO2 and Mn3O4 [9] and characteristic
bands for Fe2O3 [1819 ] were used as a reference point in the results discussion
Fig 44 FT ndash IR spectra of xMnOmiddot(100- x)[As2O3middotTeO2] glasses
Fig45 FT ndash IR spectra of xFe2O3middot(100- x)[As2O3middotTeO2] glasses
400 600 800 1000 1200
565
422 690 830
05
Abs
optio
n [a
u]
Wavenumber [cm-1]
0
3
5
35 50
1
MnO
854 733 644
1119
10 20
400 600 800 1000 1200
462650
812
713
561
05
20
Wavenumber [cm-1]
Abs
orpt
ion
[au
]]
0
3 5
10
35 50
1
Fe2O3
854 733
644
1119
13
This behavior of the studied glasses with the addition and increasing of MnO content
suggests that the structure observed in the glass matrix is conserving up to 5 mol MnO
where the structure takes another form From a structure dominated by AsO3 TeO4 tbp and
TeO3 tp units the structure became dominated by TeO4 tbp and MnO2 units and in a small
measure of AsO3 and TeO3 tp units For higher concentrations it can not be specified exactly
which of the last two structural units have the biggest proportion in these glasses From FT-IR
absorption spectra of the investigated glass system it can be observed that the addition and
increasing of manganese ions concluded the contraction of As-O-As bonds from totally
symmetric stretching vibrations of AsO3 units for x ge10 mol there can be an increase in
number of As-O-As bonds from AsO3 units orand a length these linkage to doubly degenerate
stretching vibrations of AsO3 units and a stretching vibration mode of TeO3 tp with NBO It
can be remarked from the FT-IR absorption spectra the gradual transformation of symmetric
stretching vibration mode of Te-O bonds from TeO3 units in TeO4 (tbp) units and the presence
of MnO2 units Once with the addition of iron ions the xFe2O3middot(100- x)[As2O3middotTeO2]
glasses behave like xMnOmiddot(100-x)[As2O3middotTeO2] glasses but in this system the
appearance of FeO6 units can be seen
414 Comparative study by FT-IR spectroscopy of
xMnOmiddot(100- x)[As2O3middotBO] vitreous systems were BO =gt TeO2 or PbO
The infrared absorption spectra obtained for xMnOmiddot(100- x)[As2O3middotBO] vitreous
systems where BO =gt TeO2 or PbO with 0 le x le 50 mol MnO are presented in figure
42 and 44 Following the infrared absorption spectra it can be observed that for
xMnOmiddot(100- x)[As2O3middot PbO] glass system the most disordered structure to exist for 0
le x le 5 mol MnO and to xMnOmiddot(100-x)[As2O3middot TeO2] glass system for 1 le x le 5 mol
MnO For x ge 5 mol MnO manganese ions break up a part of As ndash O ndash As Pb ndash O ndash Pb
and probably of As ndash O ndash Pb bonds to favor the increase in number of PbO4 units and
appearance of MnO2 units For x ge 10 mol MnO observed comparatively in both system
glasses the addition of manganese ions suggests for the first system a modification in linkage
characteristic units and for the second system an improvement for structural units of As2O3middot
TeO2 vitreous matrice also linkage characteristic units
415 Comparative study by FT-IR spectroscopy of
xFe2O3middot(100-x)[As2O3middotBO] vitreous systems where BO =gt TeO2 or PbO
The infrared absorption spectra obtained for xFe2O3middot(100- x)[As2O3middotBO] vitreous
systems where BO =gt TeO2 or PbO with 0 le x le 50 mol Fe2O3 are presented in figure
43 and 45
14
The evolution of the spectra with the addition and the increasing of the Fe2O3 content
suggest that the iron ions break up a part of As ndash O ndash As Pb ndash O ndash Pb and probably of As ndash O
ndash Pb bonds It can be observed a shift in the bands assigned As ndash O ndash As vibrations from AsO3
units due to changing to length As ndash O ndash As bonds and interne angles of AsO3 units the PbO4
units disappear and FeO6 units appear For x ge 5 mol Fe2O3 observed comparatively in
both system glasses the addition of iron ions suggests for the first system a modification in
linkage characteristic units of As2O3middotPbO and for the second system an improvement for
structural units of As2O3middot TeO2 vitreous matrice also linkage characteristic units appearance
of FeO6 units in both system
416 Comparative study by Raman spectroscopy of
As2O3middotTeO2 and As2O3middotPbO vitreous matrices
In order to obtain new information regarding the role of the modifier in the
formation of vitreous matrices there were made comparative studies by Raman
spectroscopy The Raman spectroscopy are presented in figure 46(ab) The wave
length and the structural assignments of Raman spectra of As2O3middotPbO şi As2O3middotTeO2 vitreous
matrices are presented in table 42
Table 42Wavenumber and the structural assignements of Raman spectra
of As2O3middotPbO and As2O3middotTeO2 vitreous matrices
~ [cm 1 ]
As2O3middotPbO As2O3middotTeO2
Attribution
~826 cm-1
~ 816 cm-1
Stretching vibrations of As-O-As
~ 752 cm-1
Vibrations of the continuous TeO4 (tbp) network
~ 627 cm-1
Vibrations As ndash O ndash As bonds from As2O units
~ 580 cm-1
Stretching vibrations of As-O-As
~ 525 cm-1
Vibrations O-As-O bonds from AsO3 units
~ 438cm-1
Symmetric bending vibrations of Te ndash O ndash Te vertex linkages between different TeO4 (tbp) TeO3+1 polyhedra Stretching vibrations of As-O-As of AsO3 units
~ 345 cm-1
Bending vibrations of As ndash O ndash As from As2O units
15
200 400 600 800 1000
As2O3PbO
Ram
an In
tens
ity [a
u]
LWavenumber [cm-1]
345
826
525
627a)
a
200 400 600 800 1000
816
752
580 R
aman
Inte
nsity
[au
]
Wavenumber [cm-1]
As2O3TeO2
438
b)
b
Fig46 Raman spectra of vitreous matrices a As2O3middotPbO şi b As2O3middotTeO2
The Raman spectrum of As2O3middotPbO glass matrix presents four bands at 826 cm-1
627 cm-1 525 cm-1 and 345 cm-1 The band from 826 cm-1 can be assigned to As ndash O ndash
As stretching vibrations [20] The band centered at 627 cm-1 can be assigned to vibrations As
ndash O ndash As bonds from As2O units the band from 525 cm-1 are assigned vibrations O-As-O
bonds from AsO3 units [21] The band of 345 cm-1 are attributed to As ndash O ndash As bending
vibrations from As2O units[2021]
The Raman spectrum of As2O3middot TeO2 glass matrix presents four bands at 816 cm-1
752 cm-1 580 cm-1 and 438 cm-1 The band from 816 cm-1 can be assigned to As ndash O ndash
As stretching vibrations [20] The band centered at 752 cm-1 can be assigned to vibrations of
the continuous TeO4 (tbp) network [22] The band of 580 cm-1 are attributed to As ndash O ndash As
stretching vibrations [12] The band centered at 438 cm-1 can be assigned symmetric bending
vibrations of Te ndash O ndash Te vertex linkages between different TeO4 (tbp) TeO3+1 polyhedra and
As ndash O ndash As stretching vibrations of AsO3 units
16
417 Study by Raman spectroscopy of xMOmiddot(100- x)[As2O3middotPbO]
vitreous systems where MO =gt MnO or Fe2O3
The Raman spectra obtained for xMOmiddot(100- x)[As2O3middotPbO] vitreous systems where
MO =gt MnO or Fe2O3 with 0 le x le 50 mol are presented in figure 47-8 and their
structural assignments are summarized in table 42
200 400 600 800 1000
368
833
345
1
3
Lungimea de unda [cm-1]
Inte
nsita
te R
aman
[ua
]
20
05
0
5
10
35
50
MnO
826
525
627
Fig 47 Raman spectra of xMnOmiddot(100- x)[As2O3middotPbO] glasses
The addition of MnO in the glass matrix determined an order degree of the vitreous
matrix The intensity of the bands attributed vibrations As ndash O ndash As bonds from As2O units
and bending vibrations of As ndash O ndash As from As2O units shift to a higher wave length that
suggests an increase in the As2O units comparative to AsO3 units
To the band from 826 cm-1 the addition of manganese ions in the glass matrix
determine for x = 05 mol an decreasing in intensity whereupon increasing for higher
concentrations The intensity of bands centered at 627 cm-1 and 525 cm-1 for x = 05
mol MnO decrease and disappear for x = 1 mol MnO The band of 345 cm-1 slowly
increases with the addition of manganese ions
To the band from 826 cm-1 the addition of iron ions in the glass matrix determines
for x = 05 mol an increase in intensity a gradual decrease and disappearance for x = 35
mol Fe2O3 of the bands observed for the glass matrix For higher concentrations of
manganese these bands gradually decrease The intensity of bands centered at 627 cm-1 and
525 cm-1 for x = 05 mol Fe2O3 increase and shift to 612 cm-1 and 501 cm-1 whereas
17
they gradually decrease and disappear for x = 10 mol Fe2O3 The band of 345 cm-1
decreases with the addition of iron ions and disappears for x = 20 mol Fe2O3
200 400 600 800 1000
3
612
501
Wavenumber [cm-1]
Ram
an In
tens
ity [a
u]
05
20
0
5
10
3550
1
Fe2O3
345
826
525
627
Fig 48 Raman spectra of xFe2O3middot(100- x)[As2O3middotPbO] glasses
With the increase of iron ions content in the As2O3middotPbO glass matrix the number of
these structural units decreases due to the increasing of the disorder in the studied glasses
418 Study by Raman spectroscopy of xMOmiddot(100-x)[As2O3middotTeO2]
vitreous systems were MO =gt MnO or Fe2O3
The Raman spectra obtained for xMOmiddot(100- x)[As2O3middot TeO2] vitreous systems
where MO =gt MnO or Fe2O3 with 0 le x le 50 mol are presented in figure 49-10 and their
structural assignments are summarized in table 42
The Raman spectrum of the glass matrix suggests a structure formed from TeO4 (tbp)
and TeO3 (tp) units where the presence of As ndash O ndash As bonds can not be excluded The
addition of manganese ions is leading to a modification of the structure proposed by the
spectrum of the glass matrix Then with the increasing of manganese content the intensity of
these bands is increasing showing that the manganese content favorises the formation of TeO4
(tbp) and TeO3 (tp) units
18
200 400 600 800 1000
783
850
768
416
816
752
Wavenumber [cm -1]
Ram
an In
tens
ity [a
u]
13
20
05
0
5
10
35
50
MnO
438
580
660
Fig 49 Raman spectra of xMnOmiddot(100- x)[As2O3middot TeO2] glasses
200 400 600 800 1000
226
294
408
673 751
5
W avenumber [cm -1]
Ram
an In
tens
ity [a
u]
05
20
0
3
10
35
50
1
Fe2O
3
816
752
438
580
Fig 410 Raman spectra of xFe2O3middot(100- x)[As2O3 TeO2] glasses
The Raman spectra of xFe2O3middot(100- x)[As2O3 TeO2] glasses present a significant
advance to the TeO4 (tbp) TeO3+1 polyhedra and AsO3 units represented in Raman spectrum
by the ~ 438 cm-1 band comparative with the modifications determined by the addition of
manganese ions in vitreous matrix For high concentrations of iron ions in xFe2O3middot(100-
x)[As2O3 TeO2] system of glasses the number of As-O-As linkages appear in Raman
spectrum due to stretching vibrations of As-O-As and vibrations of the continuous TeO4 (tbp)
network show a significant decrease
19
419 Comparative study by Raman spectroscopy of xMnOmiddot(100- x)[As2O3middotBO]
vitreous systems were BO =gt TeO2 or PbO
The addition of MnO to xMnOmiddot(100- x)[As2O3middotPbO] glass system do not break As
ndash O ndash As bonds into characteristic units and contribute to their prominence The addition of
manganese ions to xMnOmiddot(100- x)[As2O3middot TeO2] glass system for x=50mol MnO
determined the splitting up of a part of As ndash O ndash As Te-O-Te and the appearance of the
TeO4 (tbp) units against the loss of continuous TeO4 (tbp) network was observed
4110 Comparative study by Raman spectroscopy of xFe2O3middot(100- x)[As2O3middotBO]
vitreous systems where BO =gt TeO2 or PbO
With the increasing of iron ions content in the As2O3middotPbO glass matrix the number of
these structural units decreased due to the increase of the disorder in the studied glasses (x gt 20
mol ) and x = 50 mol Fe2O3 for xFe2O3middot(100- x)[As2O3middotTeO2] when iron ions
brought the structural units existing in glass matrices and favoured the appearace of
new bands due to bending vibrations of As ndash O ndash As
42 Comparative study by FT-IR and Raman spectroscopies of
xMOmiddot(100-x)[3B2O3middotLi2O] glasses where MO =gt MnO or Fe2O3
421 Study by FT-IR spectroscopy of xMOmiddot(100-x)[3B2O3middotLi2O] glasses
where MO =gt MnO or Fe2O3
The infrared absorption spectra obtained for xMOmiddot(1-x)[3B2O3middotLi2O] glass system
where MO =gt MnO or Fe2O3 with 0 le x le 50 mol are presented in figure 411-13 and their
structural assignments are summarized in table 43
500 1000 1500
3B2O3Li2O
Wavenumber [cm-1]
Abs
orpt
ion
[au
]
490
1400
1230
1061
698
614
460 78
6
Fig 411 FT ndash IR spectra of vitreous matrix 3B2O3middotLi2O
20
Following the infrared absorption spectra obtained for 3B2O3middotLi2O vitreous matrix
observed on eight bands ~ 1400 cm-1 ~ 1230 cm-1 ~ 1061 cm-1 ~ 786 cm-1 ~ 698 cm-
1 ~ 614 cm-1 ~ 490 cm-1 şi ~ 460 cm-1 The band at ~ 1400 cm-1 is assigned to
asymmetric stretching vibrations from BOslash3 şi BOslash2O- groups (Oslash represent oxygen atom
bridging two boron atoms) The band at ~ 1230 cm-1 is attributed to asymmetric stretching
vibrations of B ndash O bonds from triangular ortoborate BO 33 groups [23-26]
400 600 800 1000 1200 1400 1600
0
3
5
10
20
35
50
1
Wavenumber [cm-1]
Abs
orpt
ion
[ua
]
05
MnO
490
1400
1230
1061
698
614
460 78
6
Fig 412 FT ndash IR spectra of xMnOmiddot(100-x)[3B2O3middotLi2O] glasses
400 600 800 1000 1200 1400 1600
469
Wavenumber [cm-1]
Abs
orpt
ion
[ua
]
0
3
5
10
20
35
50
1
05
Fe2O3
490
1400
1230
1061
698
614
460 78
6
Fig 413 FT ndash IR spectra of x Fe2O3middot(100-x)[3B2O3middotLi2O] glasses
21
Table 43Wavenumber and the structural assignments of FT ndash IR and Raman
spectra of 3B2O3middotLi2O vitreous matrix
~ [cm 1 ] Attribution
FT ndash IR Raman FT ndash IR Raman
~ 1400 cm-1
~ 1400 cm-1
Asymmetric stretching
vibrations from BOslash3 şi BOslash2O-
groups
BOslash2O- triangles linked to
other borate triangular units
~ 1230 cm-1
Asymmetric stretching
vibrations of B ndash O bonds from
triangular ortoborate
BO 33 groups
~ 1061 cm-1
~ 1074 cm-1
Stretching vibrations of B ndash Oslash
bonds in -4BOslash tetrahedra from
tri- tetra- and penta-borate
groups
Diborate groups
~ 902 cm-1
Vibrations of orthoborate
groups
~ 786 cm-1
~ 791 cm-1
Bending vibrations of O3B ndash O
ndash BO4 bonds
Vibrations of rings with six
member to one or two BO4
tetrahedral from tri- tetra ndash
and penta ndash borate units
~ 698 cm-1
Bending vibrations of B-O-B
bonds from pentaborate groups
~ 614cm-1 Bending vibrations of O ndash B ndash O
bonds
~ 490cm-1 ~ 471cm-1 Bending vibrations of B-O-B
bonds
Isolated diborate groups
~ 460cm-1 Bending vibrations of O ndash B ndash O
bonds
22
The band at ~ 1061 cm-1 is assigned to stretching vibrations of B ndash Oslash bonds in -4BOslash
tetrahedra from tri- tetra- and penta-borate groups and the band at ~ 786 cm-1 is assigned
to bending vibrations of O3B ndash O ndash BO4 bonds The band at ~ 698 cm-1 is attributed to
Bending vibrations of B-O-B bonds from pentaborate groups The bands at ~ 614 cm-1 and
~ 460 cm-1 are assigned to bending vibrations of O ndash B ndash O bonds and the band at ~ 490 cm-
1 is assigned to bending vibrations of B-O-B bonds
From FT-IR spectra it can be concluded that the addition of manganese or iron ions in
vitreous matrices leads to the increase of the disorder degree
Also the structural changes that appeared in 3B2O3middotLi2O vitreous matrix with an
addition MnO or Fe2O3 content can be studied Ar=A4A3 ratio(A4 - relative number of -4BOslash tetrahedral borate units A3 - relative number of triangular (BOslash3 and BOslash2O-) units
0 10 20 30 40 50
010
015
020
Ar
x [mol]
MnO Fe2O3
Fig 414 The evolution of Ar ratio with the MnO or Fe2O3 content of
xMnOmiddot(100-x)[3B2O3middotLi2O] şi xFe2O3middot(100-x)[3B2O3middotLi2O] The evolution of the value of this ratio also allows a visualization of the effects
determined by the presence of the manganese or iron ions in the matrix The value Arltlt 1
indicated that BO3 is dominant related to BO4
422 Study by Raman spectroscopy of xMOmiddot(100-x)[3B2O3middotLi2O] glasses
where MO =gt MnO or Fe2O3
The Raman spectra obtained for xMOmiddot(1-x)[3B2O3middotLi2O] glass system were MO =gt
MnO or Fe2O3 with 0 le x le 50 mol are presented in figure 414-16 and their structural
assignments are summarized in table 43
Studying the Raman spectra of xMOmiddot(1-x)[3B2O3middotLi2O] glass system where MO =gt
MnO or Fe2O3 it has been observed that the absorption bands presented in vitreous matrix
gradually decreased with an increase in the manganese or iron content in both glasses system
which suggested an increase of the disorder in these vitreous systems
23
1000 2000 3000
B2O3Li2O
Wavenumber [cm-1]
Ram
an In
tens
ity [a
u]
1430
107490
279
1471
Fig 415 Raman spectra of vitreous matrix 3B2O3middotLi2O
500 1000 1500 2000 2500 3000
1430
107490
2791
0
Wavenumber [cm-1]
Ram
an In
tens
ity [a
u]
1
3
20
05
5
10
35
50
MnO
471
Fig 416 Raman spectra of xMnOmiddot(100-x)[3B2O3middotLi2O] glasses
400 600 800 1000 1200 1400 1600
Wavenumber [cm-1]
Ram
an In
tens
ity [a
u]
0
1
3
20
05
5
10
35
50
Fe2O3
1430
1074
90279
1
471
Fig 417 Raman spectra of x Fe2O3middot(100-x)[3B2O3middotLi2O] glasses
24
43 Comparative study by electron paramagnetic resonance (EPR) and magnetic
susceptibility measurements of xMOmiddot(100-x)[As2O3middotTeO2] xMOmiddot(100-x)
[As2O3middotPbO] and xMOmiddot(100-x)[3B2O3middotLi2O] glasses where MO =gt MnO or Fe2O3
431 Comparative study by electron paramagnetic resonance (EPR) of
xMnOmiddot(100-x)[As2O3middotBO] where BO =gt TeO2 or PbO
and xMnOmiddot(100-x) [3B2O3middotLi2O] glasses
In order to obtain more information regarding the behavior of manganese ions in
different vitreous matrices [3031] xMnOmiddot(100-x)[As2O3middotBO] where BO =gt TeO2 or PbO
and xMnOmiddot(100-x) [3B2O3middotLi2O] glasses were investigated by EPR spectroscopy on a large
compositional range with 0 le x le 50 mol The EPR spectra of Mn2+ for xMnOmiddot(100-
x)[As2O3middotPbO] (S1) xMnOmiddot(100-x)[As2O3middotTeO2] (S3) and xMnOmiddot(100-x)[3B2O3middotLi2O]
(S5) are presented in figure 418-20 These spectra present two absorption lines centered at gef
43 and gef 20 in all systems
The absorption line centered at gef 43 and is due to isolated Mn2+ ions [32] The
absorption line centered at gef 20 may be attributed to Mn2+ species interacting by magnetic
coupling[33] dipolar and or super exchange the last ones forming magnetic clusters [32]
The evolution of the spectra is easier to follow considering the dependence of
concentration on the EPR parameters the line - intensity (obtained as an integral of the area
under the corresponding EPR signal) J and the line - width ΔB The evolution of J and AB
reflects the structural transformations which appear in the glass matrices due to the increase of
manganese ions content
The intensity and the line - width of the resonance line from gef 43 for all
investigated systems is represented in figure 421(ab)
The intensity of the resonance line from gef 43 for all investigated glass systems
decreases due to the decrease of the isolated manganese ions numbers The line - width from
gef 43 for (S1) and (S3) systems decreases due to decrease of Mn2+ number and to the
structural disorder in glasses with the increase of MnO content For (S5) glass system the line
- width of the resonance line there is an increase in all compositional domains
The intensity of the resonance line from gef 20 can be observed as increasing up to
x=14 mol for (S1) system up to x=8mol for (S3) system and 20 mol for (S5)
system The line - width of the resonance line from gef 20 for (S1) and (S3) systems
increases up to 3 mol and 5mol for (S5) due to Mn2+ species interacting by magnetic
coupling dipole- dipole as the main broadening mechanism Over this concentration line ndash the
width of the resonance line from gef 20 is straight and it can be assumed that the
manganese ions begin to manifest super exchange magnetic interactions
25
1000 2000 3000 4000 5000
Firs
t der
ivat
ive
of a
bsor
ptio
n [u
a]
05
1
3
5
10
20
35
50
x [mol Mn2O3]amplif
B [G]
10
200
40
80
400
5
1
1
Fig 418 The EPR spectra of Mn2+ for xMnOmiddot(100-x)[As2O3middotPbO] (S1)
glass system
1000 2000 3000 4000 5000
Firs
t der
ivat
ive
of a
bsor
ptio
n [u
a]
x [mol MnO]
051
3
5
10
20
35
50
9
500
400
50
100
4
1
amplif
B [G]
1
Fig 419 The EPR spectra of Mn2+ for xMnOmiddot(100-x)[As2O3middotTeO2] (S3)
glass system
26
1000 2000 3000 4000 5000
501
B [G]
Firs
t der
ivat
ive
of a
bsor
ptio
n [u
a]
1
4
9
10
30
60
100
amplif
05
1
3
5
10
20
35
x [mol MnO]
Fe3+
Fig 420 The EPR spectra of Mn2+ for xMnOmiddot(100-x)[3B2O3middotLi2O] (S5)
glass system
0 2 4 6 8 10 12 14 16 18 20 22
x [mol]
J [ u
a]
S1 S3 S5
-2 0 2 4 6 8 10 12 14 16 18 20 22
50
100
150
200
250
300
S1 S3 S5
x [mol]
B
[G]
a b
Fig 421 The dependence on MnO content of the intensity (a) and width(b) of resonance
line at gef 43 for xMnOmiddot(100-x)[As2O3middotPbO] (S1) xMnOmiddot(100-x)[As2O3middotTeO2] (S3) şi
xMnOmiddot(100-x)[3B2O3middotLi2O] (S5) system glasses
27
0 10 20 30 40 50
x [mol]
J [ u
a]
S1 S3 S5
0 10 20 30 40 50
400
500
600
700
800
900
S1 S3 S5
x [mol]
B[G
]
a b
Fig 422 The dependence on MnO content of the intensity (a) and width b) of resonance
line at gef 20 for xMnOmiddot(100-x)[As2O3middotPbO] (S1) xMnOmiddot(100-x)[As2O3middotTeO2] (S3) and
xMnOmiddot(100-x)[3B2O3middotLi2O] (S5) system glasses
Following figure 418-20 it can be observed that (S1) and (S3) have had a similar
evolution but (S5) system presented for 05 le x le 5 mol (fig420) has a hyperfine
sextet[33] at gef 20due to Mn2+ isolated ions
432 Comparative study by magnetic susceptibility measurements of
xMnOmiddot(100-x)[As2O3middotBO] where BO =gt TeO2 or PbO and
xMnOmiddot(100-x)[3B2O3middotLi2O] glasses
The magnetic susceptibility data are in good agreement with the EPR result The
magnetic behavior of the glasses from xMnOmiddot(100-x)[As2O3middotBO] where BO =gt TeO2 (S3)
or PbO (S1) and xMnOmiddot(100-x)[3B2O3middotLi2O] (S5) glasses for 3 le x le 50 mol MnO are
presented in figure 423 - 25
For (S1) and (S3) system glasses up to x 3 mol and x 5 mol (S5) glass
system the temperature dependence of the reciprocal magnetic susceptibility obeys a Curie
law In this concentration range the manganese ions are predominantly isolated orand
participate in dipole-dipole interractions At higher concentrations the reciprocal magnetic
susceptibility obeys a Curie-Weiss law with negative paramagnetic Curie temperature (p)
characteristic to antiferromagnetic coupled ions by means of super exchange interractions(fig
426) This behavior of manganese ions is confirmed by the shape of the EPR spectra
28
100 150 200 250
2
4
6
8
10
12
14
16
18
20
22
T [K]
[
emu
mol
]-1
3 mol 5 mol 10 mol 20 mol 35 mol 50 mol
Fig423 The temperature dependence of -1 for xMnOmiddot(100-x)[As2O3middotPbO]
(S1) 3 le x le 50 mol
50 100 150 200 2500
2
4
6
8
10
12
14
16
18
20
22
3 mol 5 mol 10 mol 20 mol 35 mol 50 mol
T [K]
[
emu
mol
]-1
Fig424 The temperature dependence of -1 for xMnOmiddot(100-x)[ As2O3middotTeO2]
(S1) 3 le x le 50 mol
100 150 200 250
2
4
6
8
10
12
14
16
18
20
22
[em
u m
ol]-1
T [K]
3 mol 5 mol 10 mol 20 mol 35 mol 50 mol
Fig425 The temperature dependence of -1 for xMnOmiddot(100-x)[3B2O3middotLi2O]
(S5) 3 le x le 50 mol
29
0 10 20 30 40 50
0
20
40
60
80
100
x [mol]
-p [K
]
(S1) (S3) (S5)
Fig426Concentration dependence of (p) for sistemele xMnOmiddot(100-x)[As2O3middotPbO]
(S1) xMnOmiddot(100-x)[As2O3middotTeO2] (S3) şi xMnOmiddot(100-x)[3B2O3middotLi2O] (S5)
Using the representation 1 =f(T) the molar Curie constants CM the effective
magnetic moments and molar fraction of Mn2+(x1) şi Mn3+(x2) ions were calculated and
represented in tables 44 -6
Tabel 44 Molar Curie constants effective magnetic moments and molar fraction of Mn2+(x1) şi Mn3+(x2) ions in xMnOmiddot(100-x)[As2O3middotPbO] (S1) glasses
x
[mol MnO2] CMtimes102
[emu mol] ef
[microB] x1
[mol Mn2+O2] x2
[mol Mn3+O2] 3 1272 582 268 032 5 1979 562 343 157 10 3777 549 555 445 20 6688 517 492 1508 35 12239 502 377 3123 50 15427 496 268 4732
Tabel 45 Molar Curie constants effective magnetic moments and molar fraction of Mn2+(x1) şi Mn3+(x2) ions in xMnOmiddot(100-x)[As2O3middotTeO2] (S3)glasses
x
[mol MnO2] CMtimes102
[emu mol] ef
[microB] x1
[mol Mn2+O2] x2
[mol Mn3+O2] 3 1297 588 287 013 5 1938 556 312 188 10 3804 551 575 425 20 6766 52 549 1451 35 11148 504 441 3059 50 15528 498 358 4642
30
Tabel 46 Molar Curie constants effective magnetic moments and molar fraction of Mn2+(x1) şi Mn3+(x2) ions in xMnOmiddot(100-x)[3B2O3middotLi2O] (S5) glasses
x
[mol MnO2] CMtimes102
[emu mol] ef
[microB] x1
[mol Mn2+O2] x2
[mol Mn3+O2] 3 127 581 265 035 5 1919 554 303 197 10 3681 542 486 514 20 7215 519 53 147 35 1121 506 505 2995 50 15898 501 493 4507
433 Comparative study by electron paramagnetic resonance (EPR) of
xFe2O3middot(100-x)[As2O3middotBO] where BO =gt TeO2 or PbO and
x Fe2O3middot(100-x) [3B2O3middotLi2O] glasses
In order to obtain more information regarding the behavior of iron ions in
xFe2O3middot(100-x)[As2O3middotBO] where BO =gt TeO2 (S4) or PbO (S2) şi xFe2O3middot(100-
x)[3B2O3middotLi2O] glasses were investigated by EPR spectroscopy on a large compositional
range with 05 le x le 35 mol Fe2O3 The EPR spectra of Fe3+ in xFe2O3middot(100-
x)[As2O3middotPbO] (S2) xFe2O3middot(100-x)[As2O3middotTeO2] (S4) and xFe2O3middot(1-x)[3B2O3middotLi2O]
(S6) are presented in figure 427-29 These spectra present two absorption lines centered at
gef 43 and gef 20 up to x le 35mol Fe2O3 systems studied
The absorption line centered at gef 43 is due to isolated Fe3+ ions [34-36] The
absorption line centered at gef 20 may be attributed to Fe3+ species interacting by magnetic
coupling dipolar and or super exchange the last ones forming magnetic clusters [37-41]
The evolution of the spectra is easier to follow considering the dependence of
concentration on the EPR parameters the line - intensity (obtained as an integral of the area
under the corresponding EPR signal) J and the line - width ΔB The evolution of J and AB
reflects the structural transformations which appear in the glass matrices due to the increasing
of iron ions content
The intensity and the line - width of the resonance line from gef 43 for all
investigated systems is represented in figure 430 (a b) The intensity of the resonance line
from gef 43 increases for (S2) and (S4) up to 3 mol and up to 5 mol for (S6) then
decreases for all systems investigated A line broadening up to 3 mol from gef 43 for
these systems can be observed due to increasing of Fe3+ isolated number of ions
31
1000 2000 3000 4000 5000
40
Firs
t der
ivat
ive
of a
bsor
ptio
n [u
a]
B [G]
x [mol Fe2O3]
05
1
3
5
1020
35 2
40
20
10
10
10
amplif
Fig427 The EPR spectra of Fe3+ for xFe2O3middot(100-x)[As2O3middotPbO] (S2)
glass system
1000 2000 3000 4000 5000
100
B [G]
Firs
t der
ivat
ive
of a
bsor
ptio
n [u
a]
10080
20
50
20
20
3
05
1
5
102035
x [mol Fe2O3] amplif
Fig428 The EPR spectra of Fe3+ for xFe2O3middot(100-x)[As2O3middotTeO2] (S4)
glass system
32
1000 2000 3000 4000 5000
Firs
t der
ivat
ive
of a
bsor
ptio
n [u
a]
B [G]
3
05
1
5
10
20
35
x [mol Fe2O3]
30
50
20
20
10
30
30
amplif
Fig429 The EPR spectra of Fe3+ for xFe2O3middot(100-x)[3B2O3middotLi2O] (S6)
glass system
The intensity and the line - width of the resonance line from gef 43 for all
investigated systems is represented in figure 430 (a b)The resonance line from gef 20 is
attributed to Fe3+ ions that interact by magnetic coupling dipolar orand super exchange
interractions can be observed in all compositional domains
The intensity of the resonance line from gef 20 can be observed as increasing up to
x=35 mol for (S2) and (S6) system and 10 mol for (S4) system with increased iron
ions content The line - width of the resonance line from gef 20 increased up to 10mol
for (S2) system and up to 3 mol for (S4) and 5mol for (S6) due to Fe3+species
interacting by magnetic coupling dipole-dipole Above this concentration line - width of the
resonance line from gef 20 can be attributed to dipolar and super exchange magnetic
interactions The ΔB = f(x) dependence reflects the competion between the broadening
mechanism (dipole ndash dipole interactions the interactions between ions in diferent
valence state and structural disorder) and the narrowing ones (super exchange
interactions)
33
0 5 10 15 20 25 30 35 40
x [mol]
J [ u
a]
S2 S4 S6
a)
0 5 10 15 20 25 30 35 4040
60
80
100
120
140
160
180
200
220 S2 S4 S6
B[G
]
x [mol]
a b
Fig 430 The dependence on Fe2O3 content of the intensity (a) and width (b) of
resonance line at gef 43 for xFe2O3middot(100-x)[As2O3middotPbO] (S2)
xFe2O3middot(100-x)[As2O3middotTeO2] (S4) and xFe2O3middot(100-x)[3B2O3middotLi2O] (S6) glasses
0 5 10 15 20 25 30 35 40
x [mol]
J [ u
a]
S2 S4 S6
a)
0 5 10 15 20 25 30 35 40
200
400
600
800
1000
1200
1400
1600
x [mol]
B
[G] S2
S4 S6
a b
Fig 431 The dependence on Fe2O3 content of the intensity (a) and width (b) of
resonance line at gef 20 for xFe2O3middot(100-x)[As2O3middotPbO] (S2)
xFe2O3middot(100-x)[As2O3middotTeO2] (S4) and xFe2O3middot(100-x)[3B2O3middotLi2O] (S6) glasses
34
434 Comparative study by magnetic susceptibility measurements of
xFe2O3middot(100-x)[As2O3middotBO] where BO =gt TeO2 or PbO and
xFe2O3middot(100-x) [3B2O3middotLi2O] glasses
The magnetic susceptibility data are in good agreement with the EPR result The magnetic
behavior of the glasses xFe2O3middot(100-x)[As2O3middotPbO] (S2) xFe2O3middot(100-x)[As2O3middotTeO2]
(S4) and xFe2O3middot(100-x)[3B2O3middotLi2O] (S6) for 3 x 50 mol Fe2O3 are presented in
figure 432 - 34
For (S2) glass systems up to x 10 mol x 3 mol (S5) glass systems and x 5
mol (S6) glass systems the temperature dependence of the reciprocal magnetic susceptibility
obeys a Curie law In this concentration range the iron ions are predominantly isolated orand
participate in dipole-dipole interactions At higher concentrations the reciprocal magnetic
susceptibility obeys a Curie-Weiss law with negative paramagnetic Curie temperature (p)
characteristic to antiferromagnetic coupled ions by means of super exchange interactions(fig
435) This behavior of iron ions is confirmed by the shape of the EPR spectra
80 100 120 140 160 180 200 220 240 260 2800
1
2
3
4
5
6
7
8
9
10
11
[
emu
mol
]-1
T [K]
3 mol 5 mol 10 mol 20 mol 35 mol 50 mol
Fig432 The temperature dependence of -1 for xFe2O3middot(100-x)[As2O3middotPbO] (S2)
3 x 50 mol
35
80 100 120 140 160 180 200 220 240 260 2800
1
2
3
4
5
6
7
8
9
10
T [K]
[
emu
mol
]-1
3 mol 5 mol 10 mol 20 mol 35 mol 50 mol
Fig433 The temperature dependence of -1 for xFe2O3middot(100-x)[As2O3middotTeO2] (S4)
3 x 50 mol
80 100 120 140 160 180 200 220 240 260 2800
1
2
3
4
5
6
7
8
9
10
11
3 mol 5 mol 10 mol 20 mol 35 mol 50 mol
T [K]
[
emu
mol
]-1
Fig434 The temperature dependence of -1 for xFe2O3middot(100-x)[3B2O3middotLi2O] (S6)
3 x 50 mol
36
0 10 20 30 40 50
0
10
20
30
40
50
x [mol]-
p [K]
(S2) (S4) (S6)
Fig435Concentration dependence of (p) for sistemele xFe2O3middot(100-x)[As2O3middotPbO] (S2) xFe2O3middot(100-x)[As2O3middotTeO2] (S4) and xFe2O3middot(100-x)[3B2O3middotLi2O] (S6)
for 3 x 50 mol Fe2O3
Using the representation 1 = f(T) the molar Curie constants CM the effective
magnetic moments and molar fraction of Fe3+(x1) şi Fe2+(x2) ions were calculated and
represented in tables 47-9
Table 47 Molar Curie constants effective magnetic moments and molar fraction of
Fe3+(x1) şi Fe2+(x2) ions in xFe2O3middot(100-x)[As2O3middotPbO] glasses (S2)
x [mol Fe2O3]
CMtimes102
[emu mol] ef
[microB] x1
[mol Fe23+O3]
x2 [mol Fe2
2+O3] 3 2526 58 261 039 5 393 56 332 168 10 7326 541 476 524 20 13459 519 53 147 35 23364 516 829 2671 50 32154 507 767 4233
Table 48 Molar Curie constants effective magnetic moments and molar fraction of
Fe3+(x1) şi Fe2+(x2) ions in xFe2O3middot(100-x)[As2O3middotTeO2] glasses (S4)
x [mol Fe2O3]
CMtimes102
[emu mol] ef
[microB] x1
[mol Fe23+O3]
x2 [mol Fe2
2+O3] 3 2571 585 277 023 5 4016 566 363 137 10 7911 562 686 314 20 14992 521 643 929 35 22676 509 601 2899 50 30959 497 313 4687
37
Table 49 Molar Curie constants effective magnetic moments and molar fraction of Fe3+(x1) şi Fe2+(x2) ions in xFe2O3middot(100-x)[3B2O3middotLi2O] glasses (S6)
The results allowed to consider that the magnetic properties of the studied glasses can
be explained through magnetic interractions between Fe3+ - Fe3+ Fe3+- Fe2+ and Fe2+- Fe2+ that
explain the dependences of RPE parameters concentration
SELECTED CONCLUSIONS
In this thesis xMOmiddot(100-x)[As2O3middotTeO2] xMOmiddot(100-x) [As2O3middotPbO] and
xMOmiddot(100-x)[3B2O3middotLi2O] glasses where MO =gt MnO or Fe2O3 were comparatively
studied in 0 le x le 50 mol The structural modifications of investigated glass matrices were
comparatively followed in function of the manganese or iron ions on the investigated glass
matrices were followed
The study by FT-IR spectroscopy shows that the evolution of the spectra of
xMnOmiddot(100-x) [As2O3middotPbO] with the addition and the increasing of the MnO content suggest
that the manganese ions break up a part of As ndash O ndash As Pb ndash O ndash Pb and probably of As ndash O ndash
Pb bonds The addition of MnO in the As2O3middotPbO glass matrix is leading to a disordering of
the glasses structure with the increasing of the MnO content
The evolution of the absorption bands for FT ndash IR spectrum of xFe2O3middot(1-x)
[As2O3middotPbO] glasses are determined by the addition of Fe2O3 content It can be observed to
shift the bands assigned As ndash O ndash As vibrations from AsO3 units due to changing to length As
ndash O ndash As bonds and interne angles of AsO3 units disappears PbO4 units and appears FeO6
units The addition of Fe2O3 in the As2O3middotPbO glass matrix determined a disordering of the
glasses structure with the increasing of the Fe2O3 content
From FT-IR absorption spectra of the investigated xMOmiddot(100-x)[As2O3middotTeO2] glasses
system where MO =gt MnO or Fe2O3 it can be observed that the addition and increasing of
manganese ions concluded the contraction of As-O-As bonds from totally symmetric
x [mol Fe2O3]
CMtimes102
[emu mol] ef
[microB] x1
[mol Fe23+O3]
x2 [mol Fe2
2+O3] 3 2542 582 268 032 5 3943 561 338 162 10 7423 544 506 494 20 13568 520 549 1451 35 23094 513 731 2769 50 31746 503 584 4416
38
stretching vibrations of AsO3 units for x ge10 mol there can be an increase in number of As-
O-As bonds from AsO3 units orand a length these linkage to doubly degenerate stretching
vibrations of AsO3 units and a stretching vibration mode of TeO3 tp with NBO It can be
remarked from the FT-IR absorption spectra the gradual transformation of symmetric
stretching vibration mode of Te-O bonds from TeO3 units in TeO4 (tbp) units and the presence
of MnO2 units Once with the addition of iron ions the xFe2O3middot(100- x)[As2O3middotTeO2]
glasses behave like xMnOmiddot(100-x)[As2O3middotTeO2] glasses but in this system the
appearance of FeO6 units can be seen
From FT-IR spectra in xMOmiddot(100-x)[3B2O3middotLi2O] glasses where MO =gt MnO or
Fe2O3 can be concluded that the addition of manganese or iron ions in vitreous matrices leads
to the increase of the disorder degree
The study by Raman spectroscopy shows that the evolution of the spectra the addition
of MnO in the [As2O3middotPbO]glass matrix determined an order degree of the vitreous matrix
The intensity of the bands attributed vibrations As ndash O ndash As bonds from As2O units and
bending vibrations of As ndash O ndash As from As2O units shift to a higher wave length that suggests
an increase in the As2O units comparative to AsO3 units With the increase of iron ions content
in the As2O3middotPbO glass matrix the number of these structural units decreases due to the
increasing of the disorder in the studied glasses
With the increasing of manganese content in As2O3TeO2 glass matrix the intensity
of these bands is increasing showing that the manganese content favorites the formation of
TeO4 (tbp) and TeO3 (tp) units For high concentrations of iron ions in xFe2O3middot(100-
x)[As2O3 TeO2] system of glasses the number of As-O-As linkages appear in Raman
spectrum due to stretching vibrations of As-O-As and vibrations of the continuous TeO4 (tbp)
network show a significant decrease
Studying the Raman spectra of xMOmiddot(1-x)[3B2O3middotLi2O] glass system where MO =gt
MnO or Fe2O3 it has been observed that the absorption bands presented in vitreous matrix
gradually decreased with an increase in the manganese or iron content in both glasses system
which suggested an increase of the disorder in these vitreous systems
The EPR spectra presents the behavior of manganese or iron ions in different vitreous
matrices xMOmiddot(100-x)[As2O3middotBO] where MO=gtMnO or Fe2O3 and BO =gt TeO2 or
PbO and xMOmiddot(100-x) [3B2O3middotLi2O] Glasses were investigated by EPR spectroscopy on a
large compositional range with 0 le x le 50 mol The absorption line centered at gef 43 and
is due to isolated Mn2+ ions The absorption line centered at gef 20 may be attributed to
Mn2+ species interacting by magnetic coupling dipolar and or super exchange the last ones
forming magnetic clusters The EPR spectra of Fe3+ in xFe2O3middot(100-x)[As2O3middotPbO]
xFe2O3middot(100-x)[As2O3middotTeO2] and xFe2O3middot(1-x)[3B2O3middotLi2O] are presented two absorption
lines centered at gef 43 and gef 20 up to x le 35mol Fe2O3 systems studied
39
The absorption line centered at gef 43 is due to isolated Fe3+ ions The absorption
line centered at gef 20 may be attributed to Fe3+ species interacting by magnetic coupling
dipolar and or super exchange the last ones forming magnetic clusters
The evolution of the spectra is easier to follow considering the dependence of
concentration on the EPR parameters the line - intensity (obtained as an integral of the area
under the corresponding EPR signal) J and the line - width ΔB The evolution of J and AB
reflects the structural transformations which appear in the glass matrices due to the increase of
manganese ions content
The magnetic susceptibility data are in good agreement with the EPR result The
magnetic behavior of the glasses from xMnOmiddot(100-x)[As2O3middotBO] where BO =gt TeO2 (S3)
or PbO (S1) and xMnOmiddot(100-x)[3B2O3middotLi2O] (S5) glasses for 3 le x le 50 mol MnO
For (S1) and (S3) system glasses up to x 3 mol and x 5 mol (S5) glass
system the temperature dependence of the reciprocal magnetic susceptibility obeys a Curie
law In this concentration range the manganese ions are predominantly isolated orand
participate in dipole-dipole interractions At higher concentrations the reciprocal magnetic
susceptibility obeys a Curie-Weiss law with negative paramagnetic Curie temperature (p)
characteristic to antiferromagnetic coupled ions by means of super exchange interractions This
behavior of manganese ions is confirmed by the shape of the EPR spectra Using the
representation 1 =f(T) the molar Curie constants CM the effective magnetic moments
and molar fraction of Mn2+(x1) şi Mn3+(x2) ions were calculated The magnetic susceptibility
data are in good agreement with the EPR result
The magnetic behavior of the glasses xFe2O3middot(100-x)[As2O3middotPbO] (S2)
xFe2O3middot(100-x)[As2O3middotTeO2] (S4) and xFe2O3middot(100-x)[3B2O3middotLi2O] (S6) for 3 x 50
mol Fe2O3 are presented For (S2) glass systems up to x 10 mol x 3 mol (S5)
glass systems and x 5 mol (S6) glass systems the temperature dependence of the
reciprocal magnetic susceptibility obeys a Curie law In this concentration range the iron ions
are predominantly isolated orand participate in dipole-dipole interactions At higher
concentrations the reciprocal magnetic susceptibility obeys a Curie-Weiss law with negative
paramagnetic Curie temperature (p) characteristic to antiferromagnetic coupled ions by
means of super exchange interactions(fig 435) This behavior of iron ions is confirmed by the
shape of the EPR spectra Using the representation 1 = f(T) the molar Curie constants
CM the effective magnetic moments and molar fraction of Fe3+(x1) şi Fe2+(x2) ions were
calculated
40
REFERENCES
Chapter 1
[1] I Ardelean bdquoIntroducere icircn studiul materialelor oxidice cu structură vitroasă EdNapocaStar Cluj Napoca 2002 [2] G Srinivasarao N Veeraiah J All Com 327 52-65(2001) [3] G Srinivasarao N Veeraiah J Phys Chem Solids 63705-717(2002) [4] DBecherescu VCristea FMarx IMenessz FWinter Chimia stării solide Ed Şt şi Encicl Bucucureştivol 1 1983 [5] J Wong CAAngell Glass-Structure by Spectroscopy Dekker Inc New York 1976 [6] BEWarren HKKrutter O Morningstat J Am Ceram Soc 19 202 (1936) [7] LLSperry JD Mackenzie Phys Chem Glasses 9 91 (1968) [8] WLKonijnendijk JMStevels J Non-Cryst Solids 18 307 (1975) [9] FCEversteyn JM Stevels HJ Naterman Phys Chem Glasses 1 134 (1963) [10] G Fuxi Optical and Spectroscopie Properties of Glass Springer-Verlag Shanghai Scientific Technical Pub Shanghai 1991 [11] YDYiannopoulos GDChryssikos EIKamitsos Phys Chem Glasses 42(3) 164 (2001) [12] MGFerreira da Silva BFOCosta J Non-Cryst Solids 293-295 534 (2001) [13] RYordanova YDimitriev VDimitriev S Kassabov DKlissurski JNon-Cryst Solids 201 141 (1996) [14] W L Konijnendijk J M Stevels J Non-Cryst Solids 18 307 (1980) [15] M Iron M Couzi ALevasseur JBrethous JSolidState Chem 31 285 (1980) [16] TFurukawa WBWhite PhzsChemGlasses 21 85 (1980) [17] E I Kamitsos M A Karakassides GD Chryssikos J Phys Chem 90 4528 (1986) [18] E I Kamitsos M A Karakassides GD Chryssikos J Phys Chem 91 1073 (1987) [19] TWBril Philips Res Rep Suppl 2 117 (1976) [20] E I Kamitsos M A Karakassides GD Chryssikos J Phys Chem 30 203 (1989) [21] BNMeera JRamakrishna J Non-Cryst Solids 159 1 (1993) [22] KWitke THubert PReich JRamanSpectr 24 407 (1993) [23] E I Kamitsos M A Karakassides Phys Chem Glasses 30 19 (1989) [24] MPeteanu Teză de doctoratrdquo Universitatea Babeş-Bolyairdquo Cluj Napoca (1989) [25] PCTaylor PJBray JPhys Chem Solids 33 43 (1972) [26] IArdelean MPeteanu GhIlonca DPop Solid State Commun 33 653 (1980) [27] AV De Wijn RE Van Balderen JKemPhys 46 4 (1967) [28] DL Griscom RE Griscom J Phys Chem Glasses 12 19 (1971) [29] JWH Schreurs JChem Phys 69 2151 (1978) [30] AlNicula M Peteanu IArdelean Studia Univ Babeş-Bolyai Physica 2 65 (1979) [31] M Peteanu IArdelean SFilip ITodor GSalvan Studia Univ Babeş-Bolyai Physica XL 2 9 (1995) [32] IArdelean M Peteanu SFilipV Simon ITodor Solid State Commun 105 (5) 339 (1998) [33] SKMendiratta EGuedes de Sousa JMatSci Lett7 733 (1988) [34] IArdelean M Peteanu SFilip V Simon GGyorffy Solid State Commun 102 (4) 341 (1997) [35] IArdelean M Peteanu SFilip V Simon FCiorcas ITodor JMagnMagn Mat 196-197 257 (1999) [36] JKliava RBerger YServant JEmery JMGreneche JTrokss J Non-Cryst Solids 202 205 (1996) [37] LDBogomolova NA Krasilnikova VLBogdanov VDKhaliev VV Mitrofanov J Non-Cryst Solids 188 130 (1995) [38] DLoveridge SPark PhysChem Glasses 12 19 (1971) [39] IArdelean G Salvan M Peteanu V Simon FCiorcas Mod PhysLett B 13 (22-23) 801 (1999)
41
[40] JLRao AMuraly EDRao J Non-Cryst Solids 202 215 (1996) [41] CPrakash S Husain RJ Singh SMollah JAlloys Compon 326 47 (2001) [42] EGuedes de Sousa SKMendiratta JMMachado Da Silva Portugal Phys 17 (3-4) 203 (1986) [43] TCastner GSNewell WCHolton CP Slichter JChem Phys 32 668 (1960) [44] SPChaudhuri SKPatra JMatSci 35 4735 (2000) [45] IArdelean HH Qiu HSakata Matt Lett 32 335 (1997) Chapter 2 [1] J Wong C A Angel Glass Structure by Spectroscopy Marcel Dekker inc New-York 1976 [2] I Ardelean bdquoIntroducere icircn studiul materialelor oxidice cu structură vitroasă EdNapocastar Cluj-Napoca 2002 [3] N Avram GH Mateescu Spectroscopia icircn infraroşu Aplicaţii icircn chimia organică Ed Tehnică Bucureşti 1968 [4] TIliescu Spectroscopie optică moleculară vibraţională şi electronică Ed Casa Cărţii de Ştiinţă Cluj- Napoca 2000 [5] S Aştilean bdquoMetode şi tehnici moderne de spectroscopie optică Ed Casa Cărţii de Ştiinţă Cluj - Napoca 2002 p 5 [6] I Ursu Rezonanţă Electronică de Spinrdquo Ed AcademieiBucureşti (1965) [7] CHHurd ContempPhys 23 (5) 469 (1982) [8] GWAnderson WDCompton JChemPhys52 6166 (1970) [9] MS Seehra GSrinivasan Landolt-Bornstein (New Series) SubVolume F3 Springer-Verlag Berlin 1994 [10] GToulouse ContempPhys 2115 (1977) [11] NMMurayMagnetic susceptybility EdInterscience New York P1773 1963 [12] JBGoodenough Magnetism and Chemical Bond EdInterscience New York 1963 [13] IArdelean G Salvan M Peteanu V Simon FCiorcas Mod PhysLett B 13 (22-23) 801 (1999) [14] IArdelean MPeteanu R Ciceo Lucăcel Studii de rezonanţă paramagnetică electronică şi magnetice ale unor ioni 3d icircn sticle pe bază de B2O3 Ed Presa Univesitară Clujeană 2005 [15] IArdelean PhysStatSol (b) 87K137 (1978) [16] IArdelean Solid State Commun 31 75 (1979) [17] EJFrieble LKWilson AWDozier DLKinser PhysStatSol (b) 45 323 (1971) [18] DWMoon JMAitken RKMcCrone GS Ciloszik PhysChe Glasses 16 (5) 91 (1975) [19] SFilip Teză de doctorat UnivBabeş-Bolyai Cluj Napoca 1996 [20] CJSchinkel GWRathenou Physics of Non-Crystaline Solids North Holland Publ Co Amsterdam 215 1965 [21] EJFrieble LKWilson NCKoon DLKinser JAm Ceram Soc 57-237 (1974) [22] RJLandry JT Fournier CGYoung JChemPhys 46 1285 (1967) [23] WSimpson PhysStatSolidi b40 207 (1970) [24] RHasegawa PhysRevB b(5) 1631 (1971) [25] IArdelean GhIlonca MPeteanu Solid State Commun 52 145 (1984) [26] IArdelean GhIlonca OCozar J Physique 49 C8 1107 (1988) Chapter 3 [1] LFBates Modern Magnetism p133 Cambridge University Press London 1962 [2] IArdelean GhIlonca DBarbos Solid State Commun 40 769 (1981) [3] EBurzo IUrsu DUngur IArdelean JMatSci 15 581 (1980) [4] EBurzo IUrsu DUngur IArdelean MatResBull 15 1273 (1980) [5] DLGriscom Glass Science and Technology 48 151 (1990) [6] PJBray AH Silver Modern aspects of the vitreous state vol1 Butterworth
42
London 1960 [7] IArdelean Teza de doctorat UnivBabeş-Bolyai Cluj Napoca 1979 [8] SAştilean bdquoMetode şi tehnici moderne de spectroscopie opticărdquo EdCasa Cărţii de Ştiinţă Cluj ndash Napoca 2002 p5 [9] IArdelean RCiceo-Lucăcel ldquoFizica şi Tehnologia Materialelor Oxidice Lucrări Practicerdquo Ed Univ ldquoBabeş-Bolyairdquo Cluj-Napoca 2000 [10] VPop IChicinaş NJumate Fizica materialelor Metode experimentalerdquo EdPresa Universitară Clujeană 2001 [11] IUrsu Rezonanţă electronică de spinrdquo EdAcademiei Bucureşti 1965 Chapter 4 [1] I Ardelean S Lupşor D Rusu Solid State Sci 10 1384(2008) [2] I Ardelean S Lupşor D Rusu trimis spre publicare la Physica B decembrie 2009 [3] P Tarte Spectrochim Acta 18 467 (1962) [4] R A Condrate J Non ndash Cryst Solids 84 26 (1986) [5] G Srinivasarao N Veeraiah Phys Stat Sol (a) 191 370(2002) [6] G Srinivasarao N Veeraiah J Phys Chem Solids 63 705(2002) [7] G Srinivasarao N Veeraiah J All Com 327 52 (2001) [8] DK Durga N Veeraiah Bull Mater Sci 24 (4) 421 (2001) [9] F F Bentley L D Smithson A L Rozek InfraredndashSpectra and Characteristic Frequencies 700-300 cm-1 Interscience New York 1968 p 103 [10] O Noguera T Merle-Mejean AP Mirgorodsky MB Smirnov P Thomas J-C Champarnaud-Mesjard J Non-Cryst Solids 330 50 (2003) [11] BVR Chowdari KL Tan Fang Ling Solid State Ionics 113 ndash 115 711(1998) [12] C Jiang J Zhang H Mao F Gan Glass Technol 39(6) 200(1998) [13] MR Sahar K Sulhadi MS Rohani J Mater Sci 42 824(2007) [14] C Horea D Rusu I Ardelean J Mater Sci Mater Electron 20 905(2009) [15] GE Rachkovskaya GB Zakharevich J Appl Spectrosc 74 86(2007) [16] I Ardelean S Lupşor D Rusu trimis spre publicare la Journal of Materials Science Materials in Electronics decembrie 2009 [17] I Ardelean S Lupşor D Rusu trimis spre publicare la Modern Physics Letters B decembrie 2009 [18] R Iordanova Y Dimitriev V Dimitrov S Kassabov D Klissurski J Non ndash Cryst Solids 231 227 (1998) [19] R Iordanova Y Dimitriev S Kassabov D Klissurski J Non ndash Cryst Solids 204 141 (1996) [20] J O Jensen S J Gilliam A Banerjee D Zeroka S J Kirkby C N Merrow J Mol Struct (Theochem) 664 145 (2003) [21] G N Papatheodorou S A Solin Solid State Commun 16 5 (1975) [22] BVR Chowdari KL Tan Fang Ling J Mat Sci 35 2015 (2000) [23] R C Lucacel C Marcus V Timar I Ardelean Solid State Sci 9 850 (2007) [24] CP Varsamis EI Kamitsos GD Chryssikos Solid State Ionics 136ndash137 1031 (2000) [25] Sherief M Abo-Naf Fatma H El Batal Moenis A Azooz Mat Chem Phys 77 846 (2002) [26] SG Motke SP Yawale SS Yawale Bull Mater Sci 25 (10) (2002) [27] R Akagi N Ohtori N Umesaki J Non ndash Cryst Solids 293 471(2001) [28] E I Kamitsos M A Karakassides G D Chryssikos J Phys Chem 91(5) 1073 (1987) [29] H Ushida Y Iwadate T Hattori S Nishiyama K Fukushima Y Ikeda M Yamaguchi M Misawa T Fukunaga T Nakazawa S Jitsukawa J Alloys Compd 377 167 (2004) [30] I Ardelean F Ciorcas M Peteanu S Lupşor G Salvan Balkan Phys Lett 5 860 (1997)
43
[31] I Ardelean M Peteanu V Simon O Cozar F Ciorcas S Lupşor J Magn Magn Mater 196 253 (1999) [32] IArdelean MPeteanu GhIlonca Phys Stat Sol (a) 58 K33(1980) [33] IArdelean MPeteanu R Ciceo-Lucăcel ldquoStudii de rezonanţă paramagnetică electronică şi magnetice ale unor ioni 3d icircn sticle pe bază de B2O3rdquo Ed Presa Univ Clujeană Cluj Napoca 2005 p 171 [34] JLRao AMuraly EDRao J Non-Cryst Solids 202 215 (1996) [35] RPSChakradhar AMurali JLRao Optical Mat 10 109 (1998) [36] IArdelean MPeteanu SFilip VSimon GGyorffy Solid State Commun 102(4) 341 (1997) [37] IArdelean MPeteanu VSimon SFilip FCiorcaş ITodor J Magn Magn Mat 196-197 257 (1999) [38] IArdelean GSalvan MPeteanu VSimon CHimcinschi FCiorcas Mod Phys Lett B 13(22-23) 801 (1999) [39] IArdelean HHQiu HSakata Mat Lett 32 335 (1997) [40] SPChaudhuri SKPatra J Mat Sci 35 4735 (2000) [41] I Ardelean M Peteanu V Simon G Salvan J Mat Sci Technol 18 (3) 1 (2002)

6
and tetrahedral coordination and also to the different ways through which the borate buildings
units can be linked together [4-9]
The behavior of various borate species in the glass structure is determined by the nature
of modifier oxides (TeO2 PbO etc) In most binary borate glasses the glass properties change
almost linearly with composition [10-17] In binary borate glasses the properties of these show
a major deviation from linearity which depends on modifier oxide The structural reasons for
this is generally due to the change in the coordination of boron atom from 3 to 4 and back
again Many technological applications of these glasses depend of this effect since is produces
many improvements [18-23]
The introduction of MnO [24-32] or Fe2O3 [33-45] into diamagnetic glasses transform
them into paramagnetic glasses The introduction of iron and manganese in small percentages
modifies the physical properties of the glasses and the material is more accessible for a
complete structural characterization
In order to extend the available information concerning the interesting class of As2O3
and B2O3 based glasses we investigated glasses by means of different physical methods We
obtained valuable information concerning the structure and structural changes of the glasses
that occur with the addition of transitional oxide metals
CHAPTER 2 METHODS USED IN THE STUDY OF STRUCTURE AND
PROPERTIES OF OXIDE GLASSES
In this chapter some of the methods used in the investigation of the structure and
properties of vitreous systems are presented The study of the structure and properties of oxide
glasses with transitional metals ions IR and Raman spectroscopies electron paramagnetic
resonance and magnetic susceptibility measurements were chosen as investigation methods
The electromagnetic radiation (EM) with frequencies between 4000 and 400 cm -1 called
infrared radiation (IR) is used to obtain information connected to the structure of the
compound and as an analytic method to test the purity of the compound Its application in
organic chemistry is known as IR spectroscopy The radiation is absorbed by organic
molecules and converted in molecular vibration energy When the radiant energy coincides
with a specific molecular vibration the absorption appears The wave length at which the
radiation is absorbed by the organic molecule gives information regarding the functional
groups presented in the molecule [1-4]
The Raman spectroscopy brings useful contributions to the molecular vibrations study
The interraction mechanism of electromagnetic radiation with the molecular vibration which
forms the Raman spectroscopy theoretical basis differs from the one of the process which
forms the IR spectroscopy theoretical basis [4]
7
Another method used in the investigation of the glass system is the electron paramagnetic
resonance (RPE) This method is one of the most powerful techniques for local order
investigation RPE is a method widely used to describe the fundamental states and to
characterize the vicinities effect on the energetic levels of the paramagnetic centers The
method consists in the study of the electronic split levels of the atoms in the presence of an
external magnetic field [6] The Mn2+ EPR spectra are characterized by resonance absorptions
at gef 43 gef 33 and gef 20 The resonance line centered at gef 43 is
corresponding to the isolated Mn2+ ions The line from gef 20 is attributed to Mn2+ ions
involved in magnetic interactions
The Fe3+ EPR spectra are characterized by resonance absorptions at g 97 g 6 g 43
and g 20 The resonance line from g 97 is related to Fe3+ ions disposed in rhombic
environment The resonance line at g 6 was assigned to an axial distortion of the
paramagnetic ions neighborhood The resonance line at g 43 is corresponding to the isolated
Fe3+ ions situated in octahedral rhombic or tetragonal symmetric distorted neighborhoods The
line from gef 20 is attributed to Fe3+ ions involved in magnetic interactions
Along with the EPR spectroscopy the magnetic susceptibility measurements provide
useful information about the valence state and the interaction involving the transitional metal
ions in vitreous materials [7-10]
Different vitreous systems with manganese or iron ions were intensively studied by
magnetic susceptibility measurements to determine the magnetic behavior and the valence
states of these ions in these systems It was observed that the presence of the manganese or iron
ions in different valence states depends on the chemical composition of the vitreous matrix on
the valence of the vitreous network former and modifications and on the preparation of the
environment The magnetic properties of the oxide glasses with manganese or iron ions were
assigned to the antiferromagnetic couple between Mn2+-Mn2+ Mn2+-Mn3+ and Mn3+-Mn3+
[19-26] or Fe -Fe3+ Fe2+-Fe2+ and Fe3+-Fe2+ ions [11-18]
CHAPTER 3 EXPERIMENTAL TECHNIQUES
We have prepared glasses of the xMOmiddot(100-x)[As2O3middotTeO2] xMOmiddot(100-
x)[As2O3middotPbO] şi xMOmiddot(100-x)[3B2O3middotLi2O] glass structure where MO =gt MnO or Fe2O3
with 0 lt x lt 50 mol used components of reagent grade purity MnCO3 Fe2O3 As2O3
H3BO3 PbO Li2CO3 şi TeO2 in suitable proportions to obtain the desired composition The
mixtures were melted in sintered corundum crucibles introduced in an electric furnace directly
at 1250 C and kept for 5 minutes at this temperature They were quickly cooled at room
temperature by pouring onto stainless steel plates
The structure of the samples was analyzed by means of x-ray Diffraction using powders
with a Bruker D8 Advanced diffract meter
8
The FT - IR spectra have been recorded using a Bruker Equinox 55 with a spectral range
between 4000 cm -1 and 370 cm -1 A MIR GLOBAR generator cooled with air was used The
detection was carried out with a DLATGS detector with a KBr window The spectral
resolution was about 05 cm1 The samples were prepared using KBr pellet technique
The Raman spectra were recorded on bulk samples at room temperature using an
integrated FRA 106S Raman module attached to Bruker Equinox 55 with a spectral range
from 3600 cm -1 to 70 cm -1 An NdYAG laser with an output power of 500 mW and a 1064
nm radiation was used The detection was carried out with an ultra sensitive D418-T detector
cooled with liquid nitrogen The spectral resolution was about 1 cm1
The EPR spectra were obtained at room temperature with an Adani Portable EPR
Spectrometer PS8400 in X-frequency band (94 GHz) For these measurements equal
quantities of powders from the investigated samples closed in glass tubes were used
Magnetic susceptibility measurements were performed on a Faraday type balance in the 80
- 300 K temperature range The sensitivity of the equipment was 10-7 emug
CHAPTER 4 RESULTS AND DISCUSSION REGARDING THE STUDY OF
xMOmiddot(100-x)[As2O3middotTeO2] xMOmiddot(100- x)[As2O3middotPbO] şi xMOmiddot(100-x)[3B2O3middotLi2O]
GLASS STRUCTURE WHERE MO =gt MnO or Fe2O3
In this chapter the results obtained by following the study of the structure and
properties of oxide glasses with transitional metals ions by FT- IR and Raman spectroscopies
electron paramagnetic resonance and magnetic susceptibility measurements are presented The
structural changes and magnetic properties with the manganese and iron content were
followed
41 Comparative study by FT-IR and Raman spectroscopies of xMOmiddot(100-
x)[As2O3middotTeO2] xMOmiddot(100- x)[As2O3middotPbO] şi xMOmiddot(100-x)[3B2O3middotLi2O] glasses
where MO =gt MnO or Fe2O3
411 Comparative study by FT-IR spectroscopy of As2O3middotTeO2 and
As2O3middotPbO vitreous matrices
In order to obtain new information regarding the role of the modifier in the
formation of vitreous matrices comparative studies by FT-IR spectroscopy were made
The FT-IR spectroscopy is represented in figure 41(ab) The wave length and the
structural assignments of FT ndash IR spectra of As2O3middotPbO and As2O3middotTeO2 vitreous matrices
are represented in table 41
9
400 600 800 1000 1200
Wavenumber [cm-1]
Abs
orpt
ion
[au
]
407
594
821
794
1119
As2O
3PbO
a)
a
400 600 800 1000 1200
As2O3TeO2
Abs
orpt
ion
[ua
]
Wavenumber [cm-1]
85473
3
644
1119
b)
b
Fig41 FT ndash IR spectra of vitreous matrices a As2O3middotPbO şi b As2O3middotTeO2
The FT ndash IR spectrum of As2O3middotPbO glass matrix presents five absorption bands at ~
1119 cm-1 ~ 821 cm-1 ~ 794 cm-1 ~ 594 cm-1 and ~ 407 cm-1(Fig41a)
The band from ~ 1119 cm-1 is due to totally symmetric stretching vibrations of AsO3
units [5 ndash 7] The bands from ~ 821 cm-1 and ~ 794 cm-1 are due to doubly degenerate
stretching vibrations of AsO3 structural units [5 ndash 7] The large band centered at ~ 594 cm-1 can
be due to totally symmetric bending vibrations of AsO3 structural units [5-7] The band from ~
407 cm-1 can be due to vibrations of Pb ndash O bonds from PbO4 structural groups [7]
Following As2O3TeO2 glass matrix spectrum presented in Fig 41b four bands can be
observed located at ~ 644 cm-1 ~ 733 cm-1 ~ 854 cm-1 and ~ 1119 cm-1 The band from ~ 644
cm-1 can be assigned to totally symmetric bending vibrations of AsO3 units [5-7] and also
stretching vibration mode of TeO4 tbp with bridging oxygen[11] The band from ~ 733 cm-1
can be assigned to the symmetric stretching vibration mode of Te-O bonds in TeO3 units
[15] The band from ~ 854 cm-1 can be assigned to doubly degenerate stretching vibrations of
AsO3 units [5-7] and also to the stretching vibration mode of TeO3 tp with NBO [11] The band
10
from ~ 1119 cm-1 can be assigned to totally symmetric stretching vibrations of AsO3 units [5-
7] These bands presented in As2O3TeO2 glass matrix spectrum confirm the presence of
AsO3 TeO4 tbp and TeO3 tp units in the structure of the glass matrix but due to the broadness
of the bands it can not be told for sure which one of these units is predominant
Table 41Wavenumber and the structural assignments of FT ndash IR spectra of
As2O3middotPbO and As2O3middotTeO2 vitreous matrices
~ [cm 1 ]
As2O3middotPbO As2O3middotTeO2
Attribution
~1119 cm-1
~ 1119 cm-1
Totally symmetric stretching vibrations of AsO3 units
~ 821cm-1
Doubly degenerate stretching vibrations of AsO3 structural units
~ 854 cm-1
Doubly degenerate stretching vibrations of AsO3 units Stretching vibration mode of TeO3 tp with NBO
~ 794 cm-1
Doubly degenerate stretching vibrations of AsO3 structural units
~ 733 cm-1
Symmetric stretching vibration mode of Te-O bonds in TeO3 units
~ 594 cm-1
~ 644 cm-1
Totally symmetric bending vibrations of AsO3 units
~ 407 cm-1 Vibrations of Pb ndash O bonds from PbO4 structural groups
412 Comparative study by FT-IR spectroscopy of
xMOmiddot(100- x)[As2O3middotPbO] vitreous systems where MO =gt MnO or Fe2O3
The infrared absorption spectra obtained for xMOmiddot(1-x)[As2O3middotPbO] glass system
where MO =gt MnO or Fe2O3 with 0 le x le 50 mol are presented in figure 42-3 and their
structural assignments are summarized in table 41
The spectra were discussed on the basis of the method given by Tarte [3] and Condrate
[4] by comparing the experimental data of glasses with those of related crystalline compounds
The characteristic absorption bands for crystalline As2O3 [5-8] PbO [79] and characteristic
bands for Fe2O3 [1819 ] were used as a reference point in the results discussion
The FT ndash IR spectra of the investigated glasses suggest a structure formed of AsO3 and
PbO4 structural units where As2O3 plays the role of the glass former and PbO plays the role of
the glass modifier The evolution of the spectra with the addition and the increasing of the
MnO content suggest that the manganese ions break up a part of As ndash O ndash As Pb ndash O ndash Pb and
probably of As ndash O ndash Pb bonds The addition of MnO in the As2O3middotPbO glass matrix is leading
to a disordering of the glasses structure with the increasing of the MnO content
The evolution of the absorption bands for FT ndash IR spectrum of xFe2O3middot(1-x)
[As2O3middotPbO] glasses are determined by the addition of Fe2O3 content It can be observed to
11
shift the bands assigned As ndash O ndash As vibrations from AsO3 units due to changing to length As
ndash O ndash As bonds and interne angles of AsO3 units disappears PbO4 units and appears FeO6
units The addition of Fe2O3 in the As2O3middotPbO glass matrix determined a disordering of the
glasses structure with the increasing of the Fe2O3 content
400 600 800 1000 1200
610
813
449
1093
423
449
616
760 848
821
794
594
20A
bsor
ptio
n [a
u]
Wavenumber [cm-1]
05
0
35
10
35
50
1
MnO
407
1119
693
Fig 42 FT ndash IR spectra of xMnOmiddot(100- x)[As2O3middotPbO] glasses
400 600 800 1000 1200
616
462
811
407
594
Abs
orpt
ion
[au
]
Wavenumber [cm -1]
05
20
0
35
10
35
50
1
Fe2O3
821
79469
3
1119
1084
610
Fig43 FT ndash IR spectra of xFe2O3middot(100- x)[As2O3middotPbO] glasses
12
413 Comparative study by FT-IR spectroscopy of
xMOmiddot(100-x)[As2O3middotTeO2] vitreous systems where MO =gt MnO or Fe2O
The infrared absorption spectra obtained for xMOmiddot(1-x)[As2O3middotTeO2] glass system
where MO =gt MnO or Fe2O3 with 0 le x le 50 mol are presented in figure 44 -5 and their
structural assignments are summarized in table 41[1617] The characteristic absorption bands
for crystalline As2O3 [5-8] PbO [79] TeO2 [810-15] MnO2 and Mn3O4 [9] and characteristic
bands for Fe2O3 [1819 ] were used as a reference point in the results discussion
Fig 44 FT ndash IR spectra of xMnOmiddot(100- x)[As2O3middotTeO2] glasses
Fig45 FT ndash IR spectra of xFe2O3middot(100- x)[As2O3middotTeO2] glasses
400 600 800 1000 1200
565
422 690 830
05
Abs
optio
n [a
u]
Wavenumber [cm-1]
0
3
5
35 50
1
MnO
854 733 644
1119
10 20
400 600 800 1000 1200
462650
812
713
561
05
20
Wavenumber [cm-1]
Abs
orpt
ion
[au
]]
0
3 5
10
35 50
1
Fe2O3
854 733
644
1119
13
This behavior of the studied glasses with the addition and increasing of MnO content
suggests that the structure observed in the glass matrix is conserving up to 5 mol MnO
where the structure takes another form From a structure dominated by AsO3 TeO4 tbp and
TeO3 tp units the structure became dominated by TeO4 tbp and MnO2 units and in a small
measure of AsO3 and TeO3 tp units For higher concentrations it can not be specified exactly
which of the last two structural units have the biggest proportion in these glasses From FT-IR
absorption spectra of the investigated glass system it can be observed that the addition and
increasing of manganese ions concluded the contraction of As-O-As bonds from totally
symmetric stretching vibrations of AsO3 units for x ge10 mol there can be an increase in
number of As-O-As bonds from AsO3 units orand a length these linkage to doubly degenerate
stretching vibrations of AsO3 units and a stretching vibration mode of TeO3 tp with NBO It
can be remarked from the FT-IR absorption spectra the gradual transformation of symmetric
stretching vibration mode of Te-O bonds from TeO3 units in TeO4 (tbp) units and the presence
of MnO2 units Once with the addition of iron ions the xFe2O3middot(100- x)[As2O3middotTeO2]
glasses behave like xMnOmiddot(100-x)[As2O3middotTeO2] glasses but in this system the
appearance of FeO6 units can be seen
414 Comparative study by FT-IR spectroscopy of
xMnOmiddot(100- x)[As2O3middotBO] vitreous systems were BO =gt TeO2 or PbO
The infrared absorption spectra obtained for xMnOmiddot(100- x)[As2O3middotBO] vitreous
systems where BO =gt TeO2 or PbO with 0 le x le 50 mol MnO are presented in figure
42 and 44 Following the infrared absorption spectra it can be observed that for
xMnOmiddot(100- x)[As2O3middot PbO] glass system the most disordered structure to exist for 0
le x le 5 mol MnO and to xMnOmiddot(100-x)[As2O3middot TeO2] glass system for 1 le x le 5 mol
MnO For x ge 5 mol MnO manganese ions break up a part of As ndash O ndash As Pb ndash O ndash Pb
and probably of As ndash O ndash Pb bonds to favor the increase in number of PbO4 units and
appearance of MnO2 units For x ge 10 mol MnO observed comparatively in both system
glasses the addition of manganese ions suggests for the first system a modification in linkage
characteristic units and for the second system an improvement for structural units of As2O3middot
TeO2 vitreous matrice also linkage characteristic units
415 Comparative study by FT-IR spectroscopy of
xFe2O3middot(100-x)[As2O3middotBO] vitreous systems where BO =gt TeO2 or PbO
The infrared absorption spectra obtained for xFe2O3middot(100- x)[As2O3middotBO] vitreous
systems where BO =gt TeO2 or PbO with 0 le x le 50 mol Fe2O3 are presented in figure
43 and 45
14
The evolution of the spectra with the addition and the increasing of the Fe2O3 content
suggest that the iron ions break up a part of As ndash O ndash As Pb ndash O ndash Pb and probably of As ndash O
ndash Pb bonds It can be observed a shift in the bands assigned As ndash O ndash As vibrations from AsO3
units due to changing to length As ndash O ndash As bonds and interne angles of AsO3 units the PbO4
units disappear and FeO6 units appear For x ge 5 mol Fe2O3 observed comparatively in
both system glasses the addition of iron ions suggests for the first system a modification in
linkage characteristic units of As2O3middotPbO and for the second system an improvement for
structural units of As2O3middot TeO2 vitreous matrice also linkage characteristic units appearance
of FeO6 units in both system
416 Comparative study by Raman spectroscopy of
As2O3middotTeO2 and As2O3middotPbO vitreous matrices
In order to obtain new information regarding the role of the modifier in the
formation of vitreous matrices there were made comparative studies by Raman
spectroscopy The Raman spectroscopy are presented in figure 46(ab) The wave
length and the structural assignments of Raman spectra of As2O3middotPbO şi As2O3middotTeO2 vitreous
matrices are presented in table 42
Table 42Wavenumber and the structural assignements of Raman spectra
of As2O3middotPbO and As2O3middotTeO2 vitreous matrices
~ [cm 1 ]
As2O3middotPbO As2O3middotTeO2
Attribution
~826 cm-1
~ 816 cm-1
Stretching vibrations of As-O-As
~ 752 cm-1
Vibrations of the continuous TeO4 (tbp) network
~ 627 cm-1
Vibrations As ndash O ndash As bonds from As2O units
~ 580 cm-1
Stretching vibrations of As-O-As
~ 525 cm-1
Vibrations O-As-O bonds from AsO3 units
~ 438cm-1
Symmetric bending vibrations of Te ndash O ndash Te vertex linkages between different TeO4 (tbp) TeO3+1 polyhedra Stretching vibrations of As-O-As of AsO3 units
~ 345 cm-1
Bending vibrations of As ndash O ndash As from As2O units
15
200 400 600 800 1000
As2O3PbO
Ram
an In
tens
ity [a
u]
LWavenumber [cm-1]
345
826
525
627a)
a
200 400 600 800 1000
816
752
580 R
aman
Inte
nsity
[au
]
Wavenumber [cm-1]
As2O3TeO2
438
b)
b
Fig46 Raman spectra of vitreous matrices a As2O3middotPbO şi b As2O3middotTeO2
The Raman spectrum of As2O3middotPbO glass matrix presents four bands at 826 cm-1
627 cm-1 525 cm-1 and 345 cm-1 The band from 826 cm-1 can be assigned to As ndash O ndash
As stretching vibrations [20] The band centered at 627 cm-1 can be assigned to vibrations As
ndash O ndash As bonds from As2O units the band from 525 cm-1 are assigned vibrations O-As-O
bonds from AsO3 units [21] The band of 345 cm-1 are attributed to As ndash O ndash As bending
vibrations from As2O units[2021]
The Raman spectrum of As2O3middot TeO2 glass matrix presents four bands at 816 cm-1
752 cm-1 580 cm-1 and 438 cm-1 The band from 816 cm-1 can be assigned to As ndash O ndash
As stretching vibrations [20] The band centered at 752 cm-1 can be assigned to vibrations of
the continuous TeO4 (tbp) network [22] The band of 580 cm-1 are attributed to As ndash O ndash As
stretching vibrations [12] The band centered at 438 cm-1 can be assigned symmetric bending
vibrations of Te ndash O ndash Te vertex linkages between different TeO4 (tbp) TeO3+1 polyhedra and
As ndash O ndash As stretching vibrations of AsO3 units
16
417 Study by Raman spectroscopy of xMOmiddot(100- x)[As2O3middotPbO]
vitreous systems where MO =gt MnO or Fe2O3
The Raman spectra obtained for xMOmiddot(100- x)[As2O3middotPbO] vitreous systems where
MO =gt MnO or Fe2O3 with 0 le x le 50 mol are presented in figure 47-8 and their
structural assignments are summarized in table 42
200 400 600 800 1000
368
833
345
1
3
Lungimea de unda [cm-1]
Inte
nsita
te R
aman
[ua
]
20
05
0
5
10
35
50
MnO
826
525
627
Fig 47 Raman spectra of xMnOmiddot(100- x)[As2O3middotPbO] glasses
The addition of MnO in the glass matrix determined an order degree of the vitreous
matrix The intensity of the bands attributed vibrations As ndash O ndash As bonds from As2O units
and bending vibrations of As ndash O ndash As from As2O units shift to a higher wave length that
suggests an increase in the As2O units comparative to AsO3 units
To the band from 826 cm-1 the addition of manganese ions in the glass matrix
determine for x = 05 mol an decreasing in intensity whereupon increasing for higher
concentrations The intensity of bands centered at 627 cm-1 and 525 cm-1 for x = 05
mol MnO decrease and disappear for x = 1 mol MnO The band of 345 cm-1 slowly
increases with the addition of manganese ions
To the band from 826 cm-1 the addition of iron ions in the glass matrix determines
for x = 05 mol an increase in intensity a gradual decrease and disappearance for x = 35
mol Fe2O3 of the bands observed for the glass matrix For higher concentrations of
manganese these bands gradually decrease The intensity of bands centered at 627 cm-1 and
525 cm-1 for x = 05 mol Fe2O3 increase and shift to 612 cm-1 and 501 cm-1 whereas
17
they gradually decrease and disappear for x = 10 mol Fe2O3 The band of 345 cm-1
decreases with the addition of iron ions and disappears for x = 20 mol Fe2O3
200 400 600 800 1000
3
612
501
Wavenumber [cm-1]
Ram
an In
tens
ity [a
u]
05
20
0
5
10
3550
1
Fe2O3
345
826
525
627
Fig 48 Raman spectra of xFe2O3middot(100- x)[As2O3middotPbO] glasses
With the increase of iron ions content in the As2O3middotPbO glass matrix the number of
these structural units decreases due to the increasing of the disorder in the studied glasses
418 Study by Raman spectroscopy of xMOmiddot(100-x)[As2O3middotTeO2]
vitreous systems were MO =gt MnO or Fe2O3
The Raman spectra obtained for xMOmiddot(100- x)[As2O3middot TeO2] vitreous systems
where MO =gt MnO or Fe2O3 with 0 le x le 50 mol are presented in figure 49-10 and their
structural assignments are summarized in table 42
The Raman spectrum of the glass matrix suggests a structure formed from TeO4 (tbp)
and TeO3 (tp) units where the presence of As ndash O ndash As bonds can not be excluded The
addition of manganese ions is leading to a modification of the structure proposed by the
spectrum of the glass matrix Then with the increasing of manganese content the intensity of
these bands is increasing showing that the manganese content favorises the formation of TeO4
(tbp) and TeO3 (tp) units
18
200 400 600 800 1000
783
850
768
416
816
752
Wavenumber [cm -1]
Ram
an In
tens
ity [a
u]
13
20
05
0
5
10
35
50
MnO
438
580
660
Fig 49 Raman spectra of xMnOmiddot(100- x)[As2O3middot TeO2] glasses
200 400 600 800 1000
226
294
408
673 751
5
W avenumber [cm -1]
Ram
an In
tens
ity [a
u]
05
20
0
3
10
35
50
1
Fe2O
3
816
752
438
580
Fig 410 Raman spectra of xFe2O3middot(100- x)[As2O3 TeO2] glasses
The Raman spectra of xFe2O3middot(100- x)[As2O3 TeO2] glasses present a significant
advance to the TeO4 (tbp) TeO3+1 polyhedra and AsO3 units represented in Raman spectrum
by the ~ 438 cm-1 band comparative with the modifications determined by the addition of
manganese ions in vitreous matrix For high concentrations of iron ions in xFe2O3middot(100-
x)[As2O3 TeO2] system of glasses the number of As-O-As linkages appear in Raman
spectrum due to stretching vibrations of As-O-As and vibrations of the continuous TeO4 (tbp)
network show a significant decrease
19
419 Comparative study by Raman spectroscopy of xMnOmiddot(100- x)[As2O3middotBO]
vitreous systems were BO =gt TeO2 or PbO
The addition of MnO to xMnOmiddot(100- x)[As2O3middotPbO] glass system do not break As
ndash O ndash As bonds into characteristic units and contribute to their prominence The addition of
manganese ions to xMnOmiddot(100- x)[As2O3middot TeO2] glass system for x=50mol MnO
determined the splitting up of a part of As ndash O ndash As Te-O-Te and the appearance of the
TeO4 (tbp) units against the loss of continuous TeO4 (tbp) network was observed
4110 Comparative study by Raman spectroscopy of xFe2O3middot(100- x)[As2O3middotBO]
vitreous systems where BO =gt TeO2 or PbO
With the increasing of iron ions content in the As2O3middotPbO glass matrix the number of
these structural units decreased due to the increase of the disorder in the studied glasses (x gt 20
mol ) and x = 50 mol Fe2O3 for xFe2O3middot(100- x)[As2O3middotTeO2] when iron ions
brought the structural units existing in glass matrices and favoured the appearace of
new bands due to bending vibrations of As ndash O ndash As
42 Comparative study by FT-IR and Raman spectroscopies of
xMOmiddot(100-x)[3B2O3middotLi2O] glasses where MO =gt MnO or Fe2O3
421 Study by FT-IR spectroscopy of xMOmiddot(100-x)[3B2O3middotLi2O] glasses
where MO =gt MnO or Fe2O3
The infrared absorption spectra obtained for xMOmiddot(1-x)[3B2O3middotLi2O] glass system
where MO =gt MnO or Fe2O3 with 0 le x le 50 mol are presented in figure 411-13 and their
structural assignments are summarized in table 43
500 1000 1500
3B2O3Li2O
Wavenumber [cm-1]
Abs
orpt
ion
[au
]
490
1400
1230
1061
698
614
460 78
6
Fig 411 FT ndash IR spectra of vitreous matrix 3B2O3middotLi2O
20
Following the infrared absorption spectra obtained for 3B2O3middotLi2O vitreous matrix
observed on eight bands ~ 1400 cm-1 ~ 1230 cm-1 ~ 1061 cm-1 ~ 786 cm-1 ~ 698 cm-
1 ~ 614 cm-1 ~ 490 cm-1 şi ~ 460 cm-1 The band at ~ 1400 cm-1 is assigned to
asymmetric stretching vibrations from BOslash3 şi BOslash2O- groups (Oslash represent oxygen atom
bridging two boron atoms) The band at ~ 1230 cm-1 is attributed to asymmetric stretching
vibrations of B ndash O bonds from triangular ortoborate BO 33 groups [23-26]
400 600 800 1000 1200 1400 1600
0
3
5
10
20
35
50
1
Wavenumber [cm-1]
Abs
orpt
ion
[ua
]
05
MnO
490
1400
1230
1061
698
614
460 78
6
Fig 412 FT ndash IR spectra of xMnOmiddot(100-x)[3B2O3middotLi2O] glasses
400 600 800 1000 1200 1400 1600
469
Wavenumber [cm-1]
Abs
orpt
ion
[ua
]
0
3
5
10
20
35
50
1
05
Fe2O3
490
1400
1230
1061
698
614
460 78
6
Fig 413 FT ndash IR spectra of x Fe2O3middot(100-x)[3B2O3middotLi2O] glasses
21
Table 43Wavenumber and the structural assignments of FT ndash IR and Raman
spectra of 3B2O3middotLi2O vitreous matrix
~ [cm 1 ] Attribution
FT ndash IR Raman FT ndash IR Raman
~ 1400 cm-1
~ 1400 cm-1
Asymmetric stretching
vibrations from BOslash3 şi BOslash2O-
groups
BOslash2O- triangles linked to
other borate triangular units
~ 1230 cm-1
Asymmetric stretching
vibrations of B ndash O bonds from
triangular ortoborate
BO 33 groups
~ 1061 cm-1
~ 1074 cm-1
Stretching vibrations of B ndash Oslash
bonds in -4BOslash tetrahedra from
tri- tetra- and penta-borate
groups
Diborate groups
~ 902 cm-1
Vibrations of orthoborate
groups
~ 786 cm-1
~ 791 cm-1
Bending vibrations of O3B ndash O
ndash BO4 bonds
Vibrations of rings with six
member to one or two BO4
tetrahedral from tri- tetra ndash
and penta ndash borate units
~ 698 cm-1
Bending vibrations of B-O-B
bonds from pentaborate groups
~ 614cm-1 Bending vibrations of O ndash B ndash O
bonds
~ 490cm-1 ~ 471cm-1 Bending vibrations of B-O-B
bonds
Isolated diborate groups
~ 460cm-1 Bending vibrations of O ndash B ndash O
bonds
22
The band at ~ 1061 cm-1 is assigned to stretching vibrations of B ndash Oslash bonds in -4BOslash
tetrahedra from tri- tetra- and penta-borate groups and the band at ~ 786 cm-1 is assigned
to bending vibrations of O3B ndash O ndash BO4 bonds The band at ~ 698 cm-1 is attributed to
Bending vibrations of B-O-B bonds from pentaborate groups The bands at ~ 614 cm-1 and
~ 460 cm-1 are assigned to bending vibrations of O ndash B ndash O bonds and the band at ~ 490 cm-
1 is assigned to bending vibrations of B-O-B bonds
From FT-IR spectra it can be concluded that the addition of manganese or iron ions in
vitreous matrices leads to the increase of the disorder degree
Also the structural changes that appeared in 3B2O3middotLi2O vitreous matrix with an
addition MnO or Fe2O3 content can be studied Ar=A4A3 ratio(A4 - relative number of -4BOslash tetrahedral borate units A3 - relative number of triangular (BOslash3 and BOslash2O-) units
0 10 20 30 40 50
010
015
020
Ar
x [mol]
MnO Fe2O3
Fig 414 The evolution of Ar ratio with the MnO or Fe2O3 content of
xMnOmiddot(100-x)[3B2O3middotLi2O] şi xFe2O3middot(100-x)[3B2O3middotLi2O] The evolution of the value of this ratio also allows a visualization of the effects
determined by the presence of the manganese or iron ions in the matrix The value Arltlt 1
indicated that BO3 is dominant related to BO4
422 Study by Raman spectroscopy of xMOmiddot(100-x)[3B2O3middotLi2O] glasses
where MO =gt MnO or Fe2O3
The Raman spectra obtained for xMOmiddot(1-x)[3B2O3middotLi2O] glass system were MO =gt
MnO or Fe2O3 with 0 le x le 50 mol are presented in figure 414-16 and their structural
assignments are summarized in table 43
Studying the Raman spectra of xMOmiddot(1-x)[3B2O3middotLi2O] glass system where MO =gt
MnO or Fe2O3 it has been observed that the absorption bands presented in vitreous matrix
gradually decreased with an increase in the manganese or iron content in both glasses system
which suggested an increase of the disorder in these vitreous systems
23
1000 2000 3000
B2O3Li2O
Wavenumber [cm-1]
Ram
an In
tens
ity [a
u]
1430
107490
279
1471
Fig 415 Raman spectra of vitreous matrix 3B2O3middotLi2O
500 1000 1500 2000 2500 3000
1430
107490
2791
0
Wavenumber [cm-1]
Ram
an In
tens
ity [a
u]
1
3
20
05
5
10
35
50
MnO
471
Fig 416 Raman spectra of xMnOmiddot(100-x)[3B2O3middotLi2O] glasses
400 600 800 1000 1200 1400 1600
Wavenumber [cm-1]
Ram
an In
tens
ity [a
u]
0
1
3
20
05
5
10
35
50
Fe2O3
1430
1074
90279
1
471
Fig 417 Raman spectra of x Fe2O3middot(100-x)[3B2O3middotLi2O] glasses
24
43 Comparative study by electron paramagnetic resonance (EPR) and magnetic
susceptibility measurements of xMOmiddot(100-x)[As2O3middotTeO2] xMOmiddot(100-x)
[As2O3middotPbO] and xMOmiddot(100-x)[3B2O3middotLi2O] glasses where MO =gt MnO or Fe2O3
431 Comparative study by electron paramagnetic resonance (EPR) of
xMnOmiddot(100-x)[As2O3middotBO] where BO =gt TeO2 or PbO
and xMnOmiddot(100-x) [3B2O3middotLi2O] glasses
In order to obtain more information regarding the behavior of manganese ions in
different vitreous matrices [3031] xMnOmiddot(100-x)[As2O3middotBO] where BO =gt TeO2 or PbO
and xMnOmiddot(100-x) [3B2O3middotLi2O] glasses were investigated by EPR spectroscopy on a large
compositional range with 0 le x le 50 mol The EPR spectra of Mn2+ for xMnOmiddot(100-
x)[As2O3middotPbO] (S1) xMnOmiddot(100-x)[As2O3middotTeO2] (S3) and xMnOmiddot(100-x)[3B2O3middotLi2O]
(S5) are presented in figure 418-20 These spectra present two absorption lines centered at gef
43 and gef 20 in all systems
The absorption line centered at gef 43 and is due to isolated Mn2+ ions [32] The
absorption line centered at gef 20 may be attributed to Mn2+ species interacting by magnetic
coupling[33] dipolar and or super exchange the last ones forming magnetic clusters [32]
The evolution of the spectra is easier to follow considering the dependence of
concentration on the EPR parameters the line - intensity (obtained as an integral of the area
under the corresponding EPR signal) J and the line - width ΔB The evolution of J and AB
reflects the structural transformations which appear in the glass matrices due to the increase of
manganese ions content
The intensity and the line - width of the resonance line from gef 43 for all
investigated systems is represented in figure 421(ab)
The intensity of the resonance line from gef 43 for all investigated glass systems
decreases due to the decrease of the isolated manganese ions numbers The line - width from
gef 43 for (S1) and (S3) systems decreases due to decrease of Mn2+ number and to the
structural disorder in glasses with the increase of MnO content For (S5) glass system the line
- width of the resonance line there is an increase in all compositional domains
The intensity of the resonance line from gef 20 can be observed as increasing up to
x=14 mol for (S1) system up to x=8mol for (S3) system and 20 mol for (S5)
system The line - width of the resonance line from gef 20 for (S1) and (S3) systems
increases up to 3 mol and 5mol for (S5) due to Mn2+ species interacting by magnetic
coupling dipole- dipole as the main broadening mechanism Over this concentration line ndash the
width of the resonance line from gef 20 is straight and it can be assumed that the
manganese ions begin to manifest super exchange magnetic interactions
25
1000 2000 3000 4000 5000
Firs
t der
ivat
ive
of a
bsor
ptio
n [u
a]
05
1
3
5
10
20
35
50
x [mol Mn2O3]amplif
B [G]
10
200
40
80
400
5
1
1
Fig 418 The EPR spectra of Mn2+ for xMnOmiddot(100-x)[As2O3middotPbO] (S1)
glass system
1000 2000 3000 4000 5000
Firs
t der
ivat
ive
of a
bsor
ptio
n [u
a]
x [mol MnO]
051
3
5
10
20
35
50
9
500
400
50
100
4
1
amplif
B [G]
1
Fig 419 The EPR spectra of Mn2+ for xMnOmiddot(100-x)[As2O3middotTeO2] (S3)
glass system
26
1000 2000 3000 4000 5000
501
B [G]
Firs
t der
ivat
ive
of a
bsor
ptio
n [u
a]
1
4
9
10
30
60
100
amplif
05
1
3
5
10
20
35
x [mol MnO]
Fe3+
Fig 420 The EPR spectra of Mn2+ for xMnOmiddot(100-x)[3B2O3middotLi2O] (S5)
glass system
0 2 4 6 8 10 12 14 16 18 20 22
x [mol]
J [ u
a]
S1 S3 S5
-2 0 2 4 6 8 10 12 14 16 18 20 22
50
100
150
200
250
300
S1 S3 S5
x [mol]
B
[G]
a b
Fig 421 The dependence on MnO content of the intensity (a) and width(b) of resonance
line at gef 43 for xMnOmiddot(100-x)[As2O3middotPbO] (S1) xMnOmiddot(100-x)[As2O3middotTeO2] (S3) şi
xMnOmiddot(100-x)[3B2O3middotLi2O] (S5) system glasses
27
0 10 20 30 40 50
x [mol]
J [ u
a]
S1 S3 S5
0 10 20 30 40 50
400
500
600
700
800
900
S1 S3 S5
x [mol]
B[G
]
a b
Fig 422 The dependence on MnO content of the intensity (a) and width b) of resonance
line at gef 20 for xMnOmiddot(100-x)[As2O3middotPbO] (S1) xMnOmiddot(100-x)[As2O3middotTeO2] (S3) and
xMnOmiddot(100-x)[3B2O3middotLi2O] (S5) system glasses
Following figure 418-20 it can be observed that (S1) and (S3) have had a similar
evolution but (S5) system presented for 05 le x le 5 mol (fig420) has a hyperfine
sextet[33] at gef 20due to Mn2+ isolated ions
432 Comparative study by magnetic susceptibility measurements of
xMnOmiddot(100-x)[As2O3middotBO] where BO =gt TeO2 or PbO and
xMnOmiddot(100-x)[3B2O3middotLi2O] glasses
The magnetic susceptibility data are in good agreement with the EPR result The
magnetic behavior of the glasses from xMnOmiddot(100-x)[As2O3middotBO] where BO =gt TeO2 (S3)
or PbO (S1) and xMnOmiddot(100-x)[3B2O3middotLi2O] (S5) glasses for 3 le x le 50 mol MnO are
presented in figure 423 - 25
For (S1) and (S3) system glasses up to x 3 mol and x 5 mol (S5) glass
system the temperature dependence of the reciprocal magnetic susceptibility obeys a Curie
law In this concentration range the manganese ions are predominantly isolated orand
participate in dipole-dipole interractions At higher concentrations the reciprocal magnetic
susceptibility obeys a Curie-Weiss law with negative paramagnetic Curie temperature (p)
characteristic to antiferromagnetic coupled ions by means of super exchange interractions(fig
426) This behavior of manganese ions is confirmed by the shape of the EPR spectra
28
100 150 200 250
2
4
6
8
10
12
14
16
18
20
22
T [K]
[
emu
mol
]-1
3 mol 5 mol 10 mol 20 mol 35 mol 50 mol
Fig423 The temperature dependence of -1 for xMnOmiddot(100-x)[As2O3middotPbO]
(S1) 3 le x le 50 mol
50 100 150 200 2500
2
4
6
8
10
12
14
16
18
20
22
3 mol 5 mol 10 mol 20 mol 35 mol 50 mol
T [K]
[
emu
mol
]-1
Fig424 The temperature dependence of -1 for xMnOmiddot(100-x)[ As2O3middotTeO2]
(S1) 3 le x le 50 mol
100 150 200 250
2
4
6
8
10
12
14
16
18
20
22
[em
u m
ol]-1
T [K]
3 mol 5 mol 10 mol 20 mol 35 mol 50 mol
Fig425 The temperature dependence of -1 for xMnOmiddot(100-x)[3B2O3middotLi2O]
(S5) 3 le x le 50 mol
29
0 10 20 30 40 50
0
20
40
60
80
100
x [mol]
-p [K
]
(S1) (S3) (S5)
Fig426Concentration dependence of (p) for sistemele xMnOmiddot(100-x)[As2O3middotPbO]
(S1) xMnOmiddot(100-x)[As2O3middotTeO2] (S3) şi xMnOmiddot(100-x)[3B2O3middotLi2O] (S5)
Using the representation 1 =f(T) the molar Curie constants CM the effective
magnetic moments and molar fraction of Mn2+(x1) şi Mn3+(x2) ions were calculated and
represented in tables 44 -6
Tabel 44 Molar Curie constants effective magnetic moments and molar fraction of Mn2+(x1) şi Mn3+(x2) ions in xMnOmiddot(100-x)[As2O3middotPbO] (S1) glasses
x
[mol MnO2] CMtimes102
[emu mol] ef
[microB] x1
[mol Mn2+O2] x2
[mol Mn3+O2] 3 1272 582 268 032 5 1979 562 343 157 10 3777 549 555 445 20 6688 517 492 1508 35 12239 502 377 3123 50 15427 496 268 4732
Tabel 45 Molar Curie constants effective magnetic moments and molar fraction of Mn2+(x1) şi Mn3+(x2) ions in xMnOmiddot(100-x)[As2O3middotTeO2] (S3)glasses
x
[mol MnO2] CMtimes102
[emu mol] ef
[microB] x1
[mol Mn2+O2] x2
[mol Mn3+O2] 3 1297 588 287 013 5 1938 556 312 188 10 3804 551 575 425 20 6766 52 549 1451 35 11148 504 441 3059 50 15528 498 358 4642
30
Tabel 46 Molar Curie constants effective magnetic moments and molar fraction of Mn2+(x1) şi Mn3+(x2) ions in xMnOmiddot(100-x)[3B2O3middotLi2O] (S5) glasses
x
[mol MnO2] CMtimes102
[emu mol] ef
[microB] x1
[mol Mn2+O2] x2
[mol Mn3+O2] 3 127 581 265 035 5 1919 554 303 197 10 3681 542 486 514 20 7215 519 53 147 35 1121 506 505 2995 50 15898 501 493 4507
433 Comparative study by electron paramagnetic resonance (EPR) of
xFe2O3middot(100-x)[As2O3middotBO] where BO =gt TeO2 or PbO and
x Fe2O3middot(100-x) [3B2O3middotLi2O] glasses
In order to obtain more information regarding the behavior of iron ions in
xFe2O3middot(100-x)[As2O3middotBO] where BO =gt TeO2 (S4) or PbO (S2) şi xFe2O3middot(100-
x)[3B2O3middotLi2O] glasses were investigated by EPR spectroscopy on a large compositional
range with 05 le x le 35 mol Fe2O3 The EPR spectra of Fe3+ in xFe2O3middot(100-
x)[As2O3middotPbO] (S2) xFe2O3middot(100-x)[As2O3middotTeO2] (S4) and xFe2O3middot(1-x)[3B2O3middotLi2O]
(S6) are presented in figure 427-29 These spectra present two absorption lines centered at
gef 43 and gef 20 up to x le 35mol Fe2O3 systems studied
The absorption line centered at gef 43 is due to isolated Fe3+ ions [34-36] The
absorption line centered at gef 20 may be attributed to Fe3+ species interacting by magnetic
coupling dipolar and or super exchange the last ones forming magnetic clusters [37-41]
The evolution of the spectra is easier to follow considering the dependence of
concentration on the EPR parameters the line - intensity (obtained as an integral of the area
under the corresponding EPR signal) J and the line - width ΔB The evolution of J and AB
reflects the structural transformations which appear in the glass matrices due to the increasing
of iron ions content
The intensity and the line - width of the resonance line from gef 43 for all
investigated systems is represented in figure 430 (a b) The intensity of the resonance line
from gef 43 increases for (S2) and (S4) up to 3 mol and up to 5 mol for (S6) then
decreases for all systems investigated A line broadening up to 3 mol from gef 43 for
these systems can be observed due to increasing of Fe3+ isolated number of ions
31
1000 2000 3000 4000 5000
40
Firs
t der
ivat
ive
of a
bsor
ptio
n [u
a]
B [G]
x [mol Fe2O3]
05
1
3
5
1020
35 2
40
20
10
10
10
amplif
Fig427 The EPR spectra of Fe3+ for xFe2O3middot(100-x)[As2O3middotPbO] (S2)
glass system
1000 2000 3000 4000 5000
100
B [G]
Firs
t der
ivat
ive
of a
bsor
ptio
n [u
a]
10080
20
50
20
20
3
05
1
5
102035
x [mol Fe2O3] amplif
Fig428 The EPR spectra of Fe3+ for xFe2O3middot(100-x)[As2O3middotTeO2] (S4)
glass system
32
1000 2000 3000 4000 5000
Firs
t der
ivat
ive
of a
bsor
ptio
n [u
a]
B [G]
3
05
1
5
10
20
35
x [mol Fe2O3]
30
50
20
20
10
30
30
amplif
Fig429 The EPR spectra of Fe3+ for xFe2O3middot(100-x)[3B2O3middotLi2O] (S6)
glass system
The intensity and the line - width of the resonance line from gef 43 for all
investigated systems is represented in figure 430 (a b)The resonance line from gef 20 is
attributed to Fe3+ ions that interact by magnetic coupling dipolar orand super exchange
interractions can be observed in all compositional domains
The intensity of the resonance line from gef 20 can be observed as increasing up to
x=35 mol for (S2) and (S6) system and 10 mol for (S4) system with increased iron
ions content The line - width of the resonance line from gef 20 increased up to 10mol
for (S2) system and up to 3 mol for (S4) and 5mol for (S6) due to Fe3+species
interacting by magnetic coupling dipole-dipole Above this concentration line - width of the
resonance line from gef 20 can be attributed to dipolar and super exchange magnetic
interactions The ΔB = f(x) dependence reflects the competion between the broadening
mechanism (dipole ndash dipole interactions the interactions between ions in diferent
valence state and structural disorder) and the narrowing ones (super exchange
interactions)
33
0 5 10 15 20 25 30 35 40
x [mol]
J [ u
a]
S2 S4 S6
a)
0 5 10 15 20 25 30 35 4040
60
80
100
120
140
160
180
200
220 S2 S4 S6
B[G
]
x [mol]
a b
Fig 430 The dependence on Fe2O3 content of the intensity (a) and width (b) of
resonance line at gef 43 for xFe2O3middot(100-x)[As2O3middotPbO] (S2)
xFe2O3middot(100-x)[As2O3middotTeO2] (S4) and xFe2O3middot(100-x)[3B2O3middotLi2O] (S6) glasses
0 5 10 15 20 25 30 35 40
x [mol]
J [ u
a]
S2 S4 S6
a)
0 5 10 15 20 25 30 35 40
200
400
600
800
1000
1200
1400
1600
x [mol]
B
[G] S2
S4 S6
a b
Fig 431 The dependence on Fe2O3 content of the intensity (a) and width (b) of
resonance line at gef 20 for xFe2O3middot(100-x)[As2O3middotPbO] (S2)
xFe2O3middot(100-x)[As2O3middotTeO2] (S4) and xFe2O3middot(100-x)[3B2O3middotLi2O] (S6) glasses
34
434 Comparative study by magnetic susceptibility measurements of
xFe2O3middot(100-x)[As2O3middotBO] where BO =gt TeO2 or PbO and
xFe2O3middot(100-x) [3B2O3middotLi2O] glasses
The magnetic susceptibility data are in good agreement with the EPR result The magnetic
behavior of the glasses xFe2O3middot(100-x)[As2O3middotPbO] (S2) xFe2O3middot(100-x)[As2O3middotTeO2]
(S4) and xFe2O3middot(100-x)[3B2O3middotLi2O] (S6) for 3 x 50 mol Fe2O3 are presented in
figure 432 - 34
For (S2) glass systems up to x 10 mol x 3 mol (S5) glass systems and x 5
mol (S6) glass systems the temperature dependence of the reciprocal magnetic susceptibility
obeys a Curie law In this concentration range the iron ions are predominantly isolated orand
participate in dipole-dipole interactions At higher concentrations the reciprocal magnetic
susceptibility obeys a Curie-Weiss law with negative paramagnetic Curie temperature (p)
characteristic to antiferromagnetic coupled ions by means of super exchange interactions(fig
435) This behavior of iron ions is confirmed by the shape of the EPR spectra
80 100 120 140 160 180 200 220 240 260 2800
1
2
3
4
5
6
7
8
9
10
11
[
emu
mol
]-1
T [K]
3 mol 5 mol 10 mol 20 mol 35 mol 50 mol
Fig432 The temperature dependence of -1 for xFe2O3middot(100-x)[As2O3middotPbO] (S2)
3 x 50 mol
35
80 100 120 140 160 180 200 220 240 260 2800
1
2
3
4
5
6
7
8
9
10
T [K]
[
emu
mol
]-1
3 mol 5 mol 10 mol 20 mol 35 mol 50 mol
Fig433 The temperature dependence of -1 for xFe2O3middot(100-x)[As2O3middotTeO2] (S4)
3 x 50 mol
80 100 120 140 160 180 200 220 240 260 2800
1
2
3
4
5
6
7
8
9
10
11
3 mol 5 mol 10 mol 20 mol 35 mol 50 mol
T [K]
[
emu
mol
]-1
Fig434 The temperature dependence of -1 for xFe2O3middot(100-x)[3B2O3middotLi2O] (S6)
3 x 50 mol
36
0 10 20 30 40 50
0
10
20
30
40
50
x [mol]-
p [K]
(S2) (S4) (S6)
Fig435Concentration dependence of (p) for sistemele xFe2O3middot(100-x)[As2O3middotPbO] (S2) xFe2O3middot(100-x)[As2O3middotTeO2] (S4) and xFe2O3middot(100-x)[3B2O3middotLi2O] (S6)
for 3 x 50 mol Fe2O3
Using the representation 1 = f(T) the molar Curie constants CM the effective
magnetic moments and molar fraction of Fe3+(x1) şi Fe2+(x2) ions were calculated and
represented in tables 47-9
Table 47 Molar Curie constants effective magnetic moments and molar fraction of
Fe3+(x1) şi Fe2+(x2) ions in xFe2O3middot(100-x)[As2O3middotPbO] glasses (S2)
x [mol Fe2O3]
CMtimes102
[emu mol] ef
[microB] x1
[mol Fe23+O3]
x2 [mol Fe2
2+O3] 3 2526 58 261 039 5 393 56 332 168 10 7326 541 476 524 20 13459 519 53 147 35 23364 516 829 2671 50 32154 507 767 4233
Table 48 Molar Curie constants effective magnetic moments and molar fraction of
Fe3+(x1) şi Fe2+(x2) ions in xFe2O3middot(100-x)[As2O3middotTeO2] glasses (S4)
x [mol Fe2O3]
CMtimes102
[emu mol] ef
[microB] x1
[mol Fe23+O3]
x2 [mol Fe2
2+O3] 3 2571 585 277 023 5 4016 566 363 137 10 7911 562 686 314 20 14992 521 643 929 35 22676 509 601 2899 50 30959 497 313 4687
37
Table 49 Molar Curie constants effective magnetic moments and molar fraction of Fe3+(x1) şi Fe2+(x2) ions in xFe2O3middot(100-x)[3B2O3middotLi2O] glasses (S6)
The results allowed to consider that the magnetic properties of the studied glasses can
be explained through magnetic interractions between Fe3+ - Fe3+ Fe3+- Fe2+ and Fe2+- Fe2+ that
explain the dependences of RPE parameters concentration
SELECTED CONCLUSIONS
In this thesis xMOmiddot(100-x)[As2O3middotTeO2] xMOmiddot(100-x) [As2O3middotPbO] and
xMOmiddot(100-x)[3B2O3middotLi2O] glasses where MO =gt MnO or Fe2O3 were comparatively
studied in 0 le x le 50 mol The structural modifications of investigated glass matrices were
comparatively followed in function of the manganese or iron ions on the investigated glass
matrices were followed
The study by FT-IR spectroscopy shows that the evolution of the spectra of
xMnOmiddot(100-x) [As2O3middotPbO] with the addition and the increasing of the MnO content suggest
that the manganese ions break up a part of As ndash O ndash As Pb ndash O ndash Pb and probably of As ndash O ndash
Pb bonds The addition of MnO in the As2O3middotPbO glass matrix is leading to a disordering of
the glasses structure with the increasing of the MnO content
The evolution of the absorption bands for FT ndash IR spectrum of xFe2O3middot(1-x)
[As2O3middotPbO] glasses are determined by the addition of Fe2O3 content It can be observed to
shift the bands assigned As ndash O ndash As vibrations from AsO3 units due to changing to length As
ndash O ndash As bonds and interne angles of AsO3 units disappears PbO4 units and appears FeO6
units The addition of Fe2O3 in the As2O3middotPbO glass matrix determined a disordering of the
glasses structure with the increasing of the Fe2O3 content
From FT-IR absorption spectra of the investigated xMOmiddot(100-x)[As2O3middotTeO2] glasses
system where MO =gt MnO or Fe2O3 it can be observed that the addition and increasing of
manganese ions concluded the contraction of As-O-As bonds from totally symmetric
x [mol Fe2O3]
CMtimes102
[emu mol] ef
[microB] x1
[mol Fe23+O3]
x2 [mol Fe2
2+O3] 3 2542 582 268 032 5 3943 561 338 162 10 7423 544 506 494 20 13568 520 549 1451 35 23094 513 731 2769 50 31746 503 584 4416
38
stretching vibrations of AsO3 units for x ge10 mol there can be an increase in number of As-
O-As bonds from AsO3 units orand a length these linkage to doubly degenerate stretching
vibrations of AsO3 units and a stretching vibration mode of TeO3 tp with NBO It can be
remarked from the FT-IR absorption spectra the gradual transformation of symmetric
stretching vibration mode of Te-O bonds from TeO3 units in TeO4 (tbp) units and the presence
of MnO2 units Once with the addition of iron ions the xFe2O3middot(100- x)[As2O3middotTeO2]
glasses behave like xMnOmiddot(100-x)[As2O3middotTeO2] glasses but in this system the
appearance of FeO6 units can be seen
From FT-IR spectra in xMOmiddot(100-x)[3B2O3middotLi2O] glasses where MO =gt MnO or
Fe2O3 can be concluded that the addition of manganese or iron ions in vitreous matrices leads
to the increase of the disorder degree
The study by Raman spectroscopy shows that the evolution of the spectra the addition
of MnO in the [As2O3middotPbO]glass matrix determined an order degree of the vitreous matrix
The intensity of the bands attributed vibrations As ndash O ndash As bonds from As2O units and
bending vibrations of As ndash O ndash As from As2O units shift to a higher wave length that suggests
an increase in the As2O units comparative to AsO3 units With the increase of iron ions content
in the As2O3middotPbO glass matrix the number of these structural units decreases due to the
increasing of the disorder in the studied glasses
With the increasing of manganese content in As2O3TeO2 glass matrix the intensity
of these bands is increasing showing that the manganese content favorites the formation of
TeO4 (tbp) and TeO3 (tp) units For high concentrations of iron ions in xFe2O3middot(100-
x)[As2O3 TeO2] system of glasses the number of As-O-As linkages appear in Raman
spectrum due to stretching vibrations of As-O-As and vibrations of the continuous TeO4 (tbp)
network show a significant decrease
Studying the Raman spectra of xMOmiddot(1-x)[3B2O3middotLi2O] glass system where MO =gt
MnO or Fe2O3 it has been observed that the absorption bands presented in vitreous matrix
gradually decreased with an increase in the manganese or iron content in both glasses system
which suggested an increase of the disorder in these vitreous systems
The EPR spectra presents the behavior of manganese or iron ions in different vitreous
matrices xMOmiddot(100-x)[As2O3middotBO] where MO=gtMnO or Fe2O3 and BO =gt TeO2 or
PbO and xMOmiddot(100-x) [3B2O3middotLi2O] Glasses were investigated by EPR spectroscopy on a
large compositional range with 0 le x le 50 mol The absorption line centered at gef 43 and
is due to isolated Mn2+ ions The absorption line centered at gef 20 may be attributed to
Mn2+ species interacting by magnetic coupling dipolar and or super exchange the last ones
forming magnetic clusters The EPR spectra of Fe3+ in xFe2O3middot(100-x)[As2O3middotPbO]
xFe2O3middot(100-x)[As2O3middotTeO2] and xFe2O3middot(1-x)[3B2O3middotLi2O] are presented two absorption
lines centered at gef 43 and gef 20 up to x le 35mol Fe2O3 systems studied
39
The absorption line centered at gef 43 is due to isolated Fe3+ ions The absorption
line centered at gef 20 may be attributed to Fe3+ species interacting by magnetic coupling
dipolar and or super exchange the last ones forming magnetic clusters
The evolution of the spectra is easier to follow considering the dependence of
concentration on the EPR parameters the line - intensity (obtained as an integral of the area
under the corresponding EPR signal) J and the line - width ΔB The evolution of J and AB
reflects the structural transformations which appear in the glass matrices due to the increase of
manganese ions content
The magnetic susceptibility data are in good agreement with the EPR result The
magnetic behavior of the glasses from xMnOmiddot(100-x)[As2O3middotBO] where BO =gt TeO2 (S3)
or PbO (S1) and xMnOmiddot(100-x)[3B2O3middotLi2O] (S5) glasses for 3 le x le 50 mol MnO
For (S1) and (S3) system glasses up to x 3 mol and x 5 mol (S5) glass
system the temperature dependence of the reciprocal magnetic susceptibility obeys a Curie
law In this concentration range the manganese ions are predominantly isolated orand
participate in dipole-dipole interractions At higher concentrations the reciprocal magnetic
susceptibility obeys a Curie-Weiss law with negative paramagnetic Curie temperature (p)
characteristic to antiferromagnetic coupled ions by means of super exchange interractions This
behavior of manganese ions is confirmed by the shape of the EPR spectra Using the
representation 1 =f(T) the molar Curie constants CM the effective magnetic moments
and molar fraction of Mn2+(x1) şi Mn3+(x2) ions were calculated The magnetic susceptibility
data are in good agreement with the EPR result
The magnetic behavior of the glasses xFe2O3middot(100-x)[As2O3middotPbO] (S2)
xFe2O3middot(100-x)[As2O3middotTeO2] (S4) and xFe2O3middot(100-x)[3B2O3middotLi2O] (S6) for 3 x 50
mol Fe2O3 are presented For (S2) glass systems up to x 10 mol x 3 mol (S5)
glass systems and x 5 mol (S6) glass systems the temperature dependence of the
reciprocal magnetic susceptibility obeys a Curie law In this concentration range the iron ions
are predominantly isolated orand participate in dipole-dipole interactions At higher
concentrations the reciprocal magnetic susceptibility obeys a Curie-Weiss law with negative
paramagnetic Curie temperature (p) characteristic to antiferromagnetic coupled ions by
means of super exchange interactions(fig 435) This behavior of iron ions is confirmed by the
shape of the EPR spectra Using the representation 1 = f(T) the molar Curie constants
CM the effective magnetic moments and molar fraction of Fe3+(x1) şi Fe2+(x2) ions were
calculated
40
REFERENCES
Chapter 1
[1] I Ardelean bdquoIntroducere icircn studiul materialelor oxidice cu structură vitroasă EdNapocaStar Cluj Napoca 2002 [2] G Srinivasarao N Veeraiah J All Com 327 52-65(2001) [3] G Srinivasarao N Veeraiah J Phys Chem Solids 63705-717(2002) [4] DBecherescu VCristea FMarx IMenessz FWinter Chimia stării solide Ed Şt şi Encicl Bucucureştivol 1 1983 [5] J Wong CAAngell Glass-Structure by Spectroscopy Dekker Inc New York 1976 [6] BEWarren HKKrutter O Morningstat J Am Ceram Soc 19 202 (1936) [7] LLSperry JD Mackenzie Phys Chem Glasses 9 91 (1968) [8] WLKonijnendijk JMStevels J Non-Cryst Solids 18 307 (1975) [9] FCEversteyn JM Stevels HJ Naterman Phys Chem Glasses 1 134 (1963) [10] G Fuxi Optical and Spectroscopie Properties of Glass Springer-Verlag Shanghai Scientific Technical Pub Shanghai 1991 [11] YDYiannopoulos GDChryssikos EIKamitsos Phys Chem Glasses 42(3) 164 (2001) [12] MGFerreira da Silva BFOCosta J Non-Cryst Solids 293-295 534 (2001) [13] RYordanova YDimitriev VDimitriev S Kassabov DKlissurski JNon-Cryst Solids 201 141 (1996) [14] W L Konijnendijk J M Stevels J Non-Cryst Solids 18 307 (1980) [15] M Iron M Couzi ALevasseur JBrethous JSolidState Chem 31 285 (1980) [16] TFurukawa WBWhite PhzsChemGlasses 21 85 (1980) [17] E I Kamitsos M A Karakassides GD Chryssikos J Phys Chem 90 4528 (1986) [18] E I Kamitsos M A Karakassides GD Chryssikos J Phys Chem 91 1073 (1987) [19] TWBril Philips Res Rep Suppl 2 117 (1976) [20] E I Kamitsos M A Karakassides GD Chryssikos J Phys Chem 30 203 (1989) [21] BNMeera JRamakrishna J Non-Cryst Solids 159 1 (1993) [22] KWitke THubert PReich JRamanSpectr 24 407 (1993) [23] E I Kamitsos M A Karakassides Phys Chem Glasses 30 19 (1989) [24] MPeteanu Teză de doctoratrdquo Universitatea Babeş-Bolyairdquo Cluj Napoca (1989) [25] PCTaylor PJBray JPhys Chem Solids 33 43 (1972) [26] IArdelean MPeteanu GhIlonca DPop Solid State Commun 33 653 (1980) [27] AV De Wijn RE Van Balderen JKemPhys 46 4 (1967) [28] DL Griscom RE Griscom J Phys Chem Glasses 12 19 (1971) [29] JWH Schreurs JChem Phys 69 2151 (1978) [30] AlNicula M Peteanu IArdelean Studia Univ Babeş-Bolyai Physica 2 65 (1979) [31] M Peteanu IArdelean SFilip ITodor GSalvan Studia Univ Babeş-Bolyai Physica XL 2 9 (1995) [32] IArdelean M Peteanu SFilipV Simon ITodor Solid State Commun 105 (5) 339 (1998) [33] SKMendiratta EGuedes de Sousa JMatSci Lett7 733 (1988) [34] IArdelean M Peteanu SFilip V Simon GGyorffy Solid State Commun 102 (4) 341 (1997) [35] IArdelean M Peteanu SFilip V Simon FCiorcas ITodor JMagnMagn Mat 196-197 257 (1999) [36] JKliava RBerger YServant JEmery JMGreneche JTrokss J Non-Cryst Solids 202 205 (1996) [37] LDBogomolova NA Krasilnikova VLBogdanov VDKhaliev VV Mitrofanov J Non-Cryst Solids 188 130 (1995) [38] DLoveridge SPark PhysChem Glasses 12 19 (1971) [39] IArdelean G Salvan M Peteanu V Simon FCiorcas Mod PhysLett B 13 (22-23) 801 (1999)
41
[40] JLRao AMuraly EDRao J Non-Cryst Solids 202 215 (1996) [41] CPrakash S Husain RJ Singh SMollah JAlloys Compon 326 47 (2001) [42] EGuedes de Sousa SKMendiratta JMMachado Da Silva Portugal Phys 17 (3-4) 203 (1986) [43] TCastner GSNewell WCHolton CP Slichter JChem Phys 32 668 (1960) [44] SPChaudhuri SKPatra JMatSci 35 4735 (2000) [45] IArdelean HH Qiu HSakata Matt Lett 32 335 (1997) Chapter 2 [1] J Wong C A Angel Glass Structure by Spectroscopy Marcel Dekker inc New-York 1976 [2] I Ardelean bdquoIntroducere icircn studiul materialelor oxidice cu structură vitroasă EdNapocastar Cluj-Napoca 2002 [3] N Avram GH Mateescu Spectroscopia icircn infraroşu Aplicaţii icircn chimia organică Ed Tehnică Bucureşti 1968 [4] TIliescu Spectroscopie optică moleculară vibraţională şi electronică Ed Casa Cărţii de Ştiinţă Cluj- Napoca 2000 [5] S Aştilean bdquoMetode şi tehnici moderne de spectroscopie optică Ed Casa Cărţii de Ştiinţă Cluj - Napoca 2002 p 5 [6] I Ursu Rezonanţă Electronică de Spinrdquo Ed AcademieiBucureşti (1965) [7] CHHurd ContempPhys 23 (5) 469 (1982) [8] GWAnderson WDCompton JChemPhys52 6166 (1970) [9] MS Seehra GSrinivasan Landolt-Bornstein (New Series) SubVolume F3 Springer-Verlag Berlin 1994 [10] GToulouse ContempPhys 2115 (1977) [11] NMMurayMagnetic susceptybility EdInterscience New York P1773 1963 [12] JBGoodenough Magnetism and Chemical Bond EdInterscience New York 1963 [13] IArdelean G Salvan M Peteanu V Simon FCiorcas Mod PhysLett B 13 (22-23) 801 (1999) [14] IArdelean MPeteanu R Ciceo Lucăcel Studii de rezonanţă paramagnetică electronică şi magnetice ale unor ioni 3d icircn sticle pe bază de B2O3 Ed Presa Univesitară Clujeană 2005 [15] IArdelean PhysStatSol (b) 87K137 (1978) [16] IArdelean Solid State Commun 31 75 (1979) [17] EJFrieble LKWilson AWDozier DLKinser PhysStatSol (b) 45 323 (1971) [18] DWMoon JMAitken RKMcCrone GS Ciloszik PhysChe Glasses 16 (5) 91 (1975) [19] SFilip Teză de doctorat UnivBabeş-Bolyai Cluj Napoca 1996 [20] CJSchinkel GWRathenou Physics of Non-Crystaline Solids North Holland Publ Co Amsterdam 215 1965 [21] EJFrieble LKWilson NCKoon DLKinser JAm Ceram Soc 57-237 (1974) [22] RJLandry JT Fournier CGYoung JChemPhys 46 1285 (1967) [23] WSimpson PhysStatSolidi b40 207 (1970) [24] RHasegawa PhysRevB b(5) 1631 (1971) [25] IArdelean GhIlonca MPeteanu Solid State Commun 52 145 (1984) [26] IArdelean GhIlonca OCozar J Physique 49 C8 1107 (1988) Chapter 3 [1] LFBates Modern Magnetism p133 Cambridge University Press London 1962 [2] IArdelean GhIlonca DBarbos Solid State Commun 40 769 (1981) [3] EBurzo IUrsu DUngur IArdelean JMatSci 15 581 (1980) [4] EBurzo IUrsu DUngur IArdelean MatResBull 15 1273 (1980) [5] DLGriscom Glass Science and Technology 48 151 (1990) [6] PJBray AH Silver Modern aspects of the vitreous state vol1 Butterworth
42
London 1960 [7] IArdelean Teza de doctorat UnivBabeş-Bolyai Cluj Napoca 1979 [8] SAştilean bdquoMetode şi tehnici moderne de spectroscopie opticărdquo EdCasa Cărţii de Ştiinţă Cluj ndash Napoca 2002 p5 [9] IArdelean RCiceo-Lucăcel ldquoFizica şi Tehnologia Materialelor Oxidice Lucrări Practicerdquo Ed Univ ldquoBabeş-Bolyairdquo Cluj-Napoca 2000 [10] VPop IChicinaş NJumate Fizica materialelor Metode experimentalerdquo EdPresa Universitară Clujeană 2001 [11] IUrsu Rezonanţă electronică de spinrdquo EdAcademiei Bucureşti 1965 Chapter 4 [1] I Ardelean S Lupşor D Rusu Solid State Sci 10 1384(2008) [2] I Ardelean S Lupşor D Rusu trimis spre publicare la Physica B decembrie 2009 [3] P Tarte Spectrochim Acta 18 467 (1962) [4] R A Condrate J Non ndash Cryst Solids 84 26 (1986) [5] G Srinivasarao N Veeraiah Phys Stat Sol (a) 191 370(2002) [6] G Srinivasarao N Veeraiah J Phys Chem Solids 63 705(2002) [7] G Srinivasarao N Veeraiah J All Com 327 52 (2001) [8] DK Durga N Veeraiah Bull Mater Sci 24 (4) 421 (2001) [9] F F Bentley L D Smithson A L Rozek InfraredndashSpectra and Characteristic Frequencies 700-300 cm-1 Interscience New York 1968 p 103 [10] O Noguera T Merle-Mejean AP Mirgorodsky MB Smirnov P Thomas J-C Champarnaud-Mesjard J Non-Cryst Solids 330 50 (2003) [11] BVR Chowdari KL Tan Fang Ling Solid State Ionics 113 ndash 115 711(1998) [12] C Jiang J Zhang H Mao F Gan Glass Technol 39(6) 200(1998) [13] MR Sahar K Sulhadi MS Rohani J Mater Sci 42 824(2007) [14] C Horea D Rusu I Ardelean J Mater Sci Mater Electron 20 905(2009) [15] GE Rachkovskaya GB Zakharevich J Appl Spectrosc 74 86(2007) [16] I Ardelean S Lupşor D Rusu trimis spre publicare la Journal of Materials Science Materials in Electronics decembrie 2009 [17] I Ardelean S Lupşor D Rusu trimis spre publicare la Modern Physics Letters B decembrie 2009 [18] R Iordanova Y Dimitriev V Dimitrov S Kassabov D Klissurski J Non ndash Cryst Solids 231 227 (1998) [19] R Iordanova Y Dimitriev S Kassabov D Klissurski J Non ndash Cryst Solids 204 141 (1996) [20] J O Jensen S J Gilliam A Banerjee D Zeroka S J Kirkby C N Merrow J Mol Struct (Theochem) 664 145 (2003) [21] G N Papatheodorou S A Solin Solid State Commun 16 5 (1975) [22] BVR Chowdari KL Tan Fang Ling J Mat Sci 35 2015 (2000) [23] R C Lucacel C Marcus V Timar I Ardelean Solid State Sci 9 850 (2007) [24] CP Varsamis EI Kamitsos GD Chryssikos Solid State Ionics 136ndash137 1031 (2000) [25] Sherief M Abo-Naf Fatma H El Batal Moenis A Azooz Mat Chem Phys 77 846 (2002) [26] SG Motke SP Yawale SS Yawale Bull Mater Sci 25 (10) (2002) [27] R Akagi N Ohtori N Umesaki J Non ndash Cryst Solids 293 471(2001) [28] E I Kamitsos M A Karakassides G D Chryssikos J Phys Chem 91(5) 1073 (1987) [29] H Ushida Y Iwadate T Hattori S Nishiyama K Fukushima Y Ikeda M Yamaguchi M Misawa T Fukunaga T Nakazawa S Jitsukawa J Alloys Compd 377 167 (2004) [30] I Ardelean F Ciorcas M Peteanu S Lupşor G Salvan Balkan Phys Lett 5 860 (1997)
43
[31] I Ardelean M Peteanu V Simon O Cozar F Ciorcas S Lupşor J Magn Magn Mater 196 253 (1999) [32] IArdelean MPeteanu GhIlonca Phys Stat Sol (a) 58 K33(1980) [33] IArdelean MPeteanu R Ciceo-Lucăcel ldquoStudii de rezonanţă paramagnetică electronică şi magnetice ale unor ioni 3d icircn sticle pe bază de B2O3rdquo Ed Presa Univ Clujeană Cluj Napoca 2005 p 171 [34] JLRao AMuraly EDRao J Non-Cryst Solids 202 215 (1996) [35] RPSChakradhar AMurali JLRao Optical Mat 10 109 (1998) [36] IArdelean MPeteanu SFilip VSimon GGyorffy Solid State Commun 102(4) 341 (1997) [37] IArdelean MPeteanu VSimon SFilip FCiorcaş ITodor J Magn Magn Mat 196-197 257 (1999) [38] IArdelean GSalvan MPeteanu VSimon CHimcinschi FCiorcas Mod Phys Lett B 13(22-23) 801 (1999) [39] IArdelean HHQiu HSakata Mat Lett 32 335 (1997) [40] SPChaudhuri SKPatra J Mat Sci 35 4735 (2000) [41] I Ardelean M Peteanu V Simon G Salvan J Mat Sci Technol 18 (3) 1 (2002)

7
Another method used in the investigation of the glass system is the electron paramagnetic
resonance (RPE) This method is one of the most powerful techniques for local order
investigation RPE is a method widely used to describe the fundamental states and to
characterize the vicinities effect on the energetic levels of the paramagnetic centers The
method consists in the study of the electronic split levels of the atoms in the presence of an
external magnetic field [6] The Mn2+ EPR spectra are characterized by resonance absorptions
at gef 43 gef 33 and gef 20 The resonance line centered at gef 43 is
corresponding to the isolated Mn2+ ions The line from gef 20 is attributed to Mn2+ ions
involved in magnetic interactions
The Fe3+ EPR spectra are characterized by resonance absorptions at g 97 g 6 g 43
and g 20 The resonance line from g 97 is related to Fe3+ ions disposed in rhombic
environment The resonance line at g 6 was assigned to an axial distortion of the
paramagnetic ions neighborhood The resonance line at g 43 is corresponding to the isolated
Fe3+ ions situated in octahedral rhombic or tetragonal symmetric distorted neighborhoods The
line from gef 20 is attributed to Fe3+ ions involved in magnetic interactions
Along with the EPR spectroscopy the magnetic susceptibility measurements provide
useful information about the valence state and the interaction involving the transitional metal
ions in vitreous materials [7-10]
Different vitreous systems with manganese or iron ions were intensively studied by
magnetic susceptibility measurements to determine the magnetic behavior and the valence
states of these ions in these systems It was observed that the presence of the manganese or iron
ions in different valence states depends on the chemical composition of the vitreous matrix on
the valence of the vitreous network former and modifications and on the preparation of the
environment The magnetic properties of the oxide glasses with manganese or iron ions were
assigned to the antiferromagnetic couple between Mn2+-Mn2+ Mn2+-Mn3+ and Mn3+-Mn3+
[19-26] or Fe -Fe3+ Fe2+-Fe2+ and Fe3+-Fe2+ ions [11-18]
CHAPTER 3 EXPERIMENTAL TECHNIQUES
We have prepared glasses of the xMOmiddot(100-x)[As2O3middotTeO2] xMOmiddot(100-
x)[As2O3middotPbO] şi xMOmiddot(100-x)[3B2O3middotLi2O] glass structure where MO =gt MnO or Fe2O3
with 0 lt x lt 50 mol used components of reagent grade purity MnCO3 Fe2O3 As2O3
H3BO3 PbO Li2CO3 şi TeO2 in suitable proportions to obtain the desired composition The
mixtures were melted in sintered corundum crucibles introduced in an electric furnace directly
at 1250 C and kept for 5 minutes at this temperature They were quickly cooled at room
temperature by pouring onto stainless steel plates
The structure of the samples was analyzed by means of x-ray Diffraction using powders
with a Bruker D8 Advanced diffract meter
8
The FT - IR spectra have been recorded using a Bruker Equinox 55 with a spectral range
between 4000 cm -1 and 370 cm -1 A MIR GLOBAR generator cooled with air was used The
detection was carried out with a DLATGS detector with a KBr window The spectral
resolution was about 05 cm1 The samples were prepared using KBr pellet technique
The Raman spectra were recorded on bulk samples at room temperature using an
integrated FRA 106S Raman module attached to Bruker Equinox 55 with a spectral range
from 3600 cm -1 to 70 cm -1 An NdYAG laser with an output power of 500 mW and a 1064
nm radiation was used The detection was carried out with an ultra sensitive D418-T detector
cooled with liquid nitrogen The spectral resolution was about 1 cm1
The EPR spectra were obtained at room temperature with an Adani Portable EPR
Spectrometer PS8400 in X-frequency band (94 GHz) For these measurements equal
quantities of powders from the investigated samples closed in glass tubes were used
Magnetic susceptibility measurements were performed on a Faraday type balance in the 80
- 300 K temperature range The sensitivity of the equipment was 10-7 emug
CHAPTER 4 RESULTS AND DISCUSSION REGARDING THE STUDY OF
xMOmiddot(100-x)[As2O3middotTeO2] xMOmiddot(100- x)[As2O3middotPbO] şi xMOmiddot(100-x)[3B2O3middotLi2O]
GLASS STRUCTURE WHERE MO =gt MnO or Fe2O3
In this chapter the results obtained by following the study of the structure and
properties of oxide glasses with transitional metals ions by FT- IR and Raman spectroscopies
electron paramagnetic resonance and magnetic susceptibility measurements are presented The
structural changes and magnetic properties with the manganese and iron content were
followed
41 Comparative study by FT-IR and Raman spectroscopies of xMOmiddot(100-
x)[As2O3middotTeO2] xMOmiddot(100- x)[As2O3middotPbO] şi xMOmiddot(100-x)[3B2O3middotLi2O] glasses
where MO =gt MnO or Fe2O3
411 Comparative study by FT-IR spectroscopy of As2O3middotTeO2 and
As2O3middotPbO vitreous matrices
In order to obtain new information regarding the role of the modifier in the
formation of vitreous matrices comparative studies by FT-IR spectroscopy were made
The FT-IR spectroscopy is represented in figure 41(ab) The wave length and the
structural assignments of FT ndash IR spectra of As2O3middotPbO and As2O3middotTeO2 vitreous matrices
are represented in table 41
9
400 600 800 1000 1200
Wavenumber [cm-1]
Abs
orpt
ion
[au
]
407
594
821
794
1119
As2O
3PbO
a)
a
400 600 800 1000 1200
As2O3TeO2
Abs
orpt
ion
[ua
]
Wavenumber [cm-1]
85473
3
644
1119
b)
b
Fig41 FT ndash IR spectra of vitreous matrices a As2O3middotPbO şi b As2O3middotTeO2
The FT ndash IR spectrum of As2O3middotPbO glass matrix presents five absorption bands at ~
1119 cm-1 ~ 821 cm-1 ~ 794 cm-1 ~ 594 cm-1 and ~ 407 cm-1(Fig41a)
The band from ~ 1119 cm-1 is due to totally symmetric stretching vibrations of AsO3
units [5 ndash 7] The bands from ~ 821 cm-1 and ~ 794 cm-1 are due to doubly degenerate
stretching vibrations of AsO3 structural units [5 ndash 7] The large band centered at ~ 594 cm-1 can
be due to totally symmetric bending vibrations of AsO3 structural units [5-7] The band from ~
407 cm-1 can be due to vibrations of Pb ndash O bonds from PbO4 structural groups [7]
Following As2O3TeO2 glass matrix spectrum presented in Fig 41b four bands can be
observed located at ~ 644 cm-1 ~ 733 cm-1 ~ 854 cm-1 and ~ 1119 cm-1 The band from ~ 644
cm-1 can be assigned to totally symmetric bending vibrations of AsO3 units [5-7] and also
stretching vibration mode of TeO4 tbp with bridging oxygen[11] The band from ~ 733 cm-1
can be assigned to the symmetric stretching vibration mode of Te-O bonds in TeO3 units
[15] The band from ~ 854 cm-1 can be assigned to doubly degenerate stretching vibrations of
AsO3 units [5-7] and also to the stretching vibration mode of TeO3 tp with NBO [11] The band
10
from ~ 1119 cm-1 can be assigned to totally symmetric stretching vibrations of AsO3 units [5-
7] These bands presented in As2O3TeO2 glass matrix spectrum confirm the presence of
AsO3 TeO4 tbp and TeO3 tp units in the structure of the glass matrix but due to the broadness
of the bands it can not be told for sure which one of these units is predominant
Table 41Wavenumber and the structural assignments of FT ndash IR spectra of
As2O3middotPbO and As2O3middotTeO2 vitreous matrices
~ [cm 1 ]
As2O3middotPbO As2O3middotTeO2
Attribution
~1119 cm-1
~ 1119 cm-1
Totally symmetric stretching vibrations of AsO3 units
~ 821cm-1
Doubly degenerate stretching vibrations of AsO3 structural units
~ 854 cm-1
Doubly degenerate stretching vibrations of AsO3 units Stretching vibration mode of TeO3 tp with NBO
~ 794 cm-1
Doubly degenerate stretching vibrations of AsO3 structural units
~ 733 cm-1
Symmetric stretching vibration mode of Te-O bonds in TeO3 units
~ 594 cm-1
~ 644 cm-1
Totally symmetric bending vibrations of AsO3 units
~ 407 cm-1 Vibrations of Pb ndash O bonds from PbO4 structural groups
412 Comparative study by FT-IR spectroscopy of
xMOmiddot(100- x)[As2O3middotPbO] vitreous systems where MO =gt MnO or Fe2O3
The infrared absorption spectra obtained for xMOmiddot(1-x)[As2O3middotPbO] glass system
where MO =gt MnO or Fe2O3 with 0 le x le 50 mol are presented in figure 42-3 and their
structural assignments are summarized in table 41
The spectra were discussed on the basis of the method given by Tarte [3] and Condrate
[4] by comparing the experimental data of glasses with those of related crystalline compounds
The characteristic absorption bands for crystalline As2O3 [5-8] PbO [79] and characteristic
bands for Fe2O3 [1819 ] were used as a reference point in the results discussion
The FT ndash IR spectra of the investigated glasses suggest a structure formed of AsO3 and
PbO4 structural units where As2O3 plays the role of the glass former and PbO plays the role of
the glass modifier The evolution of the spectra with the addition and the increasing of the
MnO content suggest that the manganese ions break up a part of As ndash O ndash As Pb ndash O ndash Pb and
probably of As ndash O ndash Pb bonds The addition of MnO in the As2O3middotPbO glass matrix is leading
to a disordering of the glasses structure with the increasing of the MnO content
The evolution of the absorption bands for FT ndash IR spectrum of xFe2O3middot(1-x)
[As2O3middotPbO] glasses are determined by the addition of Fe2O3 content It can be observed to
11
shift the bands assigned As ndash O ndash As vibrations from AsO3 units due to changing to length As
ndash O ndash As bonds and interne angles of AsO3 units disappears PbO4 units and appears FeO6
units The addition of Fe2O3 in the As2O3middotPbO glass matrix determined a disordering of the
glasses structure with the increasing of the Fe2O3 content
400 600 800 1000 1200
610
813
449
1093
423
449
616
760 848
821
794
594
20A
bsor
ptio
n [a
u]
Wavenumber [cm-1]
05
0
35
10
35
50
1
MnO
407
1119
693
Fig 42 FT ndash IR spectra of xMnOmiddot(100- x)[As2O3middotPbO] glasses
400 600 800 1000 1200
616
462
811
407
594
Abs
orpt
ion
[au
]
Wavenumber [cm -1]
05
20
0
35
10
35
50
1
Fe2O3
821
79469
3
1119
1084
610
Fig43 FT ndash IR spectra of xFe2O3middot(100- x)[As2O3middotPbO] glasses
12
413 Comparative study by FT-IR spectroscopy of
xMOmiddot(100-x)[As2O3middotTeO2] vitreous systems where MO =gt MnO or Fe2O
The infrared absorption spectra obtained for xMOmiddot(1-x)[As2O3middotTeO2] glass system
where MO =gt MnO or Fe2O3 with 0 le x le 50 mol are presented in figure 44 -5 and their
structural assignments are summarized in table 41[1617] The characteristic absorption bands
for crystalline As2O3 [5-8] PbO [79] TeO2 [810-15] MnO2 and Mn3O4 [9] and characteristic
bands for Fe2O3 [1819 ] were used as a reference point in the results discussion
Fig 44 FT ndash IR spectra of xMnOmiddot(100- x)[As2O3middotTeO2] glasses
Fig45 FT ndash IR spectra of xFe2O3middot(100- x)[As2O3middotTeO2] glasses
400 600 800 1000 1200
565
422 690 830
05
Abs
optio
n [a
u]
Wavenumber [cm-1]
0
3
5
35 50
1
MnO
854 733 644
1119
10 20
400 600 800 1000 1200
462650
812
713
561
05
20
Wavenumber [cm-1]
Abs
orpt
ion
[au
]]
0
3 5
10
35 50
1
Fe2O3
854 733
644
1119
13
This behavior of the studied glasses with the addition and increasing of MnO content
suggests that the structure observed in the glass matrix is conserving up to 5 mol MnO
where the structure takes another form From a structure dominated by AsO3 TeO4 tbp and
TeO3 tp units the structure became dominated by TeO4 tbp and MnO2 units and in a small
measure of AsO3 and TeO3 tp units For higher concentrations it can not be specified exactly
which of the last two structural units have the biggest proportion in these glasses From FT-IR
absorption spectra of the investigated glass system it can be observed that the addition and
increasing of manganese ions concluded the contraction of As-O-As bonds from totally
symmetric stretching vibrations of AsO3 units for x ge10 mol there can be an increase in
number of As-O-As bonds from AsO3 units orand a length these linkage to doubly degenerate
stretching vibrations of AsO3 units and a stretching vibration mode of TeO3 tp with NBO It
can be remarked from the FT-IR absorption spectra the gradual transformation of symmetric
stretching vibration mode of Te-O bonds from TeO3 units in TeO4 (tbp) units and the presence
of MnO2 units Once with the addition of iron ions the xFe2O3middot(100- x)[As2O3middotTeO2]
glasses behave like xMnOmiddot(100-x)[As2O3middotTeO2] glasses but in this system the
appearance of FeO6 units can be seen
414 Comparative study by FT-IR spectroscopy of
xMnOmiddot(100- x)[As2O3middotBO] vitreous systems were BO =gt TeO2 or PbO
The infrared absorption spectra obtained for xMnOmiddot(100- x)[As2O3middotBO] vitreous
systems where BO =gt TeO2 or PbO with 0 le x le 50 mol MnO are presented in figure
42 and 44 Following the infrared absorption spectra it can be observed that for
xMnOmiddot(100- x)[As2O3middot PbO] glass system the most disordered structure to exist for 0
le x le 5 mol MnO and to xMnOmiddot(100-x)[As2O3middot TeO2] glass system for 1 le x le 5 mol
MnO For x ge 5 mol MnO manganese ions break up a part of As ndash O ndash As Pb ndash O ndash Pb
and probably of As ndash O ndash Pb bonds to favor the increase in number of PbO4 units and
appearance of MnO2 units For x ge 10 mol MnO observed comparatively in both system
glasses the addition of manganese ions suggests for the first system a modification in linkage
characteristic units and for the second system an improvement for structural units of As2O3middot
TeO2 vitreous matrice also linkage characteristic units
415 Comparative study by FT-IR spectroscopy of
xFe2O3middot(100-x)[As2O3middotBO] vitreous systems where BO =gt TeO2 or PbO
The infrared absorption spectra obtained for xFe2O3middot(100- x)[As2O3middotBO] vitreous
systems where BO =gt TeO2 or PbO with 0 le x le 50 mol Fe2O3 are presented in figure
43 and 45
14
The evolution of the spectra with the addition and the increasing of the Fe2O3 content
suggest that the iron ions break up a part of As ndash O ndash As Pb ndash O ndash Pb and probably of As ndash O
ndash Pb bonds It can be observed a shift in the bands assigned As ndash O ndash As vibrations from AsO3
units due to changing to length As ndash O ndash As bonds and interne angles of AsO3 units the PbO4
units disappear and FeO6 units appear For x ge 5 mol Fe2O3 observed comparatively in
both system glasses the addition of iron ions suggests for the first system a modification in
linkage characteristic units of As2O3middotPbO and for the second system an improvement for
structural units of As2O3middot TeO2 vitreous matrice also linkage characteristic units appearance
of FeO6 units in both system
416 Comparative study by Raman spectroscopy of
As2O3middotTeO2 and As2O3middotPbO vitreous matrices
In order to obtain new information regarding the role of the modifier in the
formation of vitreous matrices there were made comparative studies by Raman
spectroscopy The Raman spectroscopy are presented in figure 46(ab) The wave
length and the structural assignments of Raman spectra of As2O3middotPbO şi As2O3middotTeO2 vitreous
matrices are presented in table 42
Table 42Wavenumber and the structural assignements of Raman spectra
of As2O3middotPbO and As2O3middotTeO2 vitreous matrices
~ [cm 1 ]
As2O3middotPbO As2O3middotTeO2
Attribution
~826 cm-1
~ 816 cm-1
Stretching vibrations of As-O-As
~ 752 cm-1
Vibrations of the continuous TeO4 (tbp) network
~ 627 cm-1
Vibrations As ndash O ndash As bonds from As2O units
~ 580 cm-1
Stretching vibrations of As-O-As
~ 525 cm-1
Vibrations O-As-O bonds from AsO3 units
~ 438cm-1
Symmetric bending vibrations of Te ndash O ndash Te vertex linkages between different TeO4 (tbp) TeO3+1 polyhedra Stretching vibrations of As-O-As of AsO3 units
~ 345 cm-1
Bending vibrations of As ndash O ndash As from As2O units
15
200 400 600 800 1000
As2O3PbO
Ram
an In
tens
ity [a
u]
LWavenumber [cm-1]
345
826
525
627a)
a
200 400 600 800 1000
816
752
580 R
aman
Inte
nsity
[au
]
Wavenumber [cm-1]
As2O3TeO2
438
b)
b
Fig46 Raman spectra of vitreous matrices a As2O3middotPbO şi b As2O3middotTeO2
The Raman spectrum of As2O3middotPbO glass matrix presents four bands at 826 cm-1
627 cm-1 525 cm-1 and 345 cm-1 The band from 826 cm-1 can be assigned to As ndash O ndash
As stretching vibrations [20] The band centered at 627 cm-1 can be assigned to vibrations As
ndash O ndash As bonds from As2O units the band from 525 cm-1 are assigned vibrations O-As-O
bonds from AsO3 units [21] The band of 345 cm-1 are attributed to As ndash O ndash As bending
vibrations from As2O units[2021]
The Raman spectrum of As2O3middot TeO2 glass matrix presents four bands at 816 cm-1
752 cm-1 580 cm-1 and 438 cm-1 The band from 816 cm-1 can be assigned to As ndash O ndash
As stretching vibrations [20] The band centered at 752 cm-1 can be assigned to vibrations of
the continuous TeO4 (tbp) network [22] The band of 580 cm-1 are attributed to As ndash O ndash As
stretching vibrations [12] The band centered at 438 cm-1 can be assigned symmetric bending
vibrations of Te ndash O ndash Te vertex linkages between different TeO4 (tbp) TeO3+1 polyhedra and
As ndash O ndash As stretching vibrations of AsO3 units
16
417 Study by Raman spectroscopy of xMOmiddot(100- x)[As2O3middotPbO]
vitreous systems where MO =gt MnO or Fe2O3
The Raman spectra obtained for xMOmiddot(100- x)[As2O3middotPbO] vitreous systems where
MO =gt MnO or Fe2O3 with 0 le x le 50 mol are presented in figure 47-8 and their
structural assignments are summarized in table 42
200 400 600 800 1000
368
833
345
1
3
Lungimea de unda [cm-1]
Inte
nsita
te R
aman
[ua
]
20
05
0
5
10
35
50
MnO
826
525
627
Fig 47 Raman spectra of xMnOmiddot(100- x)[As2O3middotPbO] glasses
The addition of MnO in the glass matrix determined an order degree of the vitreous
matrix The intensity of the bands attributed vibrations As ndash O ndash As bonds from As2O units
and bending vibrations of As ndash O ndash As from As2O units shift to a higher wave length that
suggests an increase in the As2O units comparative to AsO3 units
To the band from 826 cm-1 the addition of manganese ions in the glass matrix
determine for x = 05 mol an decreasing in intensity whereupon increasing for higher
concentrations The intensity of bands centered at 627 cm-1 and 525 cm-1 for x = 05
mol MnO decrease and disappear for x = 1 mol MnO The band of 345 cm-1 slowly
increases with the addition of manganese ions
To the band from 826 cm-1 the addition of iron ions in the glass matrix determines
for x = 05 mol an increase in intensity a gradual decrease and disappearance for x = 35
mol Fe2O3 of the bands observed for the glass matrix For higher concentrations of
manganese these bands gradually decrease The intensity of bands centered at 627 cm-1 and
525 cm-1 for x = 05 mol Fe2O3 increase and shift to 612 cm-1 and 501 cm-1 whereas
17
they gradually decrease and disappear for x = 10 mol Fe2O3 The band of 345 cm-1
decreases with the addition of iron ions and disappears for x = 20 mol Fe2O3
200 400 600 800 1000
3
612
501
Wavenumber [cm-1]
Ram
an In
tens
ity [a
u]
05
20
0
5
10
3550
1
Fe2O3
345
826
525
627
Fig 48 Raman spectra of xFe2O3middot(100- x)[As2O3middotPbO] glasses
With the increase of iron ions content in the As2O3middotPbO glass matrix the number of
these structural units decreases due to the increasing of the disorder in the studied glasses
418 Study by Raman spectroscopy of xMOmiddot(100-x)[As2O3middotTeO2]
vitreous systems were MO =gt MnO or Fe2O3
The Raman spectra obtained for xMOmiddot(100- x)[As2O3middot TeO2] vitreous systems
where MO =gt MnO or Fe2O3 with 0 le x le 50 mol are presented in figure 49-10 and their
structural assignments are summarized in table 42
The Raman spectrum of the glass matrix suggests a structure formed from TeO4 (tbp)
and TeO3 (tp) units where the presence of As ndash O ndash As bonds can not be excluded The
addition of manganese ions is leading to a modification of the structure proposed by the
spectrum of the glass matrix Then with the increasing of manganese content the intensity of
these bands is increasing showing that the manganese content favorises the formation of TeO4
(tbp) and TeO3 (tp) units
18
200 400 600 800 1000
783
850
768
416
816
752
Wavenumber [cm -1]
Ram
an In
tens
ity [a
u]
13
20
05
0
5
10
35
50
MnO
438
580
660
Fig 49 Raman spectra of xMnOmiddot(100- x)[As2O3middot TeO2] glasses
200 400 600 800 1000
226
294
408
673 751
5
W avenumber [cm -1]
Ram
an In
tens
ity [a
u]
05
20
0
3
10
35
50
1
Fe2O
3
816
752
438
580
Fig 410 Raman spectra of xFe2O3middot(100- x)[As2O3 TeO2] glasses
The Raman spectra of xFe2O3middot(100- x)[As2O3 TeO2] glasses present a significant
advance to the TeO4 (tbp) TeO3+1 polyhedra and AsO3 units represented in Raman spectrum
by the ~ 438 cm-1 band comparative with the modifications determined by the addition of
manganese ions in vitreous matrix For high concentrations of iron ions in xFe2O3middot(100-
x)[As2O3 TeO2] system of glasses the number of As-O-As linkages appear in Raman
spectrum due to stretching vibrations of As-O-As and vibrations of the continuous TeO4 (tbp)
network show a significant decrease
19
419 Comparative study by Raman spectroscopy of xMnOmiddot(100- x)[As2O3middotBO]
vitreous systems were BO =gt TeO2 or PbO
The addition of MnO to xMnOmiddot(100- x)[As2O3middotPbO] glass system do not break As
ndash O ndash As bonds into characteristic units and contribute to their prominence The addition of
manganese ions to xMnOmiddot(100- x)[As2O3middot TeO2] glass system for x=50mol MnO
determined the splitting up of a part of As ndash O ndash As Te-O-Te and the appearance of the
TeO4 (tbp) units against the loss of continuous TeO4 (tbp) network was observed
4110 Comparative study by Raman spectroscopy of xFe2O3middot(100- x)[As2O3middotBO]
vitreous systems where BO =gt TeO2 or PbO
With the increasing of iron ions content in the As2O3middotPbO glass matrix the number of
these structural units decreased due to the increase of the disorder in the studied glasses (x gt 20
mol ) and x = 50 mol Fe2O3 for xFe2O3middot(100- x)[As2O3middotTeO2] when iron ions
brought the structural units existing in glass matrices and favoured the appearace of
new bands due to bending vibrations of As ndash O ndash As
42 Comparative study by FT-IR and Raman spectroscopies of
xMOmiddot(100-x)[3B2O3middotLi2O] glasses where MO =gt MnO or Fe2O3
421 Study by FT-IR spectroscopy of xMOmiddot(100-x)[3B2O3middotLi2O] glasses
where MO =gt MnO or Fe2O3
The infrared absorption spectra obtained for xMOmiddot(1-x)[3B2O3middotLi2O] glass system
where MO =gt MnO or Fe2O3 with 0 le x le 50 mol are presented in figure 411-13 and their
structural assignments are summarized in table 43
500 1000 1500
3B2O3Li2O
Wavenumber [cm-1]
Abs
orpt
ion
[au
]
490
1400
1230
1061
698
614
460 78
6
Fig 411 FT ndash IR spectra of vitreous matrix 3B2O3middotLi2O
20
Following the infrared absorption spectra obtained for 3B2O3middotLi2O vitreous matrix
observed on eight bands ~ 1400 cm-1 ~ 1230 cm-1 ~ 1061 cm-1 ~ 786 cm-1 ~ 698 cm-
1 ~ 614 cm-1 ~ 490 cm-1 şi ~ 460 cm-1 The band at ~ 1400 cm-1 is assigned to
asymmetric stretching vibrations from BOslash3 şi BOslash2O- groups (Oslash represent oxygen atom
bridging two boron atoms) The band at ~ 1230 cm-1 is attributed to asymmetric stretching
vibrations of B ndash O bonds from triangular ortoborate BO 33 groups [23-26]
400 600 800 1000 1200 1400 1600
0
3
5
10
20
35
50
1
Wavenumber [cm-1]
Abs
orpt
ion
[ua
]
05
MnO
490
1400
1230
1061
698
614
460 78
6
Fig 412 FT ndash IR spectra of xMnOmiddot(100-x)[3B2O3middotLi2O] glasses
400 600 800 1000 1200 1400 1600
469
Wavenumber [cm-1]
Abs
orpt
ion
[ua
]
0
3
5
10
20
35
50
1
05
Fe2O3
490
1400
1230
1061
698
614
460 78
6
Fig 413 FT ndash IR spectra of x Fe2O3middot(100-x)[3B2O3middotLi2O] glasses
21
Table 43Wavenumber and the structural assignments of FT ndash IR and Raman
spectra of 3B2O3middotLi2O vitreous matrix
~ [cm 1 ] Attribution
FT ndash IR Raman FT ndash IR Raman
~ 1400 cm-1
~ 1400 cm-1
Asymmetric stretching
vibrations from BOslash3 şi BOslash2O-
groups
BOslash2O- triangles linked to
other borate triangular units
~ 1230 cm-1
Asymmetric stretching
vibrations of B ndash O bonds from
triangular ortoborate
BO 33 groups
~ 1061 cm-1
~ 1074 cm-1
Stretching vibrations of B ndash Oslash
bonds in -4BOslash tetrahedra from
tri- tetra- and penta-borate
groups
Diborate groups
~ 902 cm-1
Vibrations of orthoborate
groups
~ 786 cm-1
~ 791 cm-1
Bending vibrations of O3B ndash O
ndash BO4 bonds
Vibrations of rings with six
member to one or two BO4
tetrahedral from tri- tetra ndash
and penta ndash borate units
~ 698 cm-1
Bending vibrations of B-O-B
bonds from pentaborate groups
~ 614cm-1 Bending vibrations of O ndash B ndash O
bonds
~ 490cm-1 ~ 471cm-1 Bending vibrations of B-O-B
bonds
Isolated diborate groups
~ 460cm-1 Bending vibrations of O ndash B ndash O
bonds
22
The band at ~ 1061 cm-1 is assigned to stretching vibrations of B ndash Oslash bonds in -4BOslash
tetrahedra from tri- tetra- and penta-borate groups and the band at ~ 786 cm-1 is assigned
to bending vibrations of O3B ndash O ndash BO4 bonds The band at ~ 698 cm-1 is attributed to
Bending vibrations of B-O-B bonds from pentaborate groups The bands at ~ 614 cm-1 and
~ 460 cm-1 are assigned to bending vibrations of O ndash B ndash O bonds and the band at ~ 490 cm-
1 is assigned to bending vibrations of B-O-B bonds
From FT-IR spectra it can be concluded that the addition of manganese or iron ions in
vitreous matrices leads to the increase of the disorder degree
Also the structural changes that appeared in 3B2O3middotLi2O vitreous matrix with an
addition MnO or Fe2O3 content can be studied Ar=A4A3 ratio(A4 - relative number of -4BOslash tetrahedral borate units A3 - relative number of triangular (BOslash3 and BOslash2O-) units
0 10 20 30 40 50
010
015
020
Ar
x [mol]
MnO Fe2O3
Fig 414 The evolution of Ar ratio with the MnO or Fe2O3 content of
xMnOmiddot(100-x)[3B2O3middotLi2O] şi xFe2O3middot(100-x)[3B2O3middotLi2O] The evolution of the value of this ratio also allows a visualization of the effects
determined by the presence of the manganese or iron ions in the matrix The value Arltlt 1
indicated that BO3 is dominant related to BO4
422 Study by Raman spectroscopy of xMOmiddot(100-x)[3B2O3middotLi2O] glasses
where MO =gt MnO or Fe2O3
The Raman spectra obtained for xMOmiddot(1-x)[3B2O3middotLi2O] glass system were MO =gt
MnO or Fe2O3 with 0 le x le 50 mol are presented in figure 414-16 and their structural
assignments are summarized in table 43
Studying the Raman spectra of xMOmiddot(1-x)[3B2O3middotLi2O] glass system where MO =gt
MnO or Fe2O3 it has been observed that the absorption bands presented in vitreous matrix
gradually decreased with an increase in the manganese or iron content in both glasses system
which suggested an increase of the disorder in these vitreous systems
23
1000 2000 3000
B2O3Li2O
Wavenumber [cm-1]
Ram
an In
tens
ity [a
u]
1430
107490
279
1471
Fig 415 Raman spectra of vitreous matrix 3B2O3middotLi2O
500 1000 1500 2000 2500 3000
1430
107490
2791
0
Wavenumber [cm-1]
Ram
an In
tens
ity [a
u]
1
3
20
05
5
10
35
50
MnO
471
Fig 416 Raman spectra of xMnOmiddot(100-x)[3B2O3middotLi2O] glasses
400 600 800 1000 1200 1400 1600
Wavenumber [cm-1]
Ram
an In
tens
ity [a
u]
0
1
3
20
05
5
10
35
50
Fe2O3
1430
1074
90279
1
471
Fig 417 Raman spectra of x Fe2O3middot(100-x)[3B2O3middotLi2O] glasses
24
43 Comparative study by electron paramagnetic resonance (EPR) and magnetic
susceptibility measurements of xMOmiddot(100-x)[As2O3middotTeO2] xMOmiddot(100-x)
[As2O3middotPbO] and xMOmiddot(100-x)[3B2O3middotLi2O] glasses where MO =gt MnO or Fe2O3
431 Comparative study by electron paramagnetic resonance (EPR) of
xMnOmiddot(100-x)[As2O3middotBO] where BO =gt TeO2 or PbO
and xMnOmiddot(100-x) [3B2O3middotLi2O] glasses
In order to obtain more information regarding the behavior of manganese ions in
different vitreous matrices [3031] xMnOmiddot(100-x)[As2O3middotBO] where BO =gt TeO2 or PbO
and xMnOmiddot(100-x) [3B2O3middotLi2O] glasses were investigated by EPR spectroscopy on a large
compositional range with 0 le x le 50 mol The EPR spectra of Mn2+ for xMnOmiddot(100-
x)[As2O3middotPbO] (S1) xMnOmiddot(100-x)[As2O3middotTeO2] (S3) and xMnOmiddot(100-x)[3B2O3middotLi2O]
(S5) are presented in figure 418-20 These spectra present two absorption lines centered at gef
43 and gef 20 in all systems
The absorption line centered at gef 43 and is due to isolated Mn2+ ions [32] The
absorption line centered at gef 20 may be attributed to Mn2+ species interacting by magnetic
coupling[33] dipolar and or super exchange the last ones forming magnetic clusters [32]
The evolution of the spectra is easier to follow considering the dependence of
concentration on the EPR parameters the line - intensity (obtained as an integral of the area
under the corresponding EPR signal) J and the line - width ΔB The evolution of J and AB
reflects the structural transformations which appear in the glass matrices due to the increase of
manganese ions content
The intensity and the line - width of the resonance line from gef 43 for all
investigated systems is represented in figure 421(ab)
The intensity of the resonance line from gef 43 for all investigated glass systems
decreases due to the decrease of the isolated manganese ions numbers The line - width from
gef 43 for (S1) and (S3) systems decreases due to decrease of Mn2+ number and to the
structural disorder in glasses with the increase of MnO content For (S5) glass system the line
- width of the resonance line there is an increase in all compositional domains
The intensity of the resonance line from gef 20 can be observed as increasing up to
x=14 mol for (S1) system up to x=8mol for (S3) system and 20 mol for (S5)
system The line - width of the resonance line from gef 20 for (S1) and (S3) systems
increases up to 3 mol and 5mol for (S5) due to Mn2+ species interacting by magnetic
coupling dipole- dipole as the main broadening mechanism Over this concentration line ndash the
width of the resonance line from gef 20 is straight and it can be assumed that the
manganese ions begin to manifest super exchange magnetic interactions
25
1000 2000 3000 4000 5000
Firs
t der
ivat
ive
of a
bsor
ptio
n [u
a]
05
1
3
5
10
20
35
50
x [mol Mn2O3]amplif
B [G]
10
200
40
80
400
5
1
1
Fig 418 The EPR spectra of Mn2+ for xMnOmiddot(100-x)[As2O3middotPbO] (S1)
glass system
1000 2000 3000 4000 5000
Firs
t der
ivat
ive
of a
bsor
ptio
n [u
a]
x [mol MnO]
051
3
5
10
20
35
50
9
500
400
50
100
4
1
amplif
B [G]
1
Fig 419 The EPR spectra of Mn2+ for xMnOmiddot(100-x)[As2O3middotTeO2] (S3)
glass system
26
1000 2000 3000 4000 5000
501
B [G]
Firs
t der
ivat
ive
of a
bsor
ptio
n [u
a]
1
4
9
10
30
60
100
amplif
05
1
3
5
10
20
35
x [mol MnO]
Fe3+
Fig 420 The EPR spectra of Mn2+ for xMnOmiddot(100-x)[3B2O3middotLi2O] (S5)
glass system
0 2 4 6 8 10 12 14 16 18 20 22
x [mol]
J [ u
a]
S1 S3 S5
-2 0 2 4 6 8 10 12 14 16 18 20 22
50
100
150
200
250
300
S1 S3 S5
x [mol]
B
[G]
a b
Fig 421 The dependence on MnO content of the intensity (a) and width(b) of resonance
line at gef 43 for xMnOmiddot(100-x)[As2O3middotPbO] (S1) xMnOmiddot(100-x)[As2O3middotTeO2] (S3) şi
xMnOmiddot(100-x)[3B2O3middotLi2O] (S5) system glasses
27
0 10 20 30 40 50
x [mol]
J [ u
a]
S1 S3 S5
0 10 20 30 40 50
400
500
600
700
800
900
S1 S3 S5
x [mol]
B[G
]
a b
Fig 422 The dependence on MnO content of the intensity (a) and width b) of resonance
line at gef 20 for xMnOmiddot(100-x)[As2O3middotPbO] (S1) xMnOmiddot(100-x)[As2O3middotTeO2] (S3) and
xMnOmiddot(100-x)[3B2O3middotLi2O] (S5) system glasses
Following figure 418-20 it can be observed that (S1) and (S3) have had a similar
evolution but (S5) system presented for 05 le x le 5 mol (fig420) has a hyperfine
sextet[33] at gef 20due to Mn2+ isolated ions
432 Comparative study by magnetic susceptibility measurements of
xMnOmiddot(100-x)[As2O3middotBO] where BO =gt TeO2 or PbO and
xMnOmiddot(100-x)[3B2O3middotLi2O] glasses
The magnetic susceptibility data are in good agreement with the EPR result The
magnetic behavior of the glasses from xMnOmiddot(100-x)[As2O3middotBO] where BO =gt TeO2 (S3)
or PbO (S1) and xMnOmiddot(100-x)[3B2O3middotLi2O] (S5) glasses for 3 le x le 50 mol MnO are
presented in figure 423 - 25
For (S1) and (S3) system glasses up to x 3 mol and x 5 mol (S5) glass
system the temperature dependence of the reciprocal magnetic susceptibility obeys a Curie
law In this concentration range the manganese ions are predominantly isolated orand
participate in dipole-dipole interractions At higher concentrations the reciprocal magnetic
susceptibility obeys a Curie-Weiss law with negative paramagnetic Curie temperature (p)
characteristic to antiferromagnetic coupled ions by means of super exchange interractions(fig
426) This behavior of manganese ions is confirmed by the shape of the EPR spectra
28
100 150 200 250
2
4
6
8
10
12
14
16
18
20
22
T [K]
[
emu
mol
]-1
3 mol 5 mol 10 mol 20 mol 35 mol 50 mol
Fig423 The temperature dependence of -1 for xMnOmiddot(100-x)[As2O3middotPbO]
(S1) 3 le x le 50 mol
50 100 150 200 2500
2
4
6
8
10
12
14
16
18
20
22
3 mol 5 mol 10 mol 20 mol 35 mol 50 mol
T [K]
[
emu
mol
]-1
Fig424 The temperature dependence of -1 for xMnOmiddot(100-x)[ As2O3middotTeO2]
(S1) 3 le x le 50 mol
100 150 200 250
2
4
6
8
10
12
14
16
18
20
22
[em
u m
ol]-1
T [K]
3 mol 5 mol 10 mol 20 mol 35 mol 50 mol
Fig425 The temperature dependence of -1 for xMnOmiddot(100-x)[3B2O3middotLi2O]
(S5) 3 le x le 50 mol
29
0 10 20 30 40 50
0
20
40
60
80
100
x [mol]
-p [K
]
(S1) (S3) (S5)
Fig426Concentration dependence of (p) for sistemele xMnOmiddot(100-x)[As2O3middotPbO]
(S1) xMnOmiddot(100-x)[As2O3middotTeO2] (S3) şi xMnOmiddot(100-x)[3B2O3middotLi2O] (S5)
Using the representation 1 =f(T) the molar Curie constants CM the effective
magnetic moments and molar fraction of Mn2+(x1) şi Mn3+(x2) ions were calculated and
represented in tables 44 -6
Tabel 44 Molar Curie constants effective magnetic moments and molar fraction of Mn2+(x1) şi Mn3+(x2) ions in xMnOmiddot(100-x)[As2O3middotPbO] (S1) glasses
x
[mol MnO2] CMtimes102
[emu mol] ef
[microB] x1
[mol Mn2+O2] x2
[mol Mn3+O2] 3 1272 582 268 032 5 1979 562 343 157 10 3777 549 555 445 20 6688 517 492 1508 35 12239 502 377 3123 50 15427 496 268 4732
Tabel 45 Molar Curie constants effective magnetic moments and molar fraction of Mn2+(x1) şi Mn3+(x2) ions in xMnOmiddot(100-x)[As2O3middotTeO2] (S3)glasses
x
[mol MnO2] CMtimes102
[emu mol] ef
[microB] x1
[mol Mn2+O2] x2
[mol Mn3+O2] 3 1297 588 287 013 5 1938 556 312 188 10 3804 551 575 425 20 6766 52 549 1451 35 11148 504 441 3059 50 15528 498 358 4642
30
Tabel 46 Molar Curie constants effective magnetic moments and molar fraction of Mn2+(x1) şi Mn3+(x2) ions in xMnOmiddot(100-x)[3B2O3middotLi2O] (S5) glasses
x
[mol MnO2] CMtimes102
[emu mol] ef
[microB] x1
[mol Mn2+O2] x2
[mol Mn3+O2] 3 127 581 265 035 5 1919 554 303 197 10 3681 542 486 514 20 7215 519 53 147 35 1121 506 505 2995 50 15898 501 493 4507
433 Comparative study by electron paramagnetic resonance (EPR) of
xFe2O3middot(100-x)[As2O3middotBO] where BO =gt TeO2 or PbO and
x Fe2O3middot(100-x) [3B2O3middotLi2O] glasses
In order to obtain more information regarding the behavior of iron ions in
xFe2O3middot(100-x)[As2O3middotBO] where BO =gt TeO2 (S4) or PbO (S2) şi xFe2O3middot(100-
x)[3B2O3middotLi2O] glasses were investigated by EPR spectroscopy on a large compositional
range with 05 le x le 35 mol Fe2O3 The EPR spectra of Fe3+ in xFe2O3middot(100-
x)[As2O3middotPbO] (S2) xFe2O3middot(100-x)[As2O3middotTeO2] (S4) and xFe2O3middot(1-x)[3B2O3middotLi2O]
(S6) are presented in figure 427-29 These spectra present two absorption lines centered at
gef 43 and gef 20 up to x le 35mol Fe2O3 systems studied
The absorption line centered at gef 43 is due to isolated Fe3+ ions [34-36] The
absorption line centered at gef 20 may be attributed to Fe3+ species interacting by magnetic
coupling dipolar and or super exchange the last ones forming magnetic clusters [37-41]
The evolution of the spectra is easier to follow considering the dependence of
concentration on the EPR parameters the line - intensity (obtained as an integral of the area
under the corresponding EPR signal) J and the line - width ΔB The evolution of J and AB
reflects the structural transformations which appear in the glass matrices due to the increasing
of iron ions content
The intensity and the line - width of the resonance line from gef 43 for all
investigated systems is represented in figure 430 (a b) The intensity of the resonance line
from gef 43 increases for (S2) and (S4) up to 3 mol and up to 5 mol for (S6) then
decreases for all systems investigated A line broadening up to 3 mol from gef 43 for
these systems can be observed due to increasing of Fe3+ isolated number of ions
31
1000 2000 3000 4000 5000
40
Firs
t der
ivat
ive
of a
bsor
ptio
n [u
a]
B [G]
x [mol Fe2O3]
05
1
3
5
1020
35 2
40
20
10
10
10
amplif
Fig427 The EPR spectra of Fe3+ for xFe2O3middot(100-x)[As2O3middotPbO] (S2)
glass system
1000 2000 3000 4000 5000
100
B [G]
Firs
t der
ivat
ive
of a
bsor
ptio
n [u
a]
10080
20
50
20
20
3
05
1
5
102035
x [mol Fe2O3] amplif
Fig428 The EPR spectra of Fe3+ for xFe2O3middot(100-x)[As2O3middotTeO2] (S4)
glass system
32
1000 2000 3000 4000 5000
Firs
t der
ivat
ive
of a
bsor
ptio
n [u
a]
B [G]
3
05
1
5
10
20
35
x [mol Fe2O3]
30
50
20
20
10
30
30
amplif
Fig429 The EPR spectra of Fe3+ for xFe2O3middot(100-x)[3B2O3middotLi2O] (S6)
glass system
The intensity and the line - width of the resonance line from gef 43 for all
investigated systems is represented in figure 430 (a b)The resonance line from gef 20 is
attributed to Fe3+ ions that interact by magnetic coupling dipolar orand super exchange
interractions can be observed in all compositional domains
The intensity of the resonance line from gef 20 can be observed as increasing up to
x=35 mol for (S2) and (S6) system and 10 mol for (S4) system with increased iron
ions content The line - width of the resonance line from gef 20 increased up to 10mol
for (S2) system and up to 3 mol for (S4) and 5mol for (S6) due to Fe3+species
interacting by magnetic coupling dipole-dipole Above this concentration line - width of the
resonance line from gef 20 can be attributed to dipolar and super exchange magnetic
interactions The ΔB = f(x) dependence reflects the competion between the broadening
mechanism (dipole ndash dipole interactions the interactions between ions in diferent
valence state and structural disorder) and the narrowing ones (super exchange
interactions)
33
0 5 10 15 20 25 30 35 40
x [mol]
J [ u
a]
S2 S4 S6
a)
0 5 10 15 20 25 30 35 4040
60
80
100
120
140
160
180
200
220 S2 S4 S6
B[G
]
x [mol]
a b
Fig 430 The dependence on Fe2O3 content of the intensity (a) and width (b) of
resonance line at gef 43 for xFe2O3middot(100-x)[As2O3middotPbO] (S2)
xFe2O3middot(100-x)[As2O3middotTeO2] (S4) and xFe2O3middot(100-x)[3B2O3middotLi2O] (S6) glasses
0 5 10 15 20 25 30 35 40
x [mol]
J [ u
a]
S2 S4 S6
a)
0 5 10 15 20 25 30 35 40
200
400
600
800
1000
1200
1400
1600
x [mol]
B
[G] S2
S4 S6
a b
Fig 431 The dependence on Fe2O3 content of the intensity (a) and width (b) of
resonance line at gef 20 for xFe2O3middot(100-x)[As2O3middotPbO] (S2)
xFe2O3middot(100-x)[As2O3middotTeO2] (S4) and xFe2O3middot(100-x)[3B2O3middotLi2O] (S6) glasses
34
434 Comparative study by magnetic susceptibility measurements of
xFe2O3middot(100-x)[As2O3middotBO] where BO =gt TeO2 or PbO and
xFe2O3middot(100-x) [3B2O3middotLi2O] glasses
The magnetic susceptibility data are in good agreement with the EPR result The magnetic
behavior of the glasses xFe2O3middot(100-x)[As2O3middotPbO] (S2) xFe2O3middot(100-x)[As2O3middotTeO2]
(S4) and xFe2O3middot(100-x)[3B2O3middotLi2O] (S6) for 3 x 50 mol Fe2O3 are presented in
figure 432 - 34
For (S2) glass systems up to x 10 mol x 3 mol (S5) glass systems and x 5
mol (S6) glass systems the temperature dependence of the reciprocal magnetic susceptibility
obeys a Curie law In this concentration range the iron ions are predominantly isolated orand
participate in dipole-dipole interactions At higher concentrations the reciprocal magnetic
susceptibility obeys a Curie-Weiss law with negative paramagnetic Curie temperature (p)
characteristic to antiferromagnetic coupled ions by means of super exchange interactions(fig
435) This behavior of iron ions is confirmed by the shape of the EPR spectra
80 100 120 140 160 180 200 220 240 260 2800
1
2
3
4
5
6
7
8
9
10
11
[
emu
mol
]-1
T [K]
3 mol 5 mol 10 mol 20 mol 35 mol 50 mol
Fig432 The temperature dependence of -1 for xFe2O3middot(100-x)[As2O3middotPbO] (S2)
3 x 50 mol
35
80 100 120 140 160 180 200 220 240 260 2800
1
2
3
4
5
6
7
8
9
10
T [K]
[
emu
mol
]-1
3 mol 5 mol 10 mol 20 mol 35 mol 50 mol
Fig433 The temperature dependence of -1 for xFe2O3middot(100-x)[As2O3middotTeO2] (S4)
3 x 50 mol
80 100 120 140 160 180 200 220 240 260 2800
1
2
3
4
5
6
7
8
9
10
11
3 mol 5 mol 10 mol 20 mol 35 mol 50 mol
T [K]
[
emu
mol
]-1
Fig434 The temperature dependence of -1 for xFe2O3middot(100-x)[3B2O3middotLi2O] (S6)
3 x 50 mol
36
0 10 20 30 40 50
0
10
20
30
40
50
x [mol]-
p [K]
(S2) (S4) (S6)
Fig435Concentration dependence of (p) for sistemele xFe2O3middot(100-x)[As2O3middotPbO] (S2) xFe2O3middot(100-x)[As2O3middotTeO2] (S4) and xFe2O3middot(100-x)[3B2O3middotLi2O] (S6)
for 3 x 50 mol Fe2O3
Using the representation 1 = f(T) the molar Curie constants CM the effective
magnetic moments and molar fraction of Fe3+(x1) şi Fe2+(x2) ions were calculated and
represented in tables 47-9
Table 47 Molar Curie constants effective magnetic moments and molar fraction of
Fe3+(x1) şi Fe2+(x2) ions in xFe2O3middot(100-x)[As2O3middotPbO] glasses (S2)
x [mol Fe2O3]
CMtimes102
[emu mol] ef
[microB] x1
[mol Fe23+O3]
x2 [mol Fe2
2+O3] 3 2526 58 261 039 5 393 56 332 168 10 7326 541 476 524 20 13459 519 53 147 35 23364 516 829 2671 50 32154 507 767 4233
Table 48 Molar Curie constants effective magnetic moments and molar fraction of
Fe3+(x1) şi Fe2+(x2) ions in xFe2O3middot(100-x)[As2O3middotTeO2] glasses (S4)
x [mol Fe2O3]
CMtimes102
[emu mol] ef
[microB] x1
[mol Fe23+O3]
x2 [mol Fe2
2+O3] 3 2571 585 277 023 5 4016 566 363 137 10 7911 562 686 314 20 14992 521 643 929 35 22676 509 601 2899 50 30959 497 313 4687
37
Table 49 Molar Curie constants effective magnetic moments and molar fraction of Fe3+(x1) şi Fe2+(x2) ions in xFe2O3middot(100-x)[3B2O3middotLi2O] glasses (S6)
The results allowed to consider that the magnetic properties of the studied glasses can
be explained through magnetic interractions between Fe3+ - Fe3+ Fe3+- Fe2+ and Fe2+- Fe2+ that
explain the dependences of RPE parameters concentration
SELECTED CONCLUSIONS
In this thesis xMOmiddot(100-x)[As2O3middotTeO2] xMOmiddot(100-x) [As2O3middotPbO] and
xMOmiddot(100-x)[3B2O3middotLi2O] glasses where MO =gt MnO or Fe2O3 were comparatively
studied in 0 le x le 50 mol The structural modifications of investigated glass matrices were
comparatively followed in function of the manganese or iron ions on the investigated glass
matrices were followed
The study by FT-IR spectroscopy shows that the evolution of the spectra of
xMnOmiddot(100-x) [As2O3middotPbO] with the addition and the increasing of the MnO content suggest
that the manganese ions break up a part of As ndash O ndash As Pb ndash O ndash Pb and probably of As ndash O ndash
Pb bonds The addition of MnO in the As2O3middotPbO glass matrix is leading to a disordering of
the glasses structure with the increasing of the MnO content
The evolution of the absorption bands for FT ndash IR spectrum of xFe2O3middot(1-x)
[As2O3middotPbO] glasses are determined by the addition of Fe2O3 content It can be observed to
shift the bands assigned As ndash O ndash As vibrations from AsO3 units due to changing to length As
ndash O ndash As bonds and interne angles of AsO3 units disappears PbO4 units and appears FeO6
units The addition of Fe2O3 in the As2O3middotPbO glass matrix determined a disordering of the
glasses structure with the increasing of the Fe2O3 content
From FT-IR absorption spectra of the investigated xMOmiddot(100-x)[As2O3middotTeO2] glasses
system where MO =gt MnO or Fe2O3 it can be observed that the addition and increasing of
manganese ions concluded the contraction of As-O-As bonds from totally symmetric
x [mol Fe2O3]
CMtimes102
[emu mol] ef
[microB] x1
[mol Fe23+O3]
x2 [mol Fe2
2+O3] 3 2542 582 268 032 5 3943 561 338 162 10 7423 544 506 494 20 13568 520 549 1451 35 23094 513 731 2769 50 31746 503 584 4416
38
stretching vibrations of AsO3 units for x ge10 mol there can be an increase in number of As-
O-As bonds from AsO3 units orand a length these linkage to doubly degenerate stretching
vibrations of AsO3 units and a stretching vibration mode of TeO3 tp with NBO It can be
remarked from the FT-IR absorption spectra the gradual transformation of symmetric
stretching vibration mode of Te-O bonds from TeO3 units in TeO4 (tbp) units and the presence
of MnO2 units Once with the addition of iron ions the xFe2O3middot(100- x)[As2O3middotTeO2]
glasses behave like xMnOmiddot(100-x)[As2O3middotTeO2] glasses but in this system the
appearance of FeO6 units can be seen
From FT-IR spectra in xMOmiddot(100-x)[3B2O3middotLi2O] glasses where MO =gt MnO or
Fe2O3 can be concluded that the addition of manganese or iron ions in vitreous matrices leads
to the increase of the disorder degree
The study by Raman spectroscopy shows that the evolution of the spectra the addition
of MnO in the [As2O3middotPbO]glass matrix determined an order degree of the vitreous matrix
The intensity of the bands attributed vibrations As ndash O ndash As bonds from As2O units and
bending vibrations of As ndash O ndash As from As2O units shift to a higher wave length that suggests
an increase in the As2O units comparative to AsO3 units With the increase of iron ions content
in the As2O3middotPbO glass matrix the number of these structural units decreases due to the
increasing of the disorder in the studied glasses
With the increasing of manganese content in As2O3TeO2 glass matrix the intensity
of these bands is increasing showing that the manganese content favorites the formation of
TeO4 (tbp) and TeO3 (tp) units For high concentrations of iron ions in xFe2O3middot(100-
x)[As2O3 TeO2] system of glasses the number of As-O-As linkages appear in Raman
spectrum due to stretching vibrations of As-O-As and vibrations of the continuous TeO4 (tbp)
network show a significant decrease
Studying the Raman spectra of xMOmiddot(1-x)[3B2O3middotLi2O] glass system where MO =gt
MnO or Fe2O3 it has been observed that the absorption bands presented in vitreous matrix
gradually decreased with an increase in the manganese or iron content in both glasses system
which suggested an increase of the disorder in these vitreous systems
The EPR spectra presents the behavior of manganese or iron ions in different vitreous
matrices xMOmiddot(100-x)[As2O3middotBO] where MO=gtMnO or Fe2O3 and BO =gt TeO2 or
PbO and xMOmiddot(100-x) [3B2O3middotLi2O] Glasses were investigated by EPR spectroscopy on a
large compositional range with 0 le x le 50 mol The absorption line centered at gef 43 and
is due to isolated Mn2+ ions The absorption line centered at gef 20 may be attributed to
Mn2+ species interacting by magnetic coupling dipolar and or super exchange the last ones
forming magnetic clusters The EPR spectra of Fe3+ in xFe2O3middot(100-x)[As2O3middotPbO]
xFe2O3middot(100-x)[As2O3middotTeO2] and xFe2O3middot(1-x)[3B2O3middotLi2O] are presented two absorption
lines centered at gef 43 and gef 20 up to x le 35mol Fe2O3 systems studied
39
The absorption line centered at gef 43 is due to isolated Fe3+ ions The absorption
line centered at gef 20 may be attributed to Fe3+ species interacting by magnetic coupling
dipolar and or super exchange the last ones forming magnetic clusters
The evolution of the spectra is easier to follow considering the dependence of
concentration on the EPR parameters the line - intensity (obtained as an integral of the area
under the corresponding EPR signal) J and the line - width ΔB The evolution of J and AB
reflects the structural transformations which appear in the glass matrices due to the increase of
manganese ions content
The magnetic susceptibility data are in good agreement with the EPR result The
magnetic behavior of the glasses from xMnOmiddot(100-x)[As2O3middotBO] where BO =gt TeO2 (S3)
or PbO (S1) and xMnOmiddot(100-x)[3B2O3middotLi2O] (S5) glasses for 3 le x le 50 mol MnO
For (S1) and (S3) system glasses up to x 3 mol and x 5 mol (S5) glass
system the temperature dependence of the reciprocal magnetic susceptibility obeys a Curie
law In this concentration range the manganese ions are predominantly isolated orand
participate in dipole-dipole interractions At higher concentrations the reciprocal magnetic
susceptibility obeys a Curie-Weiss law with negative paramagnetic Curie temperature (p)
characteristic to antiferromagnetic coupled ions by means of super exchange interractions This
behavior of manganese ions is confirmed by the shape of the EPR spectra Using the
representation 1 =f(T) the molar Curie constants CM the effective magnetic moments
and molar fraction of Mn2+(x1) şi Mn3+(x2) ions were calculated The magnetic susceptibility
data are in good agreement with the EPR result
The magnetic behavior of the glasses xFe2O3middot(100-x)[As2O3middotPbO] (S2)
xFe2O3middot(100-x)[As2O3middotTeO2] (S4) and xFe2O3middot(100-x)[3B2O3middotLi2O] (S6) for 3 x 50
mol Fe2O3 are presented For (S2) glass systems up to x 10 mol x 3 mol (S5)
glass systems and x 5 mol (S6) glass systems the temperature dependence of the
reciprocal magnetic susceptibility obeys a Curie law In this concentration range the iron ions
are predominantly isolated orand participate in dipole-dipole interactions At higher
concentrations the reciprocal magnetic susceptibility obeys a Curie-Weiss law with negative
paramagnetic Curie temperature (p) characteristic to antiferromagnetic coupled ions by
means of super exchange interactions(fig 435) This behavior of iron ions is confirmed by the
shape of the EPR spectra Using the representation 1 = f(T) the molar Curie constants
CM the effective magnetic moments and molar fraction of Fe3+(x1) şi Fe2+(x2) ions were
calculated
40
REFERENCES
Chapter 1
[1] I Ardelean bdquoIntroducere icircn studiul materialelor oxidice cu structură vitroasă EdNapocaStar Cluj Napoca 2002 [2] G Srinivasarao N Veeraiah J All Com 327 52-65(2001) [3] G Srinivasarao N Veeraiah J Phys Chem Solids 63705-717(2002) [4] DBecherescu VCristea FMarx IMenessz FWinter Chimia stării solide Ed Şt şi Encicl Bucucureştivol 1 1983 [5] J Wong CAAngell Glass-Structure by Spectroscopy Dekker Inc New York 1976 [6] BEWarren HKKrutter O Morningstat J Am Ceram Soc 19 202 (1936) [7] LLSperry JD Mackenzie Phys Chem Glasses 9 91 (1968) [8] WLKonijnendijk JMStevels J Non-Cryst Solids 18 307 (1975) [9] FCEversteyn JM Stevels HJ Naterman Phys Chem Glasses 1 134 (1963) [10] G Fuxi Optical and Spectroscopie Properties of Glass Springer-Verlag Shanghai Scientific Technical Pub Shanghai 1991 [11] YDYiannopoulos GDChryssikos EIKamitsos Phys Chem Glasses 42(3) 164 (2001) [12] MGFerreira da Silva BFOCosta J Non-Cryst Solids 293-295 534 (2001) [13] RYordanova YDimitriev VDimitriev S Kassabov DKlissurski JNon-Cryst Solids 201 141 (1996) [14] W L Konijnendijk J M Stevels J Non-Cryst Solids 18 307 (1980) [15] M Iron M Couzi ALevasseur JBrethous JSolidState Chem 31 285 (1980) [16] TFurukawa WBWhite PhzsChemGlasses 21 85 (1980) [17] E I Kamitsos M A Karakassides GD Chryssikos J Phys Chem 90 4528 (1986) [18] E I Kamitsos M A Karakassides GD Chryssikos J Phys Chem 91 1073 (1987) [19] TWBril Philips Res Rep Suppl 2 117 (1976) [20] E I Kamitsos M A Karakassides GD Chryssikos J Phys Chem 30 203 (1989) [21] BNMeera JRamakrishna J Non-Cryst Solids 159 1 (1993) [22] KWitke THubert PReich JRamanSpectr 24 407 (1993) [23] E I Kamitsos M A Karakassides Phys Chem Glasses 30 19 (1989) [24] MPeteanu Teză de doctoratrdquo Universitatea Babeş-Bolyairdquo Cluj Napoca (1989) [25] PCTaylor PJBray JPhys Chem Solids 33 43 (1972) [26] IArdelean MPeteanu GhIlonca DPop Solid State Commun 33 653 (1980) [27] AV De Wijn RE Van Balderen JKemPhys 46 4 (1967) [28] DL Griscom RE Griscom J Phys Chem Glasses 12 19 (1971) [29] JWH Schreurs JChem Phys 69 2151 (1978) [30] AlNicula M Peteanu IArdelean Studia Univ Babeş-Bolyai Physica 2 65 (1979) [31] M Peteanu IArdelean SFilip ITodor GSalvan Studia Univ Babeş-Bolyai Physica XL 2 9 (1995) [32] IArdelean M Peteanu SFilipV Simon ITodor Solid State Commun 105 (5) 339 (1998) [33] SKMendiratta EGuedes de Sousa JMatSci Lett7 733 (1988) [34] IArdelean M Peteanu SFilip V Simon GGyorffy Solid State Commun 102 (4) 341 (1997) [35] IArdelean M Peteanu SFilip V Simon FCiorcas ITodor JMagnMagn Mat 196-197 257 (1999) [36] JKliava RBerger YServant JEmery JMGreneche JTrokss J Non-Cryst Solids 202 205 (1996) [37] LDBogomolova NA Krasilnikova VLBogdanov VDKhaliev VV Mitrofanov J Non-Cryst Solids 188 130 (1995) [38] DLoveridge SPark PhysChem Glasses 12 19 (1971) [39] IArdelean G Salvan M Peteanu V Simon FCiorcas Mod PhysLett B 13 (22-23) 801 (1999)
41
[40] JLRao AMuraly EDRao J Non-Cryst Solids 202 215 (1996) [41] CPrakash S Husain RJ Singh SMollah JAlloys Compon 326 47 (2001) [42] EGuedes de Sousa SKMendiratta JMMachado Da Silva Portugal Phys 17 (3-4) 203 (1986) [43] TCastner GSNewell WCHolton CP Slichter JChem Phys 32 668 (1960) [44] SPChaudhuri SKPatra JMatSci 35 4735 (2000) [45] IArdelean HH Qiu HSakata Matt Lett 32 335 (1997) Chapter 2 [1] J Wong C A Angel Glass Structure by Spectroscopy Marcel Dekker inc New-York 1976 [2] I Ardelean bdquoIntroducere icircn studiul materialelor oxidice cu structură vitroasă EdNapocastar Cluj-Napoca 2002 [3] N Avram GH Mateescu Spectroscopia icircn infraroşu Aplicaţii icircn chimia organică Ed Tehnică Bucureşti 1968 [4] TIliescu Spectroscopie optică moleculară vibraţională şi electronică Ed Casa Cărţii de Ştiinţă Cluj- Napoca 2000 [5] S Aştilean bdquoMetode şi tehnici moderne de spectroscopie optică Ed Casa Cărţii de Ştiinţă Cluj - Napoca 2002 p 5 [6] I Ursu Rezonanţă Electronică de Spinrdquo Ed AcademieiBucureşti (1965) [7] CHHurd ContempPhys 23 (5) 469 (1982) [8] GWAnderson WDCompton JChemPhys52 6166 (1970) [9] MS Seehra GSrinivasan Landolt-Bornstein (New Series) SubVolume F3 Springer-Verlag Berlin 1994 [10] GToulouse ContempPhys 2115 (1977) [11] NMMurayMagnetic susceptybility EdInterscience New York P1773 1963 [12] JBGoodenough Magnetism and Chemical Bond EdInterscience New York 1963 [13] IArdelean G Salvan M Peteanu V Simon FCiorcas Mod PhysLett B 13 (22-23) 801 (1999) [14] IArdelean MPeteanu R Ciceo Lucăcel Studii de rezonanţă paramagnetică electronică şi magnetice ale unor ioni 3d icircn sticle pe bază de B2O3 Ed Presa Univesitară Clujeană 2005 [15] IArdelean PhysStatSol (b) 87K137 (1978) [16] IArdelean Solid State Commun 31 75 (1979) [17] EJFrieble LKWilson AWDozier DLKinser PhysStatSol (b) 45 323 (1971) [18] DWMoon JMAitken RKMcCrone GS Ciloszik PhysChe Glasses 16 (5) 91 (1975) [19] SFilip Teză de doctorat UnivBabeş-Bolyai Cluj Napoca 1996 [20] CJSchinkel GWRathenou Physics of Non-Crystaline Solids North Holland Publ Co Amsterdam 215 1965 [21] EJFrieble LKWilson NCKoon DLKinser JAm Ceram Soc 57-237 (1974) [22] RJLandry JT Fournier CGYoung JChemPhys 46 1285 (1967) [23] WSimpson PhysStatSolidi b40 207 (1970) [24] RHasegawa PhysRevB b(5) 1631 (1971) [25] IArdelean GhIlonca MPeteanu Solid State Commun 52 145 (1984) [26] IArdelean GhIlonca OCozar J Physique 49 C8 1107 (1988) Chapter 3 [1] LFBates Modern Magnetism p133 Cambridge University Press London 1962 [2] IArdelean GhIlonca DBarbos Solid State Commun 40 769 (1981) [3] EBurzo IUrsu DUngur IArdelean JMatSci 15 581 (1980) [4] EBurzo IUrsu DUngur IArdelean MatResBull 15 1273 (1980) [5] DLGriscom Glass Science and Technology 48 151 (1990) [6] PJBray AH Silver Modern aspects of the vitreous state vol1 Butterworth
42
London 1960 [7] IArdelean Teza de doctorat UnivBabeş-Bolyai Cluj Napoca 1979 [8] SAştilean bdquoMetode şi tehnici moderne de spectroscopie opticărdquo EdCasa Cărţii de Ştiinţă Cluj ndash Napoca 2002 p5 [9] IArdelean RCiceo-Lucăcel ldquoFizica şi Tehnologia Materialelor Oxidice Lucrări Practicerdquo Ed Univ ldquoBabeş-Bolyairdquo Cluj-Napoca 2000 [10] VPop IChicinaş NJumate Fizica materialelor Metode experimentalerdquo EdPresa Universitară Clujeană 2001 [11] IUrsu Rezonanţă electronică de spinrdquo EdAcademiei Bucureşti 1965 Chapter 4 [1] I Ardelean S Lupşor D Rusu Solid State Sci 10 1384(2008) [2] I Ardelean S Lupşor D Rusu trimis spre publicare la Physica B decembrie 2009 [3] P Tarte Spectrochim Acta 18 467 (1962) [4] R A Condrate J Non ndash Cryst Solids 84 26 (1986) [5] G Srinivasarao N Veeraiah Phys Stat Sol (a) 191 370(2002) [6] G Srinivasarao N Veeraiah J Phys Chem Solids 63 705(2002) [7] G Srinivasarao N Veeraiah J All Com 327 52 (2001) [8] DK Durga N Veeraiah Bull Mater Sci 24 (4) 421 (2001) [9] F F Bentley L D Smithson A L Rozek InfraredndashSpectra and Characteristic Frequencies 700-300 cm-1 Interscience New York 1968 p 103 [10] O Noguera T Merle-Mejean AP Mirgorodsky MB Smirnov P Thomas J-C Champarnaud-Mesjard J Non-Cryst Solids 330 50 (2003) [11] BVR Chowdari KL Tan Fang Ling Solid State Ionics 113 ndash 115 711(1998) [12] C Jiang J Zhang H Mao F Gan Glass Technol 39(6) 200(1998) [13] MR Sahar K Sulhadi MS Rohani J Mater Sci 42 824(2007) [14] C Horea D Rusu I Ardelean J Mater Sci Mater Electron 20 905(2009) [15] GE Rachkovskaya GB Zakharevich J Appl Spectrosc 74 86(2007) [16] I Ardelean S Lupşor D Rusu trimis spre publicare la Journal of Materials Science Materials in Electronics decembrie 2009 [17] I Ardelean S Lupşor D Rusu trimis spre publicare la Modern Physics Letters B decembrie 2009 [18] R Iordanova Y Dimitriev V Dimitrov S Kassabov D Klissurski J Non ndash Cryst Solids 231 227 (1998) [19] R Iordanova Y Dimitriev S Kassabov D Klissurski J Non ndash Cryst Solids 204 141 (1996) [20] J O Jensen S J Gilliam A Banerjee D Zeroka S J Kirkby C N Merrow J Mol Struct (Theochem) 664 145 (2003) [21] G N Papatheodorou S A Solin Solid State Commun 16 5 (1975) [22] BVR Chowdari KL Tan Fang Ling J Mat Sci 35 2015 (2000) [23] R C Lucacel C Marcus V Timar I Ardelean Solid State Sci 9 850 (2007) [24] CP Varsamis EI Kamitsos GD Chryssikos Solid State Ionics 136ndash137 1031 (2000) [25] Sherief M Abo-Naf Fatma H El Batal Moenis A Azooz Mat Chem Phys 77 846 (2002) [26] SG Motke SP Yawale SS Yawale Bull Mater Sci 25 (10) (2002) [27] R Akagi N Ohtori N Umesaki J Non ndash Cryst Solids 293 471(2001) [28] E I Kamitsos M A Karakassides G D Chryssikos J Phys Chem 91(5) 1073 (1987) [29] H Ushida Y Iwadate T Hattori S Nishiyama K Fukushima Y Ikeda M Yamaguchi M Misawa T Fukunaga T Nakazawa S Jitsukawa J Alloys Compd 377 167 (2004) [30] I Ardelean F Ciorcas M Peteanu S Lupşor G Salvan Balkan Phys Lett 5 860 (1997)
43
[31] I Ardelean M Peteanu V Simon O Cozar F Ciorcas S Lupşor J Magn Magn Mater 196 253 (1999) [32] IArdelean MPeteanu GhIlonca Phys Stat Sol (a) 58 K33(1980) [33] IArdelean MPeteanu R Ciceo-Lucăcel ldquoStudii de rezonanţă paramagnetică electronică şi magnetice ale unor ioni 3d icircn sticle pe bază de B2O3rdquo Ed Presa Univ Clujeană Cluj Napoca 2005 p 171 [34] JLRao AMuraly EDRao J Non-Cryst Solids 202 215 (1996) [35] RPSChakradhar AMurali JLRao Optical Mat 10 109 (1998) [36] IArdelean MPeteanu SFilip VSimon GGyorffy Solid State Commun 102(4) 341 (1997) [37] IArdelean MPeteanu VSimon SFilip FCiorcaş ITodor J Magn Magn Mat 196-197 257 (1999) [38] IArdelean GSalvan MPeteanu VSimon CHimcinschi FCiorcas Mod Phys Lett B 13(22-23) 801 (1999) [39] IArdelean HHQiu HSakata Mat Lett 32 335 (1997) [40] SPChaudhuri SKPatra J Mat Sci 35 4735 (2000) [41] I Ardelean M Peteanu V Simon G Salvan J Mat Sci Technol 18 (3) 1 (2002)

8
The FT - IR spectra have been recorded using a Bruker Equinox 55 with a spectral range
between 4000 cm -1 and 370 cm -1 A MIR GLOBAR generator cooled with air was used The
detection was carried out with a DLATGS detector with a KBr window The spectral
resolution was about 05 cm1 The samples were prepared using KBr pellet technique
The Raman spectra were recorded on bulk samples at room temperature using an
integrated FRA 106S Raman module attached to Bruker Equinox 55 with a spectral range
from 3600 cm -1 to 70 cm -1 An NdYAG laser with an output power of 500 mW and a 1064
nm radiation was used The detection was carried out with an ultra sensitive D418-T detector
cooled with liquid nitrogen The spectral resolution was about 1 cm1
The EPR spectra were obtained at room temperature with an Adani Portable EPR
Spectrometer PS8400 in X-frequency band (94 GHz) For these measurements equal
quantities of powders from the investigated samples closed in glass tubes were used
Magnetic susceptibility measurements were performed on a Faraday type balance in the 80
- 300 K temperature range The sensitivity of the equipment was 10-7 emug
CHAPTER 4 RESULTS AND DISCUSSION REGARDING THE STUDY OF
xMOmiddot(100-x)[As2O3middotTeO2] xMOmiddot(100- x)[As2O3middotPbO] şi xMOmiddot(100-x)[3B2O3middotLi2O]
GLASS STRUCTURE WHERE MO =gt MnO or Fe2O3
In this chapter the results obtained by following the study of the structure and
properties of oxide glasses with transitional metals ions by FT- IR and Raman spectroscopies
electron paramagnetic resonance and magnetic susceptibility measurements are presented The
structural changes and magnetic properties with the manganese and iron content were
followed
41 Comparative study by FT-IR and Raman spectroscopies of xMOmiddot(100-
x)[As2O3middotTeO2] xMOmiddot(100- x)[As2O3middotPbO] şi xMOmiddot(100-x)[3B2O3middotLi2O] glasses
where MO =gt MnO or Fe2O3
411 Comparative study by FT-IR spectroscopy of As2O3middotTeO2 and
As2O3middotPbO vitreous matrices
In order to obtain new information regarding the role of the modifier in the
formation of vitreous matrices comparative studies by FT-IR spectroscopy were made
The FT-IR spectroscopy is represented in figure 41(ab) The wave length and the
structural assignments of FT ndash IR spectra of As2O3middotPbO and As2O3middotTeO2 vitreous matrices
are represented in table 41
9
400 600 800 1000 1200
Wavenumber [cm-1]
Abs
orpt
ion
[au
]
407
594
821
794
1119
As2O
3PbO
a)
a
400 600 800 1000 1200
As2O3TeO2
Abs
orpt
ion
[ua
]
Wavenumber [cm-1]
85473
3
644
1119
b)
b
Fig41 FT ndash IR spectra of vitreous matrices a As2O3middotPbO şi b As2O3middotTeO2
The FT ndash IR spectrum of As2O3middotPbO glass matrix presents five absorption bands at ~
1119 cm-1 ~ 821 cm-1 ~ 794 cm-1 ~ 594 cm-1 and ~ 407 cm-1(Fig41a)
The band from ~ 1119 cm-1 is due to totally symmetric stretching vibrations of AsO3
units [5 ndash 7] The bands from ~ 821 cm-1 and ~ 794 cm-1 are due to doubly degenerate
stretching vibrations of AsO3 structural units [5 ndash 7] The large band centered at ~ 594 cm-1 can
be due to totally symmetric bending vibrations of AsO3 structural units [5-7] The band from ~
407 cm-1 can be due to vibrations of Pb ndash O bonds from PbO4 structural groups [7]
Following As2O3TeO2 glass matrix spectrum presented in Fig 41b four bands can be
observed located at ~ 644 cm-1 ~ 733 cm-1 ~ 854 cm-1 and ~ 1119 cm-1 The band from ~ 644
cm-1 can be assigned to totally symmetric bending vibrations of AsO3 units [5-7] and also
stretching vibration mode of TeO4 tbp with bridging oxygen[11] The band from ~ 733 cm-1
can be assigned to the symmetric stretching vibration mode of Te-O bonds in TeO3 units
[15] The band from ~ 854 cm-1 can be assigned to doubly degenerate stretching vibrations of
AsO3 units [5-7] and also to the stretching vibration mode of TeO3 tp with NBO [11] The band
10
from ~ 1119 cm-1 can be assigned to totally symmetric stretching vibrations of AsO3 units [5-
7] These bands presented in As2O3TeO2 glass matrix spectrum confirm the presence of
AsO3 TeO4 tbp and TeO3 tp units in the structure of the glass matrix but due to the broadness
of the bands it can not be told for sure which one of these units is predominant
Table 41Wavenumber and the structural assignments of FT ndash IR spectra of
As2O3middotPbO and As2O3middotTeO2 vitreous matrices
~ [cm 1 ]
As2O3middotPbO As2O3middotTeO2
Attribution
~1119 cm-1
~ 1119 cm-1
Totally symmetric stretching vibrations of AsO3 units
~ 821cm-1
Doubly degenerate stretching vibrations of AsO3 structural units
~ 854 cm-1
Doubly degenerate stretching vibrations of AsO3 units Stretching vibration mode of TeO3 tp with NBO
~ 794 cm-1
Doubly degenerate stretching vibrations of AsO3 structural units
~ 733 cm-1
Symmetric stretching vibration mode of Te-O bonds in TeO3 units
~ 594 cm-1
~ 644 cm-1
Totally symmetric bending vibrations of AsO3 units
~ 407 cm-1 Vibrations of Pb ndash O bonds from PbO4 structural groups
412 Comparative study by FT-IR spectroscopy of
xMOmiddot(100- x)[As2O3middotPbO] vitreous systems where MO =gt MnO or Fe2O3
The infrared absorption spectra obtained for xMOmiddot(1-x)[As2O3middotPbO] glass system
where MO =gt MnO or Fe2O3 with 0 le x le 50 mol are presented in figure 42-3 and their
structural assignments are summarized in table 41
The spectra were discussed on the basis of the method given by Tarte [3] and Condrate
[4] by comparing the experimental data of glasses with those of related crystalline compounds
The characteristic absorption bands for crystalline As2O3 [5-8] PbO [79] and characteristic
bands for Fe2O3 [1819 ] were used as a reference point in the results discussion
The FT ndash IR spectra of the investigated glasses suggest a structure formed of AsO3 and
PbO4 structural units where As2O3 plays the role of the glass former and PbO plays the role of
the glass modifier The evolution of the spectra with the addition and the increasing of the
MnO content suggest that the manganese ions break up a part of As ndash O ndash As Pb ndash O ndash Pb and
probably of As ndash O ndash Pb bonds The addition of MnO in the As2O3middotPbO glass matrix is leading
to a disordering of the glasses structure with the increasing of the MnO content
The evolution of the absorption bands for FT ndash IR spectrum of xFe2O3middot(1-x)
[As2O3middotPbO] glasses are determined by the addition of Fe2O3 content It can be observed to
11
shift the bands assigned As ndash O ndash As vibrations from AsO3 units due to changing to length As
ndash O ndash As bonds and interne angles of AsO3 units disappears PbO4 units and appears FeO6
units The addition of Fe2O3 in the As2O3middotPbO glass matrix determined a disordering of the
glasses structure with the increasing of the Fe2O3 content
400 600 800 1000 1200
610
813
449
1093
423
449
616
760 848
821
794
594
20A
bsor
ptio
n [a
u]
Wavenumber [cm-1]
05
0
35
10
35
50
1
MnO
407
1119
693
Fig 42 FT ndash IR spectra of xMnOmiddot(100- x)[As2O3middotPbO] glasses
400 600 800 1000 1200
616
462
811
407
594
Abs
orpt
ion
[au
]
Wavenumber [cm -1]
05
20
0
35
10
35
50
1
Fe2O3
821
79469
3
1119
1084
610
Fig43 FT ndash IR spectra of xFe2O3middot(100- x)[As2O3middotPbO] glasses
12
413 Comparative study by FT-IR spectroscopy of
xMOmiddot(100-x)[As2O3middotTeO2] vitreous systems where MO =gt MnO or Fe2O
The infrared absorption spectra obtained for xMOmiddot(1-x)[As2O3middotTeO2] glass system
where MO =gt MnO or Fe2O3 with 0 le x le 50 mol are presented in figure 44 -5 and their
structural assignments are summarized in table 41[1617] The characteristic absorption bands
for crystalline As2O3 [5-8] PbO [79] TeO2 [810-15] MnO2 and Mn3O4 [9] and characteristic
bands for Fe2O3 [1819 ] were used as a reference point in the results discussion
Fig 44 FT ndash IR spectra of xMnOmiddot(100- x)[As2O3middotTeO2] glasses
Fig45 FT ndash IR spectra of xFe2O3middot(100- x)[As2O3middotTeO2] glasses
400 600 800 1000 1200
565
422 690 830
05
Abs
optio
n [a
u]
Wavenumber [cm-1]
0
3
5
35 50
1
MnO
854 733 644
1119
10 20
400 600 800 1000 1200
462650
812
713
561
05
20
Wavenumber [cm-1]
Abs
orpt
ion
[au
]]
0
3 5
10
35 50
1
Fe2O3
854 733
644
1119
13
This behavior of the studied glasses with the addition and increasing of MnO content
suggests that the structure observed in the glass matrix is conserving up to 5 mol MnO
where the structure takes another form From a structure dominated by AsO3 TeO4 tbp and
TeO3 tp units the structure became dominated by TeO4 tbp and MnO2 units and in a small
measure of AsO3 and TeO3 tp units For higher concentrations it can not be specified exactly
which of the last two structural units have the biggest proportion in these glasses From FT-IR
absorption spectra of the investigated glass system it can be observed that the addition and
increasing of manganese ions concluded the contraction of As-O-As bonds from totally
symmetric stretching vibrations of AsO3 units for x ge10 mol there can be an increase in
number of As-O-As bonds from AsO3 units orand a length these linkage to doubly degenerate
stretching vibrations of AsO3 units and a stretching vibration mode of TeO3 tp with NBO It
can be remarked from the FT-IR absorption spectra the gradual transformation of symmetric
stretching vibration mode of Te-O bonds from TeO3 units in TeO4 (tbp) units and the presence
of MnO2 units Once with the addition of iron ions the xFe2O3middot(100- x)[As2O3middotTeO2]
glasses behave like xMnOmiddot(100-x)[As2O3middotTeO2] glasses but in this system the
appearance of FeO6 units can be seen
414 Comparative study by FT-IR spectroscopy of
xMnOmiddot(100- x)[As2O3middotBO] vitreous systems were BO =gt TeO2 or PbO
The infrared absorption spectra obtained for xMnOmiddot(100- x)[As2O3middotBO] vitreous
systems where BO =gt TeO2 or PbO with 0 le x le 50 mol MnO are presented in figure
42 and 44 Following the infrared absorption spectra it can be observed that for
xMnOmiddot(100- x)[As2O3middot PbO] glass system the most disordered structure to exist for 0
le x le 5 mol MnO and to xMnOmiddot(100-x)[As2O3middot TeO2] glass system for 1 le x le 5 mol
MnO For x ge 5 mol MnO manganese ions break up a part of As ndash O ndash As Pb ndash O ndash Pb
and probably of As ndash O ndash Pb bonds to favor the increase in number of PbO4 units and
appearance of MnO2 units For x ge 10 mol MnO observed comparatively in both system
glasses the addition of manganese ions suggests for the first system a modification in linkage
characteristic units and for the second system an improvement for structural units of As2O3middot
TeO2 vitreous matrice also linkage characteristic units
415 Comparative study by FT-IR spectroscopy of
xFe2O3middot(100-x)[As2O3middotBO] vitreous systems where BO =gt TeO2 or PbO
The infrared absorption spectra obtained for xFe2O3middot(100- x)[As2O3middotBO] vitreous
systems where BO =gt TeO2 or PbO with 0 le x le 50 mol Fe2O3 are presented in figure
43 and 45
14
The evolution of the spectra with the addition and the increasing of the Fe2O3 content
suggest that the iron ions break up a part of As ndash O ndash As Pb ndash O ndash Pb and probably of As ndash O
ndash Pb bonds It can be observed a shift in the bands assigned As ndash O ndash As vibrations from AsO3
units due to changing to length As ndash O ndash As bonds and interne angles of AsO3 units the PbO4
units disappear and FeO6 units appear For x ge 5 mol Fe2O3 observed comparatively in
both system glasses the addition of iron ions suggests for the first system a modification in
linkage characteristic units of As2O3middotPbO and for the second system an improvement for
structural units of As2O3middot TeO2 vitreous matrice also linkage characteristic units appearance
of FeO6 units in both system
416 Comparative study by Raman spectroscopy of
As2O3middotTeO2 and As2O3middotPbO vitreous matrices
In order to obtain new information regarding the role of the modifier in the
formation of vitreous matrices there were made comparative studies by Raman
spectroscopy The Raman spectroscopy are presented in figure 46(ab) The wave
length and the structural assignments of Raman spectra of As2O3middotPbO şi As2O3middotTeO2 vitreous
matrices are presented in table 42
Table 42Wavenumber and the structural assignements of Raman spectra
of As2O3middotPbO and As2O3middotTeO2 vitreous matrices
~ [cm 1 ]
As2O3middotPbO As2O3middotTeO2
Attribution
~826 cm-1
~ 816 cm-1
Stretching vibrations of As-O-As
~ 752 cm-1
Vibrations of the continuous TeO4 (tbp) network
~ 627 cm-1
Vibrations As ndash O ndash As bonds from As2O units
~ 580 cm-1
Stretching vibrations of As-O-As
~ 525 cm-1
Vibrations O-As-O bonds from AsO3 units
~ 438cm-1
Symmetric bending vibrations of Te ndash O ndash Te vertex linkages between different TeO4 (tbp) TeO3+1 polyhedra Stretching vibrations of As-O-As of AsO3 units
~ 345 cm-1
Bending vibrations of As ndash O ndash As from As2O units
15
200 400 600 800 1000
As2O3PbO
Ram
an In
tens
ity [a
u]
LWavenumber [cm-1]
345
826
525
627a)
a
200 400 600 800 1000
816
752
580 R
aman
Inte
nsity
[au
]
Wavenumber [cm-1]
As2O3TeO2
438
b)
b
Fig46 Raman spectra of vitreous matrices a As2O3middotPbO şi b As2O3middotTeO2
The Raman spectrum of As2O3middotPbO glass matrix presents four bands at 826 cm-1
627 cm-1 525 cm-1 and 345 cm-1 The band from 826 cm-1 can be assigned to As ndash O ndash
As stretching vibrations [20] The band centered at 627 cm-1 can be assigned to vibrations As
ndash O ndash As bonds from As2O units the band from 525 cm-1 are assigned vibrations O-As-O
bonds from AsO3 units [21] The band of 345 cm-1 are attributed to As ndash O ndash As bending
vibrations from As2O units[2021]
The Raman spectrum of As2O3middot TeO2 glass matrix presents four bands at 816 cm-1
752 cm-1 580 cm-1 and 438 cm-1 The band from 816 cm-1 can be assigned to As ndash O ndash
As stretching vibrations [20] The band centered at 752 cm-1 can be assigned to vibrations of
the continuous TeO4 (tbp) network [22] The band of 580 cm-1 are attributed to As ndash O ndash As
stretching vibrations [12] The band centered at 438 cm-1 can be assigned symmetric bending
vibrations of Te ndash O ndash Te vertex linkages between different TeO4 (tbp) TeO3+1 polyhedra and
As ndash O ndash As stretching vibrations of AsO3 units
16
417 Study by Raman spectroscopy of xMOmiddot(100- x)[As2O3middotPbO]
vitreous systems where MO =gt MnO or Fe2O3
The Raman spectra obtained for xMOmiddot(100- x)[As2O3middotPbO] vitreous systems where
MO =gt MnO or Fe2O3 with 0 le x le 50 mol are presented in figure 47-8 and their
structural assignments are summarized in table 42
200 400 600 800 1000
368
833
345
1
3
Lungimea de unda [cm-1]
Inte
nsita
te R
aman
[ua
]
20
05
0
5
10
35
50
MnO
826
525
627
Fig 47 Raman spectra of xMnOmiddot(100- x)[As2O3middotPbO] glasses
The addition of MnO in the glass matrix determined an order degree of the vitreous
matrix The intensity of the bands attributed vibrations As ndash O ndash As bonds from As2O units
and bending vibrations of As ndash O ndash As from As2O units shift to a higher wave length that
suggests an increase in the As2O units comparative to AsO3 units
To the band from 826 cm-1 the addition of manganese ions in the glass matrix
determine for x = 05 mol an decreasing in intensity whereupon increasing for higher
concentrations The intensity of bands centered at 627 cm-1 and 525 cm-1 for x = 05
mol MnO decrease and disappear for x = 1 mol MnO The band of 345 cm-1 slowly
increases with the addition of manganese ions
To the band from 826 cm-1 the addition of iron ions in the glass matrix determines
for x = 05 mol an increase in intensity a gradual decrease and disappearance for x = 35
mol Fe2O3 of the bands observed for the glass matrix For higher concentrations of
manganese these bands gradually decrease The intensity of bands centered at 627 cm-1 and
525 cm-1 for x = 05 mol Fe2O3 increase and shift to 612 cm-1 and 501 cm-1 whereas
17
they gradually decrease and disappear for x = 10 mol Fe2O3 The band of 345 cm-1
decreases with the addition of iron ions and disappears for x = 20 mol Fe2O3
200 400 600 800 1000
3
612
501
Wavenumber [cm-1]
Ram
an In
tens
ity [a
u]
05
20
0
5
10
3550
1
Fe2O3
345
826
525
627
Fig 48 Raman spectra of xFe2O3middot(100- x)[As2O3middotPbO] glasses
With the increase of iron ions content in the As2O3middotPbO glass matrix the number of
these structural units decreases due to the increasing of the disorder in the studied glasses
418 Study by Raman spectroscopy of xMOmiddot(100-x)[As2O3middotTeO2]
vitreous systems were MO =gt MnO or Fe2O3
The Raman spectra obtained for xMOmiddot(100- x)[As2O3middot TeO2] vitreous systems
where MO =gt MnO or Fe2O3 with 0 le x le 50 mol are presented in figure 49-10 and their
structural assignments are summarized in table 42
The Raman spectrum of the glass matrix suggests a structure formed from TeO4 (tbp)
and TeO3 (tp) units where the presence of As ndash O ndash As bonds can not be excluded The
addition of manganese ions is leading to a modification of the structure proposed by the
spectrum of the glass matrix Then with the increasing of manganese content the intensity of
these bands is increasing showing that the manganese content favorises the formation of TeO4
(tbp) and TeO3 (tp) units
18
200 400 600 800 1000
783
850
768
416
816
752
Wavenumber [cm -1]
Ram
an In
tens
ity [a
u]
13
20
05
0
5
10
35
50
MnO
438
580
660
Fig 49 Raman spectra of xMnOmiddot(100- x)[As2O3middot TeO2] glasses
200 400 600 800 1000
226
294
408
673 751
5
W avenumber [cm -1]
Ram
an In
tens
ity [a
u]
05
20
0
3
10
35
50
1
Fe2O
3
816
752
438
580
Fig 410 Raman spectra of xFe2O3middot(100- x)[As2O3 TeO2] glasses
The Raman spectra of xFe2O3middot(100- x)[As2O3 TeO2] glasses present a significant
advance to the TeO4 (tbp) TeO3+1 polyhedra and AsO3 units represented in Raman spectrum
by the ~ 438 cm-1 band comparative with the modifications determined by the addition of
manganese ions in vitreous matrix For high concentrations of iron ions in xFe2O3middot(100-
x)[As2O3 TeO2] system of glasses the number of As-O-As linkages appear in Raman
spectrum due to stretching vibrations of As-O-As and vibrations of the continuous TeO4 (tbp)
network show a significant decrease
19
419 Comparative study by Raman spectroscopy of xMnOmiddot(100- x)[As2O3middotBO]
vitreous systems were BO =gt TeO2 or PbO
The addition of MnO to xMnOmiddot(100- x)[As2O3middotPbO] glass system do not break As
ndash O ndash As bonds into characteristic units and contribute to their prominence The addition of
manganese ions to xMnOmiddot(100- x)[As2O3middot TeO2] glass system for x=50mol MnO
determined the splitting up of a part of As ndash O ndash As Te-O-Te and the appearance of the
TeO4 (tbp) units against the loss of continuous TeO4 (tbp) network was observed
4110 Comparative study by Raman spectroscopy of xFe2O3middot(100- x)[As2O3middotBO]
vitreous systems where BO =gt TeO2 or PbO
With the increasing of iron ions content in the As2O3middotPbO glass matrix the number of
these structural units decreased due to the increase of the disorder in the studied glasses (x gt 20
mol ) and x = 50 mol Fe2O3 for xFe2O3middot(100- x)[As2O3middotTeO2] when iron ions
brought the structural units existing in glass matrices and favoured the appearace of
new bands due to bending vibrations of As ndash O ndash As
42 Comparative study by FT-IR and Raman spectroscopies of
xMOmiddot(100-x)[3B2O3middotLi2O] glasses where MO =gt MnO or Fe2O3
421 Study by FT-IR spectroscopy of xMOmiddot(100-x)[3B2O3middotLi2O] glasses
where MO =gt MnO or Fe2O3
The infrared absorption spectra obtained for xMOmiddot(1-x)[3B2O3middotLi2O] glass system
where MO =gt MnO or Fe2O3 with 0 le x le 50 mol are presented in figure 411-13 and their
structural assignments are summarized in table 43
500 1000 1500
3B2O3Li2O
Wavenumber [cm-1]
Abs
orpt
ion
[au
]
490
1400
1230
1061
698
614
460 78
6
Fig 411 FT ndash IR spectra of vitreous matrix 3B2O3middotLi2O
20
Following the infrared absorption spectra obtained for 3B2O3middotLi2O vitreous matrix
observed on eight bands ~ 1400 cm-1 ~ 1230 cm-1 ~ 1061 cm-1 ~ 786 cm-1 ~ 698 cm-
1 ~ 614 cm-1 ~ 490 cm-1 şi ~ 460 cm-1 The band at ~ 1400 cm-1 is assigned to
asymmetric stretching vibrations from BOslash3 şi BOslash2O- groups (Oslash represent oxygen atom
bridging two boron atoms) The band at ~ 1230 cm-1 is attributed to asymmetric stretching
vibrations of B ndash O bonds from triangular ortoborate BO 33 groups [23-26]
400 600 800 1000 1200 1400 1600
0
3
5
10
20
35
50
1
Wavenumber [cm-1]
Abs
orpt
ion
[ua
]
05
MnO
490
1400
1230
1061
698
614
460 78
6
Fig 412 FT ndash IR spectra of xMnOmiddot(100-x)[3B2O3middotLi2O] glasses
400 600 800 1000 1200 1400 1600
469
Wavenumber [cm-1]
Abs
orpt
ion
[ua
]
0
3
5
10
20
35
50
1
05
Fe2O3
490
1400
1230
1061
698
614
460 78
6
Fig 413 FT ndash IR spectra of x Fe2O3middot(100-x)[3B2O3middotLi2O] glasses
21
Table 43Wavenumber and the structural assignments of FT ndash IR and Raman
spectra of 3B2O3middotLi2O vitreous matrix
~ [cm 1 ] Attribution
FT ndash IR Raman FT ndash IR Raman
~ 1400 cm-1
~ 1400 cm-1
Asymmetric stretching
vibrations from BOslash3 şi BOslash2O-
groups
BOslash2O- triangles linked to
other borate triangular units
~ 1230 cm-1
Asymmetric stretching
vibrations of B ndash O bonds from
triangular ortoborate
BO 33 groups
~ 1061 cm-1
~ 1074 cm-1
Stretching vibrations of B ndash Oslash
bonds in -4BOslash tetrahedra from
tri- tetra- and penta-borate
groups
Diborate groups
~ 902 cm-1
Vibrations of orthoborate
groups
~ 786 cm-1
~ 791 cm-1
Bending vibrations of O3B ndash O
ndash BO4 bonds
Vibrations of rings with six
member to one or two BO4
tetrahedral from tri- tetra ndash
and penta ndash borate units
~ 698 cm-1
Bending vibrations of B-O-B
bonds from pentaborate groups
~ 614cm-1 Bending vibrations of O ndash B ndash O
bonds
~ 490cm-1 ~ 471cm-1 Bending vibrations of B-O-B
bonds
Isolated diborate groups
~ 460cm-1 Bending vibrations of O ndash B ndash O
bonds
22
The band at ~ 1061 cm-1 is assigned to stretching vibrations of B ndash Oslash bonds in -4BOslash
tetrahedra from tri- tetra- and penta-borate groups and the band at ~ 786 cm-1 is assigned
to bending vibrations of O3B ndash O ndash BO4 bonds The band at ~ 698 cm-1 is attributed to
Bending vibrations of B-O-B bonds from pentaborate groups The bands at ~ 614 cm-1 and
~ 460 cm-1 are assigned to bending vibrations of O ndash B ndash O bonds and the band at ~ 490 cm-
1 is assigned to bending vibrations of B-O-B bonds
From FT-IR spectra it can be concluded that the addition of manganese or iron ions in
vitreous matrices leads to the increase of the disorder degree
Also the structural changes that appeared in 3B2O3middotLi2O vitreous matrix with an
addition MnO or Fe2O3 content can be studied Ar=A4A3 ratio(A4 - relative number of -4BOslash tetrahedral borate units A3 - relative number of triangular (BOslash3 and BOslash2O-) units
0 10 20 30 40 50
010
015
020
Ar
x [mol]
MnO Fe2O3
Fig 414 The evolution of Ar ratio with the MnO or Fe2O3 content of
xMnOmiddot(100-x)[3B2O3middotLi2O] şi xFe2O3middot(100-x)[3B2O3middotLi2O] The evolution of the value of this ratio also allows a visualization of the effects
determined by the presence of the manganese or iron ions in the matrix The value Arltlt 1
indicated that BO3 is dominant related to BO4
422 Study by Raman spectroscopy of xMOmiddot(100-x)[3B2O3middotLi2O] glasses
where MO =gt MnO or Fe2O3
The Raman spectra obtained for xMOmiddot(1-x)[3B2O3middotLi2O] glass system were MO =gt
MnO or Fe2O3 with 0 le x le 50 mol are presented in figure 414-16 and their structural
assignments are summarized in table 43
Studying the Raman spectra of xMOmiddot(1-x)[3B2O3middotLi2O] glass system where MO =gt
MnO or Fe2O3 it has been observed that the absorption bands presented in vitreous matrix
gradually decreased with an increase in the manganese or iron content in both glasses system
which suggested an increase of the disorder in these vitreous systems
23
1000 2000 3000
B2O3Li2O
Wavenumber [cm-1]
Ram
an In
tens
ity [a
u]
1430
107490
279
1471
Fig 415 Raman spectra of vitreous matrix 3B2O3middotLi2O
500 1000 1500 2000 2500 3000
1430
107490
2791
0
Wavenumber [cm-1]
Ram
an In
tens
ity [a
u]
1
3
20
05
5
10
35
50
MnO
471
Fig 416 Raman spectra of xMnOmiddot(100-x)[3B2O3middotLi2O] glasses
400 600 800 1000 1200 1400 1600
Wavenumber [cm-1]
Ram
an In
tens
ity [a
u]
0
1
3
20
05
5
10
35
50
Fe2O3
1430
1074
90279
1
471
Fig 417 Raman spectra of x Fe2O3middot(100-x)[3B2O3middotLi2O] glasses
24
43 Comparative study by electron paramagnetic resonance (EPR) and magnetic
susceptibility measurements of xMOmiddot(100-x)[As2O3middotTeO2] xMOmiddot(100-x)
[As2O3middotPbO] and xMOmiddot(100-x)[3B2O3middotLi2O] glasses where MO =gt MnO or Fe2O3
431 Comparative study by electron paramagnetic resonance (EPR) of
xMnOmiddot(100-x)[As2O3middotBO] where BO =gt TeO2 or PbO
and xMnOmiddot(100-x) [3B2O3middotLi2O] glasses
In order to obtain more information regarding the behavior of manganese ions in
different vitreous matrices [3031] xMnOmiddot(100-x)[As2O3middotBO] where BO =gt TeO2 or PbO
and xMnOmiddot(100-x) [3B2O3middotLi2O] glasses were investigated by EPR spectroscopy on a large
compositional range with 0 le x le 50 mol The EPR spectra of Mn2+ for xMnOmiddot(100-
x)[As2O3middotPbO] (S1) xMnOmiddot(100-x)[As2O3middotTeO2] (S3) and xMnOmiddot(100-x)[3B2O3middotLi2O]
(S5) are presented in figure 418-20 These spectra present two absorption lines centered at gef
43 and gef 20 in all systems
The absorption line centered at gef 43 and is due to isolated Mn2+ ions [32] The
absorption line centered at gef 20 may be attributed to Mn2+ species interacting by magnetic
coupling[33] dipolar and or super exchange the last ones forming magnetic clusters [32]
The evolution of the spectra is easier to follow considering the dependence of
concentration on the EPR parameters the line - intensity (obtained as an integral of the area
under the corresponding EPR signal) J and the line - width ΔB The evolution of J and AB
reflects the structural transformations which appear in the glass matrices due to the increase of
manganese ions content
The intensity and the line - width of the resonance line from gef 43 for all
investigated systems is represented in figure 421(ab)
The intensity of the resonance line from gef 43 for all investigated glass systems
decreases due to the decrease of the isolated manganese ions numbers The line - width from
gef 43 for (S1) and (S3) systems decreases due to decrease of Mn2+ number and to the
structural disorder in glasses with the increase of MnO content For (S5) glass system the line
- width of the resonance line there is an increase in all compositional domains
The intensity of the resonance line from gef 20 can be observed as increasing up to
x=14 mol for (S1) system up to x=8mol for (S3) system and 20 mol for (S5)
system The line - width of the resonance line from gef 20 for (S1) and (S3) systems
increases up to 3 mol and 5mol for (S5) due to Mn2+ species interacting by magnetic
coupling dipole- dipole as the main broadening mechanism Over this concentration line ndash the
width of the resonance line from gef 20 is straight and it can be assumed that the
manganese ions begin to manifest super exchange magnetic interactions
25
1000 2000 3000 4000 5000
Firs
t der
ivat
ive
of a
bsor
ptio
n [u
a]
05
1
3
5
10
20
35
50
x [mol Mn2O3]amplif
B [G]
10
200
40
80
400
5
1
1
Fig 418 The EPR spectra of Mn2+ for xMnOmiddot(100-x)[As2O3middotPbO] (S1)
glass system
1000 2000 3000 4000 5000
Firs
t der
ivat
ive
of a
bsor
ptio
n [u
a]
x [mol MnO]
051
3
5
10
20
35
50
9
500
400
50
100
4
1
amplif
B [G]
1
Fig 419 The EPR spectra of Mn2+ for xMnOmiddot(100-x)[As2O3middotTeO2] (S3)
glass system
26
1000 2000 3000 4000 5000
501
B [G]
Firs
t der
ivat
ive
of a
bsor
ptio
n [u
a]
1
4
9
10
30
60
100
amplif
05
1
3
5
10
20
35
x [mol MnO]
Fe3+
Fig 420 The EPR spectra of Mn2+ for xMnOmiddot(100-x)[3B2O3middotLi2O] (S5)
glass system
0 2 4 6 8 10 12 14 16 18 20 22
x [mol]
J [ u
a]
S1 S3 S5
-2 0 2 4 6 8 10 12 14 16 18 20 22
50
100
150
200
250
300
S1 S3 S5
x [mol]
B
[G]
a b
Fig 421 The dependence on MnO content of the intensity (a) and width(b) of resonance
line at gef 43 for xMnOmiddot(100-x)[As2O3middotPbO] (S1) xMnOmiddot(100-x)[As2O3middotTeO2] (S3) şi
xMnOmiddot(100-x)[3B2O3middotLi2O] (S5) system glasses
27
0 10 20 30 40 50
x [mol]
J [ u
a]
S1 S3 S5
0 10 20 30 40 50
400
500
600
700
800
900
S1 S3 S5
x [mol]
B[G
]
a b
Fig 422 The dependence on MnO content of the intensity (a) and width b) of resonance
line at gef 20 for xMnOmiddot(100-x)[As2O3middotPbO] (S1) xMnOmiddot(100-x)[As2O3middotTeO2] (S3) and
xMnOmiddot(100-x)[3B2O3middotLi2O] (S5) system glasses
Following figure 418-20 it can be observed that (S1) and (S3) have had a similar
evolution but (S5) system presented for 05 le x le 5 mol (fig420) has a hyperfine
sextet[33] at gef 20due to Mn2+ isolated ions
432 Comparative study by magnetic susceptibility measurements of
xMnOmiddot(100-x)[As2O3middotBO] where BO =gt TeO2 or PbO and
xMnOmiddot(100-x)[3B2O3middotLi2O] glasses
The magnetic susceptibility data are in good agreement with the EPR result The
magnetic behavior of the glasses from xMnOmiddot(100-x)[As2O3middotBO] where BO =gt TeO2 (S3)
or PbO (S1) and xMnOmiddot(100-x)[3B2O3middotLi2O] (S5) glasses for 3 le x le 50 mol MnO are
presented in figure 423 - 25
For (S1) and (S3) system glasses up to x 3 mol and x 5 mol (S5) glass
system the temperature dependence of the reciprocal magnetic susceptibility obeys a Curie
law In this concentration range the manganese ions are predominantly isolated orand
participate in dipole-dipole interractions At higher concentrations the reciprocal magnetic
susceptibility obeys a Curie-Weiss law with negative paramagnetic Curie temperature (p)
characteristic to antiferromagnetic coupled ions by means of super exchange interractions(fig
426) This behavior of manganese ions is confirmed by the shape of the EPR spectra
28
100 150 200 250
2
4
6
8
10
12
14
16
18
20
22
T [K]
[
emu
mol
]-1
3 mol 5 mol 10 mol 20 mol 35 mol 50 mol
Fig423 The temperature dependence of -1 for xMnOmiddot(100-x)[As2O3middotPbO]
(S1) 3 le x le 50 mol
50 100 150 200 2500
2
4
6
8
10
12
14
16
18
20
22
3 mol 5 mol 10 mol 20 mol 35 mol 50 mol
T [K]
[
emu
mol
]-1
Fig424 The temperature dependence of -1 for xMnOmiddot(100-x)[ As2O3middotTeO2]
(S1) 3 le x le 50 mol
100 150 200 250
2
4
6
8
10
12
14
16
18
20
22
[em
u m
ol]-1
T [K]
3 mol 5 mol 10 mol 20 mol 35 mol 50 mol
Fig425 The temperature dependence of -1 for xMnOmiddot(100-x)[3B2O3middotLi2O]
(S5) 3 le x le 50 mol
29
0 10 20 30 40 50
0
20
40
60
80
100
x [mol]
-p [K
]
(S1) (S3) (S5)
Fig426Concentration dependence of (p) for sistemele xMnOmiddot(100-x)[As2O3middotPbO]
(S1) xMnOmiddot(100-x)[As2O3middotTeO2] (S3) şi xMnOmiddot(100-x)[3B2O3middotLi2O] (S5)
Using the representation 1 =f(T) the molar Curie constants CM the effective
magnetic moments and molar fraction of Mn2+(x1) şi Mn3+(x2) ions were calculated and
represented in tables 44 -6
Tabel 44 Molar Curie constants effective magnetic moments and molar fraction of Mn2+(x1) şi Mn3+(x2) ions in xMnOmiddot(100-x)[As2O3middotPbO] (S1) glasses
x
[mol MnO2] CMtimes102
[emu mol] ef
[microB] x1
[mol Mn2+O2] x2
[mol Mn3+O2] 3 1272 582 268 032 5 1979 562 343 157 10 3777 549 555 445 20 6688 517 492 1508 35 12239 502 377 3123 50 15427 496 268 4732
Tabel 45 Molar Curie constants effective magnetic moments and molar fraction of Mn2+(x1) şi Mn3+(x2) ions in xMnOmiddot(100-x)[As2O3middotTeO2] (S3)glasses
x
[mol MnO2] CMtimes102
[emu mol] ef
[microB] x1
[mol Mn2+O2] x2
[mol Mn3+O2] 3 1297 588 287 013 5 1938 556 312 188 10 3804 551 575 425 20 6766 52 549 1451 35 11148 504 441 3059 50 15528 498 358 4642
30
Tabel 46 Molar Curie constants effective magnetic moments and molar fraction of Mn2+(x1) şi Mn3+(x2) ions in xMnOmiddot(100-x)[3B2O3middotLi2O] (S5) glasses
x
[mol MnO2] CMtimes102
[emu mol] ef
[microB] x1
[mol Mn2+O2] x2
[mol Mn3+O2] 3 127 581 265 035 5 1919 554 303 197 10 3681 542 486 514 20 7215 519 53 147 35 1121 506 505 2995 50 15898 501 493 4507
433 Comparative study by electron paramagnetic resonance (EPR) of
xFe2O3middot(100-x)[As2O3middotBO] where BO =gt TeO2 or PbO and
x Fe2O3middot(100-x) [3B2O3middotLi2O] glasses
In order to obtain more information regarding the behavior of iron ions in
xFe2O3middot(100-x)[As2O3middotBO] where BO =gt TeO2 (S4) or PbO (S2) şi xFe2O3middot(100-
x)[3B2O3middotLi2O] glasses were investigated by EPR spectroscopy on a large compositional
range with 05 le x le 35 mol Fe2O3 The EPR spectra of Fe3+ in xFe2O3middot(100-
x)[As2O3middotPbO] (S2) xFe2O3middot(100-x)[As2O3middotTeO2] (S4) and xFe2O3middot(1-x)[3B2O3middotLi2O]
(S6) are presented in figure 427-29 These spectra present two absorption lines centered at
gef 43 and gef 20 up to x le 35mol Fe2O3 systems studied
The absorption line centered at gef 43 is due to isolated Fe3+ ions [34-36] The
absorption line centered at gef 20 may be attributed to Fe3+ species interacting by magnetic
coupling dipolar and or super exchange the last ones forming magnetic clusters [37-41]
The evolution of the spectra is easier to follow considering the dependence of
concentration on the EPR parameters the line - intensity (obtained as an integral of the area
under the corresponding EPR signal) J and the line - width ΔB The evolution of J and AB
reflects the structural transformations which appear in the glass matrices due to the increasing
of iron ions content
The intensity and the line - width of the resonance line from gef 43 for all
investigated systems is represented in figure 430 (a b) The intensity of the resonance line
from gef 43 increases for (S2) and (S4) up to 3 mol and up to 5 mol for (S6) then
decreases for all systems investigated A line broadening up to 3 mol from gef 43 for
these systems can be observed due to increasing of Fe3+ isolated number of ions
31
1000 2000 3000 4000 5000
40
Firs
t der
ivat
ive
of a
bsor
ptio
n [u
a]
B [G]
x [mol Fe2O3]
05
1
3
5
1020
35 2
40
20
10
10
10
amplif
Fig427 The EPR spectra of Fe3+ for xFe2O3middot(100-x)[As2O3middotPbO] (S2)
glass system
1000 2000 3000 4000 5000
100
B [G]
Firs
t der
ivat
ive
of a
bsor
ptio
n [u
a]
10080
20
50
20
20
3
05
1
5
102035
x [mol Fe2O3] amplif
Fig428 The EPR spectra of Fe3+ for xFe2O3middot(100-x)[As2O3middotTeO2] (S4)
glass system
32
1000 2000 3000 4000 5000
Firs
t der
ivat
ive
of a
bsor
ptio
n [u
a]
B [G]
3
05
1
5
10
20
35
x [mol Fe2O3]
30
50
20
20
10
30
30
amplif
Fig429 The EPR spectra of Fe3+ for xFe2O3middot(100-x)[3B2O3middotLi2O] (S6)
glass system
The intensity and the line - width of the resonance line from gef 43 for all
investigated systems is represented in figure 430 (a b)The resonance line from gef 20 is
attributed to Fe3+ ions that interact by magnetic coupling dipolar orand super exchange
interractions can be observed in all compositional domains
The intensity of the resonance line from gef 20 can be observed as increasing up to
x=35 mol for (S2) and (S6) system and 10 mol for (S4) system with increased iron
ions content The line - width of the resonance line from gef 20 increased up to 10mol
for (S2) system and up to 3 mol for (S4) and 5mol for (S6) due to Fe3+species
interacting by magnetic coupling dipole-dipole Above this concentration line - width of the
resonance line from gef 20 can be attributed to dipolar and super exchange magnetic
interactions The ΔB = f(x) dependence reflects the competion between the broadening
mechanism (dipole ndash dipole interactions the interactions between ions in diferent
valence state and structural disorder) and the narrowing ones (super exchange
interactions)
33
0 5 10 15 20 25 30 35 40
x [mol]
J [ u
a]
S2 S4 S6
a)
0 5 10 15 20 25 30 35 4040
60
80
100
120
140
160
180
200
220 S2 S4 S6
B[G
]
x [mol]
a b
Fig 430 The dependence on Fe2O3 content of the intensity (a) and width (b) of
resonance line at gef 43 for xFe2O3middot(100-x)[As2O3middotPbO] (S2)
xFe2O3middot(100-x)[As2O3middotTeO2] (S4) and xFe2O3middot(100-x)[3B2O3middotLi2O] (S6) glasses
0 5 10 15 20 25 30 35 40
x [mol]
J [ u
a]
S2 S4 S6
a)
0 5 10 15 20 25 30 35 40
200
400
600
800
1000
1200
1400
1600
x [mol]
B
[G] S2
S4 S6
a b
Fig 431 The dependence on Fe2O3 content of the intensity (a) and width (b) of
resonance line at gef 20 for xFe2O3middot(100-x)[As2O3middotPbO] (S2)
xFe2O3middot(100-x)[As2O3middotTeO2] (S4) and xFe2O3middot(100-x)[3B2O3middotLi2O] (S6) glasses
34
434 Comparative study by magnetic susceptibility measurements of
xFe2O3middot(100-x)[As2O3middotBO] where BO =gt TeO2 or PbO and
xFe2O3middot(100-x) [3B2O3middotLi2O] glasses
The magnetic susceptibility data are in good agreement with the EPR result The magnetic
behavior of the glasses xFe2O3middot(100-x)[As2O3middotPbO] (S2) xFe2O3middot(100-x)[As2O3middotTeO2]
(S4) and xFe2O3middot(100-x)[3B2O3middotLi2O] (S6) for 3 x 50 mol Fe2O3 are presented in
figure 432 - 34
For (S2) glass systems up to x 10 mol x 3 mol (S5) glass systems and x 5
mol (S6) glass systems the temperature dependence of the reciprocal magnetic susceptibility
obeys a Curie law In this concentration range the iron ions are predominantly isolated orand
participate in dipole-dipole interactions At higher concentrations the reciprocal magnetic
susceptibility obeys a Curie-Weiss law with negative paramagnetic Curie temperature (p)
characteristic to antiferromagnetic coupled ions by means of super exchange interactions(fig
435) This behavior of iron ions is confirmed by the shape of the EPR spectra
80 100 120 140 160 180 200 220 240 260 2800
1
2
3
4
5
6
7
8
9
10
11
[
emu
mol
]-1
T [K]
3 mol 5 mol 10 mol 20 mol 35 mol 50 mol
Fig432 The temperature dependence of -1 for xFe2O3middot(100-x)[As2O3middotPbO] (S2)
3 x 50 mol
35
80 100 120 140 160 180 200 220 240 260 2800
1
2
3
4
5
6
7
8
9
10
T [K]
[
emu
mol
]-1
3 mol 5 mol 10 mol 20 mol 35 mol 50 mol
Fig433 The temperature dependence of -1 for xFe2O3middot(100-x)[As2O3middotTeO2] (S4)
3 x 50 mol
80 100 120 140 160 180 200 220 240 260 2800
1
2
3
4
5
6
7
8
9
10
11
3 mol 5 mol 10 mol 20 mol 35 mol 50 mol
T [K]
[
emu
mol
]-1
Fig434 The temperature dependence of -1 for xFe2O3middot(100-x)[3B2O3middotLi2O] (S6)
3 x 50 mol
36
0 10 20 30 40 50
0
10
20
30
40
50
x [mol]-
p [K]
(S2) (S4) (S6)
Fig435Concentration dependence of (p) for sistemele xFe2O3middot(100-x)[As2O3middotPbO] (S2) xFe2O3middot(100-x)[As2O3middotTeO2] (S4) and xFe2O3middot(100-x)[3B2O3middotLi2O] (S6)
for 3 x 50 mol Fe2O3
Using the representation 1 = f(T) the molar Curie constants CM the effective
magnetic moments and molar fraction of Fe3+(x1) şi Fe2+(x2) ions were calculated and
represented in tables 47-9
Table 47 Molar Curie constants effective magnetic moments and molar fraction of
Fe3+(x1) şi Fe2+(x2) ions in xFe2O3middot(100-x)[As2O3middotPbO] glasses (S2)
x [mol Fe2O3]
CMtimes102
[emu mol] ef
[microB] x1
[mol Fe23+O3]
x2 [mol Fe2
2+O3] 3 2526 58 261 039 5 393 56 332 168 10 7326 541 476 524 20 13459 519 53 147 35 23364 516 829 2671 50 32154 507 767 4233
Table 48 Molar Curie constants effective magnetic moments and molar fraction of
Fe3+(x1) şi Fe2+(x2) ions in xFe2O3middot(100-x)[As2O3middotTeO2] glasses (S4)
x [mol Fe2O3]
CMtimes102
[emu mol] ef
[microB] x1
[mol Fe23+O3]
x2 [mol Fe2
2+O3] 3 2571 585 277 023 5 4016 566 363 137 10 7911 562 686 314 20 14992 521 643 929 35 22676 509 601 2899 50 30959 497 313 4687
37
Table 49 Molar Curie constants effective magnetic moments and molar fraction of Fe3+(x1) şi Fe2+(x2) ions in xFe2O3middot(100-x)[3B2O3middotLi2O] glasses (S6)
The results allowed to consider that the magnetic properties of the studied glasses can
be explained through magnetic interractions between Fe3+ - Fe3+ Fe3+- Fe2+ and Fe2+- Fe2+ that
explain the dependences of RPE parameters concentration
SELECTED CONCLUSIONS
In this thesis xMOmiddot(100-x)[As2O3middotTeO2] xMOmiddot(100-x) [As2O3middotPbO] and
xMOmiddot(100-x)[3B2O3middotLi2O] glasses where MO =gt MnO or Fe2O3 were comparatively
studied in 0 le x le 50 mol The structural modifications of investigated glass matrices were
comparatively followed in function of the manganese or iron ions on the investigated glass
matrices were followed
The study by FT-IR spectroscopy shows that the evolution of the spectra of
xMnOmiddot(100-x) [As2O3middotPbO] with the addition and the increasing of the MnO content suggest
that the manganese ions break up a part of As ndash O ndash As Pb ndash O ndash Pb and probably of As ndash O ndash
Pb bonds The addition of MnO in the As2O3middotPbO glass matrix is leading to a disordering of
the glasses structure with the increasing of the MnO content
The evolution of the absorption bands for FT ndash IR spectrum of xFe2O3middot(1-x)
[As2O3middotPbO] glasses are determined by the addition of Fe2O3 content It can be observed to
shift the bands assigned As ndash O ndash As vibrations from AsO3 units due to changing to length As
ndash O ndash As bonds and interne angles of AsO3 units disappears PbO4 units and appears FeO6
units The addition of Fe2O3 in the As2O3middotPbO glass matrix determined a disordering of the
glasses structure with the increasing of the Fe2O3 content
From FT-IR absorption spectra of the investigated xMOmiddot(100-x)[As2O3middotTeO2] glasses
system where MO =gt MnO or Fe2O3 it can be observed that the addition and increasing of
manganese ions concluded the contraction of As-O-As bonds from totally symmetric
x [mol Fe2O3]
CMtimes102
[emu mol] ef
[microB] x1
[mol Fe23+O3]
x2 [mol Fe2
2+O3] 3 2542 582 268 032 5 3943 561 338 162 10 7423 544 506 494 20 13568 520 549 1451 35 23094 513 731 2769 50 31746 503 584 4416
38
stretching vibrations of AsO3 units for x ge10 mol there can be an increase in number of As-
O-As bonds from AsO3 units orand a length these linkage to doubly degenerate stretching
vibrations of AsO3 units and a stretching vibration mode of TeO3 tp with NBO It can be
remarked from the FT-IR absorption spectra the gradual transformation of symmetric
stretching vibration mode of Te-O bonds from TeO3 units in TeO4 (tbp) units and the presence
of MnO2 units Once with the addition of iron ions the xFe2O3middot(100- x)[As2O3middotTeO2]
glasses behave like xMnOmiddot(100-x)[As2O3middotTeO2] glasses but in this system the
appearance of FeO6 units can be seen
From FT-IR spectra in xMOmiddot(100-x)[3B2O3middotLi2O] glasses where MO =gt MnO or
Fe2O3 can be concluded that the addition of manganese or iron ions in vitreous matrices leads
to the increase of the disorder degree
The study by Raman spectroscopy shows that the evolution of the spectra the addition
of MnO in the [As2O3middotPbO]glass matrix determined an order degree of the vitreous matrix
The intensity of the bands attributed vibrations As ndash O ndash As bonds from As2O units and
bending vibrations of As ndash O ndash As from As2O units shift to a higher wave length that suggests
an increase in the As2O units comparative to AsO3 units With the increase of iron ions content
in the As2O3middotPbO glass matrix the number of these structural units decreases due to the
increasing of the disorder in the studied glasses
With the increasing of manganese content in As2O3TeO2 glass matrix the intensity
of these bands is increasing showing that the manganese content favorites the formation of
TeO4 (tbp) and TeO3 (tp) units For high concentrations of iron ions in xFe2O3middot(100-
x)[As2O3 TeO2] system of glasses the number of As-O-As linkages appear in Raman
spectrum due to stretching vibrations of As-O-As and vibrations of the continuous TeO4 (tbp)
network show a significant decrease
Studying the Raman spectra of xMOmiddot(1-x)[3B2O3middotLi2O] glass system where MO =gt
MnO or Fe2O3 it has been observed that the absorption bands presented in vitreous matrix
gradually decreased with an increase in the manganese or iron content in both glasses system
which suggested an increase of the disorder in these vitreous systems
The EPR spectra presents the behavior of manganese or iron ions in different vitreous
matrices xMOmiddot(100-x)[As2O3middotBO] where MO=gtMnO or Fe2O3 and BO =gt TeO2 or
PbO and xMOmiddot(100-x) [3B2O3middotLi2O] Glasses were investigated by EPR spectroscopy on a
large compositional range with 0 le x le 50 mol The absorption line centered at gef 43 and
is due to isolated Mn2+ ions The absorption line centered at gef 20 may be attributed to
Mn2+ species interacting by magnetic coupling dipolar and or super exchange the last ones
forming magnetic clusters The EPR spectra of Fe3+ in xFe2O3middot(100-x)[As2O3middotPbO]
xFe2O3middot(100-x)[As2O3middotTeO2] and xFe2O3middot(1-x)[3B2O3middotLi2O] are presented two absorption
lines centered at gef 43 and gef 20 up to x le 35mol Fe2O3 systems studied
39
The absorption line centered at gef 43 is due to isolated Fe3+ ions The absorption
line centered at gef 20 may be attributed to Fe3+ species interacting by magnetic coupling
dipolar and or super exchange the last ones forming magnetic clusters
The evolution of the spectra is easier to follow considering the dependence of
concentration on the EPR parameters the line - intensity (obtained as an integral of the area
under the corresponding EPR signal) J and the line - width ΔB The evolution of J and AB
reflects the structural transformations which appear in the glass matrices due to the increase of
manganese ions content
The magnetic susceptibility data are in good agreement with the EPR result The
magnetic behavior of the glasses from xMnOmiddot(100-x)[As2O3middotBO] where BO =gt TeO2 (S3)
or PbO (S1) and xMnOmiddot(100-x)[3B2O3middotLi2O] (S5) glasses for 3 le x le 50 mol MnO
For (S1) and (S3) system glasses up to x 3 mol and x 5 mol (S5) glass
system the temperature dependence of the reciprocal magnetic susceptibility obeys a Curie
law In this concentration range the manganese ions are predominantly isolated orand
participate in dipole-dipole interractions At higher concentrations the reciprocal magnetic
susceptibility obeys a Curie-Weiss law with negative paramagnetic Curie temperature (p)
characteristic to antiferromagnetic coupled ions by means of super exchange interractions This
behavior of manganese ions is confirmed by the shape of the EPR spectra Using the
representation 1 =f(T) the molar Curie constants CM the effective magnetic moments
and molar fraction of Mn2+(x1) şi Mn3+(x2) ions were calculated The magnetic susceptibility
data are in good agreement with the EPR result
The magnetic behavior of the glasses xFe2O3middot(100-x)[As2O3middotPbO] (S2)
xFe2O3middot(100-x)[As2O3middotTeO2] (S4) and xFe2O3middot(100-x)[3B2O3middotLi2O] (S6) for 3 x 50
mol Fe2O3 are presented For (S2) glass systems up to x 10 mol x 3 mol (S5)
glass systems and x 5 mol (S6) glass systems the temperature dependence of the
reciprocal magnetic susceptibility obeys a Curie law In this concentration range the iron ions
are predominantly isolated orand participate in dipole-dipole interactions At higher
concentrations the reciprocal magnetic susceptibility obeys a Curie-Weiss law with negative
paramagnetic Curie temperature (p) characteristic to antiferromagnetic coupled ions by
means of super exchange interactions(fig 435) This behavior of iron ions is confirmed by the
shape of the EPR spectra Using the representation 1 = f(T) the molar Curie constants
CM the effective magnetic moments and molar fraction of Fe3+(x1) şi Fe2+(x2) ions were
calculated
40
REFERENCES
Chapter 1
[1] I Ardelean bdquoIntroducere icircn studiul materialelor oxidice cu structură vitroasă EdNapocaStar Cluj Napoca 2002 [2] G Srinivasarao N Veeraiah J All Com 327 52-65(2001) [3] G Srinivasarao N Veeraiah J Phys Chem Solids 63705-717(2002) [4] DBecherescu VCristea FMarx IMenessz FWinter Chimia stării solide Ed Şt şi Encicl Bucucureştivol 1 1983 [5] J Wong CAAngell Glass-Structure by Spectroscopy Dekker Inc New York 1976 [6] BEWarren HKKrutter O Morningstat J Am Ceram Soc 19 202 (1936) [7] LLSperry JD Mackenzie Phys Chem Glasses 9 91 (1968) [8] WLKonijnendijk JMStevels J Non-Cryst Solids 18 307 (1975) [9] FCEversteyn JM Stevels HJ Naterman Phys Chem Glasses 1 134 (1963) [10] G Fuxi Optical and Spectroscopie Properties of Glass Springer-Verlag Shanghai Scientific Technical Pub Shanghai 1991 [11] YDYiannopoulos GDChryssikos EIKamitsos Phys Chem Glasses 42(3) 164 (2001) [12] MGFerreira da Silva BFOCosta J Non-Cryst Solids 293-295 534 (2001) [13] RYordanova YDimitriev VDimitriev S Kassabov DKlissurski JNon-Cryst Solids 201 141 (1996) [14] W L Konijnendijk J M Stevels J Non-Cryst Solids 18 307 (1980) [15] M Iron M Couzi ALevasseur JBrethous JSolidState Chem 31 285 (1980) [16] TFurukawa WBWhite PhzsChemGlasses 21 85 (1980) [17] E I Kamitsos M A Karakassides GD Chryssikos J Phys Chem 90 4528 (1986) [18] E I Kamitsos M A Karakassides GD Chryssikos J Phys Chem 91 1073 (1987) [19] TWBril Philips Res Rep Suppl 2 117 (1976) [20] E I Kamitsos M A Karakassides GD Chryssikos J Phys Chem 30 203 (1989) [21] BNMeera JRamakrishna J Non-Cryst Solids 159 1 (1993) [22] KWitke THubert PReich JRamanSpectr 24 407 (1993) [23] E I Kamitsos M A Karakassides Phys Chem Glasses 30 19 (1989) [24] MPeteanu Teză de doctoratrdquo Universitatea Babeş-Bolyairdquo Cluj Napoca (1989) [25] PCTaylor PJBray JPhys Chem Solids 33 43 (1972) [26] IArdelean MPeteanu GhIlonca DPop Solid State Commun 33 653 (1980) [27] AV De Wijn RE Van Balderen JKemPhys 46 4 (1967) [28] DL Griscom RE Griscom J Phys Chem Glasses 12 19 (1971) [29] JWH Schreurs JChem Phys 69 2151 (1978) [30] AlNicula M Peteanu IArdelean Studia Univ Babeş-Bolyai Physica 2 65 (1979) [31] M Peteanu IArdelean SFilip ITodor GSalvan Studia Univ Babeş-Bolyai Physica XL 2 9 (1995) [32] IArdelean M Peteanu SFilipV Simon ITodor Solid State Commun 105 (5) 339 (1998) [33] SKMendiratta EGuedes de Sousa JMatSci Lett7 733 (1988) [34] IArdelean M Peteanu SFilip V Simon GGyorffy Solid State Commun 102 (4) 341 (1997) [35] IArdelean M Peteanu SFilip V Simon FCiorcas ITodor JMagnMagn Mat 196-197 257 (1999) [36] JKliava RBerger YServant JEmery JMGreneche JTrokss J Non-Cryst Solids 202 205 (1996) [37] LDBogomolova NA Krasilnikova VLBogdanov VDKhaliev VV Mitrofanov J Non-Cryst Solids 188 130 (1995) [38] DLoveridge SPark PhysChem Glasses 12 19 (1971) [39] IArdelean G Salvan M Peteanu V Simon FCiorcas Mod PhysLett B 13 (22-23) 801 (1999)
41
[40] JLRao AMuraly EDRao J Non-Cryst Solids 202 215 (1996) [41] CPrakash S Husain RJ Singh SMollah JAlloys Compon 326 47 (2001) [42] EGuedes de Sousa SKMendiratta JMMachado Da Silva Portugal Phys 17 (3-4) 203 (1986) [43] TCastner GSNewell WCHolton CP Slichter JChem Phys 32 668 (1960) [44] SPChaudhuri SKPatra JMatSci 35 4735 (2000) [45] IArdelean HH Qiu HSakata Matt Lett 32 335 (1997) Chapter 2 [1] J Wong C A Angel Glass Structure by Spectroscopy Marcel Dekker inc New-York 1976 [2] I Ardelean bdquoIntroducere icircn studiul materialelor oxidice cu structură vitroasă EdNapocastar Cluj-Napoca 2002 [3] N Avram GH Mateescu Spectroscopia icircn infraroşu Aplicaţii icircn chimia organică Ed Tehnică Bucureşti 1968 [4] TIliescu Spectroscopie optică moleculară vibraţională şi electronică Ed Casa Cărţii de Ştiinţă Cluj- Napoca 2000 [5] S Aştilean bdquoMetode şi tehnici moderne de spectroscopie optică Ed Casa Cărţii de Ştiinţă Cluj - Napoca 2002 p 5 [6] I Ursu Rezonanţă Electronică de Spinrdquo Ed AcademieiBucureşti (1965) [7] CHHurd ContempPhys 23 (5) 469 (1982) [8] GWAnderson WDCompton JChemPhys52 6166 (1970) [9] MS Seehra GSrinivasan Landolt-Bornstein (New Series) SubVolume F3 Springer-Verlag Berlin 1994 [10] GToulouse ContempPhys 2115 (1977) [11] NMMurayMagnetic susceptybility EdInterscience New York P1773 1963 [12] JBGoodenough Magnetism and Chemical Bond EdInterscience New York 1963 [13] IArdelean G Salvan M Peteanu V Simon FCiorcas Mod PhysLett B 13 (22-23) 801 (1999) [14] IArdelean MPeteanu R Ciceo Lucăcel Studii de rezonanţă paramagnetică electronică şi magnetice ale unor ioni 3d icircn sticle pe bază de B2O3 Ed Presa Univesitară Clujeană 2005 [15] IArdelean PhysStatSol (b) 87K137 (1978) [16] IArdelean Solid State Commun 31 75 (1979) [17] EJFrieble LKWilson AWDozier DLKinser PhysStatSol (b) 45 323 (1971) [18] DWMoon JMAitken RKMcCrone GS Ciloszik PhysChe Glasses 16 (5) 91 (1975) [19] SFilip Teză de doctorat UnivBabeş-Bolyai Cluj Napoca 1996 [20] CJSchinkel GWRathenou Physics of Non-Crystaline Solids North Holland Publ Co Amsterdam 215 1965 [21] EJFrieble LKWilson NCKoon DLKinser JAm Ceram Soc 57-237 (1974) [22] RJLandry JT Fournier CGYoung JChemPhys 46 1285 (1967) [23] WSimpson PhysStatSolidi b40 207 (1970) [24] RHasegawa PhysRevB b(5) 1631 (1971) [25] IArdelean GhIlonca MPeteanu Solid State Commun 52 145 (1984) [26] IArdelean GhIlonca OCozar J Physique 49 C8 1107 (1988) Chapter 3 [1] LFBates Modern Magnetism p133 Cambridge University Press London 1962 [2] IArdelean GhIlonca DBarbos Solid State Commun 40 769 (1981) [3] EBurzo IUrsu DUngur IArdelean JMatSci 15 581 (1980) [4] EBurzo IUrsu DUngur IArdelean MatResBull 15 1273 (1980) [5] DLGriscom Glass Science and Technology 48 151 (1990) [6] PJBray AH Silver Modern aspects of the vitreous state vol1 Butterworth
42
London 1960 [7] IArdelean Teza de doctorat UnivBabeş-Bolyai Cluj Napoca 1979 [8] SAştilean bdquoMetode şi tehnici moderne de spectroscopie opticărdquo EdCasa Cărţii de Ştiinţă Cluj ndash Napoca 2002 p5 [9] IArdelean RCiceo-Lucăcel ldquoFizica şi Tehnologia Materialelor Oxidice Lucrări Practicerdquo Ed Univ ldquoBabeş-Bolyairdquo Cluj-Napoca 2000 [10] VPop IChicinaş NJumate Fizica materialelor Metode experimentalerdquo EdPresa Universitară Clujeană 2001 [11] IUrsu Rezonanţă electronică de spinrdquo EdAcademiei Bucureşti 1965 Chapter 4 [1] I Ardelean S Lupşor D Rusu Solid State Sci 10 1384(2008) [2] I Ardelean S Lupşor D Rusu trimis spre publicare la Physica B decembrie 2009 [3] P Tarte Spectrochim Acta 18 467 (1962) [4] R A Condrate J Non ndash Cryst Solids 84 26 (1986) [5] G Srinivasarao N Veeraiah Phys Stat Sol (a) 191 370(2002) [6] G Srinivasarao N Veeraiah J Phys Chem Solids 63 705(2002) [7] G Srinivasarao N Veeraiah J All Com 327 52 (2001) [8] DK Durga N Veeraiah Bull Mater Sci 24 (4) 421 (2001) [9] F F Bentley L D Smithson A L Rozek InfraredndashSpectra and Characteristic Frequencies 700-300 cm-1 Interscience New York 1968 p 103 [10] O Noguera T Merle-Mejean AP Mirgorodsky MB Smirnov P Thomas J-C Champarnaud-Mesjard J Non-Cryst Solids 330 50 (2003) [11] BVR Chowdari KL Tan Fang Ling Solid State Ionics 113 ndash 115 711(1998) [12] C Jiang J Zhang H Mao F Gan Glass Technol 39(6) 200(1998) [13] MR Sahar K Sulhadi MS Rohani J Mater Sci 42 824(2007) [14] C Horea D Rusu I Ardelean J Mater Sci Mater Electron 20 905(2009) [15] GE Rachkovskaya GB Zakharevich J Appl Spectrosc 74 86(2007) [16] I Ardelean S Lupşor D Rusu trimis spre publicare la Journal of Materials Science Materials in Electronics decembrie 2009 [17] I Ardelean S Lupşor D Rusu trimis spre publicare la Modern Physics Letters B decembrie 2009 [18] R Iordanova Y Dimitriev V Dimitrov S Kassabov D Klissurski J Non ndash Cryst Solids 231 227 (1998) [19] R Iordanova Y Dimitriev S Kassabov D Klissurski J Non ndash Cryst Solids 204 141 (1996) [20] J O Jensen S J Gilliam A Banerjee D Zeroka S J Kirkby C N Merrow J Mol Struct (Theochem) 664 145 (2003) [21] G N Papatheodorou S A Solin Solid State Commun 16 5 (1975) [22] BVR Chowdari KL Tan Fang Ling J Mat Sci 35 2015 (2000) [23] R C Lucacel C Marcus V Timar I Ardelean Solid State Sci 9 850 (2007) [24] CP Varsamis EI Kamitsos GD Chryssikos Solid State Ionics 136ndash137 1031 (2000) [25] Sherief M Abo-Naf Fatma H El Batal Moenis A Azooz Mat Chem Phys 77 846 (2002) [26] SG Motke SP Yawale SS Yawale Bull Mater Sci 25 (10) (2002) [27] R Akagi N Ohtori N Umesaki J Non ndash Cryst Solids 293 471(2001) [28] E I Kamitsos M A Karakassides G D Chryssikos J Phys Chem 91(5) 1073 (1987) [29] H Ushida Y Iwadate T Hattori S Nishiyama K Fukushima Y Ikeda M Yamaguchi M Misawa T Fukunaga T Nakazawa S Jitsukawa J Alloys Compd 377 167 (2004) [30] I Ardelean F Ciorcas M Peteanu S Lupşor G Salvan Balkan Phys Lett 5 860 (1997)
43
[31] I Ardelean M Peteanu V Simon O Cozar F Ciorcas S Lupşor J Magn Magn Mater 196 253 (1999) [32] IArdelean MPeteanu GhIlonca Phys Stat Sol (a) 58 K33(1980) [33] IArdelean MPeteanu R Ciceo-Lucăcel ldquoStudii de rezonanţă paramagnetică electronică şi magnetice ale unor ioni 3d icircn sticle pe bază de B2O3rdquo Ed Presa Univ Clujeană Cluj Napoca 2005 p 171 [34] JLRao AMuraly EDRao J Non-Cryst Solids 202 215 (1996) [35] RPSChakradhar AMurali JLRao Optical Mat 10 109 (1998) [36] IArdelean MPeteanu SFilip VSimon GGyorffy Solid State Commun 102(4) 341 (1997) [37] IArdelean MPeteanu VSimon SFilip FCiorcaş ITodor J Magn Magn Mat 196-197 257 (1999) [38] IArdelean GSalvan MPeteanu VSimon CHimcinschi FCiorcas Mod Phys Lett B 13(22-23) 801 (1999) [39] IArdelean HHQiu HSakata Mat Lett 32 335 (1997) [40] SPChaudhuri SKPatra J Mat Sci 35 4735 (2000) [41] I Ardelean M Peteanu V Simon G Salvan J Mat Sci Technol 18 (3) 1 (2002)

9
400 600 800 1000 1200
Wavenumber [cm-1]
Abs
orpt
ion
[au
]
407
594
821
794
1119
As2O
3PbO
a)
a
400 600 800 1000 1200
As2O3TeO2
Abs
orpt
ion
[ua
]
Wavenumber [cm-1]
85473
3
644
1119
b)
b
Fig41 FT ndash IR spectra of vitreous matrices a As2O3middotPbO şi b As2O3middotTeO2
The FT ndash IR spectrum of As2O3middotPbO glass matrix presents five absorption bands at ~
1119 cm-1 ~ 821 cm-1 ~ 794 cm-1 ~ 594 cm-1 and ~ 407 cm-1(Fig41a)
The band from ~ 1119 cm-1 is due to totally symmetric stretching vibrations of AsO3
units [5 ndash 7] The bands from ~ 821 cm-1 and ~ 794 cm-1 are due to doubly degenerate
stretching vibrations of AsO3 structural units [5 ndash 7] The large band centered at ~ 594 cm-1 can
be due to totally symmetric bending vibrations of AsO3 structural units [5-7] The band from ~
407 cm-1 can be due to vibrations of Pb ndash O bonds from PbO4 structural groups [7]
Following As2O3TeO2 glass matrix spectrum presented in Fig 41b four bands can be
observed located at ~ 644 cm-1 ~ 733 cm-1 ~ 854 cm-1 and ~ 1119 cm-1 The band from ~ 644
cm-1 can be assigned to totally symmetric bending vibrations of AsO3 units [5-7] and also
stretching vibration mode of TeO4 tbp with bridging oxygen[11] The band from ~ 733 cm-1
can be assigned to the symmetric stretching vibration mode of Te-O bonds in TeO3 units
[15] The band from ~ 854 cm-1 can be assigned to doubly degenerate stretching vibrations of
AsO3 units [5-7] and also to the stretching vibration mode of TeO3 tp with NBO [11] The band
10
from ~ 1119 cm-1 can be assigned to totally symmetric stretching vibrations of AsO3 units [5-
7] These bands presented in As2O3TeO2 glass matrix spectrum confirm the presence of
AsO3 TeO4 tbp and TeO3 tp units in the structure of the glass matrix but due to the broadness
of the bands it can not be told for sure which one of these units is predominant
Table 41Wavenumber and the structural assignments of FT ndash IR spectra of
As2O3middotPbO and As2O3middotTeO2 vitreous matrices
~ [cm 1 ]
As2O3middotPbO As2O3middotTeO2
Attribution
~1119 cm-1
~ 1119 cm-1
Totally symmetric stretching vibrations of AsO3 units
~ 821cm-1
Doubly degenerate stretching vibrations of AsO3 structural units
~ 854 cm-1
Doubly degenerate stretching vibrations of AsO3 units Stretching vibration mode of TeO3 tp with NBO
~ 794 cm-1
Doubly degenerate stretching vibrations of AsO3 structural units
~ 733 cm-1
Symmetric stretching vibration mode of Te-O bonds in TeO3 units
~ 594 cm-1
~ 644 cm-1
Totally symmetric bending vibrations of AsO3 units
~ 407 cm-1 Vibrations of Pb ndash O bonds from PbO4 structural groups
412 Comparative study by FT-IR spectroscopy of
xMOmiddot(100- x)[As2O3middotPbO] vitreous systems where MO =gt MnO or Fe2O3
The infrared absorption spectra obtained for xMOmiddot(1-x)[As2O3middotPbO] glass system
where MO =gt MnO or Fe2O3 with 0 le x le 50 mol are presented in figure 42-3 and their
structural assignments are summarized in table 41
The spectra were discussed on the basis of the method given by Tarte [3] and Condrate
[4] by comparing the experimental data of glasses with those of related crystalline compounds
The characteristic absorption bands for crystalline As2O3 [5-8] PbO [79] and characteristic
bands for Fe2O3 [1819 ] were used as a reference point in the results discussion
The FT ndash IR spectra of the investigated glasses suggest a structure formed of AsO3 and
PbO4 structural units where As2O3 plays the role of the glass former and PbO plays the role of
the glass modifier The evolution of the spectra with the addition and the increasing of the
MnO content suggest that the manganese ions break up a part of As ndash O ndash As Pb ndash O ndash Pb and
probably of As ndash O ndash Pb bonds The addition of MnO in the As2O3middotPbO glass matrix is leading
to a disordering of the glasses structure with the increasing of the MnO content
The evolution of the absorption bands for FT ndash IR spectrum of xFe2O3middot(1-x)
[As2O3middotPbO] glasses are determined by the addition of Fe2O3 content It can be observed to
11
shift the bands assigned As ndash O ndash As vibrations from AsO3 units due to changing to length As
ndash O ndash As bonds and interne angles of AsO3 units disappears PbO4 units and appears FeO6
units The addition of Fe2O3 in the As2O3middotPbO glass matrix determined a disordering of the
glasses structure with the increasing of the Fe2O3 content
400 600 800 1000 1200
610
813
449
1093
423
449
616
760 848
821
794
594
20A
bsor
ptio
n [a
u]
Wavenumber [cm-1]
05
0
35
10
35
50
1
MnO
407
1119
693
Fig 42 FT ndash IR spectra of xMnOmiddot(100- x)[As2O3middotPbO] glasses
400 600 800 1000 1200
616
462
811
407
594
Abs
orpt
ion
[au
]
Wavenumber [cm -1]
05
20
0
35
10
35
50
1
Fe2O3
821
79469
3
1119
1084
610
Fig43 FT ndash IR spectra of xFe2O3middot(100- x)[As2O3middotPbO] glasses
12
413 Comparative study by FT-IR spectroscopy of
xMOmiddot(100-x)[As2O3middotTeO2] vitreous systems where MO =gt MnO or Fe2O
The infrared absorption spectra obtained for xMOmiddot(1-x)[As2O3middotTeO2] glass system
where MO =gt MnO or Fe2O3 with 0 le x le 50 mol are presented in figure 44 -5 and their
structural assignments are summarized in table 41[1617] The characteristic absorption bands
for crystalline As2O3 [5-8] PbO [79] TeO2 [810-15] MnO2 and Mn3O4 [9] and characteristic
bands for Fe2O3 [1819 ] were used as a reference point in the results discussion
Fig 44 FT ndash IR spectra of xMnOmiddot(100- x)[As2O3middotTeO2] glasses
Fig45 FT ndash IR spectra of xFe2O3middot(100- x)[As2O3middotTeO2] glasses
400 600 800 1000 1200
565
422 690 830
05
Abs
optio
n [a
u]
Wavenumber [cm-1]
0
3
5
35 50
1
MnO
854 733 644
1119
10 20
400 600 800 1000 1200
462650
812
713
561
05
20
Wavenumber [cm-1]
Abs
orpt
ion
[au
]]
0
3 5
10
35 50
1
Fe2O3
854 733
644
1119
13
This behavior of the studied glasses with the addition and increasing of MnO content
suggests that the structure observed in the glass matrix is conserving up to 5 mol MnO
where the structure takes another form From a structure dominated by AsO3 TeO4 tbp and
TeO3 tp units the structure became dominated by TeO4 tbp and MnO2 units and in a small
measure of AsO3 and TeO3 tp units For higher concentrations it can not be specified exactly
which of the last two structural units have the biggest proportion in these glasses From FT-IR
absorption spectra of the investigated glass system it can be observed that the addition and
increasing of manganese ions concluded the contraction of As-O-As bonds from totally
symmetric stretching vibrations of AsO3 units for x ge10 mol there can be an increase in
number of As-O-As bonds from AsO3 units orand a length these linkage to doubly degenerate
stretching vibrations of AsO3 units and a stretching vibration mode of TeO3 tp with NBO It
can be remarked from the FT-IR absorption spectra the gradual transformation of symmetric
stretching vibration mode of Te-O bonds from TeO3 units in TeO4 (tbp) units and the presence
of MnO2 units Once with the addition of iron ions the xFe2O3middot(100- x)[As2O3middotTeO2]
glasses behave like xMnOmiddot(100-x)[As2O3middotTeO2] glasses but in this system the
appearance of FeO6 units can be seen
414 Comparative study by FT-IR spectroscopy of
xMnOmiddot(100- x)[As2O3middotBO] vitreous systems were BO =gt TeO2 or PbO
The infrared absorption spectra obtained for xMnOmiddot(100- x)[As2O3middotBO] vitreous
systems where BO =gt TeO2 or PbO with 0 le x le 50 mol MnO are presented in figure
42 and 44 Following the infrared absorption spectra it can be observed that for
xMnOmiddot(100- x)[As2O3middot PbO] glass system the most disordered structure to exist for 0
le x le 5 mol MnO and to xMnOmiddot(100-x)[As2O3middot TeO2] glass system for 1 le x le 5 mol
MnO For x ge 5 mol MnO manganese ions break up a part of As ndash O ndash As Pb ndash O ndash Pb
and probably of As ndash O ndash Pb bonds to favor the increase in number of PbO4 units and
appearance of MnO2 units For x ge 10 mol MnO observed comparatively in both system
glasses the addition of manganese ions suggests for the first system a modification in linkage
characteristic units and for the second system an improvement for structural units of As2O3middot
TeO2 vitreous matrice also linkage characteristic units
415 Comparative study by FT-IR spectroscopy of
xFe2O3middot(100-x)[As2O3middotBO] vitreous systems where BO =gt TeO2 or PbO
The infrared absorption spectra obtained for xFe2O3middot(100- x)[As2O3middotBO] vitreous
systems where BO =gt TeO2 or PbO with 0 le x le 50 mol Fe2O3 are presented in figure
43 and 45
14
The evolution of the spectra with the addition and the increasing of the Fe2O3 content
suggest that the iron ions break up a part of As ndash O ndash As Pb ndash O ndash Pb and probably of As ndash O
ndash Pb bonds It can be observed a shift in the bands assigned As ndash O ndash As vibrations from AsO3
units due to changing to length As ndash O ndash As bonds and interne angles of AsO3 units the PbO4
units disappear and FeO6 units appear For x ge 5 mol Fe2O3 observed comparatively in
both system glasses the addition of iron ions suggests for the first system a modification in
linkage characteristic units of As2O3middotPbO and for the second system an improvement for
structural units of As2O3middot TeO2 vitreous matrice also linkage characteristic units appearance
of FeO6 units in both system
416 Comparative study by Raman spectroscopy of
As2O3middotTeO2 and As2O3middotPbO vitreous matrices
In order to obtain new information regarding the role of the modifier in the
formation of vitreous matrices there were made comparative studies by Raman
spectroscopy The Raman spectroscopy are presented in figure 46(ab) The wave
length and the structural assignments of Raman spectra of As2O3middotPbO şi As2O3middotTeO2 vitreous
matrices are presented in table 42
Table 42Wavenumber and the structural assignements of Raman spectra
of As2O3middotPbO and As2O3middotTeO2 vitreous matrices
~ [cm 1 ]
As2O3middotPbO As2O3middotTeO2
Attribution
~826 cm-1
~ 816 cm-1
Stretching vibrations of As-O-As
~ 752 cm-1
Vibrations of the continuous TeO4 (tbp) network
~ 627 cm-1
Vibrations As ndash O ndash As bonds from As2O units
~ 580 cm-1
Stretching vibrations of As-O-As
~ 525 cm-1
Vibrations O-As-O bonds from AsO3 units
~ 438cm-1
Symmetric bending vibrations of Te ndash O ndash Te vertex linkages between different TeO4 (tbp) TeO3+1 polyhedra Stretching vibrations of As-O-As of AsO3 units
~ 345 cm-1
Bending vibrations of As ndash O ndash As from As2O units
15
200 400 600 800 1000
As2O3PbO
Ram
an In
tens
ity [a
u]
LWavenumber [cm-1]
345
826
525
627a)
a
200 400 600 800 1000
816
752
580 R
aman
Inte
nsity
[au
]
Wavenumber [cm-1]
As2O3TeO2
438
b)
b
Fig46 Raman spectra of vitreous matrices a As2O3middotPbO şi b As2O3middotTeO2
The Raman spectrum of As2O3middotPbO glass matrix presents four bands at 826 cm-1
627 cm-1 525 cm-1 and 345 cm-1 The band from 826 cm-1 can be assigned to As ndash O ndash
As stretching vibrations [20] The band centered at 627 cm-1 can be assigned to vibrations As
ndash O ndash As bonds from As2O units the band from 525 cm-1 are assigned vibrations O-As-O
bonds from AsO3 units [21] The band of 345 cm-1 are attributed to As ndash O ndash As bending
vibrations from As2O units[2021]
The Raman spectrum of As2O3middot TeO2 glass matrix presents four bands at 816 cm-1
752 cm-1 580 cm-1 and 438 cm-1 The band from 816 cm-1 can be assigned to As ndash O ndash
As stretching vibrations [20] The band centered at 752 cm-1 can be assigned to vibrations of
the continuous TeO4 (tbp) network [22] The band of 580 cm-1 are attributed to As ndash O ndash As
stretching vibrations [12] The band centered at 438 cm-1 can be assigned symmetric bending
vibrations of Te ndash O ndash Te vertex linkages between different TeO4 (tbp) TeO3+1 polyhedra and
As ndash O ndash As stretching vibrations of AsO3 units
16
417 Study by Raman spectroscopy of xMOmiddot(100- x)[As2O3middotPbO]
vitreous systems where MO =gt MnO or Fe2O3
The Raman spectra obtained for xMOmiddot(100- x)[As2O3middotPbO] vitreous systems where
MO =gt MnO or Fe2O3 with 0 le x le 50 mol are presented in figure 47-8 and their
structural assignments are summarized in table 42
200 400 600 800 1000
368
833
345
1
3
Lungimea de unda [cm-1]
Inte
nsita
te R
aman
[ua
]
20
05
0
5
10
35
50
MnO
826
525
627
Fig 47 Raman spectra of xMnOmiddot(100- x)[As2O3middotPbO] glasses
The addition of MnO in the glass matrix determined an order degree of the vitreous
matrix The intensity of the bands attributed vibrations As ndash O ndash As bonds from As2O units
and bending vibrations of As ndash O ndash As from As2O units shift to a higher wave length that
suggests an increase in the As2O units comparative to AsO3 units
To the band from 826 cm-1 the addition of manganese ions in the glass matrix
determine for x = 05 mol an decreasing in intensity whereupon increasing for higher
concentrations The intensity of bands centered at 627 cm-1 and 525 cm-1 for x = 05
mol MnO decrease and disappear for x = 1 mol MnO The band of 345 cm-1 slowly
increases with the addition of manganese ions
To the band from 826 cm-1 the addition of iron ions in the glass matrix determines
for x = 05 mol an increase in intensity a gradual decrease and disappearance for x = 35
mol Fe2O3 of the bands observed for the glass matrix For higher concentrations of
manganese these bands gradually decrease The intensity of bands centered at 627 cm-1 and
525 cm-1 for x = 05 mol Fe2O3 increase and shift to 612 cm-1 and 501 cm-1 whereas
17
they gradually decrease and disappear for x = 10 mol Fe2O3 The band of 345 cm-1
decreases with the addition of iron ions and disappears for x = 20 mol Fe2O3
200 400 600 800 1000
3
612
501
Wavenumber [cm-1]
Ram
an In
tens
ity [a
u]
05
20
0
5
10
3550
1
Fe2O3
345
826
525
627
Fig 48 Raman spectra of xFe2O3middot(100- x)[As2O3middotPbO] glasses
With the increase of iron ions content in the As2O3middotPbO glass matrix the number of
these structural units decreases due to the increasing of the disorder in the studied glasses
418 Study by Raman spectroscopy of xMOmiddot(100-x)[As2O3middotTeO2]
vitreous systems were MO =gt MnO or Fe2O3
The Raman spectra obtained for xMOmiddot(100- x)[As2O3middot TeO2] vitreous systems
where MO =gt MnO or Fe2O3 with 0 le x le 50 mol are presented in figure 49-10 and their
structural assignments are summarized in table 42
The Raman spectrum of the glass matrix suggests a structure formed from TeO4 (tbp)
and TeO3 (tp) units where the presence of As ndash O ndash As bonds can not be excluded The
addition of manganese ions is leading to a modification of the structure proposed by the
spectrum of the glass matrix Then with the increasing of manganese content the intensity of
these bands is increasing showing that the manganese content favorises the formation of TeO4
(tbp) and TeO3 (tp) units
18
200 400 600 800 1000
783
850
768
416
816
752
Wavenumber [cm -1]
Ram
an In
tens
ity [a
u]
13
20
05
0
5
10
35
50
MnO
438
580
660
Fig 49 Raman spectra of xMnOmiddot(100- x)[As2O3middot TeO2] glasses
200 400 600 800 1000
226
294
408
673 751
5
W avenumber [cm -1]
Ram
an In
tens
ity [a
u]
05
20
0
3
10
35
50
1
Fe2O
3
816
752
438
580
Fig 410 Raman spectra of xFe2O3middot(100- x)[As2O3 TeO2] glasses
The Raman spectra of xFe2O3middot(100- x)[As2O3 TeO2] glasses present a significant
advance to the TeO4 (tbp) TeO3+1 polyhedra and AsO3 units represented in Raman spectrum
by the ~ 438 cm-1 band comparative with the modifications determined by the addition of
manganese ions in vitreous matrix For high concentrations of iron ions in xFe2O3middot(100-
x)[As2O3 TeO2] system of glasses the number of As-O-As linkages appear in Raman
spectrum due to stretching vibrations of As-O-As and vibrations of the continuous TeO4 (tbp)
network show a significant decrease
19
419 Comparative study by Raman spectroscopy of xMnOmiddot(100- x)[As2O3middotBO]
vitreous systems were BO =gt TeO2 or PbO
The addition of MnO to xMnOmiddot(100- x)[As2O3middotPbO] glass system do not break As
ndash O ndash As bonds into characteristic units and contribute to their prominence The addition of
manganese ions to xMnOmiddot(100- x)[As2O3middot TeO2] glass system for x=50mol MnO
determined the splitting up of a part of As ndash O ndash As Te-O-Te and the appearance of the
TeO4 (tbp) units against the loss of continuous TeO4 (tbp) network was observed
4110 Comparative study by Raman spectroscopy of xFe2O3middot(100- x)[As2O3middotBO]
vitreous systems where BO =gt TeO2 or PbO
With the increasing of iron ions content in the As2O3middotPbO glass matrix the number of
these structural units decreased due to the increase of the disorder in the studied glasses (x gt 20
mol ) and x = 50 mol Fe2O3 for xFe2O3middot(100- x)[As2O3middotTeO2] when iron ions
brought the structural units existing in glass matrices and favoured the appearace of
new bands due to bending vibrations of As ndash O ndash As
42 Comparative study by FT-IR and Raman spectroscopies of
xMOmiddot(100-x)[3B2O3middotLi2O] glasses where MO =gt MnO or Fe2O3
421 Study by FT-IR spectroscopy of xMOmiddot(100-x)[3B2O3middotLi2O] glasses
where MO =gt MnO or Fe2O3
The infrared absorption spectra obtained for xMOmiddot(1-x)[3B2O3middotLi2O] glass system
where MO =gt MnO or Fe2O3 with 0 le x le 50 mol are presented in figure 411-13 and their
structural assignments are summarized in table 43
500 1000 1500
3B2O3Li2O
Wavenumber [cm-1]
Abs
orpt
ion
[au
]
490
1400
1230
1061
698
614
460 78
6
Fig 411 FT ndash IR spectra of vitreous matrix 3B2O3middotLi2O
20
Following the infrared absorption spectra obtained for 3B2O3middotLi2O vitreous matrix
observed on eight bands ~ 1400 cm-1 ~ 1230 cm-1 ~ 1061 cm-1 ~ 786 cm-1 ~ 698 cm-
1 ~ 614 cm-1 ~ 490 cm-1 şi ~ 460 cm-1 The band at ~ 1400 cm-1 is assigned to
asymmetric stretching vibrations from BOslash3 şi BOslash2O- groups (Oslash represent oxygen atom
bridging two boron atoms) The band at ~ 1230 cm-1 is attributed to asymmetric stretching
vibrations of B ndash O bonds from triangular ortoborate BO 33 groups [23-26]
400 600 800 1000 1200 1400 1600
0
3
5
10
20
35
50
1
Wavenumber [cm-1]
Abs
orpt
ion
[ua
]
05
MnO
490
1400
1230
1061
698
614
460 78
6
Fig 412 FT ndash IR spectra of xMnOmiddot(100-x)[3B2O3middotLi2O] glasses
400 600 800 1000 1200 1400 1600
469
Wavenumber [cm-1]
Abs
orpt
ion
[ua
]
0
3
5
10
20
35
50
1
05
Fe2O3
490
1400
1230
1061
698
614
460 78
6
Fig 413 FT ndash IR spectra of x Fe2O3middot(100-x)[3B2O3middotLi2O] glasses
21
Table 43Wavenumber and the structural assignments of FT ndash IR and Raman
spectra of 3B2O3middotLi2O vitreous matrix
~ [cm 1 ] Attribution
FT ndash IR Raman FT ndash IR Raman
~ 1400 cm-1
~ 1400 cm-1
Asymmetric stretching
vibrations from BOslash3 şi BOslash2O-
groups
BOslash2O- triangles linked to
other borate triangular units
~ 1230 cm-1
Asymmetric stretching
vibrations of B ndash O bonds from
triangular ortoborate
BO 33 groups
~ 1061 cm-1
~ 1074 cm-1
Stretching vibrations of B ndash Oslash
bonds in -4BOslash tetrahedra from
tri- tetra- and penta-borate
groups
Diborate groups
~ 902 cm-1
Vibrations of orthoborate
groups
~ 786 cm-1
~ 791 cm-1
Bending vibrations of O3B ndash O
ndash BO4 bonds
Vibrations of rings with six
member to one or two BO4
tetrahedral from tri- tetra ndash
and penta ndash borate units
~ 698 cm-1
Bending vibrations of B-O-B
bonds from pentaborate groups
~ 614cm-1 Bending vibrations of O ndash B ndash O
bonds
~ 490cm-1 ~ 471cm-1 Bending vibrations of B-O-B
bonds
Isolated diborate groups
~ 460cm-1 Bending vibrations of O ndash B ndash O
bonds
22
The band at ~ 1061 cm-1 is assigned to stretching vibrations of B ndash Oslash bonds in -4BOslash
tetrahedra from tri- tetra- and penta-borate groups and the band at ~ 786 cm-1 is assigned
to bending vibrations of O3B ndash O ndash BO4 bonds The band at ~ 698 cm-1 is attributed to
Bending vibrations of B-O-B bonds from pentaborate groups The bands at ~ 614 cm-1 and
~ 460 cm-1 are assigned to bending vibrations of O ndash B ndash O bonds and the band at ~ 490 cm-
1 is assigned to bending vibrations of B-O-B bonds
From FT-IR spectra it can be concluded that the addition of manganese or iron ions in
vitreous matrices leads to the increase of the disorder degree
Also the structural changes that appeared in 3B2O3middotLi2O vitreous matrix with an
addition MnO or Fe2O3 content can be studied Ar=A4A3 ratio(A4 - relative number of -4BOslash tetrahedral borate units A3 - relative number of triangular (BOslash3 and BOslash2O-) units
0 10 20 30 40 50
010
015
020
Ar
x [mol]
MnO Fe2O3
Fig 414 The evolution of Ar ratio with the MnO or Fe2O3 content of
xMnOmiddot(100-x)[3B2O3middotLi2O] şi xFe2O3middot(100-x)[3B2O3middotLi2O] The evolution of the value of this ratio also allows a visualization of the effects
determined by the presence of the manganese or iron ions in the matrix The value Arltlt 1
indicated that BO3 is dominant related to BO4
422 Study by Raman spectroscopy of xMOmiddot(100-x)[3B2O3middotLi2O] glasses
where MO =gt MnO or Fe2O3
The Raman spectra obtained for xMOmiddot(1-x)[3B2O3middotLi2O] glass system were MO =gt
MnO or Fe2O3 with 0 le x le 50 mol are presented in figure 414-16 and their structural
assignments are summarized in table 43
Studying the Raman spectra of xMOmiddot(1-x)[3B2O3middotLi2O] glass system where MO =gt
MnO or Fe2O3 it has been observed that the absorption bands presented in vitreous matrix
gradually decreased with an increase in the manganese or iron content in both glasses system
which suggested an increase of the disorder in these vitreous systems
23
1000 2000 3000
B2O3Li2O
Wavenumber [cm-1]
Ram
an In
tens
ity [a
u]
1430
107490
279
1471
Fig 415 Raman spectra of vitreous matrix 3B2O3middotLi2O
500 1000 1500 2000 2500 3000
1430
107490
2791
0
Wavenumber [cm-1]
Ram
an In
tens
ity [a
u]
1
3
20
05
5
10
35
50
MnO
471
Fig 416 Raman spectra of xMnOmiddot(100-x)[3B2O3middotLi2O] glasses
400 600 800 1000 1200 1400 1600
Wavenumber [cm-1]
Ram
an In
tens
ity [a
u]
0
1
3
20
05
5
10
35
50
Fe2O3
1430
1074
90279
1
471
Fig 417 Raman spectra of x Fe2O3middot(100-x)[3B2O3middotLi2O] glasses
24
43 Comparative study by electron paramagnetic resonance (EPR) and magnetic
susceptibility measurements of xMOmiddot(100-x)[As2O3middotTeO2] xMOmiddot(100-x)
[As2O3middotPbO] and xMOmiddot(100-x)[3B2O3middotLi2O] glasses where MO =gt MnO or Fe2O3
431 Comparative study by electron paramagnetic resonance (EPR) of
xMnOmiddot(100-x)[As2O3middotBO] where BO =gt TeO2 or PbO
and xMnOmiddot(100-x) [3B2O3middotLi2O] glasses
In order to obtain more information regarding the behavior of manganese ions in
different vitreous matrices [3031] xMnOmiddot(100-x)[As2O3middotBO] where BO =gt TeO2 or PbO
and xMnOmiddot(100-x) [3B2O3middotLi2O] glasses were investigated by EPR spectroscopy on a large
compositional range with 0 le x le 50 mol The EPR spectra of Mn2+ for xMnOmiddot(100-
x)[As2O3middotPbO] (S1) xMnOmiddot(100-x)[As2O3middotTeO2] (S3) and xMnOmiddot(100-x)[3B2O3middotLi2O]
(S5) are presented in figure 418-20 These spectra present two absorption lines centered at gef
43 and gef 20 in all systems
The absorption line centered at gef 43 and is due to isolated Mn2+ ions [32] The
absorption line centered at gef 20 may be attributed to Mn2+ species interacting by magnetic
coupling[33] dipolar and or super exchange the last ones forming magnetic clusters [32]
The evolution of the spectra is easier to follow considering the dependence of
concentration on the EPR parameters the line - intensity (obtained as an integral of the area
under the corresponding EPR signal) J and the line - width ΔB The evolution of J and AB
reflects the structural transformations which appear in the glass matrices due to the increase of
manganese ions content
The intensity and the line - width of the resonance line from gef 43 for all
investigated systems is represented in figure 421(ab)
The intensity of the resonance line from gef 43 for all investigated glass systems
decreases due to the decrease of the isolated manganese ions numbers The line - width from
gef 43 for (S1) and (S3) systems decreases due to decrease of Mn2+ number and to the
structural disorder in glasses with the increase of MnO content For (S5) glass system the line
- width of the resonance line there is an increase in all compositional domains
The intensity of the resonance line from gef 20 can be observed as increasing up to
x=14 mol for (S1) system up to x=8mol for (S3) system and 20 mol for (S5)
system The line - width of the resonance line from gef 20 for (S1) and (S3) systems
increases up to 3 mol and 5mol for (S5) due to Mn2+ species interacting by magnetic
coupling dipole- dipole as the main broadening mechanism Over this concentration line ndash the
width of the resonance line from gef 20 is straight and it can be assumed that the
manganese ions begin to manifest super exchange magnetic interactions
25
1000 2000 3000 4000 5000
Firs
t der
ivat
ive
of a
bsor
ptio
n [u
a]
05
1
3
5
10
20
35
50
x [mol Mn2O3]amplif
B [G]
10
200
40
80
400
5
1
1
Fig 418 The EPR spectra of Mn2+ for xMnOmiddot(100-x)[As2O3middotPbO] (S1)
glass system
1000 2000 3000 4000 5000
Firs
t der
ivat
ive
of a
bsor
ptio
n [u
a]
x [mol MnO]
051
3
5
10
20
35
50
9
500
400
50
100
4
1
amplif
B [G]
1
Fig 419 The EPR spectra of Mn2+ for xMnOmiddot(100-x)[As2O3middotTeO2] (S3)
glass system
26
1000 2000 3000 4000 5000
501
B [G]
Firs
t der
ivat
ive
of a
bsor
ptio
n [u
a]
1
4
9
10
30
60
100
amplif
05
1
3
5
10
20
35
x [mol MnO]
Fe3+
Fig 420 The EPR spectra of Mn2+ for xMnOmiddot(100-x)[3B2O3middotLi2O] (S5)
glass system
0 2 4 6 8 10 12 14 16 18 20 22
x [mol]
J [ u
a]
S1 S3 S5
-2 0 2 4 6 8 10 12 14 16 18 20 22
50
100
150
200
250
300
S1 S3 S5
x [mol]
B
[G]
a b
Fig 421 The dependence on MnO content of the intensity (a) and width(b) of resonance
line at gef 43 for xMnOmiddot(100-x)[As2O3middotPbO] (S1) xMnOmiddot(100-x)[As2O3middotTeO2] (S3) şi
xMnOmiddot(100-x)[3B2O3middotLi2O] (S5) system glasses
27
0 10 20 30 40 50
x [mol]
J [ u
a]
S1 S3 S5
0 10 20 30 40 50
400
500
600
700
800
900
S1 S3 S5
x [mol]
B[G
]
a b
Fig 422 The dependence on MnO content of the intensity (a) and width b) of resonance
line at gef 20 for xMnOmiddot(100-x)[As2O3middotPbO] (S1) xMnOmiddot(100-x)[As2O3middotTeO2] (S3) and
xMnOmiddot(100-x)[3B2O3middotLi2O] (S5) system glasses
Following figure 418-20 it can be observed that (S1) and (S3) have had a similar
evolution but (S5) system presented for 05 le x le 5 mol (fig420) has a hyperfine
sextet[33] at gef 20due to Mn2+ isolated ions
432 Comparative study by magnetic susceptibility measurements of
xMnOmiddot(100-x)[As2O3middotBO] where BO =gt TeO2 or PbO and
xMnOmiddot(100-x)[3B2O3middotLi2O] glasses
The magnetic susceptibility data are in good agreement with the EPR result The
magnetic behavior of the glasses from xMnOmiddot(100-x)[As2O3middotBO] where BO =gt TeO2 (S3)
or PbO (S1) and xMnOmiddot(100-x)[3B2O3middotLi2O] (S5) glasses for 3 le x le 50 mol MnO are
presented in figure 423 - 25
For (S1) and (S3) system glasses up to x 3 mol and x 5 mol (S5) glass
system the temperature dependence of the reciprocal magnetic susceptibility obeys a Curie
law In this concentration range the manganese ions are predominantly isolated orand
participate in dipole-dipole interractions At higher concentrations the reciprocal magnetic
susceptibility obeys a Curie-Weiss law with negative paramagnetic Curie temperature (p)
characteristic to antiferromagnetic coupled ions by means of super exchange interractions(fig
426) This behavior of manganese ions is confirmed by the shape of the EPR spectra
28
100 150 200 250
2
4
6
8
10
12
14
16
18
20
22
T [K]
[
emu
mol
]-1
3 mol 5 mol 10 mol 20 mol 35 mol 50 mol
Fig423 The temperature dependence of -1 for xMnOmiddot(100-x)[As2O3middotPbO]
(S1) 3 le x le 50 mol
50 100 150 200 2500
2
4
6
8
10
12
14
16
18
20
22
3 mol 5 mol 10 mol 20 mol 35 mol 50 mol
T [K]
[
emu
mol
]-1
Fig424 The temperature dependence of -1 for xMnOmiddot(100-x)[ As2O3middotTeO2]
(S1) 3 le x le 50 mol
100 150 200 250
2
4
6
8
10
12
14
16
18
20
22
[em
u m
ol]-1
T [K]
3 mol 5 mol 10 mol 20 mol 35 mol 50 mol
Fig425 The temperature dependence of -1 for xMnOmiddot(100-x)[3B2O3middotLi2O]
(S5) 3 le x le 50 mol
29
0 10 20 30 40 50
0
20
40
60
80
100
x [mol]
-p [K
]
(S1) (S3) (S5)
Fig426Concentration dependence of (p) for sistemele xMnOmiddot(100-x)[As2O3middotPbO]
(S1) xMnOmiddot(100-x)[As2O3middotTeO2] (S3) şi xMnOmiddot(100-x)[3B2O3middotLi2O] (S5)
Using the representation 1 =f(T) the molar Curie constants CM the effective
magnetic moments and molar fraction of Mn2+(x1) şi Mn3+(x2) ions were calculated and
represented in tables 44 -6
Tabel 44 Molar Curie constants effective magnetic moments and molar fraction of Mn2+(x1) şi Mn3+(x2) ions in xMnOmiddot(100-x)[As2O3middotPbO] (S1) glasses
x
[mol MnO2] CMtimes102
[emu mol] ef
[microB] x1
[mol Mn2+O2] x2
[mol Mn3+O2] 3 1272 582 268 032 5 1979 562 343 157 10 3777 549 555 445 20 6688 517 492 1508 35 12239 502 377 3123 50 15427 496 268 4732
Tabel 45 Molar Curie constants effective magnetic moments and molar fraction of Mn2+(x1) şi Mn3+(x2) ions in xMnOmiddot(100-x)[As2O3middotTeO2] (S3)glasses
x
[mol MnO2] CMtimes102
[emu mol] ef
[microB] x1
[mol Mn2+O2] x2
[mol Mn3+O2] 3 1297 588 287 013 5 1938 556 312 188 10 3804 551 575 425 20 6766 52 549 1451 35 11148 504 441 3059 50 15528 498 358 4642
30
Tabel 46 Molar Curie constants effective magnetic moments and molar fraction of Mn2+(x1) şi Mn3+(x2) ions in xMnOmiddot(100-x)[3B2O3middotLi2O] (S5) glasses
x
[mol MnO2] CMtimes102
[emu mol] ef
[microB] x1
[mol Mn2+O2] x2
[mol Mn3+O2] 3 127 581 265 035 5 1919 554 303 197 10 3681 542 486 514 20 7215 519 53 147 35 1121 506 505 2995 50 15898 501 493 4507
433 Comparative study by electron paramagnetic resonance (EPR) of
xFe2O3middot(100-x)[As2O3middotBO] where BO =gt TeO2 or PbO and
x Fe2O3middot(100-x) [3B2O3middotLi2O] glasses
In order to obtain more information regarding the behavior of iron ions in
xFe2O3middot(100-x)[As2O3middotBO] where BO =gt TeO2 (S4) or PbO (S2) şi xFe2O3middot(100-
x)[3B2O3middotLi2O] glasses were investigated by EPR spectroscopy on a large compositional
range with 05 le x le 35 mol Fe2O3 The EPR spectra of Fe3+ in xFe2O3middot(100-
x)[As2O3middotPbO] (S2) xFe2O3middot(100-x)[As2O3middotTeO2] (S4) and xFe2O3middot(1-x)[3B2O3middotLi2O]
(S6) are presented in figure 427-29 These spectra present two absorption lines centered at
gef 43 and gef 20 up to x le 35mol Fe2O3 systems studied
The absorption line centered at gef 43 is due to isolated Fe3+ ions [34-36] The
absorption line centered at gef 20 may be attributed to Fe3+ species interacting by magnetic
coupling dipolar and or super exchange the last ones forming magnetic clusters [37-41]
The evolution of the spectra is easier to follow considering the dependence of
concentration on the EPR parameters the line - intensity (obtained as an integral of the area
under the corresponding EPR signal) J and the line - width ΔB The evolution of J and AB
reflects the structural transformations which appear in the glass matrices due to the increasing
of iron ions content
The intensity and the line - width of the resonance line from gef 43 for all
investigated systems is represented in figure 430 (a b) The intensity of the resonance line
from gef 43 increases for (S2) and (S4) up to 3 mol and up to 5 mol for (S6) then
decreases for all systems investigated A line broadening up to 3 mol from gef 43 for
these systems can be observed due to increasing of Fe3+ isolated number of ions
31
1000 2000 3000 4000 5000
40
Firs
t der
ivat
ive
of a
bsor
ptio
n [u
a]
B [G]
x [mol Fe2O3]
05
1
3
5
1020
35 2
40
20
10
10
10
amplif
Fig427 The EPR spectra of Fe3+ for xFe2O3middot(100-x)[As2O3middotPbO] (S2)
glass system
1000 2000 3000 4000 5000
100
B [G]
Firs
t der
ivat
ive
of a
bsor
ptio
n [u
a]
10080
20
50
20
20
3
05
1
5
102035
x [mol Fe2O3] amplif
Fig428 The EPR spectra of Fe3+ for xFe2O3middot(100-x)[As2O3middotTeO2] (S4)
glass system
32
1000 2000 3000 4000 5000
Firs
t der
ivat
ive
of a
bsor
ptio
n [u
a]
B [G]
3
05
1
5
10
20
35
x [mol Fe2O3]
30
50
20
20
10
30
30
amplif
Fig429 The EPR spectra of Fe3+ for xFe2O3middot(100-x)[3B2O3middotLi2O] (S6)
glass system
The intensity and the line - width of the resonance line from gef 43 for all
investigated systems is represented in figure 430 (a b)The resonance line from gef 20 is
attributed to Fe3+ ions that interact by magnetic coupling dipolar orand super exchange
interractions can be observed in all compositional domains
The intensity of the resonance line from gef 20 can be observed as increasing up to
x=35 mol for (S2) and (S6) system and 10 mol for (S4) system with increased iron
ions content The line - width of the resonance line from gef 20 increased up to 10mol
for (S2) system and up to 3 mol for (S4) and 5mol for (S6) due to Fe3+species
interacting by magnetic coupling dipole-dipole Above this concentration line - width of the
resonance line from gef 20 can be attributed to dipolar and super exchange magnetic
interactions The ΔB = f(x) dependence reflects the competion between the broadening
mechanism (dipole ndash dipole interactions the interactions between ions in diferent
valence state and structural disorder) and the narrowing ones (super exchange
interactions)
33
0 5 10 15 20 25 30 35 40
x [mol]
J [ u
a]
S2 S4 S6
a)
0 5 10 15 20 25 30 35 4040
60
80
100
120
140
160
180
200
220 S2 S4 S6
B[G
]
x [mol]
a b
Fig 430 The dependence on Fe2O3 content of the intensity (a) and width (b) of
resonance line at gef 43 for xFe2O3middot(100-x)[As2O3middotPbO] (S2)
xFe2O3middot(100-x)[As2O3middotTeO2] (S4) and xFe2O3middot(100-x)[3B2O3middotLi2O] (S6) glasses
0 5 10 15 20 25 30 35 40
x [mol]
J [ u
a]
S2 S4 S6
a)
0 5 10 15 20 25 30 35 40
200
400
600
800
1000
1200
1400
1600
x [mol]
B
[G] S2
S4 S6
a b
Fig 431 The dependence on Fe2O3 content of the intensity (a) and width (b) of
resonance line at gef 20 for xFe2O3middot(100-x)[As2O3middotPbO] (S2)
xFe2O3middot(100-x)[As2O3middotTeO2] (S4) and xFe2O3middot(100-x)[3B2O3middotLi2O] (S6) glasses
34
434 Comparative study by magnetic susceptibility measurements of
xFe2O3middot(100-x)[As2O3middotBO] where BO =gt TeO2 or PbO and
xFe2O3middot(100-x) [3B2O3middotLi2O] glasses
The magnetic susceptibility data are in good agreement with the EPR result The magnetic
behavior of the glasses xFe2O3middot(100-x)[As2O3middotPbO] (S2) xFe2O3middot(100-x)[As2O3middotTeO2]
(S4) and xFe2O3middot(100-x)[3B2O3middotLi2O] (S6) for 3 x 50 mol Fe2O3 are presented in
figure 432 - 34
For (S2) glass systems up to x 10 mol x 3 mol (S5) glass systems and x 5
mol (S6) glass systems the temperature dependence of the reciprocal magnetic susceptibility
obeys a Curie law In this concentration range the iron ions are predominantly isolated orand
participate in dipole-dipole interactions At higher concentrations the reciprocal magnetic
susceptibility obeys a Curie-Weiss law with negative paramagnetic Curie temperature (p)
characteristic to antiferromagnetic coupled ions by means of super exchange interactions(fig
435) This behavior of iron ions is confirmed by the shape of the EPR spectra
80 100 120 140 160 180 200 220 240 260 2800
1
2
3
4
5
6
7
8
9
10
11
[
emu
mol
]-1
T [K]
3 mol 5 mol 10 mol 20 mol 35 mol 50 mol
Fig432 The temperature dependence of -1 for xFe2O3middot(100-x)[As2O3middotPbO] (S2)
3 x 50 mol
35
80 100 120 140 160 180 200 220 240 260 2800
1
2
3
4
5
6
7
8
9
10
T [K]
[
emu
mol
]-1
3 mol 5 mol 10 mol 20 mol 35 mol 50 mol
Fig433 The temperature dependence of -1 for xFe2O3middot(100-x)[As2O3middotTeO2] (S4)
3 x 50 mol
80 100 120 140 160 180 200 220 240 260 2800
1
2
3
4
5
6
7
8
9
10
11
3 mol 5 mol 10 mol 20 mol 35 mol 50 mol
T [K]
[
emu
mol
]-1
Fig434 The temperature dependence of -1 for xFe2O3middot(100-x)[3B2O3middotLi2O] (S6)
3 x 50 mol
36
0 10 20 30 40 50
0
10
20
30
40
50
x [mol]-
p [K]
(S2) (S4) (S6)
Fig435Concentration dependence of (p) for sistemele xFe2O3middot(100-x)[As2O3middotPbO] (S2) xFe2O3middot(100-x)[As2O3middotTeO2] (S4) and xFe2O3middot(100-x)[3B2O3middotLi2O] (S6)
for 3 x 50 mol Fe2O3
Using the representation 1 = f(T) the molar Curie constants CM the effective
magnetic moments and molar fraction of Fe3+(x1) şi Fe2+(x2) ions were calculated and
represented in tables 47-9
Table 47 Molar Curie constants effective magnetic moments and molar fraction of
Fe3+(x1) şi Fe2+(x2) ions in xFe2O3middot(100-x)[As2O3middotPbO] glasses (S2)
x [mol Fe2O3]
CMtimes102
[emu mol] ef
[microB] x1
[mol Fe23+O3]
x2 [mol Fe2
2+O3] 3 2526 58 261 039 5 393 56 332 168 10 7326 541 476 524 20 13459 519 53 147 35 23364 516 829 2671 50 32154 507 767 4233
Table 48 Molar Curie constants effective magnetic moments and molar fraction of
Fe3+(x1) şi Fe2+(x2) ions in xFe2O3middot(100-x)[As2O3middotTeO2] glasses (S4)
x [mol Fe2O3]
CMtimes102
[emu mol] ef
[microB] x1
[mol Fe23+O3]
x2 [mol Fe2
2+O3] 3 2571 585 277 023 5 4016 566 363 137 10 7911 562 686 314 20 14992 521 643 929 35 22676 509 601 2899 50 30959 497 313 4687
37
Table 49 Molar Curie constants effective magnetic moments and molar fraction of Fe3+(x1) şi Fe2+(x2) ions in xFe2O3middot(100-x)[3B2O3middotLi2O] glasses (S6)
The results allowed to consider that the magnetic properties of the studied glasses can
be explained through magnetic interractions between Fe3+ - Fe3+ Fe3+- Fe2+ and Fe2+- Fe2+ that
explain the dependences of RPE parameters concentration
SELECTED CONCLUSIONS
In this thesis xMOmiddot(100-x)[As2O3middotTeO2] xMOmiddot(100-x) [As2O3middotPbO] and
xMOmiddot(100-x)[3B2O3middotLi2O] glasses where MO =gt MnO or Fe2O3 were comparatively
studied in 0 le x le 50 mol The structural modifications of investigated glass matrices were
comparatively followed in function of the manganese or iron ions on the investigated glass
matrices were followed
The study by FT-IR spectroscopy shows that the evolution of the spectra of
xMnOmiddot(100-x) [As2O3middotPbO] with the addition and the increasing of the MnO content suggest
that the manganese ions break up a part of As ndash O ndash As Pb ndash O ndash Pb and probably of As ndash O ndash
Pb bonds The addition of MnO in the As2O3middotPbO glass matrix is leading to a disordering of
the glasses structure with the increasing of the MnO content
The evolution of the absorption bands for FT ndash IR spectrum of xFe2O3middot(1-x)
[As2O3middotPbO] glasses are determined by the addition of Fe2O3 content It can be observed to
shift the bands assigned As ndash O ndash As vibrations from AsO3 units due to changing to length As
ndash O ndash As bonds and interne angles of AsO3 units disappears PbO4 units and appears FeO6
units The addition of Fe2O3 in the As2O3middotPbO glass matrix determined a disordering of the
glasses structure with the increasing of the Fe2O3 content
From FT-IR absorption spectra of the investigated xMOmiddot(100-x)[As2O3middotTeO2] glasses
system where MO =gt MnO or Fe2O3 it can be observed that the addition and increasing of
manganese ions concluded the contraction of As-O-As bonds from totally symmetric
x [mol Fe2O3]
CMtimes102
[emu mol] ef
[microB] x1
[mol Fe23+O3]
x2 [mol Fe2
2+O3] 3 2542 582 268 032 5 3943 561 338 162 10 7423 544 506 494 20 13568 520 549 1451 35 23094 513 731 2769 50 31746 503 584 4416
38
stretching vibrations of AsO3 units for x ge10 mol there can be an increase in number of As-
O-As bonds from AsO3 units orand a length these linkage to doubly degenerate stretching
vibrations of AsO3 units and a stretching vibration mode of TeO3 tp with NBO It can be
remarked from the FT-IR absorption spectra the gradual transformation of symmetric
stretching vibration mode of Te-O bonds from TeO3 units in TeO4 (tbp) units and the presence
of MnO2 units Once with the addition of iron ions the xFe2O3middot(100- x)[As2O3middotTeO2]
glasses behave like xMnOmiddot(100-x)[As2O3middotTeO2] glasses but in this system the
appearance of FeO6 units can be seen
From FT-IR spectra in xMOmiddot(100-x)[3B2O3middotLi2O] glasses where MO =gt MnO or
Fe2O3 can be concluded that the addition of manganese or iron ions in vitreous matrices leads
to the increase of the disorder degree
The study by Raman spectroscopy shows that the evolution of the spectra the addition
of MnO in the [As2O3middotPbO]glass matrix determined an order degree of the vitreous matrix
The intensity of the bands attributed vibrations As ndash O ndash As bonds from As2O units and
bending vibrations of As ndash O ndash As from As2O units shift to a higher wave length that suggests
an increase in the As2O units comparative to AsO3 units With the increase of iron ions content
in the As2O3middotPbO glass matrix the number of these structural units decreases due to the
increasing of the disorder in the studied glasses
With the increasing of manganese content in As2O3TeO2 glass matrix the intensity
of these bands is increasing showing that the manganese content favorites the formation of
TeO4 (tbp) and TeO3 (tp) units For high concentrations of iron ions in xFe2O3middot(100-
x)[As2O3 TeO2] system of glasses the number of As-O-As linkages appear in Raman
spectrum due to stretching vibrations of As-O-As and vibrations of the continuous TeO4 (tbp)
network show a significant decrease
Studying the Raman spectra of xMOmiddot(1-x)[3B2O3middotLi2O] glass system where MO =gt
MnO or Fe2O3 it has been observed that the absorption bands presented in vitreous matrix
gradually decreased with an increase in the manganese or iron content in both glasses system
which suggested an increase of the disorder in these vitreous systems
The EPR spectra presents the behavior of manganese or iron ions in different vitreous
matrices xMOmiddot(100-x)[As2O3middotBO] where MO=gtMnO or Fe2O3 and BO =gt TeO2 or
PbO and xMOmiddot(100-x) [3B2O3middotLi2O] Glasses were investigated by EPR spectroscopy on a
large compositional range with 0 le x le 50 mol The absorption line centered at gef 43 and
is due to isolated Mn2+ ions The absorption line centered at gef 20 may be attributed to
Mn2+ species interacting by magnetic coupling dipolar and or super exchange the last ones
forming magnetic clusters The EPR spectra of Fe3+ in xFe2O3middot(100-x)[As2O3middotPbO]
xFe2O3middot(100-x)[As2O3middotTeO2] and xFe2O3middot(1-x)[3B2O3middotLi2O] are presented two absorption
lines centered at gef 43 and gef 20 up to x le 35mol Fe2O3 systems studied
39
The absorption line centered at gef 43 is due to isolated Fe3+ ions The absorption
line centered at gef 20 may be attributed to Fe3+ species interacting by magnetic coupling
dipolar and or super exchange the last ones forming magnetic clusters
The evolution of the spectra is easier to follow considering the dependence of
concentration on the EPR parameters the line - intensity (obtained as an integral of the area
under the corresponding EPR signal) J and the line - width ΔB The evolution of J and AB
reflects the structural transformations which appear in the glass matrices due to the increase of
manganese ions content
The magnetic susceptibility data are in good agreement with the EPR result The
magnetic behavior of the glasses from xMnOmiddot(100-x)[As2O3middotBO] where BO =gt TeO2 (S3)
or PbO (S1) and xMnOmiddot(100-x)[3B2O3middotLi2O] (S5) glasses for 3 le x le 50 mol MnO
For (S1) and (S3) system glasses up to x 3 mol and x 5 mol (S5) glass
system the temperature dependence of the reciprocal magnetic susceptibility obeys a Curie
law In this concentration range the manganese ions are predominantly isolated orand
participate in dipole-dipole interractions At higher concentrations the reciprocal magnetic
susceptibility obeys a Curie-Weiss law with negative paramagnetic Curie temperature (p)
characteristic to antiferromagnetic coupled ions by means of super exchange interractions This
behavior of manganese ions is confirmed by the shape of the EPR spectra Using the
representation 1 =f(T) the molar Curie constants CM the effective magnetic moments
and molar fraction of Mn2+(x1) şi Mn3+(x2) ions were calculated The magnetic susceptibility
data are in good agreement with the EPR result
The magnetic behavior of the glasses xFe2O3middot(100-x)[As2O3middotPbO] (S2)
xFe2O3middot(100-x)[As2O3middotTeO2] (S4) and xFe2O3middot(100-x)[3B2O3middotLi2O] (S6) for 3 x 50
mol Fe2O3 are presented For (S2) glass systems up to x 10 mol x 3 mol (S5)
glass systems and x 5 mol (S6) glass systems the temperature dependence of the
reciprocal magnetic susceptibility obeys a Curie law In this concentration range the iron ions
are predominantly isolated orand participate in dipole-dipole interactions At higher
concentrations the reciprocal magnetic susceptibility obeys a Curie-Weiss law with negative
paramagnetic Curie temperature (p) characteristic to antiferromagnetic coupled ions by
means of super exchange interactions(fig 435) This behavior of iron ions is confirmed by the
shape of the EPR spectra Using the representation 1 = f(T) the molar Curie constants
CM the effective magnetic moments and molar fraction of Fe3+(x1) şi Fe2+(x2) ions were
calculated
40
REFERENCES
Chapter 1
[1] I Ardelean bdquoIntroducere icircn studiul materialelor oxidice cu structură vitroasă EdNapocaStar Cluj Napoca 2002 [2] G Srinivasarao N Veeraiah J All Com 327 52-65(2001) [3] G Srinivasarao N Veeraiah J Phys Chem Solids 63705-717(2002) [4] DBecherescu VCristea FMarx IMenessz FWinter Chimia stării solide Ed Şt şi Encicl Bucucureştivol 1 1983 [5] J Wong CAAngell Glass-Structure by Spectroscopy Dekker Inc New York 1976 [6] BEWarren HKKrutter O Morningstat J Am Ceram Soc 19 202 (1936) [7] LLSperry JD Mackenzie Phys Chem Glasses 9 91 (1968) [8] WLKonijnendijk JMStevels J Non-Cryst Solids 18 307 (1975) [9] FCEversteyn JM Stevels HJ Naterman Phys Chem Glasses 1 134 (1963) [10] G Fuxi Optical and Spectroscopie Properties of Glass Springer-Verlag Shanghai Scientific Technical Pub Shanghai 1991 [11] YDYiannopoulos GDChryssikos EIKamitsos Phys Chem Glasses 42(3) 164 (2001) [12] MGFerreira da Silva BFOCosta J Non-Cryst Solids 293-295 534 (2001) [13] RYordanova YDimitriev VDimitriev S Kassabov DKlissurski JNon-Cryst Solids 201 141 (1996) [14] W L Konijnendijk J M Stevels J Non-Cryst Solids 18 307 (1980) [15] M Iron M Couzi ALevasseur JBrethous JSolidState Chem 31 285 (1980) [16] TFurukawa WBWhite PhzsChemGlasses 21 85 (1980) [17] E I Kamitsos M A Karakassides GD Chryssikos J Phys Chem 90 4528 (1986) [18] E I Kamitsos M A Karakassides GD Chryssikos J Phys Chem 91 1073 (1987) [19] TWBril Philips Res Rep Suppl 2 117 (1976) [20] E I Kamitsos M A Karakassides GD Chryssikos J Phys Chem 30 203 (1989) [21] BNMeera JRamakrishna J Non-Cryst Solids 159 1 (1993) [22] KWitke THubert PReich JRamanSpectr 24 407 (1993) [23] E I Kamitsos M A Karakassides Phys Chem Glasses 30 19 (1989) [24] MPeteanu Teză de doctoratrdquo Universitatea Babeş-Bolyairdquo Cluj Napoca (1989) [25] PCTaylor PJBray JPhys Chem Solids 33 43 (1972) [26] IArdelean MPeteanu GhIlonca DPop Solid State Commun 33 653 (1980) [27] AV De Wijn RE Van Balderen JKemPhys 46 4 (1967) [28] DL Griscom RE Griscom J Phys Chem Glasses 12 19 (1971) [29] JWH Schreurs JChem Phys 69 2151 (1978) [30] AlNicula M Peteanu IArdelean Studia Univ Babeş-Bolyai Physica 2 65 (1979) [31] M Peteanu IArdelean SFilip ITodor GSalvan Studia Univ Babeş-Bolyai Physica XL 2 9 (1995) [32] IArdelean M Peteanu SFilipV Simon ITodor Solid State Commun 105 (5) 339 (1998) [33] SKMendiratta EGuedes de Sousa JMatSci Lett7 733 (1988) [34] IArdelean M Peteanu SFilip V Simon GGyorffy Solid State Commun 102 (4) 341 (1997) [35] IArdelean M Peteanu SFilip V Simon FCiorcas ITodor JMagnMagn Mat 196-197 257 (1999) [36] JKliava RBerger YServant JEmery JMGreneche JTrokss J Non-Cryst Solids 202 205 (1996) [37] LDBogomolova NA Krasilnikova VLBogdanov VDKhaliev VV Mitrofanov J Non-Cryst Solids 188 130 (1995) [38] DLoveridge SPark PhysChem Glasses 12 19 (1971) [39] IArdelean G Salvan M Peteanu V Simon FCiorcas Mod PhysLett B 13 (22-23) 801 (1999)
41
[40] JLRao AMuraly EDRao J Non-Cryst Solids 202 215 (1996) [41] CPrakash S Husain RJ Singh SMollah JAlloys Compon 326 47 (2001) [42] EGuedes de Sousa SKMendiratta JMMachado Da Silva Portugal Phys 17 (3-4) 203 (1986) [43] TCastner GSNewell WCHolton CP Slichter JChem Phys 32 668 (1960) [44] SPChaudhuri SKPatra JMatSci 35 4735 (2000) [45] IArdelean HH Qiu HSakata Matt Lett 32 335 (1997) Chapter 2 [1] J Wong C A Angel Glass Structure by Spectroscopy Marcel Dekker inc New-York 1976 [2] I Ardelean bdquoIntroducere icircn studiul materialelor oxidice cu structură vitroasă EdNapocastar Cluj-Napoca 2002 [3] N Avram GH Mateescu Spectroscopia icircn infraroşu Aplicaţii icircn chimia organică Ed Tehnică Bucureşti 1968 [4] TIliescu Spectroscopie optică moleculară vibraţională şi electronică Ed Casa Cărţii de Ştiinţă Cluj- Napoca 2000 [5] S Aştilean bdquoMetode şi tehnici moderne de spectroscopie optică Ed Casa Cărţii de Ştiinţă Cluj - Napoca 2002 p 5 [6] I Ursu Rezonanţă Electronică de Spinrdquo Ed AcademieiBucureşti (1965) [7] CHHurd ContempPhys 23 (5) 469 (1982) [8] GWAnderson WDCompton JChemPhys52 6166 (1970) [9] MS Seehra GSrinivasan Landolt-Bornstein (New Series) SubVolume F3 Springer-Verlag Berlin 1994 [10] GToulouse ContempPhys 2115 (1977) [11] NMMurayMagnetic susceptybility EdInterscience New York P1773 1963 [12] JBGoodenough Magnetism and Chemical Bond EdInterscience New York 1963 [13] IArdelean G Salvan M Peteanu V Simon FCiorcas Mod PhysLett B 13 (22-23) 801 (1999) [14] IArdelean MPeteanu R Ciceo Lucăcel Studii de rezonanţă paramagnetică electronică şi magnetice ale unor ioni 3d icircn sticle pe bază de B2O3 Ed Presa Univesitară Clujeană 2005 [15] IArdelean PhysStatSol (b) 87K137 (1978) [16] IArdelean Solid State Commun 31 75 (1979) [17] EJFrieble LKWilson AWDozier DLKinser PhysStatSol (b) 45 323 (1971) [18] DWMoon JMAitken RKMcCrone GS Ciloszik PhysChe Glasses 16 (5) 91 (1975) [19] SFilip Teză de doctorat UnivBabeş-Bolyai Cluj Napoca 1996 [20] CJSchinkel GWRathenou Physics of Non-Crystaline Solids North Holland Publ Co Amsterdam 215 1965 [21] EJFrieble LKWilson NCKoon DLKinser JAm Ceram Soc 57-237 (1974) [22] RJLandry JT Fournier CGYoung JChemPhys 46 1285 (1967) [23] WSimpson PhysStatSolidi b40 207 (1970) [24] RHasegawa PhysRevB b(5) 1631 (1971) [25] IArdelean GhIlonca MPeteanu Solid State Commun 52 145 (1984) [26] IArdelean GhIlonca OCozar J Physique 49 C8 1107 (1988) Chapter 3 [1] LFBates Modern Magnetism p133 Cambridge University Press London 1962 [2] IArdelean GhIlonca DBarbos Solid State Commun 40 769 (1981) [3] EBurzo IUrsu DUngur IArdelean JMatSci 15 581 (1980) [4] EBurzo IUrsu DUngur IArdelean MatResBull 15 1273 (1980) [5] DLGriscom Glass Science and Technology 48 151 (1990) [6] PJBray AH Silver Modern aspects of the vitreous state vol1 Butterworth
42
London 1960 [7] IArdelean Teza de doctorat UnivBabeş-Bolyai Cluj Napoca 1979 [8] SAştilean bdquoMetode şi tehnici moderne de spectroscopie opticărdquo EdCasa Cărţii de Ştiinţă Cluj ndash Napoca 2002 p5 [9] IArdelean RCiceo-Lucăcel ldquoFizica şi Tehnologia Materialelor Oxidice Lucrări Practicerdquo Ed Univ ldquoBabeş-Bolyairdquo Cluj-Napoca 2000 [10] VPop IChicinaş NJumate Fizica materialelor Metode experimentalerdquo EdPresa Universitară Clujeană 2001 [11] IUrsu Rezonanţă electronică de spinrdquo EdAcademiei Bucureşti 1965 Chapter 4 [1] I Ardelean S Lupşor D Rusu Solid State Sci 10 1384(2008) [2] I Ardelean S Lupşor D Rusu trimis spre publicare la Physica B decembrie 2009 [3] P Tarte Spectrochim Acta 18 467 (1962) [4] R A Condrate J Non ndash Cryst Solids 84 26 (1986) [5] G Srinivasarao N Veeraiah Phys Stat Sol (a) 191 370(2002) [6] G Srinivasarao N Veeraiah J Phys Chem Solids 63 705(2002) [7] G Srinivasarao N Veeraiah J All Com 327 52 (2001) [8] DK Durga N Veeraiah Bull Mater Sci 24 (4) 421 (2001) [9] F F Bentley L D Smithson A L Rozek InfraredndashSpectra and Characteristic Frequencies 700-300 cm-1 Interscience New York 1968 p 103 [10] O Noguera T Merle-Mejean AP Mirgorodsky MB Smirnov P Thomas J-C Champarnaud-Mesjard J Non-Cryst Solids 330 50 (2003) [11] BVR Chowdari KL Tan Fang Ling Solid State Ionics 113 ndash 115 711(1998) [12] C Jiang J Zhang H Mao F Gan Glass Technol 39(6) 200(1998) [13] MR Sahar K Sulhadi MS Rohani J Mater Sci 42 824(2007) [14] C Horea D Rusu I Ardelean J Mater Sci Mater Electron 20 905(2009) [15] GE Rachkovskaya GB Zakharevich J Appl Spectrosc 74 86(2007) [16] I Ardelean S Lupşor D Rusu trimis spre publicare la Journal of Materials Science Materials in Electronics decembrie 2009 [17] I Ardelean S Lupşor D Rusu trimis spre publicare la Modern Physics Letters B decembrie 2009 [18] R Iordanova Y Dimitriev V Dimitrov S Kassabov D Klissurski J Non ndash Cryst Solids 231 227 (1998) [19] R Iordanova Y Dimitriev S Kassabov D Klissurski J Non ndash Cryst Solids 204 141 (1996) [20] J O Jensen S J Gilliam A Banerjee D Zeroka S J Kirkby C N Merrow J Mol Struct (Theochem) 664 145 (2003) [21] G N Papatheodorou S A Solin Solid State Commun 16 5 (1975) [22] BVR Chowdari KL Tan Fang Ling J Mat Sci 35 2015 (2000) [23] R C Lucacel C Marcus V Timar I Ardelean Solid State Sci 9 850 (2007) [24] CP Varsamis EI Kamitsos GD Chryssikos Solid State Ionics 136ndash137 1031 (2000) [25] Sherief M Abo-Naf Fatma H El Batal Moenis A Azooz Mat Chem Phys 77 846 (2002) [26] SG Motke SP Yawale SS Yawale Bull Mater Sci 25 (10) (2002) [27] R Akagi N Ohtori N Umesaki J Non ndash Cryst Solids 293 471(2001) [28] E I Kamitsos M A Karakassides G D Chryssikos J Phys Chem 91(5) 1073 (1987) [29] H Ushida Y Iwadate T Hattori S Nishiyama K Fukushima Y Ikeda M Yamaguchi M Misawa T Fukunaga T Nakazawa S Jitsukawa J Alloys Compd 377 167 (2004) [30] I Ardelean F Ciorcas M Peteanu S Lupşor G Salvan Balkan Phys Lett 5 860 (1997)
43
[31] I Ardelean M Peteanu V Simon O Cozar F Ciorcas S Lupşor J Magn Magn Mater 196 253 (1999) [32] IArdelean MPeteanu GhIlonca Phys Stat Sol (a) 58 K33(1980) [33] IArdelean MPeteanu R Ciceo-Lucăcel ldquoStudii de rezonanţă paramagnetică electronică şi magnetice ale unor ioni 3d icircn sticle pe bază de B2O3rdquo Ed Presa Univ Clujeană Cluj Napoca 2005 p 171 [34] JLRao AMuraly EDRao J Non-Cryst Solids 202 215 (1996) [35] RPSChakradhar AMurali JLRao Optical Mat 10 109 (1998) [36] IArdelean MPeteanu SFilip VSimon GGyorffy Solid State Commun 102(4) 341 (1997) [37] IArdelean MPeteanu VSimon SFilip FCiorcaş ITodor J Magn Magn Mat 196-197 257 (1999) [38] IArdelean GSalvan MPeteanu VSimon CHimcinschi FCiorcas Mod Phys Lett B 13(22-23) 801 (1999) [39] IArdelean HHQiu HSakata Mat Lett 32 335 (1997) [40] SPChaudhuri SKPatra J Mat Sci 35 4735 (2000) [41] I Ardelean M Peteanu V Simon G Salvan J Mat Sci Technol 18 (3) 1 (2002)

10
from ~ 1119 cm-1 can be assigned to totally symmetric stretching vibrations of AsO3 units [5-
7] These bands presented in As2O3TeO2 glass matrix spectrum confirm the presence of
AsO3 TeO4 tbp and TeO3 tp units in the structure of the glass matrix but due to the broadness
of the bands it can not be told for sure which one of these units is predominant
Table 41Wavenumber and the structural assignments of FT ndash IR spectra of
As2O3middotPbO and As2O3middotTeO2 vitreous matrices
~ [cm 1 ]
As2O3middotPbO As2O3middotTeO2
Attribution
~1119 cm-1
~ 1119 cm-1
Totally symmetric stretching vibrations of AsO3 units
~ 821cm-1
Doubly degenerate stretching vibrations of AsO3 structural units
~ 854 cm-1
Doubly degenerate stretching vibrations of AsO3 units Stretching vibration mode of TeO3 tp with NBO
~ 794 cm-1
Doubly degenerate stretching vibrations of AsO3 structural units
~ 733 cm-1
Symmetric stretching vibration mode of Te-O bonds in TeO3 units
~ 594 cm-1
~ 644 cm-1
Totally symmetric bending vibrations of AsO3 units
~ 407 cm-1 Vibrations of Pb ndash O bonds from PbO4 structural groups
412 Comparative study by FT-IR spectroscopy of
xMOmiddot(100- x)[As2O3middotPbO] vitreous systems where MO =gt MnO or Fe2O3
The infrared absorption spectra obtained for xMOmiddot(1-x)[As2O3middotPbO] glass system
where MO =gt MnO or Fe2O3 with 0 le x le 50 mol are presented in figure 42-3 and their
structural assignments are summarized in table 41
The spectra were discussed on the basis of the method given by Tarte [3] and Condrate
[4] by comparing the experimental data of glasses with those of related crystalline compounds
The characteristic absorption bands for crystalline As2O3 [5-8] PbO [79] and characteristic
bands for Fe2O3 [1819 ] were used as a reference point in the results discussion
The FT ndash IR spectra of the investigated glasses suggest a structure formed of AsO3 and
PbO4 structural units where As2O3 plays the role of the glass former and PbO plays the role of
the glass modifier The evolution of the spectra with the addition and the increasing of the
MnO content suggest that the manganese ions break up a part of As ndash O ndash As Pb ndash O ndash Pb and
probably of As ndash O ndash Pb bonds The addition of MnO in the As2O3middotPbO glass matrix is leading
to a disordering of the glasses structure with the increasing of the MnO content
The evolution of the absorption bands for FT ndash IR spectrum of xFe2O3middot(1-x)
[As2O3middotPbO] glasses are determined by the addition of Fe2O3 content It can be observed to
11
shift the bands assigned As ndash O ndash As vibrations from AsO3 units due to changing to length As
ndash O ndash As bonds and interne angles of AsO3 units disappears PbO4 units and appears FeO6
units The addition of Fe2O3 in the As2O3middotPbO glass matrix determined a disordering of the
glasses structure with the increasing of the Fe2O3 content
400 600 800 1000 1200
610
813
449
1093
423
449
616
760 848
821
794
594
20A
bsor
ptio
n [a
u]
Wavenumber [cm-1]
05
0
35
10
35
50
1
MnO
407
1119
693
Fig 42 FT ndash IR spectra of xMnOmiddot(100- x)[As2O3middotPbO] glasses
400 600 800 1000 1200
616
462
811
407
594
Abs
orpt
ion
[au
]
Wavenumber [cm -1]
05
20
0
35
10
35
50
1
Fe2O3
821
79469
3
1119
1084
610
Fig43 FT ndash IR spectra of xFe2O3middot(100- x)[As2O3middotPbO] glasses
12
413 Comparative study by FT-IR spectroscopy of
xMOmiddot(100-x)[As2O3middotTeO2] vitreous systems where MO =gt MnO or Fe2O
The infrared absorption spectra obtained for xMOmiddot(1-x)[As2O3middotTeO2] glass system
where MO =gt MnO or Fe2O3 with 0 le x le 50 mol are presented in figure 44 -5 and their
structural assignments are summarized in table 41[1617] The characteristic absorption bands
for crystalline As2O3 [5-8] PbO [79] TeO2 [810-15] MnO2 and Mn3O4 [9] and characteristic
bands for Fe2O3 [1819 ] were used as a reference point in the results discussion
Fig 44 FT ndash IR spectra of xMnOmiddot(100- x)[As2O3middotTeO2] glasses
Fig45 FT ndash IR spectra of xFe2O3middot(100- x)[As2O3middotTeO2] glasses
400 600 800 1000 1200
565
422 690 830
05
Abs
optio
n [a
u]
Wavenumber [cm-1]
0
3
5
35 50
1
MnO
854 733 644
1119
10 20
400 600 800 1000 1200
462650
812
713
561
05
20
Wavenumber [cm-1]
Abs
orpt
ion
[au
]]
0
3 5
10
35 50
1
Fe2O3
854 733
644
1119
13
This behavior of the studied glasses with the addition and increasing of MnO content
suggests that the structure observed in the glass matrix is conserving up to 5 mol MnO
where the structure takes another form From a structure dominated by AsO3 TeO4 tbp and
TeO3 tp units the structure became dominated by TeO4 tbp and MnO2 units and in a small
measure of AsO3 and TeO3 tp units For higher concentrations it can not be specified exactly
which of the last two structural units have the biggest proportion in these glasses From FT-IR
absorption spectra of the investigated glass system it can be observed that the addition and
increasing of manganese ions concluded the contraction of As-O-As bonds from totally
symmetric stretching vibrations of AsO3 units for x ge10 mol there can be an increase in
number of As-O-As bonds from AsO3 units orand a length these linkage to doubly degenerate
stretching vibrations of AsO3 units and a stretching vibration mode of TeO3 tp with NBO It
can be remarked from the FT-IR absorption spectra the gradual transformation of symmetric
stretching vibration mode of Te-O bonds from TeO3 units in TeO4 (tbp) units and the presence
of MnO2 units Once with the addition of iron ions the xFe2O3middot(100- x)[As2O3middotTeO2]
glasses behave like xMnOmiddot(100-x)[As2O3middotTeO2] glasses but in this system the
appearance of FeO6 units can be seen
414 Comparative study by FT-IR spectroscopy of
xMnOmiddot(100- x)[As2O3middotBO] vitreous systems were BO =gt TeO2 or PbO
The infrared absorption spectra obtained for xMnOmiddot(100- x)[As2O3middotBO] vitreous
systems where BO =gt TeO2 or PbO with 0 le x le 50 mol MnO are presented in figure
42 and 44 Following the infrared absorption spectra it can be observed that for
xMnOmiddot(100- x)[As2O3middot PbO] glass system the most disordered structure to exist for 0
le x le 5 mol MnO and to xMnOmiddot(100-x)[As2O3middot TeO2] glass system for 1 le x le 5 mol
MnO For x ge 5 mol MnO manganese ions break up a part of As ndash O ndash As Pb ndash O ndash Pb
and probably of As ndash O ndash Pb bonds to favor the increase in number of PbO4 units and
appearance of MnO2 units For x ge 10 mol MnO observed comparatively in both system
glasses the addition of manganese ions suggests for the first system a modification in linkage
characteristic units and for the second system an improvement for structural units of As2O3middot
TeO2 vitreous matrice also linkage characteristic units
415 Comparative study by FT-IR spectroscopy of
xFe2O3middot(100-x)[As2O3middotBO] vitreous systems where BO =gt TeO2 or PbO
The infrared absorption spectra obtained for xFe2O3middot(100- x)[As2O3middotBO] vitreous
systems where BO =gt TeO2 or PbO with 0 le x le 50 mol Fe2O3 are presented in figure
43 and 45
14
The evolution of the spectra with the addition and the increasing of the Fe2O3 content
suggest that the iron ions break up a part of As ndash O ndash As Pb ndash O ndash Pb and probably of As ndash O
ndash Pb bonds It can be observed a shift in the bands assigned As ndash O ndash As vibrations from AsO3
units due to changing to length As ndash O ndash As bonds and interne angles of AsO3 units the PbO4
units disappear and FeO6 units appear For x ge 5 mol Fe2O3 observed comparatively in
both system glasses the addition of iron ions suggests for the first system a modification in
linkage characteristic units of As2O3middotPbO and for the second system an improvement for
structural units of As2O3middot TeO2 vitreous matrice also linkage characteristic units appearance
of FeO6 units in both system
416 Comparative study by Raman spectroscopy of
As2O3middotTeO2 and As2O3middotPbO vitreous matrices
In order to obtain new information regarding the role of the modifier in the
formation of vitreous matrices there were made comparative studies by Raman
spectroscopy The Raman spectroscopy are presented in figure 46(ab) The wave
length and the structural assignments of Raman spectra of As2O3middotPbO şi As2O3middotTeO2 vitreous
matrices are presented in table 42
Table 42Wavenumber and the structural assignements of Raman spectra
of As2O3middotPbO and As2O3middotTeO2 vitreous matrices
~ [cm 1 ]
As2O3middotPbO As2O3middotTeO2
Attribution
~826 cm-1
~ 816 cm-1
Stretching vibrations of As-O-As
~ 752 cm-1
Vibrations of the continuous TeO4 (tbp) network
~ 627 cm-1
Vibrations As ndash O ndash As bonds from As2O units
~ 580 cm-1
Stretching vibrations of As-O-As
~ 525 cm-1
Vibrations O-As-O bonds from AsO3 units
~ 438cm-1
Symmetric bending vibrations of Te ndash O ndash Te vertex linkages between different TeO4 (tbp) TeO3+1 polyhedra Stretching vibrations of As-O-As of AsO3 units
~ 345 cm-1
Bending vibrations of As ndash O ndash As from As2O units
15
200 400 600 800 1000
As2O3PbO
Ram
an In
tens
ity [a
u]
LWavenumber [cm-1]
345
826
525
627a)
a
200 400 600 800 1000
816
752
580 R
aman
Inte
nsity
[au
]
Wavenumber [cm-1]
As2O3TeO2
438
b)
b
Fig46 Raman spectra of vitreous matrices a As2O3middotPbO şi b As2O3middotTeO2
The Raman spectrum of As2O3middotPbO glass matrix presents four bands at 826 cm-1
627 cm-1 525 cm-1 and 345 cm-1 The band from 826 cm-1 can be assigned to As ndash O ndash
As stretching vibrations [20] The band centered at 627 cm-1 can be assigned to vibrations As
ndash O ndash As bonds from As2O units the band from 525 cm-1 are assigned vibrations O-As-O
bonds from AsO3 units [21] The band of 345 cm-1 are attributed to As ndash O ndash As bending
vibrations from As2O units[2021]
The Raman spectrum of As2O3middot TeO2 glass matrix presents four bands at 816 cm-1
752 cm-1 580 cm-1 and 438 cm-1 The band from 816 cm-1 can be assigned to As ndash O ndash
As stretching vibrations [20] The band centered at 752 cm-1 can be assigned to vibrations of
the continuous TeO4 (tbp) network [22] The band of 580 cm-1 are attributed to As ndash O ndash As
stretching vibrations [12] The band centered at 438 cm-1 can be assigned symmetric bending
vibrations of Te ndash O ndash Te vertex linkages between different TeO4 (tbp) TeO3+1 polyhedra and
As ndash O ndash As stretching vibrations of AsO3 units
16
417 Study by Raman spectroscopy of xMOmiddot(100- x)[As2O3middotPbO]
vitreous systems where MO =gt MnO or Fe2O3
The Raman spectra obtained for xMOmiddot(100- x)[As2O3middotPbO] vitreous systems where
MO =gt MnO or Fe2O3 with 0 le x le 50 mol are presented in figure 47-8 and their
structural assignments are summarized in table 42
200 400 600 800 1000
368
833
345
1
3
Lungimea de unda [cm-1]
Inte
nsita
te R
aman
[ua
]
20
05
0
5
10
35
50
MnO
826
525
627
Fig 47 Raman spectra of xMnOmiddot(100- x)[As2O3middotPbO] glasses
The addition of MnO in the glass matrix determined an order degree of the vitreous
matrix The intensity of the bands attributed vibrations As ndash O ndash As bonds from As2O units
and bending vibrations of As ndash O ndash As from As2O units shift to a higher wave length that
suggests an increase in the As2O units comparative to AsO3 units
To the band from 826 cm-1 the addition of manganese ions in the glass matrix
determine for x = 05 mol an decreasing in intensity whereupon increasing for higher
concentrations The intensity of bands centered at 627 cm-1 and 525 cm-1 for x = 05
mol MnO decrease and disappear for x = 1 mol MnO The band of 345 cm-1 slowly
increases with the addition of manganese ions
To the band from 826 cm-1 the addition of iron ions in the glass matrix determines
for x = 05 mol an increase in intensity a gradual decrease and disappearance for x = 35
mol Fe2O3 of the bands observed for the glass matrix For higher concentrations of
manganese these bands gradually decrease The intensity of bands centered at 627 cm-1 and
525 cm-1 for x = 05 mol Fe2O3 increase and shift to 612 cm-1 and 501 cm-1 whereas
17
they gradually decrease and disappear for x = 10 mol Fe2O3 The band of 345 cm-1
decreases with the addition of iron ions and disappears for x = 20 mol Fe2O3
200 400 600 800 1000
3
612
501
Wavenumber [cm-1]
Ram
an In
tens
ity [a
u]
05
20
0
5
10
3550
1
Fe2O3
345
826
525
627
Fig 48 Raman spectra of xFe2O3middot(100- x)[As2O3middotPbO] glasses
With the increase of iron ions content in the As2O3middotPbO glass matrix the number of
these structural units decreases due to the increasing of the disorder in the studied glasses
418 Study by Raman spectroscopy of xMOmiddot(100-x)[As2O3middotTeO2]
vitreous systems were MO =gt MnO or Fe2O3
The Raman spectra obtained for xMOmiddot(100- x)[As2O3middot TeO2] vitreous systems
where MO =gt MnO or Fe2O3 with 0 le x le 50 mol are presented in figure 49-10 and their
structural assignments are summarized in table 42
The Raman spectrum of the glass matrix suggests a structure formed from TeO4 (tbp)
and TeO3 (tp) units where the presence of As ndash O ndash As bonds can not be excluded The
addition of manganese ions is leading to a modification of the structure proposed by the
spectrum of the glass matrix Then with the increasing of manganese content the intensity of
these bands is increasing showing that the manganese content favorises the formation of TeO4
(tbp) and TeO3 (tp) units
18
200 400 600 800 1000
783
850
768
416
816
752
Wavenumber [cm -1]
Ram
an In
tens
ity [a
u]
13
20
05
0
5
10
35
50
MnO
438
580
660
Fig 49 Raman spectra of xMnOmiddot(100- x)[As2O3middot TeO2] glasses
200 400 600 800 1000
226
294
408
673 751
5
W avenumber [cm -1]
Ram
an In
tens
ity [a
u]
05
20
0
3
10
35
50
1
Fe2O
3
816
752
438
580
Fig 410 Raman spectra of xFe2O3middot(100- x)[As2O3 TeO2] glasses
The Raman spectra of xFe2O3middot(100- x)[As2O3 TeO2] glasses present a significant
advance to the TeO4 (tbp) TeO3+1 polyhedra and AsO3 units represented in Raman spectrum
by the ~ 438 cm-1 band comparative with the modifications determined by the addition of
manganese ions in vitreous matrix For high concentrations of iron ions in xFe2O3middot(100-
x)[As2O3 TeO2] system of glasses the number of As-O-As linkages appear in Raman
spectrum due to stretching vibrations of As-O-As and vibrations of the continuous TeO4 (tbp)
network show a significant decrease
19
419 Comparative study by Raman spectroscopy of xMnOmiddot(100- x)[As2O3middotBO]
vitreous systems were BO =gt TeO2 or PbO
The addition of MnO to xMnOmiddot(100- x)[As2O3middotPbO] glass system do not break As
ndash O ndash As bonds into characteristic units and contribute to their prominence The addition of
manganese ions to xMnOmiddot(100- x)[As2O3middot TeO2] glass system for x=50mol MnO
determined the splitting up of a part of As ndash O ndash As Te-O-Te and the appearance of the
TeO4 (tbp) units against the loss of continuous TeO4 (tbp) network was observed
4110 Comparative study by Raman spectroscopy of xFe2O3middot(100- x)[As2O3middotBO]
vitreous systems where BO =gt TeO2 or PbO
With the increasing of iron ions content in the As2O3middotPbO glass matrix the number of
these structural units decreased due to the increase of the disorder in the studied glasses (x gt 20
mol ) and x = 50 mol Fe2O3 for xFe2O3middot(100- x)[As2O3middotTeO2] when iron ions
brought the structural units existing in glass matrices and favoured the appearace of
new bands due to bending vibrations of As ndash O ndash As
42 Comparative study by FT-IR and Raman spectroscopies of
xMOmiddot(100-x)[3B2O3middotLi2O] glasses where MO =gt MnO or Fe2O3
421 Study by FT-IR spectroscopy of xMOmiddot(100-x)[3B2O3middotLi2O] glasses
where MO =gt MnO or Fe2O3
The infrared absorption spectra obtained for xMOmiddot(1-x)[3B2O3middotLi2O] glass system
where MO =gt MnO or Fe2O3 with 0 le x le 50 mol are presented in figure 411-13 and their
structural assignments are summarized in table 43
500 1000 1500
3B2O3Li2O
Wavenumber [cm-1]
Abs
orpt
ion
[au
]
490
1400
1230
1061
698
614
460 78
6
Fig 411 FT ndash IR spectra of vitreous matrix 3B2O3middotLi2O
20
Following the infrared absorption spectra obtained for 3B2O3middotLi2O vitreous matrix
observed on eight bands ~ 1400 cm-1 ~ 1230 cm-1 ~ 1061 cm-1 ~ 786 cm-1 ~ 698 cm-
1 ~ 614 cm-1 ~ 490 cm-1 şi ~ 460 cm-1 The band at ~ 1400 cm-1 is assigned to
asymmetric stretching vibrations from BOslash3 şi BOslash2O- groups (Oslash represent oxygen atom
bridging two boron atoms) The band at ~ 1230 cm-1 is attributed to asymmetric stretching
vibrations of B ndash O bonds from triangular ortoborate BO 33 groups [23-26]
400 600 800 1000 1200 1400 1600
0
3
5
10
20
35
50
1
Wavenumber [cm-1]
Abs
orpt
ion
[ua
]
05
MnO
490
1400
1230
1061
698
614
460 78
6
Fig 412 FT ndash IR spectra of xMnOmiddot(100-x)[3B2O3middotLi2O] glasses
400 600 800 1000 1200 1400 1600
469
Wavenumber [cm-1]
Abs
orpt
ion
[ua
]
0
3
5
10
20
35
50
1
05
Fe2O3
490
1400
1230
1061
698
614
460 78
6
Fig 413 FT ndash IR spectra of x Fe2O3middot(100-x)[3B2O3middotLi2O] glasses
21
Table 43Wavenumber and the structural assignments of FT ndash IR and Raman
spectra of 3B2O3middotLi2O vitreous matrix
~ [cm 1 ] Attribution
FT ndash IR Raman FT ndash IR Raman
~ 1400 cm-1
~ 1400 cm-1
Asymmetric stretching
vibrations from BOslash3 şi BOslash2O-
groups
BOslash2O- triangles linked to
other borate triangular units
~ 1230 cm-1
Asymmetric stretching
vibrations of B ndash O bonds from
triangular ortoborate
BO 33 groups
~ 1061 cm-1
~ 1074 cm-1
Stretching vibrations of B ndash Oslash
bonds in -4BOslash tetrahedra from
tri- tetra- and penta-borate
groups
Diborate groups
~ 902 cm-1
Vibrations of orthoborate
groups
~ 786 cm-1
~ 791 cm-1
Bending vibrations of O3B ndash O
ndash BO4 bonds
Vibrations of rings with six
member to one or two BO4
tetrahedral from tri- tetra ndash
and penta ndash borate units
~ 698 cm-1
Bending vibrations of B-O-B
bonds from pentaborate groups
~ 614cm-1 Bending vibrations of O ndash B ndash O
bonds
~ 490cm-1 ~ 471cm-1 Bending vibrations of B-O-B
bonds
Isolated diborate groups
~ 460cm-1 Bending vibrations of O ndash B ndash O
bonds
22
The band at ~ 1061 cm-1 is assigned to stretching vibrations of B ndash Oslash bonds in -4BOslash
tetrahedra from tri- tetra- and penta-borate groups and the band at ~ 786 cm-1 is assigned
to bending vibrations of O3B ndash O ndash BO4 bonds The band at ~ 698 cm-1 is attributed to
Bending vibrations of B-O-B bonds from pentaborate groups The bands at ~ 614 cm-1 and
~ 460 cm-1 are assigned to bending vibrations of O ndash B ndash O bonds and the band at ~ 490 cm-
1 is assigned to bending vibrations of B-O-B bonds
From FT-IR spectra it can be concluded that the addition of manganese or iron ions in
vitreous matrices leads to the increase of the disorder degree
Also the structural changes that appeared in 3B2O3middotLi2O vitreous matrix with an
addition MnO or Fe2O3 content can be studied Ar=A4A3 ratio(A4 - relative number of -4BOslash tetrahedral borate units A3 - relative number of triangular (BOslash3 and BOslash2O-) units
0 10 20 30 40 50
010
015
020
Ar
x [mol]
MnO Fe2O3
Fig 414 The evolution of Ar ratio with the MnO or Fe2O3 content of
xMnOmiddot(100-x)[3B2O3middotLi2O] şi xFe2O3middot(100-x)[3B2O3middotLi2O] The evolution of the value of this ratio also allows a visualization of the effects
determined by the presence of the manganese or iron ions in the matrix The value Arltlt 1
indicated that BO3 is dominant related to BO4
422 Study by Raman spectroscopy of xMOmiddot(100-x)[3B2O3middotLi2O] glasses
where MO =gt MnO or Fe2O3
The Raman spectra obtained for xMOmiddot(1-x)[3B2O3middotLi2O] glass system were MO =gt
MnO or Fe2O3 with 0 le x le 50 mol are presented in figure 414-16 and their structural
assignments are summarized in table 43
Studying the Raman spectra of xMOmiddot(1-x)[3B2O3middotLi2O] glass system where MO =gt
MnO or Fe2O3 it has been observed that the absorption bands presented in vitreous matrix
gradually decreased with an increase in the manganese or iron content in both glasses system
which suggested an increase of the disorder in these vitreous systems
23
1000 2000 3000
B2O3Li2O
Wavenumber [cm-1]
Ram
an In
tens
ity [a
u]
1430
107490
279
1471
Fig 415 Raman spectra of vitreous matrix 3B2O3middotLi2O
500 1000 1500 2000 2500 3000
1430
107490
2791
0
Wavenumber [cm-1]
Ram
an In
tens
ity [a
u]
1
3
20
05
5
10
35
50
MnO
471
Fig 416 Raman spectra of xMnOmiddot(100-x)[3B2O3middotLi2O] glasses
400 600 800 1000 1200 1400 1600
Wavenumber [cm-1]
Ram
an In
tens
ity [a
u]
0
1
3
20
05
5
10
35
50
Fe2O3
1430
1074
90279
1
471
Fig 417 Raman spectra of x Fe2O3middot(100-x)[3B2O3middotLi2O] glasses
24
43 Comparative study by electron paramagnetic resonance (EPR) and magnetic
susceptibility measurements of xMOmiddot(100-x)[As2O3middotTeO2] xMOmiddot(100-x)
[As2O3middotPbO] and xMOmiddot(100-x)[3B2O3middotLi2O] glasses where MO =gt MnO or Fe2O3
431 Comparative study by electron paramagnetic resonance (EPR) of
xMnOmiddot(100-x)[As2O3middotBO] where BO =gt TeO2 or PbO
and xMnOmiddot(100-x) [3B2O3middotLi2O] glasses
In order to obtain more information regarding the behavior of manganese ions in
different vitreous matrices [3031] xMnOmiddot(100-x)[As2O3middotBO] where BO =gt TeO2 or PbO
and xMnOmiddot(100-x) [3B2O3middotLi2O] glasses were investigated by EPR spectroscopy on a large
compositional range with 0 le x le 50 mol The EPR spectra of Mn2+ for xMnOmiddot(100-
x)[As2O3middotPbO] (S1) xMnOmiddot(100-x)[As2O3middotTeO2] (S3) and xMnOmiddot(100-x)[3B2O3middotLi2O]
(S5) are presented in figure 418-20 These spectra present two absorption lines centered at gef
43 and gef 20 in all systems
The absorption line centered at gef 43 and is due to isolated Mn2+ ions [32] The
absorption line centered at gef 20 may be attributed to Mn2+ species interacting by magnetic
coupling[33] dipolar and or super exchange the last ones forming magnetic clusters [32]
The evolution of the spectra is easier to follow considering the dependence of
concentration on the EPR parameters the line - intensity (obtained as an integral of the area
under the corresponding EPR signal) J and the line - width ΔB The evolution of J and AB
reflects the structural transformations which appear in the glass matrices due to the increase of
manganese ions content
The intensity and the line - width of the resonance line from gef 43 for all
investigated systems is represented in figure 421(ab)
The intensity of the resonance line from gef 43 for all investigated glass systems
decreases due to the decrease of the isolated manganese ions numbers The line - width from
gef 43 for (S1) and (S3) systems decreases due to decrease of Mn2+ number and to the
structural disorder in glasses with the increase of MnO content For (S5) glass system the line
- width of the resonance line there is an increase in all compositional domains
The intensity of the resonance line from gef 20 can be observed as increasing up to
x=14 mol for (S1) system up to x=8mol for (S3) system and 20 mol for (S5)
system The line - width of the resonance line from gef 20 for (S1) and (S3) systems
increases up to 3 mol and 5mol for (S5) due to Mn2+ species interacting by magnetic
coupling dipole- dipole as the main broadening mechanism Over this concentration line ndash the
width of the resonance line from gef 20 is straight and it can be assumed that the
manganese ions begin to manifest super exchange magnetic interactions
25
1000 2000 3000 4000 5000
Firs
t der
ivat
ive
of a
bsor
ptio
n [u
a]
05
1
3
5
10
20
35
50
x [mol Mn2O3]amplif
B [G]
10
200
40
80
400
5
1
1
Fig 418 The EPR spectra of Mn2+ for xMnOmiddot(100-x)[As2O3middotPbO] (S1)
glass system
1000 2000 3000 4000 5000
Firs
t der
ivat
ive
of a
bsor
ptio
n [u
a]
x [mol MnO]
051
3
5
10
20
35
50
9
500
400
50
100
4
1
amplif
B [G]
1
Fig 419 The EPR spectra of Mn2+ for xMnOmiddot(100-x)[As2O3middotTeO2] (S3)
glass system
26
1000 2000 3000 4000 5000
501
B [G]
Firs
t der
ivat
ive
of a
bsor
ptio
n [u
a]
1
4
9
10
30
60
100
amplif
05
1
3
5
10
20
35
x [mol MnO]
Fe3+
Fig 420 The EPR spectra of Mn2+ for xMnOmiddot(100-x)[3B2O3middotLi2O] (S5)
glass system
0 2 4 6 8 10 12 14 16 18 20 22
x [mol]
J [ u
a]
S1 S3 S5
-2 0 2 4 6 8 10 12 14 16 18 20 22
50
100
150
200
250
300
S1 S3 S5
x [mol]
B
[G]
a b
Fig 421 The dependence on MnO content of the intensity (a) and width(b) of resonance
line at gef 43 for xMnOmiddot(100-x)[As2O3middotPbO] (S1) xMnOmiddot(100-x)[As2O3middotTeO2] (S3) şi
xMnOmiddot(100-x)[3B2O3middotLi2O] (S5) system glasses
27
0 10 20 30 40 50
x [mol]
J [ u
a]
S1 S3 S5
0 10 20 30 40 50
400
500
600
700
800
900
S1 S3 S5
x [mol]
B[G
]
a b
Fig 422 The dependence on MnO content of the intensity (a) and width b) of resonance
line at gef 20 for xMnOmiddot(100-x)[As2O3middotPbO] (S1) xMnOmiddot(100-x)[As2O3middotTeO2] (S3) and
xMnOmiddot(100-x)[3B2O3middotLi2O] (S5) system glasses
Following figure 418-20 it can be observed that (S1) and (S3) have had a similar
evolution but (S5) system presented for 05 le x le 5 mol (fig420) has a hyperfine
sextet[33] at gef 20due to Mn2+ isolated ions
432 Comparative study by magnetic susceptibility measurements of
xMnOmiddot(100-x)[As2O3middotBO] where BO =gt TeO2 or PbO and
xMnOmiddot(100-x)[3B2O3middotLi2O] glasses
The magnetic susceptibility data are in good agreement with the EPR result The
magnetic behavior of the glasses from xMnOmiddot(100-x)[As2O3middotBO] where BO =gt TeO2 (S3)
or PbO (S1) and xMnOmiddot(100-x)[3B2O3middotLi2O] (S5) glasses for 3 le x le 50 mol MnO are
presented in figure 423 - 25
For (S1) and (S3) system glasses up to x 3 mol and x 5 mol (S5) glass
system the temperature dependence of the reciprocal magnetic susceptibility obeys a Curie
law In this concentration range the manganese ions are predominantly isolated orand
participate in dipole-dipole interractions At higher concentrations the reciprocal magnetic
susceptibility obeys a Curie-Weiss law with negative paramagnetic Curie temperature (p)
characteristic to antiferromagnetic coupled ions by means of super exchange interractions(fig
426) This behavior of manganese ions is confirmed by the shape of the EPR spectra
28
100 150 200 250
2
4
6
8
10
12
14
16
18
20
22
T [K]
[
emu
mol
]-1
3 mol 5 mol 10 mol 20 mol 35 mol 50 mol
Fig423 The temperature dependence of -1 for xMnOmiddot(100-x)[As2O3middotPbO]
(S1) 3 le x le 50 mol
50 100 150 200 2500
2
4
6
8
10
12
14
16
18
20
22
3 mol 5 mol 10 mol 20 mol 35 mol 50 mol
T [K]
[
emu
mol
]-1
Fig424 The temperature dependence of -1 for xMnOmiddot(100-x)[ As2O3middotTeO2]
(S1) 3 le x le 50 mol
100 150 200 250
2
4
6
8
10
12
14
16
18
20
22
[em
u m
ol]-1
T [K]
3 mol 5 mol 10 mol 20 mol 35 mol 50 mol
Fig425 The temperature dependence of -1 for xMnOmiddot(100-x)[3B2O3middotLi2O]
(S5) 3 le x le 50 mol
29
0 10 20 30 40 50
0
20
40
60
80
100
x [mol]
-p [K
]
(S1) (S3) (S5)
Fig426Concentration dependence of (p) for sistemele xMnOmiddot(100-x)[As2O3middotPbO]
(S1) xMnOmiddot(100-x)[As2O3middotTeO2] (S3) şi xMnOmiddot(100-x)[3B2O3middotLi2O] (S5)
Using the representation 1 =f(T) the molar Curie constants CM the effective
magnetic moments and molar fraction of Mn2+(x1) şi Mn3+(x2) ions were calculated and
represented in tables 44 -6
Tabel 44 Molar Curie constants effective magnetic moments and molar fraction of Mn2+(x1) şi Mn3+(x2) ions in xMnOmiddot(100-x)[As2O3middotPbO] (S1) glasses
x
[mol MnO2] CMtimes102
[emu mol] ef
[microB] x1
[mol Mn2+O2] x2
[mol Mn3+O2] 3 1272 582 268 032 5 1979 562 343 157 10 3777 549 555 445 20 6688 517 492 1508 35 12239 502 377 3123 50 15427 496 268 4732
Tabel 45 Molar Curie constants effective magnetic moments and molar fraction of Mn2+(x1) şi Mn3+(x2) ions in xMnOmiddot(100-x)[As2O3middotTeO2] (S3)glasses
x
[mol MnO2] CMtimes102
[emu mol] ef
[microB] x1
[mol Mn2+O2] x2
[mol Mn3+O2] 3 1297 588 287 013 5 1938 556 312 188 10 3804 551 575 425 20 6766 52 549 1451 35 11148 504 441 3059 50 15528 498 358 4642
30
Tabel 46 Molar Curie constants effective magnetic moments and molar fraction of Mn2+(x1) şi Mn3+(x2) ions in xMnOmiddot(100-x)[3B2O3middotLi2O] (S5) glasses
x
[mol MnO2] CMtimes102
[emu mol] ef
[microB] x1
[mol Mn2+O2] x2
[mol Mn3+O2] 3 127 581 265 035 5 1919 554 303 197 10 3681 542 486 514 20 7215 519 53 147 35 1121 506 505 2995 50 15898 501 493 4507
433 Comparative study by electron paramagnetic resonance (EPR) of
xFe2O3middot(100-x)[As2O3middotBO] where BO =gt TeO2 or PbO and
x Fe2O3middot(100-x) [3B2O3middotLi2O] glasses
In order to obtain more information regarding the behavior of iron ions in
xFe2O3middot(100-x)[As2O3middotBO] where BO =gt TeO2 (S4) or PbO (S2) şi xFe2O3middot(100-
x)[3B2O3middotLi2O] glasses were investigated by EPR spectroscopy on a large compositional
range with 05 le x le 35 mol Fe2O3 The EPR spectra of Fe3+ in xFe2O3middot(100-
x)[As2O3middotPbO] (S2) xFe2O3middot(100-x)[As2O3middotTeO2] (S4) and xFe2O3middot(1-x)[3B2O3middotLi2O]
(S6) are presented in figure 427-29 These spectra present two absorption lines centered at
gef 43 and gef 20 up to x le 35mol Fe2O3 systems studied
The absorption line centered at gef 43 is due to isolated Fe3+ ions [34-36] The
absorption line centered at gef 20 may be attributed to Fe3+ species interacting by magnetic
coupling dipolar and or super exchange the last ones forming magnetic clusters [37-41]
The evolution of the spectra is easier to follow considering the dependence of
concentration on the EPR parameters the line - intensity (obtained as an integral of the area
under the corresponding EPR signal) J and the line - width ΔB The evolution of J and AB
reflects the structural transformations which appear in the glass matrices due to the increasing
of iron ions content
The intensity and the line - width of the resonance line from gef 43 for all
investigated systems is represented in figure 430 (a b) The intensity of the resonance line
from gef 43 increases for (S2) and (S4) up to 3 mol and up to 5 mol for (S6) then
decreases for all systems investigated A line broadening up to 3 mol from gef 43 for
these systems can be observed due to increasing of Fe3+ isolated number of ions
31
1000 2000 3000 4000 5000
40
Firs
t der
ivat
ive
of a
bsor
ptio
n [u
a]
B [G]
x [mol Fe2O3]
05
1
3
5
1020
35 2
40
20
10
10
10
amplif
Fig427 The EPR spectra of Fe3+ for xFe2O3middot(100-x)[As2O3middotPbO] (S2)
glass system
1000 2000 3000 4000 5000
100
B [G]
Firs
t der
ivat
ive
of a
bsor
ptio
n [u
a]
10080
20
50
20
20
3
05
1
5
102035
x [mol Fe2O3] amplif
Fig428 The EPR spectra of Fe3+ for xFe2O3middot(100-x)[As2O3middotTeO2] (S4)
glass system
32
1000 2000 3000 4000 5000
Firs
t der
ivat
ive
of a
bsor
ptio
n [u
a]
B [G]
3
05
1
5
10
20
35
x [mol Fe2O3]
30
50
20
20
10
30
30
amplif
Fig429 The EPR spectra of Fe3+ for xFe2O3middot(100-x)[3B2O3middotLi2O] (S6)
glass system
The intensity and the line - width of the resonance line from gef 43 for all
investigated systems is represented in figure 430 (a b)The resonance line from gef 20 is
attributed to Fe3+ ions that interact by magnetic coupling dipolar orand super exchange
interractions can be observed in all compositional domains
The intensity of the resonance line from gef 20 can be observed as increasing up to
x=35 mol for (S2) and (S6) system and 10 mol for (S4) system with increased iron
ions content The line - width of the resonance line from gef 20 increased up to 10mol
for (S2) system and up to 3 mol for (S4) and 5mol for (S6) due to Fe3+species
interacting by magnetic coupling dipole-dipole Above this concentration line - width of the
resonance line from gef 20 can be attributed to dipolar and super exchange magnetic
interactions The ΔB = f(x) dependence reflects the competion between the broadening
mechanism (dipole ndash dipole interactions the interactions between ions in diferent
valence state and structural disorder) and the narrowing ones (super exchange
interactions)
33
0 5 10 15 20 25 30 35 40
x [mol]
J [ u
a]
S2 S4 S6
a)
0 5 10 15 20 25 30 35 4040
60
80
100
120
140
160
180
200
220 S2 S4 S6
B[G
]
x [mol]
a b
Fig 430 The dependence on Fe2O3 content of the intensity (a) and width (b) of
resonance line at gef 43 for xFe2O3middot(100-x)[As2O3middotPbO] (S2)
xFe2O3middot(100-x)[As2O3middotTeO2] (S4) and xFe2O3middot(100-x)[3B2O3middotLi2O] (S6) glasses
0 5 10 15 20 25 30 35 40
x [mol]
J [ u
a]
S2 S4 S6
a)
0 5 10 15 20 25 30 35 40
200
400
600
800
1000
1200
1400
1600
x [mol]
B
[G] S2
S4 S6
a b
Fig 431 The dependence on Fe2O3 content of the intensity (a) and width (b) of
resonance line at gef 20 for xFe2O3middot(100-x)[As2O3middotPbO] (S2)
xFe2O3middot(100-x)[As2O3middotTeO2] (S4) and xFe2O3middot(100-x)[3B2O3middotLi2O] (S6) glasses
34
434 Comparative study by magnetic susceptibility measurements of
xFe2O3middot(100-x)[As2O3middotBO] where BO =gt TeO2 or PbO and
xFe2O3middot(100-x) [3B2O3middotLi2O] glasses
The magnetic susceptibility data are in good agreement with the EPR result The magnetic
behavior of the glasses xFe2O3middot(100-x)[As2O3middotPbO] (S2) xFe2O3middot(100-x)[As2O3middotTeO2]
(S4) and xFe2O3middot(100-x)[3B2O3middotLi2O] (S6) for 3 x 50 mol Fe2O3 are presented in
figure 432 - 34
For (S2) glass systems up to x 10 mol x 3 mol (S5) glass systems and x 5
mol (S6) glass systems the temperature dependence of the reciprocal magnetic susceptibility
obeys a Curie law In this concentration range the iron ions are predominantly isolated orand
participate in dipole-dipole interactions At higher concentrations the reciprocal magnetic
susceptibility obeys a Curie-Weiss law with negative paramagnetic Curie temperature (p)
characteristic to antiferromagnetic coupled ions by means of super exchange interactions(fig
435) This behavior of iron ions is confirmed by the shape of the EPR spectra
80 100 120 140 160 180 200 220 240 260 2800
1
2
3
4
5
6
7
8
9
10
11
[
emu
mol
]-1
T [K]
3 mol 5 mol 10 mol 20 mol 35 mol 50 mol
Fig432 The temperature dependence of -1 for xFe2O3middot(100-x)[As2O3middotPbO] (S2)
3 x 50 mol
35
80 100 120 140 160 180 200 220 240 260 2800
1
2
3
4
5
6
7
8
9
10
T [K]
[
emu
mol
]-1
3 mol 5 mol 10 mol 20 mol 35 mol 50 mol
Fig433 The temperature dependence of -1 for xFe2O3middot(100-x)[As2O3middotTeO2] (S4)
3 x 50 mol
80 100 120 140 160 180 200 220 240 260 2800
1
2
3
4
5
6
7
8
9
10
11
3 mol 5 mol 10 mol 20 mol 35 mol 50 mol
T [K]
[
emu
mol
]-1
Fig434 The temperature dependence of -1 for xFe2O3middot(100-x)[3B2O3middotLi2O] (S6)
3 x 50 mol
36
0 10 20 30 40 50
0
10
20
30
40
50
x [mol]-
p [K]
(S2) (S4) (S6)
Fig435Concentration dependence of (p) for sistemele xFe2O3middot(100-x)[As2O3middotPbO] (S2) xFe2O3middot(100-x)[As2O3middotTeO2] (S4) and xFe2O3middot(100-x)[3B2O3middotLi2O] (S6)
for 3 x 50 mol Fe2O3
Using the representation 1 = f(T) the molar Curie constants CM the effective
magnetic moments and molar fraction of Fe3+(x1) şi Fe2+(x2) ions were calculated and
represented in tables 47-9
Table 47 Molar Curie constants effective magnetic moments and molar fraction of
Fe3+(x1) şi Fe2+(x2) ions in xFe2O3middot(100-x)[As2O3middotPbO] glasses (S2)
x [mol Fe2O3]
CMtimes102
[emu mol] ef
[microB] x1
[mol Fe23+O3]
x2 [mol Fe2
2+O3] 3 2526 58 261 039 5 393 56 332 168 10 7326 541 476 524 20 13459 519 53 147 35 23364 516 829 2671 50 32154 507 767 4233
Table 48 Molar Curie constants effective magnetic moments and molar fraction of
Fe3+(x1) şi Fe2+(x2) ions in xFe2O3middot(100-x)[As2O3middotTeO2] glasses (S4)
x [mol Fe2O3]
CMtimes102
[emu mol] ef
[microB] x1
[mol Fe23+O3]
x2 [mol Fe2
2+O3] 3 2571 585 277 023 5 4016 566 363 137 10 7911 562 686 314 20 14992 521 643 929 35 22676 509 601 2899 50 30959 497 313 4687
37
Table 49 Molar Curie constants effective magnetic moments and molar fraction of Fe3+(x1) şi Fe2+(x2) ions in xFe2O3middot(100-x)[3B2O3middotLi2O] glasses (S6)
The results allowed to consider that the magnetic properties of the studied glasses can
be explained through magnetic interractions between Fe3+ - Fe3+ Fe3+- Fe2+ and Fe2+- Fe2+ that
explain the dependences of RPE parameters concentration
SELECTED CONCLUSIONS
In this thesis xMOmiddot(100-x)[As2O3middotTeO2] xMOmiddot(100-x) [As2O3middotPbO] and
xMOmiddot(100-x)[3B2O3middotLi2O] glasses where MO =gt MnO or Fe2O3 were comparatively
studied in 0 le x le 50 mol The structural modifications of investigated glass matrices were
comparatively followed in function of the manganese or iron ions on the investigated glass
matrices were followed
The study by FT-IR spectroscopy shows that the evolution of the spectra of
xMnOmiddot(100-x) [As2O3middotPbO] with the addition and the increasing of the MnO content suggest
that the manganese ions break up a part of As ndash O ndash As Pb ndash O ndash Pb and probably of As ndash O ndash
Pb bonds The addition of MnO in the As2O3middotPbO glass matrix is leading to a disordering of
the glasses structure with the increasing of the MnO content
The evolution of the absorption bands for FT ndash IR spectrum of xFe2O3middot(1-x)
[As2O3middotPbO] glasses are determined by the addition of Fe2O3 content It can be observed to
shift the bands assigned As ndash O ndash As vibrations from AsO3 units due to changing to length As
ndash O ndash As bonds and interne angles of AsO3 units disappears PbO4 units and appears FeO6
units The addition of Fe2O3 in the As2O3middotPbO glass matrix determined a disordering of the
glasses structure with the increasing of the Fe2O3 content
From FT-IR absorption spectra of the investigated xMOmiddot(100-x)[As2O3middotTeO2] glasses
system where MO =gt MnO or Fe2O3 it can be observed that the addition and increasing of
manganese ions concluded the contraction of As-O-As bonds from totally symmetric
x [mol Fe2O3]
CMtimes102
[emu mol] ef
[microB] x1
[mol Fe23+O3]
x2 [mol Fe2
2+O3] 3 2542 582 268 032 5 3943 561 338 162 10 7423 544 506 494 20 13568 520 549 1451 35 23094 513 731 2769 50 31746 503 584 4416
38
stretching vibrations of AsO3 units for x ge10 mol there can be an increase in number of As-
O-As bonds from AsO3 units orand a length these linkage to doubly degenerate stretching
vibrations of AsO3 units and a stretching vibration mode of TeO3 tp with NBO It can be
remarked from the FT-IR absorption spectra the gradual transformation of symmetric
stretching vibration mode of Te-O bonds from TeO3 units in TeO4 (tbp) units and the presence
of MnO2 units Once with the addition of iron ions the xFe2O3middot(100- x)[As2O3middotTeO2]
glasses behave like xMnOmiddot(100-x)[As2O3middotTeO2] glasses but in this system the
appearance of FeO6 units can be seen
From FT-IR spectra in xMOmiddot(100-x)[3B2O3middotLi2O] glasses where MO =gt MnO or
Fe2O3 can be concluded that the addition of manganese or iron ions in vitreous matrices leads
to the increase of the disorder degree
The study by Raman spectroscopy shows that the evolution of the spectra the addition
of MnO in the [As2O3middotPbO]glass matrix determined an order degree of the vitreous matrix
The intensity of the bands attributed vibrations As ndash O ndash As bonds from As2O units and
bending vibrations of As ndash O ndash As from As2O units shift to a higher wave length that suggests
an increase in the As2O units comparative to AsO3 units With the increase of iron ions content
in the As2O3middotPbO glass matrix the number of these structural units decreases due to the
increasing of the disorder in the studied glasses
With the increasing of manganese content in As2O3TeO2 glass matrix the intensity
of these bands is increasing showing that the manganese content favorites the formation of
TeO4 (tbp) and TeO3 (tp) units For high concentrations of iron ions in xFe2O3middot(100-
x)[As2O3 TeO2] system of glasses the number of As-O-As linkages appear in Raman
spectrum due to stretching vibrations of As-O-As and vibrations of the continuous TeO4 (tbp)
network show a significant decrease
Studying the Raman spectra of xMOmiddot(1-x)[3B2O3middotLi2O] glass system where MO =gt
MnO or Fe2O3 it has been observed that the absorption bands presented in vitreous matrix
gradually decreased with an increase in the manganese or iron content in both glasses system
which suggested an increase of the disorder in these vitreous systems
The EPR spectra presents the behavior of manganese or iron ions in different vitreous
matrices xMOmiddot(100-x)[As2O3middotBO] where MO=gtMnO or Fe2O3 and BO =gt TeO2 or
PbO and xMOmiddot(100-x) [3B2O3middotLi2O] Glasses were investigated by EPR spectroscopy on a
large compositional range with 0 le x le 50 mol The absorption line centered at gef 43 and
is due to isolated Mn2+ ions The absorption line centered at gef 20 may be attributed to
Mn2+ species interacting by magnetic coupling dipolar and or super exchange the last ones
forming magnetic clusters The EPR spectra of Fe3+ in xFe2O3middot(100-x)[As2O3middotPbO]
xFe2O3middot(100-x)[As2O3middotTeO2] and xFe2O3middot(1-x)[3B2O3middotLi2O] are presented two absorption
lines centered at gef 43 and gef 20 up to x le 35mol Fe2O3 systems studied
39
The absorption line centered at gef 43 is due to isolated Fe3+ ions The absorption
line centered at gef 20 may be attributed to Fe3+ species interacting by magnetic coupling
dipolar and or super exchange the last ones forming magnetic clusters
The evolution of the spectra is easier to follow considering the dependence of
concentration on the EPR parameters the line - intensity (obtained as an integral of the area
under the corresponding EPR signal) J and the line - width ΔB The evolution of J and AB
reflects the structural transformations which appear in the glass matrices due to the increase of
manganese ions content
The magnetic susceptibility data are in good agreement with the EPR result The
magnetic behavior of the glasses from xMnOmiddot(100-x)[As2O3middotBO] where BO =gt TeO2 (S3)
or PbO (S1) and xMnOmiddot(100-x)[3B2O3middotLi2O] (S5) glasses for 3 le x le 50 mol MnO
For (S1) and (S3) system glasses up to x 3 mol and x 5 mol (S5) glass
system the temperature dependence of the reciprocal magnetic susceptibility obeys a Curie
law In this concentration range the manganese ions are predominantly isolated orand
participate in dipole-dipole interractions At higher concentrations the reciprocal magnetic
susceptibility obeys a Curie-Weiss law with negative paramagnetic Curie temperature (p)
characteristic to antiferromagnetic coupled ions by means of super exchange interractions This
behavior of manganese ions is confirmed by the shape of the EPR spectra Using the
representation 1 =f(T) the molar Curie constants CM the effective magnetic moments
and molar fraction of Mn2+(x1) şi Mn3+(x2) ions were calculated The magnetic susceptibility
data are in good agreement with the EPR result
The magnetic behavior of the glasses xFe2O3middot(100-x)[As2O3middotPbO] (S2)
xFe2O3middot(100-x)[As2O3middotTeO2] (S4) and xFe2O3middot(100-x)[3B2O3middotLi2O] (S6) for 3 x 50
mol Fe2O3 are presented For (S2) glass systems up to x 10 mol x 3 mol (S5)
glass systems and x 5 mol (S6) glass systems the temperature dependence of the
reciprocal magnetic susceptibility obeys a Curie law In this concentration range the iron ions
are predominantly isolated orand participate in dipole-dipole interactions At higher
concentrations the reciprocal magnetic susceptibility obeys a Curie-Weiss law with negative
paramagnetic Curie temperature (p) characteristic to antiferromagnetic coupled ions by
means of super exchange interactions(fig 435) This behavior of iron ions is confirmed by the
shape of the EPR spectra Using the representation 1 = f(T) the molar Curie constants
CM the effective magnetic moments and molar fraction of Fe3+(x1) şi Fe2+(x2) ions were
calculated
40
REFERENCES
Chapter 1
[1] I Ardelean bdquoIntroducere icircn studiul materialelor oxidice cu structură vitroasă EdNapocaStar Cluj Napoca 2002 [2] G Srinivasarao N Veeraiah J All Com 327 52-65(2001) [3] G Srinivasarao N Veeraiah J Phys Chem Solids 63705-717(2002) [4] DBecherescu VCristea FMarx IMenessz FWinter Chimia stării solide Ed Şt şi Encicl Bucucureştivol 1 1983 [5] J Wong CAAngell Glass-Structure by Spectroscopy Dekker Inc New York 1976 [6] BEWarren HKKrutter O Morningstat J Am Ceram Soc 19 202 (1936) [7] LLSperry JD Mackenzie Phys Chem Glasses 9 91 (1968) [8] WLKonijnendijk JMStevels J Non-Cryst Solids 18 307 (1975) [9] FCEversteyn JM Stevels HJ Naterman Phys Chem Glasses 1 134 (1963) [10] G Fuxi Optical and Spectroscopie Properties of Glass Springer-Verlag Shanghai Scientific Technical Pub Shanghai 1991 [11] YDYiannopoulos GDChryssikos EIKamitsos Phys Chem Glasses 42(3) 164 (2001) [12] MGFerreira da Silva BFOCosta J Non-Cryst Solids 293-295 534 (2001) [13] RYordanova YDimitriev VDimitriev S Kassabov DKlissurski JNon-Cryst Solids 201 141 (1996) [14] W L Konijnendijk J M Stevels J Non-Cryst Solids 18 307 (1980) [15] M Iron M Couzi ALevasseur JBrethous JSolidState Chem 31 285 (1980) [16] TFurukawa WBWhite PhzsChemGlasses 21 85 (1980) [17] E I Kamitsos M A Karakassides GD Chryssikos J Phys Chem 90 4528 (1986) [18] E I Kamitsos M A Karakassides GD Chryssikos J Phys Chem 91 1073 (1987) [19] TWBril Philips Res Rep Suppl 2 117 (1976) [20] E I Kamitsos M A Karakassides GD Chryssikos J Phys Chem 30 203 (1989) [21] BNMeera JRamakrishna J Non-Cryst Solids 159 1 (1993) [22] KWitke THubert PReich JRamanSpectr 24 407 (1993) [23] E I Kamitsos M A Karakassides Phys Chem Glasses 30 19 (1989) [24] MPeteanu Teză de doctoratrdquo Universitatea Babeş-Bolyairdquo Cluj Napoca (1989) [25] PCTaylor PJBray JPhys Chem Solids 33 43 (1972) [26] IArdelean MPeteanu GhIlonca DPop Solid State Commun 33 653 (1980) [27] AV De Wijn RE Van Balderen JKemPhys 46 4 (1967) [28] DL Griscom RE Griscom J Phys Chem Glasses 12 19 (1971) [29] JWH Schreurs JChem Phys 69 2151 (1978) [30] AlNicula M Peteanu IArdelean Studia Univ Babeş-Bolyai Physica 2 65 (1979) [31] M Peteanu IArdelean SFilip ITodor GSalvan Studia Univ Babeş-Bolyai Physica XL 2 9 (1995) [32] IArdelean M Peteanu SFilipV Simon ITodor Solid State Commun 105 (5) 339 (1998) [33] SKMendiratta EGuedes de Sousa JMatSci Lett7 733 (1988) [34] IArdelean M Peteanu SFilip V Simon GGyorffy Solid State Commun 102 (4) 341 (1997) [35] IArdelean M Peteanu SFilip V Simon FCiorcas ITodor JMagnMagn Mat 196-197 257 (1999) [36] JKliava RBerger YServant JEmery JMGreneche JTrokss J Non-Cryst Solids 202 205 (1996) [37] LDBogomolova NA Krasilnikova VLBogdanov VDKhaliev VV Mitrofanov J Non-Cryst Solids 188 130 (1995) [38] DLoveridge SPark PhysChem Glasses 12 19 (1971) [39] IArdelean G Salvan M Peteanu V Simon FCiorcas Mod PhysLett B 13 (22-23) 801 (1999)
41
[40] JLRao AMuraly EDRao J Non-Cryst Solids 202 215 (1996) [41] CPrakash S Husain RJ Singh SMollah JAlloys Compon 326 47 (2001) [42] EGuedes de Sousa SKMendiratta JMMachado Da Silva Portugal Phys 17 (3-4) 203 (1986) [43] TCastner GSNewell WCHolton CP Slichter JChem Phys 32 668 (1960) [44] SPChaudhuri SKPatra JMatSci 35 4735 (2000) [45] IArdelean HH Qiu HSakata Matt Lett 32 335 (1997) Chapter 2 [1] J Wong C A Angel Glass Structure by Spectroscopy Marcel Dekker inc New-York 1976 [2] I Ardelean bdquoIntroducere icircn studiul materialelor oxidice cu structură vitroasă EdNapocastar Cluj-Napoca 2002 [3] N Avram GH Mateescu Spectroscopia icircn infraroşu Aplicaţii icircn chimia organică Ed Tehnică Bucureşti 1968 [4] TIliescu Spectroscopie optică moleculară vibraţională şi electronică Ed Casa Cărţii de Ştiinţă Cluj- Napoca 2000 [5] S Aştilean bdquoMetode şi tehnici moderne de spectroscopie optică Ed Casa Cărţii de Ştiinţă Cluj - Napoca 2002 p 5 [6] I Ursu Rezonanţă Electronică de Spinrdquo Ed AcademieiBucureşti (1965) [7] CHHurd ContempPhys 23 (5) 469 (1982) [8] GWAnderson WDCompton JChemPhys52 6166 (1970) [9] MS Seehra GSrinivasan Landolt-Bornstein (New Series) SubVolume F3 Springer-Verlag Berlin 1994 [10] GToulouse ContempPhys 2115 (1977) [11] NMMurayMagnetic susceptybility EdInterscience New York P1773 1963 [12] JBGoodenough Magnetism and Chemical Bond EdInterscience New York 1963 [13] IArdelean G Salvan M Peteanu V Simon FCiorcas Mod PhysLett B 13 (22-23) 801 (1999) [14] IArdelean MPeteanu R Ciceo Lucăcel Studii de rezonanţă paramagnetică electronică şi magnetice ale unor ioni 3d icircn sticle pe bază de B2O3 Ed Presa Univesitară Clujeană 2005 [15] IArdelean PhysStatSol (b) 87K137 (1978) [16] IArdelean Solid State Commun 31 75 (1979) [17] EJFrieble LKWilson AWDozier DLKinser PhysStatSol (b) 45 323 (1971) [18] DWMoon JMAitken RKMcCrone GS Ciloszik PhysChe Glasses 16 (5) 91 (1975) [19] SFilip Teză de doctorat UnivBabeş-Bolyai Cluj Napoca 1996 [20] CJSchinkel GWRathenou Physics of Non-Crystaline Solids North Holland Publ Co Amsterdam 215 1965 [21] EJFrieble LKWilson NCKoon DLKinser JAm Ceram Soc 57-237 (1974) [22] RJLandry JT Fournier CGYoung JChemPhys 46 1285 (1967) [23] WSimpson PhysStatSolidi b40 207 (1970) [24] RHasegawa PhysRevB b(5) 1631 (1971) [25] IArdelean GhIlonca MPeteanu Solid State Commun 52 145 (1984) [26] IArdelean GhIlonca OCozar J Physique 49 C8 1107 (1988) Chapter 3 [1] LFBates Modern Magnetism p133 Cambridge University Press London 1962 [2] IArdelean GhIlonca DBarbos Solid State Commun 40 769 (1981) [3] EBurzo IUrsu DUngur IArdelean JMatSci 15 581 (1980) [4] EBurzo IUrsu DUngur IArdelean MatResBull 15 1273 (1980) [5] DLGriscom Glass Science and Technology 48 151 (1990) [6] PJBray AH Silver Modern aspects of the vitreous state vol1 Butterworth
42
London 1960 [7] IArdelean Teza de doctorat UnivBabeş-Bolyai Cluj Napoca 1979 [8] SAştilean bdquoMetode şi tehnici moderne de spectroscopie opticărdquo EdCasa Cărţii de Ştiinţă Cluj ndash Napoca 2002 p5 [9] IArdelean RCiceo-Lucăcel ldquoFizica şi Tehnologia Materialelor Oxidice Lucrări Practicerdquo Ed Univ ldquoBabeş-Bolyairdquo Cluj-Napoca 2000 [10] VPop IChicinaş NJumate Fizica materialelor Metode experimentalerdquo EdPresa Universitară Clujeană 2001 [11] IUrsu Rezonanţă electronică de spinrdquo EdAcademiei Bucureşti 1965 Chapter 4 [1] I Ardelean S Lupşor D Rusu Solid State Sci 10 1384(2008) [2] I Ardelean S Lupşor D Rusu trimis spre publicare la Physica B decembrie 2009 [3] P Tarte Spectrochim Acta 18 467 (1962) [4] R A Condrate J Non ndash Cryst Solids 84 26 (1986) [5] G Srinivasarao N Veeraiah Phys Stat Sol (a) 191 370(2002) [6] G Srinivasarao N Veeraiah J Phys Chem Solids 63 705(2002) [7] G Srinivasarao N Veeraiah J All Com 327 52 (2001) [8] DK Durga N Veeraiah Bull Mater Sci 24 (4) 421 (2001) [9] F F Bentley L D Smithson A L Rozek InfraredndashSpectra and Characteristic Frequencies 700-300 cm-1 Interscience New York 1968 p 103 [10] O Noguera T Merle-Mejean AP Mirgorodsky MB Smirnov P Thomas J-C Champarnaud-Mesjard J Non-Cryst Solids 330 50 (2003) [11] BVR Chowdari KL Tan Fang Ling Solid State Ionics 113 ndash 115 711(1998) [12] C Jiang J Zhang H Mao F Gan Glass Technol 39(6) 200(1998) [13] MR Sahar K Sulhadi MS Rohani J Mater Sci 42 824(2007) [14] C Horea D Rusu I Ardelean J Mater Sci Mater Electron 20 905(2009) [15] GE Rachkovskaya GB Zakharevich J Appl Spectrosc 74 86(2007) [16] I Ardelean S Lupşor D Rusu trimis spre publicare la Journal of Materials Science Materials in Electronics decembrie 2009 [17] I Ardelean S Lupşor D Rusu trimis spre publicare la Modern Physics Letters B decembrie 2009 [18] R Iordanova Y Dimitriev V Dimitrov S Kassabov D Klissurski J Non ndash Cryst Solids 231 227 (1998) [19] R Iordanova Y Dimitriev S Kassabov D Klissurski J Non ndash Cryst Solids 204 141 (1996) [20] J O Jensen S J Gilliam A Banerjee D Zeroka S J Kirkby C N Merrow J Mol Struct (Theochem) 664 145 (2003) [21] G N Papatheodorou S A Solin Solid State Commun 16 5 (1975) [22] BVR Chowdari KL Tan Fang Ling J Mat Sci 35 2015 (2000) [23] R C Lucacel C Marcus V Timar I Ardelean Solid State Sci 9 850 (2007) [24] CP Varsamis EI Kamitsos GD Chryssikos Solid State Ionics 136ndash137 1031 (2000) [25] Sherief M Abo-Naf Fatma H El Batal Moenis A Azooz Mat Chem Phys 77 846 (2002) [26] SG Motke SP Yawale SS Yawale Bull Mater Sci 25 (10) (2002) [27] R Akagi N Ohtori N Umesaki J Non ndash Cryst Solids 293 471(2001) [28] E I Kamitsos M A Karakassides G D Chryssikos J Phys Chem 91(5) 1073 (1987) [29] H Ushida Y Iwadate T Hattori S Nishiyama K Fukushima Y Ikeda M Yamaguchi M Misawa T Fukunaga T Nakazawa S Jitsukawa J Alloys Compd 377 167 (2004) [30] I Ardelean F Ciorcas M Peteanu S Lupşor G Salvan Balkan Phys Lett 5 860 (1997)
43
[31] I Ardelean M Peteanu V Simon O Cozar F Ciorcas S Lupşor J Magn Magn Mater 196 253 (1999) [32] IArdelean MPeteanu GhIlonca Phys Stat Sol (a) 58 K33(1980) [33] IArdelean MPeteanu R Ciceo-Lucăcel ldquoStudii de rezonanţă paramagnetică electronică şi magnetice ale unor ioni 3d icircn sticle pe bază de B2O3rdquo Ed Presa Univ Clujeană Cluj Napoca 2005 p 171 [34] JLRao AMuraly EDRao J Non-Cryst Solids 202 215 (1996) [35] RPSChakradhar AMurali JLRao Optical Mat 10 109 (1998) [36] IArdelean MPeteanu SFilip VSimon GGyorffy Solid State Commun 102(4) 341 (1997) [37] IArdelean MPeteanu VSimon SFilip FCiorcaş ITodor J Magn Magn Mat 196-197 257 (1999) [38] IArdelean GSalvan MPeteanu VSimon CHimcinschi FCiorcas Mod Phys Lett B 13(22-23) 801 (1999) [39] IArdelean HHQiu HSakata Mat Lett 32 335 (1997) [40] SPChaudhuri SKPatra J Mat Sci 35 4735 (2000) [41] I Ardelean M Peteanu V Simon G Salvan J Mat Sci Technol 18 (3) 1 (2002)
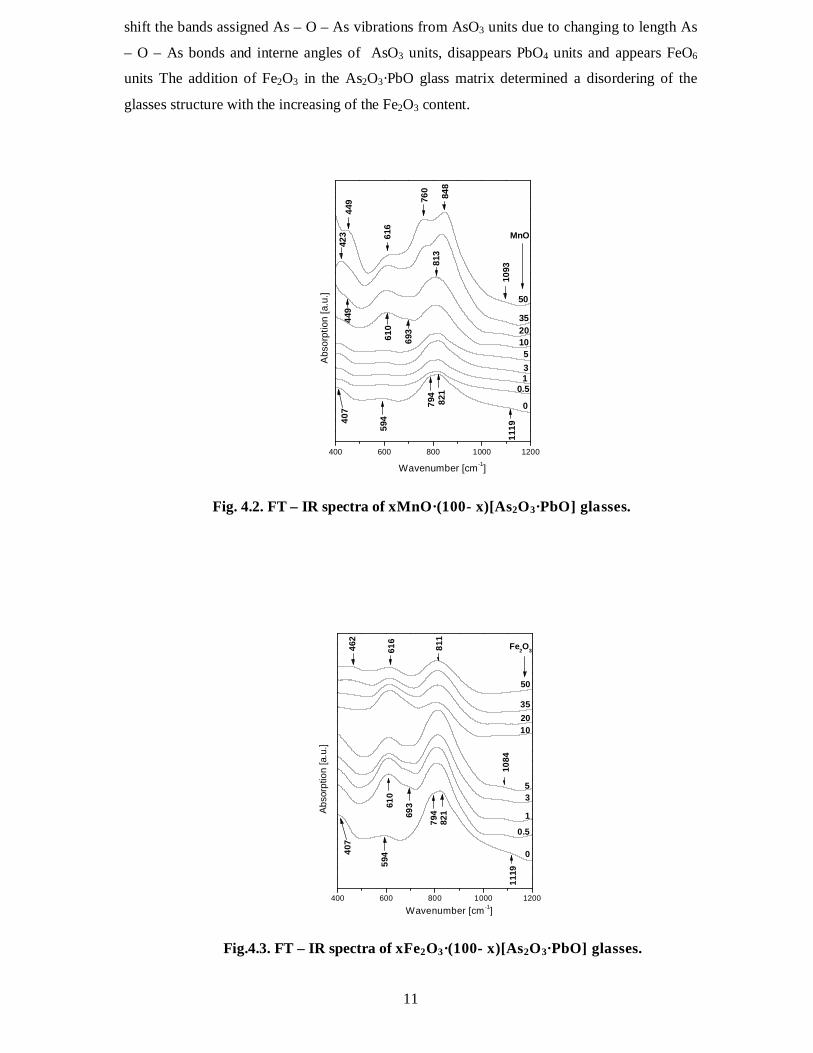
11
shift the bands assigned As ndash O ndash As vibrations from AsO3 units due to changing to length As
ndash O ndash As bonds and interne angles of AsO3 units disappears PbO4 units and appears FeO6
units The addition of Fe2O3 in the As2O3middotPbO glass matrix determined a disordering of the
glasses structure with the increasing of the Fe2O3 content
400 600 800 1000 1200
610
813
449
1093
423
449
616
760 848
821
794
594
20A
bsor
ptio
n [a
u]
Wavenumber [cm-1]
05
0
35
10
35
50
1
MnO
407
1119
693
Fig 42 FT ndash IR spectra of xMnOmiddot(100- x)[As2O3middotPbO] glasses
400 600 800 1000 1200
616
462
811
407
594
Abs
orpt
ion
[au
]
Wavenumber [cm -1]
05
20
0
35
10
35
50
1
Fe2O3
821
79469
3
1119
1084
610
Fig43 FT ndash IR spectra of xFe2O3middot(100- x)[As2O3middotPbO] glasses
12
413 Comparative study by FT-IR spectroscopy of
xMOmiddot(100-x)[As2O3middotTeO2] vitreous systems where MO =gt MnO or Fe2O
The infrared absorption spectra obtained for xMOmiddot(1-x)[As2O3middotTeO2] glass system
where MO =gt MnO or Fe2O3 with 0 le x le 50 mol are presented in figure 44 -5 and their
structural assignments are summarized in table 41[1617] The characteristic absorption bands
for crystalline As2O3 [5-8] PbO [79] TeO2 [810-15] MnO2 and Mn3O4 [9] and characteristic
bands for Fe2O3 [1819 ] were used as a reference point in the results discussion
Fig 44 FT ndash IR spectra of xMnOmiddot(100- x)[As2O3middotTeO2] glasses
Fig45 FT ndash IR spectra of xFe2O3middot(100- x)[As2O3middotTeO2] glasses
400 600 800 1000 1200
565
422 690 830
05
Abs
optio
n [a
u]
Wavenumber [cm-1]
0
3
5
35 50
1
MnO
854 733 644
1119
10 20
400 600 800 1000 1200
462650
812
713
561
05
20
Wavenumber [cm-1]
Abs
orpt
ion
[au
]]
0
3 5
10
35 50
1
Fe2O3
854 733
644
1119
13
This behavior of the studied glasses with the addition and increasing of MnO content
suggests that the structure observed in the glass matrix is conserving up to 5 mol MnO
where the structure takes another form From a structure dominated by AsO3 TeO4 tbp and
TeO3 tp units the structure became dominated by TeO4 tbp and MnO2 units and in a small
measure of AsO3 and TeO3 tp units For higher concentrations it can not be specified exactly
which of the last two structural units have the biggest proportion in these glasses From FT-IR
absorption spectra of the investigated glass system it can be observed that the addition and
increasing of manganese ions concluded the contraction of As-O-As bonds from totally
symmetric stretching vibrations of AsO3 units for x ge10 mol there can be an increase in
number of As-O-As bonds from AsO3 units orand a length these linkage to doubly degenerate
stretching vibrations of AsO3 units and a stretching vibration mode of TeO3 tp with NBO It
can be remarked from the FT-IR absorption spectra the gradual transformation of symmetric
stretching vibration mode of Te-O bonds from TeO3 units in TeO4 (tbp) units and the presence
of MnO2 units Once with the addition of iron ions the xFe2O3middot(100- x)[As2O3middotTeO2]
glasses behave like xMnOmiddot(100-x)[As2O3middotTeO2] glasses but in this system the
appearance of FeO6 units can be seen
414 Comparative study by FT-IR spectroscopy of
xMnOmiddot(100- x)[As2O3middotBO] vitreous systems were BO =gt TeO2 or PbO
The infrared absorption spectra obtained for xMnOmiddot(100- x)[As2O3middotBO] vitreous
systems where BO =gt TeO2 or PbO with 0 le x le 50 mol MnO are presented in figure
42 and 44 Following the infrared absorption spectra it can be observed that for
xMnOmiddot(100- x)[As2O3middot PbO] glass system the most disordered structure to exist for 0
le x le 5 mol MnO and to xMnOmiddot(100-x)[As2O3middot TeO2] glass system for 1 le x le 5 mol
MnO For x ge 5 mol MnO manganese ions break up a part of As ndash O ndash As Pb ndash O ndash Pb
and probably of As ndash O ndash Pb bonds to favor the increase in number of PbO4 units and
appearance of MnO2 units For x ge 10 mol MnO observed comparatively in both system
glasses the addition of manganese ions suggests for the first system a modification in linkage
characteristic units and for the second system an improvement for structural units of As2O3middot
TeO2 vitreous matrice also linkage characteristic units
415 Comparative study by FT-IR spectroscopy of
xFe2O3middot(100-x)[As2O3middotBO] vitreous systems where BO =gt TeO2 or PbO
The infrared absorption spectra obtained for xFe2O3middot(100- x)[As2O3middotBO] vitreous
systems where BO =gt TeO2 or PbO with 0 le x le 50 mol Fe2O3 are presented in figure
43 and 45
14
The evolution of the spectra with the addition and the increasing of the Fe2O3 content
suggest that the iron ions break up a part of As ndash O ndash As Pb ndash O ndash Pb and probably of As ndash O
ndash Pb bonds It can be observed a shift in the bands assigned As ndash O ndash As vibrations from AsO3
units due to changing to length As ndash O ndash As bonds and interne angles of AsO3 units the PbO4
units disappear and FeO6 units appear For x ge 5 mol Fe2O3 observed comparatively in
both system glasses the addition of iron ions suggests for the first system a modification in
linkage characteristic units of As2O3middotPbO and for the second system an improvement for
structural units of As2O3middot TeO2 vitreous matrice also linkage characteristic units appearance
of FeO6 units in both system
416 Comparative study by Raman spectroscopy of
As2O3middotTeO2 and As2O3middotPbO vitreous matrices
In order to obtain new information regarding the role of the modifier in the
formation of vitreous matrices there were made comparative studies by Raman
spectroscopy The Raman spectroscopy are presented in figure 46(ab) The wave
length and the structural assignments of Raman spectra of As2O3middotPbO şi As2O3middotTeO2 vitreous
matrices are presented in table 42
Table 42Wavenumber and the structural assignements of Raman spectra
of As2O3middotPbO and As2O3middotTeO2 vitreous matrices
~ [cm 1 ]
As2O3middotPbO As2O3middotTeO2
Attribution
~826 cm-1
~ 816 cm-1
Stretching vibrations of As-O-As
~ 752 cm-1
Vibrations of the continuous TeO4 (tbp) network
~ 627 cm-1
Vibrations As ndash O ndash As bonds from As2O units
~ 580 cm-1
Stretching vibrations of As-O-As
~ 525 cm-1
Vibrations O-As-O bonds from AsO3 units
~ 438cm-1
Symmetric bending vibrations of Te ndash O ndash Te vertex linkages between different TeO4 (tbp) TeO3+1 polyhedra Stretching vibrations of As-O-As of AsO3 units
~ 345 cm-1
Bending vibrations of As ndash O ndash As from As2O units
15
200 400 600 800 1000
As2O3PbO
Ram
an In
tens
ity [a
u]
LWavenumber [cm-1]
345
826
525
627a)
a
200 400 600 800 1000
816
752
580 R
aman
Inte
nsity
[au
]
Wavenumber [cm-1]
As2O3TeO2
438
b)
b
Fig46 Raman spectra of vitreous matrices a As2O3middotPbO şi b As2O3middotTeO2
The Raman spectrum of As2O3middotPbO glass matrix presents four bands at 826 cm-1
627 cm-1 525 cm-1 and 345 cm-1 The band from 826 cm-1 can be assigned to As ndash O ndash
As stretching vibrations [20] The band centered at 627 cm-1 can be assigned to vibrations As
ndash O ndash As bonds from As2O units the band from 525 cm-1 are assigned vibrations O-As-O
bonds from AsO3 units [21] The band of 345 cm-1 are attributed to As ndash O ndash As bending
vibrations from As2O units[2021]
The Raman spectrum of As2O3middot TeO2 glass matrix presents four bands at 816 cm-1
752 cm-1 580 cm-1 and 438 cm-1 The band from 816 cm-1 can be assigned to As ndash O ndash
As stretching vibrations [20] The band centered at 752 cm-1 can be assigned to vibrations of
the continuous TeO4 (tbp) network [22] The band of 580 cm-1 are attributed to As ndash O ndash As
stretching vibrations [12] The band centered at 438 cm-1 can be assigned symmetric bending
vibrations of Te ndash O ndash Te vertex linkages between different TeO4 (tbp) TeO3+1 polyhedra and
As ndash O ndash As stretching vibrations of AsO3 units
16
417 Study by Raman spectroscopy of xMOmiddot(100- x)[As2O3middotPbO]
vitreous systems where MO =gt MnO or Fe2O3
The Raman spectra obtained for xMOmiddot(100- x)[As2O3middotPbO] vitreous systems where
MO =gt MnO or Fe2O3 with 0 le x le 50 mol are presented in figure 47-8 and their
structural assignments are summarized in table 42
200 400 600 800 1000
368
833
345
1
3
Lungimea de unda [cm-1]
Inte
nsita
te R
aman
[ua
]
20
05
0
5
10
35
50
MnO
826
525
627
Fig 47 Raman spectra of xMnOmiddot(100- x)[As2O3middotPbO] glasses
The addition of MnO in the glass matrix determined an order degree of the vitreous
matrix The intensity of the bands attributed vibrations As ndash O ndash As bonds from As2O units
and bending vibrations of As ndash O ndash As from As2O units shift to a higher wave length that
suggests an increase in the As2O units comparative to AsO3 units
To the band from 826 cm-1 the addition of manganese ions in the glass matrix
determine for x = 05 mol an decreasing in intensity whereupon increasing for higher
concentrations The intensity of bands centered at 627 cm-1 and 525 cm-1 for x = 05
mol MnO decrease and disappear for x = 1 mol MnO The band of 345 cm-1 slowly
increases with the addition of manganese ions
To the band from 826 cm-1 the addition of iron ions in the glass matrix determines
for x = 05 mol an increase in intensity a gradual decrease and disappearance for x = 35
mol Fe2O3 of the bands observed for the glass matrix For higher concentrations of
manganese these bands gradually decrease The intensity of bands centered at 627 cm-1 and
525 cm-1 for x = 05 mol Fe2O3 increase and shift to 612 cm-1 and 501 cm-1 whereas
17
they gradually decrease and disappear for x = 10 mol Fe2O3 The band of 345 cm-1
decreases with the addition of iron ions and disappears for x = 20 mol Fe2O3
200 400 600 800 1000
3
612
501
Wavenumber [cm-1]
Ram
an In
tens
ity [a
u]
05
20
0
5
10
3550
1
Fe2O3
345
826
525
627
Fig 48 Raman spectra of xFe2O3middot(100- x)[As2O3middotPbO] glasses
With the increase of iron ions content in the As2O3middotPbO glass matrix the number of
these structural units decreases due to the increasing of the disorder in the studied glasses
418 Study by Raman spectroscopy of xMOmiddot(100-x)[As2O3middotTeO2]
vitreous systems were MO =gt MnO or Fe2O3
The Raman spectra obtained for xMOmiddot(100- x)[As2O3middot TeO2] vitreous systems
where MO =gt MnO or Fe2O3 with 0 le x le 50 mol are presented in figure 49-10 and their
structural assignments are summarized in table 42
The Raman spectrum of the glass matrix suggests a structure formed from TeO4 (tbp)
and TeO3 (tp) units where the presence of As ndash O ndash As bonds can not be excluded The
addition of manganese ions is leading to a modification of the structure proposed by the
spectrum of the glass matrix Then with the increasing of manganese content the intensity of
these bands is increasing showing that the manganese content favorises the formation of TeO4
(tbp) and TeO3 (tp) units
18
200 400 600 800 1000
783
850
768
416
816
752
Wavenumber [cm -1]
Ram
an In
tens
ity [a
u]
13
20
05
0
5
10
35
50
MnO
438
580
660
Fig 49 Raman spectra of xMnOmiddot(100- x)[As2O3middot TeO2] glasses
200 400 600 800 1000
226
294
408
673 751
5
W avenumber [cm -1]
Ram
an In
tens
ity [a
u]
05
20
0
3
10
35
50
1
Fe2O
3
816
752
438
580
Fig 410 Raman spectra of xFe2O3middot(100- x)[As2O3 TeO2] glasses
The Raman spectra of xFe2O3middot(100- x)[As2O3 TeO2] glasses present a significant
advance to the TeO4 (tbp) TeO3+1 polyhedra and AsO3 units represented in Raman spectrum
by the ~ 438 cm-1 band comparative with the modifications determined by the addition of
manganese ions in vitreous matrix For high concentrations of iron ions in xFe2O3middot(100-
x)[As2O3 TeO2] system of glasses the number of As-O-As linkages appear in Raman
spectrum due to stretching vibrations of As-O-As and vibrations of the continuous TeO4 (tbp)
network show a significant decrease
19
419 Comparative study by Raman spectroscopy of xMnOmiddot(100- x)[As2O3middotBO]
vitreous systems were BO =gt TeO2 or PbO
The addition of MnO to xMnOmiddot(100- x)[As2O3middotPbO] glass system do not break As
ndash O ndash As bonds into characteristic units and contribute to their prominence The addition of
manganese ions to xMnOmiddot(100- x)[As2O3middot TeO2] glass system for x=50mol MnO
determined the splitting up of a part of As ndash O ndash As Te-O-Te and the appearance of the
TeO4 (tbp) units against the loss of continuous TeO4 (tbp) network was observed
4110 Comparative study by Raman spectroscopy of xFe2O3middot(100- x)[As2O3middotBO]
vitreous systems where BO =gt TeO2 or PbO
With the increasing of iron ions content in the As2O3middotPbO glass matrix the number of
these structural units decreased due to the increase of the disorder in the studied glasses (x gt 20
mol ) and x = 50 mol Fe2O3 for xFe2O3middot(100- x)[As2O3middotTeO2] when iron ions
brought the structural units existing in glass matrices and favoured the appearace of
new bands due to bending vibrations of As ndash O ndash As
42 Comparative study by FT-IR and Raman spectroscopies of
xMOmiddot(100-x)[3B2O3middotLi2O] glasses where MO =gt MnO or Fe2O3
421 Study by FT-IR spectroscopy of xMOmiddot(100-x)[3B2O3middotLi2O] glasses
where MO =gt MnO or Fe2O3
The infrared absorption spectra obtained for xMOmiddot(1-x)[3B2O3middotLi2O] glass system
where MO =gt MnO or Fe2O3 with 0 le x le 50 mol are presented in figure 411-13 and their
structural assignments are summarized in table 43
500 1000 1500
3B2O3Li2O
Wavenumber [cm-1]
Abs
orpt
ion
[au
]
490
1400
1230
1061
698
614
460 78
6
Fig 411 FT ndash IR spectra of vitreous matrix 3B2O3middotLi2O
20
Following the infrared absorption spectra obtained for 3B2O3middotLi2O vitreous matrix
observed on eight bands ~ 1400 cm-1 ~ 1230 cm-1 ~ 1061 cm-1 ~ 786 cm-1 ~ 698 cm-
1 ~ 614 cm-1 ~ 490 cm-1 şi ~ 460 cm-1 The band at ~ 1400 cm-1 is assigned to
asymmetric stretching vibrations from BOslash3 şi BOslash2O- groups (Oslash represent oxygen atom
bridging two boron atoms) The band at ~ 1230 cm-1 is attributed to asymmetric stretching
vibrations of B ndash O bonds from triangular ortoborate BO 33 groups [23-26]
400 600 800 1000 1200 1400 1600
0
3
5
10
20
35
50
1
Wavenumber [cm-1]
Abs
orpt
ion
[ua
]
05
MnO
490
1400
1230
1061
698
614
460 78
6
Fig 412 FT ndash IR spectra of xMnOmiddot(100-x)[3B2O3middotLi2O] glasses
400 600 800 1000 1200 1400 1600
469
Wavenumber [cm-1]
Abs
orpt
ion
[ua
]
0
3
5
10
20
35
50
1
05
Fe2O3
490
1400
1230
1061
698
614
460 78
6
Fig 413 FT ndash IR spectra of x Fe2O3middot(100-x)[3B2O3middotLi2O] glasses
21
Table 43Wavenumber and the structural assignments of FT ndash IR and Raman
spectra of 3B2O3middotLi2O vitreous matrix
~ [cm 1 ] Attribution
FT ndash IR Raman FT ndash IR Raman
~ 1400 cm-1
~ 1400 cm-1
Asymmetric stretching
vibrations from BOslash3 şi BOslash2O-
groups
BOslash2O- triangles linked to
other borate triangular units
~ 1230 cm-1
Asymmetric stretching
vibrations of B ndash O bonds from
triangular ortoborate
BO 33 groups
~ 1061 cm-1
~ 1074 cm-1
Stretching vibrations of B ndash Oslash
bonds in -4BOslash tetrahedra from
tri- tetra- and penta-borate
groups
Diborate groups
~ 902 cm-1
Vibrations of orthoborate
groups
~ 786 cm-1
~ 791 cm-1
Bending vibrations of O3B ndash O
ndash BO4 bonds
Vibrations of rings with six
member to one or two BO4
tetrahedral from tri- tetra ndash
and penta ndash borate units
~ 698 cm-1
Bending vibrations of B-O-B
bonds from pentaborate groups
~ 614cm-1 Bending vibrations of O ndash B ndash O
bonds
~ 490cm-1 ~ 471cm-1 Bending vibrations of B-O-B
bonds
Isolated diborate groups
~ 460cm-1 Bending vibrations of O ndash B ndash O
bonds
22
The band at ~ 1061 cm-1 is assigned to stretching vibrations of B ndash Oslash bonds in -4BOslash
tetrahedra from tri- tetra- and penta-borate groups and the band at ~ 786 cm-1 is assigned
to bending vibrations of O3B ndash O ndash BO4 bonds The band at ~ 698 cm-1 is attributed to
Bending vibrations of B-O-B bonds from pentaborate groups The bands at ~ 614 cm-1 and
~ 460 cm-1 are assigned to bending vibrations of O ndash B ndash O bonds and the band at ~ 490 cm-
1 is assigned to bending vibrations of B-O-B bonds
From FT-IR spectra it can be concluded that the addition of manganese or iron ions in
vitreous matrices leads to the increase of the disorder degree
Also the structural changes that appeared in 3B2O3middotLi2O vitreous matrix with an
addition MnO or Fe2O3 content can be studied Ar=A4A3 ratio(A4 - relative number of -4BOslash tetrahedral borate units A3 - relative number of triangular (BOslash3 and BOslash2O-) units
0 10 20 30 40 50
010
015
020
Ar
x [mol]
MnO Fe2O3
Fig 414 The evolution of Ar ratio with the MnO or Fe2O3 content of
xMnOmiddot(100-x)[3B2O3middotLi2O] şi xFe2O3middot(100-x)[3B2O3middotLi2O] The evolution of the value of this ratio also allows a visualization of the effects
determined by the presence of the manganese or iron ions in the matrix The value Arltlt 1
indicated that BO3 is dominant related to BO4
422 Study by Raman spectroscopy of xMOmiddot(100-x)[3B2O3middotLi2O] glasses
where MO =gt MnO or Fe2O3
The Raman spectra obtained for xMOmiddot(1-x)[3B2O3middotLi2O] glass system were MO =gt
MnO or Fe2O3 with 0 le x le 50 mol are presented in figure 414-16 and their structural
assignments are summarized in table 43
Studying the Raman spectra of xMOmiddot(1-x)[3B2O3middotLi2O] glass system where MO =gt
MnO or Fe2O3 it has been observed that the absorption bands presented in vitreous matrix
gradually decreased with an increase in the manganese or iron content in both glasses system
which suggested an increase of the disorder in these vitreous systems
23
1000 2000 3000
B2O3Li2O
Wavenumber [cm-1]
Ram
an In
tens
ity [a
u]
1430
107490
279
1471
Fig 415 Raman spectra of vitreous matrix 3B2O3middotLi2O
500 1000 1500 2000 2500 3000
1430
107490
2791
0
Wavenumber [cm-1]
Ram
an In
tens
ity [a
u]
1
3
20
05
5
10
35
50
MnO
471
Fig 416 Raman spectra of xMnOmiddot(100-x)[3B2O3middotLi2O] glasses
400 600 800 1000 1200 1400 1600
Wavenumber [cm-1]
Ram
an In
tens
ity [a
u]
0
1
3
20
05
5
10
35
50
Fe2O3
1430
1074
90279
1
471
Fig 417 Raman spectra of x Fe2O3middot(100-x)[3B2O3middotLi2O] glasses
24
43 Comparative study by electron paramagnetic resonance (EPR) and magnetic
susceptibility measurements of xMOmiddot(100-x)[As2O3middotTeO2] xMOmiddot(100-x)
[As2O3middotPbO] and xMOmiddot(100-x)[3B2O3middotLi2O] glasses where MO =gt MnO or Fe2O3
431 Comparative study by electron paramagnetic resonance (EPR) of
xMnOmiddot(100-x)[As2O3middotBO] where BO =gt TeO2 or PbO
and xMnOmiddot(100-x) [3B2O3middotLi2O] glasses
In order to obtain more information regarding the behavior of manganese ions in
different vitreous matrices [3031] xMnOmiddot(100-x)[As2O3middotBO] where BO =gt TeO2 or PbO
and xMnOmiddot(100-x) [3B2O3middotLi2O] glasses were investigated by EPR spectroscopy on a large
compositional range with 0 le x le 50 mol The EPR spectra of Mn2+ for xMnOmiddot(100-
x)[As2O3middotPbO] (S1) xMnOmiddot(100-x)[As2O3middotTeO2] (S3) and xMnOmiddot(100-x)[3B2O3middotLi2O]
(S5) are presented in figure 418-20 These spectra present two absorption lines centered at gef
43 and gef 20 in all systems
The absorption line centered at gef 43 and is due to isolated Mn2+ ions [32] The
absorption line centered at gef 20 may be attributed to Mn2+ species interacting by magnetic
coupling[33] dipolar and or super exchange the last ones forming magnetic clusters [32]
The evolution of the spectra is easier to follow considering the dependence of
concentration on the EPR parameters the line - intensity (obtained as an integral of the area
under the corresponding EPR signal) J and the line - width ΔB The evolution of J and AB
reflects the structural transformations which appear in the glass matrices due to the increase of
manganese ions content
The intensity and the line - width of the resonance line from gef 43 for all
investigated systems is represented in figure 421(ab)
The intensity of the resonance line from gef 43 for all investigated glass systems
decreases due to the decrease of the isolated manganese ions numbers The line - width from
gef 43 for (S1) and (S3) systems decreases due to decrease of Mn2+ number and to the
structural disorder in glasses with the increase of MnO content For (S5) glass system the line
- width of the resonance line there is an increase in all compositional domains
The intensity of the resonance line from gef 20 can be observed as increasing up to
x=14 mol for (S1) system up to x=8mol for (S3) system and 20 mol for (S5)
system The line - width of the resonance line from gef 20 for (S1) and (S3) systems
increases up to 3 mol and 5mol for (S5) due to Mn2+ species interacting by magnetic
coupling dipole- dipole as the main broadening mechanism Over this concentration line ndash the
width of the resonance line from gef 20 is straight and it can be assumed that the
manganese ions begin to manifest super exchange magnetic interactions
25
1000 2000 3000 4000 5000
Firs
t der
ivat
ive
of a
bsor
ptio
n [u
a]
05
1
3
5
10
20
35
50
x [mol Mn2O3]amplif
B [G]
10
200
40
80
400
5
1
1
Fig 418 The EPR spectra of Mn2+ for xMnOmiddot(100-x)[As2O3middotPbO] (S1)
glass system
1000 2000 3000 4000 5000
Firs
t der
ivat
ive
of a
bsor
ptio
n [u
a]
x [mol MnO]
051
3
5
10
20
35
50
9
500
400
50
100
4
1
amplif
B [G]
1
Fig 419 The EPR spectra of Mn2+ for xMnOmiddot(100-x)[As2O3middotTeO2] (S3)
glass system
26
1000 2000 3000 4000 5000
501
B [G]
Firs
t der
ivat
ive
of a
bsor
ptio
n [u
a]
1
4
9
10
30
60
100
amplif
05
1
3
5
10
20
35
x [mol MnO]
Fe3+
Fig 420 The EPR spectra of Mn2+ for xMnOmiddot(100-x)[3B2O3middotLi2O] (S5)
glass system
0 2 4 6 8 10 12 14 16 18 20 22
x [mol]
J [ u
a]
S1 S3 S5
-2 0 2 4 6 8 10 12 14 16 18 20 22
50
100
150
200
250
300
S1 S3 S5
x [mol]
B
[G]
a b
Fig 421 The dependence on MnO content of the intensity (a) and width(b) of resonance
line at gef 43 for xMnOmiddot(100-x)[As2O3middotPbO] (S1) xMnOmiddot(100-x)[As2O3middotTeO2] (S3) şi
xMnOmiddot(100-x)[3B2O3middotLi2O] (S5) system glasses
27
0 10 20 30 40 50
x [mol]
J [ u
a]
S1 S3 S5
0 10 20 30 40 50
400
500
600
700
800
900
S1 S3 S5
x [mol]
B[G
]
a b
Fig 422 The dependence on MnO content of the intensity (a) and width b) of resonance
line at gef 20 for xMnOmiddot(100-x)[As2O3middotPbO] (S1) xMnOmiddot(100-x)[As2O3middotTeO2] (S3) and
xMnOmiddot(100-x)[3B2O3middotLi2O] (S5) system glasses
Following figure 418-20 it can be observed that (S1) and (S3) have had a similar
evolution but (S5) system presented for 05 le x le 5 mol (fig420) has a hyperfine
sextet[33] at gef 20due to Mn2+ isolated ions
432 Comparative study by magnetic susceptibility measurements of
xMnOmiddot(100-x)[As2O3middotBO] where BO =gt TeO2 or PbO and
xMnOmiddot(100-x)[3B2O3middotLi2O] glasses
The magnetic susceptibility data are in good agreement with the EPR result The
magnetic behavior of the glasses from xMnOmiddot(100-x)[As2O3middotBO] where BO =gt TeO2 (S3)
or PbO (S1) and xMnOmiddot(100-x)[3B2O3middotLi2O] (S5) glasses for 3 le x le 50 mol MnO are
presented in figure 423 - 25
For (S1) and (S3) system glasses up to x 3 mol and x 5 mol (S5) glass
system the temperature dependence of the reciprocal magnetic susceptibility obeys a Curie
law In this concentration range the manganese ions are predominantly isolated orand
participate in dipole-dipole interractions At higher concentrations the reciprocal magnetic
susceptibility obeys a Curie-Weiss law with negative paramagnetic Curie temperature (p)
characteristic to antiferromagnetic coupled ions by means of super exchange interractions(fig
426) This behavior of manganese ions is confirmed by the shape of the EPR spectra
28
100 150 200 250
2
4
6
8
10
12
14
16
18
20
22
T [K]
[
emu
mol
]-1
3 mol 5 mol 10 mol 20 mol 35 mol 50 mol
Fig423 The temperature dependence of -1 for xMnOmiddot(100-x)[As2O3middotPbO]
(S1) 3 le x le 50 mol
50 100 150 200 2500
2
4
6
8
10
12
14
16
18
20
22
3 mol 5 mol 10 mol 20 mol 35 mol 50 mol
T [K]
[
emu
mol
]-1
Fig424 The temperature dependence of -1 for xMnOmiddot(100-x)[ As2O3middotTeO2]
(S1) 3 le x le 50 mol
100 150 200 250
2
4
6
8
10
12
14
16
18
20
22
[em
u m
ol]-1
T [K]
3 mol 5 mol 10 mol 20 mol 35 mol 50 mol
Fig425 The temperature dependence of -1 for xMnOmiddot(100-x)[3B2O3middotLi2O]
(S5) 3 le x le 50 mol
29
0 10 20 30 40 50
0
20
40
60
80
100
x [mol]
-p [K
]
(S1) (S3) (S5)
Fig426Concentration dependence of (p) for sistemele xMnOmiddot(100-x)[As2O3middotPbO]
(S1) xMnOmiddot(100-x)[As2O3middotTeO2] (S3) şi xMnOmiddot(100-x)[3B2O3middotLi2O] (S5)
Using the representation 1 =f(T) the molar Curie constants CM the effective
magnetic moments and molar fraction of Mn2+(x1) şi Mn3+(x2) ions were calculated and
represented in tables 44 -6
Tabel 44 Molar Curie constants effective magnetic moments and molar fraction of Mn2+(x1) şi Mn3+(x2) ions in xMnOmiddot(100-x)[As2O3middotPbO] (S1) glasses
x
[mol MnO2] CMtimes102
[emu mol] ef
[microB] x1
[mol Mn2+O2] x2
[mol Mn3+O2] 3 1272 582 268 032 5 1979 562 343 157 10 3777 549 555 445 20 6688 517 492 1508 35 12239 502 377 3123 50 15427 496 268 4732
Tabel 45 Molar Curie constants effective magnetic moments and molar fraction of Mn2+(x1) şi Mn3+(x2) ions in xMnOmiddot(100-x)[As2O3middotTeO2] (S3)glasses
x
[mol MnO2] CMtimes102
[emu mol] ef
[microB] x1
[mol Mn2+O2] x2
[mol Mn3+O2] 3 1297 588 287 013 5 1938 556 312 188 10 3804 551 575 425 20 6766 52 549 1451 35 11148 504 441 3059 50 15528 498 358 4642
30
Tabel 46 Molar Curie constants effective magnetic moments and molar fraction of Mn2+(x1) şi Mn3+(x2) ions in xMnOmiddot(100-x)[3B2O3middotLi2O] (S5) glasses
x
[mol MnO2] CMtimes102
[emu mol] ef
[microB] x1
[mol Mn2+O2] x2
[mol Mn3+O2] 3 127 581 265 035 5 1919 554 303 197 10 3681 542 486 514 20 7215 519 53 147 35 1121 506 505 2995 50 15898 501 493 4507
433 Comparative study by electron paramagnetic resonance (EPR) of
xFe2O3middot(100-x)[As2O3middotBO] where BO =gt TeO2 or PbO and
x Fe2O3middot(100-x) [3B2O3middotLi2O] glasses
In order to obtain more information regarding the behavior of iron ions in
xFe2O3middot(100-x)[As2O3middotBO] where BO =gt TeO2 (S4) or PbO (S2) şi xFe2O3middot(100-
x)[3B2O3middotLi2O] glasses were investigated by EPR spectroscopy on a large compositional
range with 05 le x le 35 mol Fe2O3 The EPR spectra of Fe3+ in xFe2O3middot(100-
x)[As2O3middotPbO] (S2) xFe2O3middot(100-x)[As2O3middotTeO2] (S4) and xFe2O3middot(1-x)[3B2O3middotLi2O]
(S6) are presented in figure 427-29 These spectra present two absorption lines centered at
gef 43 and gef 20 up to x le 35mol Fe2O3 systems studied
The absorption line centered at gef 43 is due to isolated Fe3+ ions [34-36] The
absorption line centered at gef 20 may be attributed to Fe3+ species interacting by magnetic
coupling dipolar and or super exchange the last ones forming magnetic clusters [37-41]
The evolution of the spectra is easier to follow considering the dependence of
concentration on the EPR parameters the line - intensity (obtained as an integral of the area
under the corresponding EPR signal) J and the line - width ΔB The evolution of J and AB
reflects the structural transformations which appear in the glass matrices due to the increasing
of iron ions content
The intensity and the line - width of the resonance line from gef 43 for all
investigated systems is represented in figure 430 (a b) The intensity of the resonance line
from gef 43 increases for (S2) and (S4) up to 3 mol and up to 5 mol for (S6) then
decreases for all systems investigated A line broadening up to 3 mol from gef 43 for
these systems can be observed due to increasing of Fe3+ isolated number of ions
31
1000 2000 3000 4000 5000
40
Firs
t der
ivat
ive
of a
bsor
ptio
n [u
a]
B [G]
x [mol Fe2O3]
05
1
3
5
1020
35 2
40
20
10
10
10
amplif
Fig427 The EPR spectra of Fe3+ for xFe2O3middot(100-x)[As2O3middotPbO] (S2)
glass system
1000 2000 3000 4000 5000
100
B [G]
Firs
t der
ivat
ive
of a
bsor
ptio
n [u
a]
10080
20
50
20
20
3
05
1
5
102035
x [mol Fe2O3] amplif
Fig428 The EPR spectra of Fe3+ for xFe2O3middot(100-x)[As2O3middotTeO2] (S4)
glass system
32
1000 2000 3000 4000 5000
Firs
t der
ivat
ive
of a
bsor
ptio
n [u
a]
B [G]
3
05
1
5
10
20
35
x [mol Fe2O3]
30
50
20
20
10
30
30
amplif
Fig429 The EPR spectra of Fe3+ for xFe2O3middot(100-x)[3B2O3middotLi2O] (S6)
glass system
The intensity and the line - width of the resonance line from gef 43 for all
investigated systems is represented in figure 430 (a b)The resonance line from gef 20 is
attributed to Fe3+ ions that interact by magnetic coupling dipolar orand super exchange
interractions can be observed in all compositional domains
The intensity of the resonance line from gef 20 can be observed as increasing up to
x=35 mol for (S2) and (S6) system and 10 mol for (S4) system with increased iron
ions content The line - width of the resonance line from gef 20 increased up to 10mol
for (S2) system and up to 3 mol for (S4) and 5mol for (S6) due to Fe3+species
interacting by magnetic coupling dipole-dipole Above this concentration line - width of the
resonance line from gef 20 can be attributed to dipolar and super exchange magnetic
interactions The ΔB = f(x) dependence reflects the competion between the broadening
mechanism (dipole ndash dipole interactions the interactions between ions in diferent
valence state and structural disorder) and the narrowing ones (super exchange
interactions)
33
0 5 10 15 20 25 30 35 40
x [mol]
J [ u
a]
S2 S4 S6
a)
0 5 10 15 20 25 30 35 4040
60
80
100
120
140
160
180
200
220 S2 S4 S6
B[G
]
x [mol]
a b
Fig 430 The dependence on Fe2O3 content of the intensity (a) and width (b) of
resonance line at gef 43 for xFe2O3middot(100-x)[As2O3middotPbO] (S2)
xFe2O3middot(100-x)[As2O3middotTeO2] (S4) and xFe2O3middot(100-x)[3B2O3middotLi2O] (S6) glasses
0 5 10 15 20 25 30 35 40
x [mol]
J [ u
a]
S2 S4 S6
a)
0 5 10 15 20 25 30 35 40
200
400
600
800
1000
1200
1400
1600
x [mol]
B
[G] S2
S4 S6
a b
Fig 431 The dependence on Fe2O3 content of the intensity (a) and width (b) of
resonance line at gef 20 for xFe2O3middot(100-x)[As2O3middotPbO] (S2)
xFe2O3middot(100-x)[As2O3middotTeO2] (S4) and xFe2O3middot(100-x)[3B2O3middotLi2O] (S6) glasses
34
434 Comparative study by magnetic susceptibility measurements of
xFe2O3middot(100-x)[As2O3middotBO] where BO =gt TeO2 or PbO and
xFe2O3middot(100-x) [3B2O3middotLi2O] glasses
The magnetic susceptibility data are in good agreement with the EPR result The magnetic
behavior of the glasses xFe2O3middot(100-x)[As2O3middotPbO] (S2) xFe2O3middot(100-x)[As2O3middotTeO2]
(S4) and xFe2O3middot(100-x)[3B2O3middotLi2O] (S6) for 3 x 50 mol Fe2O3 are presented in
figure 432 - 34
For (S2) glass systems up to x 10 mol x 3 mol (S5) glass systems and x 5
mol (S6) glass systems the temperature dependence of the reciprocal magnetic susceptibility
obeys a Curie law In this concentration range the iron ions are predominantly isolated orand
participate in dipole-dipole interactions At higher concentrations the reciprocal magnetic
susceptibility obeys a Curie-Weiss law with negative paramagnetic Curie temperature (p)
characteristic to antiferromagnetic coupled ions by means of super exchange interactions(fig
435) This behavior of iron ions is confirmed by the shape of the EPR spectra
80 100 120 140 160 180 200 220 240 260 2800
1
2
3
4
5
6
7
8
9
10
11
[
emu
mol
]-1
T [K]
3 mol 5 mol 10 mol 20 mol 35 mol 50 mol
Fig432 The temperature dependence of -1 for xFe2O3middot(100-x)[As2O3middotPbO] (S2)
3 x 50 mol
35
80 100 120 140 160 180 200 220 240 260 2800
1
2
3
4
5
6
7
8
9
10
T [K]
[
emu
mol
]-1
3 mol 5 mol 10 mol 20 mol 35 mol 50 mol
Fig433 The temperature dependence of -1 for xFe2O3middot(100-x)[As2O3middotTeO2] (S4)
3 x 50 mol
80 100 120 140 160 180 200 220 240 260 2800
1
2
3
4
5
6
7
8
9
10
11
3 mol 5 mol 10 mol 20 mol 35 mol 50 mol
T [K]
[
emu
mol
]-1
Fig434 The temperature dependence of -1 for xFe2O3middot(100-x)[3B2O3middotLi2O] (S6)
3 x 50 mol
36
0 10 20 30 40 50
0
10
20
30
40
50
x [mol]-
p [K]
(S2) (S4) (S6)
Fig435Concentration dependence of (p) for sistemele xFe2O3middot(100-x)[As2O3middotPbO] (S2) xFe2O3middot(100-x)[As2O3middotTeO2] (S4) and xFe2O3middot(100-x)[3B2O3middotLi2O] (S6)
for 3 x 50 mol Fe2O3
Using the representation 1 = f(T) the molar Curie constants CM the effective
magnetic moments and molar fraction of Fe3+(x1) şi Fe2+(x2) ions were calculated and
represented in tables 47-9
Table 47 Molar Curie constants effective magnetic moments and molar fraction of
Fe3+(x1) şi Fe2+(x2) ions in xFe2O3middot(100-x)[As2O3middotPbO] glasses (S2)
x [mol Fe2O3]
CMtimes102
[emu mol] ef
[microB] x1
[mol Fe23+O3]
x2 [mol Fe2
2+O3] 3 2526 58 261 039 5 393 56 332 168 10 7326 541 476 524 20 13459 519 53 147 35 23364 516 829 2671 50 32154 507 767 4233
Table 48 Molar Curie constants effective magnetic moments and molar fraction of
Fe3+(x1) şi Fe2+(x2) ions in xFe2O3middot(100-x)[As2O3middotTeO2] glasses (S4)
x [mol Fe2O3]
CMtimes102
[emu mol] ef
[microB] x1
[mol Fe23+O3]
x2 [mol Fe2
2+O3] 3 2571 585 277 023 5 4016 566 363 137 10 7911 562 686 314 20 14992 521 643 929 35 22676 509 601 2899 50 30959 497 313 4687
37
Table 49 Molar Curie constants effective magnetic moments and molar fraction of Fe3+(x1) şi Fe2+(x2) ions in xFe2O3middot(100-x)[3B2O3middotLi2O] glasses (S6)
The results allowed to consider that the magnetic properties of the studied glasses can
be explained through magnetic interractions between Fe3+ - Fe3+ Fe3+- Fe2+ and Fe2+- Fe2+ that
explain the dependences of RPE parameters concentration
SELECTED CONCLUSIONS
In this thesis xMOmiddot(100-x)[As2O3middotTeO2] xMOmiddot(100-x) [As2O3middotPbO] and
xMOmiddot(100-x)[3B2O3middotLi2O] glasses where MO =gt MnO or Fe2O3 were comparatively
studied in 0 le x le 50 mol The structural modifications of investigated glass matrices were
comparatively followed in function of the manganese or iron ions on the investigated glass
matrices were followed
The study by FT-IR spectroscopy shows that the evolution of the spectra of
xMnOmiddot(100-x) [As2O3middotPbO] with the addition and the increasing of the MnO content suggest
that the manganese ions break up a part of As ndash O ndash As Pb ndash O ndash Pb and probably of As ndash O ndash
Pb bonds The addition of MnO in the As2O3middotPbO glass matrix is leading to a disordering of
the glasses structure with the increasing of the MnO content
The evolution of the absorption bands for FT ndash IR spectrum of xFe2O3middot(1-x)
[As2O3middotPbO] glasses are determined by the addition of Fe2O3 content It can be observed to
shift the bands assigned As ndash O ndash As vibrations from AsO3 units due to changing to length As
ndash O ndash As bonds and interne angles of AsO3 units disappears PbO4 units and appears FeO6
units The addition of Fe2O3 in the As2O3middotPbO glass matrix determined a disordering of the
glasses structure with the increasing of the Fe2O3 content
From FT-IR absorption spectra of the investigated xMOmiddot(100-x)[As2O3middotTeO2] glasses
system where MO =gt MnO or Fe2O3 it can be observed that the addition and increasing of
manganese ions concluded the contraction of As-O-As bonds from totally symmetric
x [mol Fe2O3]
CMtimes102
[emu mol] ef
[microB] x1
[mol Fe23+O3]
x2 [mol Fe2
2+O3] 3 2542 582 268 032 5 3943 561 338 162 10 7423 544 506 494 20 13568 520 549 1451 35 23094 513 731 2769 50 31746 503 584 4416
38
stretching vibrations of AsO3 units for x ge10 mol there can be an increase in number of As-
O-As bonds from AsO3 units orand a length these linkage to doubly degenerate stretching
vibrations of AsO3 units and a stretching vibration mode of TeO3 tp with NBO It can be
remarked from the FT-IR absorption spectra the gradual transformation of symmetric
stretching vibration mode of Te-O bonds from TeO3 units in TeO4 (tbp) units and the presence
of MnO2 units Once with the addition of iron ions the xFe2O3middot(100- x)[As2O3middotTeO2]
glasses behave like xMnOmiddot(100-x)[As2O3middotTeO2] glasses but in this system the
appearance of FeO6 units can be seen
From FT-IR spectra in xMOmiddot(100-x)[3B2O3middotLi2O] glasses where MO =gt MnO or
Fe2O3 can be concluded that the addition of manganese or iron ions in vitreous matrices leads
to the increase of the disorder degree
The study by Raman spectroscopy shows that the evolution of the spectra the addition
of MnO in the [As2O3middotPbO]glass matrix determined an order degree of the vitreous matrix
The intensity of the bands attributed vibrations As ndash O ndash As bonds from As2O units and
bending vibrations of As ndash O ndash As from As2O units shift to a higher wave length that suggests
an increase in the As2O units comparative to AsO3 units With the increase of iron ions content
in the As2O3middotPbO glass matrix the number of these structural units decreases due to the
increasing of the disorder in the studied glasses
With the increasing of manganese content in As2O3TeO2 glass matrix the intensity
of these bands is increasing showing that the manganese content favorites the formation of
TeO4 (tbp) and TeO3 (tp) units For high concentrations of iron ions in xFe2O3middot(100-
x)[As2O3 TeO2] system of glasses the number of As-O-As linkages appear in Raman
spectrum due to stretching vibrations of As-O-As and vibrations of the continuous TeO4 (tbp)
network show a significant decrease
Studying the Raman spectra of xMOmiddot(1-x)[3B2O3middotLi2O] glass system where MO =gt
MnO or Fe2O3 it has been observed that the absorption bands presented in vitreous matrix
gradually decreased with an increase in the manganese or iron content in both glasses system
which suggested an increase of the disorder in these vitreous systems
The EPR spectra presents the behavior of manganese or iron ions in different vitreous
matrices xMOmiddot(100-x)[As2O3middotBO] where MO=gtMnO or Fe2O3 and BO =gt TeO2 or
PbO and xMOmiddot(100-x) [3B2O3middotLi2O] Glasses were investigated by EPR spectroscopy on a
large compositional range with 0 le x le 50 mol The absorption line centered at gef 43 and
is due to isolated Mn2+ ions The absorption line centered at gef 20 may be attributed to
Mn2+ species interacting by magnetic coupling dipolar and or super exchange the last ones
forming magnetic clusters The EPR spectra of Fe3+ in xFe2O3middot(100-x)[As2O3middotPbO]
xFe2O3middot(100-x)[As2O3middotTeO2] and xFe2O3middot(1-x)[3B2O3middotLi2O] are presented two absorption
lines centered at gef 43 and gef 20 up to x le 35mol Fe2O3 systems studied
39
The absorption line centered at gef 43 is due to isolated Fe3+ ions The absorption
line centered at gef 20 may be attributed to Fe3+ species interacting by magnetic coupling
dipolar and or super exchange the last ones forming magnetic clusters
The evolution of the spectra is easier to follow considering the dependence of
concentration on the EPR parameters the line - intensity (obtained as an integral of the area
under the corresponding EPR signal) J and the line - width ΔB The evolution of J and AB
reflects the structural transformations which appear in the glass matrices due to the increase of
manganese ions content
The magnetic susceptibility data are in good agreement with the EPR result The
magnetic behavior of the glasses from xMnOmiddot(100-x)[As2O3middotBO] where BO =gt TeO2 (S3)
or PbO (S1) and xMnOmiddot(100-x)[3B2O3middotLi2O] (S5) glasses for 3 le x le 50 mol MnO
For (S1) and (S3) system glasses up to x 3 mol and x 5 mol (S5) glass
system the temperature dependence of the reciprocal magnetic susceptibility obeys a Curie
law In this concentration range the manganese ions are predominantly isolated orand
participate in dipole-dipole interractions At higher concentrations the reciprocal magnetic
susceptibility obeys a Curie-Weiss law with negative paramagnetic Curie temperature (p)
characteristic to antiferromagnetic coupled ions by means of super exchange interractions This
behavior of manganese ions is confirmed by the shape of the EPR spectra Using the
representation 1 =f(T) the molar Curie constants CM the effective magnetic moments
and molar fraction of Mn2+(x1) şi Mn3+(x2) ions were calculated The magnetic susceptibility
data are in good agreement with the EPR result
The magnetic behavior of the glasses xFe2O3middot(100-x)[As2O3middotPbO] (S2)
xFe2O3middot(100-x)[As2O3middotTeO2] (S4) and xFe2O3middot(100-x)[3B2O3middotLi2O] (S6) for 3 x 50
mol Fe2O3 are presented For (S2) glass systems up to x 10 mol x 3 mol (S5)
glass systems and x 5 mol (S6) glass systems the temperature dependence of the
reciprocal magnetic susceptibility obeys a Curie law In this concentration range the iron ions
are predominantly isolated orand participate in dipole-dipole interactions At higher
concentrations the reciprocal magnetic susceptibility obeys a Curie-Weiss law with negative
paramagnetic Curie temperature (p) characteristic to antiferromagnetic coupled ions by
means of super exchange interactions(fig 435) This behavior of iron ions is confirmed by the
shape of the EPR spectra Using the representation 1 = f(T) the molar Curie constants
CM the effective magnetic moments and molar fraction of Fe3+(x1) şi Fe2+(x2) ions were
calculated
40
REFERENCES
Chapter 1
[1] I Ardelean bdquoIntroducere icircn studiul materialelor oxidice cu structură vitroasă EdNapocaStar Cluj Napoca 2002 [2] G Srinivasarao N Veeraiah J All Com 327 52-65(2001) [3] G Srinivasarao N Veeraiah J Phys Chem Solids 63705-717(2002) [4] DBecherescu VCristea FMarx IMenessz FWinter Chimia stării solide Ed Şt şi Encicl Bucucureştivol 1 1983 [5] J Wong CAAngell Glass-Structure by Spectroscopy Dekker Inc New York 1976 [6] BEWarren HKKrutter O Morningstat J Am Ceram Soc 19 202 (1936) [7] LLSperry JD Mackenzie Phys Chem Glasses 9 91 (1968) [8] WLKonijnendijk JMStevels J Non-Cryst Solids 18 307 (1975) [9] FCEversteyn JM Stevels HJ Naterman Phys Chem Glasses 1 134 (1963) [10] G Fuxi Optical and Spectroscopie Properties of Glass Springer-Verlag Shanghai Scientific Technical Pub Shanghai 1991 [11] YDYiannopoulos GDChryssikos EIKamitsos Phys Chem Glasses 42(3) 164 (2001) [12] MGFerreira da Silva BFOCosta J Non-Cryst Solids 293-295 534 (2001) [13] RYordanova YDimitriev VDimitriev S Kassabov DKlissurski JNon-Cryst Solids 201 141 (1996) [14] W L Konijnendijk J M Stevels J Non-Cryst Solids 18 307 (1980) [15] M Iron M Couzi ALevasseur JBrethous JSolidState Chem 31 285 (1980) [16] TFurukawa WBWhite PhzsChemGlasses 21 85 (1980) [17] E I Kamitsos M A Karakassides GD Chryssikos J Phys Chem 90 4528 (1986) [18] E I Kamitsos M A Karakassides GD Chryssikos J Phys Chem 91 1073 (1987) [19] TWBril Philips Res Rep Suppl 2 117 (1976) [20] E I Kamitsos M A Karakassides GD Chryssikos J Phys Chem 30 203 (1989) [21] BNMeera JRamakrishna J Non-Cryst Solids 159 1 (1993) [22] KWitke THubert PReich JRamanSpectr 24 407 (1993) [23] E I Kamitsos M A Karakassides Phys Chem Glasses 30 19 (1989) [24] MPeteanu Teză de doctoratrdquo Universitatea Babeş-Bolyairdquo Cluj Napoca (1989) [25] PCTaylor PJBray JPhys Chem Solids 33 43 (1972) [26] IArdelean MPeteanu GhIlonca DPop Solid State Commun 33 653 (1980) [27] AV De Wijn RE Van Balderen JKemPhys 46 4 (1967) [28] DL Griscom RE Griscom J Phys Chem Glasses 12 19 (1971) [29] JWH Schreurs JChem Phys 69 2151 (1978) [30] AlNicula M Peteanu IArdelean Studia Univ Babeş-Bolyai Physica 2 65 (1979) [31] M Peteanu IArdelean SFilip ITodor GSalvan Studia Univ Babeş-Bolyai Physica XL 2 9 (1995) [32] IArdelean M Peteanu SFilipV Simon ITodor Solid State Commun 105 (5) 339 (1998) [33] SKMendiratta EGuedes de Sousa JMatSci Lett7 733 (1988) [34] IArdelean M Peteanu SFilip V Simon GGyorffy Solid State Commun 102 (4) 341 (1997) [35] IArdelean M Peteanu SFilip V Simon FCiorcas ITodor JMagnMagn Mat 196-197 257 (1999) [36] JKliava RBerger YServant JEmery JMGreneche JTrokss J Non-Cryst Solids 202 205 (1996) [37] LDBogomolova NA Krasilnikova VLBogdanov VDKhaliev VV Mitrofanov J Non-Cryst Solids 188 130 (1995) [38] DLoveridge SPark PhysChem Glasses 12 19 (1971) [39] IArdelean G Salvan M Peteanu V Simon FCiorcas Mod PhysLett B 13 (22-23) 801 (1999)
41
[40] JLRao AMuraly EDRao J Non-Cryst Solids 202 215 (1996) [41] CPrakash S Husain RJ Singh SMollah JAlloys Compon 326 47 (2001) [42] EGuedes de Sousa SKMendiratta JMMachado Da Silva Portugal Phys 17 (3-4) 203 (1986) [43] TCastner GSNewell WCHolton CP Slichter JChem Phys 32 668 (1960) [44] SPChaudhuri SKPatra JMatSci 35 4735 (2000) [45] IArdelean HH Qiu HSakata Matt Lett 32 335 (1997) Chapter 2 [1] J Wong C A Angel Glass Structure by Spectroscopy Marcel Dekker inc New-York 1976 [2] I Ardelean bdquoIntroducere icircn studiul materialelor oxidice cu structură vitroasă EdNapocastar Cluj-Napoca 2002 [3] N Avram GH Mateescu Spectroscopia icircn infraroşu Aplicaţii icircn chimia organică Ed Tehnică Bucureşti 1968 [4] TIliescu Spectroscopie optică moleculară vibraţională şi electronică Ed Casa Cărţii de Ştiinţă Cluj- Napoca 2000 [5] S Aştilean bdquoMetode şi tehnici moderne de spectroscopie optică Ed Casa Cărţii de Ştiinţă Cluj - Napoca 2002 p 5 [6] I Ursu Rezonanţă Electronică de Spinrdquo Ed AcademieiBucureşti (1965) [7] CHHurd ContempPhys 23 (5) 469 (1982) [8] GWAnderson WDCompton JChemPhys52 6166 (1970) [9] MS Seehra GSrinivasan Landolt-Bornstein (New Series) SubVolume F3 Springer-Verlag Berlin 1994 [10] GToulouse ContempPhys 2115 (1977) [11] NMMurayMagnetic susceptybility EdInterscience New York P1773 1963 [12] JBGoodenough Magnetism and Chemical Bond EdInterscience New York 1963 [13] IArdelean G Salvan M Peteanu V Simon FCiorcas Mod PhysLett B 13 (22-23) 801 (1999) [14] IArdelean MPeteanu R Ciceo Lucăcel Studii de rezonanţă paramagnetică electronică şi magnetice ale unor ioni 3d icircn sticle pe bază de B2O3 Ed Presa Univesitară Clujeană 2005 [15] IArdelean PhysStatSol (b) 87K137 (1978) [16] IArdelean Solid State Commun 31 75 (1979) [17] EJFrieble LKWilson AWDozier DLKinser PhysStatSol (b) 45 323 (1971) [18] DWMoon JMAitken RKMcCrone GS Ciloszik PhysChe Glasses 16 (5) 91 (1975) [19] SFilip Teză de doctorat UnivBabeş-Bolyai Cluj Napoca 1996 [20] CJSchinkel GWRathenou Physics of Non-Crystaline Solids North Holland Publ Co Amsterdam 215 1965 [21] EJFrieble LKWilson NCKoon DLKinser JAm Ceram Soc 57-237 (1974) [22] RJLandry JT Fournier CGYoung JChemPhys 46 1285 (1967) [23] WSimpson PhysStatSolidi b40 207 (1970) [24] RHasegawa PhysRevB b(5) 1631 (1971) [25] IArdelean GhIlonca MPeteanu Solid State Commun 52 145 (1984) [26] IArdelean GhIlonca OCozar J Physique 49 C8 1107 (1988) Chapter 3 [1] LFBates Modern Magnetism p133 Cambridge University Press London 1962 [2] IArdelean GhIlonca DBarbos Solid State Commun 40 769 (1981) [3] EBurzo IUrsu DUngur IArdelean JMatSci 15 581 (1980) [4] EBurzo IUrsu DUngur IArdelean MatResBull 15 1273 (1980) [5] DLGriscom Glass Science and Technology 48 151 (1990) [6] PJBray AH Silver Modern aspects of the vitreous state vol1 Butterworth
42
London 1960 [7] IArdelean Teza de doctorat UnivBabeş-Bolyai Cluj Napoca 1979 [8] SAştilean bdquoMetode şi tehnici moderne de spectroscopie opticărdquo EdCasa Cărţii de Ştiinţă Cluj ndash Napoca 2002 p5 [9] IArdelean RCiceo-Lucăcel ldquoFizica şi Tehnologia Materialelor Oxidice Lucrări Practicerdquo Ed Univ ldquoBabeş-Bolyairdquo Cluj-Napoca 2000 [10] VPop IChicinaş NJumate Fizica materialelor Metode experimentalerdquo EdPresa Universitară Clujeană 2001 [11] IUrsu Rezonanţă electronică de spinrdquo EdAcademiei Bucureşti 1965 Chapter 4 [1] I Ardelean S Lupşor D Rusu Solid State Sci 10 1384(2008) [2] I Ardelean S Lupşor D Rusu trimis spre publicare la Physica B decembrie 2009 [3] P Tarte Spectrochim Acta 18 467 (1962) [4] R A Condrate J Non ndash Cryst Solids 84 26 (1986) [5] G Srinivasarao N Veeraiah Phys Stat Sol (a) 191 370(2002) [6] G Srinivasarao N Veeraiah J Phys Chem Solids 63 705(2002) [7] G Srinivasarao N Veeraiah J All Com 327 52 (2001) [8] DK Durga N Veeraiah Bull Mater Sci 24 (4) 421 (2001) [9] F F Bentley L D Smithson A L Rozek InfraredndashSpectra and Characteristic Frequencies 700-300 cm-1 Interscience New York 1968 p 103 [10] O Noguera T Merle-Mejean AP Mirgorodsky MB Smirnov P Thomas J-C Champarnaud-Mesjard J Non-Cryst Solids 330 50 (2003) [11] BVR Chowdari KL Tan Fang Ling Solid State Ionics 113 ndash 115 711(1998) [12] C Jiang J Zhang H Mao F Gan Glass Technol 39(6) 200(1998) [13] MR Sahar K Sulhadi MS Rohani J Mater Sci 42 824(2007) [14] C Horea D Rusu I Ardelean J Mater Sci Mater Electron 20 905(2009) [15] GE Rachkovskaya GB Zakharevich J Appl Spectrosc 74 86(2007) [16] I Ardelean S Lupşor D Rusu trimis spre publicare la Journal of Materials Science Materials in Electronics decembrie 2009 [17] I Ardelean S Lupşor D Rusu trimis spre publicare la Modern Physics Letters B decembrie 2009 [18] R Iordanova Y Dimitriev V Dimitrov S Kassabov D Klissurski J Non ndash Cryst Solids 231 227 (1998) [19] R Iordanova Y Dimitriev S Kassabov D Klissurski J Non ndash Cryst Solids 204 141 (1996) [20] J O Jensen S J Gilliam A Banerjee D Zeroka S J Kirkby C N Merrow J Mol Struct (Theochem) 664 145 (2003) [21] G N Papatheodorou S A Solin Solid State Commun 16 5 (1975) [22] BVR Chowdari KL Tan Fang Ling J Mat Sci 35 2015 (2000) [23] R C Lucacel C Marcus V Timar I Ardelean Solid State Sci 9 850 (2007) [24] CP Varsamis EI Kamitsos GD Chryssikos Solid State Ionics 136ndash137 1031 (2000) [25] Sherief M Abo-Naf Fatma H El Batal Moenis A Azooz Mat Chem Phys 77 846 (2002) [26] SG Motke SP Yawale SS Yawale Bull Mater Sci 25 (10) (2002) [27] R Akagi N Ohtori N Umesaki J Non ndash Cryst Solids 293 471(2001) [28] E I Kamitsos M A Karakassides G D Chryssikos J Phys Chem 91(5) 1073 (1987) [29] H Ushida Y Iwadate T Hattori S Nishiyama K Fukushima Y Ikeda M Yamaguchi M Misawa T Fukunaga T Nakazawa S Jitsukawa J Alloys Compd 377 167 (2004) [30] I Ardelean F Ciorcas M Peteanu S Lupşor G Salvan Balkan Phys Lett 5 860 (1997)
43
[31] I Ardelean M Peteanu V Simon O Cozar F Ciorcas S Lupşor J Magn Magn Mater 196 253 (1999) [32] IArdelean MPeteanu GhIlonca Phys Stat Sol (a) 58 K33(1980) [33] IArdelean MPeteanu R Ciceo-Lucăcel ldquoStudii de rezonanţă paramagnetică electronică şi magnetice ale unor ioni 3d icircn sticle pe bază de B2O3rdquo Ed Presa Univ Clujeană Cluj Napoca 2005 p 171 [34] JLRao AMuraly EDRao J Non-Cryst Solids 202 215 (1996) [35] RPSChakradhar AMurali JLRao Optical Mat 10 109 (1998) [36] IArdelean MPeteanu SFilip VSimon GGyorffy Solid State Commun 102(4) 341 (1997) [37] IArdelean MPeteanu VSimon SFilip FCiorcaş ITodor J Magn Magn Mat 196-197 257 (1999) [38] IArdelean GSalvan MPeteanu VSimon CHimcinschi FCiorcas Mod Phys Lett B 13(22-23) 801 (1999) [39] IArdelean HHQiu HSakata Mat Lett 32 335 (1997) [40] SPChaudhuri SKPatra J Mat Sci 35 4735 (2000) [41] I Ardelean M Peteanu V Simon G Salvan J Mat Sci Technol 18 (3) 1 (2002)

12
413 Comparative study by FT-IR spectroscopy of
xMOmiddot(100-x)[As2O3middotTeO2] vitreous systems where MO =gt MnO or Fe2O
The infrared absorption spectra obtained for xMOmiddot(1-x)[As2O3middotTeO2] glass system
where MO =gt MnO or Fe2O3 with 0 le x le 50 mol are presented in figure 44 -5 and their
structural assignments are summarized in table 41[1617] The characteristic absorption bands
for crystalline As2O3 [5-8] PbO [79] TeO2 [810-15] MnO2 and Mn3O4 [9] and characteristic
bands for Fe2O3 [1819 ] were used as a reference point in the results discussion
Fig 44 FT ndash IR spectra of xMnOmiddot(100- x)[As2O3middotTeO2] glasses
Fig45 FT ndash IR spectra of xFe2O3middot(100- x)[As2O3middotTeO2] glasses
400 600 800 1000 1200
565
422 690 830
05
Abs
optio
n [a
u]
Wavenumber [cm-1]
0
3
5
35 50
1
MnO
854 733 644
1119
10 20
400 600 800 1000 1200
462650
812
713
561
05
20
Wavenumber [cm-1]
Abs
orpt
ion
[au
]]
0
3 5
10
35 50
1
Fe2O3
854 733
644
1119
13
This behavior of the studied glasses with the addition and increasing of MnO content
suggests that the structure observed in the glass matrix is conserving up to 5 mol MnO
where the structure takes another form From a structure dominated by AsO3 TeO4 tbp and
TeO3 tp units the structure became dominated by TeO4 tbp and MnO2 units and in a small
measure of AsO3 and TeO3 tp units For higher concentrations it can not be specified exactly
which of the last two structural units have the biggest proportion in these glasses From FT-IR
absorption spectra of the investigated glass system it can be observed that the addition and
increasing of manganese ions concluded the contraction of As-O-As bonds from totally
symmetric stretching vibrations of AsO3 units for x ge10 mol there can be an increase in
number of As-O-As bonds from AsO3 units orand a length these linkage to doubly degenerate
stretching vibrations of AsO3 units and a stretching vibration mode of TeO3 tp with NBO It
can be remarked from the FT-IR absorption spectra the gradual transformation of symmetric
stretching vibration mode of Te-O bonds from TeO3 units in TeO4 (tbp) units and the presence
of MnO2 units Once with the addition of iron ions the xFe2O3middot(100- x)[As2O3middotTeO2]
glasses behave like xMnOmiddot(100-x)[As2O3middotTeO2] glasses but in this system the
appearance of FeO6 units can be seen
414 Comparative study by FT-IR spectroscopy of
xMnOmiddot(100- x)[As2O3middotBO] vitreous systems were BO =gt TeO2 or PbO
The infrared absorption spectra obtained for xMnOmiddot(100- x)[As2O3middotBO] vitreous
systems where BO =gt TeO2 or PbO with 0 le x le 50 mol MnO are presented in figure
42 and 44 Following the infrared absorption spectra it can be observed that for
xMnOmiddot(100- x)[As2O3middot PbO] glass system the most disordered structure to exist for 0
le x le 5 mol MnO and to xMnOmiddot(100-x)[As2O3middot TeO2] glass system for 1 le x le 5 mol
MnO For x ge 5 mol MnO manganese ions break up a part of As ndash O ndash As Pb ndash O ndash Pb
and probably of As ndash O ndash Pb bonds to favor the increase in number of PbO4 units and
appearance of MnO2 units For x ge 10 mol MnO observed comparatively in both system
glasses the addition of manganese ions suggests for the first system a modification in linkage
characteristic units and for the second system an improvement for structural units of As2O3middot
TeO2 vitreous matrice also linkage characteristic units
415 Comparative study by FT-IR spectroscopy of
xFe2O3middot(100-x)[As2O3middotBO] vitreous systems where BO =gt TeO2 or PbO
The infrared absorption spectra obtained for xFe2O3middot(100- x)[As2O3middotBO] vitreous
systems where BO =gt TeO2 or PbO with 0 le x le 50 mol Fe2O3 are presented in figure
43 and 45
14
The evolution of the spectra with the addition and the increasing of the Fe2O3 content
suggest that the iron ions break up a part of As ndash O ndash As Pb ndash O ndash Pb and probably of As ndash O
ndash Pb bonds It can be observed a shift in the bands assigned As ndash O ndash As vibrations from AsO3
units due to changing to length As ndash O ndash As bonds and interne angles of AsO3 units the PbO4
units disappear and FeO6 units appear For x ge 5 mol Fe2O3 observed comparatively in
both system glasses the addition of iron ions suggests for the first system a modification in
linkage characteristic units of As2O3middotPbO and for the second system an improvement for
structural units of As2O3middot TeO2 vitreous matrice also linkage characteristic units appearance
of FeO6 units in both system
416 Comparative study by Raman spectroscopy of
As2O3middotTeO2 and As2O3middotPbO vitreous matrices
In order to obtain new information regarding the role of the modifier in the
formation of vitreous matrices there were made comparative studies by Raman
spectroscopy The Raman spectroscopy are presented in figure 46(ab) The wave
length and the structural assignments of Raman spectra of As2O3middotPbO şi As2O3middotTeO2 vitreous
matrices are presented in table 42
Table 42Wavenumber and the structural assignements of Raman spectra
of As2O3middotPbO and As2O3middotTeO2 vitreous matrices
~ [cm 1 ]
As2O3middotPbO As2O3middotTeO2
Attribution
~826 cm-1
~ 816 cm-1
Stretching vibrations of As-O-As
~ 752 cm-1
Vibrations of the continuous TeO4 (tbp) network
~ 627 cm-1
Vibrations As ndash O ndash As bonds from As2O units
~ 580 cm-1
Stretching vibrations of As-O-As
~ 525 cm-1
Vibrations O-As-O bonds from AsO3 units
~ 438cm-1
Symmetric bending vibrations of Te ndash O ndash Te vertex linkages between different TeO4 (tbp) TeO3+1 polyhedra Stretching vibrations of As-O-As of AsO3 units
~ 345 cm-1
Bending vibrations of As ndash O ndash As from As2O units
15
200 400 600 800 1000
As2O3PbO
Ram
an In
tens
ity [a
u]
LWavenumber [cm-1]
345
826
525
627a)
a
200 400 600 800 1000
816
752
580 R
aman
Inte
nsity
[au
]
Wavenumber [cm-1]
As2O3TeO2
438
b)
b
Fig46 Raman spectra of vitreous matrices a As2O3middotPbO şi b As2O3middotTeO2
The Raman spectrum of As2O3middotPbO glass matrix presents four bands at 826 cm-1
627 cm-1 525 cm-1 and 345 cm-1 The band from 826 cm-1 can be assigned to As ndash O ndash
As stretching vibrations [20] The band centered at 627 cm-1 can be assigned to vibrations As
ndash O ndash As bonds from As2O units the band from 525 cm-1 are assigned vibrations O-As-O
bonds from AsO3 units [21] The band of 345 cm-1 are attributed to As ndash O ndash As bending
vibrations from As2O units[2021]
The Raman spectrum of As2O3middot TeO2 glass matrix presents four bands at 816 cm-1
752 cm-1 580 cm-1 and 438 cm-1 The band from 816 cm-1 can be assigned to As ndash O ndash
As stretching vibrations [20] The band centered at 752 cm-1 can be assigned to vibrations of
the continuous TeO4 (tbp) network [22] The band of 580 cm-1 are attributed to As ndash O ndash As
stretching vibrations [12] The band centered at 438 cm-1 can be assigned symmetric bending
vibrations of Te ndash O ndash Te vertex linkages between different TeO4 (tbp) TeO3+1 polyhedra and
As ndash O ndash As stretching vibrations of AsO3 units
16
417 Study by Raman spectroscopy of xMOmiddot(100- x)[As2O3middotPbO]
vitreous systems where MO =gt MnO or Fe2O3
The Raman spectra obtained for xMOmiddot(100- x)[As2O3middotPbO] vitreous systems where
MO =gt MnO or Fe2O3 with 0 le x le 50 mol are presented in figure 47-8 and their
structural assignments are summarized in table 42
200 400 600 800 1000
368
833
345
1
3
Lungimea de unda [cm-1]
Inte
nsita
te R
aman
[ua
]
20
05
0
5
10
35
50
MnO
826
525
627
Fig 47 Raman spectra of xMnOmiddot(100- x)[As2O3middotPbO] glasses
The addition of MnO in the glass matrix determined an order degree of the vitreous
matrix The intensity of the bands attributed vibrations As ndash O ndash As bonds from As2O units
and bending vibrations of As ndash O ndash As from As2O units shift to a higher wave length that
suggests an increase in the As2O units comparative to AsO3 units
To the band from 826 cm-1 the addition of manganese ions in the glass matrix
determine for x = 05 mol an decreasing in intensity whereupon increasing for higher
concentrations The intensity of bands centered at 627 cm-1 and 525 cm-1 for x = 05
mol MnO decrease and disappear for x = 1 mol MnO The band of 345 cm-1 slowly
increases with the addition of manganese ions
To the band from 826 cm-1 the addition of iron ions in the glass matrix determines
for x = 05 mol an increase in intensity a gradual decrease and disappearance for x = 35
mol Fe2O3 of the bands observed for the glass matrix For higher concentrations of
manganese these bands gradually decrease The intensity of bands centered at 627 cm-1 and
525 cm-1 for x = 05 mol Fe2O3 increase and shift to 612 cm-1 and 501 cm-1 whereas
17
they gradually decrease and disappear for x = 10 mol Fe2O3 The band of 345 cm-1
decreases with the addition of iron ions and disappears for x = 20 mol Fe2O3
200 400 600 800 1000
3
612
501
Wavenumber [cm-1]
Ram
an In
tens
ity [a
u]
05
20
0
5
10
3550
1
Fe2O3
345
826
525
627
Fig 48 Raman spectra of xFe2O3middot(100- x)[As2O3middotPbO] glasses
With the increase of iron ions content in the As2O3middotPbO glass matrix the number of
these structural units decreases due to the increasing of the disorder in the studied glasses
418 Study by Raman spectroscopy of xMOmiddot(100-x)[As2O3middotTeO2]
vitreous systems were MO =gt MnO or Fe2O3
The Raman spectra obtained for xMOmiddot(100- x)[As2O3middot TeO2] vitreous systems
where MO =gt MnO or Fe2O3 with 0 le x le 50 mol are presented in figure 49-10 and their
structural assignments are summarized in table 42
The Raman spectrum of the glass matrix suggests a structure formed from TeO4 (tbp)
and TeO3 (tp) units where the presence of As ndash O ndash As bonds can not be excluded The
addition of manganese ions is leading to a modification of the structure proposed by the
spectrum of the glass matrix Then with the increasing of manganese content the intensity of
these bands is increasing showing that the manganese content favorises the formation of TeO4
(tbp) and TeO3 (tp) units
18
200 400 600 800 1000
783
850
768
416
816
752
Wavenumber [cm -1]
Ram
an In
tens
ity [a
u]
13
20
05
0
5
10
35
50
MnO
438
580
660
Fig 49 Raman spectra of xMnOmiddot(100- x)[As2O3middot TeO2] glasses
200 400 600 800 1000
226
294
408
673 751
5
W avenumber [cm -1]
Ram
an In
tens
ity [a
u]
05
20
0
3
10
35
50
1
Fe2O
3
816
752
438
580
Fig 410 Raman spectra of xFe2O3middot(100- x)[As2O3 TeO2] glasses
The Raman spectra of xFe2O3middot(100- x)[As2O3 TeO2] glasses present a significant
advance to the TeO4 (tbp) TeO3+1 polyhedra and AsO3 units represented in Raman spectrum
by the ~ 438 cm-1 band comparative with the modifications determined by the addition of
manganese ions in vitreous matrix For high concentrations of iron ions in xFe2O3middot(100-
x)[As2O3 TeO2] system of glasses the number of As-O-As linkages appear in Raman
spectrum due to stretching vibrations of As-O-As and vibrations of the continuous TeO4 (tbp)
network show a significant decrease
19
419 Comparative study by Raman spectroscopy of xMnOmiddot(100- x)[As2O3middotBO]
vitreous systems were BO =gt TeO2 or PbO
The addition of MnO to xMnOmiddot(100- x)[As2O3middotPbO] glass system do not break As
ndash O ndash As bonds into characteristic units and contribute to their prominence The addition of
manganese ions to xMnOmiddot(100- x)[As2O3middot TeO2] glass system for x=50mol MnO
determined the splitting up of a part of As ndash O ndash As Te-O-Te and the appearance of the
TeO4 (tbp) units against the loss of continuous TeO4 (tbp) network was observed
4110 Comparative study by Raman spectroscopy of xFe2O3middot(100- x)[As2O3middotBO]
vitreous systems where BO =gt TeO2 or PbO
With the increasing of iron ions content in the As2O3middotPbO glass matrix the number of
these structural units decreased due to the increase of the disorder in the studied glasses (x gt 20
mol ) and x = 50 mol Fe2O3 for xFe2O3middot(100- x)[As2O3middotTeO2] when iron ions
brought the structural units existing in glass matrices and favoured the appearace of
new bands due to bending vibrations of As ndash O ndash As
42 Comparative study by FT-IR and Raman spectroscopies of
xMOmiddot(100-x)[3B2O3middotLi2O] glasses where MO =gt MnO or Fe2O3
421 Study by FT-IR spectroscopy of xMOmiddot(100-x)[3B2O3middotLi2O] glasses
where MO =gt MnO or Fe2O3
The infrared absorption spectra obtained for xMOmiddot(1-x)[3B2O3middotLi2O] glass system
where MO =gt MnO or Fe2O3 with 0 le x le 50 mol are presented in figure 411-13 and their
structural assignments are summarized in table 43
500 1000 1500
3B2O3Li2O
Wavenumber [cm-1]
Abs
orpt
ion
[au
]
490
1400
1230
1061
698
614
460 78
6
Fig 411 FT ndash IR spectra of vitreous matrix 3B2O3middotLi2O
20
Following the infrared absorption spectra obtained for 3B2O3middotLi2O vitreous matrix
observed on eight bands ~ 1400 cm-1 ~ 1230 cm-1 ~ 1061 cm-1 ~ 786 cm-1 ~ 698 cm-
1 ~ 614 cm-1 ~ 490 cm-1 şi ~ 460 cm-1 The band at ~ 1400 cm-1 is assigned to
asymmetric stretching vibrations from BOslash3 şi BOslash2O- groups (Oslash represent oxygen atom
bridging two boron atoms) The band at ~ 1230 cm-1 is attributed to asymmetric stretching
vibrations of B ndash O bonds from triangular ortoborate BO 33 groups [23-26]
400 600 800 1000 1200 1400 1600
0
3
5
10
20
35
50
1
Wavenumber [cm-1]
Abs
orpt
ion
[ua
]
05
MnO
490
1400
1230
1061
698
614
460 78
6
Fig 412 FT ndash IR spectra of xMnOmiddot(100-x)[3B2O3middotLi2O] glasses
400 600 800 1000 1200 1400 1600
469
Wavenumber [cm-1]
Abs
orpt
ion
[ua
]
0
3
5
10
20
35
50
1
05
Fe2O3
490
1400
1230
1061
698
614
460 78
6
Fig 413 FT ndash IR spectra of x Fe2O3middot(100-x)[3B2O3middotLi2O] glasses
21
Table 43Wavenumber and the structural assignments of FT ndash IR and Raman
spectra of 3B2O3middotLi2O vitreous matrix
~ [cm 1 ] Attribution
FT ndash IR Raman FT ndash IR Raman
~ 1400 cm-1
~ 1400 cm-1
Asymmetric stretching
vibrations from BOslash3 şi BOslash2O-
groups
BOslash2O- triangles linked to
other borate triangular units
~ 1230 cm-1
Asymmetric stretching
vibrations of B ndash O bonds from
triangular ortoborate
BO 33 groups
~ 1061 cm-1
~ 1074 cm-1
Stretching vibrations of B ndash Oslash
bonds in -4BOslash tetrahedra from
tri- tetra- and penta-borate
groups
Diborate groups
~ 902 cm-1
Vibrations of orthoborate
groups
~ 786 cm-1
~ 791 cm-1
Bending vibrations of O3B ndash O
ndash BO4 bonds
Vibrations of rings with six
member to one or two BO4
tetrahedral from tri- tetra ndash
and penta ndash borate units
~ 698 cm-1
Bending vibrations of B-O-B
bonds from pentaborate groups
~ 614cm-1 Bending vibrations of O ndash B ndash O
bonds
~ 490cm-1 ~ 471cm-1 Bending vibrations of B-O-B
bonds
Isolated diborate groups
~ 460cm-1 Bending vibrations of O ndash B ndash O
bonds
22
The band at ~ 1061 cm-1 is assigned to stretching vibrations of B ndash Oslash bonds in -4BOslash
tetrahedra from tri- tetra- and penta-borate groups and the band at ~ 786 cm-1 is assigned
to bending vibrations of O3B ndash O ndash BO4 bonds The band at ~ 698 cm-1 is attributed to
Bending vibrations of B-O-B bonds from pentaborate groups The bands at ~ 614 cm-1 and
~ 460 cm-1 are assigned to bending vibrations of O ndash B ndash O bonds and the band at ~ 490 cm-
1 is assigned to bending vibrations of B-O-B bonds
From FT-IR spectra it can be concluded that the addition of manganese or iron ions in
vitreous matrices leads to the increase of the disorder degree
Also the structural changes that appeared in 3B2O3middotLi2O vitreous matrix with an
addition MnO or Fe2O3 content can be studied Ar=A4A3 ratio(A4 - relative number of -4BOslash tetrahedral borate units A3 - relative number of triangular (BOslash3 and BOslash2O-) units
0 10 20 30 40 50
010
015
020
Ar
x [mol]
MnO Fe2O3
Fig 414 The evolution of Ar ratio with the MnO or Fe2O3 content of
xMnOmiddot(100-x)[3B2O3middotLi2O] şi xFe2O3middot(100-x)[3B2O3middotLi2O] The evolution of the value of this ratio also allows a visualization of the effects
determined by the presence of the manganese or iron ions in the matrix The value Arltlt 1
indicated that BO3 is dominant related to BO4
422 Study by Raman spectroscopy of xMOmiddot(100-x)[3B2O3middotLi2O] glasses
where MO =gt MnO or Fe2O3
The Raman spectra obtained for xMOmiddot(1-x)[3B2O3middotLi2O] glass system were MO =gt
MnO or Fe2O3 with 0 le x le 50 mol are presented in figure 414-16 and their structural
assignments are summarized in table 43
Studying the Raman spectra of xMOmiddot(1-x)[3B2O3middotLi2O] glass system where MO =gt
MnO or Fe2O3 it has been observed that the absorption bands presented in vitreous matrix
gradually decreased with an increase in the manganese or iron content in both glasses system
which suggested an increase of the disorder in these vitreous systems
23
1000 2000 3000
B2O3Li2O
Wavenumber [cm-1]
Ram
an In
tens
ity [a
u]
1430
107490
279
1471
Fig 415 Raman spectra of vitreous matrix 3B2O3middotLi2O
500 1000 1500 2000 2500 3000
1430
107490
2791
0
Wavenumber [cm-1]
Ram
an In
tens
ity [a
u]
1
3
20
05
5
10
35
50
MnO
471
Fig 416 Raman spectra of xMnOmiddot(100-x)[3B2O3middotLi2O] glasses
400 600 800 1000 1200 1400 1600
Wavenumber [cm-1]
Ram
an In
tens
ity [a
u]
0
1
3
20
05
5
10
35
50
Fe2O3
1430
1074
90279
1
471
Fig 417 Raman spectra of x Fe2O3middot(100-x)[3B2O3middotLi2O] glasses
24
43 Comparative study by electron paramagnetic resonance (EPR) and magnetic
susceptibility measurements of xMOmiddot(100-x)[As2O3middotTeO2] xMOmiddot(100-x)
[As2O3middotPbO] and xMOmiddot(100-x)[3B2O3middotLi2O] glasses where MO =gt MnO or Fe2O3
431 Comparative study by electron paramagnetic resonance (EPR) of
xMnOmiddot(100-x)[As2O3middotBO] where BO =gt TeO2 or PbO
and xMnOmiddot(100-x) [3B2O3middotLi2O] glasses
In order to obtain more information regarding the behavior of manganese ions in
different vitreous matrices [3031] xMnOmiddot(100-x)[As2O3middotBO] where BO =gt TeO2 or PbO
and xMnOmiddot(100-x) [3B2O3middotLi2O] glasses were investigated by EPR spectroscopy on a large
compositional range with 0 le x le 50 mol The EPR spectra of Mn2+ for xMnOmiddot(100-
x)[As2O3middotPbO] (S1) xMnOmiddot(100-x)[As2O3middotTeO2] (S3) and xMnOmiddot(100-x)[3B2O3middotLi2O]
(S5) are presented in figure 418-20 These spectra present two absorption lines centered at gef
43 and gef 20 in all systems
The absorption line centered at gef 43 and is due to isolated Mn2+ ions [32] The
absorption line centered at gef 20 may be attributed to Mn2+ species interacting by magnetic
coupling[33] dipolar and or super exchange the last ones forming magnetic clusters [32]
The evolution of the spectra is easier to follow considering the dependence of
concentration on the EPR parameters the line - intensity (obtained as an integral of the area
under the corresponding EPR signal) J and the line - width ΔB The evolution of J and AB
reflects the structural transformations which appear in the glass matrices due to the increase of
manganese ions content
The intensity and the line - width of the resonance line from gef 43 for all
investigated systems is represented in figure 421(ab)
The intensity of the resonance line from gef 43 for all investigated glass systems
decreases due to the decrease of the isolated manganese ions numbers The line - width from
gef 43 for (S1) and (S3) systems decreases due to decrease of Mn2+ number and to the
structural disorder in glasses with the increase of MnO content For (S5) glass system the line
- width of the resonance line there is an increase in all compositional domains
The intensity of the resonance line from gef 20 can be observed as increasing up to
x=14 mol for (S1) system up to x=8mol for (S3) system and 20 mol for (S5)
system The line - width of the resonance line from gef 20 for (S1) and (S3) systems
increases up to 3 mol and 5mol for (S5) due to Mn2+ species interacting by magnetic
coupling dipole- dipole as the main broadening mechanism Over this concentration line ndash the
width of the resonance line from gef 20 is straight and it can be assumed that the
manganese ions begin to manifest super exchange magnetic interactions
25
1000 2000 3000 4000 5000
Firs
t der
ivat
ive
of a
bsor
ptio
n [u
a]
05
1
3
5
10
20
35
50
x [mol Mn2O3]amplif
B [G]
10
200
40
80
400
5
1
1
Fig 418 The EPR spectra of Mn2+ for xMnOmiddot(100-x)[As2O3middotPbO] (S1)
glass system
1000 2000 3000 4000 5000
Firs
t der
ivat
ive
of a
bsor
ptio
n [u
a]
x [mol MnO]
051
3
5
10
20
35
50
9
500
400
50
100
4
1
amplif
B [G]
1
Fig 419 The EPR spectra of Mn2+ for xMnOmiddot(100-x)[As2O3middotTeO2] (S3)
glass system
26
1000 2000 3000 4000 5000
501
B [G]
Firs
t der
ivat
ive
of a
bsor
ptio
n [u
a]
1
4
9
10
30
60
100
amplif
05
1
3
5
10
20
35
x [mol MnO]
Fe3+
Fig 420 The EPR spectra of Mn2+ for xMnOmiddot(100-x)[3B2O3middotLi2O] (S5)
glass system
0 2 4 6 8 10 12 14 16 18 20 22
x [mol]
J [ u
a]
S1 S3 S5
-2 0 2 4 6 8 10 12 14 16 18 20 22
50
100
150
200
250
300
S1 S3 S5
x [mol]
B
[G]
a b
Fig 421 The dependence on MnO content of the intensity (a) and width(b) of resonance
line at gef 43 for xMnOmiddot(100-x)[As2O3middotPbO] (S1) xMnOmiddot(100-x)[As2O3middotTeO2] (S3) şi
xMnOmiddot(100-x)[3B2O3middotLi2O] (S5) system glasses
27
0 10 20 30 40 50
x [mol]
J [ u
a]
S1 S3 S5
0 10 20 30 40 50
400
500
600
700
800
900
S1 S3 S5
x [mol]
B[G
]
a b
Fig 422 The dependence on MnO content of the intensity (a) and width b) of resonance
line at gef 20 for xMnOmiddot(100-x)[As2O3middotPbO] (S1) xMnOmiddot(100-x)[As2O3middotTeO2] (S3) and
xMnOmiddot(100-x)[3B2O3middotLi2O] (S5) system glasses
Following figure 418-20 it can be observed that (S1) and (S3) have had a similar
evolution but (S5) system presented for 05 le x le 5 mol (fig420) has a hyperfine
sextet[33] at gef 20due to Mn2+ isolated ions
432 Comparative study by magnetic susceptibility measurements of
xMnOmiddot(100-x)[As2O3middotBO] where BO =gt TeO2 or PbO and
xMnOmiddot(100-x)[3B2O3middotLi2O] glasses
The magnetic susceptibility data are in good agreement with the EPR result The
magnetic behavior of the glasses from xMnOmiddot(100-x)[As2O3middotBO] where BO =gt TeO2 (S3)
or PbO (S1) and xMnOmiddot(100-x)[3B2O3middotLi2O] (S5) glasses for 3 le x le 50 mol MnO are
presented in figure 423 - 25
For (S1) and (S3) system glasses up to x 3 mol and x 5 mol (S5) glass
system the temperature dependence of the reciprocal magnetic susceptibility obeys a Curie
law In this concentration range the manganese ions are predominantly isolated orand
participate in dipole-dipole interractions At higher concentrations the reciprocal magnetic
susceptibility obeys a Curie-Weiss law with negative paramagnetic Curie temperature (p)
characteristic to antiferromagnetic coupled ions by means of super exchange interractions(fig
426) This behavior of manganese ions is confirmed by the shape of the EPR spectra
28
100 150 200 250
2
4
6
8
10
12
14
16
18
20
22
T [K]
[
emu
mol
]-1
3 mol 5 mol 10 mol 20 mol 35 mol 50 mol
Fig423 The temperature dependence of -1 for xMnOmiddot(100-x)[As2O3middotPbO]
(S1) 3 le x le 50 mol
50 100 150 200 2500
2
4
6
8
10
12
14
16
18
20
22
3 mol 5 mol 10 mol 20 mol 35 mol 50 mol
T [K]
[
emu
mol
]-1
Fig424 The temperature dependence of -1 for xMnOmiddot(100-x)[ As2O3middotTeO2]
(S1) 3 le x le 50 mol
100 150 200 250
2
4
6
8
10
12
14
16
18
20
22
[em
u m
ol]-1
T [K]
3 mol 5 mol 10 mol 20 mol 35 mol 50 mol
Fig425 The temperature dependence of -1 for xMnOmiddot(100-x)[3B2O3middotLi2O]
(S5) 3 le x le 50 mol
29
0 10 20 30 40 50
0
20
40
60
80
100
x [mol]
-p [K
]
(S1) (S3) (S5)
Fig426Concentration dependence of (p) for sistemele xMnOmiddot(100-x)[As2O3middotPbO]
(S1) xMnOmiddot(100-x)[As2O3middotTeO2] (S3) şi xMnOmiddot(100-x)[3B2O3middotLi2O] (S5)
Using the representation 1 =f(T) the molar Curie constants CM the effective
magnetic moments and molar fraction of Mn2+(x1) şi Mn3+(x2) ions were calculated and
represented in tables 44 -6
Tabel 44 Molar Curie constants effective magnetic moments and molar fraction of Mn2+(x1) şi Mn3+(x2) ions in xMnOmiddot(100-x)[As2O3middotPbO] (S1) glasses
x
[mol MnO2] CMtimes102
[emu mol] ef
[microB] x1
[mol Mn2+O2] x2
[mol Mn3+O2] 3 1272 582 268 032 5 1979 562 343 157 10 3777 549 555 445 20 6688 517 492 1508 35 12239 502 377 3123 50 15427 496 268 4732
Tabel 45 Molar Curie constants effective magnetic moments and molar fraction of Mn2+(x1) şi Mn3+(x2) ions in xMnOmiddot(100-x)[As2O3middotTeO2] (S3)glasses
x
[mol MnO2] CMtimes102
[emu mol] ef
[microB] x1
[mol Mn2+O2] x2
[mol Mn3+O2] 3 1297 588 287 013 5 1938 556 312 188 10 3804 551 575 425 20 6766 52 549 1451 35 11148 504 441 3059 50 15528 498 358 4642
30
Tabel 46 Molar Curie constants effective magnetic moments and molar fraction of Mn2+(x1) şi Mn3+(x2) ions in xMnOmiddot(100-x)[3B2O3middotLi2O] (S5) glasses
x
[mol MnO2] CMtimes102
[emu mol] ef
[microB] x1
[mol Mn2+O2] x2
[mol Mn3+O2] 3 127 581 265 035 5 1919 554 303 197 10 3681 542 486 514 20 7215 519 53 147 35 1121 506 505 2995 50 15898 501 493 4507
433 Comparative study by electron paramagnetic resonance (EPR) of
xFe2O3middot(100-x)[As2O3middotBO] where BO =gt TeO2 or PbO and
x Fe2O3middot(100-x) [3B2O3middotLi2O] glasses
In order to obtain more information regarding the behavior of iron ions in
xFe2O3middot(100-x)[As2O3middotBO] where BO =gt TeO2 (S4) or PbO (S2) şi xFe2O3middot(100-
x)[3B2O3middotLi2O] glasses were investigated by EPR spectroscopy on a large compositional
range with 05 le x le 35 mol Fe2O3 The EPR spectra of Fe3+ in xFe2O3middot(100-
x)[As2O3middotPbO] (S2) xFe2O3middot(100-x)[As2O3middotTeO2] (S4) and xFe2O3middot(1-x)[3B2O3middotLi2O]
(S6) are presented in figure 427-29 These spectra present two absorption lines centered at
gef 43 and gef 20 up to x le 35mol Fe2O3 systems studied
The absorption line centered at gef 43 is due to isolated Fe3+ ions [34-36] The
absorption line centered at gef 20 may be attributed to Fe3+ species interacting by magnetic
coupling dipolar and or super exchange the last ones forming magnetic clusters [37-41]
The evolution of the spectra is easier to follow considering the dependence of
concentration on the EPR parameters the line - intensity (obtained as an integral of the area
under the corresponding EPR signal) J and the line - width ΔB The evolution of J and AB
reflects the structural transformations which appear in the glass matrices due to the increasing
of iron ions content
The intensity and the line - width of the resonance line from gef 43 for all
investigated systems is represented in figure 430 (a b) The intensity of the resonance line
from gef 43 increases for (S2) and (S4) up to 3 mol and up to 5 mol for (S6) then
decreases for all systems investigated A line broadening up to 3 mol from gef 43 for
these systems can be observed due to increasing of Fe3+ isolated number of ions
31
1000 2000 3000 4000 5000
40
Firs
t der
ivat
ive
of a
bsor
ptio
n [u
a]
B [G]
x [mol Fe2O3]
05
1
3
5
1020
35 2
40
20
10
10
10
amplif
Fig427 The EPR spectra of Fe3+ for xFe2O3middot(100-x)[As2O3middotPbO] (S2)
glass system
1000 2000 3000 4000 5000
100
B [G]
Firs
t der
ivat
ive
of a
bsor
ptio
n [u
a]
10080
20
50
20
20
3
05
1
5
102035
x [mol Fe2O3] amplif
Fig428 The EPR spectra of Fe3+ for xFe2O3middot(100-x)[As2O3middotTeO2] (S4)
glass system
32
1000 2000 3000 4000 5000
Firs
t der
ivat
ive
of a
bsor
ptio
n [u
a]
B [G]
3
05
1
5
10
20
35
x [mol Fe2O3]
30
50
20
20
10
30
30
amplif
Fig429 The EPR spectra of Fe3+ for xFe2O3middot(100-x)[3B2O3middotLi2O] (S6)
glass system
The intensity and the line - width of the resonance line from gef 43 for all
investigated systems is represented in figure 430 (a b)The resonance line from gef 20 is
attributed to Fe3+ ions that interact by magnetic coupling dipolar orand super exchange
interractions can be observed in all compositional domains
The intensity of the resonance line from gef 20 can be observed as increasing up to
x=35 mol for (S2) and (S6) system and 10 mol for (S4) system with increased iron
ions content The line - width of the resonance line from gef 20 increased up to 10mol
for (S2) system and up to 3 mol for (S4) and 5mol for (S6) due to Fe3+species
interacting by magnetic coupling dipole-dipole Above this concentration line - width of the
resonance line from gef 20 can be attributed to dipolar and super exchange magnetic
interactions The ΔB = f(x) dependence reflects the competion between the broadening
mechanism (dipole ndash dipole interactions the interactions between ions in diferent
valence state and structural disorder) and the narrowing ones (super exchange
interactions)
33
0 5 10 15 20 25 30 35 40
x [mol]
J [ u
a]
S2 S4 S6
a)
0 5 10 15 20 25 30 35 4040
60
80
100
120
140
160
180
200
220 S2 S4 S6
B[G
]
x [mol]
a b
Fig 430 The dependence on Fe2O3 content of the intensity (a) and width (b) of
resonance line at gef 43 for xFe2O3middot(100-x)[As2O3middotPbO] (S2)
xFe2O3middot(100-x)[As2O3middotTeO2] (S4) and xFe2O3middot(100-x)[3B2O3middotLi2O] (S6) glasses
0 5 10 15 20 25 30 35 40
x [mol]
J [ u
a]
S2 S4 S6
a)
0 5 10 15 20 25 30 35 40
200
400
600
800
1000
1200
1400
1600
x [mol]
B
[G] S2
S4 S6
a b
Fig 431 The dependence on Fe2O3 content of the intensity (a) and width (b) of
resonance line at gef 20 for xFe2O3middot(100-x)[As2O3middotPbO] (S2)
xFe2O3middot(100-x)[As2O3middotTeO2] (S4) and xFe2O3middot(100-x)[3B2O3middotLi2O] (S6) glasses
34
434 Comparative study by magnetic susceptibility measurements of
xFe2O3middot(100-x)[As2O3middotBO] where BO =gt TeO2 or PbO and
xFe2O3middot(100-x) [3B2O3middotLi2O] glasses
The magnetic susceptibility data are in good agreement with the EPR result The magnetic
behavior of the glasses xFe2O3middot(100-x)[As2O3middotPbO] (S2) xFe2O3middot(100-x)[As2O3middotTeO2]
(S4) and xFe2O3middot(100-x)[3B2O3middotLi2O] (S6) for 3 x 50 mol Fe2O3 are presented in
figure 432 - 34
For (S2) glass systems up to x 10 mol x 3 mol (S5) glass systems and x 5
mol (S6) glass systems the temperature dependence of the reciprocal magnetic susceptibility
obeys a Curie law In this concentration range the iron ions are predominantly isolated orand
participate in dipole-dipole interactions At higher concentrations the reciprocal magnetic
susceptibility obeys a Curie-Weiss law with negative paramagnetic Curie temperature (p)
characteristic to antiferromagnetic coupled ions by means of super exchange interactions(fig
435) This behavior of iron ions is confirmed by the shape of the EPR spectra
80 100 120 140 160 180 200 220 240 260 2800
1
2
3
4
5
6
7
8
9
10
11
[
emu
mol
]-1
T [K]
3 mol 5 mol 10 mol 20 mol 35 mol 50 mol
Fig432 The temperature dependence of -1 for xFe2O3middot(100-x)[As2O3middotPbO] (S2)
3 x 50 mol
35
80 100 120 140 160 180 200 220 240 260 2800
1
2
3
4
5
6
7
8
9
10
T [K]
[
emu
mol
]-1
3 mol 5 mol 10 mol 20 mol 35 mol 50 mol
Fig433 The temperature dependence of -1 for xFe2O3middot(100-x)[As2O3middotTeO2] (S4)
3 x 50 mol
80 100 120 140 160 180 200 220 240 260 2800
1
2
3
4
5
6
7
8
9
10
11
3 mol 5 mol 10 mol 20 mol 35 mol 50 mol
T [K]
[
emu
mol
]-1
Fig434 The temperature dependence of -1 for xFe2O3middot(100-x)[3B2O3middotLi2O] (S6)
3 x 50 mol
36
0 10 20 30 40 50
0
10
20
30
40
50
x [mol]-
p [K]
(S2) (S4) (S6)
Fig435Concentration dependence of (p) for sistemele xFe2O3middot(100-x)[As2O3middotPbO] (S2) xFe2O3middot(100-x)[As2O3middotTeO2] (S4) and xFe2O3middot(100-x)[3B2O3middotLi2O] (S6)
for 3 x 50 mol Fe2O3
Using the representation 1 = f(T) the molar Curie constants CM the effective
magnetic moments and molar fraction of Fe3+(x1) şi Fe2+(x2) ions were calculated and
represented in tables 47-9
Table 47 Molar Curie constants effective magnetic moments and molar fraction of
Fe3+(x1) şi Fe2+(x2) ions in xFe2O3middot(100-x)[As2O3middotPbO] glasses (S2)
x [mol Fe2O3]
CMtimes102
[emu mol] ef
[microB] x1
[mol Fe23+O3]
x2 [mol Fe2
2+O3] 3 2526 58 261 039 5 393 56 332 168 10 7326 541 476 524 20 13459 519 53 147 35 23364 516 829 2671 50 32154 507 767 4233
Table 48 Molar Curie constants effective magnetic moments and molar fraction of
Fe3+(x1) şi Fe2+(x2) ions in xFe2O3middot(100-x)[As2O3middotTeO2] glasses (S4)
x [mol Fe2O3]
CMtimes102
[emu mol] ef
[microB] x1
[mol Fe23+O3]
x2 [mol Fe2
2+O3] 3 2571 585 277 023 5 4016 566 363 137 10 7911 562 686 314 20 14992 521 643 929 35 22676 509 601 2899 50 30959 497 313 4687
37
Table 49 Molar Curie constants effective magnetic moments and molar fraction of Fe3+(x1) şi Fe2+(x2) ions in xFe2O3middot(100-x)[3B2O3middotLi2O] glasses (S6)
The results allowed to consider that the magnetic properties of the studied glasses can
be explained through magnetic interractions between Fe3+ - Fe3+ Fe3+- Fe2+ and Fe2+- Fe2+ that
explain the dependences of RPE parameters concentration
SELECTED CONCLUSIONS
In this thesis xMOmiddot(100-x)[As2O3middotTeO2] xMOmiddot(100-x) [As2O3middotPbO] and
xMOmiddot(100-x)[3B2O3middotLi2O] glasses where MO =gt MnO or Fe2O3 were comparatively
studied in 0 le x le 50 mol The structural modifications of investigated glass matrices were
comparatively followed in function of the manganese or iron ions on the investigated glass
matrices were followed
The study by FT-IR spectroscopy shows that the evolution of the spectra of
xMnOmiddot(100-x) [As2O3middotPbO] with the addition and the increasing of the MnO content suggest
that the manganese ions break up a part of As ndash O ndash As Pb ndash O ndash Pb and probably of As ndash O ndash
Pb bonds The addition of MnO in the As2O3middotPbO glass matrix is leading to a disordering of
the glasses structure with the increasing of the MnO content
The evolution of the absorption bands for FT ndash IR spectrum of xFe2O3middot(1-x)
[As2O3middotPbO] glasses are determined by the addition of Fe2O3 content It can be observed to
shift the bands assigned As ndash O ndash As vibrations from AsO3 units due to changing to length As
ndash O ndash As bonds and interne angles of AsO3 units disappears PbO4 units and appears FeO6
units The addition of Fe2O3 in the As2O3middotPbO glass matrix determined a disordering of the
glasses structure with the increasing of the Fe2O3 content
From FT-IR absorption spectra of the investigated xMOmiddot(100-x)[As2O3middotTeO2] glasses
system where MO =gt MnO or Fe2O3 it can be observed that the addition and increasing of
manganese ions concluded the contraction of As-O-As bonds from totally symmetric
x [mol Fe2O3]
CMtimes102
[emu mol] ef
[microB] x1
[mol Fe23+O3]
x2 [mol Fe2
2+O3] 3 2542 582 268 032 5 3943 561 338 162 10 7423 544 506 494 20 13568 520 549 1451 35 23094 513 731 2769 50 31746 503 584 4416
38
stretching vibrations of AsO3 units for x ge10 mol there can be an increase in number of As-
O-As bonds from AsO3 units orand a length these linkage to doubly degenerate stretching
vibrations of AsO3 units and a stretching vibration mode of TeO3 tp with NBO It can be
remarked from the FT-IR absorption spectra the gradual transformation of symmetric
stretching vibration mode of Te-O bonds from TeO3 units in TeO4 (tbp) units and the presence
of MnO2 units Once with the addition of iron ions the xFe2O3middot(100- x)[As2O3middotTeO2]
glasses behave like xMnOmiddot(100-x)[As2O3middotTeO2] glasses but in this system the
appearance of FeO6 units can be seen
From FT-IR spectra in xMOmiddot(100-x)[3B2O3middotLi2O] glasses where MO =gt MnO or
Fe2O3 can be concluded that the addition of manganese or iron ions in vitreous matrices leads
to the increase of the disorder degree
The study by Raman spectroscopy shows that the evolution of the spectra the addition
of MnO in the [As2O3middotPbO]glass matrix determined an order degree of the vitreous matrix
The intensity of the bands attributed vibrations As ndash O ndash As bonds from As2O units and
bending vibrations of As ndash O ndash As from As2O units shift to a higher wave length that suggests
an increase in the As2O units comparative to AsO3 units With the increase of iron ions content
in the As2O3middotPbO glass matrix the number of these structural units decreases due to the
increasing of the disorder in the studied glasses
With the increasing of manganese content in As2O3TeO2 glass matrix the intensity
of these bands is increasing showing that the manganese content favorites the formation of
TeO4 (tbp) and TeO3 (tp) units For high concentrations of iron ions in xFe2O3middot(100-
x)[As2O3 TeO2] system of glasses the number of As-O-As linkages appear in Raman
spectrum due to stretching vibrations of As-O-As and vibrations of the continuous TeO4 (tbp)
network show a significant decrease
Studying the Raman spectra of xMOmiddot(1-x)[3B2O3middotLi2O] glass system where MO =gt
MnO or Fe2O3 it has been observed that the absorption bands presented in vitreous matrix
gradually decreased with an increase in the manganese or iron content in both glasses system
which suggested an increase of the disorder in these vitreous systems
The EPR spectra presents the behavior of manganese or iron ions in different vitreous
matrices xMOmiddot(100-x)[As2O3middotBO] where MO=gtMnO or Fe2O3 and BO =gt TeO2 or
PbO and xMOmiddot(100-x) [3B2O3middotLi2O] Glasses were investigated by EPR spectroscopy on a
large compositional range with 0 le x le 50 mol The absorption line centered at gef 43 and
is due to isolated Mn2+ ions The absorption line centered at gef 20 may be attributed to
Mn2+ species interacting by magnetic coupling dipolar and or super exchange the last ones
forming magnetic clusters The EPR spectra of Fe3+ in xFe2O3middot(100-x)[As2O3middotPbO]
xFe2O3middot(100-x)[As2O3middotTeO2] and xFe2O3middot(1-x)[3B2O3middotLi2O] are presented two absorption
lines centered at gef 43 and gef 20 up to x le 35mol Fe2O3 systems studied
39
The absorption line centered at gef 43 is due to isolated Fe3+ ions The absorption
line centered at gef 20 may be attributed to Fe3+ species interacting by magnetic coupling
dipolar and or super exchange the last ones forming magnetic clusters
The evolution of the spectra is easier to follow considering the dependence of
concentration on the EPR parameters the line - intensity (obtained as an integral of the area
under the corresponding EPR signal) J and the line - width ΔB The evolution of J and AB
reflects the structural transformations which appear in the glass matrices due to the increase of
manganese ions content
The magnetic susceptibility data are in good agreement with the EPR result The
magnetic behavior of the glasses from xMnOmiddot(100-x)[As2O3middotBO] where BO =gt TeO2 (S3)
or PbO (S1) and xMnOmiddot(100-x)[3B2O3middotLi2O] (S5) glasses for 3 le x le 50 mol MnO
For (S1) and (S3) system glasses up to x 3 mol and x 5 mol (S5) glass
system the temperature dependence of the reciprocal magnetic susceptibility obeys a Curie
law In this concentration range the manganese ions are predominantly isolated orand
participate in dipole-dipole interractions At higher concentrations the reciprocal magnetic
susceptibility obeys a Curie-Weiss law with negative paramagnetic Curie temperature (p)
characteristic to antiferromagnetic coupled ions by means of super exchange interractions This
behavior of manganese ions is confirmed by the shape of the EPR spectra Using the
representation 1 =f(T) the molar Curie constants CM the effective magnetic moments
and molar fraction of Mn2+(x1) şi Mn3+(x2) ions were calculated The magnetic susceptibility
data are in good agreement with the EPR result
The magnetic behavior of the glasses xFe2O3middot(100-x)[As2O3middotPbO] (S2)
xFe2O3middot(100-x)[As2O3middotTeO2] (S4) and xFe2O3middot(100-x)[3B2O3middotLi2O] (S6) for 3 x 50
mol Fe2O3 are presented For (S2) glass systems up to x 10 mol x 3 mol (S5)
glass systems and x 5 mol (S6) glass systems the temperature dependence of the
reciprocal magnetic susceptibility obeys a Curie law In this concentration range the iron ions
are predominantly isolated orand participate in dipole-dipole interactions At higher
concentrations the reciprocal magnetic susceptibility obeys a Curie-Weiss law with negative
paramagnetic Curie temperature (p) characteristic to antiferromagnetic coupled ions by
means of super exchange interactions(fig 435) This behavior of iron ions is confirmed by the
shape of the EPR spectra Using the representation 1 = f(T) the molar Curie constants
CM the effective magnetic moments and molar fraction of Fe3+(x1) şi Fe2+(x2) ions were
calculated
40
REFERENCES
Chapter 1
[1] I Ardelean bdquoIntroducere icircn studiul materialelor oxidice cu structură vitroasă EdNapocaStar Cluj Napoca 2002 [2] G Srinivasarao N Veeraiah J All Com 327 52-65(2001) [3] G Srinivasarao N Veeraiah J Phys Chem Solids 63705-717(2002) [4] DBecherescu VCristea FMarx IMenessz FWinter Chimia stării solide Ed Şt şi Encicl Bucucureştivol 1 1983 [5] J Wong CAAngell Glass-Structure by Spectroscopy Dekker Inc New York 1976 [6] BEWarren HKKrutter O Morningstat J Am Ceram Soc 19 202 (1936) [7] LLSperry JD Mackenzie Phys Chem Glasses 9 91 (1968) [8] WLKonijnendijk JMStevels J Non-Cryst Solids 18 307 (1975) [9] FCEversteyn JM Stevels HJ Naterman Phys Chem Glasses 1 134 (1963) [10] G Fuxi Optical and Spectroscopie Properties of Glass Springer-Verlag Shanghai Scientific Technical Pub Shanghai 1991 [11] YDYiannopoulos GDChryssikos EIKamitsos Phys Chem Glasses 42(3) 164 (2001) [12] MGFerreira da Silva BFOCosta J Non-Cryst Solids 293-295 534 (2001) [13] RYordanova YDimitriev VDimitriev S Kassabov DKlissurski JNon-Cryst Solids 201 141 (1996) [14] W L Konijnendijk J M Stevels J Non-Cryst Solids 18 307 (1980) [15] M Iron M Couzi ALevasseur JBrethous JSolidState Chem 31 285 (1980) [16] TFurukawa WBWhite PhzsChemGlasses 21 85 (1980) [17] E I Kamitsos M A Karakassides GD Chryssikos J Phys Chem 90 4528 (1986) [18] E I Kamitsos M A Karakassides GD Chryssikos J Phys Chem 91 1073 (1987) [19] TWBril Philips Res Rep Suppl 2 117 (1976) [20] E I Kamitsos M A Karakassides GD Chryssikos J Phys Chem 30 203 (1989) [21] BNMeera JRamakrishna J Non-Cryst Solids 159 1 (1993) [22] KWitke THubert PReich JRamanSpectr 24 407 (1993) [23] E I Kamitsos M A Karakassides Phys Chem Glasses 30 19 (1989) [24] MPeteanu Teză de doctoratrdquo Universitatea Babeş-Bolyairdquo Cluj Napoca (1989) [25] PCTaylor PJBray JPhys Chem Solids 33 43 (1972) [26] IArdelean MPeteanu GhIlonca DPop Solid State Commun 33 653 (1980) [27] AV De Wijn RE Van Balderen JKemPhys 46 4 (1967) [28] DL Griscom RE Griscom J Phys Chem Glasses 12 19 (1971) [29] JWH Schreurs JChem Phys 69 2151 (1978) [30] AlNicula M Peteanu IArdelean Studia Univ Babeş-Bolyai Physica 2 65 (1979) [31] M Peteanu IArdelean SFilip ITodor GSalvan Studia Univ Babeş-Bolyai Physica XL 2 9 (1995) [32] IArdelean M Peteanu SFilipV Simon ITodor Solid State Commun 105 (5) 339 (1998) [33] SKMendiratta EGuedes de Sousa JMatSci Lett7 733 (1988) [34] IArdelean M Peteanu SFilip V Simon GGyorffy Solid State Commun 102 (4) 341 (1997) [35] IArdelean M Peteanu SFilip V Simon FCiorcas ITodor JMagnMagn Mat 196-197 257 (1999) [36] JKliava RBerger YServant JEmery JMGreneche JTrokss J Non-Cryst Solids 202 205 (1996) [37] LDBogomolova NA Krasilnikova VLBogdanov VDKhaliev VV Mitrofanov J Non-Cryst Solids 188 130 (1995) [38] DLoveridge SPark PhysChem Glasses 12 19 (1971) [39] IArdelean G Salvan M Peteanu V Simon FCiorcas Mod PhysLett B 13 (22-23) 801 (1999)
41
[40] JLRao AMuraly EDRao J Non-Cryst Solids 202 215 (1996) [41] CPrakash S Husain RJ Singh SMollah JAlloys Compon 326 47 (2001) [42] EGuedes de Sousa SKMendiratta JMMachado Da Silva Portugal Phys 17 (3-4) 203 (1986) [43] TCastner GSNewell WCHolton CP Slichter JChem Phys 32 668 (1960) [44] SPChaudhuri SKPatra JMatSci 35 4735 (2000) [45] IArdelean HH Qiu HSakata Matt Lett 32 335 (1997) Chapter 2 [1] J Wong C A Angel Glass Structure by Spectroscopy Marcel Dekker inc New-York 1976 [2] I Ardelean bdquoIntroducere icircn studiul materialelor oxidice cu structură vitroasă EdNapocastar Cluj-Napoca 2002 [3] N Avram GH Mateescu Spectroscopia icircn infraroşu Aplicaţii icircn chimia organică Ed Tehnică Bucureşti 1968 [4] TIliescu Spectroscopie optică moleculară vibraţională şi electronică Ed Casa Cărţii de Ştiinţă Cluj- Napoca 2000 [5] S Aştilean bdquoMetode şi tehnici moderne de spectroscopie optică Ed Casa Cărţii de Ştiinţă Cluj - Napoca 2002 p 5 [6] I Ursu Rezonanţă Electronică de Spinrdquo Ed AcademieiBucureşti (1965) [7] CHHurd ContempPhys 23 (5) 469 (1982) [8] GWAnderson WDCompton JChemPhys52 6166 (1970) [9] MS Seehra GSrinivasan Landolt-Bornstein (New Series) SubVolume F3 Springer-Verlag Berlin 1994 [10] GToulouse ContempPhys 2115 (1977) [11] NMMurayMagnetic susceptybility EdInterscience New York P1773 1963 [12] JBGoodenough Magnetism and Chemical Bond EdInterscience New York 1963 [13] IArdelean G Salvan M Peteanu V Simon FCiorcas Mod PhysLett B 13 (22-23) 801 (1999) [14] IArdelean MPeteanu R Ciceo Lucăcel Studii de rezonanţă paramagnetică electronică şi magnetice ale unor ioni 3d icircn sticle pe bază de B2O3 Ed Presa Univesitară Clujeană 2005 [15] IArdelean PhysStatSol (b) 87K137 (1978) [16] IArdelean Solid State Commun 31 75 (1979) [17] EJFrieble LKWilson AWDozier DLKinser PhysStatSol (b) 45 323 (1971) [18] DWMoon JMAitken RKMcCrone GS Ciloszik PhysChe Glasses 16 (5) 91 (1975) [19] SFilip Teză de doctorat UnivBabeş-Bolyai Cluj Napoca 1996 [20] CJSchinkel GWRathenou Physics of Non-Crystaline Solids North Holland Publ Co Amsterdam 215 1965 [21] EJFrieble LKWilson NCKoon DLKinser JAm Ceram Soc 57-237 (1974) [22] RJLandry JT Fournier CGYoung JChemPhys 46 1285 (1967) [23] WSimpson PhysStatSolidi b40 207 (1970) [24] RHasegawa PhysRevB b(5) 1631 (1971) [25] IArdelean GhIlonca MPeteanu Solid State Commun 52 145 (1984) [26] IArdelean GhIlonca OCozar J Physique 49 C8 1107 (1988) Chapter 3 [1] LFBates Modern Magnetism p133 Cambridge University Press London 1962 [2] IArdelean GhIlonca DBarbos Solid State Commun 40 769 (1981) [3] EBurzo IUrsu DUngur IArdelean JMatSci 15 581 (1980) [4] EBurzo IUrsu DUngur IArdelean MatResBull 15 1273 (1980) [5] DLGriscom Glass Science and Technology 48 151 (1990) [6] PJBray AH Silver Modern aspects of the vitreous state vol1 Butterworth
42
London 1960 [7] IArdelean Teza de doctorat UnivBabeş-Bolyai Cluj Napoca 1979 [8] SAştilean bdquoMetode şi tehnici moderne de spectroscopie opticărdquo EdCasa Cărţii de Ştiinţă Cluj ndash Napoca 2002 p5 [9] IArdelean RCiceo-Lucăcel ldquoFizica şi Tehnologia Materialelor Oxidice Lucrări Practicerdquo Ed Univ ldquoBabeş-Bolyairdquo Cluj-Napoca 2000 [10] VPop IChicinaş NJumate Fizica materialelor Metode experimentalerdquo EdPresa Universitară Clujeană 2001 [11] IUrsu Rezonanţă electronică de spinrdquo EdAcademiei Bucureşti 1965 Chapter 4 [1] I Ardelean S Lupşor D Rusu Solid State Sci 10 1384(2008) [2] I Ardelean S Lupşor D Rusu trimis spre publicare la Physica B decembrie 2009 [3] P Tarte Spectrochim Acta 18 467 (1962) [4] R A Condrate J Non ndash Cryst Solids 84 26 (1986) [5] G Srinivasarao N Veeraiah Phys Stat Sol (a) 191 370(2002) [6] G Srinivasarao N Veeraiah J Phys Chem Solids 63 705(2002) [7] G Srinivasarao N Veeraiah J All Com 327 52 (2001) [8] DK Durga N Veeraiah Bull Mater Sci 24 (4) 421 (2001) [9] F F Bentley L D Smithson A L Rozek InfraredndashSpectra and Characteristic Frequencies 700-300 cm-1 Interscience New York 1968 p 103 [10] O Noguera T Merle-Mejean AP Mirgorodsky MB Smirnov P Thomas J-C Champarnaud-Mesjard J Non-Cryst Solids 330 50 (2003) [11] BVR Chowdari KL Tan Fang Ling Solid State Ionics 113 ndash 115 711(1998) [12] C Jiang J Zhang H Mao F Gan Glass Technol 39(6) 200(1998) [13] MR Sahar K Sulhadi MS Rohani J Mater Sci 42 824(2007) [14] C Horea D Rusu I Ardelean J Mater Sci Mater Electron 20 905(2009) [15] GE Rachkovskaya GB Zakharevich J Appl Spectrosc 74 86(2007) [16] I Ardelean S Lupşor D Rusu trimis spre publicare la Journal of Materials Science Materials in Electronics decembrie 2009 [17] I Ardelean S Lupşor D Rusu trimis spre publicare la Modern Physics Letters B decembrie 2009 [18] R Iordanova Y Dimitriev V Dimitrov S Kassabov D Klissurski J Non ndash Cryst Solids 231 227 (1998) [19] R Iordanova Y Dimitriev S Kassabov D Klissurski J Non ndash Cryst Solids 204 141 (1996) [20] J O Jensen S J Gilliam A Banerjee D Zeroka S J Kirkby C N Merrow J Mol Struct (Theochem) 664 145 (2003) [21] G N Papatheodorou S A Solin Solid State Commun 16 5 (1975) [22] BVR Chowdari KL Tan Fang Ling J Mat Sci 35 2015 (2000) [23] R C Lucacel C Marcus V Timar I Ardelean Solid State Sci 9 850 (2007) [24] CP Varsamis EI Kamitsos GD Chryssikos Solid State Ionics 136ndash137 1031 (2000) [25] Sherief M Abo-Naf Fatma H El Batal Moenis A Azooz Mat Chem Phys 77 846 (2002) [26] SG Motke SP Yawale SS Yawale Bull Mater Sci 25 (10) (2002) [27] R Akagi N Ohtori N Umesaki J Non ndash Cryst Solids 293 471(2001) [28] E I Kamitsos M A Karakassides G D Chryssikos J Phys Chem 91(5) 1073 (1987) [29] H Ushida Y Iwadate T Hattori S Nishiyama K Fukushima Y Ikeda M Yamaguchi M Misawa T Fukunaga T Nakazawa S Jitsukawa J Alloys Compd 377 167 (2004) [30] I Ardelean F Ciorcas M Peteanu S Lupşor G Salvan Balkan Phys Lett 5 860 (1997)
43
[31] I Ardelean M Peteanu V Simon O Cozar F Ciorcas S Lupşor J Magn Magn Mater 196 253 (1999) [32] IArdelean MPeteanu GhIlonca Phys Stat Sol (a) 58 K33(1980) [33] IArdelean MPeteanu R Ciceo-Lucăcel ldquoStudii de rezonanţă paramagnetică electronică şi magnetice ale unor ioni 3d icircn sticle pe bază de B2O3rdquo Ed Presa Univ Clujeană Cluj Napoca 2005 p 171 [34] JLRao AMuraly EDRao J Non-Cryst Solids 202 215 (1996) [35] RPSChakradhar AMurali JLRao Optical Mat 10 109 (1998) [36] IArdelean MPeteanu SFilip VSimon GGyorffy Solid State Commun 102(4) 341 (1997) [37] IArdelean MPeteanu VSimon SFilip FCiorcaş ITodor J Magn Magn Mat 196-197 257 (1999) [38] IArdelean GSalvan MPeteanu VSimon CHimcinschi FCiorcas Mod Phys Lett B 13(22-23) 801 (1999) [39] IArdelean HHQiu HSakata Mat Lett 32 335 (1997) [40] SPChaudhuri SKPatra J Mat Sci 35 4735 (2000) [41] I Ardelean M Peteanu V Simon G Salvan J Mat Sci Technol 18 (3) 1 (2002)

13
This behavior of the studied glasses with the addition and increasing of MnO content
suggests that the structure observed in the glass matrix is conserving up to 5 mol MnO
where the structure takes another form From a structure dominated by AsO3 TeO4 tbp and
TeO3 tp units the structure became dominated by TeO4 tbp and MnO2 units and in a small
measure of AsO3 and TeO3 tp units For higher concentrations it can not be specified exactly
which of the last two structural units have the biggest proportion in these glasses From FT-IR
absorption spectra of the investigated glass system it can be observed that the addition and
increasing of manganese ions concluded the contraction of As-O-As bonds from totally
symmetric stretching vibrations of AsO3 units for x ge10 mol there can be an increase in
number of As-O-As bonds from AsO3 units orand a length these linkage to doubly degenerate
stretching vibrations of AsO3 units and a stretching vibration mode of TeO3 tp with NBO It
can be remarked from the FT-IR absorption spectra the gradual transformation of symmetric
stretching vibration mode of Te-O bonds from TeO3 units in TeO4 (tbp) units and the presence
of MnO2 units Once with the addition of iron ions the xFe2O3middot(100- x)[As2O3middotTeO2]
glasses behave like xMnOmiddot(100-x)[As2O3middotTeO2] glasses but in this system the
appearance of FeO6 units can be seen
414 Comparative study by FT-IR spectroscopy of
xMnOmiddot(100- x)[As2O3middotBO] vitreous systems were BO =gt TeO2 or PbO
The infrared absorption spectra obtained for xMnOmiddot(100- x)[As2O3middotBO] vitreous
systems where BO =gt TeO2 or PbO with 0 le x le 50 mol MnO are presented in figure
42 and 44 Following the infrared absorption spectra it can be observed that for
xMnOmiddot(100- x)[As2O3middot PbO] glass system the most disordered structure to exist for 0
le x le 5 mol MnO and to xMnOmiddot(100-x)[As2O3middot TeO2] glass system for 1 le x le 5 mol
MnO For x ge 5 mol MnO manganese ions break up a part of As ndash O ndash As Pb ndash O ndash Pb
and probably of As ndash O ndash Pb bonds to favor the increase in number of PbO4 units and
appearance of MnO2 units For x ge 10 mol MnO observed comparatively in both system
glasses the addition of manganese ions suggests for the first system a modification in linkage
characteristic units and for the second system an improvement for structural units of As2O3middot
TeO2 vitreous matrice also linkage characteristic units
415 Comparative study by FT-IR spectroscopy of
xFe2O3middot(100-x)[As2O3middotBO] vitreous systems where BO =gt TeO2 or PbO
The infrared absorption spectra obtained for xFe2O3middot(100- x)[As2O3middotBO] vitreous
systems where BO =gt TeO2 or PbO with 0 le x le 50 mol Fe2O3 are presented in figure
43 and 45
14
The evolution of the spectra with the addition and the increasing of the Fe2O3 content
suggest that the iron ions break up a part of As ndash O ndash As Pb ndash O ndash Pb and probably of As ndash O
ndash Pb bonds It can be observed a shift in the bands assigned As ndash O ndash As vibrations from AsO3
units due to changing to length As ndash O ndash As bonds and interne angles of AsO3 units the PbO4
units disappear and FeO6 units appear For x ge 5 mol Fe2O3 observed comparatively in
both system glasses the addition of iron ions suggests for the first system a modification in
linkage characteristic units of As2O3middotPbO and for the second system an improvement for
structural units of As2O3middot TeO2 vitreous matrice also linkage characteristic units appearance
of FeO6 units in both system
416 Comparative study by Raman spectroscopy of
As2O3middotTeO2 and As2O3middotPbO vitreous matrices
In order to obtain new information regarding the role of the modifier in the
formation of vitreous matrices there were made comparative studies by Raman
spectroscopy The Raman spectroscopy are presented in figure 46(ab) The wave
length and the structural assignments of Raman spectra of As2O3middotPbO şi As2O3middotTeO2 vitreous
matrices are presented in table 42
Table 42Wavenumber and the structural assignements of Raman spectra
of As2O3middotPbO and As2O3middotTeO2 vitreous matrices
~ [cm 1 ]
As2O3middotPbO As2O3middotTeO2
Attribution
~826 cm-1
~ 816 cm-1
Stretching vibrations of As-O-As
~ 752 cm-1
Vibrations of the continuous TeO4 (tbp) network
~ 627 cm-1
Vibrations As ndash O ndash As bonds from As2O units
~ 580 cm-1
Stretching vibrations of As-O-As
~ 525 cm-1
Vibrations O-As-O bonds from AsO3 units
~ 438cm-1
Symmetric bending vibrations of Te ndash O ndash Te vertex linkages between different TeO4 (tbp) TeO3+1 polyhedra Stretching vibrations of As-O-As of AsO3 units
~ 345 cm-1
Bending vibrations of As ndash O ndash As from As2O units
15
200 400 600 800 1000
As2O3PbO
Ram
an In
tens
ity [a
u]
LWavenumber [cm-1]
345
826
525
627a)
a
200 400 600 800 1000
816
752
580 R
aman
Inte
nsity
[au
]
Wavenumber [cm-1]
As2O3TeO2
438
b)
b
Fig46 Raman spectra of vitreous matrices a As2O3middotPbO şi b As2O3middotTeO2
The Raman spectrum of As2O3middotPbO glass matrix presents four bands at 826 cm-1
627 cm-1 525 cm-1 and 345 cm-1 The band from 826 cm-1 can be assigned to As ndash O ndash
As stretching vibrations [20] The band centered at 627 cm-1 can be assigned to vibrations As
ndash O ndash As bonds from As2O units the band from 525 cm-1 are assigned vibrations O-As-O
bonds from AsO3 units [21] The band of 345 cm-1 are attributed to As ndash O ndash As bending
vibrations from As2O units[2021]
The Raman spectrum of As2O3middot TeO2 glass matrix presents four bands at 816 cm-1
752 cm-1 580 cm-1 and 438 cm-1 The band from 816 cm-1 can be assigned to As ndash O ndash
As stretching vibrations [20] The band centered at 752 cm-1 can be assigned to vibrations of
the continuous TeO4 (tbp) network [22] The band of 580 cm-1 are attributed to As ndash O ndash As
stretching vibrations [12] The band centered at 438 cm-1 can be assigned symmetric bending
vibrations of Te ndash O ndash Te vertex linkages between different TeO4 (tbp) TeO3+1 polyhedra and
As ndash O ndash As stretching vibrations of AsO3 units
16
417 Study by Raman spectroscopy of xMOmiddot(100- x)[As2O3middotPbO]
vitreous systems where MO =gt MnO or Fe2O3
The Raman spectra obtained for xMOmiddot(100- x)[As2O3middotPbO] vitreous systems where
MO =gt MnO or Fe2O3 with 0 le x le 50 mol are presented in figure 47-8 and their
structural assignments are summarized in table 42
200 400 600 800 1000
368
833
345
1
3
Lungimea de unda [cm-1]
Inte
nsita
te R
aman
[ua
]
20
05
0
5
10
35
50
MnO
826
525
627
Fig 47 Raman spectra of xMnOmiddot(100- x)[As2O3middotPbO] glasses
The addition of MnO in the glass matrix determined an order degree of the vitreous
matrix The intensity of the bands attributed vibrations As ndash O ndash As bonds from As2O units
and bending vibrations of As ndash O ndash As from As2O units shift to a higher wave length that
suggests an increase in the As2O units comparative to AsO3 units
To the band from 826 cm-1 the addition of manganese ions in the glass matrix
determine for x = 05 mol an decreasing in intensity whereupon increasing for higher
concentrations The intensity of bands centered at 627 cm-1 and 525 cm-1 for x = 05
mol MnO decrease and disappear for x = 1 mol MnO The band of 345 cm-1 slowly
increases with the addition of manganese ions
To the band from 826 cm-1 the addition of iron ions in the glass matrix determines
for x = 05 mol an increase in intensity a gradual decrease and disappearance for x = 35
mol Fe2O3 of the bands observed for the glass matrix For higher concentrations of
manganese these bands gradually decrease The intensity of bands centered at 627 cm-1 and
525 cm-1 for x = 05 mol Fe2O3 increase and shift to 612 cm-1 and 501 cm-1 whereas
17
they gradually decrease and disappear for x = 10 mol Fe2O3 The band of 345 cm-1
decreases with the addition of iron ions and disappears for x = 20 mol Fe2O3
200 400 600 800 1000
3
612
501
Wavenumber [cm-1]
Ram
an In
tens
ity [a
u]
05
20
0
5
10
3550
1
Fe2O3
345
826
525
627
Fig 48 Raman spectra of xFe2O3middot(100- x)[As2O3middotPbO] glasses
With the increase of iron ions content in the As2O3middotPbO glass matrix the number of
these structural units decreases due to the increasing of the disorder in the studied glasses
418 Study by Raman spectroscopy of xMOmiddot(100-x)[As2O3middotTeO2]
vitreous systems were MO =gt MnO or Fe2O3
The Raman spectra obtained for xMOmiddot(100- x)[As2O3middot TeO2] vitreous systems
where MO =gt MnO or Fe2O3 with 0 le x le 50 mol are presented in figure 49-10 and their
structural assignments are summarized in table 42
The Raman spectrum of the glass matrix suggests a structure formed from TeO4 (tbp)
and TeO3 (tp) units where the presence of As ndash O ndash As bonds can not be excluded The
addition of manganese ions is leading to a modification of the structure proposed by the
spectrum of the glass matrix Then with the increasing of manganese content the intensity of
these bands is increasing showing that the manganese content favorises the formation of TeO4
(tbp) and TeO3 (tp) units
18
200 400 600 800 1000
783
850
768
416
816
752
Wavenumber [cm -1]
Ram
an In
tens
ity [a
u]
13
20
05
0
5
10
35
50
MnO
438
580
660
Fig 49 Raman spectra of xMnOmiddot(100- x)[As2O3middot TeO2] glasses
200 400 600 800 1000
226
294
408
673 751
5
W avenumber [cm -1]
Ram
an In
tens
ity [a
u]
05
20
0
3
10
35
50
1
Fe2O
3
816
752
438
580
Fig 410 Raman spectra of xFe2O3middot(100- x)[As2O3 TeO2] glasses
The Raman spectra of xFe2O3middot(100- x)[As2O3 TeO2] glasses present a significant
advance to the TeO4 (tbp) TeO3+1 polyhedra and AsO3 units represented in Raman spectrum
by the ~ 438 cm-1 band comparative with the modifications determined by the addition of
manganese ions in vitreous matrix For high concentrations of iron ions in xFe2O3middot(100-
x)[As2O3 TeO2] system of glasses the number of As-O-As linkages appear in Raman
spectrum due to stretching vibrations of As-O-As and vibrations of the continuous TeO4 (tbp)
network show a significant decrease
19
419 Comparative study by Raman spectroscopy of xMnOmiddot(100- x)[As2O3middotBO]
vitreous systems were BO =gt TeO2 or PbO
The addition of MnO to xMnOmiddot(100- x)[As2O3middotPbO] glass system do not break As
ndash O ndash As bonds into characteristic units and contribute to their prominence The addition of
manganese ions to xMnOmiddot(100- x)[As2O3middot TeO2] glass system for x=50mol MnO
determined the splitting up of a part of As ndash O ndash As Te-O-Te and the appearance of the
TeO4 (tbp) units against the loss of continuous TeO4 (tbp) network was observed
4110 Comparative study by Raman spectroscopy of xFe2O3middot(100- x)[As2O3middotBO]
vitreous systems where BO =gt TeO2 or PbO
With the increasing of iron ions content in the As2O3middotPbO glass matrix the number of
these structural units decreased due to the increase of the disorder in the studied glasses (x gt 20
mol ) and x = 50 mol Fe2O3 for xFe2O3middot(100- x)[As2O3middotTeO2] when iron ions
brought the structural units existing in glass matrices and favoured the appearace of
new bands due to bending vibrations of As ndash O ndash As
42 Comparative study by FT-IR and Raman spectroscopies of
xMOmiddot(100-x)[3B2O3middotLi2O] glasses where MO =gt MnO or Fe2O3
421 Study by FT-IR spectroscopy of xMOmiddot(100-x)[3B2O3middotLi2O] glasses
where MO =gt MnO or Fe2O3
The infrared absorption spectra obtained for xMOmiddot(1-x)[3B2O3middotLi2O] glass system
where MO =gt MnO or Fe2O3 with 0 le x le 50 mol are presented in figure 411-13 and their
structural assignments are summarized in table 43
500 1000 1500
3B2O3Li2O
Wavenumber [cm-1]
Abs
orpt
ion
[au
]
490
1400
1230
1061
698
614
460 78
6
Fig 411 FT ndash IR spectra of vitreous matrix 3B2O3middotLi2O
20
Following the infrared absorption spectra obtained for 3B2O3middotLi2O vitreous matrix
observed on eight bands ~ 1400 cm-1 ~ 1230 cm-1 ~ 1061 cm-1 ~ 786 cm-1 ~ 698 cm-
1 ~ 614 cm-1 ~ 490 cm-1 şi ~ 460 cm-1 The band at ~ 1400 cm-1 is assigned to
asymmetric stretching vibrations from BOslash3 şi BOslash2O- groups (Oslash represent oxygen atom
bridging two boron atoms) The band at ~ 1230 cm-1 is attributed to asymmetric stretching
vibrations of B ndash O bonds from triangular ortoborate BO 33 groups [23-26]
400 600 800 1000 1200 1400 1600
0
3
5
10
20
35
50
1
Wavenumber [cm-1]
Abs
orpt
ion
[ua
]
05
MnO
490
1400
1230
1061
698
614
460 78
6
Fig 412 FT ndash IR spectra of xMnOmiddot(100-x)[3B2O3middotLi2O] glasses
400 600 800 1000 1200 1400 1600
469
Wavenumber [cm-1]
Abs
orpt
ion
[ua
]
0
3
5
10
20
35
50
1
05
Fe2O3
490
1400
1230
1061
698
614
460 78
6
Fig 413 FT ndash IR spectra of x Fe2O3middot(100-x)[3B2O3middotLi2O] glasses
21
Table 43Wavenumber and the structural assignments of FT ndash IR and Raman
spectra of 3B2O3middotLi2O vitreous matrix
~ [cm 1 ] Attribution
FT ndash IR Raman FT ndash IR Raman
~ 1400 cm-1
~ 1400 cm-1
Asymmetric stretching
vibrations from BOslash3 şi BOslash2O-
groups
BOslash2O- triangles linked to
other borate triangular units
~ 1230 cm-1
Asymmetric stretching
vibrations of B ndash O bonds from
triangular ortoborate
BO 33 groups
~ 1061 cm-1
~ 1074 cm-1
Stretching vibrations of B ndash Oslash
bonds in -4BOslash tetrahedra from
tri- tetra- and penta-borate
groups
Diborate groups
~ 902 cm-1
Vibrations of orthoborate
groups
~ 786 cm-1
~ 791 cm-1
Bending vibrations of O3B ndash O
ndash BO4 bonds
Vibrations of rings with six
member to one or two BO4
tetrahedral from tri- tetra ndash
and penta ndash borate units
~ 698 cm-1
Bending vibrations of B-O-B
bonds from pentaborate groups
~ 614cm-1 Bending vibrations of O ndash B ndash O
bonds
~ 490cm-1 ~ 471cm-1 Bending vibrations of B-O-B
bonds
Isolated diborate groups
~ 460cm-1 Bending vibrations of O ndash B ndash O
bonds
22
The band at ~ 1061 cm-1 is assigned to stretching vibrations of B ndash Oslash bonds in -4BOslash
tetrahedra from tri- tetra- and penta-borate groups and the band at ~ 786 cm-1 is assigned
to bending vibrations of O3B ndash O ndash BO4 bonds The band at ~ 698 cm-1 is attributed to
Bending vibrations of B-O-B bonds from pentaborate groups The bands at ~ 614 cm-1 and
~ 460 cm-1 are assigned to bending vibrations of O ndash B ndash O bonds and the band at ~ 490 cm-
1 is assigned to bending vibrations of B-O-B bonds
From FT-IR spectra it can be concluded that the addition of manganese or iron ions in
vitreous matrices leads to the increase of the disorder degree
Also the structural changes that appeared in 3B2O3middotLi2O vitreous matrix with an
addition MnO or Fe2O3 content can be studied Ar=A4A3 ratio(A4 - relative number of -4BOslash tetrahedral borate units A3 - relative number of triangular (BOslash3 and BOslash2O-) units
0 10 20 30 40 50
010
015
020
Ar
x [mol]
MnO Fe2O3
Fig 414 The evolution of Ar ratio with the MnO or Fe2O3 content of
xMnOmiddot(100-x)[3B2O3middotLi2O] şi xFe2O3middot(100-x)[3B2O3middotLi2O] The evolution of the value of this ratio also allows a visualization of the effects
determined by the presence of the manganese or iron ions in the matrix The value Arltlt 1
indicated that BO3 is dominant related to BO4
422 Study by Raman spectroscopy of xMOmiddot(100-x)[3B2O3middotLi2O] glasses
where MO =gt MnO or Fe2O3
The Raman spectra obtained for xMOmiddot(1-x)[3B2O3middotLi2O] glass system were MO =gt
MnO or Fe2O3 with 0 le x le 50 mol are presented in figure 414-16 and their structural
assignments are summarized in table 43
Studying the Raman spectra of xMOmiddot(1-x)[3B2O3middotLi2O] glass system where MO =gt
MnO or Fe2O3 it has been observed that the absorption bands presented in vitreous matrix
gradually decreased with an increase in the manganese or iron content in both glasses system
which suggested an increase of the disorder in these vitreous systems
23
1000 2000 3000
B2O3Li2O
Wavenumber [cm-1]
Ram
an In
tens
ity [a
u]
1430
107490
279
1471
Fig 415 Raman spectra of vitreous matrix 3B2O3middotLi2O
500 1000 1500 2000 2500 3000
1430
107490
2791
0
Wavenumber [cm-1]
Ram
an In
tens
ity [a
u]
1
3
20
05
5
10
35
50
MnO
471
Fig 416 Raman spectra of xMnOmiddot(100-x)[3B2O3middotLi2O] glasses
400 600 800 1000 1200 1400 1600
Wavenumber [cm-1]
Ram
an In
tens
ity [a
u]
0
1
3
20
05
5
10
35
50
Fe2O3
1430
1074
90279
1
471
Fig 417 Raman spectra of x Fe2O3middot(100-x)[3B2O3middotLi2O] glasses
24
43 Comparative study by electron paramagnetic resonance (EPR) and magnetic
susceptibility measurements of xMOmiddot(100-x)[As2O3middotTeO2] xMOmiddot(100-x)
[As2O3middotPbO] and xMOmiddot(100-x)[3B2O3middotLi2O] glasses where MO =gt MnO or Fe2O3
431 Comparative study by electron paramagnetic resonance (EPR) of
xMnOmiddot(100-x)[As2O3middotBO] where BO =gt TeO2 or PbO
and xMnOmiddot(100-x) [3B2O3middotLi2O] glasses
In order to obtain more information regarding the behavior of manganese ions in
different vitreous matrices [3031] xMnOmiddot(100-x)[As2O3middotBO] where BO =gt TeO2 or PbO
and xMnOmiddot(100-x) [3B2O3middotLi2O] glasses were investigated by EPR spectroscopy on a large
compositional range with 0 le x le 50 mol The EPR spectra of Mn2+ for xMnOmiddot(100-
x)[As2O3middotPbO] (S1) xMnOmiddot(100-x)[As2O3middotTeO2] (S3) and xMnOmiddot(100-x)[3B2O3middotLi2O]
(S5) are presented in figure 418-20 These spectra present two absorption lines centered at gef
43 and gef 20 in all systems
The absorption line centered at gef 43 and is due to isolated Mn2+ ions [32] The
absorption line centered at gef 20 may be attributed to Mn2+ species interacting by magnetic
coupling[33] dipolar and or super exchange the last ones forming magnetic clusters [32]
The evolution of the spectra is easier to follow considering the dependence of
concentration on the EPR parameters the line - intensity (obtained as an integral of the area
under the corresponding EPR signal) J and the line - width ΔB The evolution of J and AB
reflects the structural transformations which appear in the glass matrices due to the increase of
manganese ions content
The intensity and the line - width of the resonance line from gef 43 for all
investigated systems is represented in figure 421(ab)
The intensity of the resonance line from gef 43 for all investigated glass systems
decreases due to the decrease of the isolated manganese ions numbers The line - width from
gef 43 for (S1) and (S3) systems decreases due to decrease of Mn2+ number and to the
structural disorder in glasses with the increase of MnO content For (S5) glass system the line
- width of the resonance line there is an increase in all compositional domains
The intensity of the resonance line from gef 20 can be observed as increasing up to
x=14 mol for (S1) system up to x=8mol for (S3) system and 20 mol for (S5)
system The line - width of the resonance line from gef 20 for (S1) and (S3) systems
increases up to 3 mol and 5mol for (S5) due to Mn2+ species interacting by magnetic
coupling dipole- dipole as the main broadening mechanism Over this concentration line ndash the
width of the resonance line from gef 20 is straight and it can be assumed that the
manganese ions begin to manifest super exchange magnetic interactions
25
1000 2000 3000 4000 5000
Firs
t der
ivat
ive
of a
bsor
ptio
n [u
a]
05
1
3
5
10
20
35
50
x [mol Mn2O3]amplif
B [G]
10
200
40
80
400
5
1
1
Fig 418 The EPR spectra of Mn2+ for xMnOmiddot(100-x)[As2O3middotPbO] (S1)
glass system
1000 2000 3000 4000 5000
Firs
t der
ivat
ive
of a
bsor
ptio
n [u
a]
x [mol MnO]
051
3
5
10
20
35
50
9
500
400
50
100
4
1
amplif
B [G]
1
Fig 419 The EPR spectra of Mn2+ for xMnOmiddot(100-x)[As2O3middotTeO2] (S3)
glass system
26
1000 2000 3000 4000 5000
501
B [G]
Firs
t der
ivat
ive
of a
bsor
ptio
n [u
a]
1
4
9
10
30
60
100
amplif
05
1
3
5
10
20
35
x [mol MnO]
Fe3+
Fig 420 The EPR spectra of Mn2+ for xMnOmiddot(100-x)[3B2O3middotLi2O] (S5)
glass system
0 2 4 6 8 10 12 14 16 18 20 22
x [mol]
J [ u
a]
S1 S3 S5
-2 0 2 4 6 8 10 12 14 16 18 20 22
50
100
150
200
250
300
S1 S3 S5
x [mol]
B
[G]
a b
Fig 421 The dependence on MnO content of the intensity (a) and width(b) of resonance
line at gef 43 for xMnOmiddot(100-x)[As2O3middotPbO] (S1) xMnOmiddot(100-x)[As2O3middotTeO2] (S3) şi
xMnOmiddot(100-x)[3B2O3middotLi2O] (S5) system glasses
27
0 10 20 30 40 50
x [mol]
J [ u
a]
S1 S3 S5
0 10 20 30 40 50
400
500
600
700
800
900
S1 S3 S5
x [mol]
B[G
]
a b
Fig 422 The dependence on MnO content of the intensity (a) and width b) of resonance
line at gef 20 for xMnOmiddot(100-x)[As2O3middotPbO] (S1) xMnOmiddot(100-x)[As2O3middotTeO2] (S3) and
xMnOmiddot(100-x)[3B2O3middotLi2O] (S5) system glasses
Following figure 418-20 it can be observed that (S1) and (S3) have had a similar
evolution but (S5) system presented for 05 le x le 5 mol (fig420) has a hyperfine
sextet[33] at gef 20due to Mn2+ isolated ions
432 Comparative study by magnetic susceptibility measurements of
xMnOmiddot(100-x)[As2O3middotBO] where BO =gt TeO2 or PbO and
xMnOmiddot(100-x)[3B2O3middotLi2O] glasses
The magnetic susceptibility data are in good agreement with the EPR result The
magnetic behavior of the glasses from xMnOmiddot(100-x)[As2O3middotBO] where BO =gt TeO2 (S3)
or PbO (S1) and xMnOmiddot(100-x)[3B2O3middotLi2O] (S5) glasses for 3 le x le 50 mol MnO are
presented in figure 423 - 25
For (S1) and (S3) system glasses up to x 3 mol and x 5 mol (S5) glass
system the temperature dependence of the reciprocal magnetic susceptibility obeys a Curie
law In this concentration range the manganese ions are predominantly isolated orand
participate in dipole-dipole interractions At higher concentrations the reciprocal magnetic
susceptibility obeys a Curie-Weiss law with negative paramagnetic Curie temperature (p)
characteristic to antiferromagnetic coupled ions by means of super exchange interractions(fig
426) This behavior of manganese ions is confirmed by the shape of the EPR spectra
28
100 150 200 250
2
4
6
8
10
12
14
16
18
20
22
T [K]
[
emu
mol
]-1
3 mol 5 mol 10 mol 20 mol 35 mol 50 mol
Fig423 The temperature dependence of -1 for xMnOmiddot(100-x)[As2O3middotPbO]
(S1) 3 le x le 50 mol
50 100 150 200 2500
2
4
6
8
10
12
14
16
18
20
22
3 mol 5 mol 10 mol 20 mol 35 mol 50 mol
T [K]
[
emu
mol
]-1
Fig424 The temperature dependence of -1 for xMnOmiddot(100-x)[ As2O3middotTeO2]
(S1) 3 le x le 50 mol
100 150 200 250
2
4
6
8
10
12
14
16
18
20
22
[em
u m
ol]-1
T [K]
3 mol 5 mol 10 mol 20 mol 35 mol 50 mol
Fig425 The temperature dependence of -1 for xMnOmiddot(100-x)[3B2O3middotLi2O]
(S5) 3 le x le 50 mol
29
0 10 20 30 40 50
0
20
40
60
80
100
x [mol]
-p [K
]
(S1) (S3) (S5)
Fig426Concentration dependence of (p) for sistemele xMnOmiddot(100-x)[As2O3middotPbO]
(S1) xMnOmiddot(100-x)[As2O3middotTeO2] (S3) şi xMnOmiddot(100-x)[3B2O3middotLi2O] (S5)
Using the representation 1 =f(T) the molar Curie constants CM the effective
magnetic moments and molar fraction of Mn2+(x1) şi Mn3+(x2) ions were calculated and
represented in tables 44 -6
Tabel 44 Molar Curie constants effective magnetic moments and molar fraction of Mn2+(x1) şi Mn3+(x2) ions in xMnOmiddot(100-x)[As2O3middotPbO] (S1) glasses
x
[mol MnO2] CMtimes102
[emu mol] ef
[microB] x1
[mol Mn2+O2] x2
[mol Mn3+O2] 3 1272 582 268 032 5 1979 562 343 157 10 3777 549 555 445 20 6688 517 492 1508 35 12239 502 377 3123 50 15427 496 268 4732
Tabel 45 Molar Curie constants effective magnetic moments and molar fraction of Mn2+(x1) şi Mn3+(x2) ions in xMnOmiddot(100-x)[As2O3middotTeO2] (S3)glasses
x
[mol MnO2] CMtimes102
[emu mol] ef
[microB] x1
[mol Mn2+O2] x2
[mol Mn3+O2] 3 1297 588 287 013 5 1938 556 312 188 10 3804 551 575 425 20 6766 52 549 1451 35 11148 504 441 3059 50 15528 498 358 4642
30
Tabel 46 Molar Curie constants effective magnetic moments and molar fraction of Mn2+(x1) şi Mn3+(x2) ions in xMnOmiddot(100-x)[3B2O3middotLi2O] (S5) glasses
x
[mol MnO2] CMtimes102
[emu mol] ef
[microB] x1
[mol Mn2+O2] x2
[mol Mn3+O2] 3 127 581 265 035 5 1919 554 303 197 10 3681 542 486 514 20 7215 519 53 147 35 1121 506 505 2995 50 15898 501 493 4507
433 Comparative study by electron paramagnetic resonance (EPR) of
xFe2O3middot(100-x)[As2O3middotBO] where BO =gt TeO2 or PbO and
x Fe2O3middot(100-x) [3B2O3middotLi2O] glasses
In order to obtain more information regarding the behavior of iron ions in
xFe2O3middot(100-x)[As2O3middotBO] where BO =gt TeO2 (S4) or PbO (S2) şi xFe2O3middot(100-
x)[3B2O3middotLi2O] glasses were investigated by EPR spectroscopy on a large compositional
range with 05 le x le 35 mol Fe2O3 The EPR spectra of Fe3+ in xFe2O3middot(100-
x)[As2O3middotPbO] (S2) xFe2O3middot(100-x)[As2O3middotTeO2] (S4) and xFe2O3middot(1-x)[3B2O3middotLi2O]
(S6) are presented in figure 427-29 These spectra present two absorption lines centered at
gef 43 and gef 20 up to x le 35mol Fe2O3 systems studied
The absorption line centered at gef 43 is due to isolated Fe3+ ions [34-36] The
absorption line centered at gef 20 may be attributed to Fe3+ species interacting by magnetic
coupling dipolar and or super exchange the last ones forming magnetic clusters [37-41]
The evolution of the spectra is easier to follow considering the dependence of
concentration on the EPR parameters the line - intensity (obtained as an integral of the area
under the corresponding EPR signal) J and the line - width ΔB The evolution of J and AB
reflects the structural transformations which appear in the glass matrices due to the increasing
of iron ions content
The intensity and the line - width of the resonance line from gef 43 for all
investigated systems is represented in figure 430 (a b) The intensity of the resonance line
from gef 43 increases for (S2) and (S4) up to 3 mol and up to 5 mol for (S6) then
decreases for all systems investigated A line broadening up to 3 mol from gef 43 for
these systems can be observed due to increasing of Fe3+ isolated number of ions
31
1000 2000 3000 4000 5000
40
Firs
t der
ivat
ive
of a
bsor
ptio
n [u
a]
B [G]
x [mol Fe2O3]
05
1
3
5
1020
35 2
40
20
10
10
10
amplif
Fig427 The EPR spectra of Fe3+ for xFe2O3middot(100-x)[As2O3middotPbO] (S2)
glass system
1000 2000 3000 4000 5000
100
B [G]
Firs
t der
ivat
ive
of a
bsor
ptio
n [u
a]
10080
20
50
20
20
3
05
1
5
102035
x [mol Fe2O3] amplif
Fig428 The EPR spectra of Fe3+ for xFe2O3middot(100-x)[As2O3middotTeO2] (S4)
glass system
32
1000 2000 3000 4000 5000
Firs
t der
ivat
ive
of a
bsor
ptio
n [u
a]
B [G]
3
05
1
5
10
20
35
x [mol Fe2O3]
30
50
20
20
10
30
30
amplif
Fig429 The EPR spectra of Fe3+ for xFe2O3middot(100-x)[3B2O3middotLi2O] (S6)
glass system
The intensity and the line - width of the resonance line from gef 43 for all
investigated systems is represented in figure 430 (a b)The resonance line from gef 20 is
attributed to Fe3+ ions that interact by magnetic coupling dipolar orand super exchange
interractions can be observed in all compositional domains
The intensity of the resonance line from gef 20 can be observed as increasing up to
x=35 mol for (S2) and (S6) system and 10 mol for (S4) system with increased iron
ions content The line - width of the resonance line from gef 20 increased up to 10mol
for (S2) system and up to 3 mol for (S4) and 5mol for (S6) due to Fe3+species
interacting by magnetic coupling dipole-dipole Above this concentration line - width of the
resonance line from gef 20 can be attributed to dipolar and super exchange magnetic
interactions The ΔB = f(x) dependence reflects the competion between the broadening
mechanism (dipole ndash dipole interactions the interactions between ions in diferent
valence state and structural disorder) and the narrowing ones (super exchange
interactions)
33
0 5 10 15 20 25 30 35 40
x [mol]
J [ u
a]
S2 S4 S6
a)
0 5 10 15 20 25 30 35 4040
60
80
100
120
140
160
180
200
220 S2 S4 S6
B[G
]
x [mol]
a b
Fig 430 The dependence on Fe2O3 content of the intensity (a) and width (b) of
resonance line at gef 43 for xFe2O3middot(100-x)[As2O3middotPbO] (S2)
xFe2O3middot(100-x)[As2O3middotTeO2] (S4) and xFe2O3middot(100-x)[3B2O3middotLi2O] (S6) glasses
0 5 10 15 20 25 30 35 40
x [mol]
J [ u
a]
S2 S4 S6
a)
0 5 10 15 20 25 30 35 40
200
400
600
800
1000
1200
1400
1600
x [mol]
B
[G] S2
S4 S6
a b
Fig 431 The dependence on Fe2O3 content of the intensity (a) and width (b) of
resonance line at gef 20 for xFe2O3middot(100-x)[As2O3middotPbO] (S2)
xFe2O3middot(100-x)[As2O3middotTeO2] (S4) and xFe2O3middot(100-x)[3B2O3middotLi2O] (S6) glasses
34
434 Comparative study by magnetic susceptibility measurements of
xFe2O3middot(100-x)[As2O3middotBO] where BO =gt TeO2 or PbO and
xFe2O3middot(100-x) [3B2O3middotLi2O] glasses
The magnetic susceptibility data are in good agreement with the EPR result The magnetic
behavior of the glasses xFe2O3middot(100-x)[As2O3middotPbO] (S2) xFe2O3middot(100-x)[As2O3middotTeO2]
(S4) and xFe2O3middot(100-x)[3B2O3middotLi2O] (S6) for 3 x 50 mol Fe2O3 are presented in
figure 432 - 34
For (S2) glass systems up to x 10 mol x 3 mol (S5) glass systems and x 5
mol (S6) glass systems the temperature dependence of the reciprocal magnetic susceptibility
obeys a Curie law In this concentration range the iron ions are predominantly isolated orand
participate in dipole-dipole interactions At higher concentrations the reciprocal magnetic
susceptibility obeys a Curie-Weiss law with negative paramagnetic Curie temperature (p)
characteristic to antiferromagnetic coupled ions by means of super exchange interactions(fig
435) This behavior of iron ions is confirmed by the shape of the EPR spectra
80 100 120 140 160 180 200 220 240 260 2800
1
2
3
4
5
6
7
8
9
10
11
[
emu
mol
]-1
T [K]
3 mol 5 mol 10 mol 20 mol 35 mol 50 mol
Fig432 The temperature dependence of -1 for xFe2O3middot(100-x)[As2O3middotPbO] (S2)
3 x 50 mol
35
80 100 120 140 160 180 200 220 240 260 2800
1
2
3
4
5
6
7
8
9
10
T [K]
[
emu
mol
]-1
3 mol 5 mol 10 mol 20 mol 35 mol 50 mol
Fig433 The temperature dependence of -1 for xFe2O3middot(100-x)[As2O3middotTeO2] (S4)
3 x 50 mol
80 100 120 140 160 180 200 220 240 260 2800
1
2
3
4
5
6
7
8
9
10
11
3 mol 5 mol 10 mol 20 mol 35 mol 50 mol
T [K]
[
emu
mol
]-1
Fig434 The temperature dependence of -1 for xFe2O3middot(100-x)[3B2O3middotLi2O] (S6)
3 x 50 mol
36
0 10 20 30 40 50
0
10
20
30
40
50
x [mol]-
p [K]
(S2) (S4) (S6)
Fig435Concentration dependence of (p) for sistemele xFe2O3middot(100-x)[As2O3middotPbO] (S2) xFe2O3middot(100-x)[As2O3middotTeO2] (S4) and xFe2O3middot(100-x)[3B2O3middotLi2O] (S6)
for 3 x 50 mol Fe2O3
Using the representation 1 = f(T) the molar Curie constants CM the effective
magnetic moments and molar fraction of Fe3+(x1) şi Fe2+(x2) ions were calculated and
represented in tables 47-9
Table 47 Molar Curie constants effective magnetic moments and molar fraction of
Fe3+(x1) şi Fe2+(x2) ions in xFe2O3middot(100-x)[As2O3middotPbO] glasses (S2)
x [mol Fe2O3]
CMtimes102
[emu mol] ef
[microB] x1
[mol Fe23+O3]
x2 [mol Fe2
2+O3] 3 2526 58 261 039 5 393 56 332 168 10 7326 541 476 524 20 13459 519 53 147 35 23364 516 829 2671 50 32154 507 767 4233
Table 48 Molar Curie constants effective magnetic moments and molar fraction of
Fe3+(x1) şi Fe2+(x2) ions in xFe2O3middot(100-x)[As2O3middotTeO2] glasses (S4)
x [mol Fe2O3]
CMtimes102
[emu mol] ef
[microB] x1
[mol Fe23+O3]
x2 [mol Fe2
2+O3] 3 2571 585 277 023 5 4016 566 363 137 10 7911 562 686 314 20 14992 521 643 929 35 22676 509 601 2899 50 30959 497 313 4687
37
Table 49 Molar Curie constants effective magnetic moments and molar fraction of Fe3+(x1) şi Fe2+(x2) ions in xFe2O3middot(100-x)[3B2O3middotLi2O] glasses (S6)
The results allowed to consider that the magnetic properties of the studied glasses can
be explained through magnetic interractions between Fe3+ - Fe3+ Fe3+- Fe2+ and Fe2+- Fe2+ that
explain the dependences of RPE parameters concentration
SELECTED CONCLUSIONS
In this thesis xMOmiddot(100-x)[As2O3middotTeO2] xMOmiddot(100-x) [As2O3middotPbO] and
xMOmiddot(100-x)[3B2O3middotLi2O] glasses where MO =gt MnO or Fe2O3 were comparatively
studied in 0 le x le 50 mol The structural modifications of investigated glass matrices were
comparatively followed in function of the manganese or iron ions on the investigated glass
matrices were followed
The study by FT-IR spectroscopy shows that the evolution of the spectra of
xMnOmiddot(100-x) [As2O3middotPbO] with the addition and the increasing of the MnO content suggest
that the manganese ions break up a part of As ndash O ndash As Pb ndash O ndash Pb and probably of As ndash O ndash
Pb bonds The addition of MnO in the As2O3middotPbO glass matrix is leading to a disordering of
the glasses structure with the increasing of the MnO content
The evolution of the absorption bands for FT ndash IR spectrum of xFe2O3middot(1-x)
[As2O3middotPbO] glasses are determined by the addition of Fe2O3 content It can be observed to
shift the bands assigned As ndash O ndash As vibrations from AsO3 units due to changing to length As
ndash O ndash As bonds and interne angles of AsO3 units disappears PbO4 units and appears FeO6
units The addition of Fe2O3 in the As2O3middotPbO glass matrix determined a disordering of the
glasses structure with the increasing of the Fe2O3 content
From FT-IR absorption spectra of the investigated xMOmiddot(100-x)[As2O3middotTeO2] glasses
system where MO =gt MnO or Fe2O3 it can be observed that the addition and increasing of
manganese ions concluded the contraction of As-O-As bonds from totally symmetric
x [mol Fe2O3]
CMtimes102
[emu mol] ef
[microB] x1
[mol Fe23+O3]
x2 [mol Fe2
2+O3] 3 2542 582 268 032 5 3943 561 338 162 10 7423 544 506 494 20 13568 520 549 1451 35 23094 513 731 2769 50 31746 503 584 4416
38
stretching vibrations of AsO3 units for x ge10 mol there can be an increase in number of As-
O-As bonds from AsO3 units orand a length these linkage to doubly degenerate stretching
vibrations of AsO3 units and a stretching vibration mode of TeO3 tp with NBO It can be
remarked from the FT-IR absorption spectra the gradual transformation of symmetric
stretching vibration mode of Te-O bonds from TeO3 units in TeO4 (tbp) units and the presence
of MnO2 units Once with the addition of iron ions the xFe2O3middot(100- x)[As2O3middotTeO2]
glasses behave like xMnOmiddot(100-x)[As2O3middotTeO2] glasses but in this system the
appearance of FeO6 units can be seen
From FT-IR spectra in xMOmiddot(100-x)[3B2O3middotLi2O] glasses where MO =gt MnO or
Fe2O3 can be concluded that the addition of manganese or iron ions in vitreous matrices leads
to the increase of the disorder degree
The study by Raman spectroscopy shows that the evolution of the spectra the addition
of MnO in the [As2O3middotPbO]glass matrix determined an order degree of the vitreous matrix
The intensity of the bands attributed vibrations As ndash O ndash As bonds from As2O units and
bending vibrations of As ndash O ndash As from As2O units shift to a higher wave length that suggests
an increase in the As2O units comparative to AsO3 units With the increase of iron ions content
in the As2O3middotPbO glass matrix the number of these structural units decreases due to the
increasing of the disorder in the studied glasses
With the increasing of manganese content in As2O3TeO2 glass matrix the intensity
of these bands is increasing showing that the manganese content favorites the formation of
TeO4 (tbp) and TeO3 (tp) units For high concentrations of iron ions in xFe2O3middot(100-
x)[As2O3 TeO2] system of glasses the number of As-O-As linkages appear in Raman
spectrum due to stretching vibrations of As-O-As and vibrations of the continuous TeO4 (tbp)
network show a significant decrease
Studying the Raman spectra of xMOmiddot(1-x)[3B2O3middotLi2O] glass system where MO =gt
MnO or Fe2O3 it has been observed that the absorption bands presented in vitreous matrix
gradually decreased with an increase in the manganese or iron content in both glasses system
which suggested an increase of the disorder in these vitreous systems
The EPR spectra presents the behavior of manganese or iron ions in different vitreous
matrices xMOmiddot(100-x)[As2O3middotBO] where MO=gtMnO or Fe2O3 and BO =gt TeO2 or
PbO and xMOmiddot(100-x) [3B2O3middotLi2O] Glasses were investigated by EPR spectroscopy on a
large compositional range with 0 le x le 50 mol The absorption line centered at gef 43 and
is due to isolated Mn2+ ions The absorption line centered at gef 20 may be attributed to
Mn2+ species interacting by magnetic coupling dipolar and or super exchange the last ones
forming magnetic clusters The EPR spectra of Fe3+ in xFe2O3middot(100-x)[As2O3middotPbO]
xFe2O3middot(100-x)[As2O3middotTeO2] and xFe2O3middot(1-x)[3B2O3middotLi2O] are presented two absorption
lines centered at gef 43 and gef 20 up to x le 35mol Fe2O3 systems studied
39
The absorption line centered at gef 43 is due to isolated Fe3+ ions The absorption
line centered at gef 20 may be attributed to Fe3+ species interacting by magnetic coupling
dipolar and or super exchange the last ones forming magnetic clusters
The evolution of the spectra is easier to follow considering the dependence of
concentration on the EPR parameters the line - intensity (obtained as an integral of the area
under the corresponding EPR signal) J and the line - width ΔB The evolution of J and AB
reflects the structural transformations which appear in the glass matrices due to the increase of
manganese ions content
The magnetic susceptibility data are in good agreement with the EPR result The
magnetic behavior of the glasses from xMnOmiddot(100-x)[As2O3middotBO] where BO =gt TeO2 (S3)
or PbO (S1) and xMnOmiddot(100-x)[3B2O3middotLi2O] (S5) glasses for 3 le x le 50 mol MnO
For (S1) and (S3) system glasses up to x 3 mol and x 5 mol (S5) glass
system the temperature dependence of the reciprocal magnetic susceptibility obeys a Curie
law In this concentration range the manganese ions are predominantly isolated orand
participate in dipole-dipole interractions At higher concentrations the reciprocal magnetic
susceptibility obeys a Curie-Weiss law with negative paramagnetic Curie temperature (p)
characteristic to antiferromagnetic coupled ions by means of super exchange interractions This
behavior of manganese ions is confirmed by the shape of the EPR spectra Using the
representation 1 =f(T) the molar Curie constants CM the effective magnetic moments
and molar fraction of Mn2+(x1) şi Mn3+(x2) ions were calculated The magnetic susceptibility
data are in good agreement with the EPR result
The magnetic behavior of the glasses xFe2O3middot(100-x)[As2O3middotPbO] (S2)
xFe2O3middot(100-x)[As2O3middotTeO2] (S4) and xFe2O3middot(100-x)[3B2O3middotLi2O] (S6) for 3 x 50
mol Fe2O3 are presented For (S2) glass systems up to x 10 mol x 3 mol (S5)
glass systems and x 5 mol (S6) glass systems the temperature dependence of the
reciprocal magnetic susceptibility obeys a Curie law In this concentration range the iron ions
are predominantly isolated orand participate in dipole-dipole interactions At higher
concentrations the reciprocal magnetic susceptibility obeys a Curie-Weiss law with negative
paramagnetic Curie temperature (p) characteristic to antiferromagnetic coupled ions by
means of super exchange interactions(fig 435) This behavior of iron ions is confirmed by the
shape of the EPR spectra Using the representation 1 = f(T) the molar Curie constants
CM the effective magnetic moments and molar fraction of Fe3+(x1) şi Fe2+(x2) ions were
calculated
40
REFERENCES
Chapter 1
[1] I Ardelean bdquoIntroducere icircn studiul materialelor oxidice cu structură vitroasă EdNapocaStar Cluj Napoca 2002 [2] G Srinivasarao N Veeraiah J All Com 327 52-65(2001) [3] G Srinivasarao N Veeraiah J Phys Chem Solids 63705-717(2002) [4] DBecherescu VCristea FMarx IMenessz FWinter Chimia stării solide Ed Şt şi Encicl Bucucureştivol 1 1983 [5] J Wong CAAngell Glass-Structure by Spectroscopy Dekker Inc New York 1976 [6] BEWarren HKKrutter O Morningstat J Am Ceram Soc 19 202 (1936) [7] LLSperry JD Mackenzie Phys Chem Glasses 9 91 (1968) [8] WLKonijnendijk JMStevels J Non-Cryst Solids 18 307 (1975) [9] FCEversteyn JM Stevels HJ Naterman Phys Chem Glasses 1 134 (1963) [10] G Fuxi Optical and Spectroscopie Properties of Glass Springer-Verlag Shanghai Scientific Technical Pub Shanghai 1991 [11] YDYiannopoulos GDChryssikos EIKamitsos Phys Chem Glasses 42(3) 164 (2001) [12] MGFerreira da Silva BFOCosta J Non-Cryst Solids 293-295 534 (2001) [13] RYordanova YDimitriev VDimitriev S Kassabov DKlissurski JNon-Cryst Solids 201 141 (1996) [14] W L Konijnendijk J M Stevels J Non-Cryst Solids 18 307 (1980) [15] M Iron M Couzi ALevasseur JBrethous JSolidState Chem 31 285 (1980) [16] TFurukawa WBWhite PhzsChemGlasses 21 85 (1980) [17] E I Kamitsos M A Karakassides GD Chryssikos J Phys Chem 90 4528 (1986) [18] E I Kamitsos M A Karakassides GD Chryssikos J Phys Chem 91 1073 (1987) [19] TWBril Philips Res Rep Suppl 2 117 (1976) [20] E I Kamitsos M A Karakassides GD Chryssikos J Phys Chem 30 203 (1989) [21] BNMeera JRamakrishna J Non-Cryst Solids 159 1 (1993) [22] KWitke THubert PReich JRamanSpectr 24 407 (1993) [23] E I Kamitsos M A Karakassides Phys Chem Glasses 30 19 (1989) [24] MPeteanu Teză de doctoratrdquo Universitatea Babeş-Bolyairdquo Cluj Napoca (1989) [25] PCTaylor PJBray JPhys Chem Solids 33 43 (1972) [26] IArdelean MPeteanu GhIlonca DPop Solid State Commun 33 653 (1980) [27] AV De Wijn RE Van Balderen JKemPhys 46 4 (1967) [28] DL Griscom RE Griscom J Phys Chem Glasses 12 19 (1971) [29] JWH Schreurs JChem Phys 69 2151 (1978) [30] AlNicula M Peteanu IArdelean Studia Univ Babeş-Bolyai Physica 2 65 (1979) [31] M Peteanu IArdelean SFilip ITodor GSalvan Studia Univ Babeş-Bolyai Physica XL 2 9 (1995) [32] IArdelean M Peteanu SFilipV Simon ITodor Solid State Commun 105 (5) 339 (1998) [33] SKMendiratta EGuedes de Sousa JMatSci Lett7 733 (1988) [34] IArdelean M Peteanu SFilip V Simon GGyorffy Solid State Commun 102 (4) 341 (1997) [35] IArdelean M Peteanu SFilip V Simon FCiorcas ITodor JMagnMagn Mat 196-197 257 (1999) [36] JKliava RBerger YServant JEmery JMGreneche JTrokss J Non-Cryst Solids 202 205 (1996) [37] LDBogomolova NA Krasilnikova VLBogdanov VDKhaliev VV Mitrofanov J Non-Cryst Solids 188 130 (1995) [38] DLoveridge SPark PhysChem Glasses 12 19 (1971) [39] IArdelean G Salvan M Peteanu V Simon FCiorcas Mod PhysLett B 13 (22-23) 801 (1999)
41
[40] JLRao AMuraly EDRao J Non-Cryst Solids 202 215 (1996) [41] CPrakash S Husain RJ Singh SMollah JAlloys Compon 326 47 (2001) [42] EGuedes de Sousa SKMendiratta JMMachado Da Silva Portugal Phys 17 (3-4) 203 (1986) [43] TCastner GSNewell WCHolton CP Slichter JChem Phys 32 668 (1960) [44] SPChaudhuri SKPatra JMatSci 35 4735 (2000) [45] IArdelean HH Qiu HSakata Matt Lett 32 335 (1997) Chapter 2 [1] J Wong C A Angel Glass Structure by Spectroscopy Marcel Dekker inc New-York 1976 [2] I Ardelean bdquoIntroducere icircn studiul materialelor oxidice cu structură vitroasă EdNapocastar Cluj-Napoca 2002 [3] N Avram GH Mateescu Spectroscopia icircn infraroşu Aplicaţii icircn chimia organică Ed Tehnică Bucureşti 1968 [4] TIliescu Spectroscopie optică moleculară vibraţională şi electronică Ed Casa Cărţii de Ştiinţă Cluj- Napoca 2000 [5] S Aştilean bdquoMetode şi tehnici moderne de spectroscopie optică Ed Casa Cărţii de Ştiinţă Cluj - Napoca 2002 p 5 [6] I Ursu Rezonanţă Electronică de Spinrdquo Ed AcademieiBucureşti (1965) [7] CHHurd ContempPhys 23 (5) 469 (1982) [8] GWAnderson WDCompton JChemPhys52 6166 (1970) [9] MS Seehra GSrinivasan Landolt-Bornstein (New Series) SubVolume F3 Springer-Verlag Berlin 1994 [10] GToulouse ContempPhys 2115 (1977) [11] NMMurayMagnetic susceptybility EdInterscience New York P1773 1963 [12] JBGoodenough Magnetism and Chemical Bond EdInterscience New York 1963 [13] IArdelean G Salvan M Peteanu V Simon FCiorcas Mod PhysLett B 13 (22-23) 801 (1999) [14] IArdelean MPeteanu R Ciceo Lucăcel Studii de rezonanţă paramagnetică electronică şi magnetice ale unor ioni 3d icircn sticle pe bază de B2O3 Ed Presa Univesitară Clujeană 2005 [15] IArdelean PhysStatSol (b) 87K137 (1978) [16] IArdelean Solid State Commun 31 75 (1979) [17] EJFrieble LKWilson AWDozier DLKinser PhysStatSol (b) 45 323 (1971) [18] DWMoon JMAitken RKMcCrone GS Ciloszik PhysChe Glasses 16 (5) 91 (1975) [19] SFilip Teză de doctorat UnivBabeş-Bolyai Cluj Napoca 1996 [20] CJSchinkel GWRathenou Physics of Non-Crystaline Solids North Holland Publ Co Amsterdam 215 1965 [21] EJFrieble LKWilson NCKoon DLKinser JAm Ceram Soc 57-237 (1974) [22] RJLandry JT Fournier CGYoung JChemPhys 46 1285 (1967) [23] WSimpson PhysStatSolidi b40 207 (1970) [24] RHasegawa PhysRevB b(5) 1631 (1971) [25] IArdelean GhIlonca MPeteanu Solid State Commun 52 145 (1984) [26] IArdelean GhIlonca OCozar J Physique 49 C8 1107 (1988) Chapter 3 [1] LFBates Modern Magnetism p133 Cambridge University Press London 1962 [2] IArdelean GhIlonca DBarbos Solid State Commun 40 769 (1981) [3] EBurzo IUrsu DUngur IArdelean JMatSci 15 581 (1980) [4] EBurzo IUrsu DUngur IArdelean MatResBull 15 1273 (1980) [5] DLGriscom Glass Science and Technology 48 151 (1990) [6] PJBray AH Silver Modern aspects of the vitreous state vol1 Butterworth
42
London 1960 [7] IArdelean Teza de doctorat UnivBabeş-Bolyai Cluj Napoca 1979 [8] SAştilean bdquoMetode şi tehnici moderne de spectroscopie opticărdquo EdCasa Cărţii de Ştiinţă Cluj ndash Napoca 2002 p5 [9] IArdelean RCiceo-Lucăcel ldquoFizica şi Tehnologia Materialelor Oxidice Lucrări Practicerdquo Ed Univ ldquoBabeş-Bolyairdquo Cluj-Napoca 2000 [10] VPop IChicinaş NJumate Fizica materialelor Metode experimentalerdquo EdPresa Universitară Clujeană 2001 [11] IUrsu Rezonanţă electronică de spinrdquo EdAcademiei Bucureşti 1965 Chapter 4 [1] I Ardelean S Lupşor D Rusu Solid State Sci 10 1384(2008) [2] I Ardelean S Lupşor D Rusu trimis spre publicare la Physica B decembrie 2009 [3] P Tarte Spectrochim Acta 18 467 (1962) [4] R A Condrate J Non ndash Cryst Solids 84 26 (1986) [5] G Srinivasarao N Veeraiah Phys Stat Sol (a) 191 370(2002) [6] G Srinivasarao N Veeraiah J Phys Chem Solids 63 705(2002) [7] G Srinivasarao N Veeraiah J All Com 327 52 (2001) [8] DK Durga N Veeraiah Bull Mater Sci 24 (4) 421 (2001) [9] F F Bentley L D Smithson A L Rozek InfraredndashSpectra and Characteristic Frequencies 700-300 cm-1 Interscience New York 1968 p 103 [10] O Noguera T Merle-Mejean AP Mirgorodsky MB Smirnov P Thomas J-C Champarnaud-Mesjard J Non-Cryst Solids 330 50 (2003) [11] BVR Chowdari KL Tan Fang Ling Solid State Ionics 113 ndash 115 711(1998) [12] C Jiang J Zhang H Mao F Gan Glass Technol 39(6) 200(1998) [13] MR Sahar K Sulhadi MS Rohani J Mater Sci 42 824(2007) [14] C Horea D Rusu I Ardelean J Mater Sci Mater Electron 20 905(2009) [15] GE Rachkovskaya GB Zakharevich J Appl Spectrosc 74 86(2007) [16] I Ardelean S Lupşor D Rusu trimis spre publicare la Journal of Materials Science Materials in Electronics decembrie 2009 [17] I Ardelean S Lupşor D Rusu trimis spre publicare la Modern Physics Letters B decembrie 2009 [18] R Iordanova Y Dimitriev V Dimitrov S Kassabov D Klissurski J Non ndash Cryst Solids 231 227 (1998) [19] R Iordanova Y Dimitriev S Kassabov D Klissurski J Non ndash Cryst Solids 204 141 (1996) [20] J O Jensen S J Gilliam A Banerjee D Zeroka S J Kirkby C N Merrow J Mol Struct (Theochem) 664 145 (2003) [21] G N Papatheodorou S A Solin Solid State Commun 16 5 (1975) [22] BVR Chowdari KL Tan Fang Ling J Mat Sci 35 2015 (2000) [23] R C Lucacel C Marcus V Timar I Ardelean Solid State Sci 9 850 (2007) [24] CP Varsamis EI Kamitsos GD Chryssikos Solid State Ionics 136ndash137 1031 (2000) [25] Sherief M Abo-Naf Fatma H El Batal Moenis A Azooz Mat Chem Phys 77 846 (2002) [26] SG Motke SP Yawale SS Yawale Bull Mater Sci 25 (10) (2002) [27] R Akagi N Ohtori N Umesaki J Non ndash Cryst Solids 293 471(2001) [28] E I Kamitsos M A Karakassides G D Chryssikos J Phys Chem 91(5) 1073 (1987) [29] H Ushida Y Iwadate T Hattori S Nishiyama K Fukushima Y Ikeda M Yamaguchi M Misawa T Fukunaga T Nakazawa S Jitsukawa J Alloys Compd 377 167 (2004) [30] I Ardelean F Ciorcas M Peteanu S Lupşor G Salvan Balkan Phys Lett 5 860 (1997)
43
[31] I Ardelean M Peteanu V Simon O Cozar F Ciorcas S Lupşor J Magn Magn Mater 196 253 (1999) [32] IArdelean MPeteanu GhIlonca Phys Stat Sol (a) 58 K33(1980) [33] IArdelean MPeteanu R Ciceo-Lucăcel ldquoStudii de rezonanţă paramagnetică electronică şi magnetice ale unor ioni 3d icircn sticle pe bază de B2O3rdquo Ed Presa Univ Clujeană Cluj Napoca 2005 p 171 [34] JLRao AMuraly EDRao J Non-Cryst Solids 202 215 (1996) [35] RPSChakradhar AMurali JLRao Optical Mat 10 109 (1998) [36] IArdelean MPeteanu SFilip VSimon GGyorffy Solid State Commun 102(4) 341 (1997) [37] IArdelean MPeteanu VSimon SFilip FCiorcaş ITodor J Magn Magn Mat 196-197 257 (1999) [38] IArdelean GSalvan MPeteanu VSimon CHimcinschi FCiorcas Mod Phys Lett B 13(22-23) 801 (1999) [39] IArdelean HHQiu HSakata Mat Lett 32 335 (1997) [40] SPChaudhuri SKPatra J Mat Sci 35 4735 (2000) [41] I Ardelean M Peteanu V Simon G Salvan J Mat Sci Technol 18 (3) 1 (2002)

14
The evolution of the spectra with the addition and the increasing of the Fe2O3 content
suggest that the iron ions break up a part of As ndash O ndash As Pb ndash O ndash Pb and probably of As ndash O
ndash Pb bonds It can be observed a shift in the bands assigned As ndash O ndash As vibrations from AsO3
units due to changing to length As ndash O ndash As bonds and interne angles of AsO3 units the PbO4
units disappear and FeO6 units appear For x ge 5 mol Fe2O3 observed comparatively in
both system glasses the addition of iron ions suggests for the first system a modification in
linkage characteristic units of As2O3middotPbO and for the second system an improvement for
structural units of As2O3middot TeO2 vitreous matrice also linkage characteristic units appearance
of FeO6 units in both system
416 Comparative study by Raman spectroscopy of
As2O3middotTeO2 and As2O3middotPbO vitreous matrices
In order to obtain new information regarding the role of the modifier in the
formation of vitreous matrices there were made comparative studies by Raman
spectroscopy The Raman spectroscopy are presented in figure 46(ab) The wave
length and the structural assignments of Raman spectra of As2O3middotPbO şi As2O3middotTeO2 vitreous
matrices are presented in table 42
Table 42Wavenumber and the structural assignements of Raman spectra
of As2O3middotPbO and As2O3middotTeO2 vitreous matrices
~ [cm 1 ]
As2O3middotPbO As2O3middotTeO2
Attribution
~826 cm-1
~ 816 cm-1
Stretching vibrations of As-O-As
~ 752 cm-1
Vibrations of the continuous TeO4 (tbp) network
~ 627 cm-1
Vibrations As ndash O ndash As bonds from As2O units
~ 580 cm-1
Stretching vibrations of As-O-As
~ 525 cm-1
Vibrations O-As-O bonds from AsO3 units
~ 438cm-1
Symmetric bending vibrations of Te ndash O ndash Te vertex linkages between different TeO4 (tbp) TeO3+1 polyhedra Stretching vibrations of As-O-As of AsO3 units
~ 345 cm-1
Bending vibrations of As ndash O ndash As from As2O units
15
200 400 600 800 1000
As2O3PbO
Ram
an In
tens
ity [a
u]
LWavenumber [cm-1]
345
826
525
627a)
a
200 400 600 800 1000
816
752
580 R
aman
Inte
nsity
[au
]
Wavenumber [cm-1]
As2O3TeO2
438
b)
b
Fig46 Raman spectra of vitreous matrices a As2O3middotPbO şi b As2O3middotTeO2
The Raman spectrum of As2O3middotPbO glass matrix presents four bands at 826 cm-1
627 cm-1 525 cm-1 and 345 cm-1 The band from 826 cm-1 can be assigned to As ndash O ndash
As stretching vibrations [20] The band centered at 627 cm-1 can be assigned to vibrations As
ndash O ndash As bonds from As2O units the band from 525 cm-1 are assigned vibrations O-As-O
bonds from AsO3 units [21] The band of 345 cm-1 are attributed to As ndash O ndash As bending
vibrations from As2O units[2021]
The Raman spectrum of As2O3middot TeO2 glass matrix presents four bands at 816 cm-1
752 cm-1 580 cm-1 and 438 cm-1 The band from 816 cm-1 can be assigned to As ndash O ndash
As stretching vibrations [20] The band centered at 752 cm-1 can be assigned to vibrations of
the continuous TeO4 (tbp) network [22] The band of 580 cm-1 are attributed to As ndash O ndash As
stretching vibrations [12] The band centered at 438 cm-1 can be assigned symmetric bending
vibrations of Te ndash O ndash Te vertex linkages between different TeO4 (tbp) TeO3+1 polyhedra and
As ndash O ndash As stretching vibrations of AsO3 units
16
417 Study by Raman spectroscopy of xMOmiddot(100- x)[As2O3middotPbO]
vitreous systems where MO =gt MnO or Fe2O3
The Raman spectra obtained for xMOmiddot(100- x)[As2O3middotPbO] vitreous systems where
MO =gt MnO or Fe2O3 with 0 le x le 50 mol are presented in figure 47-8 and their
structural assignments are summarized in table 42
200 400 600 800 1000
368
833
345
1
3
Lungimea de unda [cm-1]
Inte
nsita
te R
aman
[ua
]
20
05
0
5
10
35
50
MnO
826
525
627
Fig 47 Raman spectra of xMnOmiddot(100- x)[As2O3middotPbO] glasses
The addition of MnO in the glass matrix determined an order degree of the vitreous
matrix The intensity of the bands attributed vibrations As ndash O ndash As bonds from As2O units
and bending vibrations of As ndash O ndash As from As2O units shift to a higher wave length that
suggests an increase in the As2O units comparative to AsO3 units
To the band from 826 cm-1 the addition of manganese ions in the glass matrix
determine for x = 05 mol an decreasing in intensity whereupon increasing for higher
concentrations The intensity of bands centered at 627 cm-1 and 525 cm-1 for x = 05
mol MnO decrease and disappear for x = 1 mol MnO The band of 345 cm-1 slowly
increases with the addition of manganese ions
To the band from 826 cm-1 the addition of iron ions in the glass matrix determines
for x = 05 mol an increase in intensity a gradual decrease and disappearance for x = 35
mol Fe2O3 of the bands observed for the glass matrix For higher concentrations of
manganese these bands gradually decrease The intensity of bands centered at 627 cm-1 and
525 cm-1 for x = 05 mol Fe2O3 increase and shift to 612 cm-1 and 501 cm-1 whereas
17
they gradually decrease and disappear for x = 10 mol Fe2O3 The band of 345 cm-1
decreases with the addition of iron ions and disappears for x = 20 mol Fe2O3
200 400 600 800 1000
3
612
501
Wavenumber [cm-1]
Ram
an In
tens
ity [a
u]
05
20
0
5
10
3550
1
Fe2O3
345
826
525
627
Fig 48 Raman spectra of xFe2O3middot(100- x)[As2O3middotPbO] glasses
With the increase of iron ions content in the As2O3middotPbO glass matrix the number of
these structural units decreases due to the increasing of the disorder in the studied glasses
418 Study by Raman spectroscopy of xMOmiddot(100-x)[As2O3middotTeO2]
vitreous systems were MO =gt MnO or Fe2O3
The Raman spectra obtained for xMOmiddot(100- x)[As2O3middot TeO2] vitreous systems
where MO =gt MnO or Fe2O3 with 0 le x le 50 mol are presented in figure 49-10 and their
structural assignments are summarized in table 42
The Raman spectrum of the glass matrix suggests a structure formed from TeO4 (tbp)
and TeO3 (tp) units where the presence of As ndash O ndash As bonds can not be excluded The
addition of manganese ions is leading to a modification of the structure proposed by the
spectrum of the glass matrix Then with the increasing of manganese content the intensity of
these bands is increasing showing that the manganese content favorises the formation of TeO4
(tbp) and TeO3 (tp) units
18
200 400 600 800 1000
783
850
768
416
816
752
Wavenumber [cm -1]
Ram
an In
tens
ity [a
u]
13
20
05
0
5
10
35
50
MnO
438
580
660
Fig 49 Raman spectra of xMnOmiddot(100- x)[As2O3middot TeO2] glasses
200 400 600 800 1000
226
294
408
673 751
5
W avenumber [cm -1]
Ram
an In
tens
ity [a
u]
05
20
0
3
10
35
50
1
Fe2O
3
816
752
438
580
Fig 410 Raman spectra of xFe2O3middot(100- x)[As2O3 TeO2] glasses
The Raman spectra of xFe2O3middot(100- x)[As2O3 TeO2] glasses present a significant
advance to the TeO4 (tbp) TeO3+1 polyhedra and AsO3 units represented in Raman spectrum
by the ~ 438 cm-1 band comparative with the modifications determined by the addition of
manganese ions in vitreous matrix For high concentrations of iron ions in xFe2O3middot(100-
x)[As2O3 TeO2] system of glasses the number of As-O-As linkages appear in Raman
spectrum due to stretching vibrations of As-O-As and vibrations of the continuous TeO4 (tbp)
network show a significant decrease
19
419 Comparative study by Raman spectroscopy of xMnOmiddot(100- x)[As2O3middotBO]
vitreous systems were BO =gt TeO2 or PbO
The addition of MnO to xMnOmiddot(100- x)[As2O3middotPbO] glass system do not break As
ndash O ndash As bonds into characteristic units and contribute to their prominence The addition of
manganese ions to xMnOmiddot(100- x)[As2O3middot TeO2] glass system for x=50mol MnO
determined the splitting up of a part of As ndash O ndash As Te-O-Te and the appearance of the
TeO4 (tbp) units against the loss of continuous TeO4 (tbp) network was observed
4110 Comparative study by Raman spectroscopy of xFe2O3middot(100- x)[As2O3middotBO]
vitreous systems where BO =gt TeO2 or PbO
With the increasing of iron ions content in the As2O3middotPbO glass matrix the number of
these structural units decreased due to the increase of the disorder in the studied glasses (x gt 20
mol ) and x = 50 mol Fe2O3 for xFe2O3middot(100- x)[As2O3middotTeO2] when iron ions
brought the structural units existing in glass matrices and favoured the appearace of
new bands due to bending vibrations of As ndash O ndash As
42 Comparative study by FT-IR and Raman spectroscopies of
xMOmiddot(100-x)[3B2O3middotLi2O] glasses where MO =gt MnO or Fe2O3
421 Study by FT-IR spectroscopy of xMOmiddot(100-x)[3B2O3middotLi2O] glasses
where MO =gt MnO or Fe2O3
The infrared absorption spectra obtained for xMOmiddot(1-x)[3B2O3middotLi2O] glass system
where MO =gt MnO or Fe2O3 with 0 le x le 50 mol are presented in figure 411-13 and their
structural assignments are summarized in table 43
500 1000 1500
3B2O3Li2O
Wavenumber [cm-1]
Abs
orpt
ion
[au
]
490
1400
1230
1061
698
614
460 78
6
Fig 411 FT ndash IR spectra of vitreous matrix 3B2O3middotLi2O
20
Following the infrared absorption spectra obtained for 3B2O3middotLi2O vitreous matrix
observed on eight bands ~ 1400 cm-1 ~ 1230 cm-1 ~ 1061 cm-1 ~ 786 cm-1 ~ 698 cm-
1 ~ 614 cm-1 ~ 490 cm-1 şi ~ 460 cm-1 The band at ~ 1400 cm-1 is assigned to
asymmetric stretching vibrations from BOslash3 şi BOslash2O- groups (Oslash represent oxygen atom
bridging two boron atoms) The band at ~ 1230 cm-1 is attributed to asymmetric stretching
vibrations of B ndash O bonds from triangular ortoborate BO 33 groups [23-26]
400 600 800 1000 1200 1400 1600
0
3
5
10
20
35
50
1
Wavenumber [cm-1]
Abs
orpt
ion
[ua
]
05
MnO
490
1400
1230
1061
698
614
460 78
6
Fig 412 FT ndash IR spectra of xMnOmiddot(100-x)[3B2O3middotLi2O] glasses
400 600 800 1000 1200 1400 1600
469
Wavenumber [cm-1]
Abs
orpt
ion
[ua
]
0
3
5
10
20
35
50
1
05
Fe2O3
490
1400
1230
1061
698
614
460 78
6
Fig 413 FT ndash IR spectra of x Fe2O3middot(100-x)[3B2O3middotLi2O] glasses
21
Table 43Wavenumber and the structural assignments of FT ndash IR and Raman
spectra of 3B2O3middotLi2O vitreous matrix
~ [cm 1 ] Attribution
FT ndash IR Raman FT ndash IR Raman
~ 1400 cm-1
~ 1400 cm-1
Asymmetric stretching
vibrations from BOslash3 şi BOslash2O-
groups
BOslash2O- triangles linked to
other borate triangular units
~ 1230 cm-1
Asymmetric stretching
vibrations of B ndash O bonds from
triangular ortoborate
BO 33 groups
~ 1061 cm-1
~ 1074 cm-1
Stretching vibrations of B ndash Oslash
bonds in -4BOslash tetrahedra from
tri- tetra- and penta-borate
groups
Diborate groups
~ 902 cm-1
Vibrations of orthoborate
groups
~ 786 cm-1
~ 791 cm-1
Bending vibrations of O3B ndash O
ndash BO4 bonds
Vibrations of rings with six
member to one or two BO4
tetrahedral from tri- tetra ndash
and penta ndash borate units
~ 698 cm-1
Bending vibrations of B-O-B
bonds from pentaborate groups
~ 614cm-1 Bending vibrations of O ndash B ndash O
bonds
~ 490cm-1 ~ 471cm-1 Bending vibrations of B-O-B
bonds
Isolated diborate groups
~ 460cm-1 Bending vibrations of O ndash B ndash O
bonds
22
The band at ~ 1061 cm-1 is assigned to stretching vibrations of B ndash Oslash bonds in -4BOslash
tetrahedra from tri- tetra- and penta-borate groups and the band at ~ 786 cm-1 is assigned
to bending vibrations of O3B ndash O ndash BO4 bonds The band at ~ 698 cm-1 is attributed to
Bending vibrations of B-O-B bonds from pentaborate groups The bands at ~ 614 cm-1 and
~ 460 cm-1 are assigned to bending vibrations of O ndash B ndash O bonds and the band at ~ 490 cm-
1 is assigned to bending vibrations of B-O-B bonds
From FT-IR spectra it can be concluded that the addition of manganese or iron ions in
vitreous matrices leads to the increase of the disorder degree
Also the structural changes that appeared in 3B2O3middotLi2O vitreous matrix with an
addition MnO or Fe2O3 content can be studied Ar=A4A3 ratio(A4 - relative number of -4BOslash tetrahedral borate units A3 - relative number of triangular (BOslash3 and BOslash2O-) units
0 10 20 30 40 50
010
015
020
Ar
x [mol]
MnO Fe2O3
Fig 414 The evolution of Ar ratio with the MnO or Fe2O3 content of
xMnOmiddot(100-x)[3B2O3middotLi2O] şi xFe2O3middot(100-x)[3B2O3middotLi2O] The evolution of the value of this ratio also allows a visualization of the effects
determined by the presence of the manganese or iron ions in the matrix The value Arltlt 1
indicated that BO3 is dominant related to BO4
422 Study by Raman spectroscopy of xMOmiddot(100-x)[3B2O3middotLi2O] glasses
where MO =gt MnO or Fe2O3
The Raman spectra obtained for xMOmiddot(1-x)[3B2O3middotLi2O] glass system were MO =gt
MnO or Fe2O3 with 0 le x le 50 mol are presented in figure 414-16 and their structural
assignments are summarized in table 43
Studying the Raman spectra of xMOmiddot(1-x)[3B2O3middotLi2O] glass system where MO =gt
MnO or Fe2O3 it has been observed that the absorption bands presented in vitreous matrix
gradually decreased with an increase in the manganese or iron content in both glasses system
which suggested an increase of the disorder in these vitreous systems
23
1000 2000 3000
B2O3Li2O
Wavenumber [cm-1]
Ram
an In
tens
ity [a
u]
1430
107490
279
1471
Fig 415 Raman spectra of vitreous matrix 3B2O3middotLi2O
500 1000 1500 2000 2500 3000
1430
107490
2791
0
Wavenumber [cm-1]
Ram
an In
tens
ity [a
u]
1
3
20
05
5
10
35
50
MnO
471
Fig 416 Raman spectra of xMnOmiddot(100-x)[3B2O3middotLi2O] glasses
400 600 800 1000 1200 1400 1600
Wavenumber [cm-1]
Ram
an In
tens
ity [a
u]
0
1
3
20
05
5
10
35
50
Fe2O3
1430
1074
90279
1
471
Fig 417 Raman spectra of x Fe2O3middot(100-x)[3B2O3middotLi2O] glasses
24
43 Comparative study by electron paramagnetic resonance (EPR) and magnetic
susceptibility measurements of xMOmiddot(100-x)[As2O3middotTeO2] xMOmiddot(100-x)
[As2O3middotPbO] and xMOmiddot(100-x)[3B2O3middotLi2O] glasses where MO =gt MnO or Fe2O3
431 Comparative study by electron paramagnetic resonance (EPR) of
xMnOmiddot(100-x)[As2O3middotBO] where BO =gt TeO2 or PbO
and xMnOmiddot(100-x) [3B2O3middotLi2O] glasses
In order to obtain more information regarding the behavior of manganese ions in
different vitreous matrices [3031] xMnOmiddot(100-x)[As2O3middotBO] where BO =gt TeO2 or PbO
and xMnOmiddot(100-x) [3B2O3middotLi2O] glasses were investigated by EPR spectroscopy on a large
compositional range with 0 le x le 50 mol The EPR spectra of Mn2+ for xMnOmiddot(100-
x)[As2O3middotPbO] (S1) xMnOmiddot(100-x)[As2O3middotTeO2] (S3) and xMnOmiddot(100-x)[3B2O3middotLi2O]
(S5) are presented in figure 418-20 These spectra present two absorption lines centered at gef
43 and gef 20 in all systems
The absorption line centered at gef 43 and is due to isolated Mn2+ ions [32] The
absorption line centered at gef 20 may be attributed to Mn2+ species interacting by magnetic
coupling[33] dipolar and or super exchange the last ones forming magnetic clusters [32]
The evolution of the spectra is easier to follow considering the dependence of
concentration on the EPR parameters the line - intensity (obtained as an integral of the area
under the corresponding EPR signal) J and the line - width ΔB The evolution of J and AB
reflects the structural transformations which appear in the glass matrices due to the increase of
manganese ions content
The intensity and the line - width of the resonance line from gef 43 for all
investigated systems is represented in figure 421(ab)
The intensity of the resonance line from gef 43 for all investigated glass systems
decreases due to the decrease of the isolated manganese ions numbers The line - width from
gef 43 for (S1) and (S3) systems decreases due to decrease of Mn2+ number and to the
structural disorder in glasses with the increase of MnO content For (S5) glass system the line
- width of the resonance line there is an increase in all compositional domains
The intensity of the resonance line from gef 20 can be observed as increasing up to
x=14 mol for (S1) system up to x=8mol for (S3) system and 20 mol for (S5)
system The line - width of the resonance line from gef 20 for (S1) and (S3) systems
increases up to 3 mol and 5mol for (S5) due to Mn2+ species interacting by magnetic
coupling dipole- dipole as the main broadening mechanism Over this concentration line ndash the
width of the resonance line from gef 20 is straight and it can be assumed that the
manganese ions begin to manifest super exchange magnetic interactions
25
1000 2000 3000 4000 5000
Firs
t der
ivat
ive
of a
bsor
ptio
n [u
a]
05
1
3
5
10
20
35
50
x [mol Mn2O3]amplif
B [G]
10
200
40
80
400
5
1
1
Fig 418 The EPR spectra of Mn2+ for xMnOmiddot(100-x)[As2O3middotPbO] (S1)
glass system
1000 2000 3000 4000 5000
Firs
t der
ivat
ive
of a
bsor
ptio
n [u
a]
x [mol MnO]
051
3
5
10
20
35
50
9
500
400
50
100
4
1
amplif
B [G]
1
Fig 419 The EPR spectra of Mn2+ for xMnOmiddot(100-x)[As2O3middotTeO2] (S3)
glass system
26
1000 2000 3000 4000 5000
501
B [G]
Firs
t der
ivat
ive
of a
bsor
ptio
n [u
a]
1
4
9
10
30
60
100
amplif
05
1
3
5
10
20
35
x [mol MnO]
Fe3+
Fig 420 The EPR spectra of Mn2+ for xMnOmiddot(100-x)[3B2O3middotLi2O] (S5)
glass system
0 2 4 6 8 10 12 14 16 18 20 22
x [mol]
J [ u
a]
S1 S3 S5
-2 0 2 4 6 8 10 12 14 16 18 20 22
50
100
150
200
250
300
S1 S3 S5
x [mol]
B
[G]
a b
Fig 421 The dependence on MnO content of the intensity (a) and width(b) of resonance
line at gef 43 for xMnOmiddot(100-x)[As2O3middotPbO] (S1) xMnOmiddot(100-x)[As2O3middotTeO2] (S3) şi
xMnOmiddot(100-x)[3B2O3middotLi2O] (S5) system glasses
27
0 10 20 30 40 50
x [mol]
J [ u
a]
S1 S3 S5
0 10 20 30 40 50
400
500
600
700
800
900
S1 S3 S5
x [mol]
B[G
]
a b
Fig 422 The dependence on MnO content of the intensity (a) and width b) of resonance
line at gef 20 for xMnOmiddot(100-x)[As2O3middotPbO] (S1) xMnOmiddot(100-x)[As2O3middotTeO2] (S3) and
xMnOmiddot(100-x)[3B2O3middotLi2O] (S5) system glasses
Following figure 418-20 it can be observed that (S1) and (S3) have had a similar
evolution but (S5) system presented for 05 le x le 5 mol (fig420) has a hyperfine
sextet[33] at gef 20due to Mn2+ isolated ions
432 Comparative study by magnetic susceptibility measurements of
xMnOmiddot(100-x)[As2O3middotBO] where BO =gt TeO2 or PbO and
xMnOmiddot(100-x)[3B2O3middotLi2O] glasses
The magnetic susceptibility data are in good agreement with the EPR result The
magnetic behavior of the glasses from xMnOmiddot(100-x)[As2O3middotBO] where BO =gt TeO2 (S3)
or PbO (S1) and xMnOmiddot(100-x)[3B2O3middotLi2O] (S5) glasses for 3 le x le 50 mol MnO are
presented in figure 423 - 25
For (S1) and (S3) system glasses up to x 3 mol and x 5 mol (S5) glass
system the temperature dependence of the reciprocal magnetic susceptibility obeys a Curie
law In this concentration range the manganese ions are predominantly isolated orand
participate in dipole-dipole interractions At higher concentrations the reciprocal magnetic
susceptibility obeys a Curie-Weiss law with negative paramagnetic Curie temperature (p)
characteristic to antiferromagnetic coupled ions by means of super exchange interractions(fig
426) This behavior of manganese ions is confirmed by the shape of the EPR spectra
28
100 150 200 250
2
4
6
8
10
12
14
16
18
20
22
T [K]
[
emu
mol
]-1
3 mol 5 mol 10 mol 20 mol 35 mol 50 mol
Fig423 The temperature dependence of -1 for xMnOmiddot(100-x)[As2O3middotPbO]
(S1) 3 le x le 50 mol
50 100 150 200 2500
2
4
6
8
10
12
14
16
18
20
22
3 mol 5 mol 10 mol 20 mol 35 mol 50 mol
T [K]
[
emu
mol
]-1
Fig424 The temperature dependence of -1 for xMnOmiddot(100-x)[ As2O3middotTeO2]
(S1) 3 le x le 50 mol
100 150 200 250
2
4
6
8
10
12
14
16
18
20
22
[em
u m
ol]-1
T [K]
3 mol 5 mol 10 mol 20 mol 35 mol 50 mol
Fig425 The temperature dependence of -1 for xMnOmiddot(100-x)[3B2O3middotLi2O]
(S5) 3 le x le 50 mol
29
0 10 20 30 40 50
0
20
40
60
80
100
x [mol]
-p [K
]
(S1) (S3) (S5)
Fig426Concentration dependence of (p) for sistemele xMnOmiddot(100-x)[As2O3middotPbO]
(S1) xMnOmiddot(100-x)[As2O3middotTeO2] (S3) şi xMnOmiddot(100-x)[3B2O3middotLi2O] (S5)
Using the representation 1 =f(T) the molar Curie constants CM the effective
magnetic moments and molar fraction of Mn2+(x1) şi Mn3+(x2) ions were calculated and
represented in tables 44 -6
Tabel 44 Molar Curie constants effective magnetic moments and molar fraction of Mn2+(x1) şi Mn3+(x2) ions in xMnOmiddot(100-x)[As2O3middotPbO] (S1) glasses
x
[mol MnO2] CMtimes102
[emu mol] ef
[microB] x1
[mol Mn2+O2] x2
[mol Mn3+O2] 3 1272 582 268 032 5 1979 562 343 157 10 3777 549 555 445 20 6688 517 492 1508 35 12239 502 377 3123 50 15427 496 268 4732
Tabel 45 Molar Curie constants effective magnetic moments and molar fraction of Mn2+(x1) şi Mn3+(x2) ions in xMnOmiddot(100-x)[As2O3middotTeO2] (S3)glasses
x
[mol MnO2] CMtimes102
[emu mol] ef
[microB] x1
[mol Mn2+O2] x2
[mol Mn3+O2] 3 1297 588 287 013 5 1938 556 312 188 10 3804 551 575 425 20 6766 52 549 1451 35 11148 504 441 3059 50 15528 498 358 4642
30
Tabel 46 Molar Curie constants effective magnetic moments and molar fraction of Mn2+(x1) şi Mn3+(x2) ions in xMnOmiddot(100-x)[3B2O3middotLi2O] (S5) glasses
x
[mol MnO2] CMtimes102
[emu mol] ef
[microB] x1
[mol Mn2+O2] x2
[mol Mn3+O2] 3 127 581 265 035 5 1919 554 303 197 10 3681 542 486 514 20 7215 519 53 147 35 1121 506 505 2995 50 15898 501 493 4507
433 Comparative study by electron paramagnetic resonance (EPR) of
xFe2O3middot(100-x)[As2O3middotBO] where BO =gt TeO2 or PbO and
x Fe2O3middot(100-x) [3B2O3middotLi2O] glasses
In order to obtain more information regarding the behavior of iron ions in
xFe2O3middot(100-x)[As2O3middotBO] where BO =gt TeO2 (S4) or PbO (S2) şi xFe2O3middot(100-
x)[3B2O3middotLi2O] glasses were investigated by EPR spectroscopy on a large compositional
range with 05 le x le 35 mol Fe2O3 The EPR spectra of Fe3+ in xFe2O3middot(100-
x)[As2O3middotPbO] (S2) xFe2O3middot(100-x)[As2O3middotTeO2] (S4) and xFe2O3middot(1-x)[3B2O3middotLi2O]
(S6) are presented in figure 427-29 These spectra present two absorption lines centered at
gef 43 and gef 20 up to x le 35mol Fe2O3 systems studied
The absorption line centered at gef 43 is due to isolated Fe3+ ions [34-36] The
absorption line centered at gef 20 may be attributed to Fe3+ species interacting by magnetic
coupling dipolar and or super exchange the last ones forming magnetic clusters [37-41]
The evolution of the spectra is easier to follow considering the dependence of
concentration on the EPR parameters the line - intensity (obtained as an integral of the area
under the corresponding EPR signal) J and the line - width ΔB The evolution of J and AB
reflects the structural transformations which appear in the glass matrices due to the increasing
of iron ions content
The intensity and the line - width of the resonance line from gef 43 for all
investigated systems is represented in figure 430 (a b) The intensity of the resonance line
from gef 43 increases for (S2) and (S4) up to 3 mol and up to 5 mol for (S6) then
decreases for all systems investigated A line broadening up to 3 mol from gef 43 for
these systems can be observed due to increasing of Fe3+ isolated number of ions
31
1000 2000 3000 4000 5000
40
Firs
t der
ivat
ive
of a
bsor
ptio
n [u
a]
B [G]
x [mol Fe2O3]
05
1
3
5
1020
35 2
40
20
10
10
10
amplif
Fig427 The EPR spectra of Fe3+ for xFe2O3middot(100-x)[As2O3middotPbO] (S2)
glass system
1000 2000 3000 4000 5000
100
B [G]
Firs
t der
ivat
ive
of a
bsor
ptio
n [u
a]
10080
20
50
20
20
3
05
1
5
102035
x [mol Fe2O3] amplif
Fig428 The EPR spectra of Fe3+ for xFe2O3middot(100-x)[As2O3middotTeO2] (S4)
glass system
32
1000 2000 3000 4000 5000
Firs
t der
ivat
ive
of a
bsor
ptio
n [u
a]
B [G]
3
05
1
5
10
20
35
x [mol Fe2O3]
30
50
20
20
10
30
30
amplif
Fig429 The EPR spectra of Fe3+ for xFe2O3middot(100-x)[3B2O3middotLi2O] (S6)
glass system
The intensity and the line - width of the resonance line from gef 43 for all
investigated systems is represented in figure 430 (a b)The resonance line from gef 20 is
attributed to Fe3+ ions that interact by magnetic coupling dipolar orand super exchange
interractions can be observed in all compositional domains
The intensity of the resonance line from gef 20 can be observed as increasing up to
x=35 mol for (S2) and (S6) system and 10 mol for (S4) system with increased iron
ions content The line - width of the resonance line from gef 20 increased up to 10mol
for (S2) system and up to 3 mol for (S4) and 5mol for (S6) due to Fe3+species
interacting by magnetic coupling dipole-dipole Above this concentration line - width of the
resonance line from gef 20 can be attributed to dipolar and super exchange magnetic
interactions The ΔB = f(x) dependence reflects the competion between the broadening
mechanism (dipole ndash dipole interactions the interactions between ions in diferent
valence state and structural disorder) and the narrowing ones (super exchange
interactions)
33
0 5 10 15 20 25 30 35 40
x [mol]
J [ u
a]
S2 S4 S6
a)
0 5 10 15 20 25 30 35 4040
60
80
100
120
140
160
180
200
220 S2 S4 S6
B[G
]
x [mol]
a b
Fig 430 The dependence on Fe2O3 content of the intensity (a) and width (b) of
resonance line at gef 43 for xFe2O3middot(100-x)[As2O3middotPbO] (S2)
xFe2O3middot(100-x)[As2O3middotTeO2] (S4) and xFe2O3middot(100-x)[3B2O3middotLi2O] (S6) glasses
0 5 10 15 20 25 30 35 40
x [mol]
J [ u
a]
S2 S4 S6
a)
0 5 10 15 20 25 30 35 40
200
400
600
800
1000
1200
1400
1600
x [mol]
B
[G] S2
S4 S6
a b
Fig 431 The dependence on Fe2O3 content of the intensity (a) and width (b) of
resonance line at gef 20 for xFe2O3middot(100-x)[As2O3middotPbO] (S2)
xFe2O3middot(100-x)[As2O3middotTeO2] (S4) and xFe2O3middot(100-x)[3B2O3middotLi2O] (S6) glasses
34
434 Comparative study by magnetic susceptibility measurements of
xFe2O3middot(100-x)[As2O3middotBO] where BO =gt TeO2 or PbO and
xFe2O3middot(100-x) [3B2O3middotLi2O] glasses
The magnetic susceptibility data are in good agreement with the EPR result The magnetic
behavior of the glasses xFe2O3middot(100-x)[As2O3middotPbO] (S2) xFe2O3middot(100-x)[As2O3middotTeO2]
(S4) and xFe2O3middot(100-x)[3B2O3middotLi2O] (S6) for 3 x 50 mol Fe2O3 are presented in
figure 432 - 34
For (S2) glass systems up to x 10 mol x 3 mol (S5) glass systems and x 5
mol (S6) glass systems the temperature dependence of the reciprocal magnetic susceptibility
obeys a Curie law In this concentration range the iron ions are predominantly isolated orand
participate in dipole-dipole interactions At higher concentrations the reciprocal magnetic
susceptibility obeys a Curie-Weiss law with negative paramagnetic Curie temperature (p)
characteristic to antiferromagnetic coupled ions by means of super exchange interactions(fig
435) This behavior of iron ions is confirmed by the shape of the EPR spectra
80 100 120 140 160 180 200 220 240 260 2800
1
2
3
4
5
6
7
8
9
10
11
[
emu
mol
]-1
T [K]
3 mol 5 mol 10 mol 20 mol 35 mol 50 mol
Fig432 The temperature dependence of -1 for xFe2O3middot(100-x)[As2O3middotPbO] (S2)
3 x 50 mol
35
80 100 120 140 160 180 200 220 240 260 2800
1
2
3
4
5
6
7
8
9
10
T [K]
[
emu
mol
]-1
3 mol 5 mol 10 mol 20 mol 35 mol 50 mol
Fig433 The temperature dependence of -1 for xFe2O3middot(100-x)[As2O3middotTeO2] (S4)
3 x 50 mol
80 100 120 140 160 180 200 220 240 260 2800
1
2
3
4
5
6
7
8
9
10
11
3 mol 5 mol 10 mol 20 mol 35 mol 50 mol
T [K]
[
emu
mol
]-1
Fig434 The temperature dependence of -1 for xFe2O3middot(100-x)[3B2O3middotLi2O] (S6)
3 x 50 mol
36
0 10 20 30 40 50
0
10
20
30
40
50
x [mol]-
p [K]
(S2) (S4) (S6)
Fig435Concentration dependence of (p) for sistemele xFe2O3middot(100-x)[As2O3middotPbO] (S2) xFe2O3middot(100-x)[As2O3middotTeO2] (S4) and xFe2O3middot(100-x)[3B2O3middotLi2O] (S6)
for 3 x 50 mol Fe2O3
Using the representation 1 = f(T) the molar Curie constants CM the effective
magnetic moments and molar fraction of Fe3+(x1) şi Fe2+(x2) ions were calculated and
represented in tables 47-9
Table 47 Molar Curie constants effective magnetic moments and molar fraction of
Fe3+(x1) şi Fe2+(x2) ions in xFe2O3middot(100-x)[As2O3middotPbO] glasses (S2)
x [mol Fe2O3]
CMtimes102
[emu mol] ef
[microB] x1
[mol Fe23+O3]
x2 [mol Fe2
2+O3] 3 2526 58 261 039 5 393 56 332 168 10 7326 541 476 524 20 13459 519 53 147 35 23364 516 829 2671 50 32154 507 767 4233
Table 48 Molar Curie constants effective magnetic moments and molar fraction of
Fe3+(x1) şi Fe2+(x2) ions in xFe2O3middot(100-x)[As2O3middotTeO2] glasses (S4)
x [mol Fe2O3]
CMtimes102
[emu mol] ef
[microB] x1
[mol Fe23+O3]
x2 [mol Fe2
2+O3] 3 2571 585 277 023 5 4016 566 363 137 10 7911 562 686 314 20 14992 521 643 929 35 22676 509 601 2899 50 30959 497 313 4687
37
Table 49 Molar Curie constants effective magnetic moments and molar fraction of Fe3+(x1) şi Fe2+(x2) ions in xFe2O3middot(100-x)[3B2O3middotLi2O] glasses (S6)
The results allowed to consider that the magnetic properties of the studied glasses can
be explained through magnetic interractions between Fe3+ - Fe3+ Fe3+- Fe2+ and Fe2+- Fe2+ that
explain the dependences of RPE parameters concentration
SELECTED CONCLUSIONS
In this thesis xMOmiddot(100-x)[As2O3middotTeO2] xMOmiddot(100-x) [As2O3middotPbO] and
xMOmiddot(100-x)[3B2O3middotLi2O] glasses where MO =gt MnO or Fe2O3 were comparatively
studied in 0 le x le 50 mol The structural modifications of investigated glass matrices were
comparatively followed in function of the manganese or iron ions on the investigated glass
matrices were followed
The study by FT-IR spectroscopy shows that the evolution of the spectra of
xMnOmiddot(100-x) [As2O3middotPbO] with the addition and the increasing of the MnO content suggest
that the manganese ions break up a part of As ndash O ndash As Pb ndash O ndash Pb and probably of As ndash O ndash
Pb bonds The addition of MnO in the As2O3middotPbO glass matrix is leading to a disordering of
the glasses structure with the increasing of the MnO content
The evolution of the absorption bands for FT ndash IR spectrum of xFe2O3middot(1-x)
[As2O3middotPbO] glasses are determined by the addition of Fe2O3 content It can be observed to
shift the bands assigned As ndash O ndash As vibrations from AsO3 units due to changing to length As
ndash O ndash As bonds and interne angles of AsO3 units disappears PbO4 units and appears FeO6
units The addition of Fe2O3 in the As2O3middotPbO glass matrix determined a disordering of the
glasses structure with the increasing of the Fe2O3 content
From FT-IR absorption spectra of the investigated xMOmiddot(100-x)[As2O3middotTeO2] glasses
system where MO =gt MnO or Fe2O3 it can be observed that the addition and increasing of
manganese ions concluded the contraction of As-O-As bonds from totally symmetric
x [mol Fe2O3]
CMtimes102
[emu mol] ef
[microB] x1
[mol Fe23+O3]
x2 [mol Fe2
2+O3] 3 2542 582 268 032 5 3943 561 338 162 10 7423 544 506 494 20 13568 520 549 1451 35 23094 513 731 2769 50 31746 503 584 4416
38
stretching vibrations of AsO3 units for x ge10 mol there can be an increase in number of As-
O-As bonds from AsO3 units orand a length these linkage to doubly degenerate stretching
vibrations of AsO3 units and a stretching vibration mode of TeO3 tp with NBO It can be
remarked from the FT-IR absorption spectra the gradual transformation of symmetric
stretching vibration mode of Te-O bonds from TeO3 units in TeO4 (tbp) units and the presence
of MnO2 units Once with the addition of iron ions the xFe2O3middot(100- x)[As2O3middotTeO2]
glasses behave like xMnOmiddot(100-x)[As2O3middotTeO2] glasses but in this system the
appearance of FeO6 units can be seen
From FT-IR spectra in xMOmiddot(100-x)[3B2O3middotLi2O] glasses where MO =gt MnO or
Fe2O3 can be concluded that the addition of manganese or iron ions in vitreous matrices leads
to the increase of the disorder degree
The study by Raman spectroscopy shows that the evolution of the spectra the addition
of MnO in the [As2O3middotPbO]glass matrix determined an order degree of the vitreous matrix
The intensity of the bands attributed vibrations As ndash O ndash As bonds from As2O units and
bending vibrations of As ndash O ndash As from As2O units shift to a higher wave length that suggests
an increase in the As2O units comparative to AsO3 units With the increase of iron ions content
in the As2O3middotPbO glass matrix the number of these structural units decreases due to the
increasing of the disorder in the studied glasses
With the increasing of manganese content in As2O3TeO2 glass matrix the intensity
of these bands is increasing showing that the manganese content favorites the formation of
TeO4 (tbp) and TeO3 (tp) units For high concentrations of iron ions in xFe2O3middot(100-
x)[As2O3 TeO2] system of glasses the number of As-O-As linkages appear in Raman
spectrum due to stretching vibrations of As-O-As and vibrations of the continuous TeO4 (tbp)
network show a significant decrease
Studying the Raman spectra of xMOmiddot(1-x)[3B2O3middotLi2O] glass system where MO =gt
MnO or Fe2O3 it has been observed that the absorption bands presented in vitreous matrix
gradually decreased with an increase in the manganese or iron content in both glasses system
which suggested an increase of the disorder in these vitreous systems
The EPR spectra presents the behavior of manganese or iron ions in different vitreous
matrices xMOmiddot(100-x)[As2O3middotBO] where MO=gtMnO or Fe2O3 and BO =gt TeO2 or
PbO and xMOmiddot(100-x) [3B2O3middotLi2O] Glasses were investigated by EPR spectroscopy on a
large compositional range with 0 le x le 50 mol The absorption line centered at gef 43 and
is due to isolated Mn2+ ions The absorption line centered at gef 20 may be attributed to
Mn2+ species interacting by magnetic coupling dipolar and or super exchange the last ones
forming magnetic clusters The EPR spectra of Fe3+ in xFe2O3middot(100-x)[As2O3middotPbO]
xFe2O3middot(100-x)[As2O3middotTeO2] and xFe2O3middot(1-x)[3B2O3middotLi2O] are presented two absorption
lines centered at gef 43 and gef 20 up to x le 35mol Fe2O3 systems studied
39
The absorption line centered at gef 43 is due to isolated Fe3+ ions The absorption
line centered at gef 20 may be attributed to Fe3+ species interacting by magnetic coupling
dipolar and or super exchange the last ones forming magnetic clusters
The evolution of the spectra is easier to follow considering the dependence of
concentration on the EPR parameters the line - intensity (obtained as an integral of the area
under the corresponding EPR signal) J and the line - width ΔB The evolution of J and AB
reflects the structural transformations which appear in the glass matrices due to the increase of
manganese ions content
The magnetic susceptibility data are in good agreement with the EPR result The
magnetic behavior of the glasses from xMnOmiddot(100-x)[As2O3middotBO] where BO =gt TeO2 (S3)
or PbO (S1) and xMnOmiddot(100-x)[3B2O3middotLi2O] (S5) glasses for 3 le x le 50 mol MnO
For (S1) and (S3) system glasses up to x 3 mol and x 5 mol (S5) glass
system the temperature dependence of the reciprocal magnetic susceptibility obeys a Curie
law In this concentration range the manganese ions are predominantly isolated orand
participate in dipole-dipole interractions At higher concentrations the reciprocal magnetic
susceptibility obeys a Curie-Weiss law with negative paramagnetic Curie temperature (p)
characteristic to antiferromagnetic coupled ions by means of super exchange interractions This
behavior of manganese ions is confirmed by the shape of the EPR spectra Using the
representation 1 =f(T) the molar Curie constants CM the effective magnetic moments
and molar fraction of Mn2+(x1) şi Mn3+(x2) ions were calculated The magnetic susceptibility
data are in good agreement with the EPR result
The magnetic behavior of the glasses xFe2O3middot(100-x)[As2O3middotPbO] (S2)
xFe2O3middot(100-x)[As2O3middotTeO2] (S4) and xFe2O3middot(100-x)[3B2O3middotLi2O] (S6) for 3 x 50
mol Fe2O3 are presented For (S2) glass systems up to x 10 mol x 3 mol (S5)
glass systems and x 5 mol (S6) glass systems the temperature dependence of the
reciprocal magnetic susceptibility obeys a Curie law In this concentration range the iron ions
are predominantly isolated orand participate in dipole-dipole interactions At higher
concentrations the reciprocal magnetic susceptibility obeys a Curie-Weiss law with negative
paramagnetic Curie temperature (p) characteristic to antiferromagnetic coupled ions by
means of super exchange interactions(fig 435) This behavior of iron ions is confirmed by the
shape of the EPR spectra Using the representation 1 = f(T) the molar Curie constants
CM the effective magnetic moments and molar fraction of Fe3+(x1) şi Fe2+(x2) ions were
calculated
40
REFERENCES
Chapter 1
[1] I Ardelean bdquoIntroducere icircn studiul materialelor oxidice cu structură vitroasă EdNapocaStar Cluj Napoca 2002 [2] G Srinivasarao N Veeraiah J All Com 327 52-65(2001) [3] G Srinivasarao N Veeraiah J Phys Chem Solids 63705-717(2002) [4] DBecherescu VCristea FMarx IMenessz FWinter Chimia stării solide Ed Şt şi Encicl Bucucureştivol 1 1983 [5] J Wong CAAngell Glass-Structure by Spectroscopy Dekker Inc New York 1976 [6] BEWarren HKKrutter O Morningstat J Am Ceram Soc 19 202 (1936) [7] LLSperry JD Mackenzie Phys Chem Glasses 9 91 (1968) [8] WLKonijnendijk JMStevels J Non-Cryst Solids 18 307 (1975) [9] FCEversteyn JM Stevels HJ Naterman Phys Chem Glasses 1 134 (1963) [10] G Fuxi Optical and Spectroscopie Properties of Glass Springer-Verlag Shanghai Scientific Technical Pub Shanghai 1991 [11] YDYiannopoulos GDChryssikos EIKamitsos Phys Chem Glasses 42(3) 164 (2001) [12] MGFerreira da Silva BFOCosta J Non-Cryst Solids 293-295 534 (2001) [13] RYordanova YDimitriev VDimitriev S Kassabov DKlissurski JNon-Cryst Solids 201 141 (1996) [14] W L Konijnendijk J M Stevels J Non-Cryst Solids 18 307 (1980) [15] M Iron M Couzi ALevasseur JBrethous JSolidState Chem 31 285 (1980) [16] TFurukawa WBWhite PhzsChemGlasses 21 85 (1980) [17] E I Kamitsos M A Karakassides GD Chryssikos J Phys Chem 90 4528 (1986) [18] E I Kamitsos M A Karakassides GD Chryssikos J Phys Chem 91 1073 (1987) [19] TWBril Philips Res Rep Suppl 2 117 (1976) [20] E I Kamitsos M A Karakassides GD Chryssikos J Phys Chem 30 203 (1989) [21] BNMeera JRamakrishna J Non-Cryst Solids 159 1 (1993) [22] KWitke THubert PReich JRamanSpectr 24 407 (1993) [23] E I Kamitsos M A Karakassides Phys Chem Glasses 30 19 (1989) [24] MPeteanu Teză de doctoratrdquo Universitatea Babeş-Bolyairdquo Cluj Napoca (1989) [25] PCTaylor PJBray JPhys Chem Solids 33 43 (1972) [26] IArdelean MPeteanu GhIlonca DPop Solid State Commun 33 653 (1980) [27] AV De Wijn RE Van Balderen JKemPhys 46 4 (1967) [28] DL Griscom RE Griscom J Phys Chem Glasses 12 19 (1971) [29] JWH Schreurs JChem Phys 69 2151 (1978) [30] AlNicula M Peteanu IArdelean Studia Univ Babeş-Bolyai Physica 2 65 (1979) [31] M Peteanu IArdelean SFilip ITodor GSalvan Studia Univ Babeş-Bolyai Physica XL 2 9 (1995) [32] IArdelean M Peteanu SFilipV Simon ITodor Solid State Commun 105 (5) 339 (1998) [33] SKMendiratta EGuedes de Sousa JMatSci Lett7 733 (1988) [34] IArdelean M Peteanu SFilip V Simon GGyorffy Solid State Commun 102 (4) 341 (1997) [35] IArdelean M Peteanu SFilip V Simon FCiorcas ITodor JMagnMagn Mat 196-197 257 (1999) [36] JKliava RBerger YServant JEmery JMGreneche JTrokss J Non-Cryst Solids 202 205 (1996) [37] LDBogomolova NA Krasilnikova VLBogdanov VDKhaliev VV Mitrofanov J Non-Cryst Solids 188 130 (1995) [38] DLoveridge SPark PhysChem Glasses 12 19 (1971) [39] IArdelean G Salvan M Peteanu V Simon FCiorcas Mod PhysLett B 13 (22-23) 801 (1999)
41
[40] JLRao AMuraly EDRao J Non-Cryst Solids 202 215 (1996) [41] CPrakash S Husain RJ Singh SMollah JAlloys Compon 326 47 (2001) [42] EGuedes de Sousa SKMendiratta JMMachado Da Silva Portugal Phys 17 (3-4) 203 (1986) [43] TCastner GSNewell WCHolton CP Slichter JChem Phys 32 668 (1960) [44] SPChaudhuri SKPatra JMatSci 35 4735 (2000) [45] IArdelean HH Qiu HSakata Matt Lett 32 335 (1997) Chapter 2 [1] J Wong C A Angel Glass Structure by Spectroscopy Marcel Dekker inc New-York 1976 [2] I Ardelean bdquoIntroducere icircn studiul materialelor oxidice cu structură vitroasă EdNapocastar Cluj-Napoca 2002 [3] N Avram GH Mateescu Spectroscopia icircn infraroşu Aplicaţii icircn chimia organică Ed Tehnică Bucureşti 1968 [4] TIliescu Spectroscopie optică moleculară vibraţională şi electronică Ed Casa Cărţii de Ştiinţă Cluj- Napoca 2000 [5] S Aştilean bdquoMetode şi tehnici moderne de spectroscopie optică Ed Casa Cărţii de Ştiinţă Cluj - Napoca 2002 p 5 [6] I Ursu Rezonanţă Electronică de Spinrdquo Ed AcademieiBucureşti (1965) [7] CHHurd ContempPhys 23 (5) 469 (1982) [8] GWAnderson WDCompton JChemPhys52 6166 (1970) [9] MS Seehra GSrinivasan Landolt-Bornstein (New Series) SubVolume F3 Springer-Verlag Berlin 1994 [10] GToulouse ContempPhys 2115 (1977) [11] NMMurayMagnetic susceptybility EdInterscience New York P1773 1963 [12] JBGoodenough Magnetism and Chemical Bond EdInterscience New York 1963 [13] IArdelean G Salvan M Peteanu V Simon FCiorcas Mod PhysLett B 13 (22-23) 801 (1999) [14] IArdelean MPeteanu R Ciceo Lucăcel Studii de rezonanţă paramagnetică electronică şi magnetice ale unor ioni 3d icircn sticle pe bază de B2O3 Ed Presa Univesitară Clujeană 2005 [15] IArdelean PhysStatSol (b) 87K137 (1978) [16] IArdelean Solid State Commun 31 75 (1979) [17] EJFrieble LKWilson AWDozier DLKinser PhysStatSol (b) 45 323 (1971) [18] DWMoon JMAitken RKMcCrone GS Ciloszik PhysChe Glasses 16 (5) 91 (1975) [19] SFilip Teză de doctorat UnivBabeş-Bolyai Cluj Napoca 1996 [20] CJSchinkel GWRathenou Physics of Non-Crystaline Solids North Holland Publ Co Amsterdam 215 1965 [21] EJFrieble LKWilson NCKoon DLKinser JAm Ceram Soc 57-237 (1974) [22] RJLandry JT Fournier CGYoung JChemPhys 46 1285 (1967) [23] WSimpson PhysStatSolidi b40 207 (1970) [24] RHasegawa PhysRevB b(5) 1631 (1971) [25] IArdelean GhIlonca MPeteanu Solid State Commun 52 145 (1984) [26] IArdelean GhIlonca OCozar J Physique 49 C8 1107 (1988) Chapter 3 [1] LFBates Modern Magnetism p133 Cambridge University Press London 1962 [2] IArdelean GhIlonca DBarbos Solid State Commun 40 769 (1981) [3] EBurzo IUrsu DUngur IArdelean JMatSci 15 581 (1980) [4] EBurzo IUrsu DUngur IArdelean MatResBull 15 1273 (1980) [5] DLGriscom Glass Science and Technology 48 151 (1990) [6] PJBray AH Silver Modern aspects of the vitreous state vol1 Butterworth
42
London 1960 [7] IArdelean Teza de doctorat UnivBabeş-Bolyai Cluj Napoca 1979 [8] SAştilean bdquoMetode şi tehnici moderne de spectroscopie opticărdquo EdCasa Cărţii de Ştiinţă Cluj ndash Napoca 2002 p5 [9] IArdelean RCiceo-Lucăcel ldquoFizica şi Tehnologia Materialelor Oxidice Lucrări Practicerdquo Ed Univ ldquoBabeş-Bolyairdquo Cluj-Napoca 2000 [10] VPop IChicinaş NJumate Fizica materialelor Metode experimentalerdquo EdPresa Universitară Clujeană 2001 [11] IUrsu Rezonanţă electronică de spinrdquo EdAcademiei Bucureşti 1965 Chapter 4 [1] I Ardelean S Lupşor D Rusu Solid State Sci 10 1384(2008) [2] I Ardelean S Lupşor D Rusu trimis spre publicare la Physica B decembrie 2009 [3] P Tarte Spectrochim Acta 18 467 (1962) [4] R A Condrate J Non ndash Cryst Solids 84 26 (1986) [5] G Srinivasarao N Veeraiah Phys Stat Sol (a) 191 370(2002) [6] G Srinivasarao N Veeraiah J Phys Chem Solids 63 705(2002) [7] G Srinivasarao N Veeraiah J All Com 327 52 (2001) [8] DK Durga N Veeraiah Bull Mater Sci 24 (4) 421 (2001) [9] F F Bentley L D Smithson A L Rozek InfraredndashSpectra and Characteristic Frequencies 700-300 cm-1 Interscience New York 1968 p 103 [10] O Noguera T Merle-Mejean AP Mirgorodsky MB Smirnov P Thomas J-C Champarnaud-Mesjard J Non-Cryst Solids 330 50 (2003) [11] BVR Chowdari KL Tan Fang Ling Solid State Ionics 113 ndash 115 711(1998) [12] C Jiang J Zhang H Mao F Gan Glass Technol 39(6) 200(1998) [13] MR Sahar K Sulhadi MS Rohani J Mater Sci 42 824(2007) [14] C Horea D Rusu I Ardelean J Mater Sci Mater Electron 20 905(2009) [15] GE Rachkovskaya GB Zakharevich J Appl Spectrosc 74 86(2007) [16] I Ardelean S Lupşor D Rusu trimis spre publicare la Journal of Materials Science Materials in Electronics decembrie 2009 [17] I Ardelean S Lupşor D Rusu trimis spre publicare la Modern Physics Letters B decembrie 2009 [18] R Iordanova Y Dimitriev V Dimitrov S Kassabov D Klissurski J Non ndash Cryst Solids 231 227 (1998) [19] R Iordanova Y Dimitriev S Kassabov D Klissurski J Non ndash Cryst Solids 204 141 (1996) [20] J O Jensen S J Gilliam A Banerjee D Zeroka S J Kirkby C N Merrow J Mol Struct (Theochem) 664 145 (2003) [21] G N Papatheodorou S A Solin Solid State Commun 16 5 (1975) [22] BVR Chowdari KL Tan Fang Ling J Mat Sci 35 2015 (2000) [23] R C Lucacel C Marcus V Timar I Ardelean Solid State Sci 9 850 (2007) [24] CP Varsamis EI Kamitsos GD Chryssikos Solid State Ionics 136ndash137 1031 (2000) [25] Sherief M Abo-Naf Fatma H El Batal Moenis A Azooz Mat Chem Phys 77 846 (2002) [26] SG Motke SP Yawale SS Yawale Bull Mater Sci 25 (10) (2002) [27] R Akagi N Ohtori N Umesaki J Non ndash Cryst Solids 293 471(2001) [28] E I Kamitsos M A Karakassides G D Chryssikos J Phys Chem 91(5) 1073 (1987) [29] H Ushida Y Iwadate T Hattori S Nishiyama K Fukushima Y Ikeda M Yamaguchi M Misawa T Fukunaga T Nakazawa S Jitsukawa J Alloys Compd 377 167 (2004) [30] I Ardelean F Ciorcas M Peteanu S Lupşor G Salvan Balkan Phys Lett 5 860 (1997)
43
[31] I Ardelean M Peteanu V Simon O Cozar F Ciorcas S Lupşor J Magn Magn Mater 196 253 (1999) [32] IArdelean MPeteanu GhIlonca Phys Stat Sol (a) 58 K33(1980) [33] IArdelean MPeteanu R Ciceo-Lucăcel ldquoStudii de rezonanţă paramagnetică electronică şi magnetice ale unor ioni 3d icircn sticle pe bază de B2O3rdquo Ed Presa Univ Clujeană Cluj Napoca 2005 p 171 [34] JLRao AMuraly EDRao J Non-Cryst Solids 202 215 (1996) [35] RPSChakradhar AMurali JLRao Optical Mat 10 109 (1998) [36] IArdelean MPeteanu SFilip VSimon GGyorffy Solid State Commun 102(4) 341 (1997) [37] IArdelean MPeteanu VSimon SFilip FCiorcaş ITodor J Magn Magn Mat 196-197 257 (1999) [38] IArdelean GSalvan MPeteanu VSimon CHimcinschi FCiorcas Mod Phys Lett B 13(22-23) 801 (1999) [39] IArdelean HHQiu HSakata Mat Lett 32 335 (1997) [40] SPChaudhuri SKPatra J Mat Sci 35 4735 (2000) [41] I Ardelean M Peteanu V Simon G Salvan J Mat Sci Technol 18 (3) 1 (2002)

16
417 Study by Raman spectroscopy of xMOmiddot(100- x)[As2O3middotPbO]
vitreous systems where MO =gt MnO or Fe2O3
The Raman spectra obtained for xMOmiddot(100- x)[As2O3middotPbO] vitreous systems where
MO =gt MnO or Fe2O3 with 0 le x le 50 mol are presented in figure 47-8 and their
structural assignments are summarized in table 42
200 400 600 800 1000
368
833
345
1
3
Lungimea de unda [cm-1]
Inte
nsita
te R
aman
[ua
]
20
05
0
5
10
35
50
MnO
826
525
627
Fig 47 Raman spectra of xMnOmiddot(100- x)[As2O3middotPbO] glasses
The addition of MnO in the glass matrix determined an order degree of the vitreous
matrix The intensity of the bands attributed vibrations As ndash O ndash As bonds from As2O units
and bending vibrations of As ndash O ndash As from As2O units shift to a higher wave length that
suggests an increase in the As2O units comparative to AsO3 units
To the band from 826 cm-1 the addition of manganese ions in the glass matrix
determine for x = 05 mol an decreasing in intensity whereupon increasing for higher
concentrations The intensity of bands centered at 627 cm-1 and 525 cm-1 for x = 05
mol MnO decrease and disappear for x = 1 mol MnO The band of 345 cm-1 slowly
increases with the addition of manganese ions
To the band from 826 cm-1 the addition of iron ions in the glass matrix determines
for x = 05 mol an increase in intensity a gradual decrease and disappearance for x = 35
mol Fe2O3 of the bands observed for the glass matrix For higher concentrations of
manganese these bands gradually decrease The intensity of bands centered at 627 cm-1 and
525 cm-1 for x = 05 mol Fe2O3 increase and shift to 612 cm-1 and 501 cm-1 whereas
17
they gradually decrease and disappear for x = 10 mol Fe2O3 The band of 345 cm-1
decreases with the addition of iron ions and disappears for x = 20 mol Fe2O3
200 400 600 800 1000
3
612
501
Wavenumber [cm-1]
Ram
an In
tens
ity [a
u]
05
20
0
5
10
3550
1
Fe2O3
345
826
525
627
Fig 48 Raman spectra of xFe2O3middot(100- x)[As2O3middotPbO] glasses
With the increase of iron ions content in the As2O3middotPbO glass matrix the number of
these structural units decreases due to the increasing of the disorder in the studied glasses
418 Study by Raman spectroscopy of xMOmiddot(100-x)[As2O3middotTeO2]
vitreous systems were MO =gt MnO or Fe2O3
The Raman spectra obtained for xMOmiddot(100- x)[As2O3middot TeO2] vitreous systems
where MO =gt MnO or Fe2O3 with 0 le x le 50 mol are presented in figure 49-10 and their
structural assignments are summarized in table 42
The Raman spectrum of the glass matrix suggests a structure formed from TeO4 (tbp)
and TeO3 (tp) units where the presence of As ndash O ndash As bonds can not be excluded The
addition of manganese ions is leading to a modification of the structure proposed by the
spectrum of the glass matrix Then with the increasing of manganese content the intensity of
these bands is increasing showing that the manganese content favorises the formation of TeO4
(tbp) and TeO3 (tp) units
18
200 400 600 800 1000
783
850
768
416
816
752
Wavenumber [cm -1]
Ram
an In
tens
ity [a
u]
13
20
05
0
5
10
35
50
MnO
438
580
660
Fig 49 Raman spectra of xMnOmiddot(100- x)[As2O3middot TeO2] glasses
200 400 600 800 1000
226
294
408
673 751
5
W avenumber [cm -1]
Ram
an In
tens
ity [a
u]
05
20
0
3
10
35
50
1
Fe2O
3
816
752
438
580
Fig 410 Raman spectra of xFe2O3middot(100- x)[As2O3 TeO2] glasses
The Raman spectra of xFe2O3middot(100- x)[As2O3 TeO2] glasses present a significant
advance to the TeO4 (tbp) TeO3+1 polyhedra and AsO3 units represented in Raman spectrum
by the ~ 438 cm-1 band comparative with the modifications determined by the addition of
manganese ions in vitreous matrix For high concentrations of iron ions in xFe2O3middot(100-
x)[As2O3 TeO2] system of glasses the number of As-O-As linkages appear in Raman
spectrum due to stretching vibrations of As-O-As and vibrations of the continuous TeO4 (tbp)
network show a significant decrease
19
419 Comparative study by Raman spectroscopy of xMnOmiddot(100- x)[As2O3middotBO]
vitreous systems were BO =gt TeO2 or PbO
The addition of MnO to xMnOmiddot(100- x)[As2O3middotPbO] glass system do not break As
ndash O ndash As bonds into characteristic units and contribute to their prominence The addition of
manganese ions to xMnOmiddot(100- x)[As2O3middot TeO2] glass system for x=50mol MnO
determined the splitting up of a part of As ndash O ndash As Te-O-Te and the appearance of the
TeO4 (tbp) units against the loss of continuous TeO4 (tbp) network was observed
4110 Comparative study by Raman spectroscopy of xFe2O3middot(100- x)[As2O3middotBO]
vitreous systems where BO =gt TeO2 or PbO
With the increasing of iron ions content in the As2O3middotPbO glass matrix the number of
these structural units decreased due to the increase of the disorder in the studied glasses (x gt 20
mol ) and x = 50 mol Fe2O3 for xFe2O3middot(100- x)[As2O3middotTeO2] when iron ions
brought the structural units existing in glass matrices and favoured the appearace of
new bands due to bending vibrations of As ndash O ndash As
42 Comparative study by FT-IR and Raman spectroscopies of
xMOmiddot(100-x)[3B2O3middotLi2O] glasses where MO =gt MnO or Fe2O3
421 Study by FT-IR spectroscopy of xMOmiddot(100-x)[3B2O3middotLi2O] glasses
where MO =gt MnO or Fe2O3
The infrared absorption spectra obtained for xMOmiddot(1-x)[3B2O3middotLi2O] glass system
where MO =gt MnO or Fe2O3 with 0 le x le 50 mol are presented in figure 411-13 and their
structural assignments are summarized in table 43
500 1000 1500
3B2O3Li2O
Wavenumber [cm-1]
Abs
orpt
ion
[au
]
490
1400
1230
1061
698
614
460 78
6
Fig 411 FT ndash IR spectra of vitreous matrix 3B2O3middotLi2O
20
Following the infrared absorption spectra obtained for 3B2O3middotLi2O vitreous matrix
observed on eight bands ~ 1400 cm-1 ~ 1230 cm-1 ~ 1061 cm-1 ~ 786 cm-1 ~ 698 cm-
1 ~ 614 cm-1 ~ 490 cm-1 şi ~ 460 cm-1 The band at ~ 1400 cm-1 is assigned to
asymmetric stretching vibrations from BOslash3 şi BOslash2O- groups (Oslash represent oxygen atom
bridging two boron atoms) The band at ~ 1230 cm-1 is attributed to asymmetric stretching
vibrations of B ndash O bonds from triangular ortoborate BO 33 groups [23-26]
400 600 800 1000 1200 1400 1600
0
3
5
10
20
35
50
1
Wavenumber [cm-1]
Abs
orpt
ion
[ua
]
05
MnO
490
1400
1230
1061
698
614
460 78
6
Fig 412 FT ndash IR spectra of xMnOmiddot(100-x)[3B2O3middotLi2O] glasses
400 600 800 1000 1200 1400 1600
469
Wavenumber [cm-1]
Abs
orpt
ion
[ua
]
0
3
5
10
20
35
50
1
05
Fe2O3
490
1400
1230
1061
698
614
460 78
6
Fig 413 FT ndash IR spectra of x Fe2O3middot(100-x)[3B2O3middotLi2O] glasses
21
Table 43Wavenumber and the structural assignments of FT ndash IR and Raman
spectra of 3B2O3middotLi2O vitreous matrix
~ [cm 1 ] Attribution
FT ndash IR Raman FT ndash IR Raman
~ 1400 cm-1
~ 1400 cm-1
Asymmetric stretching
vibrations from BOslash3 şi BOslash2O-
groups
BOslash2O- triangles linked to
other borate triangular units
~ 1230 cm-1
Asymmetric stretching
vibrations of B ndash O bonds from
triangular ortoborate
BO 33 groups
~ 1061 cm-1
~ 1074 cm-1
Stretching vibrations of B ndash Oslash
bonds in -4BOslash tetrahedra from
tri- tetra- and penta-borate
groups
Diborate groups
~ 902 cm-1
Vibrations of orthoborate
groups
~ 786 cm-1
~ 791 cm-1
Bending vibrations of O3B ndash O
ndash BO4 bonds
Vibrations of rings with six
member to one or two BO4
tetrahedral from tri- tetra ndash
and penta ndash borate units
~ 698 cm-1
Bending vibrations of B-O-B
bonds from pentaborate groups
~ 614cm-1 Bending vibrations of O ndash B ndash O
bonds
~ 490cm-1 ~ 471cm-1 Bending vibrations of B-O-B
bonds
Isolated diborate groups
~ 460cm-1 Bending vibrations of O ndash B ndash O
bonds
22
The band at ~ 1061 cm-1 is assigned to stretching vibrations of B ndash Oslash bonds in -4BOslash
tetrahedra from tri- tetra- and penta-borate groups and the band at ~ 786 cm-1 is assigned
to bending vibrations of O3B ndash O ndash BO4 bonds The band at ~ 698 cm-1 is attributed to
Bending vibrations of B-O-B bonds from pentaborate groups The bands at ~ 614 cm-1 and
~ 460 cm-1 are assigned to bending vibrations of O ndash B ndash O bonds and the band at ~ 490 cm-
1 is assigned to bending vibrations of B-O-B bonds
From FT-IR spectra it can be concluded that the addition of manganese or iron ions in
vitreous matrices leads to the increase of the disorder degree
Also the structural changes that appeared in 3B2O3middotLi2O vitreous matrix with an
addition MnO or Fe2O3 content can be studied Ar=A4A3 ratio(A4 - relative number of -4BOslash tetrahedral borate units A3 - relative number of triangular (BOslash3 and BOslash2O-) units
0 10 20 30 40 50
010
015
020
Ar
x [mol]
MnO Fe2O3
Fig 414 The evolution of Ar ratio with the MnO or Fe2O3 content of
xMnOmiddot(100-x)[3B2O3middotLi2O] şi xFe2O3middot(100-x)[3B2O3middotLi2O] The evolution of the value of this ratio also allows a visualization of the effects
determined by the presence of the manganese or iron ions in the matrix The value Arltlt 1
indicated that BO3 is dominant related to BO4
422 Study by Raman spectroscopy of xMOmiddot(100-x)[3B2O3middotLi2O] glasses
where MO =gt MnO or Fe2O3
The Raman spectra obtained for xMOmiddot(1-x)[3B2O3middotLi2O] glass system were MO =gt
MnO or Fe2O3 with 0 le x le 50 mol are presented in figure 414-16 and their structural
assignments are summarized in table 43
Studying the Raman spectra of xMOmiddot(1-x)[3B2O3middotLi2O] glass system where MO =gt
MnO or Fe2O3 it has been observed that the absorption bands presented in vitreous matrix
gradually decreased with an increase in the manganese or iron content in both glasses system
which suggested an increase of the disorder in these vitreous systems
23
1000 2000 3000
B2O3Li2O
Wavenumber [cm-1]
Ram
an In
tens
ity [a
u]
1430
107490
279
1471
Fig 415 Raman spectra of vitreous matrix 3B2O3middotLi2O
500 1000 1500 2000 2500 3000
1430
107490
2791
0
Wavenumber [cm-1]
Ram
an In
tens
ity [a
u]
1
3
20
05
5
10
35
50
MnO
471
Fig 416 Raman spectra of xMnOmiddot(100-x)[3B2O3middotLi2O] glasses
400 600 800 1000 1200 1400 1600
Wavenumber [cm-1]
Ram
an In
tens
ity [a
u]
0
1
3
20
05
5
10
35
50
Fe2O3
1430
1074
90279
1
471
Fig 417 Raman spectra of x Fe2O3middot(100-x)[3B2O3middotLi2O] glasses
24
43 Comparative study by electron paramagnetic resonance (EPR) and magnetic
susceptibility measurements of xMOmiddot(100-x)[As2O3middotTeO2] xMOmiddot(100-x)
[As2O3middotPbO] and xMOmiddot(100-x)[3B2O3middotLi2O] glasses where MO =gt MnO or Fe2O3
431 Comparative study by electron paramagnetic resonance (EPR) of
xMnOmiddot(100-x)[As2O3middotBO] where BO =gt TeO2 or PbO
and xMnOmiddot(100-x) [3B2O3middotLi2O] glasses
In order to obtain more information regarding the behavior of manganese ions in
different vitreous matrices [3031] xMnOmiddot(100-x)[As2O3middotBO] where BO =gt TeO2 or PbO
and xMnOmiddot(100-x) [3B2O3middotLi2O] glasses were investigated by EPR spectroscopy on a large
compositional range with 0 le x le 50 mol The EPR spectra of Mn2+ for xMnOmiddot(100-
x)[As2O3middotPbO] (S1) xMnOmiddot(100-x)[As2O3middotTeO2] (S3) and xMnOmiddot(100-x)[3B2O3middotLi2O]
(S5) are presented in figure 418-20 These spectra present two absorption lines centered at gef
43 and gef 20 in all systems
The absorption line centered at gef 43 and is due to isolated Mn2+ ions [32] The
absorption line centered at gef 20 may be attributed to Mn2+ species interacting by magnetic
coupling[33] dipolar and or super exchange the last ones forming magnetic clusters [32]
The evolution of the spectra is easier to follow considering the dependence of
concentration on the EPR parameters the line - intensity (obtained as an integral of the area
under the corresponding EPR signal) J and the line - width ΔB The evolution of J and AB
reflects the structural transformations which appear in the glass matrices due to the increase of
manganese ions content
The intensity and the line - width of the resonance line from gef 43 for all
investigated systems is represented in figure 421(ab)
The intensity of the resonance line from gef 43 for all investigated glass systems
decreases due to the decrease of the isolated manganese ions numbers The line - width from
gef 43 for (S1) and (S3) systems decreases due to decrease of Mn2+ number and to the
structural disorder in glasses with the increase of MnO content For (S5) glass system the line
- width of the resonance line there is an increase in all compositional domains
The intensity of the resonance line from gef 20 can be observed as increasing up to
x=14 mol for (S1) system up to x=8mol for (S3) system and 20 mol for (S5)
system The line - width of the resonance line from gef 20 for (S1) and (S3) systems
increases up to 3 mol and 5mol for (S5) due to Mn2+ species interacting by magnetic
coupling dipole- dipole as the main broadening mechanism Over this concentration line ndash the
width of the resonance line from gef 20 is straight and it can be assumed that the
manganese ions begin to manifest super exchange magnetic interactions
25
1000 2000 3000 4000 5000
Firs
t der
ivat
ive
of a
bsor
ptio
n [u
a]
05
1
3
5
10
20
35
50
x [mol Mn2O3]amplif
B [G]
10
200
40
80
400
5
1
1
Fig 418 The EPR spectra of Mn2+ for xMnOmiddot(100-x)[As2O3middotPbO] (S1)
glass system
1000 2000 3000 4000 5000
Firs
t der
ivat
ive
of a
bsor
ptio
n [u
a]
x [mol MnO]
051
3
5
10
20
35
50
9
500
400
50
100
4
1
amplif
B [G]
1
Fig 419 The EPR spectra of Mn2+ for xMnOmiddot(100-x)[As2O3middotTeO2] (S3)
glass system
26
1000 2000 3000 4000 5000
501
B [G]
Firs
t der
ivat
ive
of a
bsor
ptio
n [u
a]
1
4
9
10
30
60
100
amplif
05
1
3
5
10
20
35
x [mol MnO]
Fe3+
Fig 420 The EPR spectra of Mn2+ for xMnOmiddot(100-x)[3B2O3middotLi2O] (S5)
glass system
0 2 4 6 8 10 12 14 16 18 20 22
x [mol]
J [ u
a]
S1 S3 S5
-2 0 2 4 6 8 10 12 14 16 18 20 22
50
100
150
200
250
300
S1 S3 S5
x [mol]
B
[G]
a b
Fig 421 The dependence on MnO content of the intensity (a) and width(b) of resonance
line at gef 43 for xMnOmiddot(100-x)[As2O3middotPbO] (S1) xMnOmiddot(100-x)[As2O3middotTeO2] (S3) şi
xMnOmiddot(100-x)[3B2O3middotLi2O] (S5) system glasses
27
0 10 20 30 40 50
x [mol]
J [ u
a]
S1 S3 S5
0 10 20 30 40 50
400
500
600
700
800
900
S1 S3 S5
x [mol]
B[G
]
a b
Fig 422 The dependence on MnO content of the intensity (a) and width b) of resonance
line at gef 20 for xMnOmiddot(100-x)[As2O3middotPbO] (S1) xMnOmiddot(100-x)[As2O3middotTeO2] (S3) and
xMnOmiddot(100-x)[3B2O3middotLi2O] (S5) system glasses
Following figure 418-20 it can be observed that (S1) and (S3) have had a similar
evolution but (S5) system presented for 05 le x le 5 mol (fig420) has a hyperfine
sextet[33] at gef 20due to Mn2+ isolated ions
432 Comparative study by magnetic susceptibility measurements of
xMnOmiddot(100-x)[As2O3middotBO] where BO =gt TeO2 or PbO and
xMnOmiddot(100-x)[3B2O3middotLi2O] glasses
The magnetic susceptibility data are in good agreement with the EPR result The
magnetic behavior of the glasses from xMnOmiddot(100-x)[As2O3middotBO] where BO =gt TeO2 (S3)
or PbO (S1) and xMnOmiddot(100-x)[3B2O3middotLi2O] (S5) glasses for 3 le x le 50 mol MnO are
presented in figure 423 - 25
For (S1) and (S3) system glasses up to x 3 mol and x 5 mol (S5) glass
system the temperature dependence of the reciprocal magnetic susceptibility obeys a Curie
law In this concentration range the manganese ions are predominantly isolated orand
participate in dipole-dipole interractions At higher concentrations the reciprocal magnetic
susceptibility obeys a Curie-Weiss law with negative paramagnetic Curie temperature (p)
characteristic to antiferromagnetic coupled ions by means of super exchange interractions(fig
426) This behavior of manganese ions is confirmed by the shape of the EPR spectra
28
100 150 200 250
2
4
6
8
10
12
14
16
18
20
22
T [K]
[
emu
mol
]-1
3 mol 5 mol 10 mol 20 mol 35 mol 50 mol
Fig423 The temperature dependence of -1 for xMnOmiddot(100-x)[As2O3middotPbO]
(S1) 3 le x le 50 mol
50 100 150 200 2500
2
4
6
8
10
12
14
16
18
20
22
3 mol 5 mol 10 mol 20 mol 35 mol 50 mol
T [K]
[
emu
mol
]-1
Fig424 The temperature dependence of -1 for xMnOmiddot(100-x)[ As2O3middotTeO2]
(S1) 3 le x le 50 mol
100 150 200 250
2
4
6
8
10
12
14
16
18
20
22
[em
u m
ol]-1
T [K]
3 mol 5 mol 10 mol 20 mol 35 mol 50 mol
Fig425 The temperature dependence of -1 for xMnOmiddot(100-x)[3B2O3middotLi2O]
(S5) 3 le x le 50 mol
29
0 10 20 30 40 50
0
20
40
60
80
100
x [mol]
-p [K
]
(S1) (S3) (S5)
Fig426Concentration dependence of (p) for sistemele xMnOmiddot(100-x)[As2O3middotPbO]
(S1) xMnOmiddot(100-x)[As2O3middotTeO2] (S3) şi xMnOmiddot(100-x)[3B2O3middotLi2O] (S5)
Using the representation 1 =f(T) the molar Curie constants CM the effective
magnetic moments and molar fraction of Mn2+(x1) şi Mn3+(x2) ions were calculated and
represented in tables 44 -6
Tabel 44 Molar Curie constants effective magnetic moments and molar fraction of Mn2+(x1) şi Mn3+(x2) ions in xMnOmiddot(100-x)[As2O3middotPbO] (S1) glasses
x
[mol MnO2] CMtimes102
[emu mol] ef
[microB] x1
[mol Mn2+O2] x2
[mol Mn3+O2] 3 1272 582 268 032 5 1979 562 343 157 10 3777 549 555 445 20 6688 517 492 1508 35 12239 502 377 3123 50 15427 496 268 4732
Tabel 45 Molar Curie constants effective magnetic moments and molar fraction of Mn2+(x1) şi Mn3+(x2) ions in xMnOmiddot(100-x)[As2O3middotTeO2] (S3)glasses
x
[mol MnO2] CMtimes102
[emu mol] ef
[microB] x1
[mol Mn2+O2] x2
[mol Mn3+O2] 3 1297 588 287 013 5 1938 556 312 188 10 3804 551 575 425 20 6766 52 549 1451 35 11148 504 441 3059 50 15528 498 358 4642
30
Tabel 46 Molar Curie constants effective magnetic moments and molar fraction of Mn2+(x1) şi Mn3+(x2) ions in xMnOmiddot(100-x)[3B2O3middotLi2O] (S5) glasses
x
[mol MnO2] CMtimes102
[emu mol] ef
[microB] x1
[mol Mn2+O2] x2
[mol Mn3+O2] 3 127 581 265 035 5 1919 554 303 197 10 3681 542 486 514 20 7215 519 53 147 35 1121 506 505 2995 50 15898 501 493 4507
433 Comparative study by electron paramagnetic resonance (EPR) of
xFe2O3middot(100-x)[As2O3middotBO] where BO =gt TeO2 or PbO and
x Fe2O3middot(100-x) [3B2O3middotLi2O] glasses
In order to obtain more information regarding the behavior of iron ions in
xFe2O3middot(100-x)[As2O3middotBO] where BO =gt TeO2 (S4) or PbO (S2) şi xFe2O3middot(100-
x)[3B2O3middotLi2O] glasses were investigated by EPR spectroscopy on a large compositional
range with 05 le x le 35 mol Fe2O3 The EPR spectra of Fe3+ in xFe2O3middot(100-
x)[As2O3middotPbO] (S2) xFe2O3middot(100-x)[As2O3middotTeO2] (S4) and xFe2O3middot(1-x)[3B2O3middotLi2O]
(S6) are presented in figure 427-29 These spectra present two absorption lines centered at
gef 43 and gef 20 up to x le 35mol Fe2O3 systems studied
The absorption line centered at gef 43 is due to isolated Fe3+ ions [34-36] The
absorption line centered at gef 20 may be attributed to Fe3+ species interacting by magnetic
coupling dipolar and or super exchange the last ones forming magnetic clusters [37-41]
The evolution of the spectra is easier to follow considering the dependence of
concentration on the EPR parameters the line - intensity (obtained as an integral of the area
under the corresponding EPR signal) J and the line - width ΔB The evolution of J and AB
reflects the structural transformations which appear in the glass matrices due to the increasing
of iron ions content
The intensity and the line - width of the resonance line from gef 43 for all
investigated systems is represented in figure 430 (a b) The intensity of the resonance line
from gef 43 increases for (S2) and (S4) up to 3 mol and up to 5 mol for (S6) then
decreases for all systems investigated A line broadening up to 3 mol from gef 43 for
these systems can be observed due to increasing of Fe3+ isolated number of ions
31
1000 2000 3000 4000 5000
40
Firs
t der
ivat
ive
of a
bsor
ptio
n [u
a]
B [G]
x [mol Fe2O3]
05
1
3
5
1020
35 2
40
20
10
10
10
amplif
Fig427 The EPR spectra of Fe3+ for xFe2O3middot(100-x)[As2O3middotPbO] (S2)
glass system
1000 2000 3000 4000 5000
100
B [G]
Firs
t der
ivat
ive
of a
bsor
ptio
n [u
a]
10080
20
50
20
20
3
05
1
5
102035
x [mol Fe2O3] amplif
Fig428 The EPR spectra of Fe3+ for xFe2O3middot(100-x)[As2O3middotTeO2] (S4)
glass system
32
1000 2000 3000 4000 5000
Firs
t der
ivat
ive
of a
bsor
ptio
n [u
a]
B [G]
3
05
1
5
10
20
35
x [mol Fe2O3]
30
50
20
20
10
30
30
amplif
Fig429 The EPR spectra of Fe3+ for xFe2O3middot(100-x)[3B2O3middotLi2O] (S6)
glass system
The intensity and the line - width of the resonance line from gef 43 for all
investigated systems is represented in figure 430 (a b)The resonance line from gef 20 is
attributed to Fe3+ ions that interact by magnetic coupling dipolar orand super exchange
interractions can be observed in all compositional domains
The intensity of the resonance line from gef 20 can be observed as increasing up to
x=35 mol for (S2) and (S6) system and 10 mol for (S4) system with increased iron
ions content The line - width of the resonance line from gef 20 increased up to 10mol
for (S2) system and up to 3 mol for (S4) and 5mol for (S6) due to Fe3+species
interacting by magnetic coupling dipole-dipole Above this concentration line - width of the
resonance line from gef 20 can be attributed to dipolar and super exchange magnetic
interactions The ΔB = f(x) dependence reflects the competion between the broadening
mechanism (dipole ndash dipole interactions the interactions between ions in diferent
valence state and structural disorder) and the narrowing ones (super exchange
interactions)
33
0 5 10 15 20 25 30 35 40
x [mol]
J [ u
a]
S2 S4 S6
a)
0 5 10 15 20 25 30 35 4040
60
80
100
120
140
160
180
200
220 S2 S4 S6
B[G
]
x [mol]
a b
Fig 430 The dependence on Fe2O3 content of the intensity (a) and width (b) of
resonance line at gef 43 for xFe2O3middot(100-x)[As2O3middotPbO] (S2)
xFe2O3middot(100-x)[As2O3middotTeO2] (S4) and xFe2O3middot(100-x)[3B2O3middotLi2O] (S6) glasses
0 5 10 15 20 25 30 35 40
x [mol]
J [ u
a]
S2 S4 S6
a)
0 5 10 15 20 25 30 35 40
200
400
600
800
1000
1200
1400
1600
x [mol]
B
[G] S2
S4 S6
a b
Fig 431 The dependence on Fe2O3 content of the intensity (a) and width (b) of
resonance line at gef 20 for xFe2O3middot(100-x)[As2O3middotPbO] (S2)
xFe2O3middot(100-x)[As2O3middotTeO2] (S4) and xFe2O3middot(100-x)[3B2O3middotLi2O] (S6) glasses
34
434 Comparative study by magnetic susceptibility measurements of
xFe2O3middot(100-x)[As2O3middotBO] where BO =gt TeO2 or PbO and
xFe2O3middot(100-x) [3B2O3middotLi2O] glasses
The magnetic susceptibility data are in good agreement with the EPR result The magnetic
behavior of the glasses xFe2O3middot(100-x)[As2O3middotPbO] (S2) xFe2O3middot(100-x)[As2O3middotTeO2]
(S4) and xFe2O3middot(100-x)[3B2O3middotLi2O] (S6) for 3 x 50 mol Fe2O3 are presented in
figure 432 - 34
For (S2) glass systems up to x 10 mol x 3 mol (S5) glass systems and x 5
mol (S6) glass systems the temperature dependence of the reciprocal magnetic susceptibility
obeys a Curie law In this concentration range the iron ions are predominantly isolated orand
participate in dipole-dipole interactions At higher concentrations the reciprocal magnetic
susceptibility obeys a Curie-Weiss law with negative paramagnetic Curie temperature (p)
characteristic to antiferromagnetic coupled ions by means of super exchange interactions(fig
435) This behavior of iron ions is confirmed by the shape of the EPR spectra
80 100 120 140 160 180 200 220 240 260 2800
1
2
3
4
5
6
7
8
9
10
11
[
emu
mol
]-1
T [K]
3 mol 5 mol 10 mol 20 mol 35 mol 50 mol
Fig432 The temperature dependence of -1 for xFe2O3middot(100-x)[As2O3middotPbO] (S2)
3 x 50 mol
35
80 100 120 140 160 180 200 220 240 260 2800
1
2
3
4
5
6
7
8
9
10
T [K]
[
emu
mol
]-1
3 mol 5 mol 10 mol 20 mol 35 mol 50 mol
Fig433 The temperature dependence of -1 for xFe2O3middot(100-x)[As2O3middotTeO2] (S4)
3 x 50 mol
80 100 120 140 160 180 200 220 240 260 2800
1
2
3
4
5
6
7
8
9
10
11
3 mol 5 mol 10 mol 20 mol 35 mol 50 mol
T [K]
[
emu
mol
]-1
Fig434 The temperature dependence of -1 for xFe2O3middot(100-x)[3B2O3middotLi2O] (S6)
3 x 50 mol
36
0 10 20 30 40 50
0
10
20
30
40
50
x [mol]-
p [K]
(S2) (S4) (S6)
Fig435Concentration dependence of (p) for sistemele xFe2O3middot(100-x)[As2O3middotPbO] (S2) xFe2O3middot(100-x)[As2O3middotTeO2] (S4) and xFe2O3middot(100-x)[3B2O3middotLi2O] (S6)
for 3 x 50 mol Fe2O3
Using the representation 1 = f(T) the molar Curie constants CM the effective
magnetic moments and molar fraction of Fe3+(x1) şi Fe2+(x2) ions were calculated and
represented in tables 47-9
Table 47 Molar Curie constants effective magnetic moments and molar fraction of
Fe3+(x1) şi Fe2+(x2) ions in xFe2O3middot(100-x)[As2O3middotPbO] glasses (S2)
x [mol Fe2O3]
CMtimes102
[emu mol] ef
[microB] x1
[mol Fe23+O3]
x2 [mol Fe2
2+O3] 3 2526 58 261 039 5 393 56 332 168 10 7326 541 476 524 20 13459 519 53 147 35 23364 516 829 2671 50 32154 507 767 4233
Table 48 Molar Curie constants effective magnetic moments and molar fraction of
Fe3+(x1) şi Fe2+(x2) ions in xFe2O3middot(100-x)[As2O3middotTeO2] glasses (S4)
x [mol Fe2O3]
CMtimes102
[emu mol] ef
[microB] x1
[mol Fe23+O3]
x2 [mol Fe2
2+O3] 3 2571 585 277 023 5 4016 566 363 137 10 7911 562 686 314 20 14992 521 643 929 35 22676 509 601 2899 50 30959 497 313 4687
37
Table 49 Molar Curie constants effective magnetic moments and molar fraction of Fe3+(x1) şi Fe2+(x2) ions in xFe2O3middot(100-x)[3B2O3middotLi2O] glasses (S6)
The results allowed to consider that the magnetic properties of the studied glasses can
be explained through magnetic interractions between Fe3+ - Fe3+ Fe3+- Fe2+ and Fe2+- Fe2+ that
explain the dependences of RPE parameters concentration
SELECTED CONCLUSIONS
In this thesis xMOmiddot(100-x)[As2O3middotTeO2] xMOmiddot(100-x) [As2O3middotPbO] and
xMOmiddot(100-x)[3B2O3middotLi2O] glasses where MO =gt MnO or Fe2O3 were comparatively
studied in 0 le x le 50 mol The structural modifications of investigated glass matrices were
comparatively followed in function of the manganese or iron ions on the investigated glass
matrices were followed
The study by FT-IR spectroscopy shows that the evolution of the spectra of
xMnOmiddot(100-x) [As2O3middotPbO] with the addition and the increasing of the MnO content suggest
that the manganese ions break up a part of As ndash O ndash As Pb ndash O ndash Pb and probably of As ndash O ndash
Pb bonds The addition of MnO in the As2O3middotPbO glass matrix is leading to a disordering of
the glasses structure with the increasing of the MnO content
The evolution of the absorption bands for FT ndash IR spectrum of xFe2O3middot(1-x)
[As2O3middotPbO] glasses are determined by the addition of Fe2O3 content It can be observed to
shift the bands assigned As ndash O ndash As vibrations from AsO3 units due to changing to length As
ndash O ndash As bonds and interne angles of AsO3 units disappears PbO4 units and appears FeO6
units The addition of Fe2O3 in the As2O3middotPbO glass matrix determined a disordering of the
glasses structure with the increasing of the Fe2O3 content
From FT-IR absorption spectra of the investigated xMOmiddot(100-x)[As2O3middotTeO2] glasses
system where MO =gt MnO or Fe2O3 it can be observed that the addition and increasing of
manganese ions concluded the contraction of As-O-As bonds from totally symmetric
x [mol Fe2O3]
CMtimes102
[emu mol] ef
[microB] x1
[mol Fe23+O3]
x2 [mol Fe2
2+O3] 3 2542 582 268 032 5 3943 561 338 162 10 7423 544 506 494 20 13568 520 549 1451 35 23094 513 731 2769 50 31746 503 584 4416
38
stretching vibrations of AsO3 units for x ge10 mol there can be an increase in number of As-
O-As bonds from AsO3 units orand a length these linkage to doubly degenerate stretching
vibrations of AsO3 units and a stretching vibration mode of TeO3 tp with NBO It can be
remarked from the FT-IR absorption spectra the gradual transformation of symmetric
stretching vibration mode of Te-O bonds from TeO3 units in TeO4 (tbp) units and the presence
of MnO2 units Once with the addition of iron ions the xFe2O3middot(100- x)[As2O3middotTeO2]
glasses behave like xMnOmiddot(100-x)[As2O3middotTeO2] glasses but in this system the
appearance of FeO6 units can be seen
From FT-IR spectra in xMOmiddot(100-x)[3B2O3middotLi2O] glasses where MO =gt MnO or
Fe2O3 can be concluded that the addition of manganese or iron ions in vitreous matrices leads
to the increase of the disorder degree
The study by Raman spectroscopy shows that the evolution of the spectra the addition
of MnO in the [As2O3middotPbO]glass matrix determined an order degree of the vitreous matrix
The intensity of the bands attributed vibrations As ndash O ndash As bonds from As2O units and
bending vibrations of As ndash O ndash As from As2O units shift to a higher wave length that suggests
an increase in the As2O units comparative to AsO3 units With the increase of iron ions content
in the As2O3middotPbO glass matrix the number of these structural units decreases due to the
increasing of the disorder in the studied glasses
With the increasing of manganese content in As2O3TeO2 glass matrix the intensity
of these bands is increasing showing that the manganese content favorites the formation of
TeO4 (tbp) and TeO3 (tp) units For high concentrations of iron ions in xFe2O3middot(100-
x)[As2O3 TeO2] system of glasses the number of As-O-As linkages appear in Raman
spectrum due to stretching vibrations of As-O-As and vibrations of the continuous TeO4 (tbp)
network show a significant decrease
Studying the Raman spectra of xMOmiddot(1-x)[3B2O3middotLi2O] glass system where MO =gt
MnO or Fe2O3 it has been observed that the absorption bands presented in vitreous matrix
gradually decreased with an increase in the manganese or iron content in both glasses system
which suggested an increase of the disorder in these vitreous systems
The EPR spectra presents the behavior of manganese or iron ions in different vitreous
matrices xMOmiddot(100-x)[As2O3middotBO] where MO=gtMnO or Fe2O3 and BO =gt TeO2 or
PbO and xMOmiddot(100-x) [3B2O3middotLi2O] Glasses were investigated by EPR spectroscopy on a
large compositional range with 0 le x le 50 mol The absorption line centered at gef 43 and
is due to isolated Mn2+ ions The absorption line centered at gef 20 may be attributed to
Mn2+ species interacting by magnetic coupling dipolar and or super exchange the last ones
forming magnetic clusters The EPR spectra of Fe3+ in xFe2O3middot(100-x)[As2O3middotPbO]
xFe2O3middot(100-x)[As2O3middotTeO2] and xFe2O3middot(1-x)[3B2O3middotLi2O] are presented two absorption
lines centered at gef 43 and gef 20 up to x le 35mol Fe2O3 systems studied
39
The absorption line centered at gef 43 is due to isolated Fe3+ ions The absorption
line centered at gef 20 may be attributed to Fe3+ species interacting by magnetic coupling
dipolar and or super exchange the last ones forming magnetic clusters
The evolution of the spectra is easier to follow considering the dependence of
concentration on the EPR parameters the line - intensity (obtained as an integral of the area
under the corresponding EPR signal) J and the line - width ΔB The evolution of J and AB
reflects the structural transformations which appear in the glass matrices due to the increase of
manganese ions content
The magnetic susceptibility data are in good agreement with the EPR result The
magnetic behavior of the glasses from xMnOmiddot(100-x)[As2O3middotBO] where BO =gt TeO2 (S3)
or PbO (S1) and xMnOmiddot(100-x)[3B2O3middotLi2O] (S5) glasses for 3 le x le 50 mol MnO
For (S1) and (S3) system glasses up to x 3 mol and x 5 mol (S5) glass
system the temperature dependence of the reciprocal magnetic susceptibility obeys a Curie
law In this concentration range the manganese ions are predominantly isolated orand
participate in dipole-dipole interractions At higher concentrations the reciprocal magnetic
susceptibility obeys a Curie-Weiss law with negative paramagnetic Curie temperature (p)
characteristic to antiferromagnetic coupled ions by means of super exchange interractions This
behavior of manganese ions is confirmed by the shape of the EPR spectra Using the
representation 1 =f(T) the molar Curie constants CM the effective magnetic moments
and molar fraction of Mn2+(x1) şi Mn3+(x2) ions were calculated The magnetic susceptibility
data are in good agreement with the EPR result
The magnetic behavior of the glasses xFe2O3middot(100-x)[As2O3middotPbO] (S2)
xFe2O3middot(100-x)[As2O3middotTeO2] (S4) and xFe2O3middot(100-x)[3B2O3middotLi2O] (S6) for 3 x 50
mol Fe2O3 are presented For (S2) glass systems up to x 10 mol x 3 mol (S5)
glass systems and x 5 mol (S6) glass systems the temperature dependence of the
reciprocal magnetic susceptibility obeys a Curie law In this concentration range the iron ions
are predominantly isolated orand participate in dipole-dipole interactions At higher
concentrations the reciprocal magnetic susceptibility obeys a Curie-Weiss law with negative
paramagnetic Curie temperature (p) characteristic to antiferromagnetic coupled ions by
means of super exchange interactions(fig 435) This behavior of iron ions is confirmed by the
shape of the EPR spectra Using the representation 1 = f(T) the molar Curie constants
CM the effective magnetic moments and molar fraction of Fe3+(x1) şi Fe2+(x2) ions were
calculated
40
REFERENCES
Chapter 1
[1] I Ardelean bdquoIntroducere icircn studiul materialelor oxidice cu structură vitroasă EdNapocaStar Cluj Napoca 2002 [2] G Srinivasarao N Veeraiah J All Com 327 52-65(2001) [3] G Srinivasarao N Veeraiah J Phys Chem Solids 63705-717(2002) [4] DBecherescu VCristea FMarx IMenessz FWinter Chimia stării solide Ed Şt şi Encicl Bucucureştivol 1 1983 [5] J Wong CAAngell Glass-Structure by Spectroscopy Dekker Inc New York 1976 [6] BEWarren HKKrutter O Morningstat J Am Ceram Soc 19 202 (1936) [7] LLSperry JD Mackenzie Phys Chem Glasses 9 91 (1968) [8] WLKonijnendijk JMStevels J Non-Cryst Solids 18 307 (1975) [9] FCEversteyn JM Stevels HJ Naterman Phys Chem Glasses 1 134 (1963) [10] G Fuxi Optical and Spectroscopie Properties of Glass Springer-Verlag Shanghai Scientific Technical Pub Shanghai 1991 [11] YDYiannopoulos GDChryssikos EIKamitsos Phys Chem Glasses 42(3) 164 (2001) [12] MGFerreira da Silva BFOCosta J Non-Cryst Solids 293-295 534 (2001) [13] RYordanova YDimitriev VDimitriev S Kassabov DKlissurski JNon-Cryst Solids 201 141 (1996) [14] W L Konijnendijk J M Stevels J Non-Cryst Solids 18 307 (1980) [15] M Iron M Couzi ALevasseur JBrethous JSolidState Chem 31 285 (1980) [16] TFurukawa WBWhite PhzsChemGlasses 21 85 (1980) [17] E I Kamitsos M A Karakassides GD Chryssikos J Phys Chem 90 4528 (1986) [18] E I Kamitsos M A Karakassides GD Chryssikos J Phys Chem 91 1073 (1987) [19] TWBril Philips Res Rep Suppl 2 117 (1976) [20] E I Kamitsos M A Karakassides GD Chryssikos J Phys Chem 30 203 (1989) [21] BNMeera JRamakrishna J Non-Cryst Solids 159 1 (1993) [22] KWitke THubert PReich JRamanSpectr 24 407 (1993) [23] E I Kamitsos M A Karakassides Phys Chem Glasses 30 19 (1989) [24] MPeteanu Teză de doctoratrdquo Universitatea Babeş-Bolyairdquo Cluj Napoca (1989) [25] PCTaylor PJBray JPhys Chem Solids 33 43 (1972) [26] IArdelean MPeteanu GhIlonca DPop Solid State Commun 33 653 (1980) [27] AV De Wijn RE Van Balderen JKemPhys 46 4 (1967) [28] DL Griscom RE Griscom J Phys Chem Glasses 12 19 (1971) [29] JWH Schreurs JChem Phys 69 2151 (1978) [30] AlNicula M Peteanu IArdelean Studia Univ Babeş-Bolyai Physica 2 65 (1979) [31] M Peteanu IArdelean SFilip ITodor GSalvan Studia Univ Babeş-Bolyai Physica XL 2 9 (1995) [32] IArdelean M Peteanu SFilipV Simon ITodor Solid State Commun 105 (5) 339 (1998) [33] SKMendiratta EGuedes de Sousa JMatSci Lett7 733 (1988) [34] IArdelean M Peteanu SFilip V Simon GGyorffy Solid State Commun 102 (4) 341 (1997) [35] IArdelean M Peteanu SFilip V Simon FCiorcas ITodor JMagnMagn Mat 196-197 257 (1999) [36] JKliava RBerger YServant JEmery JMGreneche JTrokss J Non-Cryst Solids 202 205 (1996) [37] LDBogomolova NA Krasilnikova VLBogdanov VDKhaliev VV Mitrofanov J Non-Cryst Solids 188 130 (1995) [38] DLoveridge SPark PhysChem Glasses 12 19 (1971) [39] IArdelean G Salvan M Peteanu V Simon FCiorcas Mod PhysLett B 13 (22-23) 801 (1999)
41
[40] JLRao AMuraly EDRao J Non-Cryst Solids 202 215 (1996) [41] CPrakash S Husain RJ Singh SMollah JAlloys Compon 326 47 (2001) [42] EGuedes de Sousa SKMendiratta JMMachado Da Silva Portugal Phys 17 (3-4) 203 (1986) [43] TCastner GSNewell WCHolton CP Slichter JChem Phys 32 668 (1960) [44] SPChaudhuri SKPatra JMatSci 35 4735 (2000) [45] IArdelean HH Qiu HSakata Matt Lett 32 335 (1997) Chapter 2 [1] J Wong C A Angel Glass Structure by Spectroscopy Marcel Dekker inc New-York 1976 [2] I Ardelean bdquoIntroducere icircn studiul materialelor oxidice cu structură vitroasă EdNapocastar Cluj-Napoca 2002 [3] N Avram GH Mateescu Spectroscopia icircn infraroşu Aplicaţii icircn chimia organică Ed Tehnică Bucureşti 1968 [4] TIliescu Spectroscopie optică moleculară vibraţională şi electronică Ed Casa Cărţii de Ştiinţă Cluj- Napoca 2000 [5] S Aştilean bdquoMetode şi tehnici moderne de spectroscopie optică Ed Casa Cărţii de Ştiinţă Cluj - Napoca 2002 p 5 [6] I Ursu Rezonanţă Electronică de Spinrdquo Ed AcademieiBucureşti (1965) [7] CHHurd ContempPhys 23 (5) 469 (1982) [8] GWAnderson WDCompton JChemPhys52 6166 (1970) [9] MS Seehra GSrinivasan Landolt-Bornstein (New Series) SubVolume F3 Springer-Verlag Berlin 1994 [10] GToulouse ContempPhys 2115 (1977) [11] NMMurayMagnetic susceptybility EdInterscience New York P1773 1963 [12] JBGoodenough Magnetism and Chemical Bond EdInterscience New York 1963 [13] IArdelean G Salvan M Peteanu V Simon FCiorcas Mod PhysLett B 13 (22-23) 801 (1999) [14] IArdelean MPeteanu R Ciceo Lucăcel Studii de rezonanţă paramagnetică electronică şi magnetice ale unor ioni 3d icircn sticle pe bază de B2O3 Ed Presa Univesitară Clujeană 2005 [15] IArdelean PhysStatSol (b) 87K137 (1978) [16] IArdelean Solid State Commun 31 75 (1979) [17] EJFrieble LKWilson AWDozier DLKinser PhysStatSol (b) 45 323 (1971) [18] DWMoon JMAitken RKMcCrone GS Ciloszik PhysChe Glasses 16 (5) 91 (1975) [19] SFilip Teză de doctorat UnivBabeş-Bolyai Cluj Napoca 1996 [20] CJSchinkel GWRathenou Physics of Non-Crystaline Solids North Holland Publ Co Amsterdam 215 1965 [21] EJFrieble LKWilson NCKoon DLKinser JAm Ceram Soc 57-237 (1974) [22] RJLandry JT Fournier CGYoung JChemPhys 46 1285 (1967) [23] WSimpson PhysStatSolidi b40 207 (1970) [24] RHasegawa PhysRevB b(5) 1631 (1971) [25] IArdelean GhIlonca MPeteanu Solid State Commun 52 145 (1984) [26] IArdelean GhIlonca OCozar J Physique 49 C8 1107 (1988) Chapter 3 [1] LFBates Modern Magnetism p133 Cambridge University Press London 1962 [2] IArdelean GhIlonca DBarbos Solid State Commun 40 769 (1981) [3] EBurzo IUrsu DUngur IArdelean JMatSci 15 581 (1980) [4] EBurzo IUrsu DUngur IArdelean MatResBull 15 1273 (1980) [5] DLGriscom Glass Science and Technology 48 151 (1990) [6] PJBray AH Silver Modern aspects of the vitreous state vol1 Butterworth
42
London 1960 [7] IArdelean Teza de doctorat UnivBabeş-Bolyai Cluj Napoca 1979 [8] SAştilean bdquoMetode şi tehnici moderne de spectroscopie opticărdquo EdCasa Cărţii de Ştiinţă Cluj ndash Napoca 2002 p5 [9] IArdelean RCiceo-Lucăcel ldquoFizica şi Tehnologia Materialelor Oxidice Lucrări Practicerdquo Ed Univ ldquoBabeş-Bolyairdquo Cluj-Napoca 2000 [10] VPop IChicinaş NJumate Fizica materialelor Metode experimentalerdquo EdPresa Universitară Clujeană 2001 [11] IUrsu Rezonanţă electronică de spinrdquo EdAcademiei Bucureşti 1965 Chapter 4 [1] I Ardelean S Lupşor D Rusu Solid State Sci 10 1384(2008) [2] I Ardelean S Lupşor D Rusu trimis spre publicare la Physica B decembrie 2009 [3] P Tarte Spectrochim Acta 18 467 (1962) [4] R A Condrate J Non ndash Cryst Solids 84 26 (1986) [5] G Srinivasarao N Veeraiah Phys Stat Sol (a) 191 370(2002) [6] G Srinivasarao N Veeraiah J Phys Chem Solids 63 705(2002) [7] G Srinivasarao N Veeraiah J All Com 327 52 (2001) [8] DK Durga N Veeraiah Bull Mater Sci 24 (4) 421 (2001) [9] F F Bentley L D Smithson A L Rozek InfraredndashSpectra and Characteristic Frequencies 700-300 cm-1 Interscience New York 1968 p 103 [10] O Noguera T Merle-Mejean AP Mirgorodsky MB Smirnov P Thomas J-C Champarnaud-Mesjard J Non-Cryst Solids 330 50 (2003) [11] BVR Chowdari KL Tan Fang Ling Solid State Ionics 113 ndash 115 711(1998) [12] C Jiang J Zhang H Mao F Gan Glass Technol 39(6) 200(1998) [13] MR Sahar K Sulhadi MS Rohani J Mater Sci 42 824(2007) [14] C Horea D Rusu I Ardelean J Mater Sci Mater Electron 20 905(2009) [15] GE Rachkovskaya GB Zakharevich J Appl Spectrosc 74 86(2007) [16] I Ardelean S Lupşor D Rusu trimis spre publicare la Journal of Materials Science Materials in Electronics decembrie 2009 [17] I Ardelean S Lupşor D Rusu trimis spre publicare la Modern Physics Letters B decembrie 2009 [18] R Iordanova Y Dimitriev V Dimitrov S Kassabov D Klissurski J Non ndash Cryst Solids 231 227 (1998) [19] R Iordanova Y Dimitriev S Kassabov D Klissurski J Non ndash Cryst Solids 204 141 (1996) [20] J O Jensen S J Gilliam A Banerjee D Zeroka S J Kirkby C N Merrow J Mol Struct (Theochem) 664 145 (2003) [21] G N Papatheodorou S A Solin Solid State Commun 16 5 (1975) [22] BVR Chowdari KL Tan Fang Ling J Mat Sci 35 2015 (2000) [23] R C Lucacel C Marcus V Timar I Ardelean Solid State Sci 9 850 (2007) [24] CP Varsamis EI Kamitsos GD Chryssikos Solid State Ionics 136ndash137 1031 (2000) [25] Sherief M Abo-Naf Fatma H El Batal Moenis A Azooz Mat Chem Phys 77 846 (2002) [26] SG Motke SP Yawale SS Yawale Bull Mater Sci 25 (10) (2002) [27] R Akagi N Ohtori N Umesaki J Non ndash Cryst Solids 293 471(2001) [28] E I Kamitsos M A Karakassides G D Chryssikos J Phys Chem 91(5) 1073 (1987) [29] H Ushida Y Iwadate T Hattori S Nishiyama K Fukushima Y Ikeda M Yamaguchi M Misawa T Fukunaga T Nakazawa S Jitsukawa J Alloys Compd 377 167 (2004) [30] I Ardelean F Ciorcas M Peteanu S Lupşor G Salvan Balkan Phys Lett 5 860 (1997)
43
[31] I Ardelean M Peteanu V Simon O Cozar F Ciorcas S Lupşor J Magn Magn Mater 196 253 (1999) [32] IArdelean MPeteanu GhIlonca Phys Stat Sol (a) 58 K33(1980) [33] IArdelean MPeteanu R Ciceo-Lucăcel ldquoStudii de rezonanţă paramagnetică electronică şi magnetice ale unor ioni 3d icircn sticle pe bază de B2O3rdquo Ed Presa Univ Clujeană Cluj Napoca 2005 p 171 [34] JLRao AMuraly EDRao J Non-Cryst Solids 202 215 (1996) [35] RPSChakradhar AMurali JLRao Optical Mat 10 109 (1998) [36] IArdelean MPeteanu SFilip VSimon GGyorffy Solid State Commun 102(4) 341 (1997) [37] IArdelean MPeteanu VSimon SFilip FCiorcaş ITodor J Magn Magn Mat 196-197 257 (1999) [38] IArdelean GSalvan MPeteanu VSimon CHimcinschi FCiorcas Mod Phys Lett B 13(22-23) 801 (1999) [39] IArdelean HHQiu HSakata Mat Lett 32 335 (1997) [40] SPChaudhuri SKPatra J Mat Sci 35 4735 (2000) [41] I Ardelean M Peteanu V Simon G Salvan J Mat Sci Technol 18 (3) 1 (2002)

18
200 400 600 800 1000
783
850
768
416
816
752
Wavenumber [cm -1]
Ram
an In
tens
ity [a
u]
13
20
05
0
5
10
35
50
MnO
438
580
660
Fig 49 Raman spectra of xMnOmiddot(100- x)[As2O3middot TeO2] glasses
200 400 600 800 1000
226
294
408
673 751
5
W avenumber [cm -1]
Ram
an In
tens
ity [a
u]
05
20
0
3
10
35
50
1
Fe2O
3
816
752
438
580
Fig 410 Raman spectra of xFe2O3middot(100- x)[As2O3 TeO2] glasses
The Raman spectra of xFe2O3middot(100- x)[As2O3 TeO2] glasses present a significant
advance to the TeO4 (tbp) TeO3+1 polyhedra and AsO3 units represented in Raman spectrum
by the ~ 438 cm-1 band comparative with the modifications determined by the addition of
manganese ions in vitreous matrix For high concentrations of iron ions in xFe2O3middot(100-
x)[As2O3 TeO2] system of glasses the number of As-O-As linkages appear in Raman
spectrum due to stretching vibrations of As-O-As and vibrations of the continuous TeO4 (tbp)
network show a significant decrease
19
419 Comparative study by Raman spectroscopy of xMnOmiddot(100- x)[As2O3middotBO]
vitreous systems were BO =gt TeO2 or PbO
The addition of MnO to xMnOmiddot(100- x)[As2O3middotPbO] glass system do not break As
ndash O ndash As bonds into characteristic units and contribute to their prominence The addition of
manganese ions to xMnOmiddot(100- x)[As2O3middot TeO2] glass system for x=50mol MnO
determined the splitting up of a part of As ndash O ndash As Te-O-Te and the appearance of the
TeO4 (tbp) units against the loss of continuous TeO4 (tbp) network was observed
4110 Comparative study by Raman spectroscopy of xFe2O3middot(100- x)[As2O3middotBO]
vitreous systems where BO =gt TeO2 or PbO
With the increasing of iron ions content in the As2O3middotPbO glass matrix the number of
these structural units decreased due to the increase of the disorder in the studied glasses (x gt 20
mol ) and x = 50 mol Fe2O3 for xFe2O3middot(100- x)[As2O3middotTeO2] when iron ions
brought the structural units existing in glass matrices and favoured the appearace of
new bands due to bending vibrations of As ndash O ndash As
42 Comparative study by FT-IR and Raman spectroscopies of
xMOmiddot(100-x)[3B2O3middotLi2O] glasses where MO =gt MnO or Fe2O3
421 Study by FT-IR spectroscopy of xMOmiddot(100-x)[3B2O3middotLi2O] glasses
where MO =gt MnO or Fe2O3
The infrared absorption spectra obtained for xMOmiddot(1-x)[3B2O3middotLi2O] glass system
where MO =gt MnO or Fe2O3 with 0 le x le 50 mol are presented in figure 411-13 and their
structural assignments are summarized in table 43
500 1000 1500
3B2O3Li2O
Wavenumber [cm-1]
Abs
orpt
ion
[au
]
490
1400
1230
1061
698
614
460 78
6
Fig 411 FT ndash IR spectra of vitreous matrix 3B2O3middotLi2O
20
Following the infrared absorption spectra obtained for 3B2O3middotLi2O vitreous matrix
observed on eight bands ~ 1400 cm-1 ~ 1230 cm-1 ~ 1061 cm-1 ~ 786 cm-1 ~ 698 cm-
1 ~ 614 cm-1 ~ 490 cm-1 şi ~ 460 cm-1 The band at ~ 1400 cm-1 is assigned to
asymmetric stretching vibrations from BOslash3 şi BOslash2O- groups (Oslash represent oxygen atom
bridging two boron atoms) The band at ~ 1230 cm-1 is attributed to asymmetric stretching
vibrations of B ndash O bonds from triangular ortoborate BO 33 groups [23-26]
400 600 800 1000 1200 1400 1600
0
3
5
10
20
35
50
1
Wavenumber [cm-1]
Abs
orpt
ion
[ua
]
05
MnO
490
1400
1230
1061
698
614
460 78
6
Fig 412 FT ndash IR spectra of xMnOmiddot(100-x)[3B2O3middotLi2O] glasses
400 600 800 1000 1200 1400 1600
469
Wavenumber [cm-1]
Abs
orpt
ion
[ua
]
0
3
5
10
20
35
50
1
05
Fe2O3
490
1400
1230
1061
698
614
460 78
6
Fig 413 FT ndash IR spectra of x Fe2O3middot(100-x)[3B2O3middotLi2O] glasses
21
Table 43Wavenumber and the structural assignments of FT ndash IR and Raman
spectra of 3B2O3middotLi2O vitreous matrix
~ [cm 1 ] Attribution
FT ndash IR Raman FT ndash IR Raman
~ 1400 cm-1
~ 1400 cm-1
Asymmetric stretching
vibrations from BOslash3 şi BOslash2O-
groups
BOslash2O- triangles linked to
other borate triangular units
~ 1230 cm-1
Asymmetric stretching
vibrations of B ndash O bonds from
triangular ortoborate
BO 33 groups
~ 1061 cm-1
~ 1074 cm-1
Stretching vibrations of B ndash Oslash
bonds in -4BOslash tetrahedra from
tri- tetra- and penta-borate
groups
Diborate groups
~ 902 cm-1
Vibrations of orthoborate
groups
~ 786 cm-1
~ 791 cm-1
Bending vibrations of O3B ndash O
ndash BO4 bonds
Vibrations of rings with six
member to one or two BO4
tetrahedral from tri- tetra ndash
and penta ndash borate units
~ 698 cm-1
Bending vibrations of B-O-B
bonds from pentaborate groups
~ 614cm-1 Bending vibrations of O ndash B ndash O
bonds
~ 490cm-1 ~ 471cm-1 Bending vibrations of B-O-B
bonds
Isolated diborate groups
~ 460cm-1 Bending vibrations of O ndash B ndash O
bonds
22
The band at ~ 1061 cm-1 is assigned to stretching vibrations of B ndash Oslash bonds in -4BOslash
tetrahedra from tri- tetra- and penta-borate groups and the band at ~ 786 cm-1 is assigned
to bending vibrations of O3B ndash O ndash BO4 bonds The band at ~ 698 cm-1 is attributed to
Bending vibrations of B-O-B bonds from pentaborate groups The bands at ~ 614 cm-1 and
~ 460 cm-1 are assigned to bending vibrations of O ndash B ndash O bonds and the band at ~ 490 cm-
1 is assigned to bending vibrations of B-O-B bonds
From FT-IR spectra it can be concluded that the addition of manganese or iron ions in
vitreous matrices leads to the increase of the disorder degree
Also the structural changes that appeared in 3B2O3middotLi2O vitreous matrix with an
addition MnO or Fe2O3 content can be studied Ar=A4A3 ratio(A4 - relative number of -4BOslash tetrahedral borate units A3 - relative number of triangular (BOslash3 and BOslash2O-) units
0 10 20 30 40 50
010
015
020
Ar
x [mol]
MnO Fe2O3
Fig 414 The evolution of Ar ratio with the MnO or Fe2O3 content of
xMnOmiddot(100-x)[3B2O3middotLi2O] şi xFe2O3middot(100-x)[3B2O3middotLi2O] The evolution of the value of this ratio also allows a visualization of the effects
determined by the presence of the manganese or iron ions in the matrix The value Arltlt 1
indicated that BO3 is dominant related to BO4
422 Study by Raman spectroscopy of xMOmiddot(100-x)[3B2O3middotLi2O] glasses
where MO =gt MnO or Fe2O3
The Raman spectra obtained for xMOmiddot(1-x)[3B2O3middotLi2O] glass system were MO =gt
MnO or Fe2O3 with 0 le x le 50 mol are presented in figure 414-16 and their structural
assignments are summarized in table 43
Studying the Raman spectra of xMOmiddot(1-x)[3B2O3middotLi2O] glass system where MO =gt
MnO or Fe2O3 it has been observed that the absorption bands presented in vitreous matrix
gradually decreased with an increase in the manganese or iron content in both glasses system
which suggested an increase of the disorder in these vitreous systems
23
1000 2000 3000
B2O3Li2O
Wavenumber [cm-1]
Ram
an In
tens
ity [a
u]
1430
107490
279
1471
Fig 415 Raman spectra of vitreous matrix 3B2O3middotLi2O
500 1000 1500 2000 2500 3000
1430
107490
2791
0
Wavenumber [cm-1]
Ram
an In
tens
ity [a
u]
1
3
20
05
5
10
35
50
MnO
471
Fig 416 Raman spectra of xMnOmiddot(100-x)[3B2O3middotLi2O] glasses
400 600 800 1000 1200 1400 1600
Wavenumber [cm-1]
Ram
an In
tens
ity [a
u]
0
1
3
20
05
5
10
35
50
Fe2O3
1430
1074
90279
1
471
Fig 417 Raman spectra of x Fe2O3middot(100-x)[3B2O3middotLi2O] glasses
24
43 Comparative study by electron paramagnetic resonance (EPR) and magnetic
susceptibility measurements of xMOmiddot(100-x)[As2O3middotTeO2] xMOmiddot(100-x)
[As2O3middotPbO] and xMOmiddot(100-x)[3B2O3middotLi2O] glasses where MO =gt MnO or Fe2O3
431 Comparative study by electron paramagnetic resonance (EPR) of
xMnOmiddot(100-x)[As2O3middotBO] where BO =gt TeO2 or PbO
and xMnOmiddot(100-x) [3B2O3middotLi2O] glasses
In order to obtain more information regarding the behavior of manganese ions in
different vitreous matrices [3031] xMnOmiddot(100-x)[As2O3middotBO] where BO =gt TeO2 or PbO
and xMnOmiddot(100-x) [3B2O3middotLi2O] glasses were investigated by EPR spectroscopy on a large
compositional range with 0 le x le 50 mol The EPR spectra of Mn2+ for xMnOmiddot(100-
x)[As2O3middotPbO] (S1) xMnOmiddot(100-x)[As2O3middotTeO2] (S3) and xMnOmiddot(100-x)[3B2O3middotLi2O]
(S5) are presented in figure 418-20 These spectra present two absorption lines centered at gef
43 and gef 20 in all systems
The absorption line centered at gef 43 and is due to isolated Mn2+ ions [32] The
absorption line centered at gef 20 may be attributed to Mn2+ species interacting by magnetic
coupling[33] dipolar and or super exchange the last ones forming magnetic clusters [32]
The evolution of the spectra is easier to follow considering the dependence of
concentration on the EPR parameters the line - intensity (obtained as an integral of the area
under the corresponding EPR signal) J and the line - width ΔB The evolution of J and AB
reflects the structural transformations which appear in the glass matrices due to the increase of
manganese ions content
The intensity and the line - width of the resonance line from gef 43 for all
investigated systems is represented in figure 421(ab)
The intensity of the resonance line from gef 43 for all investigated glass systems
decreases due to the decrease of the isolated manganese ions numbers The line - width from
gef 43 for (S1) and (S3) systems decreases due to decrease of Mn2+ number and to the
structural disorder in glasses with the increase of MnO content For (S5) glass system the line
- width of the resonance line there is an increase in all compositional domains
The intensity of the resonance line from gef 20 can be observed as increasing up to
x=14 mol for (S1) system up to x=8mol for (S3) system and 20 mol for (S5)
system The line - width of the resonance line from gef 20 for (S1) and (S3) systems
increases up to 3 mol and 5mol for (S5) due to Mn2+ species interacting by magnetic
coupling dipole- dipole as the main broadening mechanism Over this concentration line ndash the
width of the resonance line from gef 20 is straight and it can be assumed that the
manganese ions begin to manifest super exchange magnetic interactions
25
1000 2000 3000 4000 5000
Firs
t der
ivat
ive
of a
bsor
ptio
n [u
a]
05
1
3
5
10
20
35
50
x [mol Mn2O3]amplif
B [G]
10
200
40
80
400
5
1
1
Fig 418 The EPR spectra of Mn2+ for xMnOmiddot(100-x)[As2O3middotPbO] (S1)
glass system
1000 2000 3000 4000 5000
Firs
t der
ivat
ive
of a
bsor
ptio
n [u
a]
x [mol MnO]
051
3
5
10
20
35
50
9
500
400
50
100
4
1
amplif
B [G]
1
Fig 419 The EPR spectra of Mn2+ for xMnOmiddot(100-x)[As2O3middotTeO2] (S3)
glass system
26
1000 2000 3000 4000 5000
501
B [G]
Firs
t der
ivat
ive
of a
bsor
ptio
n [u
a]
1
4
9
10
30
60
100
amplif
05
1
3
5
10
20
35
x [mol MnO]
Fe3+
Fig 420 The EPR spectra of Mn2+ for xMnOmiddot(100-x)[3B2O3middotLi2O] (S5)
glass system
0 2 4 6 8 10 12 14 16 18 20 22
x [mol]
J [ u
a]
S1 S3 S5
-2 0 2 4 6 8 10 12 14 16 18 20 22
50
100
150
200
250
300
S1 S3 S5
x [mol]
B
[G]
a b
Fig 421 The dependence on MnO content of the intensity (a) and width(b) of resonance
line at gef 43 for xMnOmiddot(100-x)[As2O3middotPbO] (S1) xMnOmiddot(100-x)[As2O3middotTeO2] (S3) şi
xMnOmiddot(100-x)[3B2O3middotLi2O] (S5) system glasses
27
0 10 20 30 40 50
x [mol]
J [ u
a]
S1 S3 S5
0 10 20 30 40 50
400
500
600
700
800
900
S1 S3 S5
x [mol]
B[G
]
a b
Fig 422 The dependence on MnO content of the intensity (a) and width b) of resonance
line at gef 20 for xMnOmiddot(100-x)[As2O3middotPbO] (S1) xMnOmiddot(100-x)[As2O3middotTeO2] (S3) and
xMnOmiddot(100-x)[3B2O3middotLi2O] (S5) system glasses
Following figure 418-20 it can be observed that (S1) and (S3) have had a similar
evolution but (S5) system presented for 05 le x le 5 mol (fig420) has a hyperfine
sextet[33] at gef 20due to Mn2+ isolated ions
432 Comparative study by magnetic susceptibility measurements of
xMnOmiddot(100-x)[As2O3middotBO] where BO =gt TeO2 or PbO and
xMnOmiddot(100-x)[3B2O3middotLi2O] glasses
The magnetic susceptibility data are in good agreement with the EPR result The
magnetic behavior of the glasses from xMnOmiddot(100-x)[As2O3middotBO] where BO =gt TeO2 (S3)
or PbO (S1) and xMnOmiddot(100-x)[3B2O3middotLi2O] (S5) glasses for 3 le x le 50 mol MnO are
presented in figure 423 - 25
For (S1) and (S3) system glasses up to x 3 mol and x 5 mol (S5) glass
system the temperature dependence of the reciprocal magnetic susceptibility obeys a Curie
law In this concentration range the manganese ions are predominantly isolated orand
participate in dipole-dipole interractions At higher concentrations the reciprocal magnetic
susceptibility obeys a Curie-Weiss law with negative paramagnetic Curie temperature (p)
characteristic to antiferromagnetic coupled ions by means of super exchange interractions(fig
426) This behavior of manganese ions is confirmed by the shape of the EPR spectra
28
100 150 200 250
2
4
6
8
10
12
14
16
18
20
22
T [K]
[
emu
mol
]-1
3 mol 5 mol 10 mol 20 mol 35 mol 50 mol
Fig423 The temperature dependence of -1 for xMnOmiddot(100-x)[As2O3middotPbO]
(S1) 3 le x le 50 mol
50 100 150 200 2500
2
4
6
8
10
12
14
16
18
20
22
3 mol 5 mol 10 mol 20 mol 35 mol 50 mol
T [K]
[
emu
mol
]-1
Fig424 The temperature dependence of -1 for xMnOmiddot(100-x)[ As2O3middotTeO2]
(S1) 3 le x le 50 mol
100 150 200 250
2
4
6
8
10
12
14
16
18
20
22
[em
u m
ol]-1
T [K]
3 mol 5 mol 10 mol 20 mol 35 mol 50 mol
Fig425 The temperature dependence of -1 for xMnOmiddot(100-x)[3B2O3middotLi2O]
(S5) 3 le x le 50 mol
29
0 10 20 30 40 50
0
20
40
60
80
100
x [mol]
-p [K
]
(S1) (S3) (S5)
Fig426Concentration dependence of (p) for sistemele xMnOmiddot(100-x)[As2O3middotPbO]
(S1) xMnOmiddot(100-x)[As2O3middotTeO2] (S3) şi xMnOmiddot(100-x)[3B2O3middotLi2O] (S5)
Using the representation 1 =f(T) the molar Curie constants CM the effective
magnetic moments and molar fraction of Mn2+(x1) şi Mn3+(x2) ions were calculated and
represented in tables 44 -6
Tabel 44 Molar Curie constants effective magnetic moments and molar fraction of Mn2+(x1) şi Mn3+(x2) ions in xMnOmiddot(100-x)[As2O3middotPbO] (S1) glasses
x
[mol MnO2] CMtimes102
[emu mol] ef
[microB] x1
[mol Mn2+O2] x2
[mol Mn3+O2] 3 1272 582 268 032 5 1979 562 343 157 10 3777 549 555 445 20 6688 517 492 1508 35 12239 502 377 3123 50 15427 496 268 4732
Tabel 45 Molar Curie constants effective magnetic moments and molar fraction of Mn2+(x1) şi Mn3+(x2) ions in xMnOmiddot(100-x)[As2O3middotTeO2] (S3)glasses
x
[mol MnO2] CMtimes102
[emu mol] ef
[microB] x1
[mol Mn2+O2] x2
[mol Mn3+O2] 3 1297 588 287 013 5 1938 556 312 188 10 3804 551 575 425 20 6766 52 549 1451 35 11148 504 441 3059 50 15528 498 358 4642
30
Tabel 46 Molar Curie constants effective magnetic moments and molar fraction of Mn2+(x1) şi Mn3+(x2) ions in xMnOmiddot(100-x)[3B2O3middotLi2O] (S5) glasses
x
[mol MnO2] CMtimes102
[emu mol] ef
[microB] x1
[mol Mn2+O2] x2
[mol Mn3+O2] 3 127 581 265 035 5 1919 554 303 197 10 3681 542 486 514 20 7215 519 53 147 35 1121 506 505 2995 50 15898 501 493 4507
433 Comparative study by electron paramagnetic resonance (EPR) of
xFe2O3middot(100-x)[As2O3middotBO] where BO =gt TeO2 or PbO and
x Fe2O3middot(100-x) [3B2O3middotLi2O] glasses
In order to obtain more information regarding the behavior of iron ions in
xFe2O3middot(100-x)[As2O3middotBO] where BO =gt TeO2 (S4) or PbO (S2) şi xFe2O3middot(100-
x)[3B2O3middotLi2O] glasses were investigated by EPR spectroscopy on a large compositional
range with 05 le x le 35 mol Fe2O3 The EPR spectra of Fe3+ in xFe2O3middot(100-
x)[As2O3middotPbO] (S2) xFe2O3middot(100-x)[As2O3middotTeO2] (S4) and xFe2O3middot(1-x)[3B2O3middotLi2O]
(S6) are presented in figure 427-29 These spectra present two absorption lines centered at
gef 43 and gef 20 up to x le 35mol Fe2O3 systems studied
The absorption line centered at gef 43 is due to isolated Fe3+ ions [34-36] The
absorption line centered at gef 20 may be attributed to Fe3+ species interacting by magnetic
coupling dipolar and or super exchange the last ones forming magnetic clusters [37-41]
The evolution of the spectra is easier to follow considering the dependence of
concentration on the EPR parameters the line - intensity (obtained as an integral of the area
under the corresponding EPR signal) J and the line - width ΔB The evolution of J and AB
reflects the structural transformations which appear in the glass matrices due to the increasing
of iron ions content
The intensity and the line - width of the resonance line from gef 43 for all
investigated systems is represented in figure 430 (a b) The intensity of the resonance line
from gef 43 increases for (S2) and (S4) up to 3 mol and up to 5 mol for (S6) then
decreases for all systems investigated A line broadening up to 3 mol from gef 43 for
these systems can be observed due to increasing of Fe3+ isolated number of ions
31
1000 2000 3000 4000 5000
40
Firs
t der
ivat
ive
of a
bsor
ptio
n [u
a]
B [G]
x [mol Fe2O3]
05
1
3
5
1020
35 2
40
20
10
10
10
amplif
Fig427 The EPR spectra of Fe3+ for xFe2O3middot(100-x)[As2O3middotPbO] (S2)
glass system
1000 2000 3000 4000 5000
100
B [G]
Firs
t der
ivat
ive
of a
bsor
ptio
n [u
a]
10080
20
50
20
20
3
05
1
5
102035
x [mol Fe2O3] amplif
Fig428 The EPR spectra of Fe3+ for xFe2O3middot(100-x)[As2O3middotTeO2] (S4)
glass system
32
1000 2000 3000 4000 5000
Firs
t der
ivat
ive
of a
bsor
ptio
n [u
a]
B [G]
3
05
1
5
10
20
35
x [mol Fe2O3]
30
50
20
20
10
30
30
amplif
Fig429 The EPR spectra of Fe3+ for xFe2O3middot(100-x)[3B2O3middotLi2O] (S6)
glass system
The intensity and the line - width of the resonance line from gef 43 for all
investigated systems is represented in figure 430 (a b)The resonance line from gef 20 is
attributed to Fe3+ ions that interact by magnetic coupling dipolar orand super exchange
interractions can be observed in all compositional domains
The intensity of the resonance line from gef 20 can be observed as increasing up to
x=35 mol for (S2) and (S6) system and 10 mol for (S4) system with increased iron
ions content The line - width of the resonance line from gef 20 increased up to 10mol
for (S2) system and up to 3 mol for (S4) and 5mol for (S6) due to Fe3+species
interacting by magnetic coupling dipole-dipole Above this concentration line - width of the
resonance line from gef 20 can be attributed to dipolar and super exchange magnetic
interactions The ΔB = f(x) dependence reflects the competion between the broadening
mechanism (dipole ndash dipole interactions the interactions between ions in diferent
valence state and structural disorder) and the narrowing ones (super exchange
interactions)
33
0 5 10 15 20 25 30 35 40
x [mol]
J [ u
a]
S2 S4 S6
a)
0 5 10 15 20 25 30 35 4040
60
80
100
120
140
160
180
200
220 S2 S4 S6
B[G
]
x [mol]
a b
Fig 430 The dependence on Fe2O3 content of the intensity (a) and width (b) of
resonance line at gef 43 for xFe2O3middot(100-x)[As2O3middotPbO] (S2)
xFe2O3middot(100-x)[As2O3middotTeO2] (S4) and xFe2O3middot(100-x)[3B2O3middotLi2O] (S6) glasses
0 5 10 15 20 25 30 35 40
x [mol]
J [ u
a]
S2 S4 S6
a)
0 5 10 15 20 25 30 35 40
200
400
600
800
1000
1200
1400
1600
x [mol]
B
[G] S2
S4 S6
a b
Fig 431 The dependence on Fe2O3 content of the intensity (a) and width (b) of
resonance line at gef 20 for xFe2O3middot(100-x)[As2O3middotPbO] (S2)
xFe2O3middot(100-x)[As2O3middotTeO2] (S4) and xFe2O3middot(100-x)[3B2O3middotLi2O] (S6) glasses
34
434 Comparative study by magnetic susceptibility measurements of
xFe2O3middot(100-x)[As2O3middotBO] where BO =gt TeO2 or PbO and
xFe2O3middot(100-x) [3B2O3middotLi2O] glasses
The magnetic susceptibility data are in good agreement with the EPR result The magnetic
behavior of the glasses xFe2O3middot(100-x)[As2O3middotPbO] (S2) xFe2O3middot(100-x)[As2O3middotTeO2]
(S4) and xFe2O3middot(100-x)[3B2O3middotLi2O] (S6) for 3 x 50 mol Fe2O3 are presented in
figure 432 - 34
For (S2) glass systems up to x 10 mol x 3 mol (S5) glass systems and x 5
mol (S6) glass systems the temperature dependence of the reciprocal magnetic susceptibility
obeys a Curie law In this concentration range the iron ions are predominantly isolated orand
participate in dipole-dipole interactions At higher concentrations the reciprocal magnetic
susceptibility obeys a Curie-Weiss law with negative paramagnetic Curie temperature (p)
characteristic to antiferromagnetic coupled ions by means of super exchange interactions(fig
435) This behavior of iron ions is confirmed by the shape of the EPR spectra
80 100 120 140 160 180 200 220 240 260 2800
1
2
3
4
5
6
7
8
9
10
11
[
emu
mol
]-1
T [K]
3 mol 5 mol 10 mol 20 mol 35 mol 50 mol
Fig432 The temperature dependence of -1 for xFe2O3middot(100-x)[As2O3middotPbO] (S2)
3 x 50 mol
35
80 100 120 140 160 180 200 220 240 260 2800
1
2
3
4
5
6
7
8
9
10
T [K]
[
emu
mol
]-1
3 mol 5 mol 10 mol 20 mol 35 mol 50 mol
Fig433 The temperature dependence of -1 for xFe2O3middot(100-x)[As2O3middotTeO2] (S4)
3 x 50 mol
80 100 120 140 160 180 200 220 240 260 2800
1
2
3
4
5
6
7
8
9
10
11
3 mol 5 mol 10 mol 20 mol 35 mol 50 mol
T [K]
[
emu
mol
]-1
Fig434 The temperature dependence of -1 for xFe2O3middot(100-x)[3B2O3middotLi2O] (S6)
3 x 50 mol
36
0 10 20 30 40 50
0
10
20
30
40
50
x [mol]-
p [K]
(S2) (S4) (S6)
Fig435Concentration dependence of (p) for sistemele xFe2O3middot(100-x)[As2O3middotPbO] (S2) xFe2O3middot(100-x)[As2O3middotTeO2] (S4) and xFe2O3middot(100-x)[3B2O3middotLi2O] (S6)
for 3 x 50 mol Fe2O3
Using the representation 1 = f(T) the molar Curie constants CM the effective
magnetic moments and molar fraction of Fe3+(x1) şi Fe2+(x2) ions were calculated and
represented in tables 47-9
Table 47 Molar Curie constants effective magnetic moments and molar fraction of
Fe3+(x1) şi Fe2+(x2) ions in xFe2O3middot(100-x)[As2O3middotPbO] glasses (S2)
x [mol Fe2O3]
CMtimes102
[emu mol] ef
[microB] x1
[mol Fe23+O3]
x2 [mol Fe2
2+O3] 3 2526 58 261 039 5 393 56 332 168 10 7326 541 476 524 20 13459 519 53 147 35 23364 516 829 2671 50 32154 507 767 4233
Table 48 Molar Curie constants effective magnetic moments and molar fraction of
Fe3+(x1) şi Fe2+(x2) ions in xFe2O3middot(100-x)[As2O3middotTeO2] glasses (S4)
x [mol Fe2O3]
CMtimes102
[emu mol] ef
[microB] x1
[mol Fe23+O3]
x2 [mol Fe2
2+O3] 3 2571 585 277 023 5 4016 566 363 137 10 7911 562 686 314 20 14992 521 643 929 35 22676 509 601 2899 50 30959 497 313 4687
37
Table 49 Molar Curie constants effective magnetic moments and molar fraction of Fe3+(x1) şi Fe2+(x2) ions in xFe2O3middot(100-x)[3B2O3middotLi2O] glasses (S6)
The results allowed to consider that the magnetic properties of the studied glasses can
be explained through magnetic interractions between Fe3+ - Fe3+ Fe3+- Fe2+ and Fe2+- Fe2+ that
explain the dependences of RPE parameters concentration
SELECTED CONCLUSIONS
In this thesis xMOmiddot(100-x)[As2O3middotTeO2] xMOmiddot(100-x) [As2O3middotPbO] and
xMOmiddot(100-x)[3B2O3middotLi2O] glasses where MO =gt MnO or Fe2O3 were comparatively
studied in 0 le x le 50 mol The structural modifications of investigated glass matrices were
comparatively followed in function of the manganese or iron ions on the investigated glass
matrices were followed
The study by FT-IR spectroscopy shows that the evolution of the spectra of
xMnOmiddot(100-x) [As2O3middotPbO] with the addition and the increasing of the MnO content suggest
that the manganese ions break up a part of As ndash O ndash As Pb ndash O ndash Pb and probably of As ndash O ndash
Pb bonds The addition of MnO in the As2O3middotPbO glass matrix is leading to a disordering of
the glasses structure with the increasing of the MnO content
The evolution of the absorption bands for FT ndash IR spectrum of xFe2O3middot(1-x)
[As2O3middotPbO] glasses are determined by the addition of Fe2O3 content It can be observed to
shift the bands assigned As ndash O ndash As vibrations from AsO3 units due to changing to length As
ndash O ndash As bonds and interne angles of AsO3 units disappears PbO4 units and appears FeO6
units The addition of Fe2O3 in the As2O3middotPbO glass matrix determined a disordering of the
glasses structure with the increasing of the Fe2O3 content
From FT-IR absorption spectra of the investigated xMOmiddot(100-x)[As2O3middotTeO2] glasses
system where MO =gt MnO or Fe2O3 it can be observed that the addition and increasing of
manganese ions concluded the contraction of As-O-As bonds from totally symmetric
x [mol Fe2O3]
CMtimes102
[emu mol] ef
[microB] x1
[mol Fe23+O3]
x2 [mol Fe2
2+O3] 3 2542 582 268 032 5 3943 561 338 162 10 7423 544 506 494 20 13568 520 549 1451 35 23094 513 731 2769 50 31746 503 584 4416
38
stretching vibrations of AsO3 units for x ge10 mol there can be an increase in number of As-
O-As bonds from AsO3 units orand a length these linkage to doubly degenerate stretching
vibrations of AsO3 units and a stretching vibration mode of TeO3 tp with NBO It can be
remarked from the FT-IR absorption spectra the gradual transformation of symmetric
stretching vibration mode of Te-O bonds from TeO3 units in TeO4 (tbp) units and the presence
of MnO2 units Once with the addition of iron ions the xFe2O3middot(100- x)[As2O3middotTeO2]
glasses behave like xMnOmiddot(100-x)[As2O3middotTeO2] glasses but in this system the
appearance of FeO6 units can be seen
From FT-IR spectra in xMOmiddot(100-x)[3B2O3middotLi2O] glasses where MO =gt MnO or
Fe2O3 can be concluded that the addition of manganese or iron ions in vitreous matrices leads
to the increase of the disorder degree
The study by Raman spectroscopy shows that the evolution of the spectra the addition
of MnO in the [As2O3middotPbO]glass matrix determined an order degree of the vitreous matrix
The intensity of the bands attributed vibrations As ndash O ndash As bonds from As2O units and
bending vibrations of As ndash O ndash As from As2O units shift to a higher wave length that suggests
an increase in the As2O units comparative to AsO3 units With the increase of iron ions content
in the As2O3middotPbO glass matrix the number of these structural units decreases due to the
increasing of the disorder in the studied glasses
With the increasing of manganese content in As2O3TeO2 glass matrix the intensity
of these bands is increasing showing that the manganese content favorites the formation of
TeO4 (tbp) and TeO3 (tp) units For high concentrations of iron ions in xFe2O3middot(100-
x)[As2O3 TeO2] system of glasses the number of As-O-As linkages appear in Raman
spectrum due to stretching vibrations of As-O-As and vibrations of the continuous TeO4 (tbp)
network show a significant decrease
Studying the Raman spectra of xMOmiddot(1-x)[3B2O3middotLi2O] glass system where MO =gt
MnO or Fe2O3 it has been observed that the absorption bands presented in vitreous matrix
gradually decreased with an increase in the manganese or iron content in both glasses system
which suggested an increase of the disorder in these vitreous systems
The EPR spectra presents the behavior of manganese or iron ions in different vitreous
matrices xMOmiddot(100-x)[As2O3middotBO] where MO=gtMnO or Fe2O3 and BO =gt TeO2 or
PbO and xMOmiddot(100-x) [3B2O3middotLi2O] Glasses were investigated by EPR spectroscopy on a
large compositional range with 0 le x le 50 mol The absorption line centered at gef 43 and
is due to isolated Mn2+ ions The absorption line centered at gef 20 may be attributed to
Mn2+ species interacting by magnetic coupling dipolar and or super exchange the last ones
forming magnetic clusters The EPR spectra of Fe3+ in xFe2O3middot(100-x)[As2O3middotPbO]
xFe2O3middot(100-x)[As2O3middotTeO2] and xFe2O3middot(1-x)[3B2O3middotLi2O] are presented two absorption
lines centered at gef 43 and gef 20 up to x le 35mol Fe2O3 systems studied
39
The absorption line centered at gef 43 is due to isolated Fe3+ ions The absorption
line centered at gef 20 may be attributed to Fe3+ species interacting by magnetic coupling
dipolar and or super exchange the last ones forming magnetic clusters
The evolution of the spectra is easier to follow considering the dependence of
concentration on the EPR parameters the line - intensity (obtained as an integral of the area
under the corresponding EPR signal) J and the line - width ΔB The evolution of J and AB
reflects the structural transformations which appear in the glass matrices due to the increase of
manganese ions content
The magnetic susceptibility data are in good agreement with the EPR result The
magnetic behavior of the glasses from xMnOmiddot(100-x)[As2O3middotBO] where BO =gt TeO2 (S3)
or PbO (S1) and xMnOmiddot(100-x)[3B2O3middotLi2O] (S5) glasses for 3 le x le 50 mol MnO
For (S1) and (S3) system glasses up to x 3 mol and x 5 mol (S5) glass
system the temperature dependence of the reciprocal magnetic susceptibility obeys a Curie
law In this concentration range the manganese ions are predominantly isolated orand
participate in dipole-dipole interractions At higher concentrations the reciprocal magnetic
susceptibility obeys a Curie-Weiss law with negative paramagnetic Curie temperature (p)
characteristic to antiferromagnetic coupled ions by means of super exchange interractions This
behavior of manganese ions is confirmed by the shape of the EPR spectra Using the
representation 1 =f(T) the molar Curie constants CM the effective magnetic moments
and molar fraction of Mn2+(x1) şi Mn3+(x2) ions were calculated The magnetic susceptibility
data are in good agreement with the EPR result
The magnetic behavior of the glasses xFe2O3middot(100-x)[As2O3middotPbO] (S2)
xFe2O3middot(100-x)[As2O3middotTeO2] (S4) and xFe2O3middot(100-x)[3B2O3middotLi2O] (S6) for 3 x 50
mol Fe2O3 are presented For (S2) glass systems up to x 10 mol x 3 mol (S5)
glass systems and x 5 mol (S6) glass systems the temperature dependence of the
reciprocal magnetic susceptibility obeys a Curie law In this concentration range the iron ions
are predominantly isolated orand participate in dipole-dipole interactions At higher
concentrations the reciprocal magnetic susceptibility obeys a Curie-Weiss law with negative
paramagnetic Curie temperature (p) characteristic to antiferromagnetic coupled ions by
means of super exchange interactions(fig 435) This behavior of iron ions is confirmed by the
shape of the EPR spectra Using the representation 1 = f(T) the molar Curie constants
CM the effective magnetic moments and molar fraction of Fe3+(x1) şi Fe2+(x2) ions were
calculated
40
REFERENCES
Chapter 1
[1] I Ardelean bdquoIntroducere icircn studiul materialelor oxidice cu structură vitroasă EdNapocaStar Cluj Napoca 2002 [2] G Srinivasarao N Veeraiah J All Com 327 52-65(2001) [3] G Srinivasarao N Veeraiah J Phys Chem Solids 63705-717(2002) [4] DBecherescu VCristea FMarx IMenessz FWinter Chimia stării solide Ed Şt şi Encicl Bucucureştivol 1 1983 [5] J Wong CAAngell Glass-Structure by Spectroscopy Dekker Inc New York 1976 [6] BEWarren HKKrutter O Morningstat J Am Ceram Soc 19 202 (1936) [7] LLSperry JD Mackenzie Phys Chem Glasses 9 91 (1968) [8] WLKonijnendijk JMStevels J Non-Cryst Solids 18 307 (1975) [9] FCEversteyn JM Stevels HJ Naterman Phys Chem Glasses 1 134 (1963) [10] G Fuxi Optical and Spectroscopie Properties of Glass Springer-Verlag Shanghai Scientific Technical Pub Shanghai 1991 [11] YDYiannopoulos GDChryssikos EIKamitsos Phys Chem Glasses 42(3) 164 (2001) [12] MGFerreira da Silva BFOCosta J Non-Cryst Solids 293-295 534 (2001) [13] RYordanova YDimitriev VDimitriev S Kassabov DKlissurski JNon-Cryst Solids 201 141 (1996) [14] W L Konijnendijk J M Stevels J Non-Cryst Solids 18 307 (1980) [15] M Iron M Couzi ALevasseur JBrethous JSolidState Chem 31 285 (1980) [16] TFurukawa WBWhite PhzsChemGlasses 21 85 (1980) [17] E I Kamitsos M A Karakassides GD Chryssikos J Phys Chem 90 4528 (1986) [18] E I Kamitsos M A Karakassides GD Chryssikos J Phys Chem 91 1073 (1987) [19] TWBril Philips Res Rep Suppl 2 117 (1976) [20] E I Kamitsos M A Karakassides GD Chryssikos J Phys Chem 30 203 (1989) [21] BNMeera JRamakrishna J Non-Cryst Solids 159 1 (1993) [22] KWitke THubert PReich JRamanSpectr 24 407 (1993) [23] E I Kamitsos M A Karakassides Phys Chem Glasses 30 19 (1989) [24] MPeteanu Teză de doctoratrdquo Universitatea Babeş-Bolyairdquo Cluj Napoca (1989) [25] PCTaylor PJBray JPhys Chem Solids 33 43 (1972) [26] IArdelean MPeteanu GhIlonca DPop Solid State Commun 33 653 (1980) [27] AV De Wijn RE Van Balderen JKemPhys 46 4 (1967) [28] DL Griscom RE Griscom J Phys Chem Glasses 12 19 (1971) [29] JWH Schreurs JChem Phys 69 2151 (1978) [30] AlNicula M Peteanu IArdelean Studia Univ Babeş-Bolyai Physica 2 65 (1979) [31] M Peteanu IArdelean SFilip ITodor GSalvan Studia Univ Babeş-Bolyai Physica XL 2 9 (1995) [32] IArdelean M Peteanu SFilipV Simon ITodor Solid State Commun 105 (5) 339 (1998) [33] SKMendiratta EGuedes de Sousa JMatSci Lett7 733 (1988) [34] IArdelean M Peteanu SFilip V Simon GGyorffy Solid State Commun 102 (4) 341 (1997) [35] IArdelean M Peteanu SFilip V Simon FCiorcas ITodor JMagnMagn Mat 196-197 257 (1999) [36] JKliava RBerger YServant JEmery JMGreneche JTrokss J Non-Cryst Solids 202 205 (1996) [37] LDBogomolova NA Krasilnikova VLBogdanov VDKhaliev VV Mitrofanov J Non-Cryst Solids 188 130 (1995) [38] DLoveridge SPark PhysChem Glasses 12 19 (1971) [39] IArdelean G Salvan M Peteanu V Simon FCiorcas Mod PhysLett B 13 (22-23) 801 (1999)
41
[40] JLRao AMuraly EDRao J Non-Cryst Solids 202 215 (1996) [41] CPrakash S Husain RJ Singh SMollah JAlloys Compon 326 47 (2001) [42] EGuedes de Sousa SKMendiratta JMMachado Da Silva Portugal Phys 17 (3-4) 203 (1986) [43] TCastner GSNewell WCHolton CP Slichter JChem Phys 32 668 (1960) [44] SPChaudhuri SKPatra JMatSci 35 4735 (2000) [45] IArdelean HH Qiu HSakata Matt Lett 32 335 (1997) Chapter 2 [1] J Wong C A Angel Glass Structure by Spectroscopy Marcel Dekker inc New-York 1976 [2] I Ardelean bdquoIntroducere icircn studiul materialelor oxidice cu structură vitroasă EdNapocastar Cluj-Napoca 2002 [3] N Avram GH Mateescu Spectroscopia icircn infraroşu Aplicaţii icircn chimia organică Ed Tehnică Bucureşti 1968 [4] TIliescu Spectroscopie optică moleculară vibraţională şi electronică Ed Casa Cărţii de Ştiinţă Cluj- Napoca 2000 [5] S Aştilean bdquoMetode şi tehnici moderne de spectroscopie optică Ed Casa Cărţii de Ştiinţă Cluj - Napoca 2002 p 5 [6] I Ursu Rezonanţă Electronică de Spinrdquo Ed AcademieiBucureşti (1965) [7] CHHurd ContempPhys 23 (5) 469 (1982) [8] GWAnderson WDCompton JChemPhys52 6166 (1970) [9] MS Seehra GSrinivasan Landolt-Bornstein (New Series) SubVolume F3 Springer-Verlag Berlin 1994 [10] GToulouse ContempPhys 2115 (1977) [11] NMMurayMagnetic susceptybility EdInterscience New York P1773 1963 [12] JBGoodenough Magnetism and Chemical Bond EdInterscience New York 1963 [13] IArdelean G Salvan M Peteanu V Simon FCiorcas Mod PhysLett B 13 (22-23) 801 (1999) [14] IArdelean MPeteanu R Ciceo Lucăcel Studii de rezonanţă paramagnetică electronică şi magnetice ale unor ioni 3d icircn sticle pe bază de B2O3 Ed Presa Univesitară Clujeană 2005 [15] IArdelean PhysStatSol (b) 87K137 (1978) [16] IArdelean Solid State Commun 31 75 (1979) [17] EJFrieble LKWilson AWDozier DLKinser PhysStatSol (b) 45 323 (1971) [18] DWMoon JMAitken RKMcCrone GS Ciloszik PhysChe Glasses 16 (5) 91 (1975) [19] SFilip Teză de doctorat UnivBabeş-Bolyai Cluj Napoca 1996 [20] CJSchinkel GWRathenou Physics of Non-Crystaline Solids North Holland Publ Co Amsterdam 215 1965 [21] EJFrieble LKWilson NCKoon DLKinser JAm Ceram Soc 57-237 (1974) [22] RJLandry JT Fournier CGYoung JChemPhys 46 1285 (1967) [23] WSimpson PhysStatSolidi b40 207 (1970) [24] RHasegawa PhysRevB b(5) 1631 (1971) [25] IArdelean GhIlonca MPeteanu Solid State Commun 52 145 (1984) [26] IArdelean GhIlonca OCozar J Physique 49 C8 1107 (1988) Chapter 3 [1] LFBates Modern Magnetism p133 Cambridge University Press London 1962 [2] IArdelean GhIlonca DBarbos Solid State Commun 40 769 (1981) [3] EBurzo IUrsu DUngur IArdelean JMatSci 15 581 (1980) [4] EBurzo IUrsu DUngur IArdelean MatResBull 15 1273 (1980) [5] DLGriscom Glass Science and Technology 48 151 (1990) [6] PJBray AH Silver Modern aspects of the vitreous state vol1 Butterworth
42
London 1960 [7] IArdelean Teza de doctorat UnivBabeş-Bolyai Cluj Napoca 1979 [8] SAştilean bdquoMetode şi tehnici moderne de spectroscopie opticărdquo EdCasa Cărţii de Ştiinţă Cluj ndash Napoca 2002 p5 [9] IArdelean RCiceo-Lucăcel ldquoFizica şi Tehnologia Materialelor Oxidice Lucrări Practicerdquo Ed Univ ldquoBabeş-Bolyairdquo Cluj-Napoca 2000 [10] VPop IChicinaş NJumate Fizica materialelor Metode experimentalerdquo EdPresa Universitară Clujeană 2001 [11] IUrsu Rezonanţă electronică de spinrdquo EdAcademiei Bucureşti 1965 Chapter 4 [1] I Ardelean S Lupşor D Rusu Solid State Sci 10 1384(2008) [2] I Ardelean S Lupşor D Rusu trimis spre publicare la Physica B decembrie 2009 [3] P Tarte Spectrochim Acta 18 467 (1962) [4] R A Condrate J Non ndash Cryst Solids 84 26 (1986) [5] G Srinivasarao N Veeraiah Phys Stat Sol (a) 191 370(2002) [6] G Srinivasarao N Veeraiah J Phys Chem Solids 63 705(2002) [7] G Srinivasarao N Veeraiah J All Com 327 52 (2001) [8] DK Durga N Veeraiah Bull Mater Sci 24 (4) 421 (2001) [9] F F Bentley L D Smithson A L Rozek InfraredndashSpectra and Characteristic Frequencies 700-300 cm-1 Interscience New York 1968 p 103 [10] O Noguera T Merle-Mejean AP Mirgorodsky MB Smirnov P Thomas J-C Champarnaud-Mesjard J Non-Cryst Solids 330 50 (2003) [11] BVR Chowdari KL Tan Fang Ling Solid State Ionics 113 ndash 115 711(1998) [12] C Jiang J Zhang H Mao F Gan Glass Technol 39(6) 200(1998) [13] MR Sahar K Sulhadi MS Rohani J Mater Sci 42 824(2007) [14] C Horea D Rusu I Ardelean J Mater Sci Mater Electron 20 905(2009) [15] GE Rachkovskaya GB Zakharevich J Appl Spectrosc 74 86(2007) [16] I Ardelean S Lupşor D Rusu trimis spre publicare la Journal of Materials Science Materials in Electronics decembrie 2009 [17] I Ardelean S Lupşor D Rusu trimis spre publicare la Modern Physics Letters B decembrie 2009 [18] R Iordanova Y Dimitriev V Dimitrov S Kassabov D Klissurski J Non ndash Cryst Solids 231 227 (1998) [19] R Iordanova Y Dimitriev S Kassabov D Klissurski J Non ndash Cryst Solids 204 141 (1996) [20] J O Jensen S J Gilliam A Banerjee D Zeroka S J Kirkby C N Merrow J Mol Struct (Theochem) 664 145 (2003) [21] G N Papatheodorou S A Solin Solid State Commun 16 5 (1975) [22] BVR Chowdari KL Tan Fang Ling J Mat Sci 35 2015 (2000) [23] R C Lucacel C Marcus V Timar I Ardelean Solid State Sci 9 850 (2007) [24] CP Varsamis EI Kamitsos GD Chryssikos Solid State Ionics 136ndash137 1031 (2000) [25] Sherief M Abo-Naf Fatma H El Batal Moenis A Azooz Mat Chem Phys 77 846 (2002) [26] SG Motke SP Yawale SS Yawale Bull Mater Sci 25 (10) (2002) [27] R Akagi N Ohtori N Umesaki J Non ndash Cryst Solids 293 471(2001) [28] E I Kamitsos M A Karakassides G D Chryssikos J Phys Chem 91(5) 1073 (1987) [29] H Ushida Y Iwadate T Hattori S Nishiyama K Fukushima Y Ikeda M Yamaguchi M Misawa T Fukunaga T Nakazawa S Jitsukawa J Alloys Compd 377 167 (2004) [30] I Ardelean F Ciorcas M Peteanu S Lupşor G Salvan Balkan Phys Lett 5 860 (1997)
43
[31] I Ardelean M Peteanu V Simon O Cozar F Ciorcas S Lupşor J Magn Magn Mater 196 253 (1999) [32] IArdelean MPeteanu GhIlonca Phys Stat Sol (a) 58 K33(1980) [33] IArdelean MPeteanu R Ciceo-Lucăcel ldquoStudii de rezonanţă paramagnetică electronică şi magnetice ale unor ioni 3d icircn sticle pe bază de B2O3rdquo Ed Presa Univ Clujeană Cluj Napoca 2005 p 171 [34] JLRao AMuraly EDRao J Non-Cryst Solids 202 215 (1996) [35] RPSChakradhar AMurali JLRao Optical Mat 10 109 (1998) [36] IArdelean MPeteanu SFilip VSimon GGyorffy Solid State Commun 102(4) 341 (1997) [37] IArdelean MPeteanu VSimon SFilip FCiorcaş ITodor J Magn Magn Mat 196-197 257 (1999) [38] IArdelean GSalvan MPeteanu VSimon CHimcinschi FCiorcas Mod Phys Lett B 13(22-23) 801 (1999) [39] IArdelean HHQiu HSakata Mat Lett 32 335 (1997) [40] SPChaudhuri SKPatra J Mat Sci 35 4735 (2000) [41] I Ardelean M Peteanu V Simon G Salvan J Mat Sci Technol 18 (3) 1 (2002)

20
Following the infrared absorption spectra obtained for 3B2O3middotLi2O vitreous matrix
observed on eight bands ~ 1400 cm-1 ~ 1230 cm-1 ~ 1061 cm-1 ~ 786 cm-1 ~ 698 cm-
1 ~ 614 cm-1 ~ 490 cm-1 şi ~ 460 cm-1 The band at ~ 1400 cm-1 is assigned to
asymmetric stretching vibrations from BOslash3 şi BOslash2O- groups (Oslash represent oxygen atom
bridging two boron atoms) The band at ~ 1230 cm-1 is attributed to asymmetric stretching
vibrations of B ndash O bonds from triangular ortoborate BO 33 groups [23-26]
400 600 800 1000 1200 1400 1600
0
3
5
10
20
35
50
1
Wavenumber [cm-1]
Abs
orpt
ion
[ua
]
05
MnO
490
1400
1230
1061
698
614
460 78
6
Fig 412 FT ndash IR spectra of xMnOmiddot(100-x)[3B2O3middotLi2O] glasses
400 600 800 1000 1200 1400 1600
469
Wavenumber [cm-1]
Abs
orpt
ion
[ua
]
0
3
5
10
20
35
50
1
05
Fe2O3
490
1400
1230
1061
698
614
460 78
6
Fig 413 FT ndash IR spectra of x Fe2O3middot(100-x)[3B2O3middotLi2O] glasses
21
Table 43Wavenumber and the structural assignments of FT ndash IR and Raman
spectra of 3B2O3middotLi2O vitreous matrix
~ [cm 1 ] Attribution
FT ndash IR Raman FT ndash IR Raman
~ 1400 cm-1
~ 1400 cm-1
Asymmetric stretching
vibrations from BOslash3 şi BOslash2O-
groups
BOslash2O- triangles linked to
other borate triangular units
~ 1230 cm-1
Asymmetric stretching
vibrations of B ndash O bonds from
triangular ortoborate
BO 33 groups
~ 1061 cm-1
~ 1074 cm-1
Stretching vibrations of B ndash Oslash
bonds in -4BOslash tetrahedra from
tri- tetra- and penta-borate
groups
Diborate groups
~ 902 cm-1
Vibrations of orthoborate
groups
~ 786 cm-1
~ 791 cm-1
Bending vibrations of O3B ndash O
ndash BO4 bonds
Vibrations of rings with six
member to one or two BO4
tetrahedral from tri- tetra ndash
and penta ndash borate units
~ 698 cm-1
Bending vibrations of B-O-B
bonds from pentaborate groups
~ 614cm-1 Bending vibrations of O ndash B ndash O
bonds
~ 490cm-1 ~ 471cm-1 Bending vibrations of B-O-B
bonds
Isolated diborate groups
~ 460cm-1 Bending vibrations of O ndash B ndash O
bonds
22
The band at ~ 1061 cm-1 is assigned to stretching vibrations of B ndash Oslash bonds in -4BOslash
tetrahedra from tri- tetra- and penta-borate groups and the band at ~ 786 cm-1 is assigned
to bending vibrations of O3B ndash O ndash BO4 bonds The band at ~ 698 cm-1 is attributed to
Bending vibrations of B-O-B bonds from pentaborate groups The bands at ~ 614 cm-1 and
~ 460 cm-1 are assigned to bending vibrations of O ndash B ndash O bonds and the band at ~ 490 cm-
1 is assigned to bending vibrations of B-O-B bonds
From FT-IR spectra it can be concluded that the addition of manganese or iron ions in
vitreous matrices leads to the increase of the disorder degree
Also the structural changes that appeared in 3B2O3middotLi2O vitreous matrix with an
addition MnO or Fe2O3 content can be studied Ar=A4A3 ratio(A4 - relative number of -4BOslash tetrahedral borate units A3 - relative number of triangular (BOslash3 and BOslash2O-) units
0 10 20 30 40 50
010
015
020
Ar
x [mol]
MnO Fe2O3
Fig 414 The evolution of Ar ratio with the MnO or Fe2O3 content of
xMnOmiddot(100-x)[3B2O3middotLi2O] şi xFe2O3middot(100-x)[3B2O3middotLi2O] The evolution of the value of this ratio also allows a visualization of the effects
determined by the presence of the manganese or iron ions in the matrix The value Arltlt 1
indicated that BO3 is dominant related to BO4
422 Study by Raman spectroscopy of xMOmiddot(100-x)[3B2O3middotLi2O] glasses
where MO =gt MnO or Fe2O3
The Raman spectra obtained for xMOmiddot(1-x)[3B2O3middotLi2O] glass system were MO =gt
MnO or Fe2O3 with 0 le x le 50 mol are presented in figure 414-16 and their structural
assignments are summarized in table 43
Studying the Raman spectra of xMOmiddot(1-x)[3B2O3middotLi2O] glass system where MO =gt
MnO or Fe2O3 it has been observed that the absorption bands presented in vitreous matrix
gradually decreased with an increase in the manganese or iron content in both glasses system
which suggested an increase of the disorder in these vitreous systems
23
1000 2000 3000
B2O3Li2O
Wavenumber [cm-1]
Ram
an In
tens
ity [a
u]
1430
107490
279
1471
Fig 415 Raman spectra of vitreous matrix 3B2O3middotLi2O
500 1000 1500 2000 2500 3000
1430
107490
2791
0
Wavenumber [cm-1]
Ram
an In
tens
ity [a
u]
1
3
20
05
5
10
35
50
MnO
471
Fig 416 Raman spectra of xMnOmiddot(100-x)[3B2O3middotLi2O] glasses
400 600 800 1000 1200 1400 1600
Wavenumber [cm-1]
Ram
an In
tens
ity [a
u]
0
1
3
20
05
5
10
35
50
Fe2O3
1430
1074
90279
1
471
Fig 417 Raman spectra of x Fe2O3middot(100-x)[3B2O3middotLi2O] glasses
24
43 Comparative study by electron paramagnetic resonance (EPR) and magnetic
susceptibility measurements of xMOmiddot(100-x)[As2O3middotTeO2] xMOmiddot(100-x)
[As2O3middotPbO] and xMOmiddot(100-x)[3B2O3middotLi2O] glasses where MO =gt MnO or Fe2O3
431 Comparative study by electron paramagnetic resonance (EPR) of
xMnOmiddot(100-x)[As2O3middotBO] where BO =gt TeO2 or PbO
and xMnOmiddot(100-x) [3B2O3middotLi2O] glasses
In order to obtain more information regarding the behavior of manganese ions in
different vitreous matrices [3031] xMnOmiddot(100-x)[As2O3middotBO] where BO =gt TeO2 or PbO
and xMnOmiddot(100-x) [3B2O3middotLi2O] glasses were investigated by EPR spectroscopy on a large
compositional range with 0 le x le 50 mol The EPR spectra of Mn2+ for xMnOmiddot(100-
x)[As2O3middotPbO] (S1) xMnOmiddot(100-x)[As2O3middotTeO2] (S3) and xMnOmiddot(100-x)[3B2O3middotLi2O]
(S5) are presented in figure 418-20 These spectra present two absorption lines centered at gef
43 and gef 20 in all systems
The absorption line centered at gef 43 and is due to isolated Mn2+ ions [32] The
absorption line centered at gef 20 may be attributed to Mn2+ species interacting by magnetic
coupling[33] dipolar and or super exchange the last ones forming magnetic clusters [32]
The evolution of the spectra is easier to follow considering the dependence of
concentration on the EPR parameters the line - intensity (obtained as an integral of the area
under the corresponding EPR signal) J and the line - width ΔB The evolution of J and AB
reflects the structural transformations which appear in the glass matrices due to the increase of
manganese ions content
The intensity and the line - width of the resonance line from gef 43 for all
investigated systems is represented in figure 421(ab)
The intensity of the resonance line from gef 43 for all investigated glass systems
decreases due to the decrease of the isolated manganese ions numbers The line - width from
gef 43 for (S1) and (S3) systems decreases due to decrease of Mn2+ number and to the
structural disorder in glasses with the increase of MnO content For (S5) glass system the line
- width of the resonance line there is an increase in all compositional domains
The intensity of the resonance line from gef 20 can be observed as increasing up to
x=14 mol for (S1) system up to x=8mol for (S3) system and 20 mol for (S5)
system The line - width of the resonance line from gef 20 for (S1) and (S3) systems
increases up to 3 mol and 5mol for (S5) due to Mn2+ species interacting by magnetic
coupling dipole- dipole as the main broadening mechanism Over this concentration line ndash the
width of the resonance line from gef 20 is straight and it can be assumed that the
manganese ions begin to manifest super exchange magnetic interactions
25
1000 2000 3000 4000 5000
Firs
t der
ivat
ive
of a
bsor
ptio
n [u
a]
05
1
3
5
10
20
35
50
x [mol Mn2O3]amplif
B [G]
10
200
40
80
400
5
1
1
Fig 418 The EPR spectra of Mn2+ for xMnOmiddot(100-x)[As2O3middotPbO] (S1)
glass system
1000 2000 3000 4000 5000
Firs
t der
ivat
ive
of a
bsor
ptio
n [u
a]
x [mol MnO]
051
3
5
10
20
35
50
9
500
400
50
100
4
1
amplif
B [G]
1
Fig 419 The EPR spectra of Mn2+ for xMnOmiddot(100-x)[As2O3middotTeO2] (S3)
glass system
26
1000 2000 3000 4000 5000
501
B [G]
Firs
t der
ivat
ive
of a
bsor
ptio
n [u
a]
1
4
9
10
30
60
100
amplif
05
1
3
5
10
20
35
x [mol MnO]
Fe3+
Fig 420 The EPR spectra of Mn2+ for xMnOmiddot(100-x)[3B2O3middotLi2O] (S5)
glass system
0 2 4 6 8 10 12 14 16 18 20 22
x [mol]
J [ u
a]
S1 S3 S5
-2 0 2 4 6 8 10 12 14 16 18 20 22
50
100
150
200
250
300
S1 S3 S5
x [mol]
B
[G]
a b
Fig 421 The dependence on MnO content of the intensity (a) and width(b) of resonance
line at gef 43 for xMnOmiddot(100-x)[As2O3middotPbO] (S1) xMnOmiddot(100-x)[As2O3middotTeO2] (S3) şi
xMnOmiddot(100-x)[3B2O3middotLi2O] (S5) system glasses
27
0 10 20 30 40 50
x [mol]
J [ u
a]
S1 S3 S5
0 10 20 30 40 50
400
500
600
700
800
900
S1 S3 S5
x [mol]
B[G
]
a b
Fig 422 The dependence on MnO content of the intensity (a) and width b) of resonance
line at gef 20 for xMnOmiddot(100-x)[As2O3middotPbO] (S1) xMnOmiddot(100-x)[As2O3middotTeO2] (S3) and
xMnOmiddot(100-x)[3B2O3middotLi2O] (S5) system glasses
Following figure 418-20 it can be observed that (S1) and (S3) have had a similar
evolution but (S5) system presented for 05 le x le 5 mol (fig420) has a hyperfine
sextet[33] at gef 20due to Mn2+ isolated ions
432 Comparative study by magnetic susceptibility measurements of
xMnOmiddot(100-x)[As2O3middotBO] where BO =gt TeO2 or PbO and
xMnOmiddot(100-x)[3B2O3middotLi2O] glasses
The magnetic susceptibility data are in good agreement with the EPR result The
magnetic behavior of the glasses from xMnOmiddot(100-x)[As2O3middotBO] where BO =gt TeO2 (S3)
or PbO (S1) and xMnOmiddot(100-x)[3B2O3middotLi2O] (S5) glasses for 3 le x le 50 mol MnO are
presented in figure 423 - 25
For (S1) and (S3) system glasses up to x 3 mol and x 5 mol (S5) glass
system the temperature dependence of the reciprocal magnetic susceptibility obeys a Curie
law In this concentration range the manganese ions are predominantly isolated orand
participate in dipole-dipole interractions At higher concentrations the reciprocal magnetic
susceptibility obeys a Curie-Weiss law with negative paramagnetic Curie temperature (p)
characteristic to antiferromagnetic coupled ions by means of super exchange interractions(fig
426) This behavior of manganese ions is confirmed by the shape of the EPR spectra
28
100 150 200 250
2
4
6
8
10
12
14
16
18
20
22
T [K]
[
emu
mol
]-1
3 mol 5 mol 10 mol 20 mol 35 mol 50 mol
Fig423 The temperature dependence of -1 for xMnOmiddot(100-x)[As2O3middotPbO]
(S1) 3 le x le 50 mol
50 100 150 200 2500
2
4
6
8
10
12
14
16
18
20
22
3 mol 5 mol 10 mol 20 mol 35 mol 50 mol
T [K]
[
emu
mol
]-1
Fig424 The temperature dependence of -1 for xMnOmiddot(100-x)[ As2O3middotTeO2]
(S1) 3 le x le 50 mol
100 150 200 250
2
4
6
8
10
12
14
16
18
20
22
[em
u m
ol]-1
T [K]
3 mol 5 mol 10 mol 20 mol 35 mol 50 mol
Fig425 The temperature dependence of -1 for xMnOmiddot(100-x)[3B2O3middotLi2O]
(S5) 3 le x le 50 mol
29
0 10 20 30 40 50
0
20
40
60
80
100
x [mol]
-p [K
]
(S1) (S3) (S5)
Fig426Concentration dependence of (p) for sistemele xMnOmiddot(100-x)[As2O3middotPbO]
(S1) xMnOmiddot(100-x)[As2O3middotTeO2] (S3) şi xMnOmiddot(100-x)[3B2O3middotLi2O] (S5)
Using the representation 1 =f(T) the molar Curie constants CM the effective
magnetic moments and molar fraction of Mn2+(x1) şi Mn3+(x2) ions were calculated and
represented in tables 44 -6
Tabel 44 Molar Curie constants effective magnetic moments and molar fraction of Mn2+(x1) şi Mn3+(x2) ions in xMnOmiddot(100-x)[As2O3middotPbO] (S1) glasses
x
[mol MnO2] CMtimes102
[emu mol] ef
[microB] x1
[mol Mn2+O2] x2
[mol Mn3+O2] 3 1272 582 268 032 5 1979 562 343 157 10 3777 549 555 445 20 6688 517 492 1508 35 12239 502 377 3123 50 15427 496 268 4732
Tabel 45 Molar Curie constants effective magnetic moments and molar fraction of Mn2+(x1) şi Mn3+(x2) ions in xMnOmiddot(100-x)[As2O3middotTeO2] (S3)glasses
x
[mol MnO2] CMtimes102
[emu mol] ef
[microB] x1
[mol Mn2+O2] x2
[mol Mn3+O2] 3 1297 588 287 013 5 1938 556 312 188 10 3804 551 575 425 20 6766 52 549 1451 35 11148 504 441 3059 50 15528 498 358 4642
30
Tabel 46 Molar Curie constants effective magnetic moments and molar fraction of Mn2+(x1) şi Mn3+(x2) ions in xMnOmiddot(100-x)[3B2O3middotLi2O] (S5) glasses
x
[mol MnO2] CMtimes102
[emu mol] ef
[microB] x1
[mol Mn2+O2] x2
[mol Mn3+O2] 3 127 581 265 035 5 1919 554 303 197 10 3681 542 486 514 20 7215 519 53 147 35 1121 506 505 2995 50 15898 501 493 4507
433 Comparative study by electron paramagnetic resonance (EPR) of
xFe2O3middot(100-x)[As2O3middotBO] where BO =gt TeO2 or PbO and
x Fe2O3middot(100-x) [3B2O3middotLi2O] glasses
In order to obtain more information regarding the behavior of iron ions in
xFe2O3middot(100-x)[As2O3middotBO] where BO =gt TeO2 (S4) or PbO (S2) şi xFe2O3middot(100-
x)[3B2O3middotLi2O] glasses were investigated by EPR spectroscopy on a large compositional
range with 05 le x le 35 mol Fe2O3 The EPR spectra of Fe3+ in xFe2O3middot(100-
x)[As2O3middotPbO] (S2) xFe2O3middot(100-x)[As2O3middotTeO2] (S4) and xFe2O3middot(1-x)[3B2O3middotLi2O]
(S6) are presented in figure 427-29 These spectra present two absorption lines centered at
gef 43 and gef 20 up to x le 35mol Fe2O3 systems studied
The absorption line centered at gef 43 is due to isolated Fe3+ ions [34-36] The
absorption line centered at gef 20 may be attributed to Fe3+ species interacting by magnetic
coupling dipolar and or super exchange the last ones forming magnetic clusters [37-41]
The evolution of the spectra is easier to follow considering the dependence of
concentration on the EPR parameters the line - intensity (obtained as an integral of the area
under the corresponding EPR signal) J and the line - width ΔB The evolution of J and AB
reflects the structural transformations which appear in the glass matrices due to the increasing
of iron ions content
The intensity and the line - width of the resonance line from gef 43 for all
investigated systems is represented in figure 430 (a b) The intensity of the resonance line
from gef 43 increases for (S2) and (S4) up to 3 mol and up to 5 mol for (S6) then
decreases for all systems investigated A line broadening up to 3 mol from gef 43 for
these systems can be observed due to increasing of Fe3+ isolated number of ions
31
1000 2000 3000 4000 5000
40
Firs
t der
ivat
ive
of a
bsor
ptio
n [u
a]
B [G]
x [mol Fe2O3]
05
1
3
5
1020
35 2
40
20
10
10
10
amplif
Fig427 The EPR spectra of Fe3+ for xFe2O3middot(100-x)[As2O3middotPbO] (S2)
glass system
1000 2000 3000 4000 5000
100
B [G]
Firs
t der
ivat
ive
of a
bsor
ptio
n [u
a]
10080
20
50
20
20
3
05
1
5
102035
x [mol Fe2O3] amplif
Fig428 The EPR spectra of Fe3+ for xFe2O3middot(100-x)[As2O3middotTeO2] (S4)
glass system
32
1000 2000 3000 4000 5000
Firs
t der
ivat
ive
of a
bsor
ptio
n [u
a]
B [G]
3
05
1
5
10
20
35
x [mol Fe2O3]
30
50
20
20
10
30
30
amplif
Fig429 The EPR spectra of Fe3+ for xFe2O3middot(100-x)[3B2O3middotLi2O] (S6)
glass system
The intensity and the line - width of the resonance line from gef 43 for all
investigated systems is represented in figure 430 (a b)The resonance line from gef 20 is
attributed to Fe3+ ions that interact by magnetic coupling dipolar orand super exchange
interractions can be observed in all compositional domains
The intensity of the resonance line from gef 20 can be observed as increasing up to
x=35 mol for (S2) and (S6) system and 10 mol for (S4) system with increased iron
ions content The line - width of the resonance line from gef 20 increased up to 10mol
for (S2) system and up to 3 mol for (S4) and 5mol for (S6) due to Fe3+species
interacting by magnetic coupling dipole-dipole Above this concentration line - width of the
resonance line from gef 20 can be attributed to dipolar and super exchange magnetic
interactions The ΔB = f(x) dependence reflects the competion between the broadening
mechanism (dipole ndash dipole interactions the interactions between ions in diferent
valence state and structural disorder) and the narrowing ones (super exchange
interactions)
33
0 5 10 15 20 25 30 35 40
x [mol]
J [ u
a]
S2 S4 S6
a)
0 5 10 15 20 25 30 35 4040
60
80
100
120
140
160
180
200
220 S2 S4 S6
B[G
]
x [mol]
a b
Fig 430 The dependence on Fe2O3 content of the intensity (a) and width (b) of
resonance line at gef 43 for xFe2O3middot(100-x)[As2O3middotPbO] (S2)
xFe2O3middot(100-x)[As2O3middotTeO2] (S4) and xFe2O3middot(100-x)[3B2O3middotLi2O] (S6) glasses
0 5 10 15 20 25 30 35 40
x [mol]
J [ u
a]
S2 S4 S6
a)
0 5 10 15 20 25 30 35 40
200
400
600
800
1000
1200
1400
1600
x [mol]
B
[G] S2
S4 S6
a b
Fig 431 The dependence on Fe2O3 content of the intensity (a) and width (b) of
resonance line at gef 20 for xFe2O3middot(100-x)[As2O3middotPbO] (S2)
xFe2O3middot(100-x)[As2O3middotTeO2] (S4) and xFe2O3middot(100-x)[3B2O3middotLi2O] (S6) glasses
34
434 Comparative study by magnetic susceptibility measurements of
xFe2O3middot(100-x)[As2O3middotBO] where BO =gt TeO2 or PbO and
xFe2O3middot(100-x) [3B2O3middotLi2O] glasses
The magnetic susceptibility data are in good agreement with the EPR result The magnetic
behavior of the glasses xFe2O3middot(100-x)[As2O3middotPbO] (S2) xFe2O3middot(100-x)[As2O3middotTeO2]
(S4) and xFe2O3middot(100-x)[3B2O3middotLi2O] (S6) for 3 x 50 mol Fe2O3 are presented in
figure 432 - 34
For (S2) glass systems up to x 10 mol x 3 mol (S5) glass systems and x 5
mol (S6) glass systems the temperature dependence of the reciprocal magnetic susceptibility
obeys a Curie law In this concentration range the iron ions are predominantly isolated orand
participate in dipole-dipole interactions At higher concentrations the reciprocal magnetic
susceptibility obeys a Curie-Weiss law with negative paramagnetic Curie temperature (p)
characteristic to antiferromagnetic coupled ions by means of super exchange interactions(fig
435) This behavior of iron ions is confirmed by the shape of the EPR spectra
80 100 120 140 160 180 200 220 240 260 2800
1
2
3
4
5
6
7
8
9
10
11
[
emu
mol
]-1
T [K]
3 mol 5 mol 10 mol 20 mol 35 mol 50 mol
Fig432 The temperature dependence of -1 for xFe2O3middot(100-x)[As2O3middotPbO] (S2)
3 x 50 mol
35
80 100 120 140 160 180 200 220 240 260 2800
1
2
3
4
5
6
7
8
9
10
T [K]
[
emu
mol
]-1
3 mol 5 mol 10 mol 20 mol 35 mol 50 mol
Fig433 The temperature dependence of -1 for xFe2O3middot(100-x)[As2O3middotTeO2] (S4)
3 x 50 mol
80 100 120 140 160 180 200 220 240 260 2800
1
2
3
4
5
6
7
8
9
10
11
3 mol 5 mol 10 mol 20 mol 35 mol 50 mol
T [K]
[
emu
mol
]-1
Fig434 The temperature dependence of -1 for xFe2O3middot(100-x)[3B2O3middotLi2O] (S6)
3 x 50 mol
36
0 10 20 30 40 50
0
10
20
30
40
50
x [mol]-
p [K]
(S2) (S4) (S6)
Fig435Concentration dependence of (p) for sistemele xFe2O3middot(100-x)[As2O3middotPbO] (S2) xFe2O3middot(100-x)[As2O3middotTeO2] (S4) and xFe2O3middot(100-x)[3B2O3middotLi2O] (S6)
for 3 x 50 mol Fe2O3
Using the representation 1 = f(T) the molar Curie constants CM the effective
magnetic moments and molar fraction of Fe3+(x1) şi Fe2+(x2) ions were calculated and
represented in tables 47-9
Table 47 Molar Curie constants effective magnetic moments and molar fraction of
Fe3+(x1) şi Fe2+(x2) ions in xFe2O3middot(100-x)[As2O3middotPbO] glasses (S2)
x [mol Fe2O3]
CMtimes102
[emu mol] ef
[microB] x1
[mol Fe23+O3]
x2 [mol Fe2
2+O3] 3 2526 58 261 039 5 393 56 332 168 10 7326 541 476 524 20 13459 519 53 147 35 23364 516 829 2671 50 32154 507 767 4233
Table 48 Molar Curie constants effective magnetic moments and molar fraction of
Fe3+(x1) şi Fe2+(x2) ions in xFe2O3middot(100-x)[As2O3middotTeO2] glasses (S4)
x [mol Fe2O3]
CMtimes102
[emu mol] ef
[microB] x1
[mol Fe23+O3]
x2 [mol Fe2
2+O3] 3 2571 585 277 023 5 4016 566 363 137 10 7911 562 686 314 20 14992 521 643 929 35 22676 509 601 2899 50 30959 497 313 4687
37
Table 49 Molar Curie constants effective magnetic moments and molar fraction of Fe3+(x1) şi Fe2+(x2) ions in xFe2O3middot(100-x)[3B2O3middotLi2O] glasses (S6)
The results allowed to consider that the magnetic properties of the studied glasses can
be explained through magnetic interractions between Fe3+ - Fe3+ Fe3+- Fe2+ and Fe2+- Fe2+ that
explain the dependences of RPE parameters concentration
SELECTED CONCLUSIONS
In this thesis xMOmiddot(100-x)[As2O3middotTeO2] xMOmiddot(100-x) [As2O3middotPbO] and
xMOmiddot(100-x)[3B2O3middotLi2O] glasses where MO =gt MnO or Fe2O3 were comparatively
studied in 0 le x le 50 mol The structural modifications of investigated glass matrices were
comparatively followed in function of the manganese or iron ions on the investigated glass
matrices were followed
The study by FT-IR spectroscopy shows that the evolution of the spectra of
xMnOmiddot(100-x) [As2O3middotPbO] with the addition and the increasing of the MnO content suggest
that the manganese ions break up a part of As ndash O ndash As Pb ndash O ndash Pb and probably of As ndash O ndash
Pb bonds The addition of MnO in the As2O3middotPbO glass matrix is leading to a disordering of
the glasses structure with the increasing of the MnO content
The evolution of the absorption bands for FT ndash IR spectrum of xFe2O3middot(1-x)
[As2O3middotPbO] glasses are determined by the addition of Fe2O3 content It can be observed to
shift the bands assigned As ndash O ndash As vibrations from AsO3 units due to changing to length As
ndash O ndash As bonds and interne angles of AsO3 units disappears PbO4 units and appears FeO6
units The addition of Fe2O3 in the As2O3middotPbO glass matrix determined a disordering of the
glasses structure with the increasing of the Fe2O3 content
From FT-IR absorption spectra of the investigated xMOmiddot(100-x)[As2O3middotTeO2] glasses
system where MO =gt MnO or Fe2O3 it can be observed that the addition and increasing of
manganese ions concluded the contraction of As-O-As bonds from totally symmetric
x [mol Fe2O3]
CMtimes102
[emu mol] ef
[microB] x1
[mol Fe23+O3]
x2 [mol Fe2
2+O3] 3 2542 582 268 032 5 3943 561 338 162 10 7423 544 506 494 20 13568 520 549 1451 35 23094 513 731 2769 50 31746 503 584 4416
38
stretching vibrations of AsO3 units for x ge10 mol there can be an increase in number of As-
O-As bonds from AsO3 units orand a length these linkage to doubly degenerate stretching
vibrations of AsO3 units and a stretching vibration mode of TeO3 tp with NBO It can be
remarked from the FT-IR absorption spectra the gradual transformation of symmetric
stretching vibration mode of Te-O bonds from TeO3 units in TeO4 (tbp) units and the presence
of MnO2 units Once with the addition of iron ions the xFe2O3middot(100- x)[As2O3middotTeO2]
glasses behave like xMnOmiddot(100-x)[As2O3middotTeO2] glasses but in this system the
appearance of FeO6 units can be seen
From FT-IR spectra in xMOmiddot(100-x)[3B2O3middotLi2O] glasses where MO =gt MnO or
Fe2O3 can be concluded that the addition of manganese or iron ions in vitreous matrices leads
to the increase of the disorder degree
The study by Raman spectroscopy shows that the evolution of the spectra the addition
of MnO in the [As2O3middotPbO]glass matrix determined an order degree of the vitreous matrix
The intensity of the bands attributed vibrations As ndash O ndash As bonds from As2O units and
bending vibrations of As ndash O ndash As from As2O units shift to a higher wave length that suggests
an increase in the As2O units comparative to AsO3 units With the increase of iron ions content
in the As2O3middotPbO glass matrix the number of these structural units decreases due to the
increasing of the disorder in the studied glasses
With the increasing of manganese content in As2O3TeO2 glass matrix the intensity
of these bands is increasing showing that the manganese content favorites the formation of
TeO4 (tbp) and TeO3 (tp) units For high concentrations of iron ions in xFe2O3middot(100-
x)[As2O3 TeO2] system of glasses the number of As-O-As linkages appear in Raman
spectrum due to stretching vibrations of As-O-As and vibrations of the continuous TeO4 (tbp)
network show a significant decrease
Studying the Raman spectra of xMOmiddot(1-x)[3B2O3middotLi2O] glass system where MO =gt
MnO or Fe2O3 it has been observed that the absorption bands presented in vitreous matrix
gradually decreased with an increase in the manganese or iron content in both glasses system
which suggested an increase of the disorder in these vitreous systems
The EPR spectra presents the behavior of manganese or iron ions in different vitreous
matrices xMOmiddot(100-x)[As2O3middotBO] where MO=gtMnO or Fe2O3 and BO =gt TeO2 or
PbO and xMOmiddot(100-x) [3B2O3middotLi2O] Glasses were investigated by EPR spectroscopy on a
large compositional range with 0 le x le 50 mol The absorption line centered at gef 43 and
is due to isolated Mn2+ ions The absorption line centered at gef 20 may be attributed to
Mn2+ species interacting by magnetic coupling dipolar and or super exchange the last ones
forming magnetic clusters The EPR spectra of Fe3+ in xFe2O3middot(100-x)[As2O3middotPbO]
xFe2O3middot(100-x)[As2O3middotTeO2] and xFe2O3middot(1-x)[3B2O3middotLi2O] are presented two absorption
lines centered at gef 43 and gef 20 up to x le 35mol Fe2O3 systems studied
39
The absorption line centered at gef 43 is due to isolated Fe3+ ions The absorption
line centered at gef 20 may be attributed to Fe3+ species interacting by magnetic coupling
dipolar and or super exchange the last ones forming magnetic clusters
The evolution of the spectra is easier to follow considering the dependence of
concentration on the EPR parameters the line - intensity (obtained as an integral of the area
under the corresponding EPR signal) J and the line - width ΔB The evolution of J and AB
reflects the structural transformations which appear in the glass matrices due to the increase of
manganese ions content
The magnetic susceptibility data are in good agreement with the EPR result The
magnetic behavior of the glasses from xMnOmiddot(100-x)[As2O3middotBO] where BO =gt TeO2 (S3)
or PbO (S1) and xMnOmiddot(100-x)[3B2O3middotLi2O] (S5) glasses for 3 le x le 50 mol MnO
For (S1) and (S3) system glasses up to x 3 mol and x 5 mol (S5) glass
system the temperature dependence of the reciprocal magnetic susceptibility obeys a Curie
law In this concentration range the manganese ions are predominantly isolated orand
participate in dipole-dipole interractions At higher concentrations the reciprocal magnetic
susceptibility obeys a Curie-Weiss law with negative paramagnetic Curie temperature (p)
characteristic to antiferromagnetic coupled ions by means of super exchange interractions This
behavior of manganese ions is confirmed by the shape of the EPR spectra Using the
representation 1 =f(T) the molar Curie constants CM the effective magnetic moments
and molar fraction of Mn2+(x1) şi Mn3+(x2) ions were calculated The magnetic susceptibility
data are in good agreement with the EPR result
The magnetic behavior of the glasses xFe2O3middot(100-x)[As2O3middotPbO] (S2)
xFe2O3middot(100-x)[As2O3middotTeO2] (S4) and xFe2O3middot(100-x)[3B2O3middotLi2O] (S6) for 3 x 50
mol Fe2O3 are presented For (S2) glass systems up to x 10 mol x 3 mol (S5)
glass systems and x 5 mol (S6) glass systems the temperature dependence of the
reciprocal magnetic susceptibility obeys a Curie law In this concentration range the iron ions
are predominantly isolated orand participate in dipole-dipole interactions At higher
concentrations the reciprocal magnetic susceptibility obeys a Curie-Weiss law with negative
paramagnetic Curie temperature (p) characteristic to antiferromagnetic coupled ions by
means of super exchange interactions(fig 435) This behavior of iron ions is confirmed by the
shape of the EPR spectra Using the representation 1 = f(T) the molar Curie constants
CM the effective magnetic moments and molar fraction of Fe3+(x1) şi Fe2+(x2) ions were
calculated
40
REFERENCES
Chapter 1
[1] I Ardelean bdquoIntroducere icircn studiul materialelor oxidice cu structură vitroasă EdNapocaStar Cluj Napoca 2002 [2] G Srinivasarao N Veeraiah J All Com 327 52-65(2001) [3] G Srinivasarao N Veeraiah J Phys Chem Solids 63705-717(2002) [4] DBecherescu VCristea FMarx IMenessz FWinter Chimia stării solide Ed Şt şi Encicl Bucucureştivol 1 1983 [5] J Wong CAAngell Glass-Structure by Spectroscopy Dekker Inc New York 1976 [6] BEWarren HKKrutter O Morningstat J Am Ceram Soc 19 202 (1936) [7] LLSperry JD Mackenzie Phys Chem Glasses 9 91 (1968) [8] WLKonijnendijk JMStevels J Non-Cryst Solids 18 307 (1975) [9] FCEversteyn JM Stevels HJ Naterman Phys Chem Glasses 1 134 (1963) [10] G Fuxi Optical and Spectroscopie Properties of Glass Springer-Verlag Shanghai Scientific Technical Pub Shanghai 1991 [11] YDYiannopoulos GDChryssikos EIKamitsos Phys Chem Glasses 42(3) 164 (2001) [12] MGFerreira da Silva BFOCosta J Non-Cryst Solids 293-295 534 (2001) [13] RYordanova YDimitriev VDimitriev S Kassabov DKlissurski JNon-Cryst Solids 201 141 (1996) [14] W L Konijnendijk J M Stevels J Non-Cryst Solids 18 307 (1980) [15] M Iron M Couzi ALevasseur JBrethous JSolidState Chem 31 285 (1980) [16] TFurukawa WBWhite PhzsChemGlasses 21 85 (1980) [17] E I Kamitsos M A Karakassides GD Chryssikos J Phys Chem 90 4528 (1986) [18] E I Kamitsos M A Karakassides GD Chryssikos J Phys Chem 91 1073 (1987) [19] TWBril Philips Res Rep Suppl 2 117 (1976) [20] E I Kamitsos M A Karakassides GD Chryssikos J Phys Chem 30 203 (1989) [21] BNMeera JRamakrishna J Non-Cryst Solids 159 1 (1993) [22] KWitke THubert PReich JRamanSpectr 24 407 (1993) [23] E I Kamitsos M A Karakassides Phys Chem Glasses 30 19 (1989) [24] MPeteanu Teză de doctoratrdquo Universitatea Babeş-Bolyairdquo Cluj Napoca (1989) [25] PCTaylor PJBray JPhys Chem Solids 33 43 (1972) [26] IArdelean MPeteanu GhIlonca DPop Solid State Commun 33 653 (1980) [27] AV De Wijn RE Van Balderen JKemPhys 46 4 (1967) [28] DL Griscom RE Griscom J Phys Chem Glasses 12 19 (1971) [29] JWH Schreurs JChem Phys 69 2151 (1978) [30] AlNicula M Peteanu IArdelean Studia Univ Babeş-Bolyai Physica 2 65 (1979) [31] M Peteanu IArdelean SFilip ITodor GSalvan Studia Univ Babeş-Bolyai Physica XL 2 9 (1995) [32] IArdelean M Peteanu SFilipV Simon ITodor Solid State Commun 105 (5) 339 (1998) [33] SKMendiratta EGuedes de Sousa JMatSci Lett7 733 (1988) [34] IArdelean M Peteanu SFilip V Simon GGyorffy Solid State Commun 102 (4) 341 (1997) [35] IArdelean M Peteanu SFilip V Simon FCiorcas ITodor JMagnMagn Mat 196-197 257 (1999) [36] JKliava RBerger YServant JEmery JMGreneche JTrokss J Non-Cryst Solids 202 205 (1996) [37] LDBogomolova NA Krasilnikova VLBogdanov VDKhaliev VV Mitrofanov J Non-Cryst Solids 188 130 (1995) [38] DLoveridge SPark PhysChem Glasses 12 19 (1971) [39] IArdelean G Salvan M Peteanu V Simon FCiorcas Mod PhysLett B 13 (22-23) 801 (1999)
41
[40] JLRao AMuraly EDRao J Non-Cryst Solids 202 215 (1996) [41] CPrakash S Husain RJ Singh SMollah JAlloys Compon 326 47 (2001) [42] EGuedes de Sousa SKMendiratta JMMachado Da Silva Portugal Phys 17 (3-4) 203 (1986) [43] TCastner GSNewell WCHolton CP Slichter JChem Phys 32 668 (1960) [44] SPChaudhuri SKPatra JMatSci 35 4735 (2000) [45] IArdelean HH Qiu HSakata Matt Lett 32 335 (1997) Chapter 2 [1] J Wong C A Angel Glass Structure by Spectroscopy Marcel Dekker inc New-York 1976 [2] I Ardelean bdquoIntroducere icircn studiul materialelor oxidice cu structură vitroasă EdNapocastar Cluj-Napoca 2002 [3] N Avram GH Mateescu Spectroscopia icircn infraroşu Aplicaţii icircn chimia organică Ed Tehnică Bucureşti 1968 [4] TIliescu Spectroscopie optică moleculară vibraţională şi electronică Ed Casa Cărţii de Ştiinţă Cluj- Napoca 2000 [5] S Aştilean bdquoMetode şi tehnici moderne de spectroscopie optică Ed Casa Cărţii de Ştiinţă Cluj - Napoca 2002 p 5 [6] I Ursu Rezonanţă Electronică de Spinrdquo Ed AcademieiBucureşti (1965) [7] CHHurd ContempPhys 23 (5) 469 (1982) [8] GWAnderson WDCompton JChemPhys52 6166 (1970) [9] MS Seehra GSrinivasan Landolt-Bornstein (New Series) SubVolume F3 Springer-Verlag Berlin 1994 [10] GToulouse ContempPhys 2115 (1977) [11] NMMurayMagnetic susceptybility EdInterscience New York P1773 1963 [12] JBGoodenough Magnetism and Chemical Bond EdInterscience New York 1963 [13] IArdelean G Salvan M Peteanu V Simon FCiorcas Mod PhysLett B 13 (22-23) 801 (1999) [14] IArdelean MPeteanu R Ciceo Lucăcel Studii de rezonanţă paramagnetică electronică şi magnetice ale unor ioni 3d icircn sticle pe bază de B2O3 Ed Presa Univesitară Clujeană 2005 [15] IArdelean PhysStatSol (b) 87K137 (1978) [16] IArdelean Solid State Commun 31 75 (1979) [17] EJFrieble LKWilson AWDozier DLKinser PhysStatSol (b) 45 323 (1971) [18] DWMoon JMAitken RKMcCrone GS Ciloszik PhysChe Glasses 16 (5) 91 (1975) [19] SFilip Teză de doctorat UnivBabeş-Bolyai Cluj Napoca 1996 [20] CJSchinkel GWRathenou Physics of Non-Crystaline Solids North Holland Publ Co Amsterdam 215 1965 [21] EJFrieble LKWilson NCKoon DLKinser JAm Ceram Soc 57-237 (1974) [22] RJLandry JT Fournier CGYoung JChemPhys 46 1285 (1967) [23] WSimpson PhysStatSolidi b40 207 (1970) [24] RHasegawa PhysRevB b(5) 1631 (1971) [25] IArdelean GhIlonca MPeteanu Solid State Commun 52 145 (1984) [26] IArdelean GhIlonca OCozar J Physique 49 C8 1107 (1988) Chapter 3 [1] LFBates Modern Magnetism p133 Cambridge University Press London 1962 [2] IArdelean GhIlonca DBarbos Solid State Commun 40 769 (1981) [3] EBurzo IUrsu DUngur IArdelean JMatSci 15 581 (1980) [4] EBurzo IUrsu DUngur IArdelean MatResBull 15 1273 (1980) [5] DLGriscom Glass Science and Technology 48 151 (1990) [6] PJBray AH Silver Modern aspects of the vitreous state vol1 Butterworth
42
London 1960 [7] IArdelean Teza de doctorat UnivBabeş-Bolyai Cluj Napoca 1979 [8] SAştilean bdquoMetode şi tehnici moderne de spectroscopie opticărdquo EdCasa Cărţii de Ştiinţă Cluj ndash Napoca 2002 p5 [9] IArdelean RCiceo-Lucăcel ldquoFizica şi Tehnologia Materialelor Oxidice Lucrări Practicerdquo Ed Univ ldquoBabeş-Bolyairdquo Cluj-Napoca 2000 [10] VPop IChicinaş NJumate Fizica materialelor Metode experimentalerdquo EdPresa Universitară Clujeană 2001 [11] IUrsu Rezonanţă electronică de spinrdquo EdAcademiei Bucureşti 1965 Chapter 4 [1] I Ardelean S Lupşor D Rusu Solid State Sci 10 1384(2008) [2] I Ardelean S Lupşor D Rusu trimis spre publicare la Physica B decembrie 2009 [3] P Tarte Spectrochim Acta 18 467 (1962) [4] R A Condrate J Non ndash Cryst Solids 84 26 (1986) [5] G Srinivasarao N Veeraiah Phys Stat Sol (a) 191 370(2002) [6] G Srinivasarao N Veeraiah J Phys Chem Solids 63 705(2002) [7] G Srinivasarao N Veeraiah J All Com 327 52 (2001) [8] DK Durga N Veeraiah Bull Mater Sci 24 (4) 421 (2001) [9] F F Bentley L D Smithson A L Rozek InfraredndashSpectra and Characteristic Frequencies 700-300 cm-1 Interscience New York 1968 p 103 [10] O Noguera T Merle-Mejean AP Mirgorodsky MB Smirnov P Thomas J-C Champarnaud-Mesjard J Non-Cryst Solids 330 50 (2003) [11] BVR Chowdari KL Tan Fang Ling Solid State Ionics 113 ndash 115 711(1998) [12] C Jiang J Zhang H Mao F Gan Glass Technol 39(6) 200(1998) [13] MR Sahar K Sulhadi MS Rohani J Mater Sci 42 824(2007) [14] C Horea D Rusu I Ardelean J Mater Sci Mater Electron 20 905(2009) [15] GE Rachkovskaya GB Zakharevich J Appl Spectrosc 74 86(2007) [16] I Ardelean S Lupşor D Rusu trimis spre publicare la Journal of Materials Science Materials in Electronics decembrie 2009 [17] I Ardelean S Lupşor D Rusu trimis spre publicare la Modern Physics Letters B decembrie 2009 [18] R Iordanova Y Dimitriev V Dimitrov S Kassabov D Klissurski J Non ndash Cryst Solids 231 227 (1998) [19] R Iordanova Y Dimitriev S Kassabov D Klissurski J Non ndash Cryst Solids 204 141 (1996) [20] J O Jensen S J Gilliam A Banerjee D Zeroka S J Kirkby C N Merrow J Mol Struct (Theochem) 664 145 (2003) [21] G N Papatheodorou S A Solin Solid State Commun 16 5 (1975) [22] BVR Chowdari KL Tan Fang Ling J Mat Sci 35 2015 (2000) [23] R C Lucacel C Marcus V Timar I Ardelean Solid State Sci 9 850 (2007) [24] CP Varsamis EI Kamitsos GD Chryssikos Solid State Ionics 136ndash137 1031 (2000) [25] Sherief M Abo-Naf Fatma H El Batal Moenis A Azooz Mat Chem Phys 77 846 (2002) [26] SG Motke SP Yawale SS Yawale Bull Mater Sci 25 (10) (2002) [27] R Akagi N Ohtori N Umesaki J Non ndash Cryst Solids 293 471(2001) [28] E I Kamitsos M A Karakassides G D Chryssikos J Phys Chem 91(5) 1073 (1987) [29] H Ushida Y Iwadate T Hattori S Nishiyama K Fukushima Y Ikeda M Yamaguchi M Misawa T Fukunaga T Nakazawa S Jitsukawa J Alloys Compd 377 167 (2004) [30] I Ardelean F Ciorcas M Peteanu S Lupşor G Salvan Balkan Phys Lett 5 860 (1997)
43
[31] I Ardelean M Peteanu V Simon O Cozar F Ciorcas S Lupşor J Magn Magn Mater 196 253 (1999) [32] IArdelean MPeteanu GhIlonca Phys Stat Sol (a) 58 K33(1980) [33] IArdelean MPeteanu R Ciceo-Lucăcel ldquoStudii de rezonanţă paramagnetică electronică şi magnetice ale unor ioni 3d icircn sticle pe bază de B2O3rdquo Ed Presa Univ Clujeană Cluj Napoca 2005 p 171 [34] JLRao AMuraly EDRao J Non-Cryst Solids 202 215 (1996) [35] RPSChakradhar AMurali JLRao Optical Mat 10 109 (1998) [36] IArdelean MPeteanu SFilip VSimon GGyorffy Solid State Commun 102(4) 341 (1997) [37] IArdelean MPeteanu VSimon SFilip FCiorcaş ITodor J Magn Magn Mat 196-197 257 (1999) [38] IArdelean GSalvan MPeteanu VSimon CHimcinschi FCiorcas Mod Phys Lett B 13(22-23) 801 (1999) [39] IArdelean HHQiu HSakata Mat Lett 32 335 (1997) [40] SPChaudhuri SKPatra J Mat Sci 35 4735 (2000) [41] I Ardelean M Peteanu V Simon G Salvan J Mat Sci Technol 18 (3) 1 (2002)

22
The band at ~ 1061 cm-1 is assigned to stretching vibrations of B ndash Oslash bonds in -4BOslash
tetrahedra from tri- tetra- and penta-borate groups and the band at ~ 786 cm-1 is assigned
to bending vibrations of O3B ndash O ndash BO4 bonds The band at ~ 698 cm-1 is attributed to
Bending vibrations of B-O-B bonds from pentaborate groups The bands at ~ 614 cm-1 and
~ 460 cm-1 are assigned to bending vibrations of O ndash B ndash O bonds and the band at ~ 490 cm-
1 is assigned to bending vibrations of B-O-B bonds
From FT-IR spectra it can be concluded that the addition of manganese or iron ions in
vitreous matrices leads to the increase of the disorder degree
Also the structural changes that appeared in 3B2O3middotLi2O vitreous matrix with an
addition MnO or Fe2O3 content can be studied Ar=A4A3 ratio(A4 - relative number of -4BOslash tetrahedral borate units A3 - relative number of triangular (BOslash3 and BOslash2O-) units
0 10 20 30 40 50
010
015
020
Ar
x [mol]
MnO Fe2O3
Fig 414 The evolution of Ar ratio with the MnO or Fe2O3 content of
xMnOmiddot(100-x)[3B2O3middotLi2O] şi xFe2O3middot(100-x)[3B2O3middotLi2O] The evolution of the value of this ratio also allows a visualization of the effects
determined by the presence of the manganese or iron ions in the matrix The value Arltlt 1
indicated that BO3 is dominant related to BO4
422 Study by Raman spectroscopy of xMOmiddot(100-x)[3B2O3middotLi2O] glasses
where MO =gt MnO or Fe2O3
The Raman spectra obtained for xMOmiddot(1-x)[3B2O3middotLi2O] glass system were MO =gt
MnO or Fe2O3 with 0 le x le 50 mol are presented in figure 414-16 and their structural
assignments are summarized in table 43
Studying the Raman spectra of xMOmiddot(1-x)[3B2O3middotLi2O] glass system where MO =gt
MnO or Fe2O3 it has been observed that the absorption bands presented in vitreous matrix
gradually decreased with an increase in the manganese or iron content in both glasses system
which suggested an increase of the disorder in these vitreous systems
23
1000 2000 3000
B2O3Li2O
Wavenumber [cm-1]
Ram
an In
tens
ity [a
u]
1430
107490
279
1471
Fig 415 Raman spectra of vitreous matrix 3B2O3middotLi2O
500 1000 1500 2000 2500 3000
1430
107490
2791
0
Wavenumber [cm-1]
Ram
an In
tens
ity [a
u]
1
3
20
05
5
10
35
50
MnO
471
Fig 416 Raman spectra of xMnOmiddot(100-x)[3B2O3middotLi2O] glasses
400 600 800 1000 1200 1400 1600
Wavenumber [cm-1]
Ram
an In
tens
ity [a
u]
0
1
3
20
05
5
10
35
50
Fe2O3
1430
1074
90279
1
471
Fig 417 Raman spectra of x Fe2O3middot(100-x)[3B2O3middotLi2O] glasses
24
43 Comparative study by electron paramagnetic resonance (EPR) and magnetic
susceptibility measurements of xMOmiddot(100-x)[As2O3middotTeO2] xMOmiddot(100-x)
[As2O3middotPbO] and xMOmiddot(100-x)[3B2O3middotLi2O] glasses where MO =gt MnO or Fe2O3
431 Comparative study by electron paramagnetic resonance (EPR) of
xMnOmiddot(100-x)[As2O3middotBO] where BO =gt TeO2 or PbO
and xMnOmiddot(100-x) [3B2O3middotLi2O] glasses
In order to obtain more information regarding the behavior of manganese ions in
different vitreous matrices [3031] xMnOmiddot(100-x)[As2O3middotBO] where BO =gt TeO2 or PbO
and xMnOmiddot(100-x) [3B2O3middotLi2O] glasses were investigated by EPR spectroscopy on a large
compositional range with 0 le x le 50 mol The EPR spectra of Mn2+ for xMnOmiddot(100-
x)[As2O3middotPbO] (S1) xMnOmiddot(100-x)[As2O3middotTeO2] (S3) and xMnOmiddot(100-x)[3B2O3middotLi2O]
(S5) are presented in figure 418-20 These spectra present two absorption lines centered at gef
43 and gef 20 in all systems
The absorption line centered at gef 43 and is due to isolated Mn2+ ions [32] The
absorption line centered at gef 20 may be attributed to Mn2+ species interacting by magnetic
coupling[33] dipolar and or super exchange the last ones forming magnetic clusters [32]
The evolution of the spectra is easier to follow considering the dependence of
concentration on the EPR parameters the line - intensity (obtained as an integral of the area
under the corresponding EPR signal) J and the line - width ΔB The evolution of J and AB
reflects the structural transformations which appear in the glass matrices due to the increase of
manganese ions content
The intensity and the line - width of the resonance line from gef 43 for all
investigated systems is represented in figure 421(ab)
The intensity of the resonance line from gef 43 for all investigated glass systems
decreases due to the decrease of the isolated manganese ions numbers The line - width from
gef 43 for (S1) and (S3) systems decreases due to decrease of Mn2+ number and to the
structural disorder in glasses with the increase of MnO content For (S5) glass system the line
- width of the resonance line there is an increase in all compositional domains
The intensity of the resonance line from gef 20 can be observed as increasing up to
x=14 mol for (S1) system up to x=8mol for (S3) system and 20 mol for (S5)
system The line - width of the resonance line from gef 20 for (S1) and (S3) systems
increases up to 3 mol and 5mol for (S5) due to Mn2+ species interacting by magnetic
coupling dipole- dipole as the main broadening mechanism Over this concentration line ndash the
width of the resonance line from gef 20 is straight and it can be assumed that the
manganese ions begin to manifest super exchange magnetic interactions
25
1000 2000 3000 4000 5000
Firs
t der
ivat
ive
of a
bsor
ptio
n [u
a]
05
1
3
5
10
20
35
50
x [mol Mn2O3]amplif
B [G]
10
200
40
80
400
5
1
1
Fig 418 The EPR spectra of Mn2+ for xMnOmiddot(100-x)[As2O3middotPbO] (S1)
glass system
1000 2000 3000 4000 5000
Firs
t der
ivat
ive
of a
bsor
ptio
n [u
a]
x [mol MnO]
051
3
5
10
20
35
50
9
500
400
50
100
4
1
amplif
B [G]
1
Fig 419 The EPR spectra of Mn2+ for xMnOmiddot(100-x)[As2O3middotTeO2] (S3)
glass system
26
1000 2000 3000 4000 5000
501
B [G]
Firs
t der
ivat
ive
of a
bsor
ptio
n [u
a]
1
4
9
10
30
60
100
amplif
05
1
3
5
10
20
35
x [mol MnO]
Fe3+
Fig 420 The EPR spectra of Mn2+ for xMnOmiddot(100-x)[3B2O3middotLi2O] (S5)
glass system
0 2 4 6 8 10 12 14 16 18 20 22
x [mol]
J [ u
a]
S1 S3 S5
-2 0 2 4 6 8 10 12 14 16 18 20 22
50
100
150
200
250
300
S1 S3 S5
x [mol]
B
[G]
a b
Fig 421 The dependence on MnO content of the intensity (a) and width(b) of resonance
line at gef 43 for xMnOmiddot(100-x)[As2O3middotPbO] (S1) xMnOmiddot(100-x)[As2O3middotTeO2] (S3) şi
xMnOmiddot(100-x)[3B2O3middotLi2O] (S5) system glasses
27
0 10 20 30 40 50
x [mol]
J [ u
a]
S1 S3 S5
0 10 20 30 40 50
400
500
600
700
800
900
S1 S3 S5
x [mol]
B[G
]
a b
Fig 422 The dependence on MnO content of the intensity (a) and width b) of resonance
line at gef 20 for xMnOmiddot(100-x)[As2O3middotPbO] (S1) xMnOmiddot(100-x)[As2O3middotTeO2] (S3) and
xMnOmiddot(100-x)[3B2O3middotLi2O] (S5) system glasses
Following figure 418-20 it can be observed that (S1) and (S3) have had a similar
evolution but (S5) system presented for 05 le x le 5 mol (fig420) has a hyperfine
sextet[33] at gef 20due to Mn2+ isolated ions
432 Comparative study by magnetic susceptibility measurements of
xMnOmiddot(100-x)[As2O3middotBO] where BO =gt TeO2 or PbO and
xMnOmiddot(100-x)[3B2O3middotLi2O] glasses
The magnetic susceptibility data are in good agreement with the EPR result The
magnetic behavior of the glasses from xMnOmiddot(100-x)[As2O3middotBO] where BO =gt TeO2 (S3)
or PbO (S1) and xMnOmiddot(100-x)[3B2O3middotLi2O] (S5) glasses for 3 le x le 50 mol MnO are
presented in figure 423 - 25
For (S1) and (S3) system glasses up to x 3 mol and x 5 mol (S5) glass
system the temperature dependence of the reciprocal magnetic susceptibility obeys a Curie
law In this concentration range the manganese ions are predominantly isolated orand
participate in dipole-dipole interractions At higher concentrations the reciprocal magnetic
susceptibility obeys a Curie-Weiss law with negative paramagnetic Curie temperature (p)
characteristic to antiferromagnetic coupled ions by means of super exchange interractions(fig
426) This behavior of manganese ions is confirmed by the shape of the EPR spectra
28
100 150 200 250
2
4
6
8
10
12
14
16
18
20
22
T [K]
[
emu
mol
]-1
3 mol 5 mol 10 mol 20 mol 35 mol 50 mol
Fig423 The temperature dependence of -1 for xMnOmiddot(100-x)[As2O3middotPbO]
(S1) 3 le x le 50 mol
50 100 150 200 2500
2
4
6
8
10
12
14
16
18
20
22
3 mol 5 mol 10 mol 20 mol 35 mol 50 mol
T [K]
[
emu
mol
]-1
Fig424 The temperature dependence of -1 for xMnOmiddot(100-x)[ As2O3middotTeO2]
(S1) 3 le x le 50 mol
100 150 200 250
2
4
6
8
10
12
14
16
18
20
22
[em
u m
ol]-1
T [K]
3 mol 5 mol 10 mol 20 mol 35 mol 50 mol
Fig425 The temperature dependence of -1 for xMnOmiddot(100-x)[3B2O3middotLi2O]
(S5) 3 le x le 50 mol
29
0 10 20 30 40 50
0
20
40
60
80
100
x [mol]
-p [K
]
(S1) (S3) (S5)
Fig426Concentration dependence of (p) for sistemele xMnOmiddot(100-x)[As2O3middotPbO]
(S1) xMnOmiddot(100-x)[As2O3middotTeO2] (S3) şi xMnOmiddot(100-x)[3B2O3middotLi2O] (S5)
Using the representation 1 =f(T) the molar Curie constants CM the effective
magnetic moments and molar fraction of Mn2+(x1) şi Mn3+(x2) ions were calculated and
represented in tables 44 -6
Tabel 44 Molar Curie constants effective magnetic moments and molar fraction of Mn2+(x1) şi Mn3+(x2) ions in xMnOmiddot(100-x)[As2O3middotPbO] (S1) glasses
x
[mol MnO2] CMtimes102
[emu mol] ef
[microB] x1
[mol Mn2+O2] x2
[mol Mn3+O2] 3 1272 582 268 032 5 1979 562 343 157 10 3777 549 555 445 20 6688 517 492 1508 35 12239 502 377 3123 50 15427 496 268 4732
Tabel 45 Molar Curie constants effective magnetic moments and molar fraction of Mn2+(x1) şi Mn3+(x2) ions in xMnOmiddot(100-x)[As2O3middotTeO2] (S3)glasses
x
[mol MnO2] CMtimes102
[emu mol] ef
[microB] x1
[mol Mn2+O2] x2
[mol Mn3+O2] 3 1297 588 287 013 5 1938 556 312 188 10 3804 551 575 425 20 6766 52 549 1451 35 11148 504 441 3059 50 15528 498 358 4642
30
Tabel 46 Molar Curie constants effective magnetic moments and molar fraction of Mn2+(x1) şi Mn3+(x2) ions in xMnOmiddot(100-x)[3B2O3middotLi2O] (S5) glasses
x
[mol MnO2] CMtimes102
[emu mol] ef
[microB] x1
[mol Mn2+O2] x2
[mol Mn3+O2] 3 127 581 265 035 5 1919 554 303 197 10 3681 542 486 514 20 7215 519 53 147 35 1121 506 505 2995 50 15898 501 493 4507
433 Comparative study by electron paramagnetic resonance (EPR) of
xFe2O3middot(100-x)[As2O3middotBO] where BO =gt TeO2 or PbO and
x Fe2O3middot(100-x) [3B2O3middotLi2O] glasses
In order to obtain more information regarding the behavior of iron ions in
xFe2O3middot(100-x)[As2O3middotBO] where BO =gt TeO2 (S4) or PbO (S2) şi xFe2O3middot(100-
x)[3B2O3middotLi2O] glasses were investigated by EPR spectroscopy on a large compositional
range with 05 le x le 35 mol Fe2O3 The EPR spectra of Fe3+ in xFe2O3middot(100-
x)[As2O3middotPbO] (S2) xFe2O3middot(100-x)[As2O3middotTeO2] (S4) and xFe2O3middot(1-x)[3B2O3middotLi2O]
(S6) are presented in figure 427-29 These spectra present two absorption lines centered at
gef 43 and gef 20 up to x le 35mol Fe2O3 systems studied
The absorption line centered at gef 43 is due to isolated Fe3+ ions [34-36] The
absorption line centered at gef 20 may be attributed to Fe3+ species interacting by magnetic
coupling dipolar and or super exchange the last ones forming magnetic clusters [37-41]
The evolution of the spectra is easier to follow considering the dependence of
concentration on the EPR parameters the line - intensity (obtained as an integral of the area
under the corresponding EPR signal) J and the line - width ΔB The evolution of J and AB
reflects the structural transformations which appear in the glass matrices due to the increasing
of iron ions content
The intensity and the line - width of the resonance line from gef 43 for all
investigated systems is represented in figure 430 (a b) The intensity of the resonance line
from gef 43 increases for (S2) and (S4) up to 3 mol and up to 5 mol for (S6) then
decreases for all systems investigated A line broadening up to 3 mol from gef 43 for
these systems can be observed due to increasing of Fe3+ isolated number of ions
31
1000 2000 3000 4000 5000
40
Firs
t der
ivat
ive
of a
bsor
ptio
n [u
a]
B [G]
x [mol Fe2O3]
05
1
3
5
1020
35 2
40
20
10
10
10
amplif
Fig427 The EPR spectra of Fe3+ for xFe2O3middot(100-x)[As2O3middotPbO] (S2)
glass system
1000 2000 3000 4000 5000
100
B [G]
Firs
t der
ivat
ive
of a
bsor
ptio
n [u
a]
10080
20
50
20
20
3
05
1
5
102035
x [mol Fe2O3] amplif
Fig428 The EPR spectra of Fe3+ for xFe2O3middot(100-x)[As2O3middotTeO2] (S4)
glass system
32
1000 2000 3000 4000 5000
Firs
t der
ivat
ive
of a
bsor
ptio
n [u
a]
B [G]
3
05
1
5
10
20
35
x [mol Fe2O3]
30
50
20
20
10
30
30
amplif
Fig429 The EPR spectra of Fe3+ for xFe2O3middot(100-x)[3B2O3middotLi2O] (S6)
glass system
The intensity and the line - width of the resonance line from gef 43 for all
investigated systems is represented in figure 430 (a b)The resonance line from gef 20 is
attributed to Fe3+ ions that interact by magnetic coupling dipolar orand super exchange
interractions can be observed in all compositional domains
The intensity of the resonance line from gef 20 can be observed as increasing up to
x=35 mol for (S2) and (S6) system and 10 mol for (S4) system with increased iron
ions content The line - width of the resonance line from gef 20 increased up to 10mol
for (S2) system and up to 3 mol for (S4) and 5mol for (S6) due to Fe3+species
interacting by magnetic coupling dipole-dipole Above this concentration line - width of the
resonance line from gef 20 can be attributed to dipolar and super exchange magnetic
interactions The ΔB = f(x) dependence reflects the competion between the broadening
mechanism (dipole ndash dipole interactions the interactions between ions in diferent
valence state and structural disorder) and the narrowing ones (super exchange
interactions)
33
0 5 10 15 20 25 30 35 40
x [mol]
J [ u
a]
S2 S4 S6
a)
0 5 10 15 20 25 30 35 4040
60
80
100
120
140
160
180
200
220 S2 S4 S6
B[G
]
x [mol]
a b
Fig 430 The dependence on Fe2O3 content of the intensity (a) and width (b) of
resonance line at gef 43 for xFe2O3middot(100-x)[As2O3middotPbO] (S2)
xFe2O3middot(100-x)[As2O3middotTeO2] (S4) and xFe2O3middot(100-x)[3B2O3middotLi2O] (S6) glasses
0 5 10 15 20 25 30 35 40
x [mol]
J [ u
a]
S2 S4 S6
a)
0 5 10 15 20 25 30 35 40
200
400
600
800
1000
1200
1400
1600
x [mol]
B
[G] S2
S4 S6
a b
Fig 431 The dependence on Fe2O3 content of the intensity (a) and width (b) of
resonance line at gef 20 for xFe2O3middot(100-x)[As2O3middotPbO] (S2)
xFe2O3middot(100-x)[As2O3middotTeO2] (S4) and xFe2O3middot(100-x)[3B2O3middotLi2O] (S6) glasses
34
434 Comparative study by magnetic susceptibility measurements of
xFe2O3middot(100-x)[As2O3middotBO] where BO =gt TeO2 or PbO and
xFe2O3middot(100-x) [3B2O3middotLi2O] glasses
The magnetic susceptibility data are in good agreement with the EPR result The magnetic
behavior of the glasses xFe2O3middot(100-x)[As2O3middotPbO] (S2) xFe2O3middot(100-x)[As2O3middotTeO2]
(S4) and xFe2O3middot(100-x)[3B2O3middotLi2O] (S6) for 3 x 50 mol Fe2O3 are presented in
figure 432 - 34
For (S2) glass systems up to x 10 mol x 3 mol (S5) glass systems and x 5
mol (S6) glass systems the temperature dependence of the reciprocal magnetic susceptibility
obeys a Curie law In this concentration range the iron ions are predominantly isolated orand
participate in dipole-dipole interactions At higher concentrations the reciprocal magnetic
susceptibility obeys a Curie-Weiss law with negative paramagnetic Curie temperature (p)
characteristic to antiferromagnetic coupled ions by means of super exchange interactions(fig
435) This behavior of iron ions is confirmed by the shape of the EPR spectra
80 100 120 140 160 180 200 220 240 260 2800
1
2
3
4
5
6
7
8
9
10
11
[
emu
mol
]-1
T [K]
3 mol 5 mol 10 mol 20 mol 35 mol 50 mol
Fig432 The temperature dependence of -1 for xFe2O3middot(100-x)[As2O3middotPbO] (S2)
3 x 50 mol
35
80 100 120 140 160 180 200 220 240 260 2800
1
2
3
4
5
6
7
8
9
10
T [K]
[
emu
mol
]-1
3 mol 5 mol 10 mol 20 mol 35 mol 50 mol
Fig433 The temperature dependence of -1 for xFe2O3middot(100-x)[As2O3middotTeO2] (S4)
3 x 50 mol
80 100 120 140 160 180 200 220 240 260 2800
1
2
3
4
5
6
7
8
9
10
11
3 mol 5 mol 10 mol 20 mol 35 mol 50 mol
T [K]
[
emu
mol
]-1
Fig434 The temperature dependence of -1 for xFe2O3middot(100-x)[3B2O3middotLi2O] (S6)
3 x 50 mol
36
0 10 20 30 40 50
0
10
20
30
40
50
x [mol]-
p [K]
(S2) (S4) (S6)
Fig435Concentration dependence of (p) for sistemele xFe2O3middot(100-x)[As2O3middotPbO] (S2) xFe2O3middot(100-x)[As2O3middotTeO2] (S4) and xFe2O3middot(100-x)[3B2O3middotLi2O] (S6)
for 3 x 50 mol Fe2O3
Using the representation 1 = f(T) the molar Curie constants CM the effective
magnetic moments and molar fraction of Fe3+(x1) şi Fe2+(x2) ions were calculated and
represented in tables 47-9
Table 47 Molar Curie constants effective magnetic moments and molar fraction of
Fe3+(x1) şi Fe2+(x2) ions in xFe2O3middot(100-x)[As2O3middotPbO] glasses (S2)
x [mol Fe2O3]
CMtimes102
[emu mol] ef
[microB] x1
[mol Fe23+O3]
x2 [mol Fe2
2+O3] 3 2526 58 261 039 5 393 56 332 168 10 7326 541 476 524 20 13459 519 53 147 35 23364 516 829 2671 50 32154 507 767 4233
Table 48 Molar Curie constants effective magnetic moments and molar fraction of
Fe3+(x1) şi Fe2+(x2) ions in xFe2O3middot(100-x)[As2O3middotTeO2] glasses (S4)
x [mol Fe2O3]
CMtimes102
[emu mol] ef
[microB] x1
[mol Fe23+O3]
x2 [mol Fe2
2+O3] 3 2571 585 277 023 5 4016 566 363 137 10 7911 562 686 314 20 14992 521 643 929 35 22676 509 601 2899 50 30959 497 313 4687
37
Table 49 Molar Curie constants effective magnetic moments and molar fraction of Fe3+(x1) şi Fe2+(x2) ions in xFe2O3middot(100-x)[3B2O3middotLi2O] glasses (S6)
The results allowed to consider that the magnetic properties of the studied glasses can
be explained through magnetic interractions between Fe3+ - Fe3+ Fe3+- Fe2+ and Fe2+- Fe2+ that
explain the dependences of RPE parameters concentration
SELECTED CONCLUSIONS
In this thesis xMOmiddot(100-x)[As2O3middotTeO2] xMOmiddot(100-x) [As2O3middotPbO] and
xMOmiddot(100-x)[3B2O3middotLi2O] glasses where MO =gt MnO or Fe2O3 were comparatively
studied in 0 le x le 50 mol The structural modifications of investigated glass matrices were
comparatively followed in function of the manganese or iron ions on the investigated glass
matrices were followed
The study by FT-IR spectroscopy shows that the evolution of the spectra of
xMnOmiddot(100-x) [As2O3middotPbO] with the addition and the increasing of the MnO content suggest
that the manganese ions break up a part of As ndash O ndash As Pb ndash O ndash Pb and probably of As ndash O ndash
Pb bonds The addition of MnO in the As2O3middotPbO glass matrix is leading to a disordering of
the glasses structure with the increasing of the MnO content
The evolution of the absorption bands for FT ndash IR spectrum of xFe2O3middot(1-x)
[As2O3middotPbO] glasses are determined by the addition of Fe2O3 content It can be observed to
shift the bands assigned As ndash O ndash As vibrations from AsO3 units due to changing to length As
ndash O ndash As bonds and interne angles of AsO3 units disappears PbO4 units and appears FeO6
units The addition of Fe2O3 in the As2O3middotPbO glass matrix determined a disordering of the
glasses structure with the increasing of the Fe2O3 content
From FT-IR absorption spectra of the investigated xMOmiddot(100-x)[As2O3middotTeO2] glasses
system where MO =gt MnO or Fe2O3 it can be observed that the addition and increasing of
manganese ions concluded the contraction of As-O-As bonds from totally symmetric
x [mol Fe2O3]
CMtimes102
[emu mol] ef
[microB] x1
[mol Fe23+O3]
x2 [mol Fe2
2+O3] 3 2542 582 268 032 5 3943 561 338 162 10 7423 544 506 494 20 13568 520 549 1451 35 23094 513 731 2769 50 31746 503 584 4416
38
stretching vibrations of AsO3 units for x ge10 mol there can be an increase in number of As-
O-As bonds from AsO3 units orand a length these linkage to doubly degenerate stretching
vibrations of AsO3 units and a stretching vibration mode of TeO3 tp with NBO It can be
remarked from the FT-IR absorption spectra the gradual transformation of symmetric
stretching vibration mode of Te-O bonds from TeO3 units in TeO4 (tbp) units and the presence
of MnO2 units Once with the addition of iron ions the xFe2O3middot(100- x)[As2O3middotTeO2]
glasses behave like xMnOmiddot(100-x)[As2O3middotTeO2] glasses but in this system the
appearance of FeO6 units can be seen
From FT-IR spectra in xMOmiddot(100-x)[3B2O3middotLi2O] glasses where MO =gt MnO or
Fe2O3 can be concluded that the addition of manganese or iron ions in vitreous matrices leads
to the increase of the disorder degree
The study by Raman spectroscopy shows that the evolution of the spectra the addition
of MnO in the [As2O3middotPbO]glass matrix determined an order degree of the vitreous matrix
The intensity of the bands attributed vibrations As ndash O ndash As bonds from As2O units and
bending vibrations of As ndash O ndash As from As2O units shift to a higher wave length that suggests
an increase in the As2O units comparative to AsO3 units With the increase of iron ions content
in the As2O3middotPbO glass matrix the number of these structural units decreases due to the
increasing of the disorder in the studied glasses
With the increasing of manganese content in As2O3TeO2 glass matrix the intensity
of these bands is increasing showing that the manganese content favorites the formation of
TeO4 (tbp) and TeO3 (tp) units For high concentrations of iron ions in xFe2O3middot(100-
x)[As2O3 TeO2] system of glasses the number of As-O-As linkages appear in Raman
spectrum due to stretching vibrations of As-O-As and vibrations of the continuous TeO4 (tbp)
network show a significant decrease
Studying the Raman spectra of xMOmiddot(1-x)[3B2O3middotLi2O] glass system where MO =gt
MnO or Fe2O3 it has been observed that the absorption bands presented in vitreous matrix
gradually decreased with an increase in the manganese or iron content in both glasses system
which suggested an increase of the disorder in these vitreous systems
The EPR spectra presents the behavior of manganese or iron ions in different vitreous
matrices xMOmiddot(100-x)[As2O3middotBO] where MO=gtMnO or Fe2O3 and BO =gt TeO2 or
PbO and xMOmiddot(100-x) [3B2O3middotLi2O] Glasses were investigated by EPR spectroscopy on a
large compositional range with 0 le x le 50 mol The absorption line centered at gef 43 and
is due to isolated Mn2+ ions The absorption line centered at gef 20 may be attributed to
Mn2+ species interacting by magnetic coupling dipolar and or super exchange the last ones
forming magnetic clusters The EPR spectra of Fe3+ in xFe2O3middot(100-x)[As2O3middotPbO]
xFe2O3middot(100-x)[As2O3middotTeO2] and xFe2O3middot(1-x)[3B2O3middotLi2O] are presented two absorption
lines centered at gef 43 and gef 20 up to x le 35mol Fe2O3 systems studied
39
The absorption line centered at gef 43 is due to isolated Fe3+ ions The absorption
line centered at gef 20 may be attributed to Fe3+ species interacting by magnetic coupling
dipolar and or super exchange the last ones forming magnetic clusters
The evolution of the spectra is easier to follow considering the dependence of
concentration on the EPR parameters the line - intensity (obtained as an integral of the area
under the corresponding EPR signal) J and the line - width ΔB The evolution of J and AB
reflects the structural transformations which appear in the glass matrices due to the increase of
manganese ions content
The magnetic susceptibility data are in good agreement with the EPR result The
magnetic behavior of the glasses from xMnOmiddot(100-x)[As2O3middotBO] where BO =gt TeO2 (S3)
or PbO (S1) and xMnOmiddot(100-x)[3B2O3middotLi2O] (S5) glasses for 3 le x le 50 mol MnO
For (S1) and (S3) system glasses up to x 3 mol and x 5 mol (S5) glass
system the temperature dependence of the reciprocal magnetic susceptibility obeys a Curie
law In this concentration range the manganese ions are predominantly isolated orand
participate in dipole-dipole interractions At higher concentrations the reciprocal magnetic
susceptibility obeys a Curie-Weiss law with negative paramagnetic Curie temperature (p)
characteristic to antiferromagnetic coupled ions by means of super exchange interractions This
behavior of manganese ions is confirmed by the shape of the EPR spectra Using the
representation 1 =f(T) the molar Curie constants CM the effective magnetic moments
and molar fraction of Mn2+(x1) şi Mn3+(x2) ions were calculated The magnetic susceptibility
data are in good agreement with the EPR result
The magnetic behavior of the glasses xFe2O3middot(100-x)[As2O3middotPbO] (S2)
xFe2O3middot(100-x)[As2O3middotTeO2] (S4) and xFe2O3middot(100-x)[3B2O3middotLi2O] (S6) for 3 x 50
mol Fe2O3 are presented For (S2) glass systems up to x 10 mol x 3 mol (S5)
glass systems and x 5 mol (S6) glass systems the temperature dependence of the
reciprocal magnetic susceptibility obeys a Curie law In this concentration range the iron ions
are predominantly isolated orand participate in dipole-dipole interactions At higher
concentrations the reciprocal magnetic susceptibility obeys a Curie-Weiss law with negative
paramagnetic Curie temperature (p) characteristic to antiferromagnetic coupled ions by
means of super exchange interactions(fig 435) This behavior of iron ions is confirmed by the
shape of the EPR spectra Using the representation 1 = f(T) the molar Curie constants
CM the effective magnetic moments and molar fraction of Fe3+(x1) şi Fe2+(x2) ions were
calculated
40
REFERENCES
Chapter 1
[1] I Ardelean bdquoIntroducere icircn studiul materialelor oxidice cu structură vitroasă EdNapocaStar Cluj Napoca 2002 [2] G Srinivasarao N Veeraiah J All Com 327 52-65(2001) [3] G Srinivasarao N Veeraiah J Phys Chem Solids 63705-717(2002) [4] DBecherescu VCristea FMarx IMenessz FWinter Chimia stării solide Ed Şt şi Encicl Bucucureştivol 1 1983 [5] J Wong CAAngell Glass-Structure by Spectroscopy Dekker Inc New York 1976 [6] BEWarren HKKrutter O Morningstat J Am Ceram Soc 19 202 (1936) [7] LLSperry JD Mackenzie Phys Chem Glasses 9 91 (1968) [8] WLKonijnendijk JMStevels J Non-Cryst Solids 18 307 (1975) [9] FCEversteyn JM Stevels HJ Naterman Phys Chem Glasses 1 134 (1963) [10] G Fuxi Optical and Spectroscopie Properties of Glass Springer-Verlag Shanghai Scientific Technical Pub Shanghai 1991 [11] YDYiannopoulos GDChryssikos EIKamitsos Phys Chem Glasses 42(3) 164 (2001) [12] MGFerreira da Silva BFOCosta J Non-Cryst Solids 293-295 534 (2001) [13] RYordanova YDimitriev VDimitriev S Kassabov DKlissurski JNon-Cryst Solids 201 141 (1996) [14] W L Konijnendijk J M Stevels J Non-Cryst Solids 18 307 (1980) [15] M Iron M Couzi ALevasseur JBrethous JSolidState Chem 31 285 (1980) [16] TFurukawa WBWhite PhzsChemGlasses 21 85 (1980) [17] E I Kamitsos M A Karakassides GD Chryssikos J Phys Chem 90 4528 (1986) [18] E I Kamitsos M A Karakassides GD Chryssikos J Phys Chem 91 1073 (1987) [19] TWBril Philips Res Rep Suppl 2 117 (1976) [20] E I Kamitsos M A Karakassides GD Chryssikos J Phys Chem 30 203 (1989) [21] BNMeera JRamakrishna J Non-Cryst Solids 159 1 (1993) [22] KWitke THubert PReich JRamanSpectr 24 407 (1993) [23] E I Kamitsos M A Karakassides Phys Chem Glasses 30 19 (1989) [24] MPeteanu Teză de doctoratrdquo Universitatea Babeş-Bolyairdquo Cluj Napoca (1989) [25] PCTaylor PJBray JPhys Chem Solids 33 43 (1972) [26] IArdelean MPeteanu GhIlonca DPop Solid State Commun 33 653 (1980) [27] AV De Wijn RE Van Balderen JKemPhys 46 4 (1967) [28] DL Griscom RE Griscom J Phys Chem Glasses 12 19 (1971) [29] JWH Schreurs JChem Phys 69 2151 (1978) [30] AlNicula M Peteanu IArdelean Studia Univ Babeş-Bolyai Physica 2 65 (1979) [31] M Peteanu IArdelean SFilip ITodor GSalvan Studia Univ Babeş-Bolyai Physica XL 2 9 (1995) [32] IArdelean M Peteanu SFilipV Simon ITodor Solid State Commun 105 (5) 339 (1998) [33] SKMendiratta EGuedes de Sousa JMatSci Lett7 733 (1988) [34] IArdelean M Peteanu SFilip V Simon GGyorffy Solid State Commun 102 (4) 341 (1997) [35] IArdelean M Peteanu SFilip V Simon FCiorcas ITodor JMagnMagn Mat 196-197 257 (1999) [36] JKliava RBerger YServant JEmery JMGreneche JTrokss J Non-Cryst Solids 202 205 (1996) [37] LDBogomolova NA Krasilnikova VLBogdanov VDKhaliev VV Mitrofanov J Non-Cryst Solids 188 130 (1995) [38] DLoveridge SPark PhysChem Glasses 12 19 (1971) [39] IArdelean G Salvan M Peteanu V Simon FCiorcas Mod PhysLett B 13 (22-23) 801 (1999)
41
[40] JLRao AMuraly EDRao J Non-Cryst Solids 202 215 (1996) [41] CPrakash S Husain RJ Singh SMollah JAlloys Compon 326 47 (2001) [42] EGuedes de Sousa SKMendiratta JMMachado Da Silva Portugal Phys 17 (3-4) 203 (1986) [43] TCastner GSNewell WCHolton CP Slichter JChem Phys 32 668 (1960) [44] SPChaudhuri SKPatra JMatSci 35 4735 (2000) [45] IArdelean HH Qiu HSakata Matt Lett 32 335 (1997) Chapter 2 [1] J Wong C A Angel Glass Structure by Spectroscopy Marcel Dekker inc New-York 1976 [2] I Ardelean bdquoIntroducere icircn studiul materialelor oxidice cu structură vitroasă EdNapocastar Cluj-Napoca 2002 [3] N Avram GH Mateescu Spectroscopia icircn infraroşu Aplicaţii icircn chimia organică Ed Tehnică Bucureşti 1968 [4] TIliescu Spectroscopie optică moleculară vibraţională şi electronică Ed Casa Cărţii de Ştiinţă Cluj- Napoca 2000 [5] S Aştilean bdquoMetode şi tehnici moderne de spectroscopie optică Ed Casa Cărţii de Ştiinţă Cluj - Napoca 2002 p 5 [6] I Ursu Rezonanţă Electronică de Spinrdquo Ed AcademieiBucureşti (1965) [7] CHHurd ContempPhys 23 (5) 469 (1982) [8] GWAnderson WDCompton JChemPhys52 6166 (1970) [9] MS Seehra GSrinivasan Landolt-Bornstein (New Series) SubVolume F3 Springer-Verlag Berlin 1994 [10] GToulouse ContempPhys 2115 (1977) [11] NMMurayMagnetic susceptybility EdInterscience New York P1773 1963 [12] JBGoodenough Magnetism and Chemical Bond EdInterscience New York 1963 [13] IArdelean G Salvan M Peteanu V Simon FCiorcas Mod PhysLett B 13 (22-23) 801 (1999) [14] IArdelean MPeteanu R Ciceo Lucăcel Studii de rezonanţă paramagnetică electronică şi magnetice ale unor ioni 3d icircn sticle pe bază de B2O3 Ed Presa Univesitară Clujeană 2005 [15] IArdelean PhysStatSol (b) 87K137 (1978) [16] IArdelean Solid State Commun 31 75 (1979) [17] EJFrieble LKWilson AWDozier DLKinser PhysStatSol (b) 45 323 (1971) [18] DWMoon JMAitken RKMcCrone GS Ciloszik PhysChe Glasses 16 (5) 91 (1975) [19] SFilip Teză de doctorat UnivBabeş-Bolyai Cluj Napoca 1996 [20] CJSchinkel GWRathenou Physics of Non-Crystaline Solids North Holland Publ Co Amsterdam 215 1965 [21] EJFrieble LKWilson NCKoon DLKinser JAm Ceram Soc 57-237 (1974) [22] RJLandry JT Fournier CGYoung JChemPhys 46 1285 (1967) [23] WSimpson PhysStatSolidi b40 207 (1970) [24] RHasegawa PhysRevB b(5) 1631 (1971) [25] IArdelean GhIlonca MPeteanu Solid State Commun 52 145 (1984) [26] IArdelean GhIlonca OCozar J Physique 49 C8 1107 (1988) Chapter 3 [1] LFBates Modern Magnetism p133 Cambridge University Press London 1962 [2] IArdelean GhIlonca DBarbos Solid State Commun 40 769 (1981) [3] EBurzo IUrsu DUngur IArdelean JMatSci 15 581 (1980) [4] EBurzo IUrsu DUngur IArdelean MatResBull 15 1273 (1980) [5] DLGriscom Glass Science and Technology 48 151 (1990) [6] PJBray AH Silver Modern aspects of the vitreous state vol1 Butterworth
42
London 1960 [7] IArdelean Teza de doctorat UnivBabeş-Bolyai Cluj Napoca 1979 [8] SAştilean bdquoMetode şi tehnici moderne de spectroscopie opticărdquo EdCasa Cărţii de Ştiinţă Cluj ndash Napoca 2002 p5 [9] IArdelean RCiceo-Lucăcel ldquoFizica şi Tehnologia Materialelor Oxidice Lucrări Practicerdquo Ed Univ ldquoBabeş-Bolyairdquo Cluj-Napoca 2000 [10] VPop IChicinaş NJumate Fizica materialelor Metode experimentalerdquo EdPresa Universitară Clujeană 2001 [11] IUrsu Rezonanţă electronică de spinrdquo EdAcademiei Bucureşti 1965 Chapter 4 [1] I Ardelean S Lupşor D Rusu Solid State Sci 10 1384(2008) [2] I Ardelean S Lupşor D Rusu trimis spre publicare la Physica B decembrie 2009 [3] P Tarte Spectrochim Acta 18 467 (1962) [4] R A Condrate J Non ndash Cryst Solids 84 26 (1986) [5] G Srinivasarao N Veeraiah Phys Stat Sol (a) 191 370(2002) [6] G Srinivasarao N Veeraiah J Phys Chem Solids 63 705(2002) [7] G Srinivasarao N Veeraiah J All Com 327 52 (2001) [8] DK Durga N Veeraiah Bull Mater Sci 24 (4) 421 (2001) [9] F F Bentley L D Smithson A L Rozek InfraredndashSpectra and Characteristic Frequencies 700-300 cm-1 Interscience New York 1968 p 103 [10] O Noguera T Merle-Mejean AP Mirgorodsky MB Smirnov P Thomas J-C Champarnaud-Mesjard J Non-Cryst Solids 330 50 (2003) [11] BVR Chowdari KL Tan Fang Ling Solid State Ionics 113 ndash 115 711(1998) [12] C Jiang J Zhang H Mao F Gan Glass Technol 39(6) 200(1998) [13] MR Sahar K Sulhadi MS Rohani J Mater Sci 42 824(2007) [14] C Horea D Rusu I Ardelean J Mater Sci Mater Electron 20 905(2009) [15] GE Rachkovskaya GB Zakharevich J Appl Spectrosc 74 86(2007) [16] I Ardelean S Lupşor D Rusu trimis spre publicare la Journal of Materials Science Materials in Electronics decembrie 2009 [17] I Ardelean S Lupşor D Rusu trimis spre publicare la Modern Physics Letters B decembrie 2009 [18] R Iordanova Y Dimitriev V Dimitrov S Kassabov D Klissurski J Non ndash Cryst Solids 231 227 (1998) [19] R Iordanova Y Dimitriev S Kassabov D Klissurski J Non ndash Cryst Solids 204 141 (1996) [20] J O Jensen S J Gilliam A Banerjee D Zeroka S J Kirkby C N Merrow J Mol Struct (Theochem) 664 145 (2003) [21] G N Papatheodorou S A Solin Solid State Commun 16 5 (1975) [22] BVR Chowdari KL Tan Fang Ling J Mat Sci 35 2015 (2000) [23] R C Lucacel C Marcus V Timar I Ardelean Solid State Sci 9 850 (2007) [24] CP Varsamis EI Kamitsos GD Chryssikos Solid State Ionics 136ndash137 1031 (2000) [25] Sherief M Abo-Naf Fatma H El Batal Moenis A Azooz Mat Chem Phys 77 846 (2002) [26] SG Motke SP Yawale SS Yawale Bull Mater Sci 25 (10) (2002) [27] R Akagi N Ohtori N Umesaki J Non ndash Cryst Solids 293 471(2001) [28] E I Kamitsos M A Karakassides G D Chryssikos J Phys Chem 91(5) 1073 (1987) [29] H Ushida Y Iwadate T Hattori S Nishiyama K Fukushima Y Ikeda M Yamaguchi M Misawa T Fukunaga T Nakazawa S Jitsukawa J Alloys Compd 377 167 (2004) [30] I Ardelean F Ciorcas M Peteanu S Lupşor G Salvan Balkan Phys Lett 5 860 (1997)
43
[31] I Ardelean M Peteanu V Simon O Cozar F Ciorcas S Lupşor J Magn Magn Mater 196 253 (1999) [32] IArdelean MPeteanu GhIlonca Phys Stat Sol (a) 58 K33(1980) [33] IArdelean MPeteanu R Ciceo-Lucăcel ldquoStudii de rezonanţă paramagnetică electronică şi magnetice ale unor ioni 3d icircn sticle pe bază de B2O3rdquo Ed Presa Univ Clujeană Cluj Napoca 2005 p 171 [34] JLRao AMuraly EDRao J Non-Cryst Solids 202 215 (1996) [35] RPSChakradhar AMurali JLRao Optical Mat 10 109 (1998) [36] IArdelean MPeteanu SFilip VSimon GGyorffy Solid State Commun 102(4) 341 (1997) [37] IArdelean MPeteanu VSimon SFilip FCiorcaş ITodor J Magn Magn Mat 196-197 257 (1999) [38] IArdelean GSalvan MPeteanu VSimon CHimcinschi FCiorcas Mod Phys Lett B 13(22-23) 801 (1999) [39] IArdelean HHQiu HSakata Mat Lett 32 335 (1997) [40] SPChaudhuri SKPatra J Mat Sci 35 4735 (2000) [41] I Ardelean M Peteanu V Simon G Salvan J Mat Sci Technol 18 (3) 1 (2002)

30
Tabel 46 Molar Curie constants effective magnetic moments and molar fraction of Mn2+(x1) şi Mn3+(x2) ions in xMnOmiddot(100-x)[3B2O3middotLi2O] (S5) glasses
x
[mol MnO2] CMtimes102
[emu mol] ef
[microB] x1
[mol Mn2+O2] x2
[mol Mn3+O2] 3 127 581 265 035 5 1919 554 303 197 10 3681 542 486 514 20 7215 519 53 147 35 1121 506 505 2995 50 15898 501 493 4507
433 Comparative study by electron paramagnetic resonance (EPR) of
xFe2O3middot(100-x)[As2O3middotBO] where BO =gt TeO2 or PbO and
x Fe2O3middot(100-x) [3B2O3middotLi2O] glasses
In order to obtain more information regarding the behavior of iron ions in
xFe2O3middot(100-x)[As2O3middotBO] where BO =gt TeO2 (S4) or PbO (S2) şi xFe2O3middot(100-
x)[3B2O3middotLi2O] glasses were investigated by EPR spectroscopy on a large compositional
range with 05 le x le 35 mol Fe2O3 The EPR spectra of Fe3+ in xFe2O3middot(100-
x)[As2O3middotPbO] (S2) xFe2O3middot(100-x)[As2O3middotTeO2] (S4) and xFe2O3middot(1-x)[3B2O3middotLi2O]
(S6) are presented in figure 427-29 These spectra present two absorption lines centered at
gef 43 and gef 20 up to x le 35mol Fe2O3 systems studied
The absorption line centered at gef 43 is due to isolated Fe3+ ions [34-36] The
absorption line centered at gef 20 may be attributed to Fe3+ species interacting by magnetic
coupling dipolar and or super exchange the last ones forming magnetic clusters [37-41]
The evolution of the spectra is easier to follow considering the dependence of
concentration on the EPR parameters the line - intensity (obtained as an integral of the area
under the corresponding EPR signal) J and the line - width ΔB The evolution of J and AB
reflects the structural transformations which appear in the glass matrices due to the increasing
of iron ions content
The intensity and the line - width of the resonance line from gef 43 for all
investigated systems is represented in figure 430 (a b) The intensity of the resonance line
from gef 43 increases for (S2) and (S4) up to 3 mol and up to 5 mol for (S6) then
decreases for all systems investigated A line broadening up to 3 mol from gef 43 for
these systems can be observed due to increasing of Fe3+ isolated number of ions
31
1000 2000 3000 4000 5000
40
Firs
t der
ivat
ive
of a
bsor
ptio
n [u
a]
B [G]
x [mol Fe2O3]
05
1
3
5
1020
35 2
40
20
10
10
10
amplif
Fig427 The EPR spectra of Fe3+ for xFe2O3middot(100-x)[As2O3middotPbO] (S2)
glass system
1000 2000 3000 4000 5000
100
B [G]
Firs
t der
ivat
ive
of a
bsor
ptio
n [u
a]
10080
20
50
20
20
3
05
1
5
102035
x [mol Fe2O3] amplif
Fig428 The EPR spectra of Fe3+ for xFe2O3middot(100-x)[As2O3middotTeO2] (S4)
glass system
32
1000 2000 3000 4000 5000
Firs
t der
ivat
ive
of a
bsor
ptio
n [u
a]
B [G]
3
05
1
5
10
20
35
x [mol Fe2O3]
30
50
20
20
10
30
30
amplif
Fig429 The EPR spectra of Fe3+ for xFe2O3middot(100-x)[3B2O3middotLi2O] (S6)
glass system
The intensity and the line - width of the resonance line from gef 43 for all
investigated systems is represented in figure 430 (a b)The resonance line from gef 20 is
attributed to Fe3+ ions that interact by magnetic coupling dipolar orand super exchange
interractions can be observed in all compositional domains
The intensity of the resonance line from gef 20 can be observed as increasing up to
x=35 mol for (S2) and (S6) system and 10 mol for (S4) system with increased iron
ions content The line - width of the resonance line from gef 20 increased up to 10mol
for (S2) system and up to 3 mol for (S4) and 5mol for (S6) due to Fe3+species
interacting by magnetic coupling dipole-dipole Above this concentration line - width of the
resonance line from gef 20 can be attributed to dipolar and super exchange magnetic
interactions The ΔB = f(x) dependence reflects the competion between the broadening
mechanism (dipole ndash dipole interactions the interactions between ions in diferent
valence state and structural disorder) and the narrowing ones (super exchange
interactions)
33
0 5 10 15 20 25 30 35 40
x [mol]
J [ u
a]
S2 S4 S6
a)
0 5 10 15 20 25 30 35 4040
60
80
100
120
140
160
180
200
220 S2 S4 S6
B[G
]
x [mol]
a b
Fig 430 The dependence on Fe2O3 content of the intensity (a) and width (b) of
resonance line at gef 43 for xFe2O3middot(100-x)[As2O3middotPbO] (S2)
xFe2O3middot(100-x)[As2O3middotTeO2] (S4) and xFe2O3middot(100-x)[3B2O3middotLi2O] (S6) glasses
0 5 10 15 20 25 30 35 40
x [mol]
J [ u
a]
S2 S4 S6
a)
0 5 10 15 20 25 30 35 40
200
400
600
800
1000
1200
1400
1600
x [mol]
B
[G] S2
S4 S6
a b
Fig 431 The dependence on Fe2O3 content of the intensity (a) and width (b) of
resonance line at gef 20 for xFe2O3middot(100-x)[As2O3middotPbO] (S2)
xFe2O3middot(100-x)[As2O3middotTeO2] (S4) and xFe2O3middot(100-x)[3B2O3middotLi2O] (S6) glasses
34
434 Comparative study by magnetic susceptibility measurements of
xFe2O3middot(100-x)[As2O3middotBO] where BO =gt TeO2 or PbO and
xFe2O3middot(100-x) [3B2O3middotLi2O] glasses
The magnetic susceptibility data are in good agreement with the EPR result The magnetic
behavior of the glasses xFe2O3middot(100-x)[As2O3middotPbO] (S2) xFe2O3middot(100-x)[As2O3middotTeO2]
(S4) and xFe2O3middot(100-x)[3B2O3middotLi2O] (S6) for 3 x 50 mol Fe2O3 are presented in
figure 432 - 34
For (S2) glass systems up to x 10 mol x 3 mol (S5) glass systems and x 5
mol (S6) glass systems the temperature dependence of the reciprocal magnetic susceptibility
obeys a Curie law In this concentration range the iron ions are predominantly isolated orand
participate in dipole-dipole interactions At higher concentrations the reciprocal magnetic
susceptibility obeys a Curie-Weiss law with negative paramagnetic Curie temperature (p)
characteristic to antiferromagnetic coupled ions by means of super exchange interactions(fig
435) This behavior of iron ions is confirmed by the shape of the EPR spectra
80 100 120 140 160 180 200 220 240 260 2800
1
2
3
4
5
6
7
8
9
10
11
[
emu
mol
]-1
T [K]
3 mol 5 mol 10 mol 20 mol 35 mol 50 mol
Fig432 The temperature dependence of -1 for xFe2O3middot(100-x)[As2O3middotPbO] (S2)
3 x 50 mol
35
80 100 120 140 160 180 200 220 240 260 2800
1
2
3
4
5
6
7
8
9
10
T [K]
[
emu
mol
]-1
3 mol 5 mol 10 mol 20 mol 35 mol 50 mol
Fig433 The temperature dependence of -1 for xFe2O3middot(100-x)[As2O3middotTeO2] (S4)
3 x 50 mol
80 100 120 140 160 180 200 220 240 260 2800
1
2
3
4
5
6
7
8
9
10
11
3 mol 5 mol 10 mol 20 mol 35 mol 50 mol
T [K]
[
emu
mol
]-1
Fig434 The temperature dependence of -1 for xFe2O3middot(100-x)[3B2O3middotLi2O] (S6)
3 x 50 mol
36
0 10 20 30 40 50
0
10
20
30
40
50
x [mol]-
p [K]
(S2) (S4) (S6)
Fig435Concentration dependence of (p) for sistemele xFe2O3middot(100-x)[As2O3middotPbO] (S2) xFe2O3middot(100-x)[As2O3middotTeO2] (S4) and xFe2O3middot(100-x)[3B2O3middotLi2O] (S6)
for 3 x 50 mol Fe2O3
Using the representation 1 = f(T) the molar Curie constants CM the effective
magnetic moments and molar fraction of Fe3+(x1) şi Fe2+(x2) ions were calculated and
represented in tables 47-9
Table 47 Molar Curie constants effective magnetic moments and molar fraction of
Fe3+(x1) şi Fe2+(x2) ions in xFe2O3middot(100-x)[As2O3middotPbO] glasses (S2)
x [mol Fe2O3]
CMtimes102
[emu mol] ef
[microB] x1
[mol Fe23+O3]
x2 [mol Fe2
2+O3] 3 2526 58 261 039 5 393 56 332 168 10 7326 541 476 524 20 13459 519 53 147 35 23364 516 829 2671 50 32154 507 767 4233
Table 48 Molar Curie constants effective magnetic moments and molar fraction of
Fe3+(x1) şi Fe2+(x2) ions in xFe2O3middot(100-x)[As2O3middotTeO2] glasses (S4)
x [mol Fe2O3]
CMtimes102
[emu mol] ef
[microB] x1
[mol Fe23+O3]
x2 [mol Fe2
2+O3] 3 2571 585 277 023 5 4016 566 363 137 10 7911 562 686 314 20 14992 521 643 929 35 22676 509 601 2899 50 30959 497 313 4687
37
Table 49 Molar Curie constants effective magnetic moments and molar fraction of Fe3+(x1) şi Fe2+(x2) ions in xFe2O3middot(100-x)[3B2O3middotLi2O] glasses (S6)
The results allowed to consider that the magnetic properties of the studied glasses can
be explained through magnetic interractions between Fe3+ - Fe3+ Fe3+- Fe2+ and Fe2+- Fe2+ that
explain the dependences of RPE parameters concentration
SELECTED CONCLUSIONS
In this thesis xMOmiddot(100-x)[As2O3middotTeO2] xMOmiddot(100-x) [As2O3middotPbO] and
xMOmiddot(100-x)[3B2O3middotLi2O] glasses where MO =gt MnO or Fe2O3 were comparatively
studied in 0 le x le 50 mol The structural modifications of investigated glass matrices were
comparatively followed in function of the manganese or iron ions on the investigated glass
matrices were followed
The study by FT-IR spectroscopy shows that the evolution of the spectra of
xMnOmiddot(100-x) [As2O3middotPbO] with the addition and the increasing of the MnO content suggest
that the manganese ions break up a part of As ndash O ndash As Pb ndash O ndash Pb and probably of As ndash O ndash
Pb bonds The addition of MnO in the As2O3middotPbO glass matrix is leading to a disordering of
the glasses structure with the increasing of the MnO content
The evolution of the absorption bands for FT ndash IR spectrum of xFe2O3middot(1-x)
[As2O3middotPbO] glasses are determined by the addition of Fe2O3 content It can be observed to
shift the bands assigned As ndash O ndash As vibrations from AsO3 units due to changing to length As
ndash O ndash As bonds and interne angles of AsO3 units disappears PbO4 units and appears FeO6
units The addition of Fe2O3 in the As2O3middotPbO glass matrix determined a disordering of the
glasses structure with the increasing of the Fe2O3 content
From FT-IR absorption spectra of the investigated xMOmiddot(100-x)[As2O3middotTeO2] glasses
system where MO =gt MnO or Fe2O3 it can be observed that the addition and increasing of
manganese ions concluded the contraction of As-O-As bonds from totally symmetric
x [mol Fe2O3]
CMtimes102
[emu mol] ef
[microB] x1
[mol Fe23+O3]
x2 [mol Fe2
2+O3] 3 2542 582 268 032 5 3943 561 338 162 10 7423 544 506 494 20 13568 520 549 1451 35 23094 513 731 2769 50 31746 503 584 4416
38
stretching vibrations of AsO3 units for x ge10 mol there can be an increase in number of As-
O-As bonds from AsO3 units orand a length these linkage to doubly degenerate stretching
vibrations of AsO3 units and a stretching vibration mode of TeO3 tp with NBO It can be
remarked from the FT-IR absorption spectra the gradual transformation of symmetric
stretching vibration mode of Te-O bonds from TeO3 units in TeO4 (tbp) units and the presence
of MnO2 units Once with the addition of iron ions the xFe2O3middot(100- x)[As2O3middotTeO2]
glasses behave like xMnOmiddot(100-x)[As2O3middotTeO2] glasses but in this system the
appearance of FeO6 units can be seen
From FT-IR spectra in xMOmiddot(100-x)[3B2O3middotLi2O] glasses where MO =gt MnO or
Fe2O3 can be concluded that the addition of manganese or iron ions in vitreous matrices leads
to the increase of the disorder degree
The study by Raman spectroscopy shows that the evolution of the spectra the addition
of MnO in the [As2O3middotPbO]glass matrix determined an order degree of the vitreous matrix
The intensity of the bands attributed vibrations As ndash O ndash As bonds from As2O units and
bending vibrations of As ndash O ndash As from As2O units shift to a higher wave length that suggests
an increase in the As2O units comparative to AsO3 units With the increase of iron ions content
in the As2O3middotPbO glass matrix the number of these structural units decreases due to the
increasing of the disorder in the studied glasses
With the increasing of manganese content in As2O3TeO2 glass matrix the intensity
of these bands is increasing showing that the manganese content favorites the formation of
TeO4 (tbp) and TeO3 (tp) units For high concentrations of iron ions in xFe2O3middot(100-
x)[As2O3 TeO2] system of glasses the number of As-O-As linkages appear in Raman
spectrum due to stretching vibrations of As-O-As and vibrations of the continuous TeO4 (tbp)
network show a significant decrease
Studying the Raman spectra of xMOmiddot(1-x)[3B2O3middotLi2O] glass system where MO =gt
MnO or Fe2O3 it has been observed that the absorption bands presented in vitreous matrix
gradually decreased with an increase in the manganese or iron content in both glasses system
which suggested an increase of the disorder in these vitreous systems
The EPR spectra presents the behavior of manganese or iron ions in different vitreous
matrices xMOmiddot(100-x)[As2O3middotBO] where MO=gtMnO or Fe2O3 and BO =gt TeO2 or
PbO and xMOmiddot(100-x) [3B2O3middotLi2O] Glasses were investigated by EPR spectroscopy on a
large compositional range with 0 le x le 50 mol The absorption line centered at gef 43 and
is due to isolated Mn2+ ions The absorption line centered at gef 20 may be attributed to
Mn2+ species interacting by magnetic coupling dipolar and or super exchange the last ones
forming magnetic clusters The EPR spectra of Fe3+ in xFe2O3middot(100-x)[As2O3middotPbO]
xFe2O3middot(100-x)[As2O3middotTeO2] and xFe2O3middot(1-x)[3B2O3middotLi2O] are presented two absorption
lines centered at gef 43 and gef 20 up to x le 35mol Fe2O3 systems studied
39
The absorption line centered at gef 43 is due to isolated Fe3+ ions The absorption
line centered at gef 20 may be attributed to Fe3+ species interacting by magnetic coupling
dipolar and or super exchange the last ones forming magnetic clusters
The evolution of the spectra is easier to follow considering the dependence of
concentration on the EPR parameters the line - intensity (obtained as an integral of the area
under the corresponding EPR signal) J and the line - width ΔB The evolution of J and AB
reflects the structural transformations which appear in the glass matrices due to the increase of
manganese ions content
The magnetic susceptibility data are in good agreement with the EPR result The
magnetic behavior of the glasses from xMnOmiddot(100-x)[As2O3middotBO] where BO =gt TeO2 (S3)
or PbO (S1) and xMnOmiddot(100-x)[3B2O3middotLi2O] (S5) glasses for 3 le x le 50 mol MnO
For (S1) and (S3) system glasses up to x 3 mol and x 5 mol (S5) glass
system the temperature dependence of the reciprocal magnetic susceptibility obeys a Curie
law In this concentration range the manganese ions are predominantly isolated orand
participate in dipole-dipole interractions At higher concentrations the reciprocal magnetic
susceptibility obeys a Curie-Weiss law with negative paramagnetic Curie temperature (p)
characteristic to antiferromagnetic coupled ions by means of super exchange interractions This
behavior of manganese ions is confirmed by the shape of the EPR spectra Using the
representation 1 =f(T) the molar Curie constants CM the effective magnetic moments
and molar fraction of Mn2+(x1) şi Mn3+(x2) ions were calculated The magnetic susceptibility
data are in good agreement with the EPR result
The magnetic behavior of the glasses xFe2O3middot(100-x)[As2O3middotPbO] (S2)
xFe2O3middot(100-x)[As2O3middotTeO2] (S4) and xFe2O3middot(100-x)[3B2O3middotLi2O] (S6) for 3 x 50
mol Fe2O3 are presented For (S2) glass systems up to x 10 mol x 3 mol (S5)
glass systems and x 5 mol (S6) glass systems the temperature dependence of the
reciprocal magnetic susceptibility obeys a Curie law In this concentration range the iron ions
are predominantly isolated orand participate in dipole-dipole interactions At higher
concentrations the reciprocal magnetic susceptibility obeys a Curie-Weiss law with negative
paramagnetic Curie temperature (p) characteristic to antiferromagnetic coupled ions by
means of super exchange interactions(fig 435) This behavior of iron ions is confirmed by the
shape of the EPR spectra Using the representation 1 = f(T) the molar Curie constants
CM the effective magnetic moments and molar fraction of Fe3+(x1) şi Fe2+(x2) ions were
calculated
40
REFERENCES
Chapter 1
[1] I Ardelean bdquoIntroducere icircn studiul materialelor oxidice cu structură vitroasă EdNapocaStar Cluj Napoca 2002 [2] G Srinivasarao N Veeraiah J All Com 327 52-65(2001) [3] G Srinivasarao N Veeraiah J Phys Chem Solids 63705-717(2002) [4] DBecherescu VCristea FMarx IMenessz FWinter Chimia stării solide Ed Şt şi Encicl Bucucureştivol 1 1983 [5] J Wong CAAngell Glass-Structure by Spectroscopy Dekker Inc New York 1976 [6] BEWarren HKKrutter O Morningstat J Am Ceram Soc 19 202 (1936) [7] LLSperry JD Mackenzie Phys Chem Glasses 9 91 (1968) [8] WLKonijnendijk JMStevels J Non-Cryst Solids 18 307 (1975) [9] FCEversteyn JM Stevels HJ Naterman Phys Chem Glasses 1 134 (1963) [10] G Fuxi Optical and Spectroscopie Properties of Glass Springer-Verlag Shanghai Scientific Technical Pub Shanghai 1991 [11] YDYiannopoulos GDChryssikos EIKamitsos Phys Chem Glasses 42(3) 164 (2001) [12] MGFerreira da Silva BFOCosta J Non-Cryst Solids 293-295 534 (2001) [13] RYordanova YDimitriev VDimitriev S Kassabov DKlissurski JNon-Cryst Solids 201 141 (1996) [14] W L Konijnendijk J M Stevels J Non-Cryst Solids 18 307 (1980) [15] M Iron M Couzi ALevasseur JBrethous JSolidState Chem 31 285 (1980) [16] TFurukawa WBWhite PhzsChemGlasses 21 85 (1980) [17] E I Kamitsos M A Karakassides GD Chryssikos J Phys Chem 90 4528 (1986) [18] E I Kamitsos M A Karakassides GD Chryssikos J Phys Chem 91 1073 (1987) [19] TWBril Philips Res Rep Suppl 2 117 (1976) [20] E I Kamitsos M A Karakassides GD Chryssikos J Phys Chem 30 203 (1989) [21] BNMeera JRamakrishna J Non-Cryst Solids 159 1 (1993) [22] KWitke THubert PReich JRamanSpectr 24 407 (1993) [23] E I Kamitsos M A Karakassides Phys Chem Glasses 30 19 (1989) [24] MPeteanu Teză de doctoratrdquo Universitatea Babeş-Bolyairdquo Cluj Napoca (1989) [25] PCTaylor PJBray JPhys Chem Solids 33 43 (1972) [26] IArdelean MPeteanu GhIlonca DPop Solid State Commun 33 653 (1980) [27] AV De Wijn RE Van Balderen JKemPhys 46 4 (1967) [28] DL Griscom RE Griscom J Phys Chem Glasses 12 19 (1971) [29] JWH Schreurs JChem Phys 69 2151 (1978) [30] AlNicula M Peteanu IArdelean Studia Univ Babeş-Bolyai Physica 2 65 (1979) [31] M Peteanu IArdelean SFilip ITodor GSalvan Studia Univ Babeş-Bolyai Physica XL 2 9 (1995) [32] IArdelean M Peteanu SFilipV Simon ITodor Solid State Commun 105 (5) 339 (1998) [33] SKMendiratta EGuedes de Sousa JMatSci Lett7 733 (1988) [34] IArdelean M Peteanu SFilip V Simon GGyorffy Solid State Commun 102 (4) 341 (1997) [35] IArdelean M Peteanu SFilip V Simon FCiorcas ITodor JMagnMagn Mat 196-197 257 (1999) [36] JKliava RBerger YServant JEmery JMGreneche JTrokss J Non-Cryst Solids 202 205 (1996) [37] LDBogomolova NA Krasilnikova VLBogdanov VDKhaliev VV Mitrofanov J Non-Cryst Solids 188 130 (1995) [38] DLoveridge SPark PhysChem Glasses 12 19 (1971) [39] IArdelean G Salvan M Peteanu V Simon FCiorcas Mod PhysLett B 13 (22-23) 801 (1999)
41
[40] JLRao AMuraly EDRao J Non-Cryst Solids 202 215 (1996) [41] CPrakash S Husain RJ Singh SMollah JAlloys Compon 326 47 (2001) [42] EGuedes de Sousa SKMendiratta JMMachado Da Silva Portugal Phys 17 (3-4) 203 (1986) [43] TCastner GSNewell WCHolton CP Slichter JChem Phys 32 668 (1960) [44] SPChaudhuri SKPatra JMatSci 35 4735 (2000) [45] IArdelean HH Qiu HSakata Matt Lett 32 335 (1997) Chapter 2 [1] J Wong C A Angel Glass Structure by Spectroscopy Marcel Dekker inc New-York 1976 [2] I Ardelean bdquoIntroducere icircn studiul materialelor oxidice cu structură vitroasă EdNapocastar Cluj-Napoca 2002 [3] N Avram GH Mateescu Spectroscopia icircn infraroşu Aplicaţii icircn chimia organică Ed Tehnică Bucureşti 1968 [4] TIliescu Spectroscopie optică moleculară vibraţională şi electronică Ed Casa Cărţii de Ştiinţă Cluj- Napoca 2000 [5] S Aştilean bdquoMetode şi tehnici moderne de spectroscopie optică Ed Casa Cărţii de Ştiinţă Cluj - Napoca 2002 p 5 [6] I Ursu Rezonanţă Electronică de Spinrdquo Ed AcademieiBucureşti (1965) [7] CHHurd ContempPhys 23 (5) 469 (1982) [8] GWAnderson WDCompton JChemPhys52 6166 (1970) [9] MS Seehra GSrinivasan Landolt-Bornstein (New Series) SubVolume F3 Springer-Verlag Berlin 1994 [10] GToulouse ContempPhys 2115 (1977) [11] NMMurayMagnetic susceptybility EdInterscience New York P1773 1963 [12] JBGoodenough Magnetism and Chemical Bond EdInterscience New York 1963 [13] IArdelean G Salvan M Peteanu V Simon FCiorcas Mod PhysLett B 13 (22-23) 801 (1999) [14] IArdelean MPeteanu R Ciceo Lucăcel Studii de rezonanţă paramagnetică electronică şi magnetice ale unor ioni 3d icircn sticle pe bază de B2O3 Ed Presa Univesitară Clujeană 2005 [15] IArdelean PhysStatSol (b) 87K137 (1978) [16] IArdelean Solid State Commun 31 75 (1979) [17] EJFrieble LKWilson AWDozier DLKinser PhysStatSol (b) 45 323 (1971) [18] DWMoon JMAitken RKMcCrone GS Ciloszik PhysChe Glasses 16 (5) 91 (1975) [19] SFilip Teză de doctorat UnivBabeş-Bolyai Cluj Napoca 1996 [20] CJSchinkel GWRathenou Physics of Non-Crystaline Solids North Holland Publ Co Amsterdam 215 1965 [21] EJFrieble LKWilson NCKoon DLKinser JAm Ceram Soc 57-237 (1974) [22] RJLandry JT Fournier CGYoung JChemPhys 46 1285 (1967) [23] WSimpson PhysStatSolidi b40 207 (1970) [24] RHasegawa PhysRevB b(5) 1631 (1971) [25] IArdelean GhIlonca MPeteanu Solid State Commun 52 145 (1984) [26] IArdelean GhIlonca OCozar J Physique 49 C8 1107 (1988) Chapter 3 [1] LFBates Modern Magnetism p133 Cambridge University Press London 1962 [2] IArdelean GhIlonca DBarbos Solid State Commun 40 769 (1981) [3] EBurzo IUrsu DUngur IArdelean JMatSci 15 581 (1980) [4] EBurzo IUrsu DUngur IArdelean MatResBull 15 1273 (1980) [5] DLGriscom Glass Science and Technology 48 151 (1990) [6] PJBray AH Silver Modern aspects of the vitreous state vol1 Butterworth
42
London 1960 [7] IArdelean Teza de doctorat UnivBabeş-Bolyai Cluj Napoca 1979 [8] SAştilean bdquoMetode şi tehnici moderne de spectroscopie opticărdquo EdCasa Cărţii de Ştiinţă Cluj ndash Napoca 2002 p5 [9] IArdelean RCiceo-Lucăcel ldquoFizica şi Tehnologia Materialelor Oxidice Lucrări Practicerdquo Ed Univ ldquoBabeş-Bolyairdquo Cluj-Napoca 2000 [10] VPop IChicinaş NJumate Fizica materialelor Metode experimentalerdquo EdPresa Universitară Clujeană 2001 [11] IUrsu Rezonanţă electronică de spinrdquo EdAcademiei Bucureşti 1965 Chapter 4 [1] I Ardelean S Lupşor D Rusu Solid State Sci 10 1384(2008) [2] I Ardelean S Lupşor D Rusu trimis spre publicare la Physica B decembrie 2009 [3] P Tarte Spectrochim Acta 18 467 (1962) [4] R A Condrate J Non ndash Cryst Solids 84 26 (1986) [5] G Srinivasarao N Veeraiah Phys Stat Sol (a) 191 370(2002) [6] G Srinivasarao N Veeraiah J Phys Chem Solids 63 705(2002) [7] G Srinivasarao N Veeraiah J All Com 327 52 (2001) [8] DK Durga N Veeraiah Bull Mater Sci 24 (4) 421 (2001) [9] F F Bentley L D Smithson A L Rozek InfraredndashSpectra and Characteristic Frequencies 700-300 cm-1 Interscience New York 1968 p 103 [10] O Noguera T Merle-Mejean AP Mirgorodsky MB Smirnov P Thomas J-C Champarnaud-Mesjard J Non-Cryst Solids 330 50 (2003) [11] BVR Chowdari KL Tan Fang Ling Solid State Ionics 113 ndash 115 711(1998) [12] C Jiang J Zhang H Mao F Gan Glass Technol 39(6) 200(1998) [13] MR Sahar K Sulhadi MS Rohani J Mater Sci 42 824(2007) [14] C Horea D Rusu I Ardelean J Mater Sci Mater Electron 20 905(2009) [15] GE Rachkovskaya GB Zakharevich J Appl Spectrosc 74 86(2007) [16] I Ardelean S Lupşor D Rusu trimis spre publicare la Journal of Materials Science Materials in Electronics decembrie 2009 [17] I Ardelean S Lupşor D Rusu trimis spre publicare la Modern Physics Letters B decembrie 2009 [18] R Iordanova Y Dimitriev V Dimitrov S Kassabov D Klissurski J Non ndash Cryst Solids 231 227 (1998) [19] R Iordanova Y Dimitriev S Kassabov D Klissurski J Non ndash Cryst Solids 204 141 (1996) [20] J O Jensen S J Gilliam A Banerjee D Zeroka S J Kirkby C N Merrow J Mol Struct (Theochem) 664 145 (2003) [21] G N Papatheodorou S A Solin Solid State Commun 16 5 (1975) [22] BVR Chowdari KL Tan Fang Ling J Mat Sci 35 2015 (2000) [23] R C Lucacel C Marcus V Timar I Ardelean Solid State Sci 9 850 (2007) [24] CP Varsamis EI Kamitsos GD Chryssikos Solid State Ionics 136ndash137 1031 (2000) [25] Sherief M Abo-Naf Fatma H El Batal Moenis A Azooz Mat Chem Phys 77 846 (2002) [26] SG Motke SP Yawale SS Yawale Bull Mater Sci 25 (10) (2002) [27] R Akagi N Ohtori N Umesaki J Non ndash Cryst Solids 293 471(2001) [28] E I Kamitsos M A Karakassides G D Chryssikos J Phys Chem 91(5) 1073 (1987) [29] H Ushida Y Iwadate T Hattori S Nishiyama K Fukushima Y Ikeda M Yamaguchi M Misawa T Fukunaga T Nakazawa S Jitsukawa J Alloys Compd 377 167 (2004) [30] I Ardelean F Ciorcas M Peteanu S Lupşor G Salvan Balkan Phys Lett 5 860 (1997)
43
[31] I Ardelean M Peteanu V Simon O Cozar F Ciorcas S Lupşor J Magn Magn Mater 196 253 (1999) [32] IArdelean MPeteanu GhIlonca Phys Stat Sol (a) 58 K33(1980) [33] IArdelean MPeteanu R Ciceo-Lucăcel ldquoStudii de rezonanţă paramagnetică electronică şi magnetice ale unor ioni 3d icircn sticle pe bază de B2O3rdquo Ed Presa Univ Clujeană Cluj Napoca 2005 p 171 [34] JLRao AMuraly EDRao J Non-Cryst Solids 202 215 (1996) [35] RPSChakradhar AMurali JLRao Optical Mat 10 109 (1998) [36] IArdelean MPeteanu SFilip VSimon GGyorffy Solid State Commun 102(4) 341 (1997) [37] IArdelean MPeteanu VSimon SFilip FCiorcaş ITodor J Magn Magn Mat 196-197 257 (1999) [38] IArdelean GSalvan MPeteanu VSimon CHimcinschi FCiorcas Mod Phys Lett B 13(22-23) 801 (1999) [39] IArdelean HHQiu HSakata Mat Lett 32 335 (1997) [40] SPChaudhuri SKPatra J Mat Sci 35 4735 (2000) [41] I Ardelean M Peteanu V Simon G Salvan J Mat Sci Technol 18 (3) 1 (2002)