
Local site effects in Istanbul: Microtremor study in Ataköy area Mathilde Bøttger Sørensen 1...
24
Local site effects in Istanbul: Microtremor study in Ataköy area Mathilde Bøttger Sørensen 1 Caglar Yalciner 2 and Kuvvet Atakan 1 1 Department of Earth Science, University of Bergen, Norway 2 Osman Gazi University,
-
Upload
julianna-butler -
Category
Documents
-
view
217 -
download
3
Transcript of Local site effects in Istanbul: Microtremor study in Ataköy area Mathilde Bøttger Sørensen 1...

Local site effects in Istanbul: Microtremor study in Ataköy area
Mathilde Bøttger Sørensen1
Caglar Yalciner2 and
Kuvvet Atakan1
1Department of Earth Science, University of Bergen, Norway2Osman Gazi University, Eskisehir, Turkey

Why are we interested in local site effects in Istanbul?
• Important factor for actual ground motion caused by an earthquake
• Necessary in order to move ground motion simulation results from bedrock level to surface of Earth

What did we do:
• Measured microtremors in the Ataköy area• Calculated H/V spectral ratios to obtain
information about frequencies with high amplification
• This information will later be combined with geotechnical data as input in 3D finite-difference modelling in cooperation with ETHZ

Geology of Istanbul
From http://www.geocities.com (Geological map by the Istanbul Greater City Council Directorate of Soil and Seismic Studies)

Ataköy area, geology
Ataköy
From I.T.Ü. Gelistirme vakfi iktisadi isletmesi

Ataköy area, accessibility
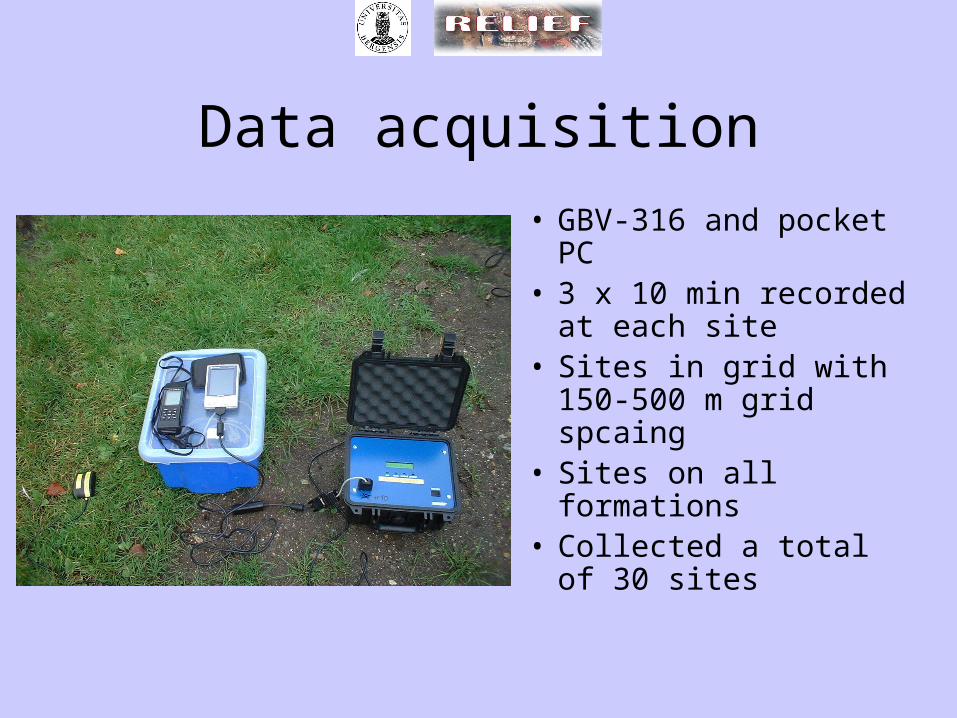
Data acquisition
• GBV-316 and pocket PC
• 3 x 10 min recorded at each site
• Sites in grid with 150-500 m grid spcaing
• Sites on all formations• Collected a total of 30
sites
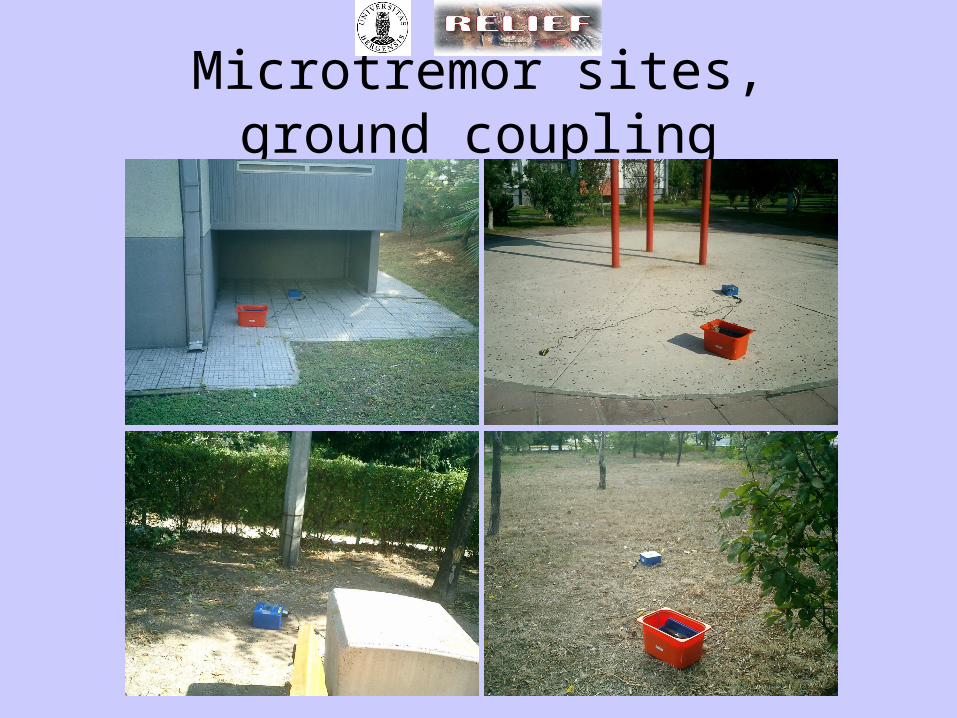
Microtremor sites, ground coupling

Microtremor sites

Data processing
• H/V spectral ratios calculated using JSesame software (SESAME project)
• Automatic window selection by searching traces for windows with low noise level using STA/LTA
• H/V is calculated for each window or as average for site

JSesame, browsing module
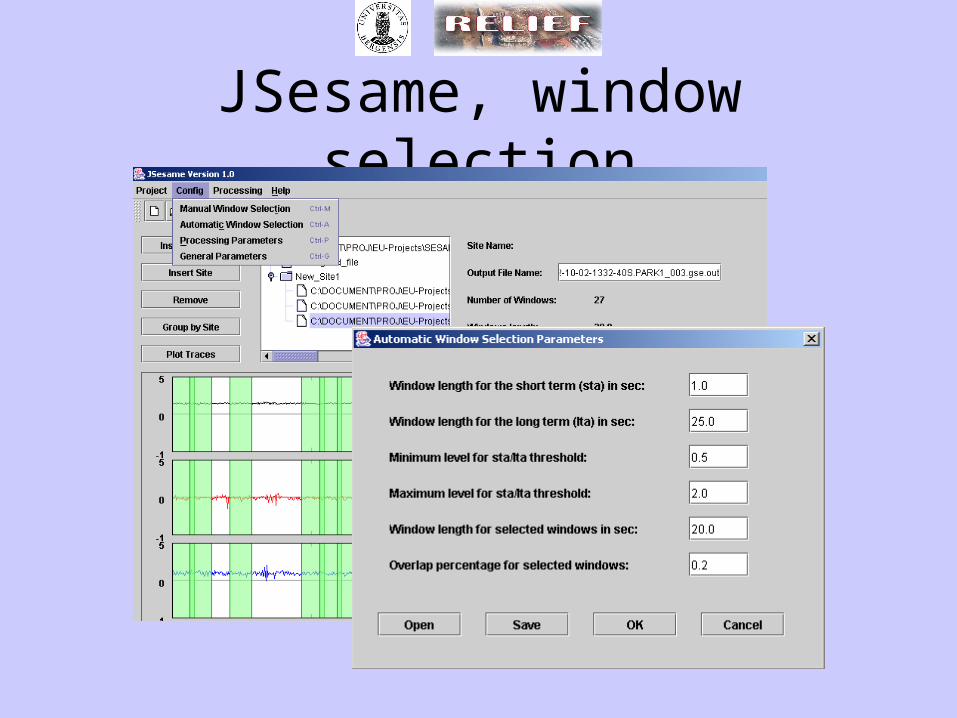
JSesame, window selection

JSesame, H/V parameters

JSesame, display module

JSesame, single window display

Results, Bakirköy FormationBakirkoy formation
0
0,5
1
1,5
2
2,5
0 2 4 6 8 10
Frequency
H/V
sp
ec
tra
l ra
tio
A005
A007
A008
A009
A010
A011
A012
A013
A014
A015
A017
A018
A019
A020
A023
A024
A025
A028
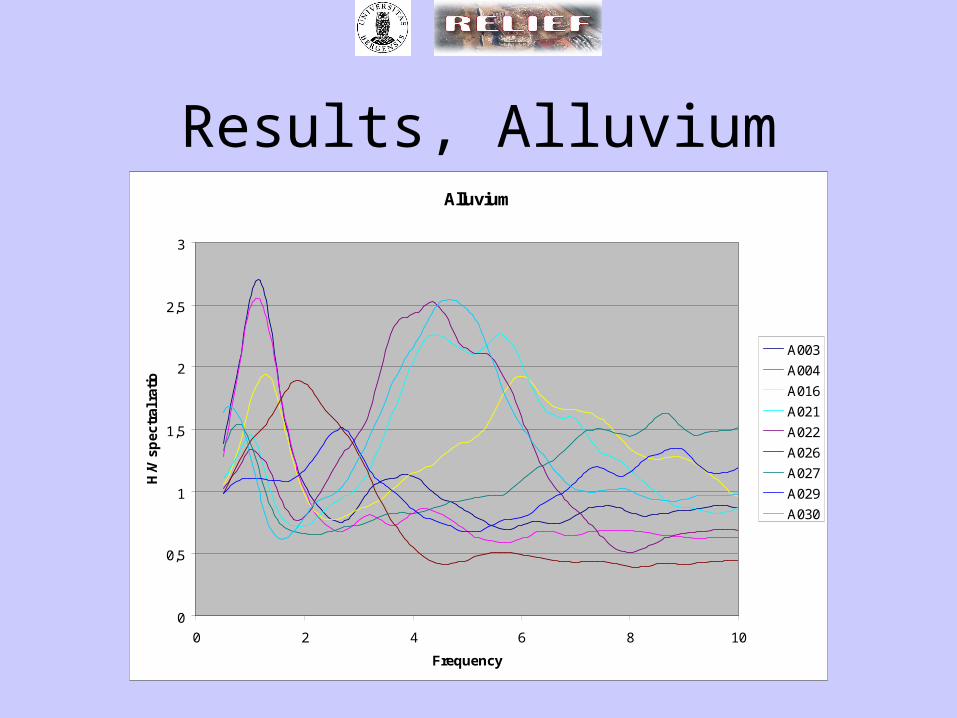
Results, AlluviumAlluvium
0
0,5
1
1,5
2
2,5
3
0 2 4 6 8 10
Frequency
H/V
sp
ectr
al r
atio
A003
A004
A016
A021
A022
A026
A027
A029
A030

Results, Güngören FormationGungoren formation
0
0,2
0,4
0,6
0,8
1
1,2
0 1 2 3 4 5 6 7 8 9 10
Frequency
H/V
sp
ectr
al r
atio
A006

Results, Artificial fillManmade structures
0
0,5
1
1,5
2
2,5
0 1 2 3 4 5 6 7 8 9 10
Frequency
H/V
sp
ectr
al r
atio
A001
A002

Artificial fill
Main results at the moment
• Main peak at 1-1.5 Hz, in agreement with ITU results
• Secondary peak at 4-6 Hz at some sites• Peaks at higher frequencies are probably
caused by noise

Secondary peak
Other available data
• Borehole data (Japan International Cooperation Agency/Istanbul Metropolitan Municipality)
• Earthquake data (Kandilli observatory, Bogazaci University)
• Geomorphological map (Istanbul Technical University)
• Geological map (Istanbul Technical University)
• Hydrogeological map (Istanbul Technical University)
• Well logs (Istanbul Technical University)
• Resistivity data (Istanbul Technical University)

Future plans
• Process and interpret data...• Check against 1D model• Produce input model for 3D finite difference
model by combining with other data• Run 3D finite difference model and interpret result• Use ground motion simulation results as input in
3D model to obtain ground motion at surface


![WORKSHOP ON CABLE-BASED OCEAN OBSERVATORIES,11-12 JUNE 2007, RADISSON SAS HOTEL NORGE, BERGEN Research topics within [Seafloor] Participants: Kuvvet AtakanJon.](https://static.fdocuments.in/doc/165x107/56649de55503460f94addf32/workshop-on-cable-based-ocean-observatories11-12-june-2007-radisson-sas-hotel.jpg)


![Sabit ve Degisk¸ en Zaman Gecikmeleri ile Bas¸ Eden˘ Iki ...tok2015.pau.edu.tr/BildirilerKitabi/152.pdfLiteratürdeki baska¸ bir çalısma¸ olan [8] paralel konum/kuvvet denetleyicisinin](https://static.fdocuments.in/doc/165x107/6080a76bf039a87a61371262/sabit-ve-degisk-en-zaman-gecikmeleri-ile-bas-eden-iki-literatrdeki-baska.jpg)

