Local Level Service Delivery, Decentralisation and...
130
-
Upload
phungthuan -
Category
Documents
-
view
227 -
download
3
Transcript of Local Level Service Delivery, Decentralisation and...
Local Level Service Delivery,Decentralisation and Governance
A Comparative Study of Uganda, Kenya and Tanzania
Education, Health and Agriculture Sectors
TANZANIA CASE REPORT
Institute for International CooperationJapan International Cooperation Agency
March 2008
This report is one of the study results conducted by DEGE Consult (www.dege.biz) with
Nordic Consulting Group Denmark (www.ncg.dk), ETC East Africa (www.etc-international.org)
and Mentor Consult Uganda in February 2007, under the framework of the study group on
“Cooperation for Decentralisation in Africa” organised by JICA.
The views and interpretations expressed in this document are not necessarily those of JICA,
Government of Tanzania or any other official organisations that have contributed to this document.
Authors: Per Tidemand, Hans Bjorn Olsen and Nazar Sola
Photos: DEGE Consult
Published by: Research Group, Institute for International Cooperation (IFIC),
Japan International Cooperation Agency (JICA)
10-5 Ichigaya Honmura-cho, Shinjuku-ku, Tokyo 162-8433 Japan
FAX: +81-3-3269-2185
E-mail: [email protected]
i
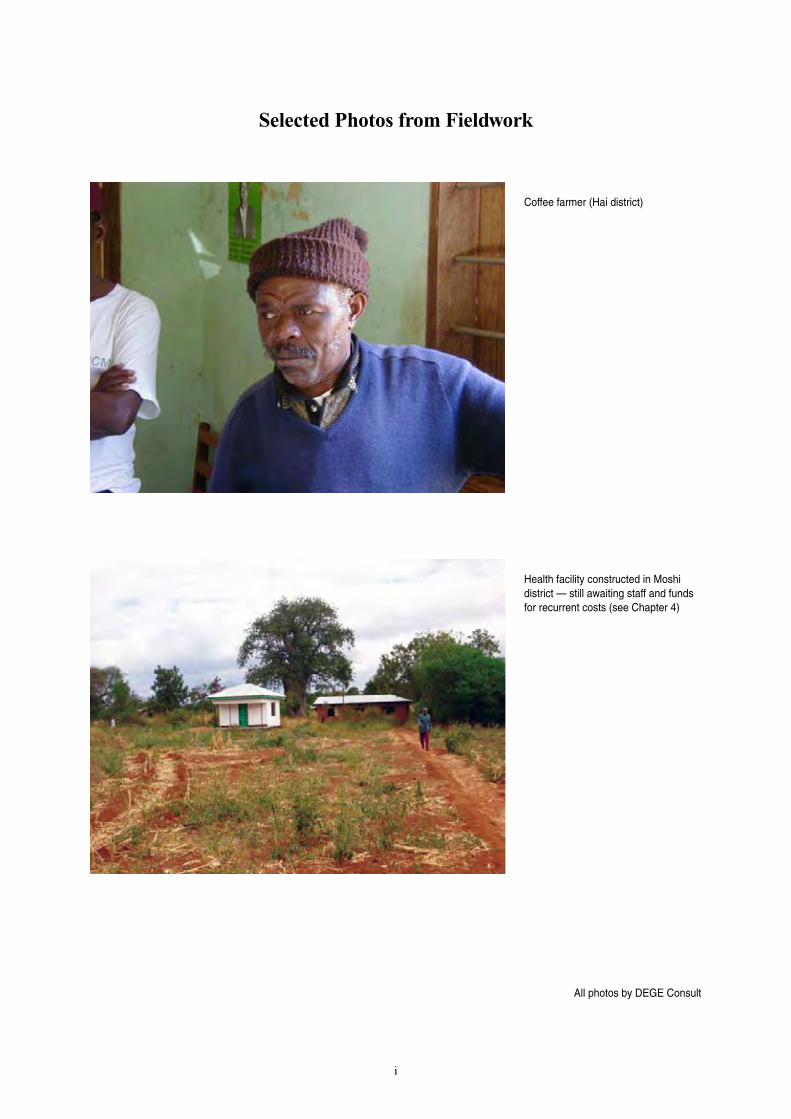
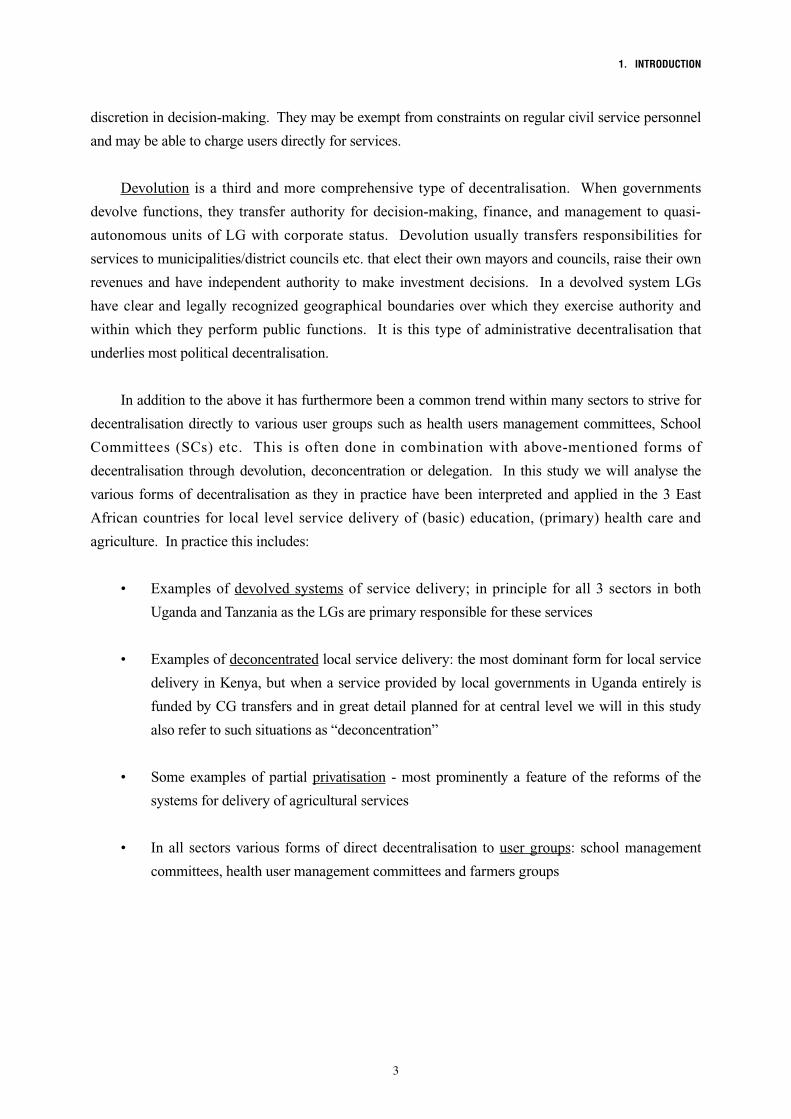
Coffee farmer (Hai district)
Health facility constructed in Moshi district — still awaiting staff and funds for recurrent costs (see Chapter 4)
Selected Photos from Fieldwork
All photos by DEGE Consult
ii
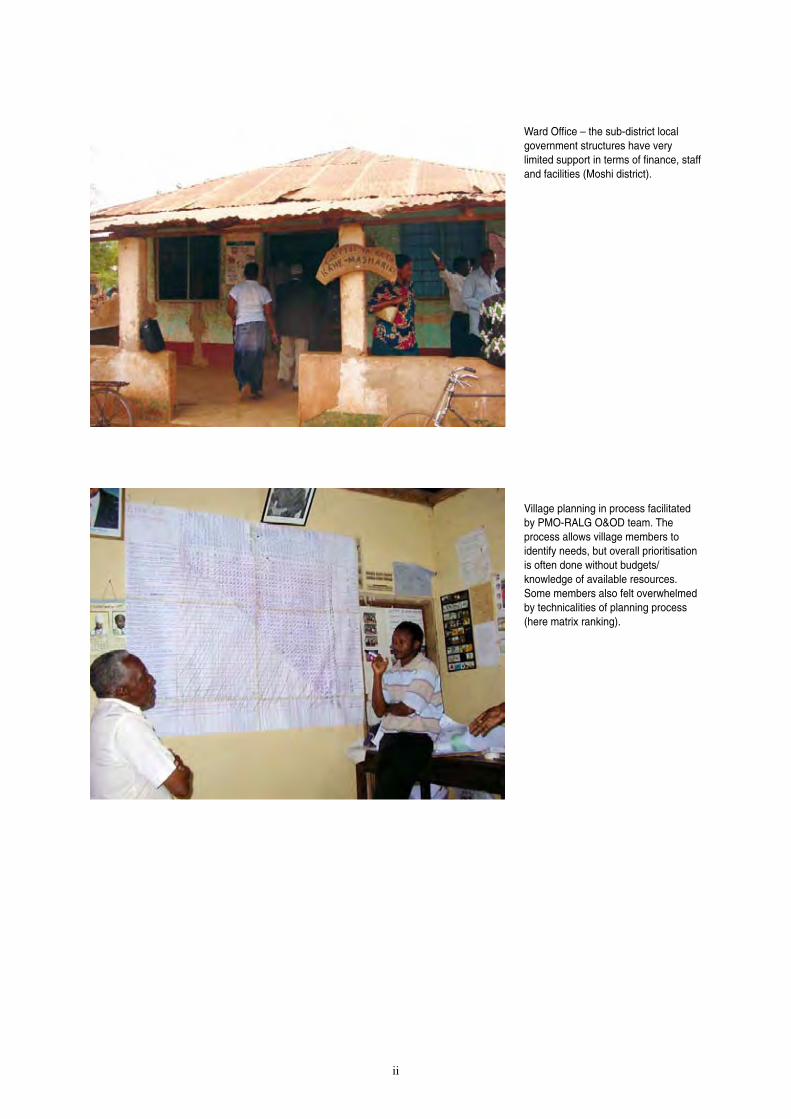
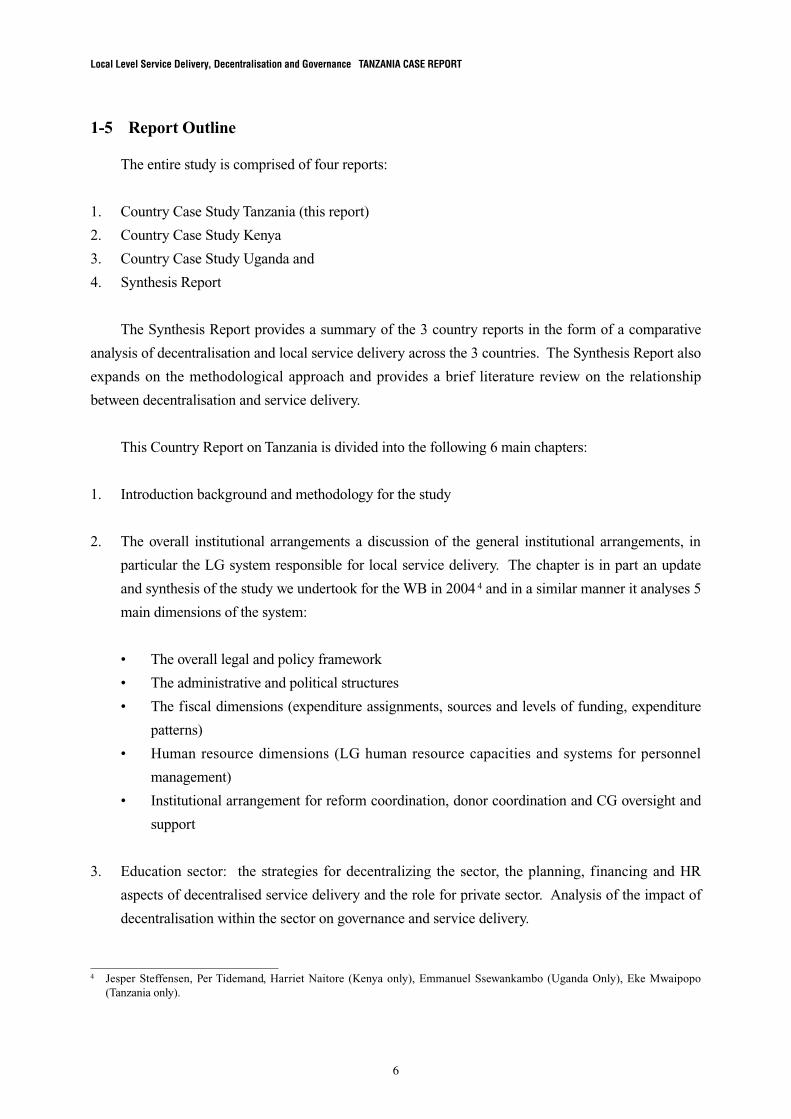
Ward Office – the sub-district local government structures have very limited support in terms of finance, staff and facilities (Moshi district).
Village planning in process facilitated by PMO-RALG O&OD team. The process allows village members to identify needs, but overall prioritisation is often done without budgets/knowledge of available resources.Some members also felt overwhelmed by technicalities of planning process (here matrix ranking).
iii
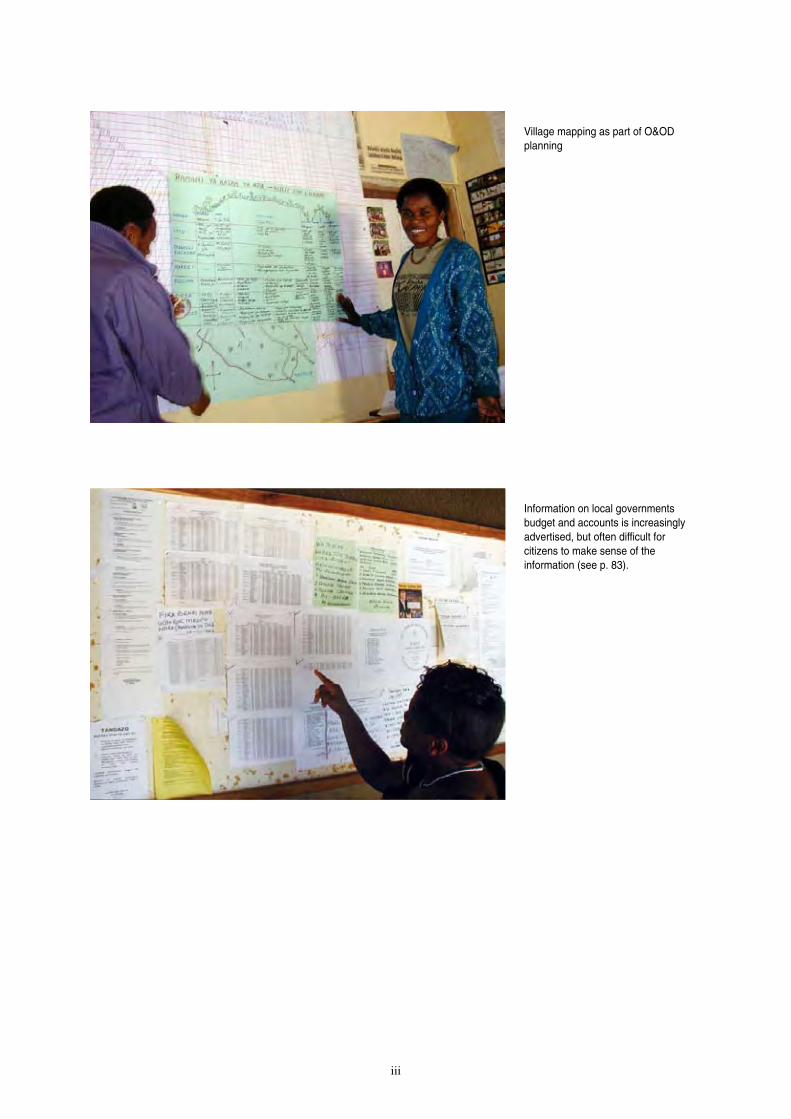
Village mapping as part of O&OD planning
Information on local governments budget and accounts is increasingly advertised, but often difficult for citizens to make sense of the information (see p. 83).
iv
Contents
Selected Photos from Fieldwork .................................................................................................... i
Abbreviations ............................................................................................................................. viii
1. INTRODUCTION ................................................................................................................. 1
1-1 Background ..................................................................................................................... 1
1-2 Objective of Study .......................................................................................................... 1
1-3 Key Concepts .................................................................................................................. 2
1-4 Study Team and Methodology ........................................................................................ 4
1-5 Report Outline ................................................................................................................. 6
2. INSTITUTIONAL ARRANGEMENTS FOR LOCAL SERVICE DELIVERY ............... 8
2-1 Legal and Policy Framework ........................................................................................... 8
2-2 Local Administrative and Political Structures ................................................................. 12
2-3 Local Government (LG) Finance .................................................................................... 13
2-4 LG Human Resources (HRs) .......................................................................................... 23
2-5 CG Oversight and Support Mechanisms......................................................................... 28
2-6 Current Key Issues and Challenges ................................................................................ 31
3. BASIC EDUCATION ............................................................................................................ 32
3-1 Sector Policy for Local Service Delivery ........................................................................ 32
3-2 Division of Responsibilities for Local Service Delivery ................................................ 34
3-3 Local Service Delivery Financing................................................................................... 37
3-4 Local Service Delivery Procedures ................................................................................. 41
3-5 HR Issues ........................................................................................................................ 43
3-6 Trends in Service Delivery Outputs and Outcomes ........................................................ 44
3-7 Impact of Governance Aspects on Service Delivery ...................................................... 45
3-8 Key Lessons and Challenges ........................................................................................... 48
4. DISTRICT HEALTH SERVICES ........................................................................................ 50
4-1 Sector Policy for Local Service Delivery ........................................................................ 50
4-2 Division of Responsibilities for Local Service Delivery ................................................ 50
4-3 Local Service Delivery Financing................................................................................... 56
4-4 Local Service Delivery Procedures ................................................................................. 59
4-5 HR Issues ........................................................................................................................ 61
4-6 Trends in Service Delivery Outputs and Outcomes ........................................................ 62
4-7 Impact of Governance Aspects on Service Delivery ...................................................... 64

v
4-8 Key Lessons and Challenges ........................................................................................... 68
5. AGRICULTURE .................................................................................................................... 70
5-1 Sector Policies ................................................................................................................. 70
5-2 Division of Responsibilities for Service Provision ......................................................... 71
5-3 Local Service Delivery Financing................................................................................... 74
5-4 Planning and Implementation Procedures ...................................................................... 76
5-5 HR Issues ........................................................................................................................ 78
5-6 Trends in Service Delivery Outputs and Outcomes ........................................................ 80
5-7 Impact of Decentralisation .............................................................................................. 84
5-8 Key Lessons and Challenges ........................................................................................... 86
6. CONCLUSION ..................................................................................................................... 88
6-1 Overall Progress and Challenges with LG Reforms ....................................................... 88
6-2 Linkages between Sector Decentralisation and LGs ....................................................... 90
6-3 Impact of (Sector) Decentralisation on Governance ....................................................... 91
6-4 Impact of (Sector) Decentralisation on Service Delivery ............................................... 95
6-5 Why Have Reforms Progressed in This Manner? ........................................................... 96
6-6 Key Challenges for Decentralised Service Delivery ....................................................... 97
6-7 Key Areas for Possible External Assistance .................................................................... 98
REFERENCES ............................................................................................................................. 99
ANNEXES
Annex 1 LGCDG Design Principles ..................................................................................... 106
Annex 2 Agriculture Block Grant Allocations (FY 2005/2006) ........................................... 111
Annex 3 List of Persons Met ................................................................................................. 113
vi
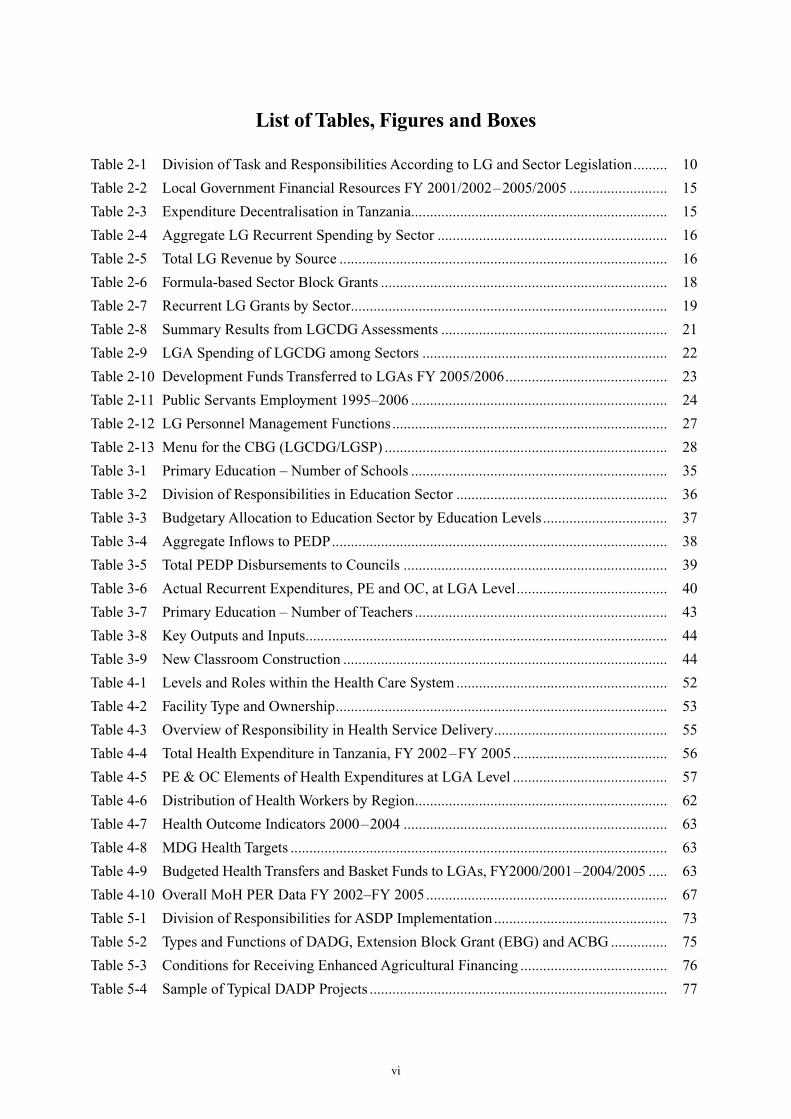
List of Tables, Figures and Boxes
Table 2-1 Division of Task and Responsibilities According to LG and Sector Legislation ......... 10
Table 2-2 Local Government Financial Resources FY 2001/2002–2005/2005 .......................... 15
Table 2-3 Expenditure Decentralisation in Tanzania.................................................................... 15
Table 2-4 Aggregate LG Recurrent Spending by Sector ............................................................. 16
Table 2-5 Total LG Revenue by Source ....................................................................................... 16
Table 2-6 Formula-based Sector Block Grants ............................................................................ 18
Table 2-7 Recurrent LG Grants by Sector.................................................................................... 19
Table 2-8 Summary Results from LGCDG Assessments ............................................................ 21
Table 2-9 LGA Spending of LGCDG among Sectors ................................................................. 22
Table 2-10 Development Funds Transferred to LGAs FY 2005/2006 ........................................... 23
Table 2-11 Public Servants Employment 1995–2006 .................................................................... 24
Table 2-12 LG Personnel Management Functions ......................................................................... 27
Table 2-13 Menu for the CBG (LGCDG/LGSP) ........................................................................... 28
Table 3-1 Primary Education – Number of Schools .................................................................... 35
Table 3-2 Division of Responsibilities in Education Sector ........................................................ 36
Table 3-3 Budgetary Allocation to Education Sector by Education Levels ................................. 37
Table 3-4 Aggregate Inflows to PEDP ......................................................................................... 38
Table 3-5 Total PEDP Disbursements to Councils ...................................................................... 39
Table 3-6 Actual Recurrent Expenditures, PE and OC, at LGA Level ........................................ 40
Table 3-7 Primary Education – Number of Teachers ................................................................... 43
Table 3-8 Key Outputs and Inputs ................................................................................................ 44
Table 3-9 New Classroom Construction ...................................................................................... 44
Table 4-1 Levels and Roles within the Health Care System ........................................................ 52
Table 4-2 Facility Type and Ownership ........................................................................................ 53
Table 4-3 Overview of Responsibility in Health Service Delivery .............................................. 55
Table 4-4 Total Health Expenditure in Tanzania, FY 2002–FY 2005 ......................................... 56
Table 4-5 PE & OC Elements of Health Expenditures at LGA Level ......................................... 57
Table 4-6 Distribution of Health Workers by Region ................................................................... 62
Table 4-7 Health Outcome Indicators 2000–2004 ...................................................................... 63
Table 4-8 MDG Health Targets .................................................................................................... 63
Table 4-9 Budgeted Health Transfers and Basket Funds to LGAs, FY2000/2001–2004/2005 ..... 63
Table 4-10 Overall MoH PER Data FY 2002–FY 2005 ................................................................ 67
Table 5-1 Division of Responsibilities for ASDP Implementation .............................................. 73
Table 5-2 Types and Functions of DADG, Extension Block Grant (EBG) and ACBG ............... 75
Table 5-3 Conditions for Receiving Enhanced Agricultural Financing ....................................... 76
Table 5-4 Sample of Typical DADP Projects ............................................................................... 77

vii
Table 5-5 Mainland Tanzania: GDP by Economic Activity ......................................................... 80
Table 5-6 Food Crop Production .................................................................................................. 81
Table 5-7 Cash Crops Production 2003–2004 ............................................................................. 81
Table 5-8 Accountability Arrangements for Different Financing and Provision Mechanisms .......... 85
Table 6-1 Sector – LGA Linkages ............................................................................................... 90
Table Annex 1-1 Menu of Investments LGCDG .......................................................................... 107
Table Annex 1-2 LGCDG Incentive Scheme ............................................................................... 109
Table Annex 1-3 Menu for the CBG (LGCDG/LGSP) ................................................................ 110
Figure 1-1 Basic Accountability Relationships ............................................................................. 4
Figure 2-1 LGs and Administrative Units: Layers and Numbers .................................................. 12
Figure 2-2 Correlation between Poverty and LGCDG Assessments ............................................. 22
Figure 3-1 Primary Education LG and CG Budget Process Relationships ................................... 42
Figure 4-1 Health Service Delivery Institutions ............................................................................ 51
Box 5-1 ASDS: Salient Features ................................................................................................ 71
Box 5-2 Historical Background to Agricultural Extension Reform .......................................... 72
Box 5-3 Report on Agricultural Extension Achievements ......................................................... 82
Box 5-4 Review of Pilot Activities Under NAEP II .................................................................. 83
viii
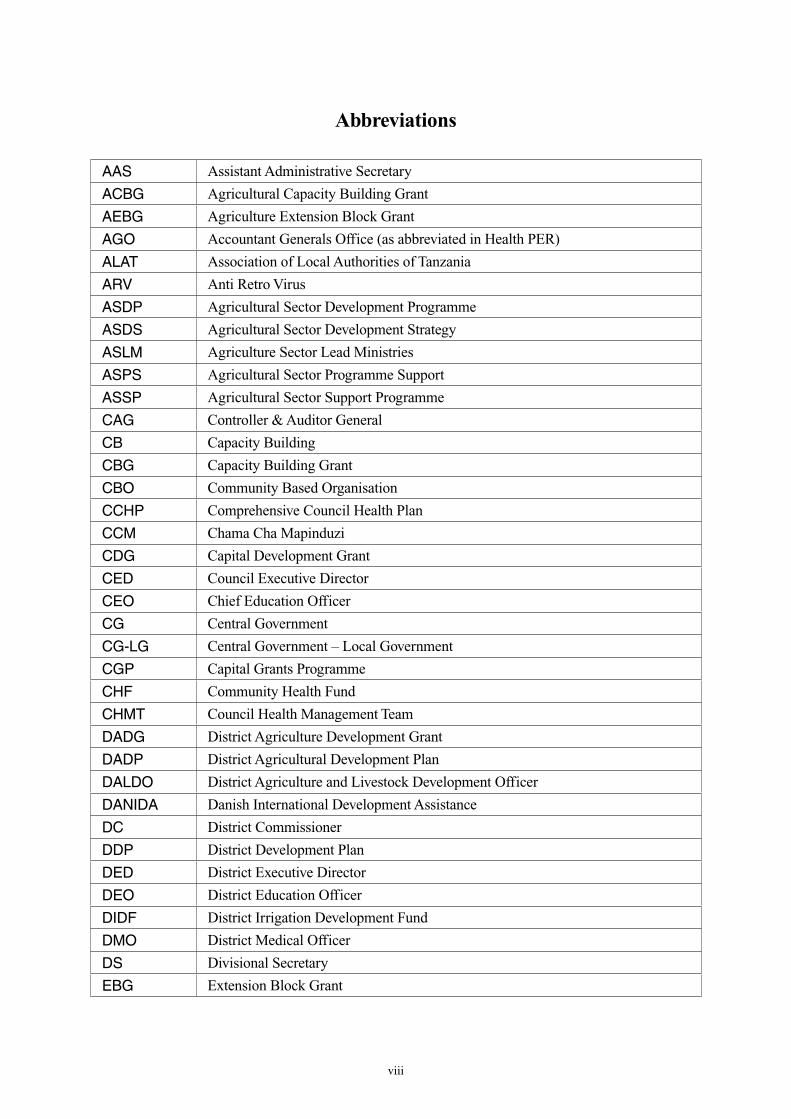
Abbreviations
AAS Assistant Administrative Secretary
ACBG Agricultural Capacity Building Grant
AEBG Agriculture Extension Block Grant
AGO Accountant Generals Office (as abbreviated in Health PER)
ALAT Association of Local Authorities of Tanzania
ARV Anti Retro Virus
ASDP Agricultural Sector Development Programme
ASDS Agricultural Sector Development Strategy
ASLM Agriculture Sector Lead Ministries
ASPS Agricultural Sector Programme Support
ASSP Agricultural Sector Support Programme
CAG Controller & Auditor General
CB Capacity Building
CBG Capacity Building Grant
CBO Community Based Organisation
CCHP Comprehensive Council Health Plan
CCM Chama Cha Mapinduzi
CDG Capital Development Grant
CED Council Executive Director
CEO Chief Education Officer
CG Central Government
CG-LG Central Government – Local Government
CGP Capital Grants Programme
CHF Community Health Fund
CHMT Council Health Management Team
DADG District Agriculture Development Grant
DADP District Agricultural Development Plan
DALDO District Agriculture and Livestock Development Officer
DANIDA Danish International Development Assistance
DC District Commissioner
DDP District Development Plan
DED District Executive Director
DEO District Education Officer
DIDF District Irrigation Development Fund
DMO District Medical Officer
DS Divisional Secretary
EBG Extension Block Grant
ix
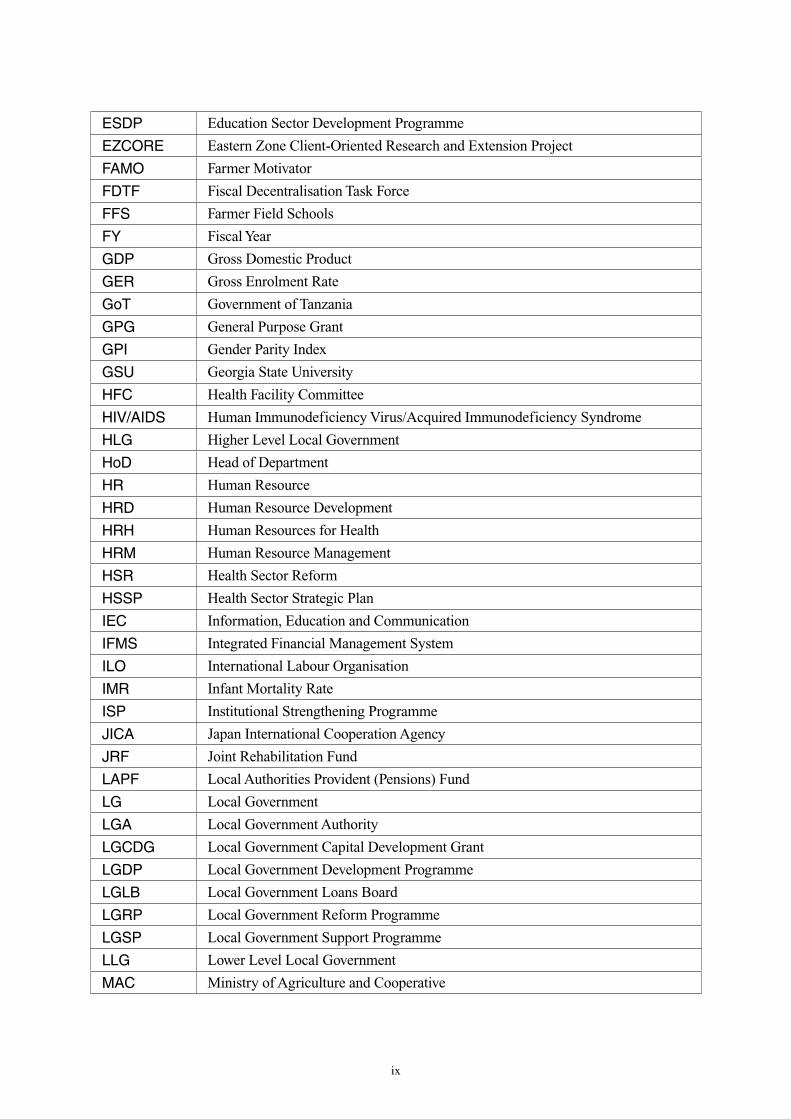
ESDP Education Sector Development Programme
EZCORE Eastern Zone Client-Oriented Research and Extension Project
FAMO Farmer Motivator
FDTF Fiscal Decentralisation Task Force
FFS Farmer Field Schools
FY Fiscal Year
GDP Gross Domestic Product
GER Gross Enrolment Rate
GoT Government of Tanzania
GPG General Purpose Grant
GPI Gender Parity Index
GSU Georgia State University
HFC Health Facility Committee
HIV/AIDS Human Immunodeficiency Virus/Acquired Immunodeficiency Syndrome
HLG Higher Level Local Government
HoD Head of Department
HR Human Resource
HRD Human Resource Development
HRH Human Resources for Health
HRM Human Resource Management
HSR Health Sector Reform
HSSP Health Sector Strategic Plan
IEC Information, Education and Communication
IFMS Integrated Financial Management System
ILO International Labour Organisation
IMR Infant Mortality Rate
ISP Institutional Strengthening Programme
JICA Japan International Cooperation Agency
JRF Joint Rehabilitation Fund
LAPF Local Authorities Provident (Pensions) Fund
LG Local Government
LGA Local Government Authority
LGCDG Local Government Capital Development Grant
LGDP Local Government Development Programme
LGLB Local Government Loans Board
LGRP Local Government Reform Programme
LGSP Local Government Support Programme
LLG Lower Level Local Government
MAC Ministry of Agriculture and Cooperative
x
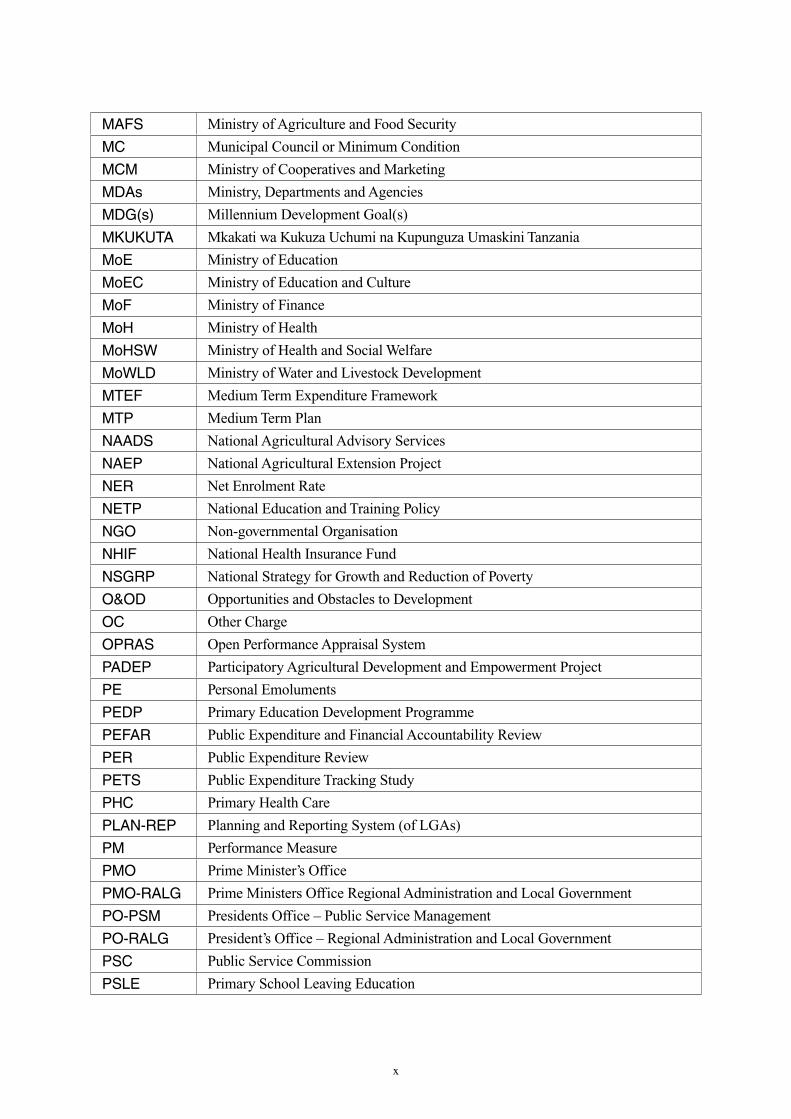
MAFS Ministry of Agriculture and Food Security
MC Municipal Council or Minimum Condition
MCM Ministry of Cooperatives and Marketing
MDAs Ministry, Departments and Agencies
MDG(s) Millennium Development Goal(s)
MKUKUTA Mkakati wa Kukuza Uchumi na Kupunguza Umaskini Tanzania
MoE Ministry of Education
MoEC Ministry of Education and Culture
MoF Ministry of Finance
MoH Ministry of Health
MoHSW Ministry of Health and Social Welfare
MoWLD Ministry of Water and Livestock Development
MTEF Medium Term Expenditure Framework
MTP Medium Term Plan
NAADS National Agricultural Advisory Services
NAEP National Agricultural Extension Project
NER Net Enrolment Rate
NETP National Education and Training Policy
NGO Non-governmental Organisation
NHIF National Health Insurance Fund
NSGRP National Strategy for Growth and Reduction of Poverty
O&OD Opportunities and Obstacles to Development
OC Other Charge
OPRAS Open Performance Appraisal System
PADEP Participatory Agricultural Development and Empowerment Project
PE Personal Emoluments
PEDP Primary Education Development Programme
PEFAR Public Expenditure and Financial Accountability Review
PER Public Expenditure Review
PETS Public Expenditure Tracking Study
PHC Primary Health Care
PLAN-REP Planning and Reporting System (of LGAs)
PM Performance Measure
PMO Prime Minister’s Office
PMO-RALG Prime Ministers Office Regional Administration and Local Government
PO-PSM Presidents Office – Public Service Management
PO-RALG President’s Office – Regional Administration and Local Government
PSC Public Service Commission
PSLE Primary School Leaving Education

xi
PSM Public Service Management
PTR Pupil Teacher Ratio
RADAG Rural and Agricultural Development Advisory Group (JICA Tanzania Office)
RAS Regional Administrative Secretary
RC Regional Commissioner
REPOA Research on Poverty Alleviation
RGS Recurrent Grant System
RMO Regional Medical Officer
RS Regional Secretariat
SACCO Savings and Credit Cooperative Societies
SASE Selective Accelerated Salary Enhancement
SCs School Committees
SEDP Secondary Education Development Programme
SWAp Sector-wide Approach
TA Technical Assistance
TASAF Tanzania Social Action Fund
TOR Terms of Reference
TSC Teachers Service Commission
U5MR Under 5 Mortality Rate
UPE Universal Primary Education
URT United Republic of Tanzania
VC Village Council
VEO Village Executive Officer
WB World Bank
WDC Ward Development Committee
WEC Ward Education Coordinator
WEO Ward Executive Officer
ZRT Zonal Reform Team

1. INTRODUCTION
1
1. INTRODUCTION
1-1 Background
Decentralisation reforms are currently ongoing in the majority of developing countries. The
nature of reforms vary greatly - ranging from mundane technical adjustments of the public
administration largely in the form of deconcentration to radical redistribution of political power
between central governments (CGs) and relatively autonomous local governments (LGs).
Decentralisation reforms hold many promises - including local level democratisation and possibly
improved service delivery for the poor. However, effective implementation often lacks behind rhetoric
and the effective delivery of promises also depends on a range of preconditions and the country
specific context for reforms. In several countries it can be observed that decentralisation reforms are
pursued in an uneven manner - some elements of the government may wish to undertake substantial
reforms - other elements will intentionally or unintentionally counter such reforms. Several different
forms of decentralisation - foremost elements of devolution, deconcentration and delegation may be
undertaken in a mutually supporting or contradictory manner.
Japan International Cooperation Agency (JICA) recognises that its development assistance at the
local level generally, and specifically within key sectors that have been decentralised will benefit from
a better understanding of the nature of decentralisation in the countries where it works. The present
study on decentralisation in East Africa is undertaken with this in mind. The study is primarily
undertaken with a broad analytical objective in mind and is not specifically undertaken as part of
a programme formulation although future JICA interventions in East Africa are intended to be
informed by the study.
1-2 Objective of Study
The specific objectives of the study are:
1. Provide a basic comparative analysis of the forms and processes of decentralisation reforms in the
three East African countries: Kenya, Uganda and Tanzania.
2. Analyse the specific modalities in the three countries for local service delivery planning and provision
within the 3 sectors of basic education, Primary Health Care (PHC) and agricultural extension.
3. Explore the impact of the specific forms of decentralisation and local level service delivery
arrangements in terms of efficiency, accountability (transparency) and democratic process
Local Level Service Delivery, Decentralisation and Governance TANZANIA CASE REPORT
2
(participation); this will include analysis of various practices for direct user participation in
planning and delivery of services 1.
1-3 Key Concepts
Decentralisation is often used as concepts without strict definitions.
The World Bank (WB) for instance use the term “decentralisation” to describe a broad range of
public sector reorganisations:
Decentralisation — the transfer of authority and responsibility for public functions from the CG
to intermediate and LGs or quasi-independent government organizations and/or the private sector
— is a complex multifaceted concept. Different types of decentralisation should be distinguished
because they have different characteristics, policy implications, and conditions for success.
There is a broad agreement to this use of terminology although it may be debated whether
“privatisation” rightly should be included or the term reserved exclusively for transfer of functions and
powers within the public sector itself 2.
It is also generally accepted to make a distinction between at least 3 main types of decentralisation 3 -
a distinction we will use throughout this study:
Deconcentration is often considered to be the weakest form of decentralisation; it redistributes
decision making authority and financial and management responsibilities among different levels of the
CG. It can merely shift responsibilities from central government officials in the capital city to those
working in regions, provinces or districts, or it can create strong field administration or local
administrative capacity under the supervision of CG ministries.
Delegation is a more extensive form of decentralisation. Through delegation central governments
transfer responsibility for decision-making and administration of public functions to semi-autonomous
organisations not wholly controlled by the CG, but ultimately accountable to it. Governments delegate
responsibilities when they create public enterprises or corporations, housing authorities, transportation
authorities, special service districts, semi-autonomous school districts, regional development
corporations, or special project implementation units. Usually these organisations have a great deal of
1 Referred to in the Terms of Reference as “forms of collective action”.2 United Nations Development Programme (UNDP) 2004 also includes privatisation as part of its definition of decentralisation.
See http://www.undp.org/governance/docs/DLGUD_PN_English.pdf 3 The definitions below follow the World Bank Decentralisation Briefing Notes (www.worldbank.org/html/fpd/urban/decent/
decent.htm)
1. INTRODUCTION
3
discretion in decision-making. They may be exempt from constraints on regular civil service personnel
and may be able to charge users directly for services.
Devolution is a third and more comprehensive type of decentralisation. When governments
devolve functions, they transfer authority for decision-making, finance, and management to quasi-
autonomous units of LG with corporate status. Devolution usually transfers responsibilities for
services to municipalities/district councils etc. that elect their own mayors and councils, raise their own
revenues and have independent authority to make investment decisions. In a devolved system LGs
have clear and legally recognized geographical boundaries over which they exercise authority and
within which they perform public functions. It is this type of administrative decentralisation that
underlies most political decentralisation.
In addition to the above it has furthermore been a common trend within many sectors to strive for
decentralisation directly to various user groups such as health users management committees, School
Committees (SCs) etc. This is often done in combination with above-mentioned forms of
decentralisation through devolution, deconcentration or delegation. In this study we will analyse the
various forms of decentralisation as they in practice have been interpreted and applied in the 3 East
African countries for local level service delivery of (basic) education, (primary) health care and
agriculture. In practice this includes:
• Examplesofdevolved systems of service delivery; in principle for all 3 sectors in both
Uganda and Tanzania as the LGs are primary responsible for these services
• Examplesofdeconcentrated local service delivery: the most dominant form for local service
delivery in Kenya, but when a service provided by local governments in Uganda entirely is
funded by CG transfers and in great detail planned for at central level we will in this study
also refer to such situations as “deconcentration”
• Someexamplesofpartialprivatisation - most prominently a feature of the reforms of the
systems for delivery of agricultural services
• Inall sectorsvarious formsofdirectdecentralisation touser groups: school management
committees, health user management committees and farmers groups

Local Level Service Delivery, Decentralisation and Governance TANZANIA CASE REPORT
4
1-4 Study Team and Methodology
The following team of consultants undertook the Tanzania case study: Per Tidemand, Hans Bjorn
Olsen and Nazar Sola. The work was undertaken August - September 2006 with subsequent report
writing. A draft report was presented to a stakeholder workshop in Dar es Salaam (JICA office) with
participants from Government of Tanzania (GoT) officials, JICA staff and development partners. Some
comments were received in December and to the extent possible incorporated in the report, however no
additional data collection was undertaken after November 2006.
Prime Ministers Office Regional Administration and Local Government (PMO-RALG) provided
logistical support and guidance to the study. The study was financed by JICA and the team also
benefited from professional comments and guidance from JICA and its Institute for International
Cooperation. However, the study does not necessarily reflect the official view of neither JICA nor the
GoT and the consultant team is responsible for all conclusions and any errors.
Figure 1-1 Basic Accountability Relationships
Poor People Providers
National policy makers(CG)
Local Policy makers(LGs)
: demonstrate the “long route of accountability” whereby citizens only very indirectly influence service providers through their elected government and possible deconcentrated structures.
: demonstrate the relatively shorter route of accountability through a devolved system of local service provision
: refers to more direct voice by citizens in service delivery planning and management through user groups etc.

1. INTRODUCTION
5
The study is based on the following
1. Review on the extensive literature on LGs and local level service delivery within education, health
and agriculture. This includes a large number of local government and sector plans, policies,
reviews and evaluations.
2. Interviews at national level with:
• StafffromPMO-RALGandLocalGovernmentReformProgramme(LGRP)
• Stafffromministriesresponsibleforfinance,planningandpublicservice
• Stafffromministriesresponsibleforhealth,education,andagriculture
- in particular the relevant directors of Policy and Planning
• TheAssociationofLocalAuthoritiesTanzania(ALAT)
• Selectedkeyinformants
3. Field work in 2 rural districts: Mpwapwa and Moshi. These districts were selected to represent
variation in effectiveness of LGs in planning and delivery of services. The criteria for their
selection included their performance in annual assessments of Local Government Authority
(LGA) capacities under the Local Government Capital Development Grant (LGCDG) system as
well as their ranking in provision of health and educational services. In each district the team
conducted interviews with:
• Stafffromtherespectiveregionalsecretariats-theassistantadministrativeofficersandsector
representatives for health, education and agriculture,
• General administrative staffof thedistrict councils (thedirector,planners, finance,human
resource management (HRM) staff)
• Sectorstaff-headsofdepartments
• Lowerleveladministrativestaff(wardandvillageexecutiveofficers(VEOs))
• Politicians(atvariouslevelssuchasdistrict,wardandvillage)
• Representativesofvarioususergroups
• Health user management committees
• School management committees
• Farmers groups
• Frontline serviceproviders:health staff at clinics, teachers/head teachers andextension
workers.
Local Level Service Delivery, Decentralisation and Governance TANZANIA CASE REPORT
6
1-5 Report Outline
The entire study is comprised of four reports:
1. Country Case Study Tanzania (this report)
2. Country Case Study Kenya
3. Country Case Study Uganda and
4. Synthesis Report
The Synthesis Report provides a summary of the 3 country reports in the form of a comparative
analysis of decentralisation and local service delivery across the 3 countries. The Synthesis Report also
expands on the methodological approach and provides a brief literature review on the relationship
between decentralisation and service delivery.
This Country Report on Tanzania is divided into the following 6 main chapters:
1. Introduction background and methodology for the study
2. The overall institutional arrangements a discussion of the general institutional arrangements, in
particular the LG system responsible for local service delivery. The chapter is in part an update
and synthesis of the study we undertook for the WB in 2004 4 and in a similar manner it analyses 5
main dimensions of the system:
• The overall legal and policy framework
• The administrative and political structures
• The fiscal dimensions (expenditure assignments, sources and levels of funding, expenditure
patterns)
• Human resource dimensions (LG human resource capacities and systems for personnel
management)
• Institutional arrangement for reform coordination, donor coordination and CG oversight and
support
3. Education sector: the strategies for decentralizing the sector, the planning, financing and HR
aspects of decentralised service delivery and the role for private sector. Analysis of the impact of
decentralisation within the sector on governance and service delivery.
4 Jesper Steffensen, Per Tidemand, Harriet Naitore (Kenya only), Emmanuel Ssewankambo (Uganda Only), Eke Mwaipopo (Tanzania only).

1. INTRODUCTION
7
4. Health sector: the strategies for decentralizing the sector, the planning, financing and HR aspects
of decentralised service delivery and the role for private sector. Analysis of the impact of
decentralisation within the sector on governance and service delivery.
5. Agricultural sector: the strategies for decentralizing the sector, the planning, financing and human
resource aspects of decentralised service delivery and the role for private sector. Analysis of the
impact of decentralisation within the sector on governance and service delivery.
6. Conclusion;
• Summarises theoverall situationof the reformso far, includingprogress, achievements,
impact of decentralisation and key lessons:
• Linkages between different forms of decentralisation and service delivery
• Linkages between different forms of decentralisation and governance
• Coherence between different sector modalities
• Coherence between sector user groups and overall (LG) structures
• Summarises the key challenges and bottlenecks that affect the future evolution of
decentralisation policy in the country, given the current achievements and performances
• Suggestspossiblewaysinwhichdonors/Japanmightbeabletoprovideeffectivesupportin
the area of decentralisation for improved local service delivery in East Africa
Local Level Service Delivery, Decentralisation and Governance TANZANIA CASE REPORT
8
2. INSTITUTIONAL ARRANGEMENTS FOR LOCAL SERVICE DELIVERY
A comprehensive description of Tanzania’s (LG system is provided in our report (Steffensen and
Tidemand 2004) - this chapter will only give a summary overview and discuss the most recent
developments. It should be noted that we focus on the LG arrangements on Tanzania mainland since
LG arrangements are not considered union matters and as the system on Zanzibar is completely
different: regulated by the Zanzibar Constitution and separate Zanzibar local government legislation 5.
2-1 Legal and Policy Framework
In Tanzania, the main institutions for local level delivery of basic services are essentially with the
LGAs 6 - in rural areas at district and village level. The decisive step towards empowering the LG in
that regard was taken in June 1996, when the Prime Minister announced the government’s decision to
restructure and downsize regional administration with the objective of making local government more
efficient and effective.7 The vision for the future LG system was formulated and endorsed at a national
conference, “Towards a Shared Vision for Local Government in Tanzania”, held in May 1996. The
wider policy intentions were outlined in the “Policy Paper on Local Government Reform” of October
1998, which in rather great detail outlines the vision of a future reformed public service. This policy
paper is still the official guiding policy regarding local government reforms and decentralisation by
devolution. The paper spells out how decentralisation will include four main policy areas 8 :
1. Political devolution is devolution of powers and the setting of the rules for councils and committees,
the chairpersons, etc., Political decentralisation will include the integration of previously
centralised or deconcentrated service sectors into a holistic LG system, installing councils as the
most important local political bodies within its jurisdiction. Political decentralisation implies the
creation of real multi-functional governments at the local level within national legislation.
2. Financial decentralisation is based on the definition of principles of financial discretionary powers
of local councils, i.e. powers to levy taxes and the obligation of CG to supply LGs with adequate
unconditional grants and other forms of grants. The principle also allows local councils to pass
their own budgets reflecting their own priorities, as well as mandatory expenditure required for
attainment of national standards.
5 For a brief description of the local government system in Zanzibar see www.dege.biz/Zanzibar.pdf 6 LGA is the abbreviation most often used in Tanzania for local government authorities - or local governments -, in Uganda and
Kenya the abbreviation LG is used.7 Prime Minister’s Budget, June 28, 1996, and Prime Minister’s Circular, July 1996, as quoted in the “Local Government Reform
Agenda 1996–2000”.8 As summarised in the executive summary of the Policy on the LG Reform (pp. v–vi).
2. INSTITUTIONAL ARRANGEMENTS FOR LOCAL SERVICE DELIVERY
9
3. Administrative decentralisation: this principle involves the de-linking of local authority staff from
their respective ministries and procedures for establishment of a local payroll. LGs will thus have
and recruit their own personnel, organised in a way decided by the respective councils in order to
improve service delivery. Administrative decentralisation makes local government staff
accountable to local councils.
4. Changed central-local relations: the role of CG vis-à-vis local councils will be changed into
a system of inter-governmental relations with central government having the over-riding powers
within the framework of the constitution. Line ministries will change their role and functions
into becoming: 1) policy making bodies, 2) supportive and capacity building (CB) bodies,
3) monitoring and quality assurance bodies within the LG legislation framework and 4) regulating
bodies (legal control and audit). The minister responsible for LG will coordinate central-local
relations and, in particular, all initiatives from sectoral matters to matters relating to LGs.
The vision for decentralisation by devolution has been supported through amendments of
various pieces of LG legislation and some review of sector legislation, but not yet fully integrated
into a Constitutional amendments or a comprehensive LGs act although this is aimed for by the
ongoing LGRP. Since the LGRP Review in 2004, the LGRP has promoted “Decentralisation by
Devolution” (D by D) as a slogan to be pursued by all government and sector reforms. Government
has in speeches, meetings and workshops generally supported these principles, although this has not
in recent years been translated into a comprehensive renewed policy statements or supportive legal
amendments.
2-1-1 Legal Assignment of Responsibilities to LGAs
LGs are through LG and sector legislation broadly mandated to provide the basics services of
health, education, water, roads, and agriculture among others. Table 2-1 presents an overview of how
functions are assigned to LGs. However, it should be noted that some of the legal provisions are a bit
vague regarding what are the mandatory functions of LGs and details on the division of tasks 9.
9 For further details see for instance Steffensen and Tidemand op. cit. 2004, chapter 2.

Local Level Service Delivery, Decentralisation and Governance TANZANIA CASE REPORT
10
Service Main responsible as provider Comments and legal issues
Primary education LGAs Section 118 of LG Act and stated in the Draft Education Bill (2004). However parallel procedures for management of teachers (TSC).The current Education Policy emphasises decentralisation to the lowest level: the school committees.
Secondary education CG As stated in the Draft Education Bill (2004), no specific reference in LG legislation. However, noted that LGAs play a role in construction of secondary schools, as it often is a local un-funded priority.
Primary and preventive health
LGAs Need for clarification of role of standing LGA committees versus decentralised facilities.
Hospitals LGAs (district hospitals) The National Health Service Bill (2004) states that responsibilities for all health facilities up to District Hospitals fall under LGAs. However, established Health Boards operate in parallel to LGA structures.
Water supply Urban areas: autonomous authorities
Rural areas: mainly LGAs
Implementation of new water capital investments in both urban and rural areas is largely managed by CG.
The water policy aims primarily at empowering users and the private sector.
Water boards in urban areas and to some extent water users associations are established for management of water supplies as parallel structures to LGAs.
Regional consultancy units are established parallel to the regional administration in order adequately to support the LGAs.
Sewerage and sanitation
As above
Solid waste LGAs No major legal issues, but problems of capacities in LGs with enforcement of laws, technical capacity for management of waste, problems of user payments for sustainable delivery of service.
Roads All districts and feeder roads, all streets in municipalities and cities
The main problems are with financing arrangements and technical capacities.Some legal issues have been raised in relation to the drafting of a new Roads Act where the ministry wanted to establish regional roads boards for coordination of district roads.
Agricultural extension LGAs In principle no major legal issues regarding division between CG and LGs. However, the transfer of some 7000 extension staff to LGAs was made rather late compared to other sectors. The capacity of LGAs to deliver meaningful services is limited not least to unresolved division of work between the private and public sector. Privatisation and use of public funds managed through farmers groups raise some issues regarding legal basis for procurement and financial management.
TSC: Teachers Service Commission
Table 2-1 Division of Task and Responsibilities According to LG and Sector Legislation 10
10 Based on Steffensen, Tidemand and Mwaipopo 2004 op. cit.
2. INSTITUTIONAL ARRANGEMENTS FOR LOCAL SERVICE DELIVERY
11
2-1-2 Recent Legal Revisions
A bill for amendment of the LG laws was published 26th July 2006 and is at the time of writing
this report for debate in the National Assembly 11.
The bill seeks to amend various pieces of LG legislation in several aspects. The amendments are
in part based cabinet decisions in 2002, regarding the need to refine the roles of regional secretariats
(RSs) including divisional secretaries (DSs). A detailed analysis of the proposed amendments and its
implications is provided by LGRP 12. The main proposals of the amendment include:
1. Introduction of a range of new “coordinating” and “consultative” institutions mainly chaired by
CG appointees, including:
a. Regional constitutional assembly in addition to the already existing regional consultative
committee all chaired by the regional commissioner (RC)
b. District consultative committee chaired by the district commissioner (DC)
c. Division defence and security committee chaired by the DS
d. Division development committee chaired by a councillor elected among councillors resident
in the division with the DS as its secretary
2. Assigning functions to these institutions in a rather broad manner. The divisional development
committee shall for instance “oversee development activities in the division”, “supervise and
coordinate implementation of development plans” etc.
3. Defining the functions of the DSs to include:
a. Representing the district executive director (DED) in overseeing implementation of activities
b. To prepare action plans and report to DC and DED
c. To supervise ward executive officers (WEOs)
4. Further defining the roles of sector ministries, inter alia to include: “to ensure that all posts as
required by establishment of a particular profession are filled”.
The amendments are currently being debated in Tanzania, but will if passed unchanged lead to
substantial deviation from the declared policy of decentralisation by devolution. The negative impact
will include 13:
11 LG Laws (Miscellaneous Amendments) Act 2006 (10th July)12 PMO-RALG/ LGRP Report on the Bill on the LG Laws (Miscellaneous Amendments) Act 2006, by Professor Issa Shivji
September 2006.13 For elaboration on most of these issues see Shivji 2006 op. cit., however note that Shivji report does not discuss the proposed
amendments regarding sector ministries role in staff management.
Local Level Service Delivery, Decentralisation and Governance TANZANIA CASE REPORT
12
• Thecreationofmultiple levelsof committeeswithCGdominance thatwill confuse the
intended empowerment of the elected district councils
• ConfusedandmultiplylinesofaccountabilitywhereforinstancetheWEO-aLGemployee-
now have to report to a CG official at the same time as he reports to the DED. The DS is
likewise supposed to report both to the DC and DED.
• PossiblycentralisingHRMatLG to sectorministries (although the formulation in the
proposed amendments are unclear).
2-2 Local Administrative and Political Structures
The LG system in the rural areas of Tanzania mainland is a two-tier LG system with LG councils
at District and Village Levels. In addition the LG system operates with administrative committees at
ward and sub-village (Kitongoji) levels.
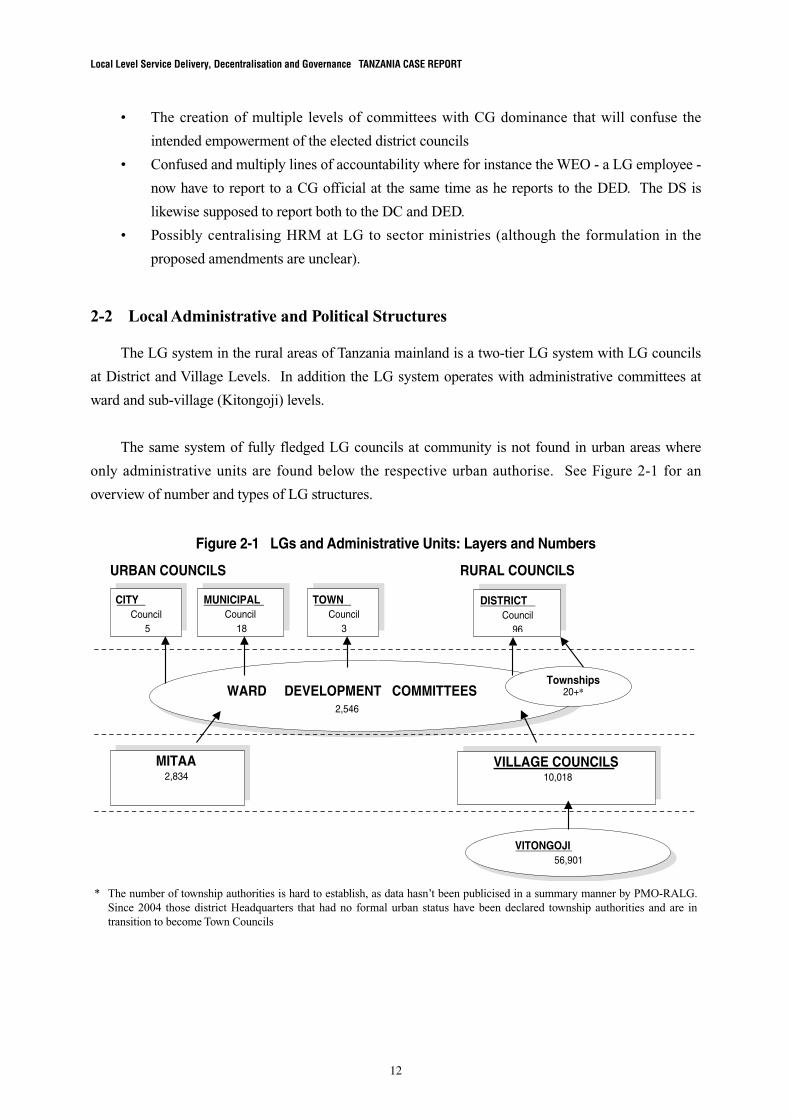
The same system of fully fledged LG councils at community is not found in urban areas where
only administrative units are found below the respective urban authorise. See Figure 2-1 for an
overview of number and types of LG structures.
Figure 2-1 LGs and Administrative Units: Layers and Numbers
URBAN COUNCILS RURAL COUNCILS
WARD DEVELOPMENT COMMITTEES 2,546
VITONGOJI56,901
MITAA 2,834
VILLAGE COUNCILS10,018
CITYCouncil
5
MUNICIPALCouncil
18
TOWNCouncil
3
DISTRICTCouncil
96
Townships20+*
* The number of township authorities is hard to establish, as data hasn’t been publicised in a summary manner by PMO-RALG. Since 2004 those district Headquarters that had no formal urban status have been declared township authorities and are in transition to become Town Councils
2. INSTITUTIONAL ARRANGEMENTS FOR LOCAL SERVICE DELIVERY
13
The number of LG structures has increased moderately over the last 4 years; the major changes
are results of urbanisation and decisions regarding formalising the urban LG status of a number of
upcoming or existing urban settlements that previously haven’t been declared as urban areas.
In addition to the LG structures, Tanzania also has a system of deconcentrated administrations; the
regional administrations, which includes a secretariat at regional level and staff at district and divisional
level. This is further discussed in section 2.5.
2-3 Local Government (LG) Finance
2-3-1 Introduction
This section provides a brief update of recent reform initiatives and developments regarding LG
financing in Tanzania. Details of the LG financing system in Tanzania were provided by our previous
report 14 and has since then been subject to further detailed analysis and discussion in reports of the
PMO-RALG/LGRP assisted by Georgia State University (GSU) 15. In this chapter we focus primarily
on the following five key issues:
• OverallpolicyandstrategicdevelopmentsregardingLGfinancing
• OveralltrendsinLGArevenues
• LGAownsourcerevenuecollections
• Progressandchallengesinreformsoftherecurrentgrantsystem
• Progressandchallengedinreformsofthedevelopmentgrantsystem
Most of the data for this section 2.3 is from the LG Finance Review 2004, 2005 and 2006. The
reader is referred to these publications for further details 16.
2-3-2 Overall Policy for LG Financing
The broad government policy for LG financing is outlined in the overall LG reform policy of 1998.
The policy states in broad terms that the Government’s objectives are to improve on LGA revenue
generation; to promote transparency and fairness in the allocation of sufficient funds; to encourage equity in
access to services; and to ensure efficient use of resources for service delivery at all levels of government.
14 Steffensen, Tidemand and Mwaipopo 2004: A Comparative Analysis of Decentralisation, Tanzania Case report pp. 48–111 and annexes 42. - 4.10.
15 See in particular: PMO-RALG/LGRP/Ministry of Finance (MoF). Development of a Strategic Framework for the Financing of LGs in Tanzania June 2006 and the related reports: LG Fiscal Review 2004, LG Fiscal Review 2005 as well as the website with LG Finance information in Tanzania: http://www.logintanzania.net
16 Available on the above mentioned website, however note that most recent data in this chapter is based on advance draft of LG Fiscal review 2006 which may differ from final version when published.

Local Level Service Delivery, Decentralisation and Governance TANZANIA CASE REPORT
14
Major steps towards the operationalisation of the policy were taken some 6 years later:
• In2004cabinetendorsedasystemforformula-basedrecurrent sectoral block grants, which
since July 2004 have been, introduced for health and education and subsequent years also for
other sectors. This reform aiming for implementing the above mentioned broad policy
concerns primarily by targeting the way CG over the years has supported LGA in financing
their recurrent expenses (person emoluments and other charges (OC)).
• TheintroductionoftheLocalGovernmentCapitalDevelopment Grant (LGCDG) system on
a nationwide basis July 2005 subsequent to design and consultations starting in 2003 with the
design of the Local Government Support Programme (LGSP). This reform initiative aims to
implement the same principles to the way that government - and donors - provide funding to
LGAs for development expenditures.
The government issued in 2004 a letter policy on fiscal decentralisation of the development budget
that outlined the intentions of the government of gradually mainstreaming various donor funded projects
and sector development grant systems into the overall LGCDG, this has later been refined and
operationalised 17. The various policy statements on LG finance is sought integrated into a comprehensive
strategic framework 18.
2-3-3 Overall Trends in LGA Revenues and Expenditures
The basic features of LGA revenues are depicted in Table 2-2 (excludes development funding). The
most important trend over the last 5 years is the expansion of fiscal transfers from central government
(Local Grants) and the significant relative decline of own source revenue (discussed further in section
2-3-4).
The financial resources at LGA level have doubled over the last five years, but this occurred in
a period of significant expansion of public expenditures in Tanzania generally and LGA share of total
public expenditure has remained relatively unchanged at around 20 % in the period (Table 2-2).
17 Further refined in the form of PMO-RALG/LGRP: Strategy For Implementation Of Government Policy on Devolution of The Development Budget (Draft 30th January 2006) and updated letter of Sectoral policy for LGSP II.
18 PMO-RALG/LGRP/MoF June 2006 op. cit.
2. INSTITUTIONAL ARRANGEMENTS FOR LOCAL SERVICE DELIVERY
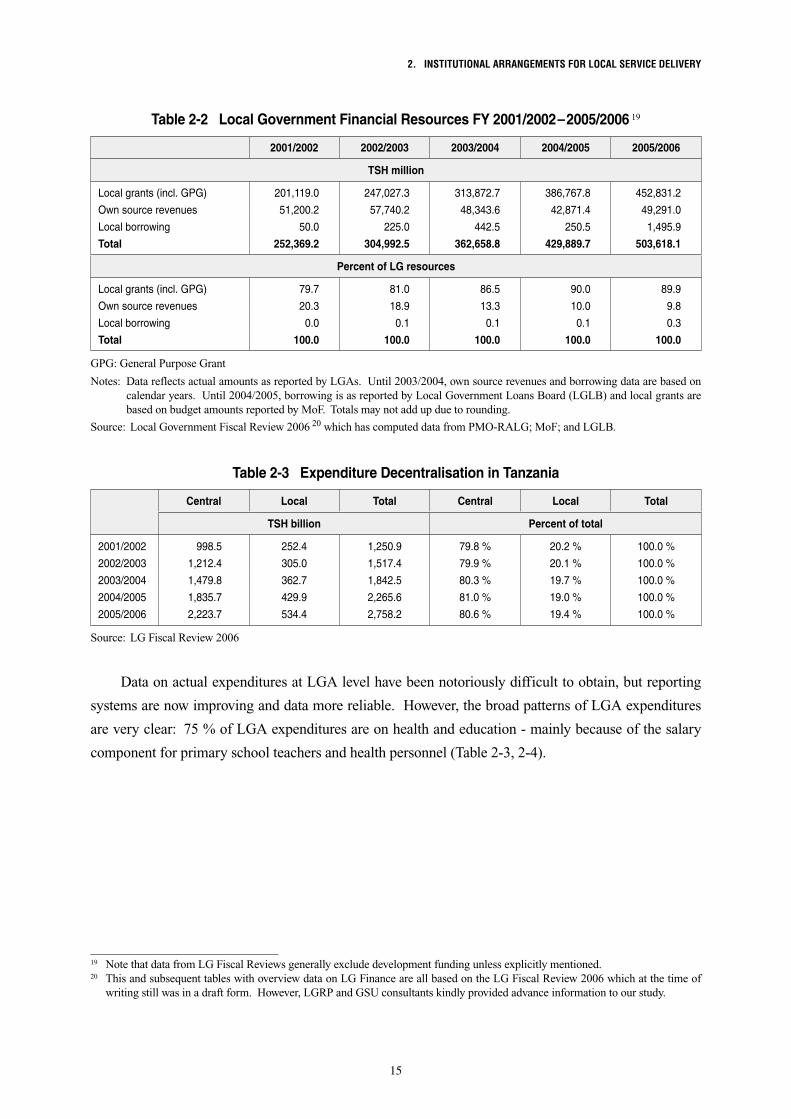
15
Data on actual expenditures at LGA level have been notoriously difficult to obtain, but reporting
systems are now improving and data more reliable. However, the broad patterns of LGA expenditures
are very clear: 75 % of LGA expenditures are on health and education - mainly because of the salary
component for primary school teachers and health personnel (Table 2-3, 2-4).
Table 2-2 Local Government Financial Resources FY 2001/2002–2005/2006 19
2001/2002 2002/2003 2003/2004 2004/2005 2005/2006
TSH million
Local grants (incl. GPG) 201,119.0 247,027.3 313,872.7 386,767.8 452,831.2
Own source revenues 51,200.2 57,740.2 48,343.6 42,871.4 49,291.0
Local borrowing 50.0 225.0 442.5 250.5 1,495.9
Total 252,369.2 304,992.5 362,658.8 429,889.7 503,618.1
Percent of LG resources
Local grants (incl. GPG) 79.7 81.0 86.5 90.0 89.9
Own source revenues 20.3 18.9 13.3 10.0 9.8
Local borrowing 0.0 0.1 0.1 0.1 0.3
Total 100.0 100.0 100.0 100.0 100.0
GPG: General Purpose Grant
Notes: Data reflects actual amounts as reported by LGAs. Until 2003/2004, own source revenues and borrowing data are based on calendar years. Until 2004/2005, borrowing is as reported by Local Government Loans Board (LGLB) and local grants are based on budget amounts reported by MoF. Totals may not add up due to rounding.
Source: Local Government Fiscal Review 2006 20 which has computed data from PMO-RALG; MoF; and LGLB.
Table 2-3 Expenditure Decentralisation in Tanzania
Central Local Total Central Local Total
TSH billion Percent of total
2001/2002 998.5 252.4 1,250.9 79.8 % 20.2 % 100.0 %
2002/2003 1,212.4 305.0 1,517.4 79.9 % 20.1 % 100.0 %
2003/2004 1,479.8 362.7 1,842.5 80.3 % 19.7 % 100.0 %
2004/2005 1,835.7 429.9 2,265.6 81.0 % 19.0 % 100.0 %
2005/2006 2,223.7 534.4 2,758.2 80.6 % 19.4 % 100.0 %
Source: LG Fiscal Review 2006
19 Note that data from LG Fiscal Reviews generally exclude development funding unless explicitly mentioned.20 This and subsequent tables with overview data on LG Finance are all based on the LG Fiscal Review 2006 which at the time of
writing still was in a draft form. However, LGRP and GSU consultants kindly provided advance information to our study.
Local Level Service Delivery, Decentralisation and Governance TANZANIA CASE REPORT
16
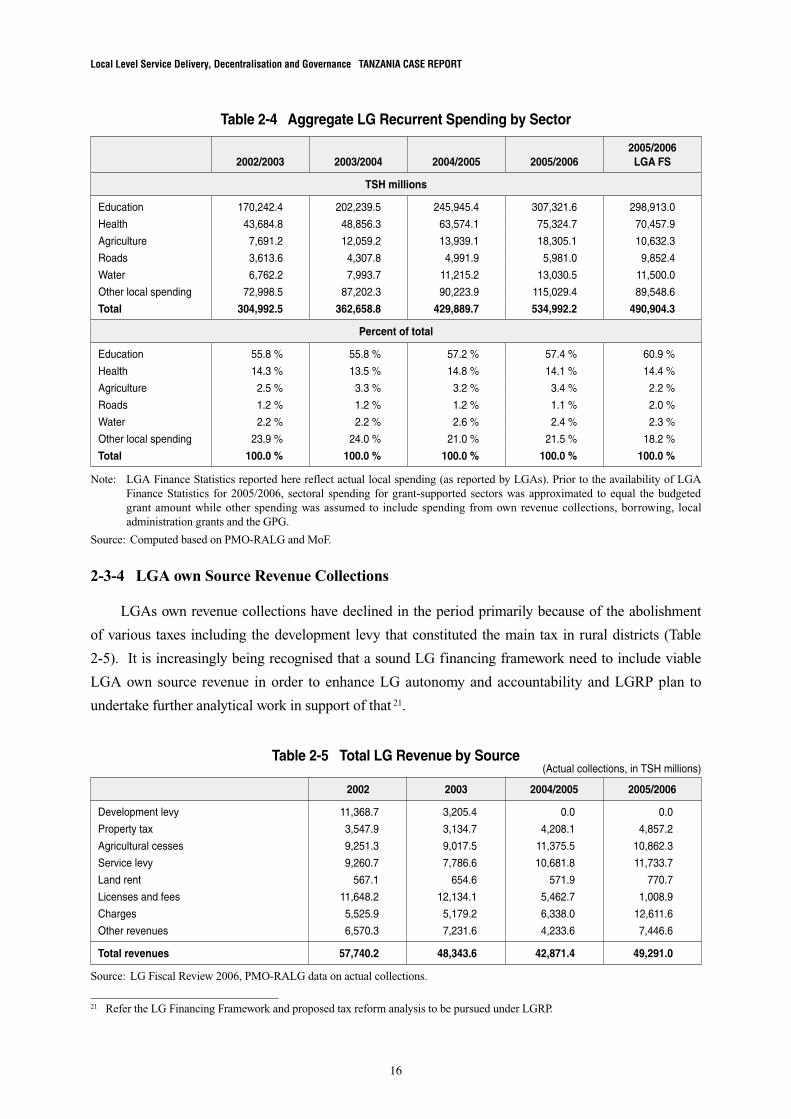
2-3-4 LGA own Source Revenue Collections
LGAs own revenue collections have declined in the period primarily because of the abolishment
of various taxes including the development levy that constituted the main tax in rural districts (Table
2-5). It is increasingly being recognised that a sound LG financing framework need to include viable
LGA own source revenue in order to enhance LG autonomy and accountability and LGRP plan to
undertake further analytical work in support of that 21.
Table 2-4 Aggregate LG Recurrent Spending by Sector
2002/2003 2003/2004 2004/2005 2005/20062005/2006LGA FS
TSH millions
Education 170,242.4 202,239.5 245,945.4 307,321.6 298,913.0
Health 43,684.8 48,856.3 63,574.1 75,324.7 70,457.9
Agriculture 7,691.2 12,059.2 13,939.1 18,305.1 10,632.3
Roads 3,613.6 4,307.8 4,991.9 5,981.0 9,852.4
Water 6,762.2 7,993.7 11,215.2 13,030.5 11,500.0
Other local spending 72,998.5 87,202.3 90,223.9 115,029.4 89,548.6
Total 304,992.5 362,658.8 429,889.7 534,992.2 490,904.3
Percent of total
Education 55.8 % 55.8 % 57.2 % 57.4 % 60.9 %
Health 14.3 % 13.5 % 14.8 % 14.1 % 14.4 %
Agriculture 2.5 % 3.3 % 3.2 % 3.4 % 2.2 %
Roads 1.2 % 1.2 % 1.2 % 1.1 % 2.0 %
Water 2.2 % 2.2 % 2.6 % 2.4 % 2.3 %
Other local spending 23.9 % 24.0 % 21.0 % 21.5 % 18.2 %
Total 100.0 % 100.0 % 100.0 % 100.0 % 100.0 %
Note: LGA Finance Statistics reported here reflect actual local spending (as reported by LGAs). Prior to the availability of LGA Finance Statistics for 2005/2006, sectoral spending for grant-supported sectors was approximated to equal the budgeted grant amount while other spending was assumed to include spending from own revenue collections, borrowing, local administration grants and the GPG.
Source: Computed based on PMO-RALG and MoF.
Table 2-5 Total LG Revenue by Source(Actual collections, in TSH millions)
Development levy
Property tax
Agricultural cesses
Service levy
Land rent
Licenses and fees
Charges
Other revenues
Total revenues
11,368.7
3,547.9
9,251.3
9,260.7
567.1
11,648.2
5,525.9
6,570.3
57,740.2
3,205.4
3,134.7
9,017.5
7,786.6
654.6
12,134.1
5,179.2
7,231.6
48,343.6
0.0
4,208.1
11,375.5
10,681.8
571.9
5,462.7
6,338.0
4,233.6
42,871.4
0.0
4,857.2
10,862.3
11,733.7
770.7
1,008.9
12,611.6
7,446.6
49,291.0
2002 2003 2004/2005 2005/2006
Source: LG Fiscal Review 2006, PMO-RALG data on actual collections.
21 Refer the LG Financing Framework and proposed tax reform analysis to be pursued under LGRP.
2. INSTITUTIONAL ARRANGEMENTS FOR LOCAL SERVICE DELIVERY
17
2-3-5 Progress and Challenges in Reforms of the Recurrent Grant System (RGS)
Until 2004 the Central Government – Local Government (CG-LG) fiscal transfer system in
Tanzania could be described as 6 sectoral LG allocation schemes - one for each 5 national policy
priority areas (education, health, water, roads and agriculture) plus an allocation scheme for local
administration. Each sectoral allocation scheme would then be further divided into personal
emoluments (PEs) and OCs. The allocation was recognised as being non-transparent and favouring
those LGAs that for historical reasons had managed to establish facilities and employ a high number
of staff, which in part meant that urban LGAs to a high degree was more favourably funded than
rural LGAs. The aims of the reform are to make the system more:
• AlignedtotheLGAexpenditureneeds
• EnsurehigherLGAdiscretionarypowertoadjust theinput totherequiredlocalneedsand
service provision priorities and thereby enhance the efficiency in resource allocation
• ImprovetheLGAincentivestoperform
• Predictable
• Stable
• Transparent
A study undertaken by Georgia State University (GSU-study) on behalf of President’s Office
–Regional Administration and Local Government (PO-RALG)/LGRP recommended a formula
driven system of recurrent grants phased in over a four-year period commencing in 2004/2005. The
grant pool would be divided into six funds targeting recurrent costs of the 5 priority service areas:
education, health, roads, water, agriculture, and administration. The GoT has endorsed this system
and GSU have been commissioned to support the implementation of the proposals. In principle,
according to the proposals, the grants will no longer differentiate between Personnel Emoluments
(PE) and OCs, there being one grant per sector to be used by LGAs at their discretion within
nationally and locally defined priorities.
Detailed proposals for a system of formula-based recurrent sector block grants were adopted by
Cabinet in February 2004 and practical implementation started with formula-based grants for primary
education and local health services in July 2004 (Table 2-6). Formula-based recurrent grants for the
other national priority sectors for which sector transfers are provided (including agriculture, water and
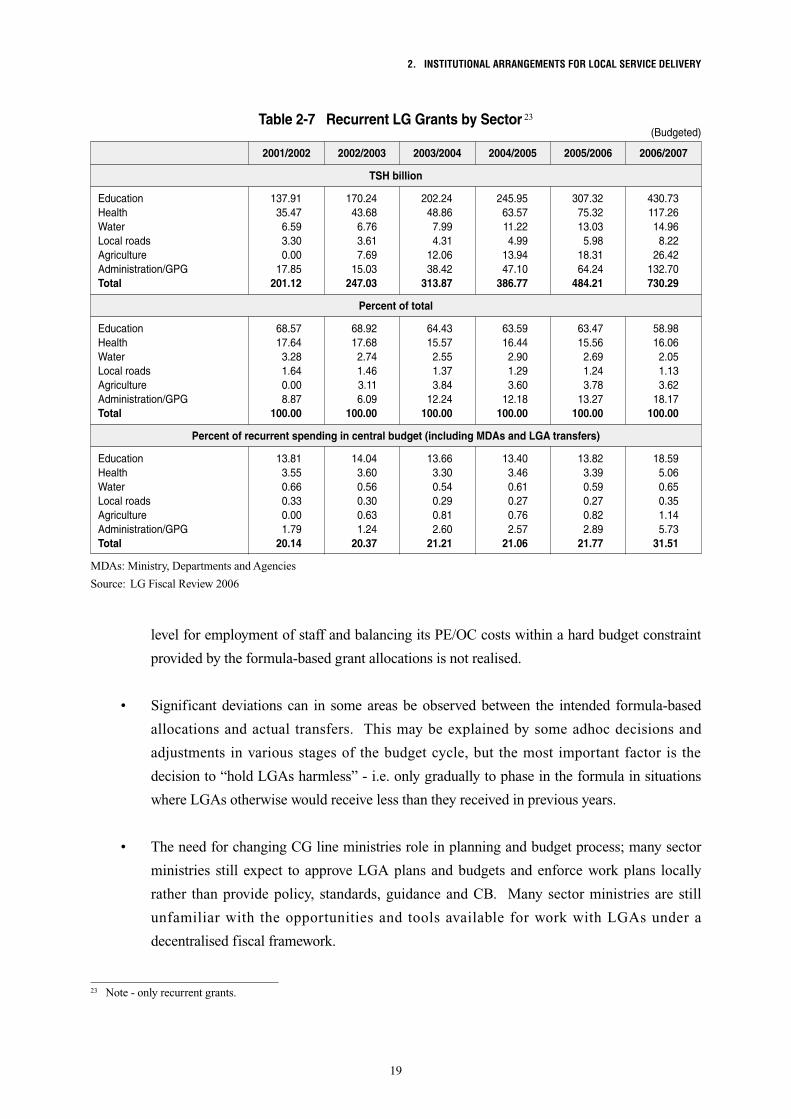
roads) were introduced as part of the FY 2005/2006 budget (Table 2-7).
In addition to these sector block grants, the central government continues to provide LGs with
a number of additional intergovernmental transfers to cater for other local expenditure responsibilities,
including the cost of local administration. These grants include a (discretionary) local administration

Local Level Service Delivery, Decentralisation and Governance TANZANIA CASE REPORT
18
grant and the GPG, which was introduced in 2003 as a compensatory grant for the abolition of certain
local revenues. The formula-based allocation of the GPG was initiated in FY 2005/2006.
The application of formulas is gradually rolled out - partly to hold those LGAs “harmless” who
otherwise would receive substantial less than previously, and partly by only gradually increasing (max
25 % per year) allocations to those LGAs that stand to gain from particular formula-based allocations.
The fiscal transfers are overwhelmingly for the education sector (approximately 60 % annually)
and health (approximately 16 %).
Some key challenges faced in the implementation to date include:
• Thebulkof recurrent financingatLGAis forsalaries. However, staffmanagement is far
from fully decentralised. The determination of staff number within each LGA and even the
practical recruitment is largely centrally determined, thus the proposed formula-based
allocations are to some extent ahead of administrative decentralisation. In practice there is
also significant differences between the agreed formula-based allocations in the beginning of
the fiscal year and later actual releases. More importantly the supposed autonomy at LGA
Sector block grant Allocation formula
Table 2-6 Formula-based Sector Block Grants 22
Primary education
Health
Agriculture extension
Water
Local roads
GPG
Number of school-aged children: 100 %(+Earmarked amount for special schools)
Population: 70 %Number of poor residents: 10 %District medical vehicle route: 10 %Under-five mortality: 10 %
Number of villages: 60 %Rural population: 20 %Rainfall index: 20 %
Equal shares: 10 %Number of un-served rural residents: 90 %
Road network length: 75 %Land area (capped): 15 %Number of poor residents: 10 %
Fixed lump sum: 10 %Total number of villages: 10 %Total population: 50 %Total number of rural residents: 30 %
Source: LG Fiscal Review (2005)
22 LG Fiscal Review 2005, however it should be noted that For FY 2006/2007, the agriculture sector changed the relative weights used in its sectoral formula; the relative weight on the number of villages was increased to 80 % while the other factors were reduced to 10 %.
2. INSTITUTIONAL ARRANGEMENTS FOR LOCAL SERVICE DELIVERY
19
level for employment of staff and balancing its PE/OC costs within a hard budget constraint
provided by the formula-based grant allocations is not realised.
• Significantdeviationscan in someareasbeobservedbetween the intended formula-based
allocations and actual transfers. This may be explained by some adhoc decisions and
adjustments in various stages of the budget cycle, but the most important factor is the
decision to “hold LGAs harmless” - i.e. only gradually to phase in the formula in situations
where LGAs otherwise would receive less than they received in previous years.
• TheneedforchangingCGlineministriesroleinplanningandbudgetprocess;manysector
ministries still expect to approve LGA plans and budgets and enforce work plans locally
rather than provide policy, standards, guidance and CB. Many sector ministries are still
unfamiliar with the opportunities and tools available for work with LGAs under a
decentralised fiscal framework.
TSH billion
Percent of total
Percent of recurrent spending in central budget (including MDAs and LGA transfers)
Table 2-7 Recurrent LG Grants by Sector 23
(Budgeted)
2002/20032001/2002
EducationHealthWaterLocal roadsAgricultureAdministration/GPGTotal
137.9135.47
6.593.300.00
17.85201.12
170.2443.68
6.763.617.69
15.03247.03
202.2448.86
7.994.31
12.0638.42
313.87
245.9563.5711.224.99
13.9447.10
386.77
307.3275.3213.03
5.9818.3164.24
484.21
430.73117.2614.96
8.2226.42
132.70730.29
EducationHealthWaterLocal roadsAgricultureAdministration/GPGTotal
68.5717.64
3.281.640.008.87
100.00
68.9217.68
2.741.463.116.09
100.00
64.4315.57
2.551.373.84
12.24100.00
63.5916.44
2.901.293.60
12.18100.00
63.4715.56
2.691.243.78
13.27100.00
58.9816.06
2.051.133.62
18.17100.00
EducationHealthWaterLocal roadsAgricultureAdministration/GPGTotal
13.813.550.660.330.001.79
20.14
14.043.600.560.300.631.24
20.37
13.663.300.540.290.812.60
21.21
13.403.460.610.270.762.57
21.06
13.823.390.590.270.822.89
21.77
18.595.060.650.351.145.73
31.51
2003/2004 2004/2005 2005/2006 2006/2007
MDAs: Ministry, Departments and Agencies
Source: LG Fiscal Review 2006
23 Note - only recurrent grants.
Local Level Service Delivery, Decentralisation and Governance TANZANIA CASE REPORT
20
2-3-6 Progress and Challenges in Reforms of the Development Grant System
The GoT maintains 2 separate budgets: the recurrent budget and the development budget. While
the recurrent budget primarily is funded from GoT own revenue, the development budget is primarily
donor funded (85 % gradually decreasing to some 77 % over the last six years) 24. A great deal of donor
support is not captured by GoT statistics. Out of the total development budget, captured by GoT
development budget, only some 5 billion were until recently transferred as an official LG development
grant transfer 25. Thus the development budget was until recently almost entirely delivered at the local
level through various projects rather than through government transfers or from LGAs own source
revenue.
From FY 2005/2006 a much larger share has been transferred through a block grant for LGAs: the
LGCDG. This is a significant step towards devolution of the development budget. Still this only
constitutes some 4 % of the entire development budget for FY 2005/2006 26. However, the government
has declared the LGCDG as the preferred modality for future development funding to LGAs and over
time it is expected that the amount and share of total development expenditures will increase.
It was realised that the previous grant transfer to LGAs did not result in very participatory planning,
transparent use or local accountability and the LGCDG is therefore only given to LGAs that fulfil
a range of basic Minimum Conditions (MCs) regarding financial management, transparency and
accountability. The basic features of the LGCDG design are enclosed as Annex 1. It is expected that
practical experiences are likely to lead to various areas of refinement and improvements over the next
year’s.
The system has only been practically implemented nationwide for 1 full f iscal year (FY
2005/2006), but practical experiences to date indicates that the LG planning system is revitalised as
discretionary funding now is available for LGAs to allocate to priorities identified from communities.
Participatory planning had been introduced in many LGAs; not least the Opportunities and Obstacles to
Development (O&OD), but only the LGCDG funds allow the LGAs to prioritise fully in line with local
priorities rather than only sector specific investments.
24 GoT 2003: Public Expenditure Review (PER) 2003 of the Development Budget. The following statistics is primarily based on this report and updated figures from recent development budgets including Makadirio ya Maendaleo ya Wizara na Mikoa FY 2004/2005 and 2005/2006 unless otherwise indicated. It should be noted that debt relief and general budget support are primary reasons for this apparent decreasing GoT contribution within the development budget. Thus it is also an indication of the general shift from project to budget support.
25 For analysis of the development budget at the local level see e.g. Pricewaterhouse Coopers 2003.26 This furthermore assumes that 100 % of the LGAs qualify and thus some 50 billion TSHs would be allocated.
2. INSTITUTIONAL ARRANGEMENTS FOR LOCAL SERVICE DELIVERY
21
The government and development partners have rapidly responded to the policy ambition of
mainstreaming development and sector funding through the LGCDG system by providing future
development funding in the agriculture sector as sector ring-fenced top-up to the LGCDG 27 from this
fiscal year, just as the additional funding for urban environment and management will be included in
future LGCDG transfers 28.
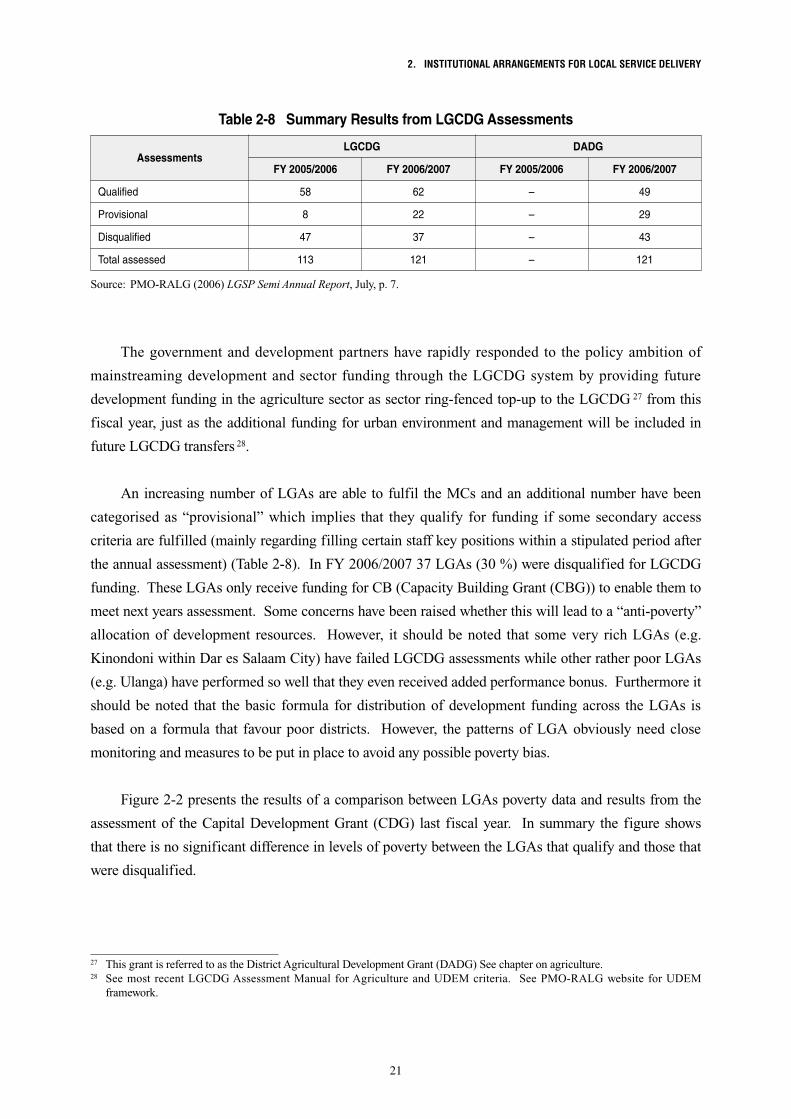
An increasing number of LGAs are able to fulfil the MCs and an additional number have been
categorised as “provisional” which implies that they qualify for funding if some secondary access
criteria are fulfilled (mainly regarding filling certain staff key positions within a stipulated period after
the annual assessment) (Table 2-8). In FY 2006/2007 37 LGAs (30 %) were disqualified for LGCDG
funding. These LGAs only receive funding for CB (Capacity Building Grant (CBG)) to enable them to
meet next years assessment. Some concerns have been raised whether this will lead to a “anti-poverty”
allocation of development resources. However, it should be noted that some very rich LGAs (e.g.
Kinondoni within Dar es Salaam City) have failed LGCDG assessments while other rather poor LGAs
(e.g. Ulanga) have performed so well that they even received added performance bonus. Furthermore it
should be noted that the basic formula for distribution of development funding across the LGAs is
based on a formula that favour poor districts. However, the patterns of LGA obviously need close
monitoring and measures to be put in place to avoid any possible poverty bias.
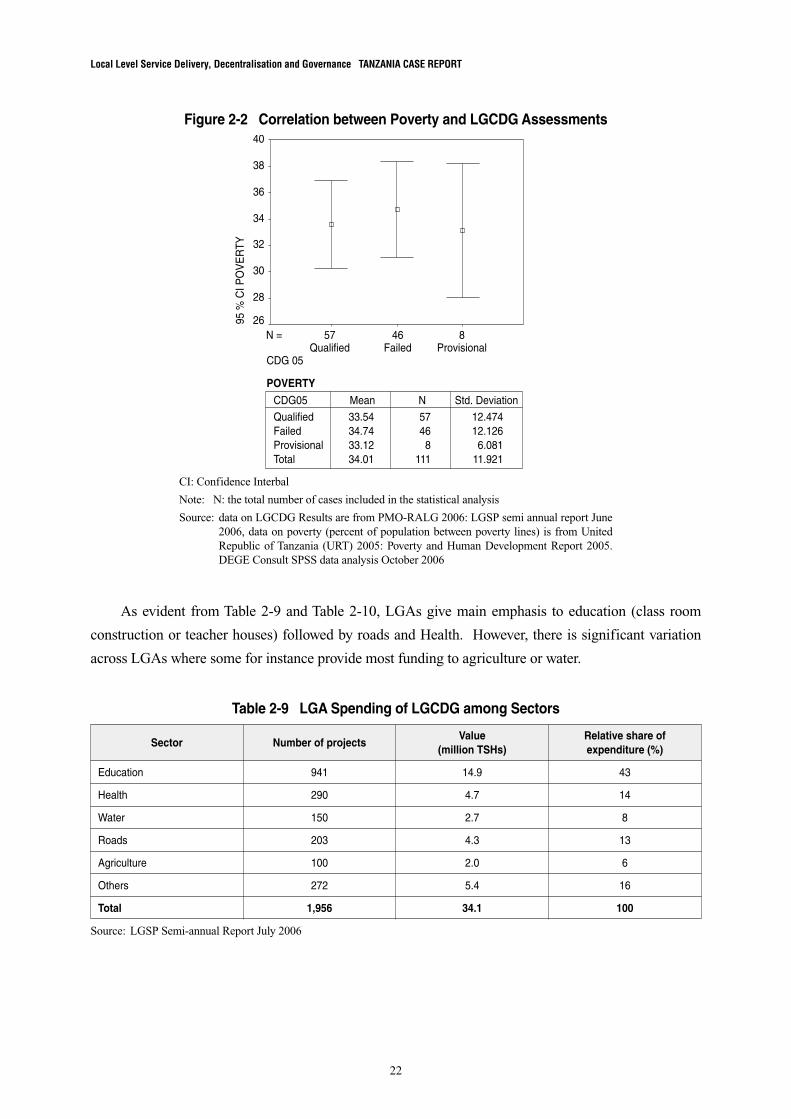
Figure 2-2 presents the results of a comparison between LGAs poverty data and results from the
assessment of the Capital Development Grant (CDG) last fiscal year. In summary the figure shows
that there is no significant difference in levels of poverty between the LGAs that qualify and those that
were disqualified.
Table 2-8 Summary Results from LGCDG Assessments
Qualified
Provisional
Disqualified
Total assessed
FY 2005/2006
58
8
47
113
FY 2006/2007
62
22
37
121
FY 2005/2006
–
–
–
–
FY 2006/2007
49
29
43
121
LGCDG DADGAssessments
Source: PMO-RALG (2006) LGSP Semi Annual Report, July, p. 7.
27 This grant is referred to as the District Agricultural Development Grant (DADG) See chapter on agriculture.28 See most recent LGCDG Assessment Manual for Agriculture and UDEM criteria. See PMO-RALG website for UDEM
framework.
Local Level Service Delivery, Decentralisation and Governance TANZANIA CASE REPORT
22
As evident from Table 2-9 and Table 2-10, LGAs give main emphasis to education (class room
construction or teacher houses) followed by roads and Health. However, there is significant variation
across LGAs where some for instance provide most funding to agriculture or water.
Figure 2-2 Correlation between Poverty and LGCDG Assessments
CI: Confidence Interbal
Note: N: the total number of cases included in the statistical analysis
Source: data on LGCDG Results are from PMO-RALG 2006: LGSP semi annual report June 2006, data on poverty (percent of population between poverty lines) is from United Republic of Tanzania (URT) 2005: Poverty and Human Development Report 2005. DEGE Consult SPSS data analysis October 2006
Table 2-9 LGA Spending of LGCDG among Sectors
Education
Health
Water
Roads
Agriculture
Others
Total
941
290
150
203
100
272
1,956
14.9
4.7
2.7
4.3
2.0
5.4
34.1
43
14
8
13
6
16
100
Sector Number of projectsValue
(million TSHs)Relative share of expenditure (%)
Source: LGSP Semi-annual Report July 2006
40
38
36
34
32
30
28
2684657N =
ProvisionalFailedQualified
95 %
CI P
OV
ER
TY
CDG 05
POVERTY
Qualified 33.54 57 12.474Failed 34.74 46 12.126Provisional 33.12 8 6.081Total 34.01 111 11.921
CDG05 Mean N Std. Deviation
2. INSTITUTIONAL ARRANGEMENTS FOR LOCAL SERVICE DELIVERY
23
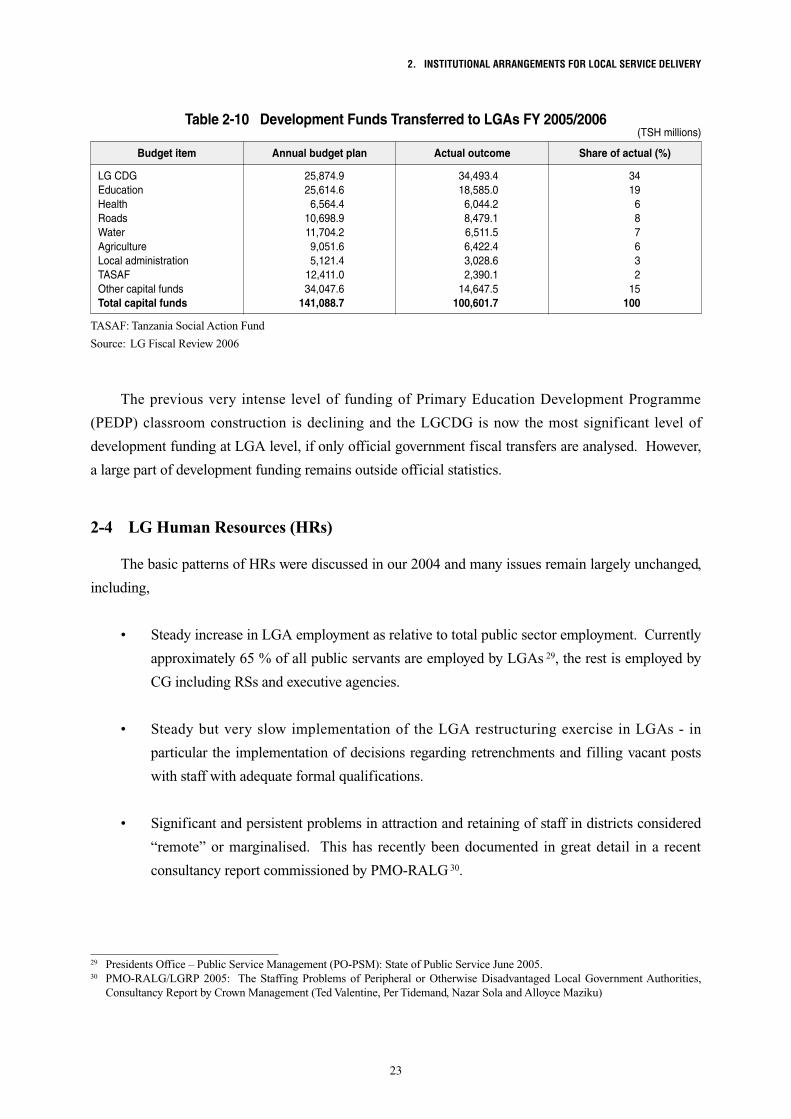
The previous very intense level of funding of Primary Education Development Programme
(PEDP) classroom construction is declining and the LGCDG is now the most significant level of
development funding at LGA level, if only official government fiscal transfers are analysed. However,
a large part of development funding remains outside official statistics.
2-4 LG Human Resources (HRs)
The basic patterns of HRs were discussed in our 2004 and many issues remain largely unchanged,
including,
• SteadyincreaseinLGAemploymentasrelativetototalpublicsectoremployment.Currently
approximately 65 % of all public servants are employed by LGAs 29, the rest is employed by
CG including RSs and executive agencies.
• Steadybutvery slow implementationof theLGArestructuringexercise inLGAs - in
particular the implementation of decisions regarding retrenchments and filling vacant posts
with staff with adequate formal qualifications.
• Significantandpersistentproblemsinattractionandretainingofstaffindistrictsconsidered
“remote” or marginalised. This has recently been documented in great detail in a recent
consultancy report commissioned by PMO-RALG 30.
Table 2-10 Development Funds Transferred to LGAs FY 2005/2006(TSH millions)
LG CDGEducationHealthRoadsWaterAgricultureLocal administrationTASAFOther capital fundsTotal capital funds
25,874.925,614.6
6,564.410,698.911,704.29,051.65,121.4
12,411.034,047.6
141,088.7
34,493.418,585.0
6,044.28,479.16,511.56,422.43,028.62,390.1
14,647.5100,601.7
3419
687632
15100
Budget item Annual budget plan Actual outcome Share of actual (%)
TASAF: Tanzania Social Action Fund
Source: LG Fiscal Review 2006
29 Presidents Office – Public Service Management (PO-PSM): State of Public Service June 2005.30 PMO-RALG/LGRP 2005: The Staffing Problems of Peripheral or Otherwise Disadvantaged Local Government Authorities,
Consultancy Report by Crown Management (Ted Valentine, Per Tidemand, Nazar Sola and Alloyce Maziku)
Local Level Service Delivery, Decentralisation and Governance TANZANIA CASE REPORT
24
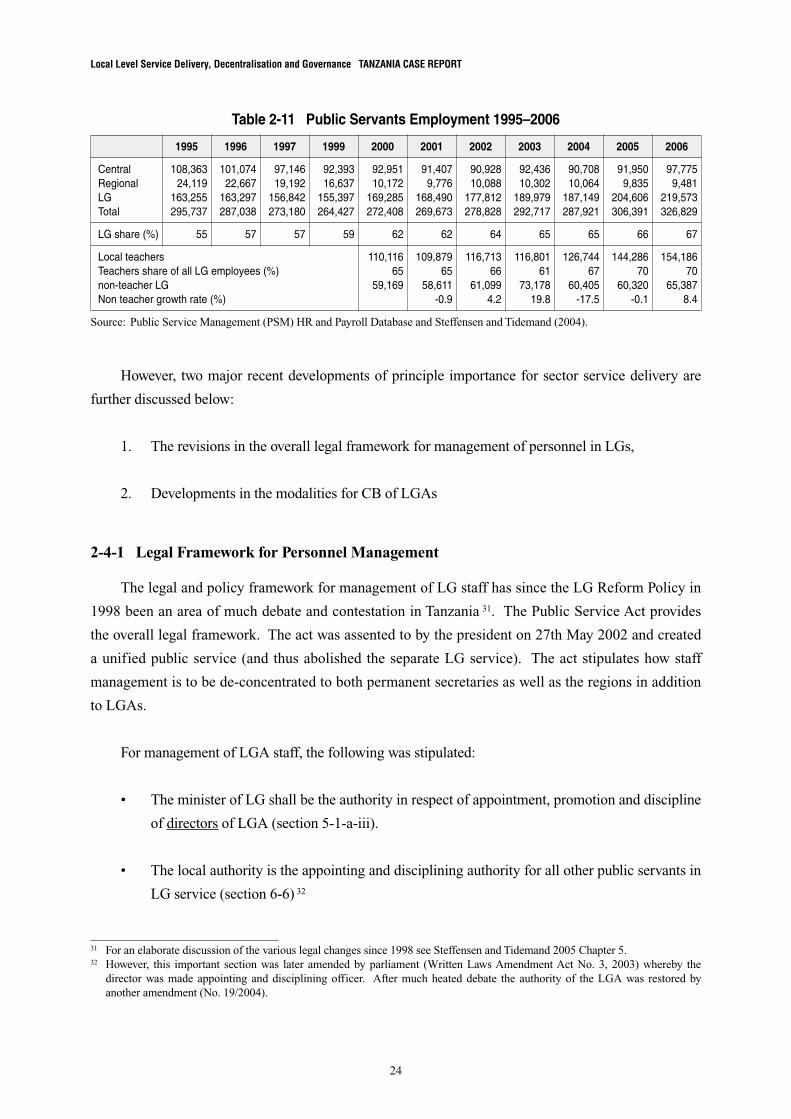
However, two major recent developments of principle importance for sector service delivery are
further discussed below:
1. The revisions in the overall legal framework for management of personnel in LGs,
2. Developments in the modalities for CB of LGAs
2-4-1 Legal Framework for Personnel Management
The legal and policy framework for management of LG staff has since the LG Reform Policy in
1998 been an area of much debate and contestation in Tanzania 31. The Public Service Act provides
the overall legal framework. The act was assented to by the president on 27th May 2002 and created
a unified public service (and thus abolished the separate LG service). The act stipulates how staff
management is to be de-concentrated to both permanent secretaries as well as the regions in addition
to LGAs.
For management of LGA staff, the following was stipulated:
• TheministerofLGshallbetheauthorityinrespectofappointment,promotionanddiscipline
of directors of LGA (section 5-1-a-iii).
• Thelocalauthorityistheappointinganddiscipliningauthorityforallotherpublicservantsin
LG service (section 6-6) 32
Table 2-11 Public Servants Employment 1995–2006
1995 1996 1997 1999 2000 2001 2002 2003 2004 2005 2006
CentralRegionalLGTotal
LG share (%)
Local teachers Teachers share of all LG employees (%)non-teacher LGNon teacher growth rate (%)
108,36324,119
163,255295,737
55
101,07422,667
163,297287,038
57
97,14619,192
156,842273,180
57
92,39316,637
155,397264,427
59
92,95110,172
169,285272,408
62
110,11665
59,169
91,4079,776
168,490269,673
62
109,87965
58,611-0.9
90,92810,088
177,812278,828
64
116,71366
61,0994.2
92,43610,302
189,979292,717
65
116,80161
73,17819.8
90,70810,064
187,149287,921
65
126,74467
60,405-17.5
91,9509,835
204,606306,391
66
144,28670
60,320-0.1
97,7759,481
219,573326,829
67
154,18670
65,3878.4
Source: Public Service Management (PSM) HR and Payroll Database and Steffensen and Tidemand (2004).
31 For an elaborate discussion of the various legal changes since 1998 see Steffensen and Tidemand 2005 Chapter 5.32 However, this important section was later amended by parliament (Written Laws Amendment Act No. 3, 2003) whereby the
director was made appointing and disciplining officer. After much heated debate the authority of the LGA was restored by another amendment (No. 19/2004).
2. INSTITUTIONAL ARRANGEMENTS FOR LOCAL SERVICE DELIVERY
25
The general provisions of Act 8 have been made effective by the official issuance of regulations as
published in the Gazette and appointment of the Commission.
The regulations (section 127) state: “Every LGA shall establish a board which shall be responsible
for the facilitation of appointment of the public servants of the LGA concerned in the accordance with
the provisions of these regulations.”
The exact powers of these employment boards depend on decisions of the overall Public Service
Commission (PSC) (established by the president) as to what authority they wish to delegate (section
128-1).
The employment board in every LGA shall be responsible for facilitation (our emphasis) of
appointments of all public servants within the LGA concerned other than those appointed by the
president and minister responsible for LG (section 128-2).
The regulations stipulate that the employment board shall be answerable to the LGA concerned,
but the legal link is weak and the employment board is mainly composed of externally appointed
members (section 128-4):
a. A chairman who shall be appointed by the LGA from amongst people who are ordinarily
resident in the area of the jurisdiction of that LGA, knowledgeable in personnel management
or public administration or law
b. One member to be appointed by the LGA from amongst its members who shall in any case
not be the chairman of the LGA
c. The district administrative secretary or his representative
d. An expert from the relevant RS responsible for LG matters
e. A representative from the PSC
The Head of Department (HoD) responsible for personnel matters in a respective LGA shall be
the secretary to the board but not be entitled to vote.
The procedures for employment of staff, other than the director, are subsequently:
• TheLGAnotifytheboardaboutanyvacanciesintheLGA
• Theboardwill(afterconsultationwiththePSC)advertisethevacantpost(nationally)
• Applicantsforthepostsubmitlettersofapplicationtothedirector
• Theboardundertakesinterviewsofcandidatesandselectsthesuitablecandidatesinorder
of merit
Local Level Service Delivery, Decentralisation and Governance TANZANIA CASE REPORT
26
• Thedirectorshallsubsequentlyappoint“takingintoaccounttheadvicegivenbytheboard”
and in “consultation with the LGA concerned”
• Thedirectorissuestheappointmentletter
The regulations outline a separate procedure for teachers, as the appointing authority is the head of
the teachers service department (section 6). The disciplinary authority for all staff (except the director)
of the LGA is the director of the respective LGA. In addition, the regulations give specific guidance
for the discipline of members of the teachers service and the health service.
The disciplinary authority of directors is the minister responsible for LGAs (except directors of
cities, where the chief secretary is the disciplinary authority). Section 103 outlines how “each
employer shall be responsible for training and development of his staff ”. Staff development plans
shall be linked to performance appraisals and the employer shall ensure provision in the annual
budget for training. The regulations provide the opportunity for LGAs to offer employees an
additional incentive package. The director is made responsible for ensuring that result-oriented
management is pursued and that the service is mission-driven and performing effectively and
efficiently (section 6-1).
Table 2-12 gives an overview of personnel management functions in LGAs as per the Public
Service Regulations 2003. As far as we could establish, then the regulations have not been amended
subsequent to the amendment of the act itself. Thus there is a discrepancy since the amended act had
(re) established the LGAss as the appointing and disciplining authority, whereas the regulations assigns
the director.
In summary, the new legal framework under the Public Service Act has wide ranging
implications for LGA personnel management. The employment of LGA staff is symbolically
maintained, but powers of recruitment are centralised 33; Directors are appointed, promoted and
disciplined by CG and directors in turn manage other LGA staff. All LGA staff can be transferred
“in the public interest”. LGAs have no effective control over the staff that they formally have in their
employment.
In addition, the Act and Regulations establish separate management procedures for teachers.
While professional registration of teachers is appropriate and already established in the Education Act,
1978, and the proposed new Education Act, the proposed structures in the Act confuse the employer
function of the LGAs.
33 Note the “centralisation” is mainly related to the LG Reform Policy, not compared to previous actual practice
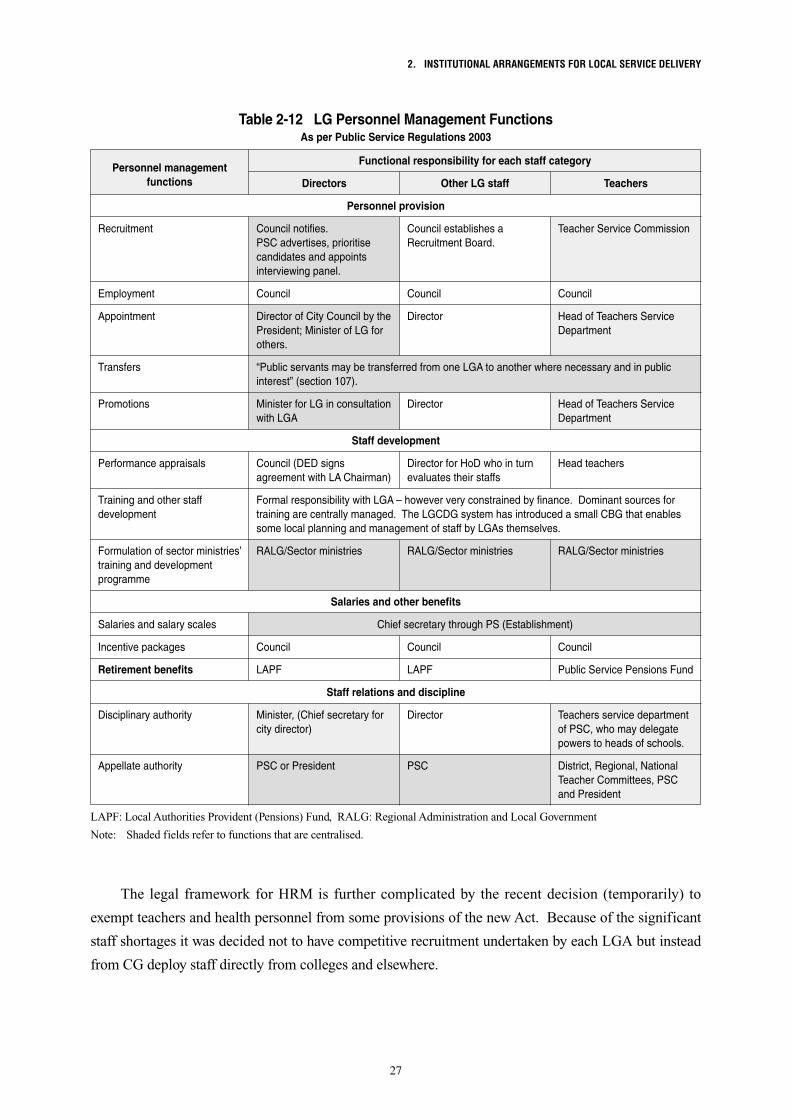
2. INSTITUTIONAL ARRANGEMENTS FOR LOCAL SERVICE DELIVERY
27
The legal framework for HRM is further complicated by the recent decision (temporarily) to
exempt teachers and health personnel from some provisions of the new Act. Because of the significant
staff shortages it was decided not to have competitive recruitment undertaken by each LGA but instead
from CG deploy staff directly from colleges and elsewhere.
Personnel provision
Staff development
Salaries and other benefits
Staff relations and discipline
Recruitment
Employment
Appointment
Transfers
Promotions
Performance appraisals
Training and other staff development
Formulation of sector ministries’ training and development programme
Salaries and salary scales
Incentive packages
Retirement benefits
Disciplinary authority
Appellate authority
Council notifies.PSC advertises, prioritise candidates and appoints interviewing panel.
Council (DED signs agreement with LA Chairman)
RALG/Sector ministries RALG/Sector ministries RALG/Sector ministries
Council establishes a Recruitment Board.
Director for HoD who in turn evaluates their staffs
Teacher Service Commission
Head teachers
Council Council Council
Director of City Council by the President; Minister of LG for others.
Minister for LG in consultation with LGA
Director Head of Teachers Service Department
“Public servants may be transferred from one LGA to another where necessary and in public interest” (section 107).
Formal responsibility with LGA – however very constrained by finance. Dominant sources for training are centrally managed. The LGCDG system has introduced a small CBG that enables some local planning and management of staff by LGAs themselves.
Chief secretary through PS (Establishment)
Council
LAPF
Council
LAPF
Council
Public Service Pensions Fund
Teachers service department of PSC, who may delegate powers to heads of schools.
DirectorMinister, (Chief secretary for city director)
District, Regional, National Teacher Committees, PSC and President
PSCPSC or President
Director Head of Teachers Service Department
Table 2-12 LG Personnel Management Functions As per Public Service Regulations 2003
Personnel management functions
LAPF: Local Authorities Provident (Pensions) Fund, RALG: Regional Administration and Local Government
Note: Shaded fields refer to functions that are centralised.
Functional responsibility for each staff category
Directors Other LG staff Teachers
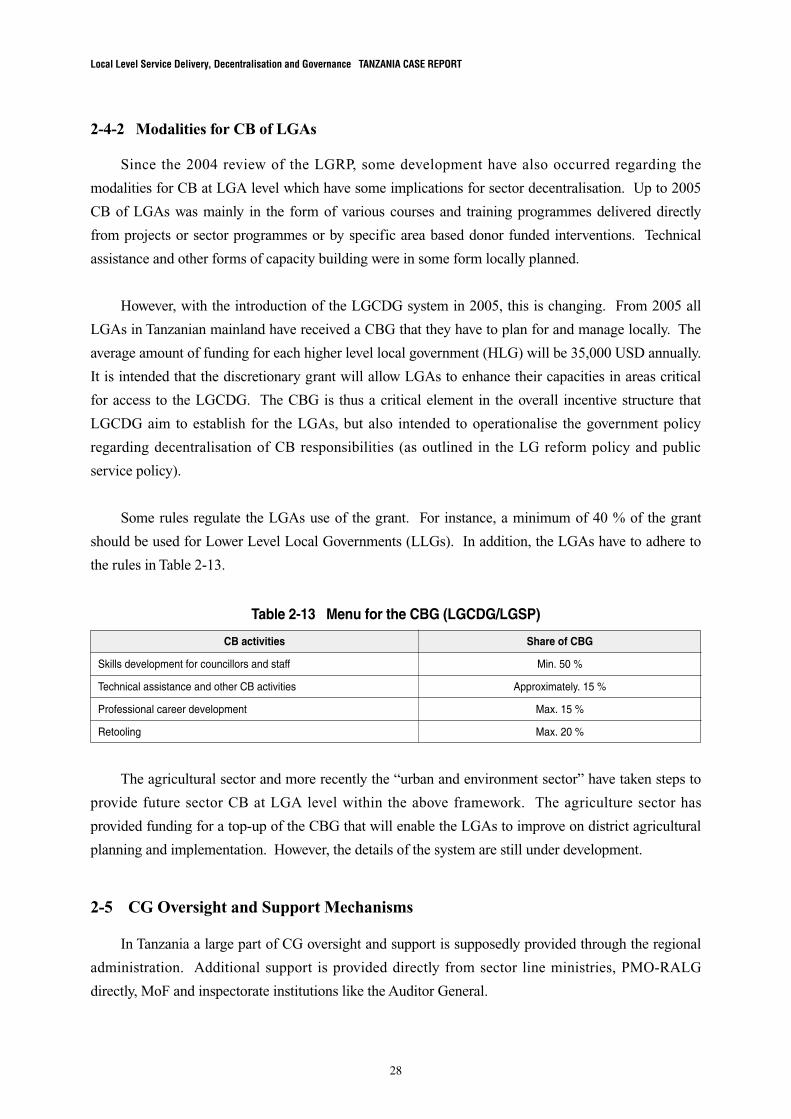
Local Level Service Delivery, Decentralisation and Governance TANZANIA CASE REPORT
28
2-4-2 Modalities for CB of LGAs
Since the 2004 review of the LGRP, some development have also occurred regarding the
modalities for CB at LGA level which have some implications for sector decentralisation. Up to 2005
CB of LGAs was mainly in the form of various courses and training programmes delivered directly
from projects or sector programmes or by specific area based donor funded interventions. Technical
assistance and other forms of capacity building were in some form locally planned.
However, with the introduction of the LGCDG system in 2005, this is changing. From 2005 all
LGAs in Tanzanian mainland have received a CBG that they have to plan for and manage locally. The
average amount of funding for each higher level local government (HLG) will be 35,000 USD annually.
It is intended that the discretionary grant will allow LGAs to enhance their capacities in areas critical
for access to the LGCDG. The CBG is thus a critical element in the overall incentive structure that
LGCDG aim to establish for the LGAs, but also intended to operationalise the government policy
regarding decentralisation of CB responsibilities (as outlined in the LG reform policy and public
service policy).
Some rules regulate the LGAs use of the grant. For instance, a minimum of 40 % of the grant
should be used for Lower Level Local Governments (LLGs). In addition, the LGAs have to adhere to
the rules in Table 2-13.
Table 2-13 Menu for the CBG (LGCDG/LGSP)
Skills development for councillors and staff
Technical assistance and other CB activities
Professional career development
Retooling
Min. 50 %
Approximately. 15 %
Max. 15 %
Max. 20 %
CB activities Share of CBG
The agricultural sector and more recently the “urban and environment sector” have taken steps to
provide future sector CB at LGA level within the above framework. The agriculture sector has
provided funding for a top-up of the CBG that will enable the LGAs to improve on district agricultural
planning and implementation. However, the details of the system are still under development.
2-5 CG Oversight and Support Mechanisms
In Tanzania a large part of CG oversight and support is supposedly provided through the regional
administration. Additional support is provided directly from sector line ministries, PMO-RALG
directly, MoF and inspectorate institutions like the Auditor General.
2. INSTITUTIONAL ARRANGEMENTS FOR LOCAL SERVICE DELIVERY
29
2-5-1 Regional Administration
Debate in Tanzania has in recent years in particular focused on the appropriate role of the regional
administration. Since the substantive restructuring of the regional administration by the late 1990s, it
has been debated how to operationalise the intended change of the role of regional administration and
its secretariat from one of implementation to one of monitoring, advice and supervision.
The regional administration is partly composed of a RS with professional staff within key service
delivery sectors and partly general administrative cadres. While the sector professional staffs only
constitutes a small secretariat at regional level, then the general administrative staff extends down to
district (DC and support staff) and divisional level (DSs).
The RS has in the last years of LGRP been included in the reform programme as a programme for
institutional strengthening of regional secretariats (ISP RSs) was included in the overall LGRP after
appraisal in 2005 34.
The institutional strengthening programme (ISP) was intended to address a range of key problems
regarding the operations of the RSs including:
• Highnumberofvacanciesinkeytechnicalpositions
• Problemsregardingemploymentofsomeunqualifiedstaffs
• Lackofequipments
• Lowlevelsoffinancingofthetechnicalarmoftheregionaladministration 35
• Poororientationtowork,includinglackofdisseminationofthePlanningandmanagement
guide (PMG) and non-operational clusters due to lack of “cluster heads”/Assistant Administrative
Secretaries (AASs), and most basically -
• UnclearassignmentoffunctionstoRSwithinkeysectors.
The programme has taken off but progress is slow.
While the debate on the RS has been ongoing for a while and also part of the LGRP, then it is more
recent that the fundamental functions of the entire regional administration is up for debate 36. The report
analyses the current system with emphasis on the relationship between the regional administration and
34 LGRP 2005: Appraisal of the proposed ISP for RSs, by PEM consult March 2005.35 Not only a problem of general level of funding but probably more regarding the balance between the sector/technical staff of the
RS and the administrative side of the regional administration: 16 % of total regional budget to technical staff compared to 84 % for general administration; see appraisal op. cit. pp. 15–16.
36 PMO-RALG/LGRP: Review of the Local Government Laws, The Regional Administration Act and the Organisational Structure of Regional Administration - a consultancy report by Professor I. G. Shivji and Professor B. S. Rutinwa (draft 2006)
Local Level Service Delivery, Decentralisation and Governance TANZANIA CASE REPORT
30
LGs. It is observed that the current arrangements lead to some confusion of lines of accountability,
especially with the interlinkages between the CG staff at district and divisional levels and the LG
structures. The radical solution will obviously be to limit and focus the extension of CG administration to
the regional level and abolish the offices of DCs and DSs.
2-5-2 Reporting and Monitoring of LGA Performance
Within the last few years very substantive progress has been made regarding a number of aspects
of LGA reporting and monitoring.
• ThePMO-RALGsystemforgenericplanningandreportingatLGAlevelinMediumTerm
Expenditure Framework (MTEF) format is now almost applied nationwide and it is expected
that nation wide report can be generated from next fiscal years
• ThisyearPMO-RALGandMoFhasalsoforthefirsttimebeenabletoanalyseandpublish
summary data on actual expenditures at LGA level
• SystemforreportingonLGrevenuecollectionisnowoperational
• Anational assessment systemhasbeendeveloped for theLGCDGmodality,whichonan
annual basis monitor LGA’s compliance to a range of governance indicators
In spite of the improvements some substantive shortcomings are also noted 37.
• ReportingonLGAfiscalperformance is complicatedbymultiple changes inCGbudget
allocations after LGAs have approved their budgets. It can be difficult to establish what
actually is the authorised budget against which to measure performance.
• Theintroductionofsomeofthenewsystems,inparticularthesystemforintegratedfinancial
management (EPICOR) has delayed in effective implementation. EPICOR is reported
poorly functioning in many councils and led to extra work load as councils have to operate
duel systems (computerised and manual)
• In spiteof the efforts formainstreamingdevelopment funding throughLGCDGand
minimising formats for reporting (by using Planning and Reporting System (PLAN-REP)),
LGAs are still required to maintain numerous different bank accounts and different reporting
formats for different projects
37 Public Expenditure and Financial Accountability review (PEFAR) 2005.
2. INSTITUTIONAL ARRANGEMENTS FOR LOCAL SERVICE DELIVERY
31
2-6 Current Key Issues and Challenges
The LG reform process has progressed over the last couple of years in many ways. This includes
foremost:
• Significantprogress in reformof the recurrent fiscal transfer system,more transparent
allocations of funds within key sectors,
• Introductionofformula-baseddevelopmentfundingtoLGAsthroughtheLGCDGsystemin
a manner that provides incentives for adherence to basic principle of good governance
(financial management issues in particular) and which provides funding to LGAs that enable
local budget priorities in development planning,
• SignificantstepstowardssectorintegrationintothenewmodalitiesforCGfundingofLGAs,
• Continued trainingofLGAstaff invariouscross sectoral issues, includingLG financial
management,
• SignificantreorganisationofPMO-RALGwithsubstantialrecruitmentofprofessionalstaffs.
The most significant key challenges include:
• TheproposedlegalamendmentsandfutureinstitutionalarrangementsforCGrepresentation
at district and divisional level,
• Agreat deal of uncertainty regarding the functionsof powersofLGA inpersonnel
management, the current law and practices significantly limits the control of LGAs over
HRM issues,
• Effectiveoperationalisationof the intensionsof sectors toprovide futuredevelopment
funding within LGCDG framework,
• Effectiveoperationalisationof the intensionsof the sectors toprovide futurecapacity
building within the LGCDG and related CBG framework,
• FuturespearheadingoftheoverallLGreformprocessasthecurrentprogramme(theLGRP)
is expected to “phase out” in 2008, yet it may be argued that the capacity of PMO-RALG to
drive reform process still is limited.
Local Level Service Delivery, Decentralisation and Governance TANZANIA CASE REPORT
32
3. BASIC EDUCATION
3-1 Sector Policy for Local Service Delivery 38
The National Education and Training Policy (NETP) formulation exercise started in 1989 when
the Ministry of Education and Culture (MoEC) established a task force to map out an education
strategy for the coming many years. The work of the task force culminated in 1995 when the
ministry promulgated the NETP. Based on the NETP the government developed the Education
Sector Development Programme (ESDP) in 1996 to address the problems with education provision.
Tanzania was facing challenges resulting from the socio-economic reforms initiated in 1986 and the
increasing demand for HR development in line with fast changing technological advancement. The
ESDP was developed and a sector-wide approach (SWAp) was formed between donors and
Government for education development to redress the problem of fragmented vertical stand alone
donor interventions.
The GoT subscribes to several international declarations such as the Education for all goals
adopted at Dakar and the Millennium Development Goals (MDGs) both of which include universal
primary education of good quality and gender parity. On a national level, the Tanzania Development
Vision 2025, which sees education as a key area for solving the development challenges that face the
nation, provides the long term framework, and the education sector is a prominent part of the medium
term national anti-poverty strategy Mkakati wa kukuza uchumi na kupunguza umaskini Tanzania
(MKUKUTA).39
In 2000 the government and the development partners commissioned an education sector country
status report. The report was part of the government effort to develop a strategic approach to sector
development. It articulates an in-depth understanding of the status of the education sector and the
critical constraints on its development. It also contributes to the ongoing discussion between the
government and the donor community toward the articulation of a sector development programme as
part of a SWAp, and formed a basis upon which the PEDP was initiated. The 4 main components of
PEDP are:
• Enrolmentexpansion,
• Qualityimprovement,
• CB,
• Strengtheninginstitutionalarrangements.
38 Sources for the following sections are: The Education and Training Sector Development Programme, Revised August 2001; Education Sector Situation Analysis, Final Report December 2005, PMO-RALG; Education Sector PER, Final Report December 2005; ESDP, Education Sector Review 23-25 February 2006 Aide Memoire
39 National Strategy for Growth and Reduction of Poverty (NSGRP)
3. BASIC EDUCATION
33
The emphasis of the PEDP strategy is on increasing both gross and net enrolment of boys and
girls in primary schools, and increasing enrolment of children with disabilities and other vulnerable
groups in primary schools. In 2004, based on a comprehensive technical analysis, the government
launched the Secondary Education Development Programme (SEDP), which included plans for the
significant expansion of secondary education to raise the Net Enrolment Rate (NER) from 10 % to 50
%, to be achieved with a crash programme of school building and teacher training.
The government’s strategy in primary education
As Universal Primary Education (UPE) was introduced in 2001 the government decided at the
same time to abolish user fees for primary education. The idea was to increase the overall (gross
enrolment rate (GER)/NER) enrolment rates for both boys and girls and to start a programme of
improvements in school buildings as well as materials and teaching quality.
The strategy within the education sector for primary education is to 40:
• Provideenoughandqualifiedteachers,
• Upgradeprofessionalandacademicqualificationsofservingteachers,
• Constructadequatenumberofclassrooms,utilities,staffhousesandenergysources,
• Provideappropriateandadequateteaching-learningmaterials,
• Provideincentivepackagetoteachers,
• Reviveextra-curricularactivitiessuchasgamesandsports,music,physicaleducation,
• TrainspecialistteachersforKiswahiliandEnglish,
• Reviewandrevisetheschoolcurriculumtomakeitmorerelevantandmarketoriented,
• Increaseenrolmentofschoolagechildren.
In 2004/2005, the GoT undertook steps to strengthen its results-based approach to policy making
and budgeting with the shift from a sector-based to a cluster outcome-based approach to development
with the introduction of National Strategy for Growth and Reduction of Poverty (NSGRP)/
MKUKUTA. With the NSGRP having shifted from the priority-sector concept to the cluster concept,
plan and budget guidelines are now being prepared on the basis of cluster strategies and outcomes.
This means that the education sector is vying for resources together with health, water and other sectors
under the social services outcome cluster. This puts added pressure on the sector for the contestability
and usage of priority funding.
40 P. 12 ESDP, 2001

Local Level Service Delivery, Decentralisation and Governance TANZANIA CASE REPORT
34
3-2 Division of Responsibilities for Local Service Delivery
3-2-1 National Education System
The delivery of education involves a multitude of institutions including the CG, LGAs, the private
sector and non-governmental organisations (NGOs). The 4 principal ministries are: Ministry of
Education (MoE); Ministry of Labour, Youth Development and Sports; PMO-RALG; and Ministry of
Science and Technology and Higher Education. Two other ministries also play an important role and
they are: Ministry of Community Development, Gender and Children; and MoF.
The key responsibilities of the MoE are: to supervise and manage pre-primary, primary,
secondary, special education, adult education, national vocational training, teacher education, school
inspection and planning and co-ordination of all educational plans. To implement these responsibilities
the ministry is guided by: (a) The Education Act No. 25 of 1978 (b) The Education and Training Policy
1995; (c) Tanzania Vision Development 2025; and (d) NSGRP. In order to review the quality of
education provided in all schools in the country, the Ministry inspects schools and administers national
examinations for Std. IV; VII; Forms 2; 4; 6 and teacher education examinations.
3-2-2 District Education System
The establishment, management and administration of primary schools are the responsibility of
PMO-RALG. Secondary schools and teachers colleges operate under MoE while public universities,
institute of technology and technical colleges operate under the Ministry of Science, Technology and
Higher Education.
Education and training provision in Tanzania has 3 levels: These are basic education consisting of
2 years pre - primary education and 7 years primary education. The pupil goes to a secondary
education level after passing the Primary School Leaving Examination (PSLE). Secondary education
has 2 stages ordinary level - Form I up to Form IV (4 years). Advanced level Form V up to Form VI (2
years) A national examination is administered at the end of each level. Technical and higher education
level consists of 3 < years leading to various occupations.
The provision of primary education is the responsibility of the local government mainly with
funding from the central government and pooled PEDP donor account. Planning, budgeting and
implementation of primary education are mainly the role of SCs in collaboration with sub-district
councils. SCs prepare and submit school plans, budgets and quarterly financial and progress reports to
the council and the RS. Each school has opened 2 bank accounts with the Microfinance Bank
(capitation grant account and development grant account). Funds are transferred from the treasury to
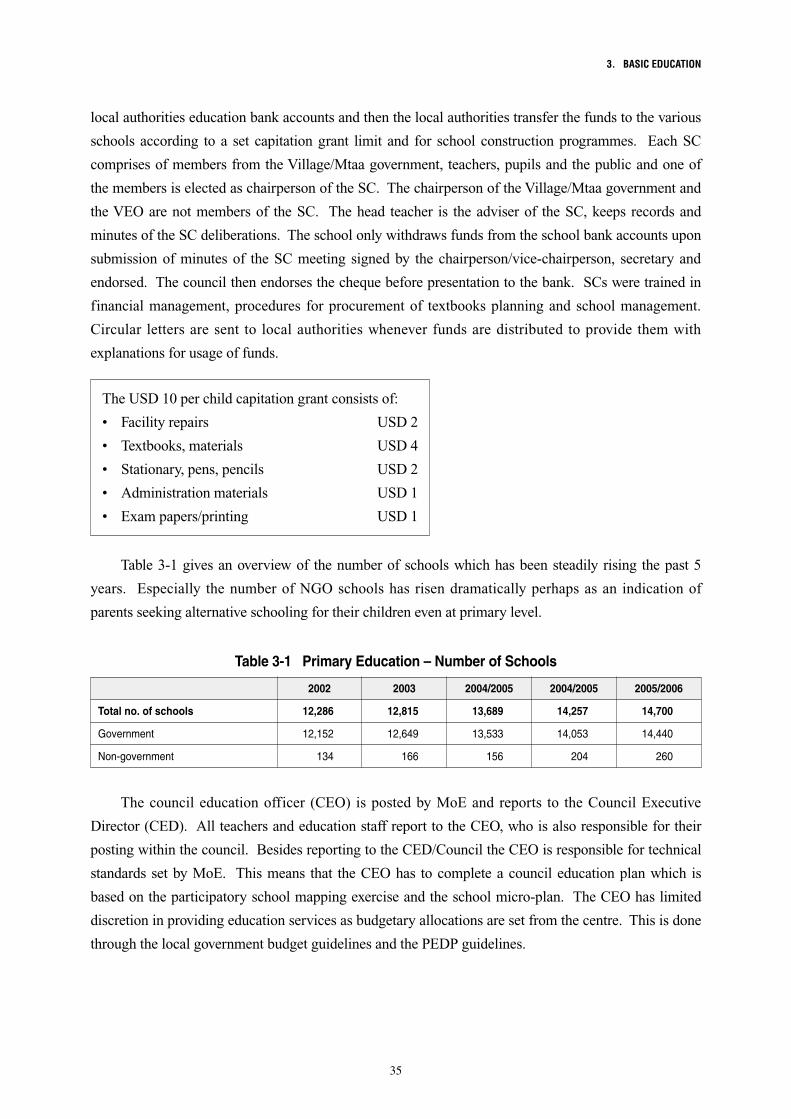
3. BASIC EDUCATION
35
local authorities education bank accounts and then the local authorities transfer the funds to the various
schools according to a set capitation grant limit and for school construction programmes. Each SC
comprises of members from the Village/Mtaa government, teachers, pupils and the public and one of
the members is elected as chairperson of the SC. The chairperson of the Village/Mtaa government and
the VEO are not members of the SC. The head teacher is the adviser of the SC, keeps records and
minutes of the SC deliberations. The school only withdraws funds from the school bank accounts upon
submission of minutes of the SC meeting signed by the chairperson/vice-chairperson, secretary and
endorsed. The council then endorses the cheque before presentation to the bank. SCs were trained in
financial management, procedures for procurement of textbooks planning and school management.
Circular letters are sent to local authorities whenever funds are distributed to provide them with
explanations for usage of funds.
Table 3-1 gives an overview of the number of schools which has been steadily rising the past 5
years. Especially the number of NGO schools has risen dramatically perhaps as an indication of
parents seeking alternative schooling for their children even at primary level.
The USD 10 per child capitation grant consists of:
• Facilityrepairs USD2
• Textbooks,materials USD4
• Stationary,pens,pencils USD2
• Administrationmaterials USD1
• Exampapers/printing USD1
Table 3-1 Primary Education – Number of Schools
Total no. of schools
Government
Non-government
12,286 12,815 13,689 14,257 14,700
12,152 12,649 13,533 14,053 14,440
134 166 156 204 260
2002 2003 2004/2005 2004/2005 2005/2006
The council education officer (CEO) is posted by MoE and reports to the Council Executive
Director (CED). All teachers and education staff report to the CEO, who is also responsible for their
posting within the council. Besides reporting to the CED/Council the CEO is responsible for technical
standards set by MoE. This means that the CEO has to complete a council education plan which is
based on the participatory school mapping exercise and the school micro-plan. The CEO has limited
discretion in providing education services as budgetary allocations are set from the centre. This is done
through the local government budget guidelines and the PEDP guidelines.

Local Level Service Delivery, Decentralisation and Governance TANZANIA CASE REPORT
36
3-2-3 Summary Responsibilities for Education Service Delivery
SC- complete school planRole in O&OD
No role
Active roleProvides inputs and supervise
Role in the priorities and operations
Can purchase under local procurement
Role in the day to day operations
Some representation for NGOs/CBOs
Submit school plans
Limited role
Recommendation
Strong coordinative role Set the targets and policy objectives
Sets the targets
Guidance
Overall guidance
Guidance
Sets the targets and provide the funding,monitor and supervise
Strong roleHas overall responsibility for inspection.
CG through the sector working groups
Major source : CG grants (main source)
MoE approves work plans of the grants and control through grant guidelines.
Sets the overall guidelines and controls via the size of the salary grantRecruits and places teachers
Active role
MoE/InspectorateTSC
Strong role
Strong role
Role in supervision and major priorities
Some role through coordination, and monitoring
Role in support of inspection
Are represented in the discussions
Contribute (limited from own source revenues
Elaborate detailed work-plans and budgets transfers of funds
Role in assigning teachers within the council
Limited. Advisory to the TSC
TSC active roleDEO only recommendation
No role
Moderate role Provides planning inputs
Limited role
Limited role
Weak role
Co-finance (small amount) part of the school construction through PEDP/CDG
Involved in the planning of part of the funds for school construction under PEDP/CDG
No
No role
Table 3-2 Division of Responsibilities in Education Sector
Tasks
Tasks
Overall planning
Management of teachers
School administration -DEO’s office
School construction
School materials, equipment and management
School books
Inspection
Overall policy planning and funding of the sector
General funding of primary education
Overall planning of primary education in the district
Management of teachers (number and location)
Hiring and firing
Disciplining
Central government
Central government
Councils
Councils
Wards / villages
Wards / villages
Committees / citizens
Committees / citizens
CBO: Community Based Organisation
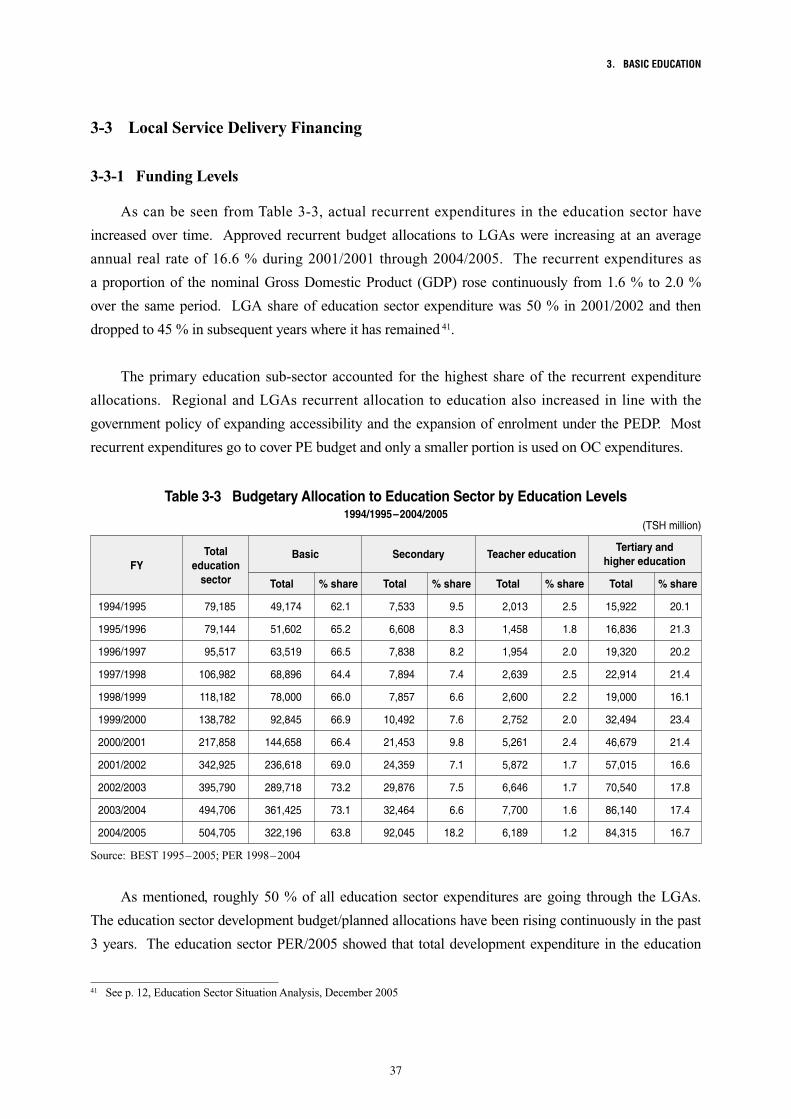
3. BASIC EDUCATION
37
1994/1995
1995/1996
1996/1997
1997/1998
1998/1999
1999/2000
2000/2001
2001/2002
2002/2003
2003/2004
2004/2005
3-3 Local Service Delivery Financing
3-3-1 Funding Levels
As can be seen from Table 3-3, actual recurrent expenditures in the education sector have
increased over time. Approved recurrent budget allocations to LGAs were increasing at an average
annual real rate of 16.6 % during 2001/2001 through 2004/2005. The recurrent expenditures as
a proportion of the nominal Gross Domestic Product (GDP) rose continuously from 1.6 % to 2.0 %
over the same period. LGA share of education sector expenditure was 50 % in 2001/2002 and then
dropped to 45 % in subsequent years where it has remained 41.
The primary education sub-sector accounted for the highest share of the recurrent expenditure
allocations. Regional and LGAs recurrent allocation to education also increased in line with the
government policy of expanding accessibility and the expansion of enrolment under the PEDP. Most
recurrent expenditures go to cover PE budget and only a smaller portion is used on OC expenditures.
Table 3-3 Budgetary Allocation to Education Sector by Education Levels 1994/1995–2004/2005
(TSH million)
79,185
79,144
95,517
106,982
118,182
138,782
217,858
342,925
395,790
494,706
504,705
49,174
51,602
63,519
68,896
78,000
92,845
144,658
236,618
289,718
361,425
322,196
62.1
65.2
66.5
64.4
66.0
66.9
66.4
69.0
73.2
73.1
63.8
FYTotal
education sector
Basic
% shareTotal
Source: BEST 1995–2005; PER 1998–2004
7,533
6,608
7,838
7,894
7,857
10,492
21,453
24,359
29,876
32,464
92,045
9.5
8.3
8.2
7.4
6.6
7.6
9.8
7.1
7.5
6.6
18.2
Secondary
% shareTotal
2,013
1,458
1,954
2,639
2,600
2,752
5,261
5,872
6,646
7,700
6,189
2.5
1.8
2.0
2.5
2.2
2.0
2.4
1.7
1.7
1.6
1.2
Teacher education
% shareTotal
15,922
16,836
19,320
22,914
19,000
32,494
46,679
57,015
70,540
86,140
84,315
20.1
21.3
20.2
21.4
16.1
23.4
21.4
16.6
17.8
17.4
16.7
Tertiary and higher education
% shareTotal
As mentioned, roughly 50 % of all education sector expenditures are going through the LGAs.
The education sector development budget/planned allocations have been rising continuously in the past
3 years. The education sector PER/2005 showed that total development expenditure in the education
41 See p. 12, Education Sector Situation Analysis, December 2005
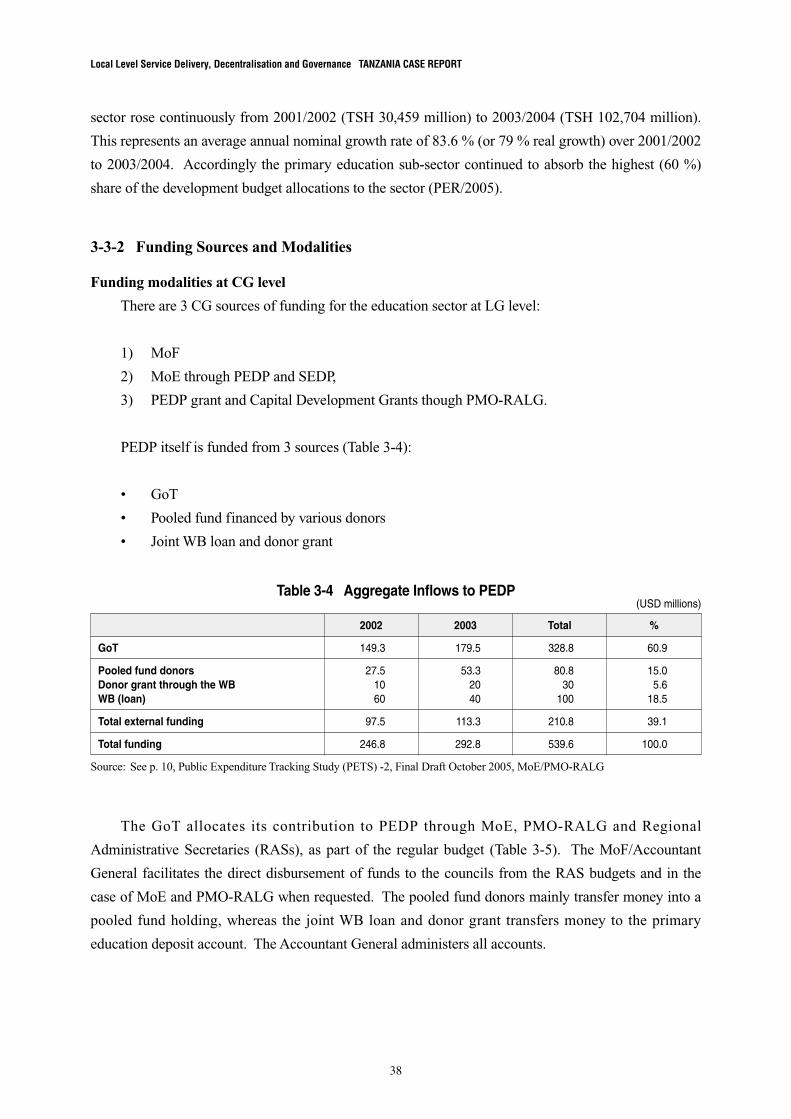
Local Level Service Delivery, Decentralisation and Governance TANZANIA CASE REPORT
38
sector rose continuously from 2001/2002 (TSH 30,459 million) to 2003/2004 (TSH 102,704 million).
This represents an average annual nominal growth rate of 83.6 % (or 79 % real growth) over 2001/2002
to 2003/2004. Accordingly the primary education sub-sector continued to absorb the highest (60 %)
share of the development budget allocations to the sector (PER/2005).
3-3-2 Funding Sources and Modalities
Funding modalities at CG level
There are 3 CG sources of funding for the education sector at LG level:
1) MoF
2) MoE through PEDP and SEDP,
3) PEDP grant and Capital Development Grants though PMO-RALG.
PEDP itself is funded from 3 sources (Table 3-4):
• GoT
• Pooledfundfinancedbyvariousdonors
• JointWBloananddonorgrant
Table 3-4 Aggregate Inflows to PEDP(USD millions)
GoT
Pooled fund donorsDonor grant through the WBWB (loan)
Total external funding
Total funding
149.3
27.51060
97.5
246.8
179.5
53.32040
113.3
292.8
328.8
80.830
100
210.8
539.6
60.9
15.05.6
18.5
39.1
100.0
2002 2003 Total %
Source: See p. 10, Public Expenditure Tracking Study (PETS) -2, Final Draft October 2005, MoE/PMO-RALG
The GoT allocates its contribution to PEDP through MoE, PMO-RALG and Regional
Administrative Secretaries (RASs), as part of the regular budget (Table 3-5). The MoF/Accountant
General facilitates the direct disbursement of funds to the councils from the RAS budgets and in the
case of MoE and PMO-RALG when requested. The pooled fund donors mainly transfer money into a
pooled fund holding, whereas the joint WB loan and donor grant transfers money to the primary
education deposit account. The Accountant General administers all accounts.
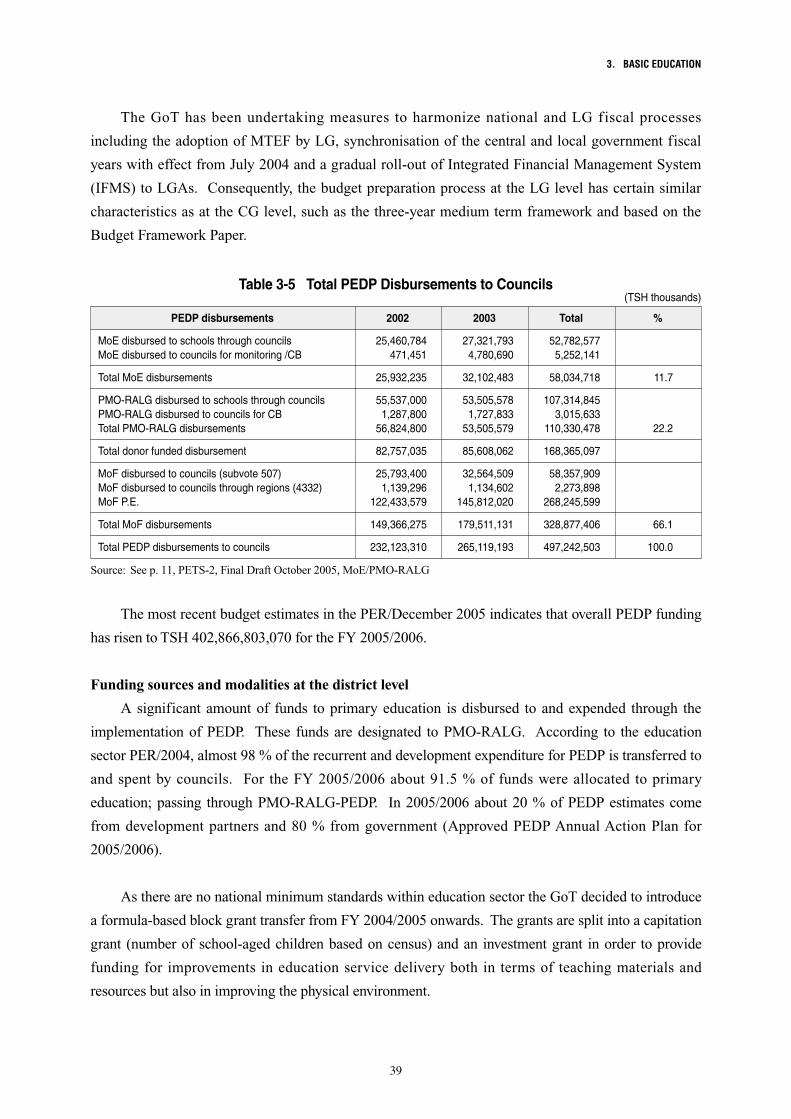
3. BASIC EDUCATION
39
The GoT has been undertaking measures to harmonize national and LG fiscal processes
including the adoption of MTEF by LG, synchronisation of the central and local government fiscal
years with effect from July 2004 and a gradual roll-out of Integrated Financial Management System
(IFMS) to LGAs. Consequently, the budget preparation process at the LG level has certain similar
characteristics as at the CG level, such as the three-year medium term framework and based on the
Budget Framework Paper.
Table 3-5 Total PEDP Disbursements to Councils(TSH thousands)
PEDP disbursements
MoE disbursed to schools through councilsMoE disbursed to councils for monitoring /CB
Total MoE disbursements
PMO-RALG disbursed to schools through councilsPMO-RALG disbursed to councils for CBTotal PMO-RALG disbursements
Total donor funded disbursement
MoF disbursed to councils (subvote 507)MoF disbursed to councils through regions (4332)MoF P.E.
Total MoF disbursements
Total PEDP disbursements to councils
25,460,784471,451
25,932,235
55,537,0001,287,800
56,824,800
82,757,035
25,793,4001,139,296
122,433,579
149,366,275
232,123,310
27,321,7934,780,690
32,102,483
53,505,5781,727,833
53,505,579
85,608,062
32,564,5091,134,602
145,812,020
179,511,131
265,119,193
52,782,5775,252,141
58,034,718
107,314,8453,015,633
110,330,478
168,365,097
58,357,9092,273,898
268,245,599
328,877,406
497,242,503
11.7
22.2
66.1
100.0
2002 2003 Total %
Source: See p. 11, PETS-2, Final Draft October 2005, MoE/PMO-RALG
The most recent budget estimates in the PER/December 2005 indicates that overall PEDP funding
has risen to TSH 402,866,803,070 for the FY 2005/2006.
Funding sources and modalities at the district level
A significant amount of funds to primary education is disbursed to and expended through the
implementation of PEDP. These funds are designated to PMO-RALG. According to the education
sector PER/2004, almost 98 % of the recurrent and development expenditure for PEDP is transferred to
and spent by councils. For the FY 2005/2006 about 91.5 % of funds were allocated to primary
education; passing through PMO-RALG-PEDP. In 2005/2006 about 20 % of PEDP estimates come
from development partners and 80 % from government (Approved PEDP Annual Action Plan for
2005/2006).
As there are no national minimum standards within education sector the GoT decided to introduce
a formula-based block grant transfer from FY 2004/2005 onwards. The grants are split into a capitation
grant (number of school-aged children based on census) and an investment grant in order to provide
funding for improvements in education service delivery both in terms of teaching materials and
resources but also in improving the physical environment.
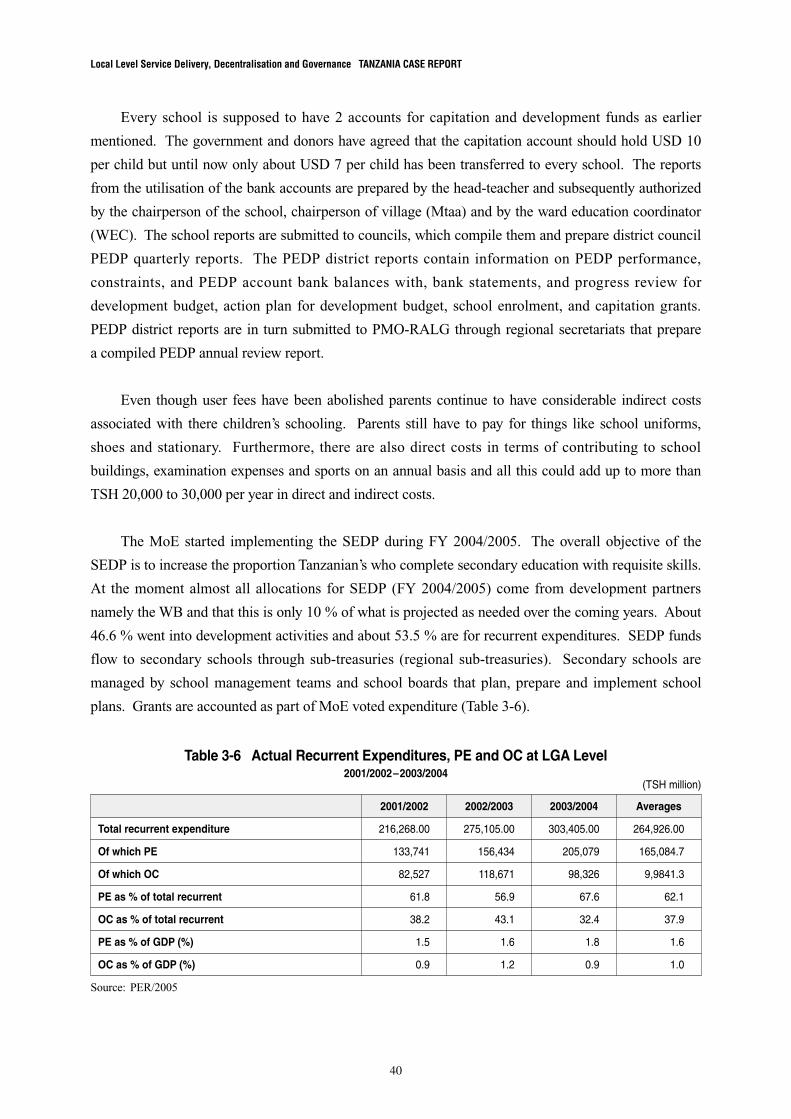
Local Level Service Delivery, Decentralisation and Governance TANZANIA CASE REPORT
40
Every school is supposed to have 2 accounts for capitation and development funds as earlier
mentioned. The government and donors have agreed that the capitation account should hold USD 10
per child but until now only about USD 7 per child has been transferred to every school. The reports
from the utilisation of the bank accounts are prepared by the head-teacher and subsequently authorized
by the chairperson of the school, chairperson of village (Mtaa) and by the ward education coordinator
(WEC). The school reports are submitted to councils, which compile them and prepare district council
PEDP quarterly reports. The PEDP district reports contain information on PEDP performance,
constraints, and PEDP account bank balances with, bank statements, and progress review for
development budget, action plan for development budget, school enrolment, and capitation grants.
PEDP district reports are in turn submitted to PMO-RALG through regional secretariats that prepare
a compiled PEDP annual review report.
Even though user fees have been abolished parents continue to have considerable indirect costs
associated with there children’s schooling. Parents still have to pay for things like school uniforms,
shoes and stationary. Furthermore, there are also direct costs in terms of contributing to school
buildings, examination expenses and sports on an annual basis and all this could add up to more than
TSH 20,000 to 30,000 per year in direct and indirect costs.
The MoE started implementing the SEDP during FY 2004/2005. The overall objective of the
SEDP is to increase the proportion Tanzanian’s who complete secondary education with requisite skills.
At the moment almost all allocations for SEDP (FY 2004/2005) come from development partners
namely the WB and that this is only 10 % of what is projected as needed over the coming years. About
46.6 % went into development activities and about 53.5 % are for recurrent expenditures. SEDP funds
flow to secondary schools through sub-treasuries (regional sub-treasuries). Secondary schools are
managed by school management teams and school boards that plan, prepare and implement school
plans. Grants are accounted as part of MoE voted expenditure (Table 3-6).
Table 3-6 Actual Recurrent Expenditures, PE and OC at LGA Level2001/2002–2003/2004
(TSH million)
Total recurrent expenditure
Of which PE
Of which OC
PE as % of total recurrent
OC as % of total recurrent
PE as % of GDP (%)
OC as % of GDP (%)
216,268.00
133,741
82,527
61.8
38.2
1.5
0.9
275,105.00
156,434
118,671
56.9
43.1
1.6
1.2
303,405.00
205,079
98,326
67.6
32.4
1.8
0.9
264,926.00
165,084.7
9,9841.3
62.1
37.9
1.6
1.0
2001/2002 2002/2003 2003/2004 Averages
Source: PER/2005
3. BASIC EDUCATION
41
3-4 Local Service Delivery Procedures
Under the PEDP both funding and authority to spend funds on purchasing school materials and
initiative classroom construction has been decentralised to the schools/SCs. For the purpose of
monitoring, schools prepare monthly and quarterly reports, which are submitted, to the council and to
the RS for consolidation and submission to PMO-RALG. A typical school report contains the
following:
• Afinancialreport,
• Physicalreportonwhatandwherefundshasbeenspent,
• BankbalancethatiscertifiedbytheBank.
Other monitoring and evaluation measures include: (i) physical visits for randomly sampled
schools by PEDP and MoE officials, (ii) visits by regional education officers to districts (facilitated
by PEDP), (iii) visits by CEO accompanied by other officials like district engineers to schools,
(iv) council task force chaired by a DC and (v) district internal auditors. PEDP has issued a directive
that every school should have a register for specific expenditures showing for instance capitation for
administration, textbooks etc.
Accounting records are managed by head teachers for primary schools and heads of schools for
secondary schools and these are held accountable for the use of funds. The Schools Inspectorate
Department inspects schools for accountability purposes. Under PEDP stakeholder sensitization and
participation has especially been targeted at the community level/SCs and is seen as key in enhancing
good governance in the management of secondary schools.
The budget guidelines that trigger the beginning of the preparation of the budget are issued in
December/January. With budget guidelines issued in January it implies that LGAs have only about
three months to prepare their budgets. This is a short period to have effective consultations and review
of the previous years’ budget and for strategic interaction within the council and especially with the
concerned communities. Furthermore, the budget guidelines will need to be changed in future if they
are to respond to the MKUKUTA outcome orientation especially with regard to sector objectives,
targets, outputs and outcomes. This means that education sector priorities are vying for funding in
competition with other social sector priorities and therefore in a continued state of contestability.
Figure 3-1 gives an illustration of the budget process relationship between central and LG.
The biggest challenge is to deepen reforms by addressing weakness in the budget process including
proper sequencing of activities in the budget cycle and enhancement of dialogue around the budget.
This is the most important instrument in the service delivery cycle and the one which has the least local
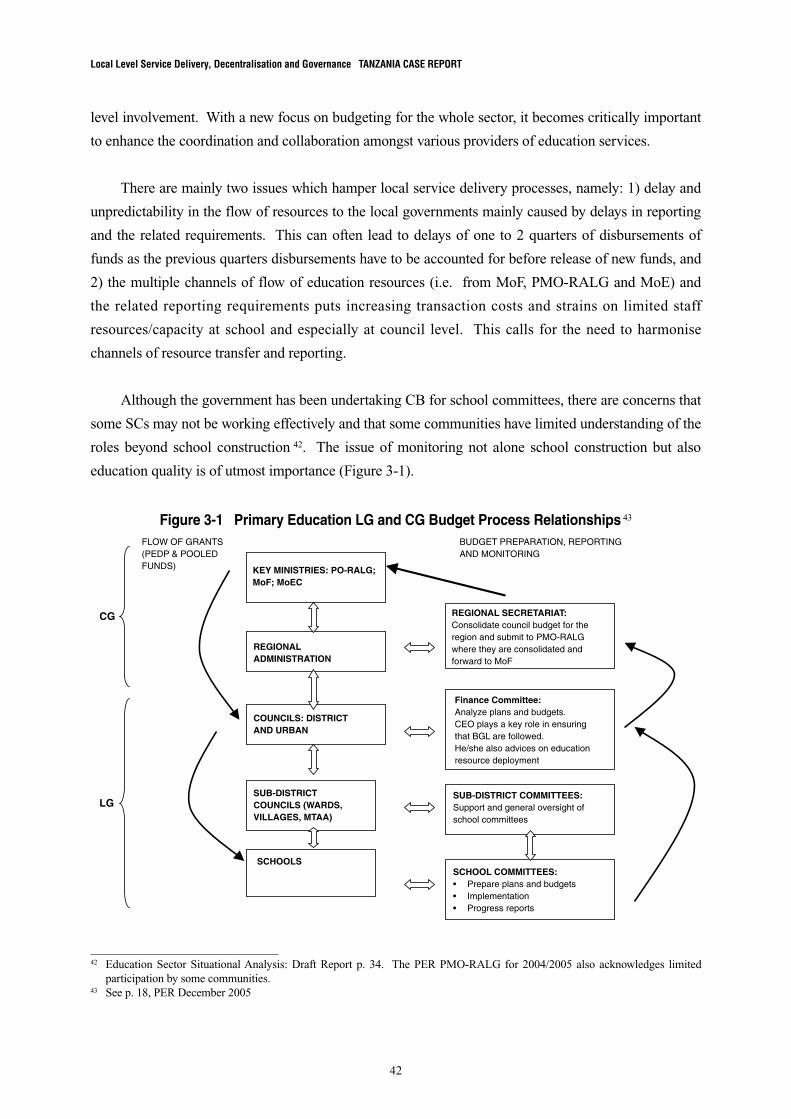
Local Level Service Delivery, Decentralisation and Governance TANZANIA CASE REPORT
42
level involvement. With a new focus on budgeting for the whole sector, it becomes critically important
to enhance the coordination and collaboration amongst various providers of education services.
There are mainly two issues which hamper local service delivery processes, namely: 1) delay and
unpredictability in the flow of resources to the local governments mainly caused by delays in reporting
and the related requirements. This can often lead to delays of one to 2 quarters of disbursements of
funds as the previous quarters disbursements have to be accounted for before release of new funds, and
2) the multiple channels of flow of education resources (i.e. from MoF, PMO-RALG and MoE) and
the related reporting requirements puts increasing transaction costs and strains on limited staff
resources/capacity at school and especially at council level. This calls for the need to harmonise
channels of resource transfer and reporting.
Although the government has been undertaking CB for school committees, there are concerns that
some SCs may not be working effectively and that some communities have limited understanding of the
roles beyond school construction 42. The issue of monitoring not alone school construction but also
education quality is of utmost importance (Figure 3-1).
Figure 3-1 Primary Education LG and CG Budget Process Relationships 43
CG
FLOW OF GRANTS(PEDP & POOLEDFUNDS)
BUDGET PREPARATION, REPORTINGAND MONITORING
KEY MINISTRIES: PO-RALG;MoF; MoEC
REGIONALADMINISTRATION
COUNCILS: DISTRICTAND URBAN
SUB-DISTRICTCOUNCILS (WARDS,VILLAGES, MTAA)
SCHOOLS
REGIONAL SECRETARIAT:Consolidate council budget for theregion and submit to PMO-RALGwhere they are consolidated andforward to MoF
Finance Committee:Analyze plans and budgets. CEO plays a key role in ensuring that BGL are followed. He/she also advices on education resource deployment
SUB-DISTRICT COMMITTEES:Support and general oversight ofschool committees
SCHOOL COMMITTEES:
LG
42 Education Sector Situational Analysis: Draft Report p. 34. The PER PMO-RALG for 2004/2005 also acknowledges limited participation by some communities.
43 See p. 18, PER December 2005
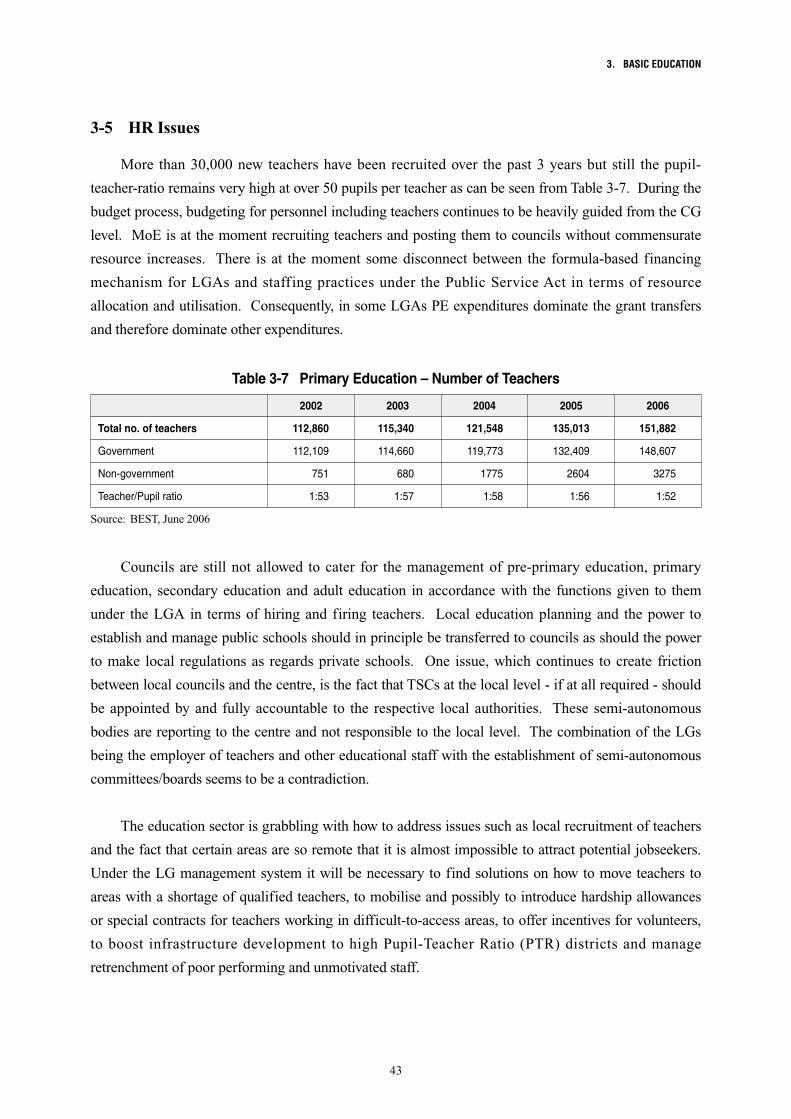
3. BASIC EDUCATION
43
3-5 HR Issues
More than 30,000 new teachers have been recruited over the past 3 years but still the pupil-
teacher-ratio remains very high at over 50 pupils per teacher as can be seen from Table 3-7. During the
budget process, budgeting for personnel including teachers continues to be heavily guided from the CG
level. MoE is at the moment recruiting teachers and posting them to councils without commensurate
resource increases. There is at the moment some disconnect between the formula-based financing
mechanism for LGAs and staffing practices under the Public Service Act in terms of resource
allocation and utilisation. Consequently, in some LGAs PE expenditures dominate the grant transfers
and therefore dominate other expenditures.
Source: BEST, June 2006
Table 3-7 Primary Education – Number of Teachers
Total no. of teachers
Government
Non-government
Teacher/Pupil ratio
112,860 115,340 121,548 135,013 151,882
112,109 114,660 119,773 132,409 148,607
751 680 1775 2604 3275
1:53 1:57 1:58 1:56 1:52
2002 2003 2004 2005 2006
Councils are still not allowed to cater for the management of pre-primary education, primary
education, secondary education and adult education in accordance with the functions given to them
under the LGA in terms of hiring and firing teachers. Local education planning and the power to
establish and manage public schools should in principle be transferred to councils as should the power
to make local regulations as regards private schools. One issue, which continues to create friction
between local councils and the centre, is the fact that TSCs at the local level - if at all required - should
be appointed by and fully accountable to the respective local authorities. These semi-autonomous
bodies are reporting to the centre and not responsible to the local level. The combination of the LGs
being the employer of teachers and other educational staff with the establishment of semi-autonomous
committees/boards seems to be a contradiction.
The education sector is grabbling with how to address issues such as local recruitment of teachers
and the fact that certain areas are so remote that it is almost impossible to attract potential jobseekers.
Under the LG management system it will be necessary to find solutions on how to move teachers to
areas with a shortage of qualified teachers, to mobilise and possibly to introduce hardship allowances
or special contracts for teachers working in difficult-to-access areas, to offer incentives for volunteers,
to boost infrastructure development to high Pupil-Teacher Ratio (PTR) districts and manage
retrenchment of poor performing and unmotivated staff.
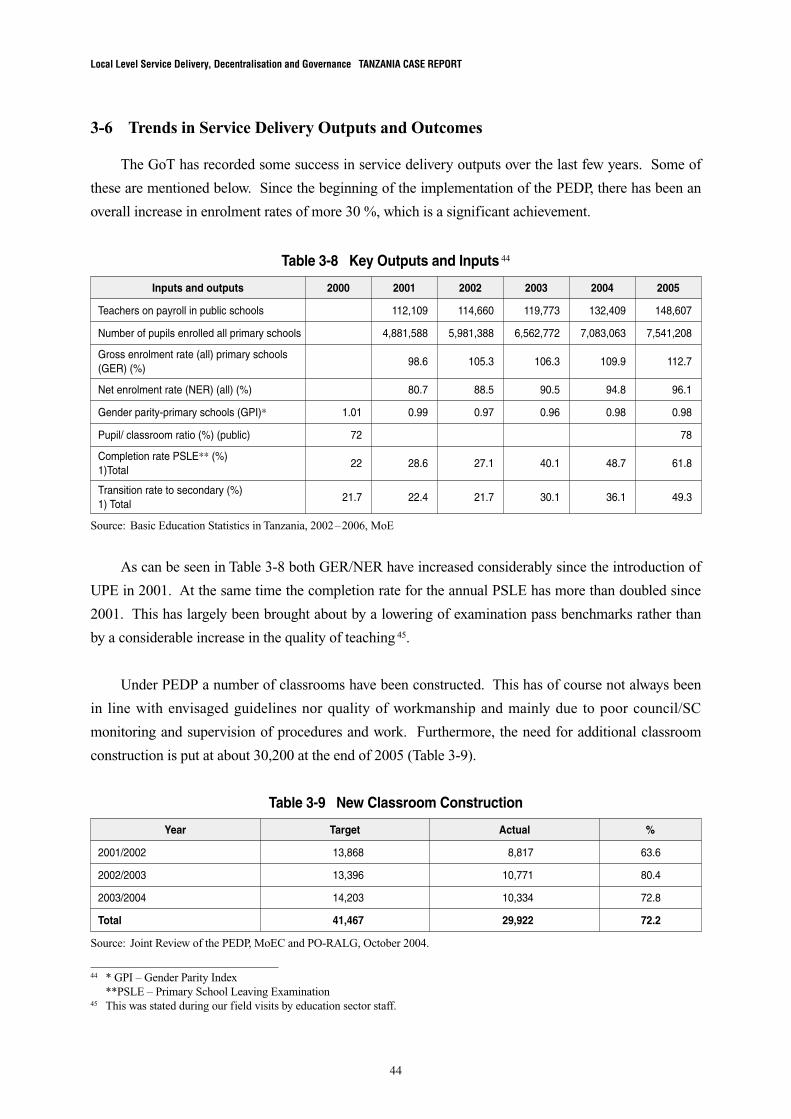
Local Level Service Delivery, Decentralisation and Governance TANZANIA CASE REPORT
44
3-6 Trends in Service Delivery Outputs and Outcomes
The GoT has recorded some success in service delivery outputs over the last few years. Some of
these are mentioned below. Since the beginning of the implementation of the PEDP, there has been an
overall increase in enrolment rates of more 30 %, which is a significant achievement.
As can be seen in Table 3-8 both GER/NER have increased considerably since the introduction of
UPE in 2001. At the same time the completion rate for the annual PSLE has more than doubled since
2001. This has largely been brought about by a lowering of examination pass benchmarks rather than
by a considerable increase in the quality of teaching 45.
Under PEDP a number of classrooms have been constructed. This has of course not always been
in line with envisaged guidelines nor quality of workmanship and mainly due to poor council/SC
monitoring and supervision of procedures and work. Furthermore, the need for additional classroom
construction is put at about 30,200 at the end of 2005 (Table 3-9).
Source: Joint Review of the PEDP, MoEC and PO-RALG, October 2004.
Table 3-9 New Classroom Construction
2001/2002
2002/2003
2003/2004
Total
13,868 8,817 63.6
13,396 10,771 80.4
14,203 10,334 72.8
41,467 29,922 72.2
Year Target Actual %
Table 3-8 Key Outputs and Inputs 44
Inputs and outputs
Teachers on payroll in public schools
Number of pupils enrolled all primary schools
Gross enrolment rate (all) primary schools (GER) (%)
Net enrolment rate (NER) (all) (%)
Gender parity-primary schools (GPI)*
Pupil/ classroom ratio (%) (public)
Completion rate PSLE** (%) 1)Total
Transition rate to secondary (%) 1) Total
112,109 114,660 119,773 132,409 148,607
2000 2001 2002 2003 2004 2005
Source: Basic Education Statistics in Tanzania, 2002–2006, MoE
4,881,588 5,981,388 6,562,772 7,083,063 7,541,208
98.6 105.3 106.3 109.9 112.7
80.7 88.5 90.5 94.8 96.1
1.01 0.99 0.97 0.96 0.98 0.98
72 78
22 28.6 27.1 40.1 48.7 61.8
21.7 22.4 21.7 30.1 36.1 49.3
44 * GPI – Gender Parity Index **PSLE – Primary School Leaving Examination 45 This was stated during our field visits by education sector staff.

3. BASIC EDUCATION
45
3-7 Impact of Governance Aspects on Service Delivery
3-7-1 Transparency and Equity
Equity has been a guiding principle in Tanzania since independence. It says in the NETP/1995 that:
• Governmentshallguaranteeaccesstopre-primaryandprimaryeducationandadultliteracy
to all citizens as a basic right
• Governmentshallpromoteandensureequitabledistributionofeducationalinstitutions
This has been reinforced through the current version of the poverty reduction strategy where goal
number 3 is ‘ensuring equitable access to quality primary and secondary education for boys and girls,
universal literacy among women and men and expansion of higher, technical and vocational education’.
In terms of inputs all indicators show a positive trend in Tanzania as enrolment rates are up,
recruitment of teachers has been increased and more recurrent and capital funding are reaching the
school levels. However, there are still considerable funds needed for construction of classrooms and for
recruitment of teachers in the coming years. As Table 3-8 illustrates above the teacher/pupil rate
remains very high even after a recruitment drive and upward trend of recruitment of new teachers
during the past 5 years. However, some improvements have been noted in terms of availability of text
books and materials overall throughout the country the past few years as the Capitation Grant gives
more local responsibility for purchasing textbooks.
In terms of transparency some initiatives are being implemented to strengthen the monitoring
and evaluation functions. In addition, all government MDAs and LGAs move to enhance
transparency by drafting anti-corruption strategies and action plans that were completed for all
LGAs and submitted for final government approval in June 2005. Transparency towards the local
communities is still weak even though measures such as posting notices on notice boards in villages,
schools and wards have been taken.
There seems to be a discrepancy between the need for equitable distribution of teachers
throughout the country and one of the main points of decentralisation, namely the issue of recruitment
and overall management of teachers at district levels. It was stated during our field visits that
recruitment of teachers could be done by the local authorities but they are not given the proper tools in
the legislation, or support from CG, to enable them to carry out this. CG plays the card of equity to
ensure that recruitment and control over teachers remains at central level.

Local Level Service Delivery, Decentralisation and Governance TANZANIA CASE REPORT
46
3-7-2 Participation
Through the adoption of the Micro-Planning Guideline in 2002, schools and SCs where more
involved with planning and executing activities at school level. SCs in collaboration with sub-district
councils play a key role in mobilization of resources. Accountability and reporting of these resources is
poor. For instance, resources mobilized at the school level are not covered in school reports, for
example, NGO contributions towards construction of schools. However, overall the reports focus more
on financial resource inputs rather than outputs. The outcome orientation advocated through
MKUKUTA requires that a bias towards outputs be adopted. This is not limited to the local
government but also central government. The value of such reports for decision making in addressing
identified weaknesses may need to be enhanced. PETS, which is an important instrument for
monitoring and tracking expenditure flows, has been used in Tanzania (Research on Poverty Alleviation
(REPOA) 2003) but under criticism from the government side.
Participation has become the cornerstone in all aspects of local development in Tanzania and the
O&OD principle has been instituted as the participatory planning guide at local level. However, none
of the visited districts had completed an O&OD exercise yet and their still seems to be quite some
confusion in terms of conflicting planning guidelines traditionally used by the sector and how it will
relate to the O&OD when conducted.
It was pointed out several times during the field visits that the local communities are confused in
terms of contributing to several competing (TASAF II, LGCDG, Joint Rehabilitation Fund (JRF),
PEDP etc.) and different development funding programmes at local level that all target potential school
construction, health facilities, agriculture projects etc. And these fundings have various degrees of
community contribution attached (from 15 % in kind contributions to 5 % in cash). While parents are
contributing less in direct payment to schools, they argue that they contribute more as direct
contributions to development projects. So as participation has increased over the past few years and the
communities feel a larger degree of ownership of the local school and the elements of planning, it is
obvious that most people feel that decentralisation has brought more involvement and participation into
the educational system at village level. All the village assemblies we talked to during our filed visits
emphasised this point.
3-7-3 Accountability
A review of the Controller & Auditor General (CAG) reports on LGA accounts reveal improvements
in financial management as evidenced in the trends in the number of clean certificates issued, adverse
audit reports and disclaimer reports. (PMO-RALG PER for FY 2004/2005).
3. BASIC EDUCATION
47
The recent education sector review showed, that audit reports from 2003 (most recent available)
taken for one district in 5 regions, that the main problem was the statements of expenditure, which
should consolidate reports on actual utilisation of PEDP funds by schools together with council
records. Disbursements to school bank accounts from the district treasury have already been recorded
as actual expenditures immediately upon transfer. This is because the schools did not compile or
submit quarterly reports. Expenditure at school level was unknown which is a worrying sign.
In addition to the identification of any specific ‘irregularities’, there were a number of other
general financial management issues that arose in several or all of the districts.
• Classroomconstruction: certificatesnot issuedbydistrict engineer toprovideevidenceof
inspections, standard building plan not always followed.
• Nocross-referencebetweencashbooksandinvoicesorreceiptsinprimaryschools.
• Lackofinternalaudit.
• Noevidenceofapprovaloffundrequests.
• Incompleteormissingtextbookandfixedassetregisters.
• Cashpaymentswithoutproperreceipts.
These deficiencies occur despite regular and repeated training. The introduction of a centralized
payment system has improved expenditure control, as commitments cannot exceed budgeted funds; and
there is now more formal record keeping (interview with PMO-RALG). Currently only around 50 %
of LGAs have computerized accounts; full roll-out of IFMS would help improve monitoring and
reporting. For 2004–2005, about half of schools submited a financial report, although this varied
between none in seven regions and over 90 % in four regions (data from PMO-RALG), although no
attempt appears to have been made to check them and they had not been verified. It seems that the
problem goes beyond training and happens because of general lack of management at local levels.
3-7-4 Service Delivery Efficiency
The major areas of concern across the whole education system are: the efficiency of resource use,
the relationship between inputs and outputs, and the effectiveness of graduates and the relevance of the
education provided. Table 3-8 shows that the primary school enrolment rate has increased significantly
over the past 6 years. The abolition of school fees has clearly been important but there is also the
question of compulsion; some of those parents who have not enrolled their children in school have been
fined. The primary PTR in Tanzania in 2001 was around 46:1 and has risen to 52:1 in 2005. But there
are wide disparities in human-resource allocation, urban-rural differentiation and distribution across
provinces and schools. At secondary school level the PTRs varied in 2000 from a high of 57 in
Shinyanga to the lowest value of 26 in Lindi, and in 2005 from 74 in Shinyanga to 40 in Ruvuma and
Local Level Service Delivery, Decentralisation and Governance TANZANIA CASE REPORT
48
Tanga. These differences need to be addressed so as to avoid further disadvantaging of the less
favoured schools and provinces whilst shifting average PTRs to more efficient levels. This has a direct
relation to the discussion regarding improvement in teacher’s salaries and benefits and hardship
allowance to enable a better and more equitable distribution of teacher resources over regions.
3-8 Key Lessons and Challenges
With the introduction of PEDP there is increased focus on reversing the negative trend within the
education sector in terms of poor quality of teaching staff, lack of textbooks, lack of sufficient
classrooms and attaining primary education for all. As demonstrated above these issues are now being
addressed in terms of capitation grants to all schools, increased roll of SCs in management of funds and
issues at school level, and the ambitious classroom construction programme.
Significant construction of new schools, classrooms, teacher houses, pit latrines, water tanks and
desks is observed in many primary schools. PEDP review reports indicate that the number of
government schools increased by almost 2,000 from 2000 to 2004. During 2003/2004 constructions of
classrooms reached 72.7 % of the planned target. But this is still not sufficient to cater for the growing
demands in view of the expanding school enrolment. 46
The PEDP process has demonstrated that increased community involvement in enhancing the
quality of education has been real and tangible. PEDP is backed by huge financial resources from
the government as well as development partners and enhanced by local participation in terms of
labour, management and supervision and indirect school contributions. Consequently with more
financial, material and human resources, new schools and classrooms have been constructed across
all communities in Tanzania. The observed impact on improved GER/NER, availability of textbooks,
enhanced school facilities is largely attributable to the adoption of the direct support to schools
through the capitation and development grants mechanism with increased amounts of funds directly
reaching the school level through LGs. These direct transfers, coupled with improvement in school
management, particularly of financial resources, has led to increased levels of effective use of the
available resources and therein impacts on school performance.
However, it is noted that this process has been with major problems such as misuse and non-
accounting of expenditure at school level but this has to a large degree been explained by the confusion
that dominated the early phases of PEDP, where many SCs/head teachers still did not know how to
account for the increased inflow of funds. A key lesson from the process is that direct transfers to
schools which involve community voluntary contributions such as labour makes grassroots institutions
46 See Review of experiences with direct support to schools in Tanzania, January 2006 (CORDESIA)

3. BASIC EDUCATION
49
more responsible to their schools and thus develop a sense of ownership which did not necessarily
exist before.
The education sector has been successful in addressing the issue of UPE and the NER has
increased over the years and is close to 100 %. However, the issue of quality of education is still very
pertinent as the PTR is over 50 and there are more than 70 pupils per classroom even after the PEDP
classroom construction programme. Simply addressing the enrolment issue has not solved the diverse
differences that are found throughout Tanzania in terms of schooling disparities especially between
urban and rural areas and especially remote rural areas where teaching resources are scarce.
There is growing recognition that increasing access to education is a necessary but not sufficient
objective. There are other important objectives that have to be pursued by the Tanzanian education
system. These are: (i) access to quality education for all children. (ii) school and training institutes
able to generate measurable learning improvements.
Human Immunodeficiency Virus/Acquired Immunodeficiency Syndrome (HIV/AIDS) is one of
crucial cross-cutting issues affecting performance of the education sector. Government’s response to
HIV/AIDS in the education sector continues to receive special attention in the financial resource
allocation from the national budgets but the impact of the disease is still felt at local level in terms of
lack of available teachers.

Local Level Service Delivery, Decentralisation and Governance TANZANIA CASE REPORT
50
4. DISTRICT HEALTH SERVICES
4-1 Sector Policy for Local Service Delivery 47
Responding to the deterioration of the health care system in the 1980s, the Tanzanian Government
through the Ministry of Health and Social Welfare (MoHSW) supported by major development
partners initiated a Health Sector Reform (HSR) in the early 1990s. The main aim was to improve the
health of the Tanzanian population in general, and especially women and children, through
improvement of the health care delivery system. The country’s long-term development framework is
laid down in the Vision 2025, published in 1998, while the medium term policy is being guided by the
poverty reduction strategy, which now is known as The NSGRP (Mkukuta/2005).
Within the health sector, the government jointly formulated with the development partners the
Programme of Work (1999 – 2002) and subsequently the Health Sector Strategic Plan (HSSP)
(2003–2008). The HSSP carries forward eight strategic areas: (i) district health services, (ii) secondary
and tertiary hospital services, (iii) the role of the central Ministry of Health (MoH), (iv) Human
Resources Development (HRD), (v) central support systems, (vi) health care financing, (vii) public
private partnerships and (viii) the MoH-donor relationship.
In addition, current activities within the health sector are directed by the MTEF, which
operationalise the strategies articulated in the HSSP and NSGRP/MKUKUTA and aims at reflecting
government and externally funded activities.
A decentralised and participatory approach to planning and service delivery is implemented
within the decentralised administrative and political framework accelerated by the LG Reform since
2000, championed by the PMO-RALG. Comprehensive Council Health Plan (CCHP) creates the basis
for decentralised management and the council basket funding mechanism.
4-2 Division of Responsibilities for Local Service Delivery
In common with other countries in the region, Tanzania has a pluralistic health sector,
encompassing a variety of providers ranging from traditional healers, through voluntary agencies, to an
increasingly significant private for-profit sub-sector. Health policy and implementation are organised
according to the three administrative levels of government. At the centre is MoHSW, based in Dar es
47 The following sections rely on the following documentation: National Health Policy, Ministry of Health, October 2002; Second HSSP July 2003–June 2008, MoH April 2003; Technical Review Report 2006, Final Report April 2006, Independent Report for MoHSW/PMO-RALG; Technical Review of Health Service Delivery at District Level, Final Report March 2003; HSPS III Programme Document, Danish International Development Assistance (DANIDA) July 2004; Country Health Profile, January 2006, DPP/MoH; Review of the State of Health in Tanzania, Independent Review by Swiss Tropical Institute, April 2005. PER, MoH FY 2003, 2004 and 2005.
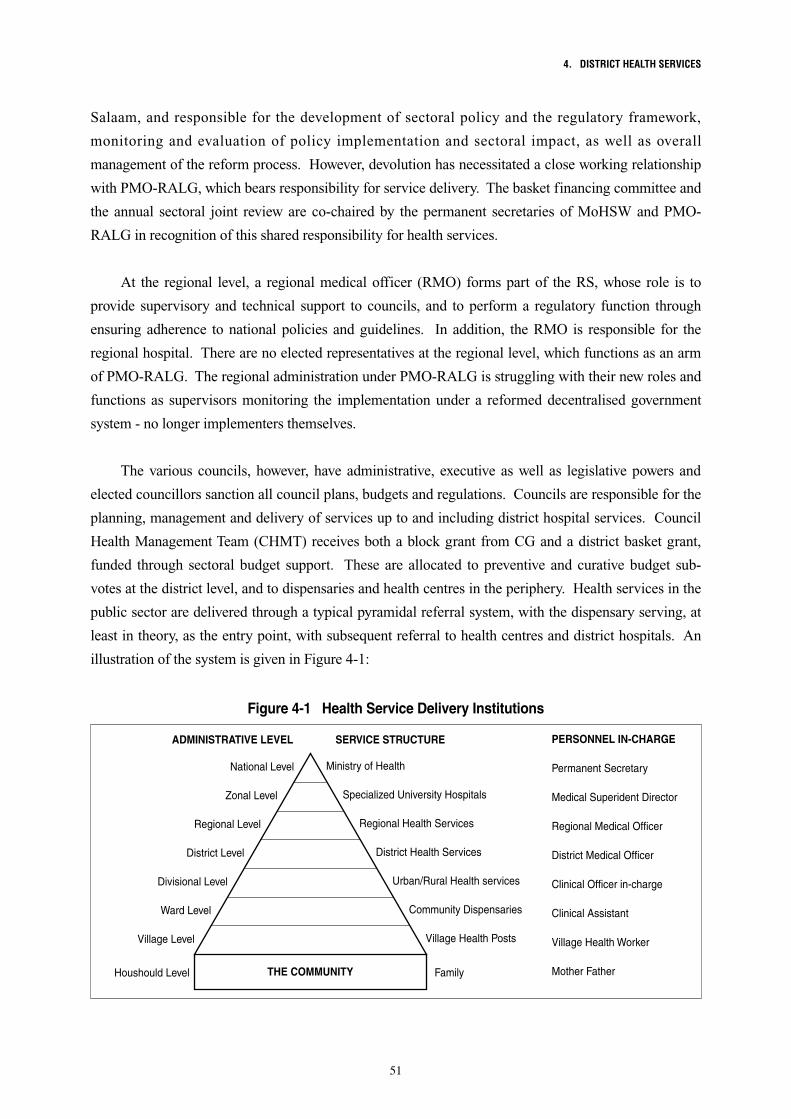
4. DISTRICT HEALTH SERVICES
51
Salaam, and responsible for the development of sectoral policy and the regulatory framework,
monitoring and evaluation of policy implementation and sectoral impact, as well as overall
management of the reform process. However, devolution has necessitated a close working relationship
with PMO-RALG, which bears responsibility for service delivery. The basket financing committee and
the annual sectoral joint review are co-chaired by the permanent secretaries of MoHSW and PMO-
RALG in recognition of this shared responsibility for health services.
At the regional level, a regional medical officer (RMO) forms part of the RS, whose role is to
provide supervisory and technical support to councils, and to perform a regulatory function through
ensuring adherence to national policies and guidelines. In addition, the RMO is responsible for the
regional hospital. There are no elected representatives at the regional level, which functions as an arm
of PMO-RALG. The regional administration under PMO-RALG is struggling with their new roles and
functions as supervisors monitoring the implementation under a reformed decentralised government
system - no longer implementers themselves.
The various councils, however, have administrative, executive as well as legislative powers and
elected councillors sanction all council plans, budgets and regulations. Councils are responsible for the
planning, management and delivery of services up to and including district hospital services. Council
Health Management Team (CHMT) receives both a block grant from CG and a district basket grant,
funded through sectoral budget support. These are allocated to preventive and curative budget sub-
votes at the district level, and to dispensaries and health centres in the periphery. Health services in the
public sector are delivered through a typical pyramidal referral system, with the dispensary serving, at
least in theory, as the entry point, with subsequent referral to health centres and district hospitals. An
illustration of the system is given in Figure 4-1:
PERSONNEL IN-CHARGE
Permanent Secretary
Medical Superident Director
Regional Medical Officer
District Medical Officer
Clinical Officer in-charge
Clinical Assistant
Village Health Worker
Mother Father
ADMINISTRATIVE LEVEL SERVICE STRUCTURE
National Level
Zonal Level
Regional Level
District Level
Divisional Level
Ward Level
Village Level
Houshould Level THE COMMUNITY
Ministry of Health
Specialized University Hospitals
Regional Health Services
District Health Services
Urban/Rural Health services
Community Dispensaries
Village Health Posts
Family
Figure 4-1 Health Service Delivery Institutions

Local Level Service Delivery, Decentralisation and Governance TANZANIA CASE REPORT
52
The council level broadly equates to the priority poverty reduction area of primary health, both
as services most directly respond to the conditions from which the majority poor suffer, and as they
are relatively easily accessible by the poor, with over 90 % of the population living within 10 km of
a health facility 48. Table 4-1 described the various roles of central, regional and district council levels
fo planning and provision of health services.
Table 4-1 Levels and Roles within the Health Care System
Level
Central
Regional
Council
• Policyformulation,healthlegislation,regulationandcontrol• Resourcemobilizationandallocation,coordinationandinter-sectorallinkages• Publichealthrelatedintervention• Provisionofclinicalservicesthroughmanagementoflevelthreehospitalsincludingreferralspecializedandthe
national hospital• Trainingofkeyprofessionalhealthcadresandmonitoringqualityoftraining• Monitoringandevaluationofhealthservicescountrywide• Supervisionandinspectionofprovisionofhealthservices• Healthresearch• Managementofexecutiveagencies• Interpretspoliciesintoactions• Provisionoftechnicalsupporttothedistricts• Supportivesupervisionandinspectionofdistricthealthservices• LinkbetweendistrictsandcentralMoHSWinmattersregardingstandardsandqualityofhealthcarebothpublic
and private
• Healthserviceprovisionatlevelonewhichincludethedistricthospital,otherhospitals,healthcentresanddispensaries
• PreparationofCCHPandregularreportingonimplementation• Coordination,supportivesupervision,monitoringandinspectionofallhealthfacilitiesandactivitiesinthecouncil• Managementofresources• Ensuringcommunitiesareresponsibleintakingcareoftheirownhealthandalsothesafetyofmedicineand
equipment in their health facilities
Roles
Ward and village level have very little direct responsibility in health planning and service delivery.
The CCHP process is very much driven from the district level by the CHMTs and with no or very little
input from the ward and village levels.
4-2-1 National Health System
The referral system is made up of three levels: dispensaries, health centres and hospitals (district,
regional and consultant). Table 4-2 gives an overview of various types of health facilities and their
ownership arrangements.
Health services boards and various community health committees (health facility committees
(HFCs), community health fund committees etc.) Have been formed to achieve community
48 Household Budget Survey 2000/2001.
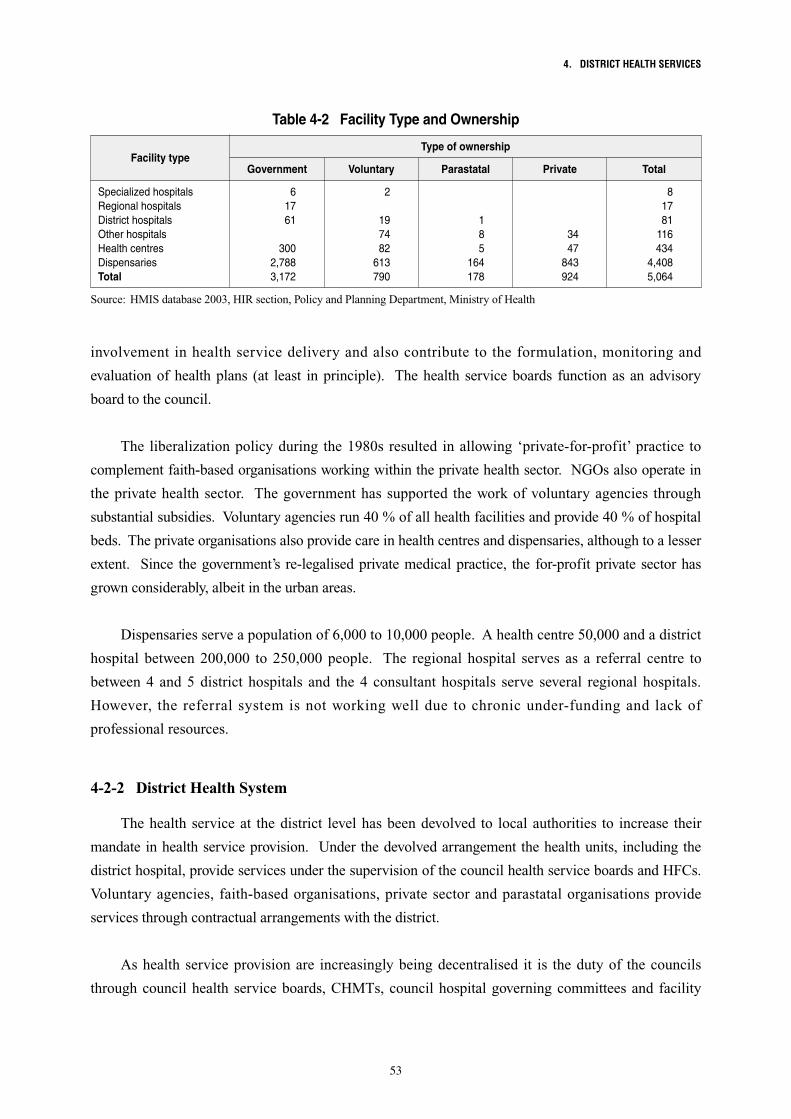
4. DISTRICT HEALTH SERVICES
53
involvement in health service delivery and also contribute to the formulation, monitoring and
evaluation of health plans (at least in principle). The health service boards function as an advisory
board to the council.
The liberalization policy during the 1980s resulted in allowing ‘private-for-profit’ practice to
complement faith-based organisations working within the private health sector. NGOs also operate in
the private health sector. The government has supported the work of voluntary agencies through
substantial subsidies. Voluntary agencies run 40 % of all health facilities and provide 40 % of hospital
beds. The private organisations also provide care in health centres and dispensaries, although to a lesser
extent. Since the government’s re-legalised private medical practice, the for-profit private sector has
grown considerably, albeit in the urban areas.
Dispensaries serve a population of 6,000 to 10,000 people. A health centre 50,000 and a district
hospital between 200,000 to 250,000 people. The regional hospital serves as a referral centre to
between 4 and 5 district hospitals and the 4 consultant hospitals serve several regional hospitals.
However, the referral system is not working well due to chronic under-funding and lack of
professional resources.
4-2-2 District Health System
The health service at the district level has been devolved to local authorities to increase their
mandate in health service provision. Under the devolved arrangement the health units, including the
district hospital, provide services under the supervision of the council health service boards and HFCs.
Voluntary agencies, faith-based organisations, private sector and parastatal organisations provide
services through contractual arrangements with the district.
As health service provision are increasingly being decentralised it is the duty of the councils
through council health service boards, CHMTs, council hospital governing committees and facility
Table 4-2 Facility Type and Ownership
Specialized hospitalsRegional hospitalsDistrict hospitalsOther hospitalsHealth centresDispensariesTotal
Facility typeType of ownership
Government Voluntary Parastatal Private Total
6 2 8 17 17 61 19 1 81 74 8 34 116 300 82 5 47 434 2,788 613 164 843 4,408 3,172 790 178 924 5,064
Source: HMIS database 2003, HIR section, Policy and Planning Department, Ministry of Health
Local Level Service Delivery, Decentralisation and Governance TANZANIA CASE REPORT
54
committees, to ensure that health facilities and services provided are of acceptable quality.
Furthermore, these facilities have to be managed by qualified personnel according to staffing level in
line with MoHSW policy guidelines and standards.
Since its adoption by the government, PHC has been the cornerstone of the national health policy.
In its endeavour to ensure success in delivery of essential health care in the country, the government
through PHC puts emphasis on:
• Community involvement throughactiveparticipation in identificationofproblemareas,
planning, implementation, monitoring and evaluation of health care services;
• Multi-sectoralcollaborationbyestablishmentofcommitteesinvolvingothersectorssuchas
water, agriculture, education and ministries such as community development, women affairs
and children, etc.
• Equityandaccessibility tohealthcarebyensuring that every individualhas the right to
health care, and equitable distribution of health resources in the country;
• Empowerment throughdecentralisationofhealthservices toregionsanddistricts toensure
effective coordination, implementation, supervision and provision of quality health care to
the community
• Providingpromotive,preventive, curativeand rehabilitative interventions toall individuals
and families with their active participation.
The policy states that “the community must be involved in taking care of its own health.
Participation of the community in decision-making must therefore go beyond the Council Health
Service Boards. The community should be more involved in planning, implementation and evaluation
of all health programs from village to national levels. The community will be responsible for the safety
of medicine, medical supplies and equipment in providing security to their health facilities.” However,
real practical involvement of communities have in practice been limited.
4-2-3 Summary Responsibilities for Health Service Delivery
Table 4-3 summaries the main responsibilities in health service delivery:
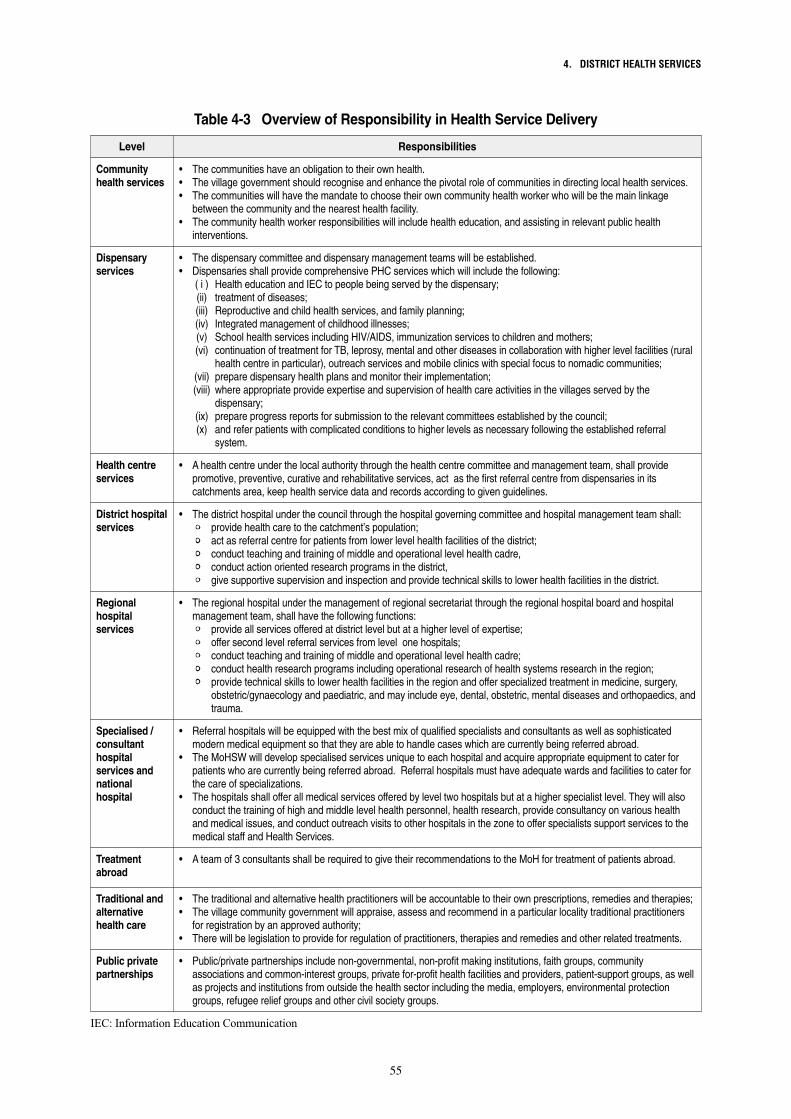
4. DISTRICT HEALTH SERVICES
55
Community health services
Dispensary services
Health centre services
District hospital services
Regional hospital services
Specialised / consultant hospital services and national hospital
Treatment abroad
Traditional and alternative health care
Public private partnerships
Table 4-3 Overview of Responsibility in Health Service Delivery
Level
• Thecommunitieshaveanobligationtotheirownhealth.• Thevillagegovernmentshouldrecogniseandenhancethepivotalroleofcommunitiesindirectinglocalhealthservices.• Thecommunitieswillhavethemandatetochoosetheirowncommunityhealthworkerwhowillbethemainlinkage
between the community and the nearest health facility. • Thecommunityhealthworkerresponsibilitieswillincludehealtheducation,andassistinginrelevantpublichealth
interventions.
• Thedispensarycommitteeanddispensarymanagementteamswillbeestablished.• DispensariesshallprovidecomprehensivePHCserviceswhichwillincludethefollowing: ( i ) Health education and IEC to people being served by the dispensary; (ii) treatment of diseases; (iii) Reproductive and child health services, and family planning; (iv) Integrated management of childhood illnesses; (v) School health services including HIV/AIDS, immunization services to children and mothers; (vi) continuation of treatment for TB, leprosy, mental and other diseases in collaboration with higher level facilities (rural
health centre in particular), outreach services and mobile clinics with special focus to nomadic communities; (vii) prepare dispensary health plans and monitor their implementation; (viii) where appropriate provide expertise and supervision of health care activities in the villages served by the
dispensary; (ix) prepare progress reports for submission to the relevant committees established by the council; (x) and refer patients with complicated conditions to higher levels as necessary following the established referral
system.
• Ahealthcentreunderthelocalauthoritythroughthehealthcentrecommitteeandmanagementteam,shallprovidepromotive, preventive, curative and rehabilitative services, act as the first referral centre from dispensaries in its catchments area, keep health service data and records according to given guidelines.
• Thedistricthospitalunderthecouncilthroughthehospitalgoverningcommitteeandhospitalmanagementteamshall:• provide health care to the catchment’s population; • act as referral centre for patients from lower level health facilities of the district; • conduct teaching and training of middle and operational level health cadre, • conduct action oriented research programs in the district, • give supportive supervision and inspection and provide technical skills to lower health facilities in the district.
• Theregionalhospitalunderthemanagementofregionalsecretariatthroughtheregionalhospitalboardandhospitalmanagement team, shall have the following functions:• provide all services offered at district level but at a higher level of expertise; • offer second level referral services from level one hospitals; • conduct teaching and training of middle and operational level health cadre; • conduct health research programs including operational research of health systems research in the region; • provide technical skills to lower health facilities in the region and offer specialized treatment in medicine, surgery,
obstetric/gynaecology and paediatric, and may include eye, dental, obstetric, mental diseases and orthopaedics, and trauma.
• Referralhospitalswillbeequippedwiththebestmixofqualifiedspecialistsandconsultantsaswellassophisticatedmodern medical equipment so that they are able to handle cases which are currently being referred abroad.
• TheMoHSWwilldevelopspecialisedservicesuniquetoeachhospitalandacquireappropriateequipmenttocaterforpatients who are currently being referred abroad. Referral hospitals must have adequate wards and facilities to cater for the care of specializations.
• Thehospitalsshallofferallmedicalservicesofferedbyleveltwohospitalsbutatahigherspecialistlevel.Theywillalsoconduct the training of high and middle level health personnel, health research, provide consultancy on various health and medical issues, and conduct outreach visits to other hospitals in the zone to offer specialists support services to the medical staff and Health Services.
• Ateamof3consultantsshallberequiredtogivetheirrecommendationstotheMoHfortreatmentofpatientsabroad.
• Thetraditionalandalternativehealthpractitionerswillbeaccountabletotheirownprescriptions,remediesandtherapies;• Thevillagecommunitygovernmentwillappraise,assessandrecommendinaparticularlocalitytraditionalpractitioners
for registration by an approved authority;• Therewillbelegislationtoprovideforregulationofpractitioners,therapiesandremediesandotherrelatedtreatments.
• Public/privatepartnershipsincludenon-governmental,non-profitmakinginstitutions,faithgroups,communityassociations and common-interest groups, private for-profit health facilities and providers, patient-support groups, as well as projects and institutions from outside the health sector including the media, employers, environmental protection groups, refugee relief groups and other civil society groups.
Responsibilities
IEC: Information Education Communication

Local Level Service Delivery, Decentralisation and Governance TANZANIA CASE REPORT
56
4-3 Local Service Delivery Financing
4-3-1 Funding Levels
Funds for central and council level activities are disbursed based on approved health plans and
cash flows. Implementation is being monitored on quarterly basis using the quarterly progress
implementation and financial reports. Table 4-4 gives on overview of budgeted and actual expenditure
between 2002 and 2005.
Table 4-4 Total Health Expenditure in Tanzania, FY 2002–FY 2005(TSH billion)
RecurrentAGOMoHRegionLG
Total rec.
DevelopmentMoHPO-RALGRegionsLG
Total devt
Total on budget
Off budget expenditureCost sharingOther foreign funds
Total off budget
Grand total
8.97 5.29 6.92 5.53 6.62 10.56 10.12 61.60 58.99 82.16 72.32 87.47 87.08 138.99 7.06 6.58 7.86 7.82 12.06 11.90 9.68 46.26 46.28 57.66 57.48 66.14 63.77 82.26 123.89 117.15 154.60 143.14 172.28 173.31 241.04
32.07 21.12 34.07 29.03 42.28 41.44 56.69 0.34 0.34 0.68 2.35 1.28 4.99 2.48 3.19 2.70 9.38 1.70 1.45 1.75 1.70 2.31 2.32 5.02 36.12 23.86 40.80 33.21 48.12 46.79 71.77
160.01 141.01 195.40 176.36 220.40 220.10 312.81
1.24 1.67 1.67 7.48 7.48 66.14 79.37 49.25 59.11 68.99 82.79 132.86 66.14 80.61 49.25 60.77 70.66 90.27 140.33
226.16 221.62 244.66 237.13 291.06 310.37 453.15
2001/2002
Budget Actual
2001/2002
Budget Actual
2001/2002
Budget Actual
2001/2002
Budget
Notes: AGO spending on National Health Insurance Fund (NHIF). PMO-RALG spending on PHC rehabilitation administration costs (actual rehabilitation included under LG). Basket funding included as recurrent or development as appropriate.
Source: MoH PER data FY 2005
As can be seen from the above table allocations within the health sector have been rising slightly
over the past years but the significant increase in MoHSW recurrent spending, which is the largest
single element both within the on-budget and total figures. This is not in the least due to on-going
vertical programmes to cover Anti Retro Viruses (ARVs) and other HIV/AIDS spending within the
sector and the health sector basket funding. Significant real increase is also seen in the allocation to
LGAs which account for the second largest element within the on-budget component.
In terms of discretionary funding, Table 4-5 shows that the split between PE recurrent and OC
recurrent funding has remained stable at about 2/3 to 1/3 for that last 3 years.

4. DISTRICT HEALTH SERVICES
57
4-3-2 Funding Sources and Modalities
a) Funding sources and modalities at CG level
The following are the funding sources for health care at CG level:
• CGcentralandlocaltaxes:(i)governmentblockgrants,(ii)governmentcapitaldevelopment
fund, (iii) centrally funded vertical health programs, (iv) local council contributions.
• Internationalbilateral andmultilateral aid: (i)basket funding (foreign sources), (ii)district
health infrastructure funds, (iii) externally funded health development projects.
• Out-of-pocketpayments andhealth insurance: (i) cost sharinganduser fees, (ii) the
Community Health Fund (CHF), (iii) the NHIF.
• Privatesector:(i)privatesectorinvestmentandservices
b) Funding sources and modalities at the district level
Health sector basket fund
The health sector basket fund (with a ‘central basket’ for MoHSW recurrent expenditures, and
a ‘district basket’ for LG expenditures through district grants that can be spent by district councils) was set
up in 1999 as a joint donor financing mechanism. Allocations are made on a per capita basis ($ 0.5 per
capita and year). 10 % of the district funds are earmarked to finance community-based health activities.
Cost sharing and user fees
User fees were introduced in 1993 with four main objectives: (i) to curb unnecessary use of health
facilities for non-essential health care services, (ii) to generate additional resources to complement
government budgetary allocations, (iii) to improve availability and quality of health services, and (iv) to
improve equity and access to health services. In order to maintain the policy principles of equity,
universal access and affordability, a range of health services was defined that would remain free to
users (“exemptions”), and procedures were introduced where poor patients would not have to pay
standard service fees (“waivers”)
Table 4-5 PE & OC Elements of Health Expenditures at LGA Level(%)
PEOC
FY 2003 FY 2004 FY 2005 FY 2003 FY 2004 FY 2005 FY 2003 FY 2004 FY 2005
67 71 67 69 73 72 66 71 66 33 29 33 31 27 28 34 29 34
All councils Urban District
Source: MoHSW PER FY 2005

Local Level Service Delivery, Decentralisation and Governance TANZANIA CASE REPORT
58
Community health fund
The CHF is a decentralised voluntary health insurance scheme (pre-payment scheme) that
operates at district level which was first introduced in 1996. The scheme targets members of formal
and informal sectors, and is designed to include the poor: village councils are encouraged to enrol poor
members of the community in the scheme and waive contributions, while at the same time seeking
compensatory funding / sponsorships. Annual membership fee for households / families is 5,000 TSH.
A matching grant for pooled district CHF (100 %) is provided from the government budget. The
collected contributions from each health facility in the council are kept in a separate bank account with
the District Medical Officer (DMO)’s office.
Membership benefits cover basic health care services; membership fees, on the other hand, cover
only a fraction of the cost of this benefit package, making continuing subsidies a necessity. The
MoHSW target is to set up CHFs in all 127 councils of Tanzania. By the end of 2005, 68 funds were
operational. The scheme struggles with low enrolment levels (on average 10 % of the population in
participating districts), and problems of financial management and record keeping. In most districts
revenue from user fees is far higher than income from CHF membership fees.
National health insurance fund
The NHIF is a compulsory, comprehensive health insurance scheme for public sector employees
and their dependants that started operations in 2001. It covers at present about 3 % of the population of
Tanzania, with a target to eventually enrol 15 % to 20 %. The NHIF runs a large surplus: in FY
2004/2005 contributions of TSH 24 billion were collected, with claims reimbursements totalling TSH
4.2 billion (equivalent to 1.8 % of total recurrent public health expenditure).
In 2005 the NHIF had service contracts with over 3,300 public and almost 600 private (mainly
faith-based) health facilities. Almost 70 % of these were submitting claims, with large variation
between districts. The total of NHIF claims and reimbursements to dispensaries is still very small, but
the NHIF is beginning to provide a significant part of hospital income (20–50 % of total fee income,
mainly at faith-based hospitals).
Fairness and appropriateness of the accreditation process has been disputed, and accreditation/
certification are not based on strict quality assurance processes. Work is under way to improve
accreditation, member registration, claims processing, and health facilities reimbursement procedures.
Micro health insurance schemes in urban areas
A number of small voluntary schemes, many of them set up and run by cooperatives, churches or
local communities are operating, mainly in urban areas. The schemes usually contract with a single
provider. In a similar way, mutual health insurance schemes exist that have developed around groups of
4. DISTRICT HEALTH SERVICES
59
common interest. Examples are UMASIDA (a mutual health scheme catering for the informal sector
and self-employed people in urban areas) and VIBINDO (part of the International Labour Organisation
(ILO) Strategies and Tools against Social Exclusion and Poverty (STEP) program to organise the
informal sector). The schemes receive support from churches and charitable organisations. There are
at present over 20 schemes in operation.
Private health insurance
A number of private health insurance companies (NIC, AAR, MEDEX, Strategis) operate in
Tanzania. They sell voluntary health insurance policies, and are mainly used by companies buying
contracts for their employees. Business is based on private commercial insurance company models.
The private health insurance industry appears to be developing fast.
In summary, Tanzania is following a mixed type of financing within the health system. In line
with fiscal decentralisation the MoHSW/PMO-RALG has developed a formula for resource allocation
from central to local government. The formula is used for government grant as well as basket funds.
Criteria considered in the allocation are population (70 %), under-five morbidity (10 %) poverty
(10 %), access to health facility (10 %). Domestic funds make up the larger part of the recurrent
budget, while foreign development funding almost exclusively makes up the capital budget.
Off-budget funds still make up roughly 30 % of the total health budget.
The government funding is channelled through four sources, namely the Ministry of Health
Budget, the Ministry of LG budget, revenues of the District and Urban Councils from levies and other
locally generated sources and finally the Prime Minister’s budget.
4-4 Local Service Delivery Procedures
The CHMTs at the district level are preparing the CCHP which in principle should involve all
providers / stakeholders involved in health related activities. Involvement varies by district but
CHMTs make an effort to include other stakeholders/providers in developing their plans, but this is
not consistent, nor comprehensive. Involvement is mainly at the planning stage, and most often
limited to district basket or project resources only. In principle the CCHP should include activity
plans of faith-based, private for-profit providers and NGOs but these are often conspicuously absent
in most CCHPs.
Bottom-up planning has been adopted as the guiding principle for council planning in Tanzania.
However, some council’s have completed village level O&OD participatory planning exercises, while
many others haven’t. Therefore, many CCHP’s do not reflect at all the needs of various facilities within
the districts. Generally, various assessments of CCHPs show that community involvement in the
Local Level Service Delivery, Decentralisation and Governance TANZANIA CASE REPORT
60
planning process and assessment of community needs is absent. (See Technical Review of Health
Service Delivery at District Level, March 2003). The same findings apply for inter-sectoral planning,
medium-term planning and investment (capital) planning, which are all but absent from the CCHPs
reviewed in 2003. An effort has been made during the last years to make the CCHPs more inclusive
but the situation from 2003 is still the rule and not the exception.
The same assessment of the districts in 2003 also pointed out that developing the CCHPs required
between 1 and 2 months full-time CHMT involvement. Part of this was of course due to the new nature
of the planning but to spend more than 1-2 months on planning only is far too cumbersome.
Ownership of the council health plan by the councils is still limited. Input from the DED’s office is
mainly at the level of accounting and financing aspects. On the other hand, the district treasurer and
accounting staff spent relatively more time on health than on other sectors, mainly because of additional
requirements of the district health basket funds. Most districts have separate sector planning formats
and as well as reporting formats and very few have overall integrated strategic council plans that try to
provide linkages between sectors.
Council account no. 6 is a joint account. It receives different types of revenues such as block
grants, cost sharing revenues, district own contributions and receipts in kind (e.g. drugs). However, the
basket restrictions on expenditure necessitate separate accounting of funds to meet the audit
requirements and accounts are therefore audited twice by donors and by Auditor General. Most
councils, especially those operating manual accounting systems, are unable to account and report the
basket expenditures separately to adhere to restrictions and meet audit requirements. This is because
the capacity to code the expenditures and keeping separate documentation is lacking in the councils.
This causes delays and errors in reporting.
The quality of supervision remains an issue of concern. Guidelines for supervision were issued
by MoHSW/PMO-RALG in late 2004, however, the concept of supportive supervision remains an
issue with several CHMT members and RMOs. Even a simple follow-up tool consisting of 1 file per
facility in the supervising office, which can be consulted prior to a visit, and a standard form which
indicates the reason for the supervisory visit, the specific areas, the observations, the action to be
taken, by whom and when and signatures of supervisor and supervised staff, does not exist in most
councils.
Supportive supervision has to be strengthened through cascading the supervisory systems, but this
requires proper training of health centre staff in supportive supervision (a capacity that is still weak at
CHMT level in many districts) and would need additional financial and staff inputs.
4. DISTRICT HEALTH SERVICES
61
4-5 HR Issues
Human resources for health (HRH) have been described as being in a crisis mode for the past
5 years. The HRH agenda aim for right sizing of a multi-professional workforce, better quality of staff
training, a more balanced approach to the allocation of human resources across service levels and
geographical areas, and workforce incentives and remuneration packages.
The number of staff working in the CHMT, Regional Health Management Team (RHMT) and
health facilities is inadequate, with only about 30–40 % of required levels being filled according to the
1999 establishment guidelines. Shortage of staff especially exists at health facility level leading to
increased workload to the available staff. Generally, the workforce is unevenly distributed in favour of
urban centres as compared to rural areas and as such HRH stands as a major challenge to health sector.
There have been a number of initiatives being carried out by the MoHSW, including raising the number
of trainees in MoHSW run institutions and university graduates, but still more effective collaboration is
needed between the MoHSW and other stakeholders such as PMO-RALG, MoF and Department of
PSM to assure effectively, development and retention of health staff.
In the context of public service reforms, MoHSW is included as beneficiary of the selective
accelerated salary enhancement (SASE) scheme. However, these approaches have mainly been applied
atHeadquarter (HQ)andnot field levelsand thusnot motivatedLGAworkers in thehealthsector.
Not only is there a current shortage of staff, it is being estimated that the need for additional staff
double by 2015. Interventions relating to HIV and AIDS are expected to take about 40 % of staff time.
Table 4-6 gives an overview from 2003 regarding the shortage of staff per region.
Due to the continued problems relating to recruitment of HRH staff in the districts - and especially
in the remote and poorer districts - the MoHSW has proposed to address the staff shortage problem by
introducing central recruitment of health workers from 2006/2007 onwards and the recruited health
workers will be transferred to selected councils as per need.
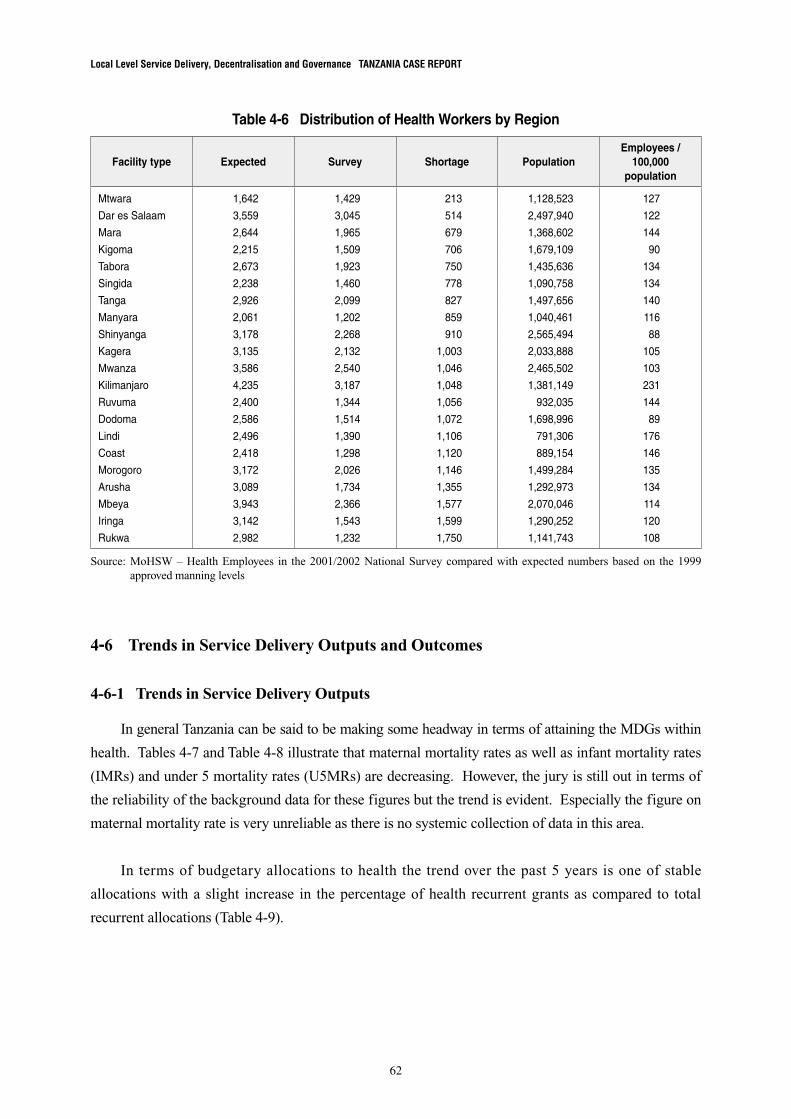
Local Level Service Delivery, Decentralisation and Governance TANZANIA CASE REPORT
62
4-6 Trends in Service Delivery Outputs and Outcomes
4-6-1 Trends in Service Delivery Outputs
In general Tanzania can be said to be making some headway in terms of attaining the MDGs within
health. Tables 4-7 and Table 4-8 illustrate that maternal mortality rates as well as infant mortality rates
(IMRs) and under 5 mortality rates (U5MRs) are decreasing. However, the jury is still out in terms of
the reliability of the background data for these figures but the trend is evident. Especially the figure on
maternal mortality rate is very unreliable as there is no systemic collection of data in this area.
In terms of budgetary allocations to health the trend over the past 5 years is one of stable
allocations with a slight increase in the percentage of health recurrent grants as compared to total
recurrent allocations (Table 4-9).
Table 4-6 Distribution of Health Workers by Region
Facility type Expected Survey Shortage PopulationEmployees /
100,000 population
Mtwara 1,642 1,429 213 1,128,523 127
Dar es Salaam 3,559 3,045 514 2,497,940 122
Mara 2,644 1,965 679 1,368,602 144
Kigoma 2,215 1,509 706 1,679,109 90
Tabora 2,673 1,923 750 1,435,636 134
Singida 2,238 1,460 778 1,090,758 134
Tanga 2,926 2,099 827 1,497,656 140
Manyara 2,061 1,202 859 1,040,461 116
Shinyanga 3,178 2,268 910 2,565,494 88
Kagera 3,135 2,132 1,003 2,033,888 105
Mwanza 3,586 2,540 1,046 2,465,502 103
Kilimanjaro 4,235 3,187 1,048 1,381,149 231
Ruvuma 2,400 1,344 1,056 932,035 144
Dodoma 2,586 1,514 1,072 1,698,996 89
Lindi 2,496 1,390 1,106 791,306 176
Coast 2,418 1,298 1,120 889,154 146
Morogoro 3,172 2,026 1,146 1,499,284 135
Arusha 3,089 1,734 1,355 1,292,973 134
Mbeya 3,943 2,366 1,577 2,070,046 114
Iringa 3,142 1,543 1,599 1,290,252 120
Rukwa 2,982 1,232 1,750 1,141,743 108
Source: MoHSW – Health Employees in the 2001/2002 National Survey compared with expected numbers based on the 1999 approved manning levels
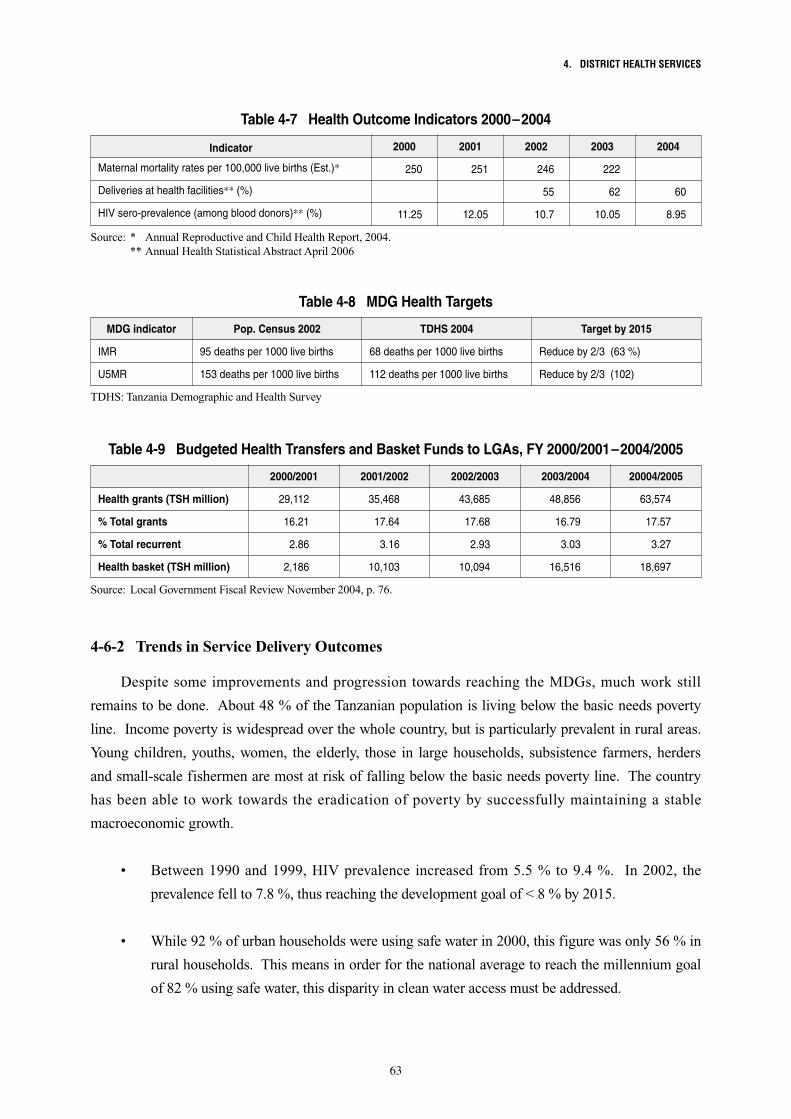
4. DISTRICT HEALTH SERVICES
63
4-6-2 Trends in Service Delivery Outcomes
Despite some improvements and progression towards reaching the MDGs, much work still
remains to be done. About 48 % of the Tanzanian population is living below the basic needs poverty
line. Income poverty is widespread over the whole country, but is particularly prevalent in rural areas.
Young children, youths, women, the elderly, those in large households, subsistence farmers, herders
and small-scale fishermen are most at risk of falling below the basic needs poverty line. The country
has been able to work towards the eradication of poverty by successfully maintaining a stable
macroeconomic growth.
• Between1990and1999,HIVprevalence increased from5.5% to9.4%. In2002, the
prevalence fell to 7.8 %, thus reaching the development goal of < 8 % by 2015.
• While92%ofurbanhouseholdswereusingsafewaterin2000,thisfigurewasonly56%in
rural households. This means in order for the national average to reach the millennium goal
of 82 % using safe water, this disparity in clean water access must be addressed.
Source: * Annual Reproductive and Child Health Report, 2004. ** Annual Health Statistical Abstract April 2006
Table 4-7 Health Outcome Indicators 2000–2004
Indicator
Maternal mortality rates per 100,000 live births (Est.)*
Deliveries at health facilities** (%)
HIV sero-prevalence (among blood donors)** (%)
250
11.25
2000
251
12.05
2001
246
55
10.7
2002
222
62
10.05
2003
60
8.95
2004
Source: Local Government Fiscal Review November 2004, p. 76.
Table 4-9 Budgeted Health Transfers and Basket Funds to LGAs, FY 2000/2001–2004/2005
Health grants (TSH million)
% Total grants
% Total recurrent
Health basket (TSH million)
2000/2001 2001/2002 2002/2003 2003/2004 20004/2005
29,112 35,468 43,685 48,856 63,574
16.21 17.64 17.68 16.79 17.57
2.86 3.16 2.93 3.03 3.27
2,186 10,103 10,094 16,516 18,697
Table 4-8 MDG Health Targets
MDG indicator
IMR
U5MR
Pop. Census 2002
95 deaths per 1000 live births
153 deaths per 1000 live births
TDHS 2004
68 deaths per 1000 live births
112 deaths per 1000 live births
Target by 2015
Reduce by 2/3 (63 %)
Reduce by 2/3 (102)
TDHS: Tanzania Demographic and Health Survey
Local Level Service Delivery, Decentralisation and Governance TANZANIA CASE REPORT
64
• It isunlikely thatTanzaniawillhalve theproportionofpeople suffering fromhungerby
2015. The number of moderately and severely underweight children has risen slightly
between 1991 and 1999, from 28.8 % to 29.4 % respectively.
• ChildandIMRhavedroppedinboththepoorestandleastpoorgroupsbetweentimeperiods
1994–1999 and 1998–2002. However, the country is unlikely to reduce the U5MR to below
48 per 1,000 live births. The proportion of orphaned children has increased between 1994
and 2001 by about 15 % to 20 % due to HIV and AIDS related deaths.
• Therewasimprovedmaternalhealthbetween1994and2001,reflectedbyafallinmaternal
mortality ratios, an increase in births taking place in health facilities, and a drop in fertility rates.
The health care delivery system has been marked by reform and improvement. There has been an
expansion of health services to the rural areas facilitating greater access to the rural population. By
1980, about 45 % of the population lived within 1 km of a health facility, 72 % within 5 km and 93.1 %
within 10 km of a facility. However, there are still geographical inequalities in access to health services
that can be attributed to its under-developed infrastructure.
The health expenditure constitutes 4.5 % of the GDP. In the PER 2005 it is estimated that about
10 % of public expenditure goes to health and corresponds to USD 7.42 per capita per annum.
However, including donor funds, it is USD 11.57 for 2005 (USD 8.12 in FY 2004). The recommended
per capita expenditure by the World Development Report 1993 is USD 12 per capita while the
Commission for Microeconomics and Health recommends USD 35 per capita. The Abuja target for
health expenditures is 15 % of government expenditure. All of the foregoing standards set by
international organisations suggest a shortfall in health expenditures.
4-7 Impact of Governance Aspects on Service Delivery
4-7-1 Transparency and Equity
Tanzania has had a large degree of equitable distribution of health facilities dating back to the
1960’s and 1970’s when the very large health facility construction programme was first launched. This
programme basically ensured that no Tanzanian (in principle) was more than 10 km from the nearest
dispensary. The JRF was set up in 2004/2005 to address the need of rehabilitating the old and decaying
health infrastructure countrywide. In these terms financial resources LGAs have been receiving and
expending about 1/3 of all on-budget expenditures since 2001 (Table 4-9). However, development
funding for health has remained low and has only recently been slightly addressed by the introduction
of the JRF and the LGCDG systems.
4. DISTRICT HEALTH SERVICES
65
In terms of equitable distribution of health staff then as demonstrated in 4-5 there are great
variations over the whole country. It is quite evident that remote areas like Rukwa, Dodoma and Iringa
regions have great difficulty in attracting qualified health staff and the shortages of staff are also more
pronounced there. The discussion has been on-going for many years regarding the introduction of an
incentive scheme (hardship allowance) for recruiting and retaining health staff in remote and less
accessible areas but until now no concrete steps have been taken.
The discussion is on-going in Tanzania regarding policies of universal and equitable access to
health services, and the exclusion of the poor from health services as a result of cost sharing policies.
Studies on the impact of user fees on the use of health services by the poor, however, do not give
a clear-cut picture. A review of available evidence (Maternal Health Financing Profile 2002) describes
how outpatient visits to public hospitals declined by half in the year after introduction of fees, as did the
number of attended births. Utilization of (paying) private health services remained constant, however.
While user fees do appear to be one of the factors influencing the poor people’s decision making on use
of health services, the effect is apparently smaller than predicted. Over 50 % of all patients in public
hospitals are either exempted, or their fees waived.
A recent report (Equity Implications of Health Sector User Fees in Tanzania, 2004) concludes that
less than expected income was generated from user fees, and that this has led to only limited quality
improvement in some services. The report also observes large variations in revenue collection, weak
management of cost sharing programs at facility level, and difficult to apply waiver policies and
procedures. In addition, user fee collection and accounting mechanisms were not transparent, and
frequently fees were collected but not registered.
User fees appear to contribute to between 20 % and 65 % of facility health budgets. Overall,
however, in FY 2005 the total contribution from all cost sharing schemes (this includes user fees and
the CHF) was less than 2 % of the global health resource envelope. At council level studies that
estimated the contribution of user fees to the district health budget found average contributions of 10.5
% (2002) and, for a different sample of districts, 3 % (2003). There are indications that revenue from
user fees has declined between 2002 and 2005.
In Fair’s Fair - Health Inequalities and Equity in Tanzania, April 2006, Paul Smithson argues that:
“Spatial variations in health outcomes (infant and under-five mortality) are even larger than socio-
economic ones. What is clear is that the best districts tend to be clustered together, and the worst
districts also tend to cluster together. This is all the more puzzling because they do not show a clear
association with income poverty at the regional level. This is not to say that wealth is unimportant for
health. Rather it suggests that the factors at work operate on quite a large scale. Possible candidate
explanations include diet (in turn related to soil types, rainfall and farming systems), infant feeding and
Local Level Service Delivery, Decentralisation and Governance TANZANIA CASE REPORT
66
child rearing practices (in turn related to ethnic group), malaria transmission intensity, and perhaps
other factors such as water and sanitation. A better understanding of the underlying causes of these
regional variations is a priority topic of research, as it would allow a targeted policy response to narrow
the differences.”
4-7-2 Participation
Participation is still somewhat limited within health in terms of overall planning. The CCHPs are
not completed after elaborate participatory planning exercises and the O&OD planning exercise in the
councils has not been instituted in all councils yet. HFCs have been set-up in almost all facilities and
through the mechanisms and guidelines adopted for the JRF HFCs have been actively participating in
the rehabilitation of selected facilities in various councils through local procurement and disbursement
of funds to contractors for rehabilitation. In principle each HFC operates an account for that purpose.
In these terms a level of community oversight and influence on the running of the health facilities has
been instituted. However, it has been demonstrated that until now most CCHPs have been completed
mostly by CHMT members and with little community involvement. The issue of how to fully integrate
the CCHPs into the council development plans will in future need attention.
It is being argued that participation could be enhanced by making communities aware of what
resources are available for their area (transparency of budgets allocated to each facility in the district by
publishing this information). This issue of building awareness and initiating informed discussions at
facility level with local communities could be a first step to building local capacity. These types of
efforts could also lead to a more appropriate way to initiate community and facility staff involvement
before investing in building planning skills of facility staff / communities.
In the districts visited by the team, it was evident that under the decentralisation process the
establishment of the HFCs has had a positive impact on the felt participation of the communities in the
day-to-day running of the health facility, but it is still not having any influence on the planning of the
health service delivery targets, which remains very much under the control of the central ministry and
its staff in the regional administrations. The contributions from the CHF is still after many years not
showing signs of considerable growth giving an indication of the general distrust in the population to
a scheme which is not very transparent.
4-7-3 Accountability
Accountability at district level has somewhat improved over the past years. A MoHSW and PMO-
RALG audit of the council health basket fund for the period January 2003 – June 2004 issued qualified
opinion on 52 LGAs and disclaimer of opinion on 61 LGAs. The percentage of disclaimers issued
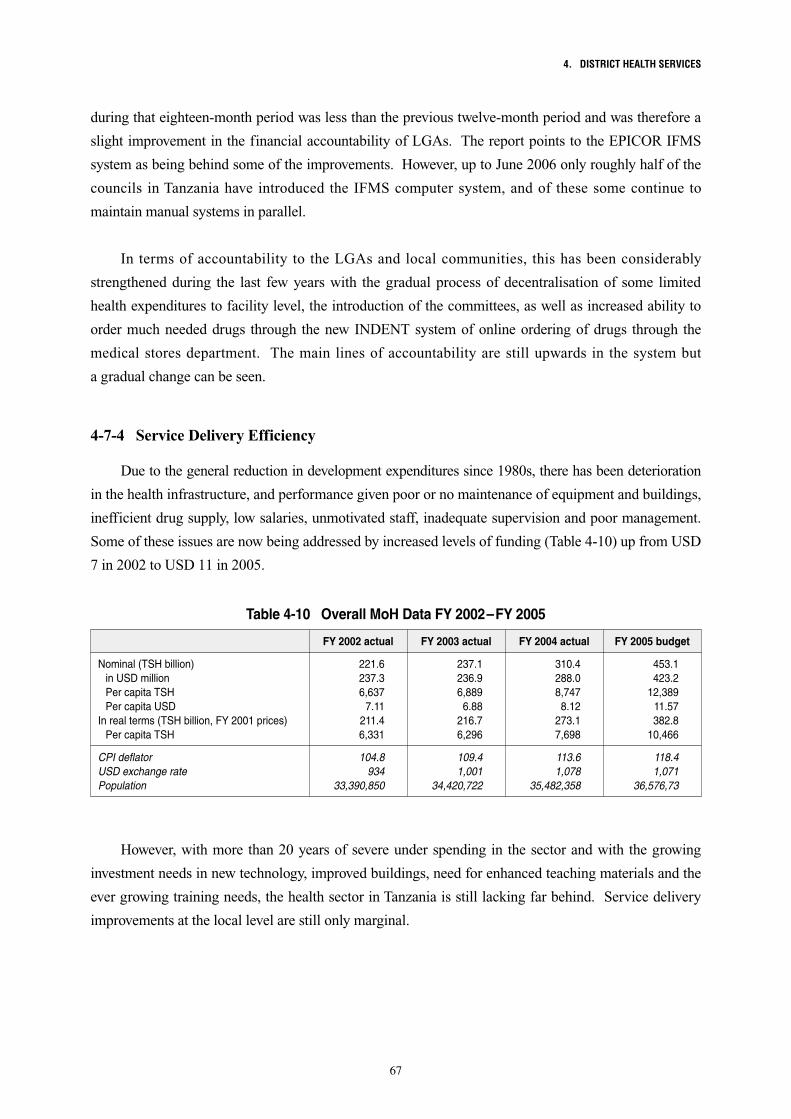
4. DISTRICT HEALTH SERVICES
67
during that eighteen-month period was less than the previous twelve-month period and was therefore a
slight improvement in the financial accountability of LGAs. The report points to the EPICOR IFMS
system as being behind some of the improvements. However, up to June 2006 only roughly half of the
councils in Tanzania have introduced the IFMS computer system, and of these some continue to
maintain manual systems in parallel.
In terms of accountability to the LGAs and local communities, this has been considerably
strengthened during the last few years with the gradual process of decentralisation of some limited
health expenditures to facility level, the introduction of the committees, as well as increased ability to
order much needed drugs through the new INDENT system of online ordering of drugs through the
medical stores department. The main lines of accountability are still upwards in the system but
a gradual change can be seen.
4-7-4 Service Delivery Efficiency
Due to the general reduction in development expenditures since 1980s, there has been deterioration
in the health infrastructure, and performance given poor or no maintenance of equipment and buildings,
inefficient drug supply, low salaries, unmotivated staff, inadequate supervision and poor management.
Some of these issues are now being addressed by increased levels of funding (Table 4-10) up from USD
7 in 2002 to USD 11 in 2005.
Table 4-10 Overall MoH Data FY 2002–FY 2005
Nominal (TSH billion)in USD millionPer capita TSHPer capita USD
In real terms (TSH billion, FY 2001 prices)Per capita TSH
CPI deflatorUSD exchange ratePopulation
FY 2002 actual FY 2003 actual FY 2004 actual FY 2005 budget
221.6 237.1 310.4 453.1 237.3 236.9 288.0 423.2 6,637 6,889 8,747 12,389 7.11 6.88 8.12 11.57 211.4 216.7 273.1 382.8 6,331 6,296 7,698 10,466
104.8 109.4 113.6 118.4 934 1,001 1,078 1,071 33,390,850 34,420,722 35,482,358 36,576,73
However, with more than 20 years of severe under spending in the sector and with the growing
investment needs in new technology, improved buildings, need for enhanced teaching materials and the
ever growing training needs, the health sector in Tanzania is still lacking far behind. Service delivery
improvements at the local level are still only marginal.
Local Level Service Delivery, Decentralisation and Governance TANZANIA CASE REPORT
68
4-8 Key Lessons and Challenges
• InmanywaysthedecentralisationofthehealthsectorinTanzaniawasattheforefrontoftheLocal
Government Development Programme (LGDP) process as the sector embraced the concept early
on. However, the results so far have been mixed. The sector still has a relatively centralistic
approach to planning and delivery of certain services at hospital level as well as planning of these
activities. With the persistent crisis in terms of recruitment, then HRM has been recentralised due
to recruitment problems at the local levels.
• Local councilshave so farbenefited froma redistributionofhealthallocations in favourof
primary and secondary care services, and an increase in donor funding leveraged through the
health baskets. As pointed out by the health sector review report of 2006 the PER of October
2005 reports “the LG element of the budget has increased by almost TSH 19 billion (28 %) (but)
the central allocation has increased much faster, by 51 %, at the expense not only of the share
assigned to LGAs but also to the regional level. This, coupled with the fact that the central level
allocation is the largest in absolute terms, has driven the increase in the sectoral on-budget total.”
This means that despite of many years of decentralisation within the health sector it still remains
centralised in the sense of funds allocation for various health activities.
• Inaddition to thesheernumericalshortageofskilledhealthcadres thereareanumberofother
challenges in tackling the HRH problem. One core challenge is the inequitable distribution of the
existing HRH workforce, with a tendency of more health workers per population in urban and
advantaged regions as compared to rural and less advantaged regions. Regardless of the urgent
need to deploy more staff to these areas, the existing processes for recruitment are overly
bureaucratic with inter-ministerial disconnects between MoH, PMO-RALG, PSM and MoF. This
has led the MoH to recentralise the recruitment of health workers in future.
• ThebasketfinancepartnersandtheMoHfoundin2005thattherewasnoevidencetoencourage
a change in existing policy on cost-sharing, by eliminating user fees for all people for all services
at public health centres, dispensaries and clinics. They found that there is not evidence that fees
are the main deterrent to utilization of primary services by the poor. It was stated in a joint note
for the 2005 Review that the poor often cite “costs” which encompass transport, lost time at work
as a deterrent, but they also cite perceptions of quality, preferences for traditional medicine, health
workers attitudes as some of the reasons for not accessing services. Often the costs referred to are
more likely to be hospital costs rather than the cost of primary services. Although not a large
amount against total health expenditures, income from fees are an important source of funding at
the local level. It looks like there are increased levels of funding coming from private insurance
schemes but this is very much an urban phenomenon and In this regard it is worth noting that
4. DISTRICT HEALTH SERVICES
69
there doesn’t seem yet to be a lot of pressure/demands on the local health services from organised
user groups.
• The2005healthsectorreviewbasicallybelievedthattheratiobetweenpublicandprivatehealth
services stands at roughly 60 – 40. In urban areas the contribution of private health care is
definitely higher; rural areas show a large variety in relative contributions. The private sector is
not easy to define and consists of a vibrant mix of a large number of different service providers
and actors. Public Private Partnership is a reality in Tanzania, albeit limited in concept and
practice and definitely insignificant to realise the paramount objective to promote equitable access
to health services of an adequate quality to the whole population. This has led to calls for a more
assertive MoH which engages the private sector and plays a better role in regulating and
supervising. There is need to take health services provided and utilised as the centre of gravity, to
be distinguished from the current arrangement that are based on ownership and function and leads
to differentiation in registration, quality assurance, resource sharing, etc. It was found that there is
a need for guidelines that allow for more equitable funding and resource sharing arrangements at
the council level that would maximise public health output by effectively tapping the potential of
all providers, public and ‘genuine’ providers.
• Sothechallengesforthehealthsectoratlocallevelremainmanybutafewarementionedhere:
• The JRF is basically a development funding mechanism very similar to the LGCDG system.
It would be practical to merge the two systems in the near future.
• Health expenditures are still very centralised even at LGA level. Maybe in future more
should be done to include more user group funding for health and to let increasing amounts
of funds be utilised and accounted for at the facility level. This would include using more
CHF as a vehicle for attracting and retaining funds at the facility level.
• The HRH crisis/challenge remains enormous. Not only in terms of recruitment of additional
health workers but also to distribute these in a more equitable way throughout the country.
The issue of incentives and added value through improved skills upgrade of already existing
staff needs to be addressed urgently.
Local Level Service Delivery, Decentralisation and Governance TANZANIA CASE REPORT
70
5. AGRICULTURE
5-1 Sector Policies
The Agricultural Sector Development Strategy (ASDS) was approved by the government in
August 2001 after a consultative process that began in 1998 after the preparation and finalization of the
agricultural and livestock policy and the cooperatives development policy of 1997 - and thus
immediately after the approval of the LG reform policy.
The ASDS envisages an agricultural sector that, by 2025, is “modernized, commercial, highly
productive and profitable, and utilizes natural resources in a sustainable manner”. The ASDS has
identified five strategic issues: (i) strengthening the institutional framework, (ii) creating a favourable
environment for commercial activities, (iii) clarifying public and private sector roles in improving
support services, (iv) strengthening marketing efficiency for inputs and outputs, and (v) mainstreaming
planning for agricultural development in other sectors.
An Agricultural Sector Development Programme (ASDP) developed jointly by the four
agriculture sector lead ministries (ASLMs 49) provides the overall framework and processes for
implementing the ASDS. Development activities at district level are to be implemented by LGAs,
based on district agricultural development plans (DADP), which are part of the overall district
development plan (DDP). The ASDP is the tool for implementing the ASDS and provides the
government with a sector-wide framework for overseeing the institutional reforms and investment
priorities. The ASDP seeks to clarify public and private roles in improving support services including
agricultural research, extension, training, regulation, technical services and finance 50. The private
sector is envisaged to increase its role in providing a wide range of demand-driven support services to
farmers. The public sector will gradually - but increasingly - limit its role to financing the provision of
public goods and services, and target poverty reduction interventions. The ASDP has three broad
pillars: (i) support at local level, (ii) support at national level, and (iii) support for cross-cutting and
cross- sector issues.
The policy has a very significant focus on decentralisation reflected in explicit policy statements
of shifting public sector funding from central government to LGAs: the ASDP makes a commitment of
transferring 70–80 % of all public finance under the ASDP to districts and sub-district LGAs.
49 ASLM include the three sector line ministries: the Ministry of Agriculture and Food Security (MAFS), Ministry of Water and Livestock Development (MoWLD) and Ministry of Cooperatives and Marketing (MCM), as well as the PO-RALG.
50 See ASDP Framework and Process Document (ASDP), Final Draft (March 2003).
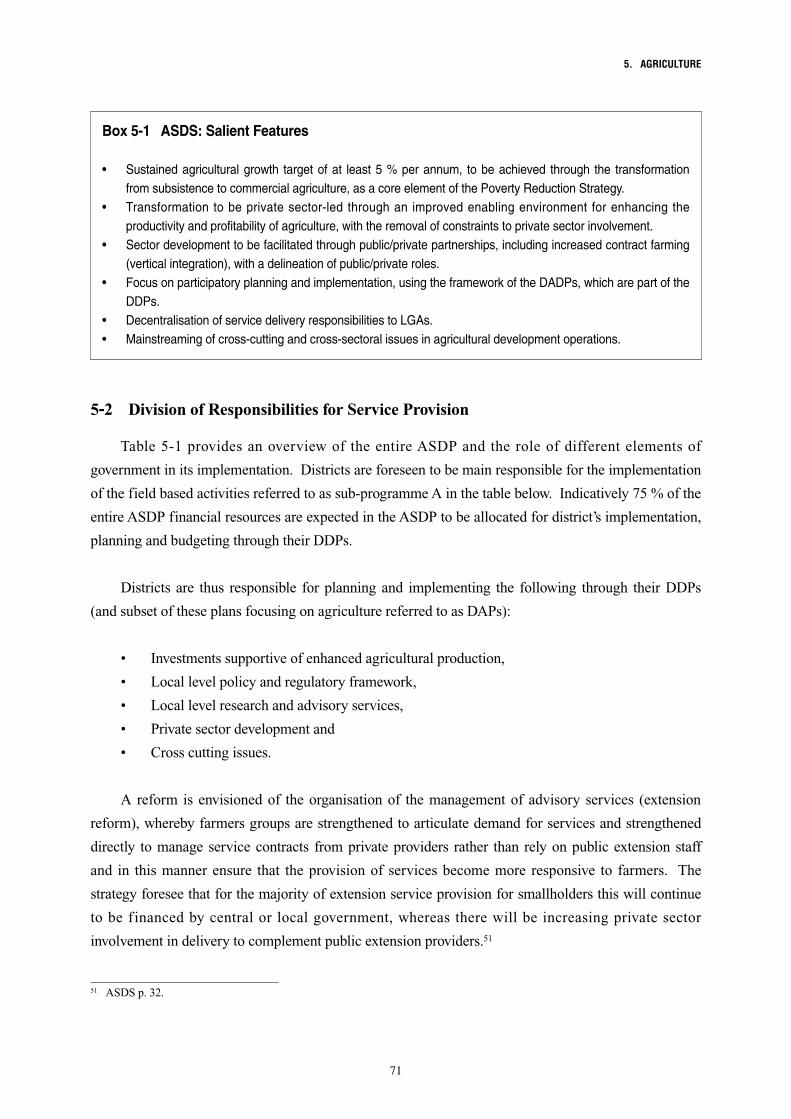
5. AGRICULTURE
71
5-2 Division of Responsibilities for Service Provision
Table 5-1 provides an overview of the entire ASDP and the role of different elements of
government in its implementation. Districts are foreseen to be main responsible for the implementation
of the field based activities referred to as sub-programme A in the table below. Indicatively 75 % of the
entire ASDP financial resources are expected in the ASDP to be allocated for district’s implementation,
planning and budgeting through their DDPs.
Districts are thus responsible for planning and implementing the following through their DDPs
(and subset of these plans focusing on agriculture referred to as DAPs):
• Investmentssupportiveofenhancedagriculturalproduction,
• Locallevelpolicyandregulatoryframework,
• Locallevelresearchandadvisoryservices,
• Privatesectordevelopmentand
• Crosscuttingissues.
A reform is envisioned of the organisation of the management of advisory services (extension
reform), whereby farmers groups are strengthened to articulate demand for services and strengthened
directly to manage service contracts from private providers rather than rely on public extension staff
and in this manner ensure that the provision of services become more responsive to farmers. The
strategy foresee that for the majority of extension service provision for smallholders this will continue
to be financed by central or local government, whereas there will be increasing private sector
involvement in delivery to complement public extension providers.51
Box 5-1 ASDS: Salient Features
• Sustainedagriculturalgrowth targetofat least5%perannum, tobeachieved through the transformationfrom subsistence to commercial agriculture, as a core element of the Poverty Reduction Strategy.
• Transformation tobeprivatesector-led throughan improvedenablingenvironment forenhancing theproductivity and profitability of agriculture, with the removal of constraints to private sector involvement.
• Sectordevelopmenttobefacilitatedthroughpublic/privatepartnerships,includingincreasedcontractfarming(vertical integration), with a delineation of public/private roles.
• Focusonparticipatoryplanningandimplementation,usingtheframeworkoftheDADPs,whicharepartoftheDDPs.
• DecentralisationofservicedeliveryresponsibilitiestoLGAs.• Mainstreamingofcross-cuttingandcross-sectoralissuesinagriculturaldevelopmentoperations.
51 ASDS p. 32.
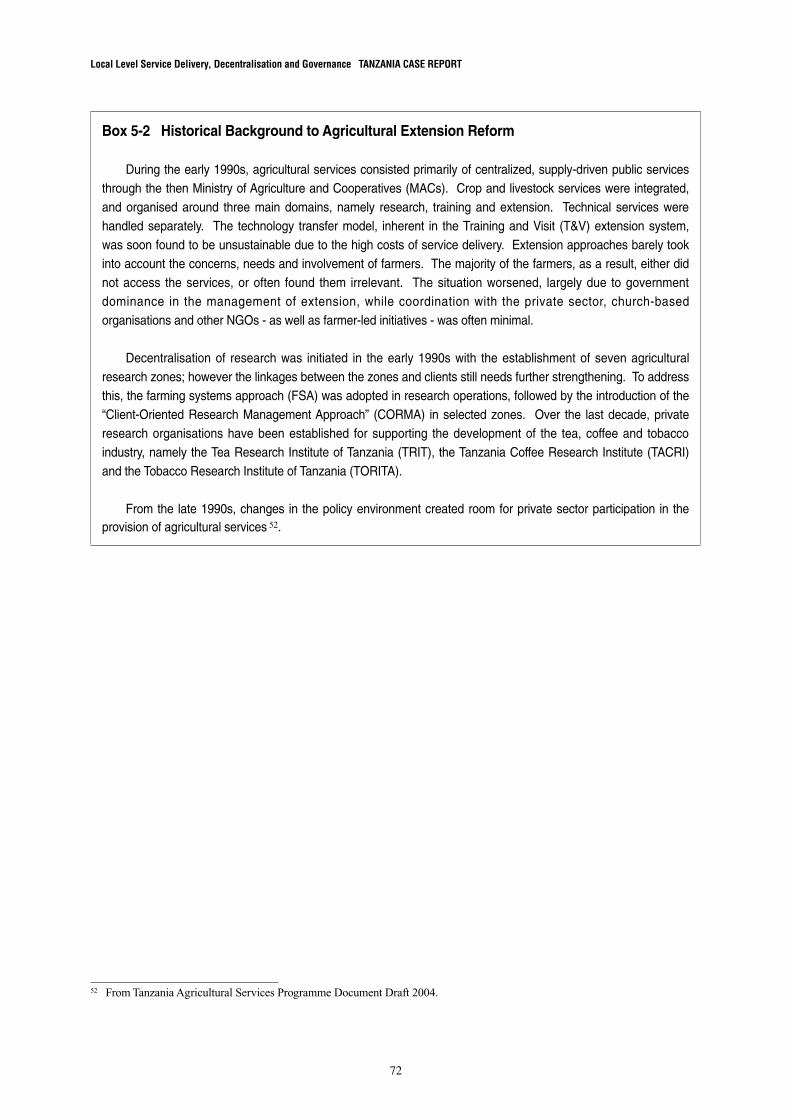
Local Level Service Delivery, Decentralisation and Governance TANZANIA CASE REPORT
72
Box 5-2 Historical Background to Agricultural Extension Reform
During the early 1990s, agricultural services consisted primarily of centralized, supply-driven public services through the then Ministry of Agriculture and Cooperatives (MACs). Crop and livestock services were integrated, and organised around three main domains, namely research, training and extension. Technical services were handled separately. The technology transfer model, inherent in the Training and Visit (T&V) extension system, was soon found to be unsustainable due to the high costs of service delivery. Extension approaches barely took into account the concerns, needs and involvement of farmers. The majority of the farmers, as a result, either did not access the services, or often found them irrelevant. The situation worsened, largely due to government dominance in the management of extension, while coordination with the private sector, church-based organisations and other NGOs - as well as farmer-led initiatives - was often minimal.
Decentralisation of research was initiated in the early 1990s with the establishment of seven agricultural research zones; however the linkages between the zones and clients still needs further strengthening. To address this, the farming systems approach (FSA) was adopted in research operations, followed by the introduction of the “Client-Oriented Research Management Approach” (CORMA) in selected zones. Over the last decade, private research organisations have been established for supporting the development of the tea, coffee and tobacco industry, namely the Tea Research Institute of Tanzania (TRIT), the Tanzania Coffee Research Institute (TACRI) and the Tobacco Research Institute of Tanzania (TORITA).
From the late 1990s, changes in the policy environment created room for private sector participation in the provision of agricultural services 52.
52 From Tanzania Agricultural Services Programme Document Draft 2004.
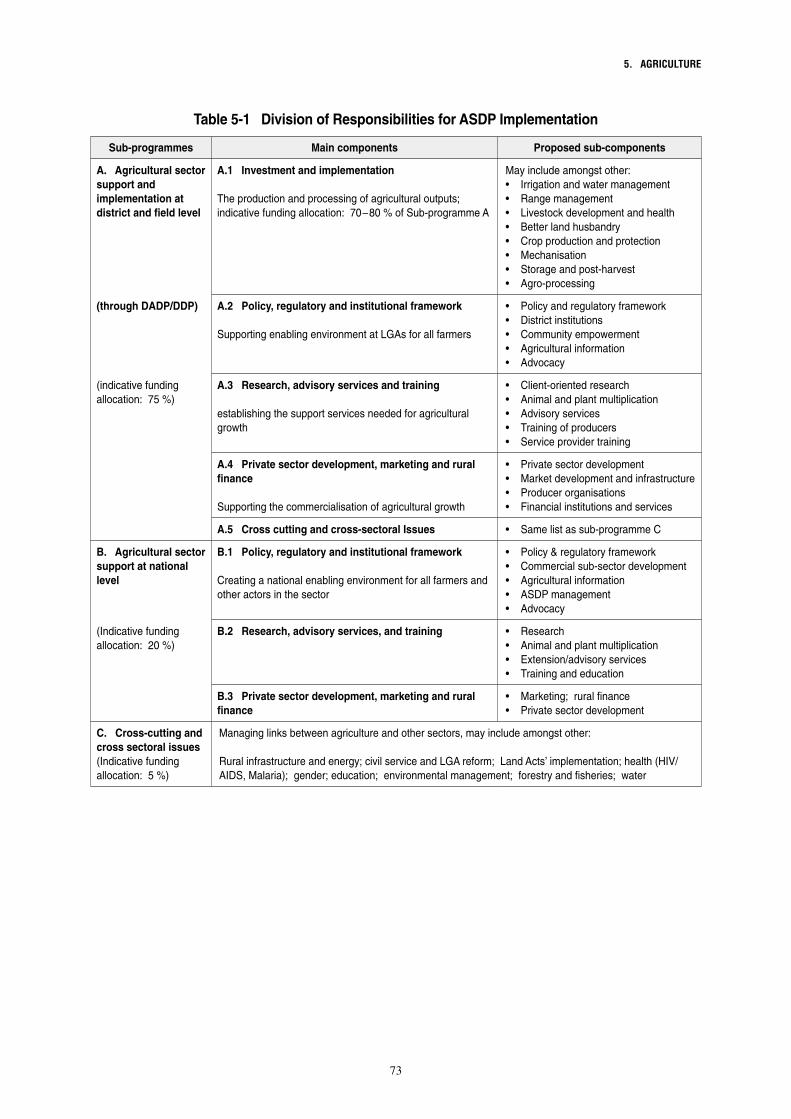
5. AGRICULTURE
73
Table 5-1 Division of Responsibilities for ASDP Implementation
Sub-programmes Main components Proposed sub-components
A. Agricultural sector support and implementation at district and field level
A.1 Investment and implementation
The production and processing of agricultural outputs; indicative funding allocation: 70–80 % of Sub-programme A
May include amongst other:• Irrigationandwatermanagement• Rangemanagement• Livestockdevelopmentandhealth• Betterlandhusbandry• Cropproductionandprotection• Mechanisation• Storageandpost-harvest• Agro-processing
(through DADP/DDP) A.2 Policy, regulatory and institutional framework
Supporting enabling environment at LGAs for all farmers
• Policyandregulatoryframework• Districtinstitutions• Communityempowerment• Agriculturalinformation• Advocacy
(indicative funding allocation: 75 %)
A.3 Research, advisory services and training
establishing the support services needed for agricultural growth
• Client-orientedresearch• Animalandplantmultiplication• Advisoryservices• Trainingofproducers• Serviceprovidertraining
A.4 Private sector development, marketing and rural finance
Supporting the commercialisation of agricultural growth
• Privatesectordevelopment• Marketdevelopmentandinfrastructure• Producerorganisations• Financialinstitutionsandservices
A.5 Cross cutting and cross-sectoral Issues • Samelistassub-programmeC
B. Agricultural sector support at national level
B.1 Policy, regulatory and institutional framework
Creating a national enabling environment for all farmers and other actors in the sector
• Policy®ulatoryframework• Commercialsub-sectordevelopment• Agriculturalinformation• ASDPmanagement• Advocacy
(Indicative funding allocation: 20 %)
B.2 Research, advisory services, and training • Research• Animalandplantmultiplication• Extension/advisoryservices• Trainingandeducation
B.3 Private sector development, marketing and rural finance
• Marketing;ruralfinance• Privatesectordevelopment
C. Cross-cutting and cross sectoral issues(Indicative funding allocation: 5 %)
Managing links between agriculture and other sectors, may include amongst other:
Rural infrastructure and energy; civil service and LGA reform; Land Acts’ implementation; health (HIV/AIDS, Malaria); gender; education; environmental management; forestry and fisheries; water
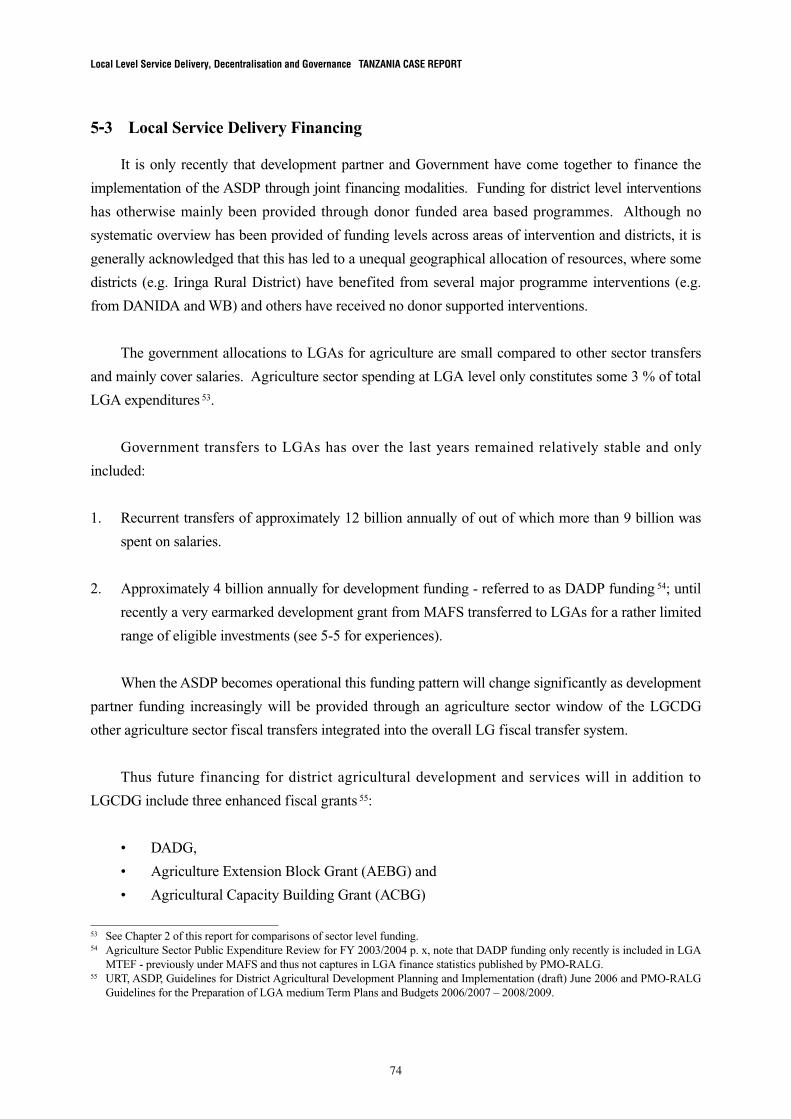
Local Level Service Delivery, Decentralisation and Governance TANZANIA CASE REPORT
74
5-3 Local Service Delivery Financing
It is only recently that development partner and Government have come together to finance the
implementation of the ASDP through joint financing modalities. Funding for district level interventions
has otherwise mainly been provided through donor funded area based programmes. Although no
systematic overview has been provided of funding levels across areas of intervention and districts, it is
generally acknowledged that this has led to a unequal geographical allocation of resources, where some
districts (e.g. Iringa Rural District) have benefited from several major programme interventions (e.g.
from DANIDA and WB) and others have received no donor supported interventions.
The government allocations to LGAs for agriculture are small compared to other sector transfers
and mainly cover salaries. Agriculture sector spending at LGA level only constitutes some 3 % of total
LGA expenditures 53.
Government transfers to LGAs has over the last years remained relatively stable and only
included:
1. Recurrent transfers of approximately 12 billion annually of out of which more than 9 billion was
spent on salaries.
2. Approximately 4 billion annually for development funding - referred to as DADP funding 54; until
recently a very earmarked development grant from MAFS transferred to LGAs for a rather limited
range of eligible investments (see 5-5 for experiences).
When the ASDP becomes operational this funding pattern will change significantly as development
partner funding increasingly will be provided through an agriculture sector window of the LGCDG
other agriculture sector fiscal transfers integrated into the overall LG fiscal transfer system.
Thus future financing for district agricultural development and services will in addition to
LGCDG include three enhanced fiscal grants 55:
• DADG,
• AgricultureExtensionBlockGrant(AEBG)and
• AgriculturalCapacityBuildingGrant(ACBG)
53 See Chapter 2 of this report for comparisons of sector level funding.54 Agriculture Sector Public Expenditure Review for FY 2003/2004 p. x, note that DADP funding only recently is included in LGA
MTEF - previously under MAFS and thus not captures in LGA finance statistics published by PMO-RALG.55 URT, ASDP, Guidelines for District Agricultural Development Planning and Implementation (draft) June 2006 and PMO-RALG
Guidelines for the Preparation of LGA medium Term Plans and Budgets 2006/2007 – 2008/2009.
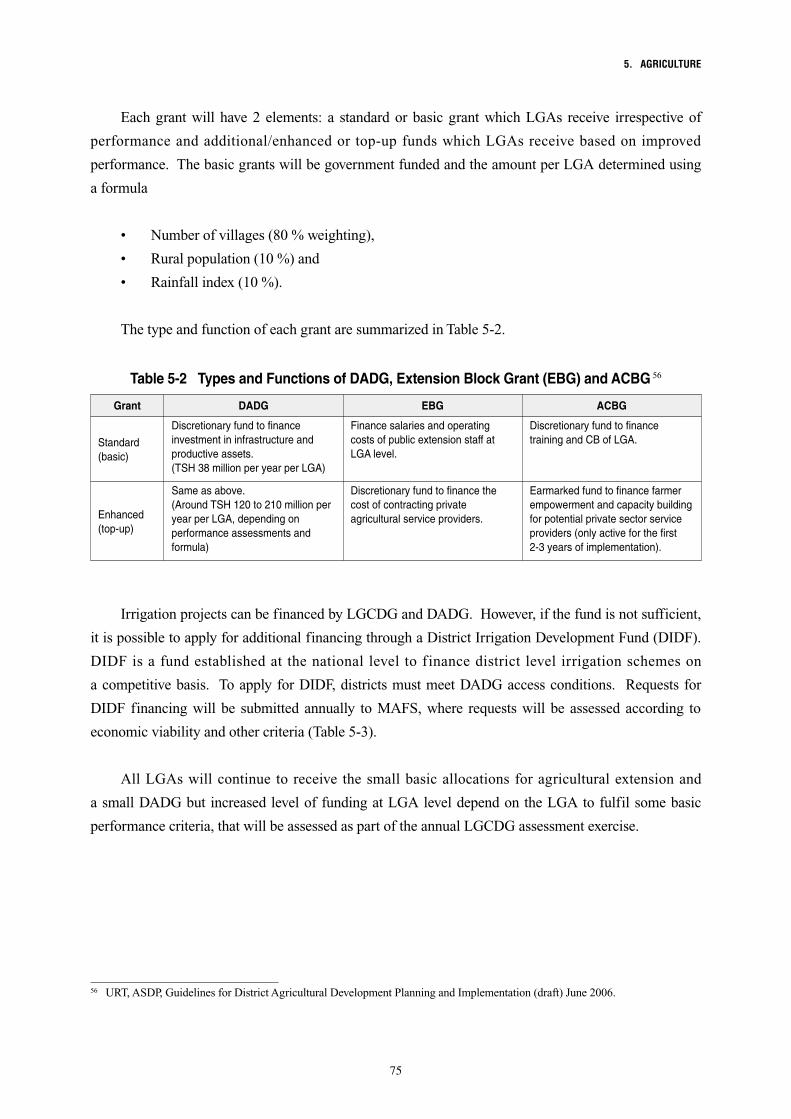
5. AGRICULTURE
75
Each grant will have 2 elements: a standard or basic grant which LGAs receive irrespective of
performance and additional/enhanced or top-up funds which LGAs receive based on improved
performance. The basic grants will be government funded and the amount per LGA determined using
a formula
• Numberofvillages(80%weighting),
• Ruralpopulation(10%)and
• Rainfallindex(10%).
The type and function of each grant are summarized in Table 5-2.
Grant DADG EBG ACBG
Standard(basic)
Enhanced(top-up)
Table 5-2 Types and Functions of DADG, Extension Block Grant (EBG) and ACBG 56
Discretionary fund to finance investment in infrastructure and productive assets.(TSH 38 million per year per LGA)
Same as above.(Around TSH 120 to 210 million per year per LGA, depending on performance assessments and formula)
Finance salaries and operating costs of public extension staff at LGA level.
Discretionary fund to finance the cost of contracting private agricultural service providers.
Discretionary fund to finance training and CB of LGA.
Earmarked fund to finance farmer empowerment and capacity building for potential private sector service providers (only active for the first 2-3 years of implementation).
Irrigation projects can be financed by LGCDG and DADG. However, if the fund is not sufficient,
it is possible to apply for additional financing through a District Irrigation Development Fund (DIDF).
DIDF is a fund established at the national level to finance district level irrigation schemes on
a competitive basis. To apply for DIDF, districts must meet DADG access conditions. Requests for
DIDF financing will be submitted annually to MAFS, where requests will be assessed according to
economic viability and other criteria (Table 5-3).
All LGAs will continue to receive the small basic allocations for agricultural extension and
a small DADG but increased level of funding at LGA level depend on the LGA to fulfil some basic
performance criteria, that will be assessed as part of the annual LGCDG assessment exercise.
56 URT, ASDP, Guidelines for District Agricultural Development Planning and Implementation (draft) June 2006.
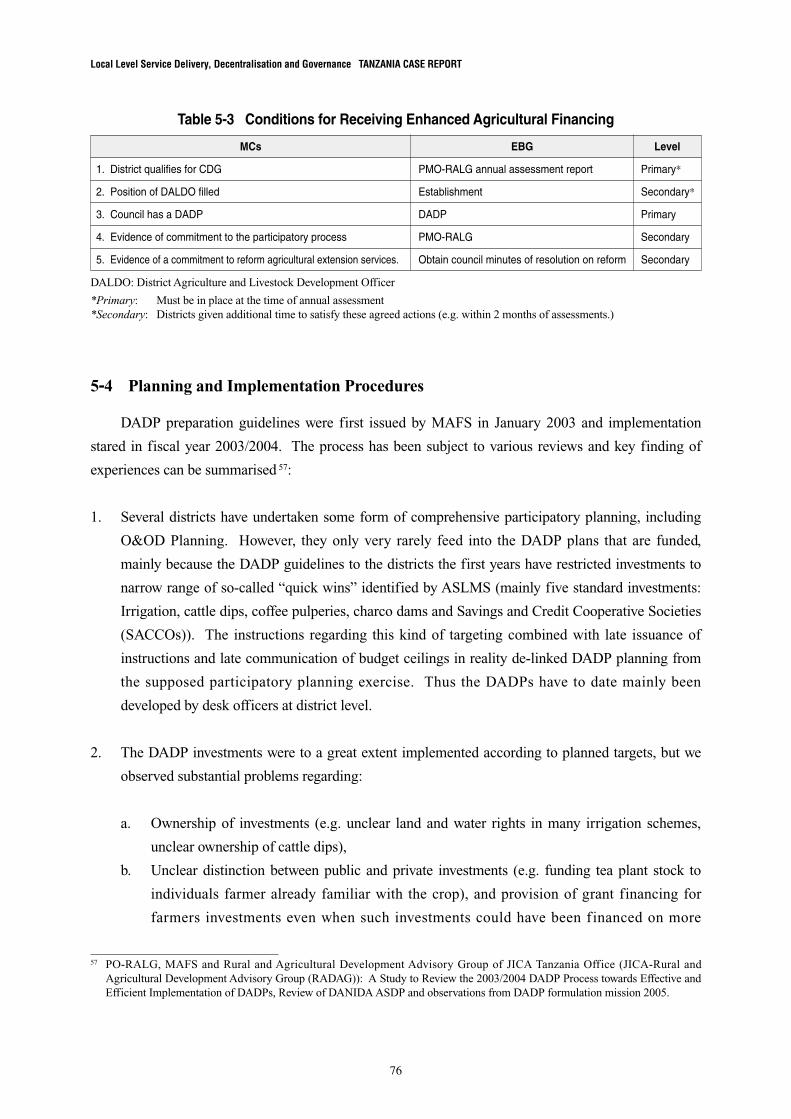
Local Level Service Delivery, Decentralisation and Governance TANZANIA CASE REPORT
76
5-4 Planning and Implementation Procedures
DADP preparation guidelines were first issued by MAFS in January 2003 and implementation
stared in fiscal year 2003/2004. The process has been subject to various reviews and key finding of
experiences can be summarised 57:
1. Several districts have undertaken some form of comprehensive participatory planning, including
O&OD Planning. However, they only very rarely feed into the DADP plans that are funded,
mainly because the DADP guidelines to the districts the first years have restricted investments to
narrow range of so-called “quick wins” identified by ASLMS (mainly five standard investments:
Irrigation, cattle dips, coffee pulperies, charco dams and Savings and Credit Cooperative Societies
(SACCOs)). The instructions regarding this kind of targeting combined with late issuance of
instructions and late communication of budget ceilings in reality de-linked DADP planning from
the supposed participatory planning exercise. Thus the DADPs have to date mainly been
developed by desk officers at district level.
2. The DADP investments were to a great extent implemented according to planned targets, but we
observed substantial problems regarding:
a. Ownership of investments (e.g. unclear land and water rights in many irrigation schemes,
unclear ownership of cattle dips),
b. Unclear distinction between public and private investments (e.g. funding tea plant stock to
individuals farmer already familiar with the crop), and provision of grant financing for
farmers investments even when such investments could have been financed on more
MCs EBG Level
Table 5-3 Conditions for Receiving Enhanced Agricultural Financing
1. District qualifies for CDG
2. Position of DALDO filled
3. Council has a DADP
4. Evidence of commitment to the participatory process
5. Evidence of a commitment to reform agricultural extension services.
PMO-RALG annual assessment report
Establishment
DADP
PMO-RALG
Obtain council minutes of resolution on reform
Primary*
Secondary*
Primary
Secondary
Secondary
DALDO: District Agriculture and Livestock Development Officer
*Primary: Must be in place at the time of annual assessment*Secondary: Districts given additional time to satisfy these agreed actions (e.g. within 2 months of assessments.)
57 PO-RALG, MAFS and Rural and Agricultural Development Advisory Group of JICA Tanzania Office (JICA-Rural and Agricultural Development Advisory Group (RADAG)): A Study to Review the 2003/2004 DADP Process towards Effective and Efficient Implementation of DADPs, Review of DANIDA ASDP and observations from DADP formulation mission 2005.
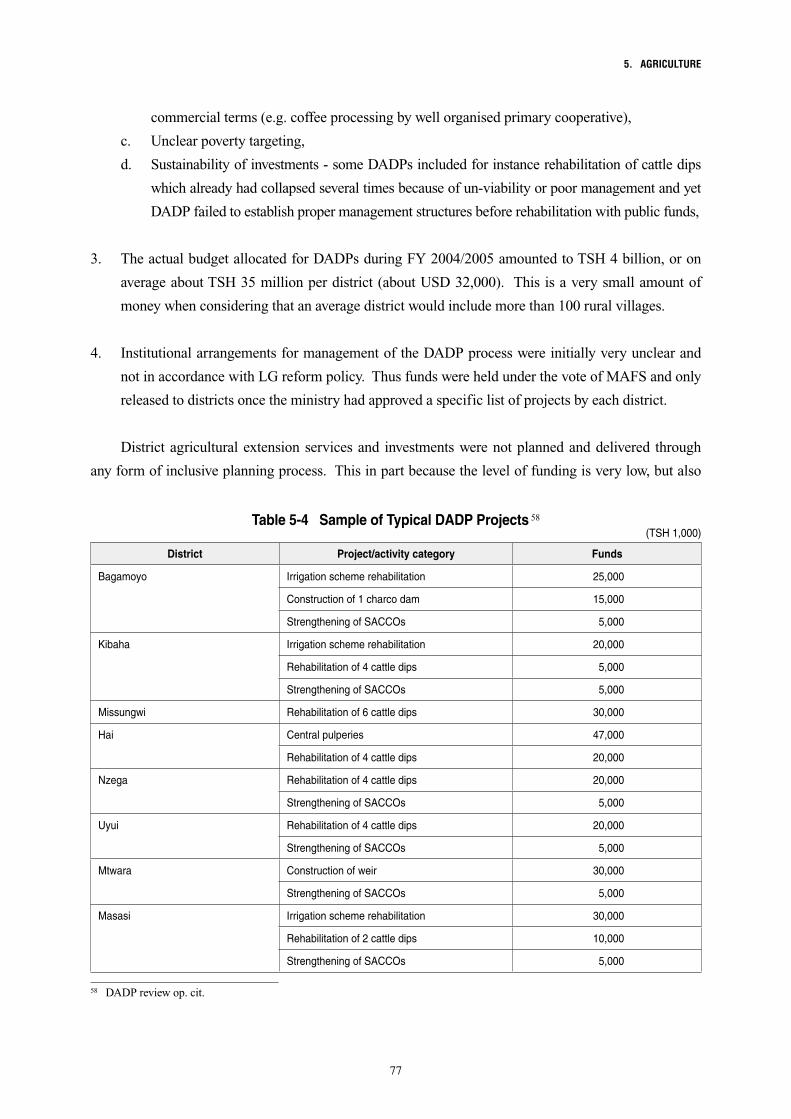
5. AGRICULTURE
77
Table 5-4 Sample of Typical DADP Projects 58
(TSH 1,000)
District Project/activity category Funds
Bagamoyo Irrigation scheme rehabilitation 25,000
Construction of 1 charco dam 15,000
Strengthening of SACCOs 5,000
Kibaha Irrigation scheme rehabilitation 20,000
Rehabilitation of 4 cattle dips 5,000
Strengthening of SACCOs 5,000
Missungwi Rehabilitation of 6 cattle dips 30,000
Hai Central pulperies 47,000
Rehabilitation of 4 cattle dips 20,000
Nzega Rehabilitation of 4 cattle dips 20,000
Strengthening of SACCOs 5,000
Uyui Rehabilitation of 4 cattle dips 20,000
Strengthening of SACCOs 5,000
Mtwara Construction of weir 30,000
Strengthening of SACCOs 5,000
Masasi Irrigation scheme rehabilitation 30,000
Rehabilitation of 2 cattle dips 10,000
Strengthening of SACCOs 5,000
commercial terms (e.g. coffee processing by well organised primary cooperative),
c. Unclear poverty targeting,
d. Sustainability of investments - some DADPs included for instance rehabilitation of cattle dips
which already had collapsed several times because of un-viability or poor management and yet
DADP failed to establish proper management structures before rehabilitation with public funds,
3. The actual budget allocated for DADPs during FY 2004/2005 amounted to TSH 4 billion, or on
average about TSH 35 million per district (about USD 32,000). This is a very small amount of
money when considering that an average district would include more than 100 rural villages.
4. Institutional arrangements for management of the DADP process were initially very unclear and
not in accordance with LG reform policy. Thus funds were held under the vote of MAFS and only
released to districts once the ministry had approved a specific list of projects by each district.
District agricultural extension services and investments were not planned and delivered through
any form of inclusive planning process. This in part because the level of funding is very low, but also
58 DADP review op. cit.
Local Level Service Delivery, Decentralisation and Governance TANZANIA CASE REPORT
78
more fundamentally because no efforts have been made effectively to include local councils and farmer
groups in decision of the overall extension budget.
5-5 HR Issues
5-5-1 Distribution and Financing of Extension Staff
At the onset of the LG reform programme agriculture extension staff were transferred from MAFS
to LGAs, but the process is often described as having been done hurriedly” or unsystematically. Data
on extension staff in the districts appear highly unreliable and different sources quote different
figures 59. However approximate 6,000 are considered a reliable estimate of extension staffs employed
by districts - slightly less than one for every 2 villages.
From a cursory review of the central government allocations of agriculture extension staff salaries,
it is clear that the existing allocations are unrelated to needs and for instance skewed in favor of urban
areas rather than rural LGAs. While such discrepancies in allocations are found in other sectors
(including health and education) then these are much more marked in the agricultural sector. Several
urban LGs at present receive more funding for agricultural extension than rural districts!
An Agriculture Block Grant team has been established with representation from ASLMs, LGRP
and MoF. The team has worked on determination of what would be an appropriate formula for
distribution of available resources among LGAs. The appropriate formula for the sector has been
determined as:
• Villages60%
• Ruralpopulation20%
• Rainfall20%
This formula will gradually be phased in for allocation of fiscal resources in LGAs for staff
salaries and OC for agricultural extension. However, as explained in Chapter 2, it was in the beginning
of the fiscal reforms decided to hold LGA “harmless” - i.e. no LGA should have their allocations
reduced but instead gradually phase in the formula as the overall resource envelope increases.
However, the application of the formula in the agriculture sector will lead to a radical different
allocation of resources across LGAs. See Annex 2 for details: some LGAs will require a ten doubling
of funding and other a 90 % decrease if funding if financial resources for all extension staff salaries and
59 See for instance the comparisons in MAFS: 2003: “Institutional Arrangements and Capacity Assessment of Public Sector Agricultural Extension in Tanzania” A Consultancy report by Faustin Maganga and E Jagga.
5. AGRICULTURE
79
OC in the sector were allocated according to the agreed transparent formula rather than based on past
historical allocations.
It seems necessary to reconsider the decision of holding “harmless” for the agriculture sector and
instead undertake a central government directed reallocation of staff across LGAs, which will be more
responsive to the needs and subsequently use that as basis for later locally managed staff restructuring.
It should be noted that the introduction of formula-based allocations will imply that possible future
LGA retrenchment exercises will increase locally available funding for services, rather than as present
simply lead to reductions in PE budget allocations. Thus the LG fiscal reforms open up for new
opportunities for funding activities envisaged under ASDP.
5-5-2 LGA Staff Restructuring
Within the ASDP it is envisaged that the extension system will in part be privatised and this for
instance is reflected in a Memorandum of Agreement that CG/ASDP and LGAs sign regarding
commitment on “Agricultural Reform”. While the practical modalities still are to be fully decided upon,
it should be observed that the previous discussions on reform of the extension system reflected in the
Agricultural Sector Support Programme (ASSP) foresaw substantial changes and staff reductions of the
public extension systems within LGAs.
A general non sector specific restructuring exercise has in the meantime been ongoing in all
LGAs starting with 38 LGAs in phase I of the LGRP in 2000 and now covering all LGAs. This
exercise has also included the agriculture sector but not been clearly linked to the Vision of ASDP
regarding a more privatised extension system 60.
As with other partially decentralised staff, the level of local accountability of agricultural
extension staff to district, ward and village councillors is very limited and we found several complaints
in the field.
District council chairman view on agricultural extension staff:
They are all corrupt - they are the most corrupt of all staff employed in my district. They have
been around for 20 years and built their networks and know how to get money out of the system.
I have no idea of what they are doing - funding is not going to the villages as supposed. I hear that
some staff are on the payroll - yet they live in other districts and I don’t see them here. There is
nothing I can do (Moshi district council chairman - observations on agriculture sector).
60 See LGRP Restructuring Manual and organisation structures of reorganised LGAs. See also discussion of Restructuring exercise in Steffensen, Tidemand and Mwaipopo 2004 op. cit. Chapter 5.
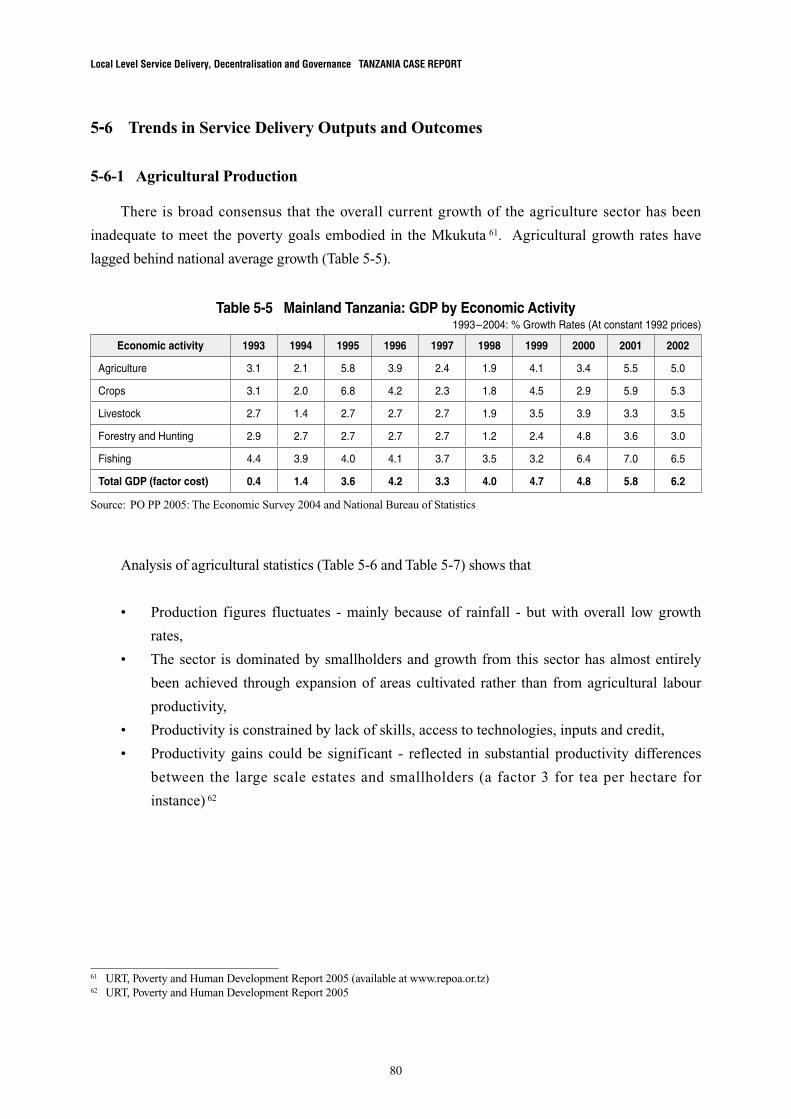
Local Level Service Delivery, Decentralisation and Governance TANZANIA CASE REPORT
80
5-6 Trends in Service Delivery Outputs and Outcomes
5-6-1 Agricultural Production
There is broad consensus that the overall current growth of the agriculture sector has been
inadequate to meet the poverty goals embodied in the Mkukuta 61. Agricultural growth rates have
lagged behind national average growth (Table 5-5).
Analysis of agricultural statistics (Table 5-6 and Table 5-7) shows that
• Production figures fluctuates -mainlybecause of rainfall - butwithoverall lowgrowth
rates,
• Thesector isdominatedbysmallholdersandgrowthfromthissectorhasalmostentirely
been achieved through expansion of areas cultivated rather than from agricultural labour
productivity,
• Productivityisconstrainedbylackofskills,accesstotechnologies,inputsandcredit,
• Productivity gains couldbe significant - reflected in substantial productivity differences
between the large scale estates and smallholders (a factor 3 for tea per hectare for
instance) 62
Table 5-5 Mainland Tanzania: GDP by Economic Activity1993–2004: % Growth Rates (At constant 1992 prices)
Economic activity 1993 1994 1995 1996 1997 1998 1999 2000 2001 2002
Agriculture 3.1 2.1 5.8 3.9 2.4 1.9 4.1 3.4 5.5 5.0
Crops 3.1 2.0 6.8 4.2 2.3 1.8 4.5 2.9 5.9 5.3
Livestock 2.7 1.4 2.7 2.7 2.7 1.9 3.5 3.9 3.3 3.5
Forestry and Hunting 2.9 2.7 2.7 2.7 2.7 1.2 2.4 4.8 3.6 3.0
Fishing 4.4 3.9 4.0 4.1 3.7 3.5 3.2 6.4 7.0 6.5
Total GDP (factor cost) 0.4 1.4 3.6 4.2 3.3 4.0 4.7 4.8 5.8 6.2
Source: PO PP 2005: The Economic Survey 2004 and National Bureau of Statistics
61 URT, Poverty and Human Development Report 2005 (available at www.repoa.or.tz)62 URT, Poverty and Human Development Report 2005
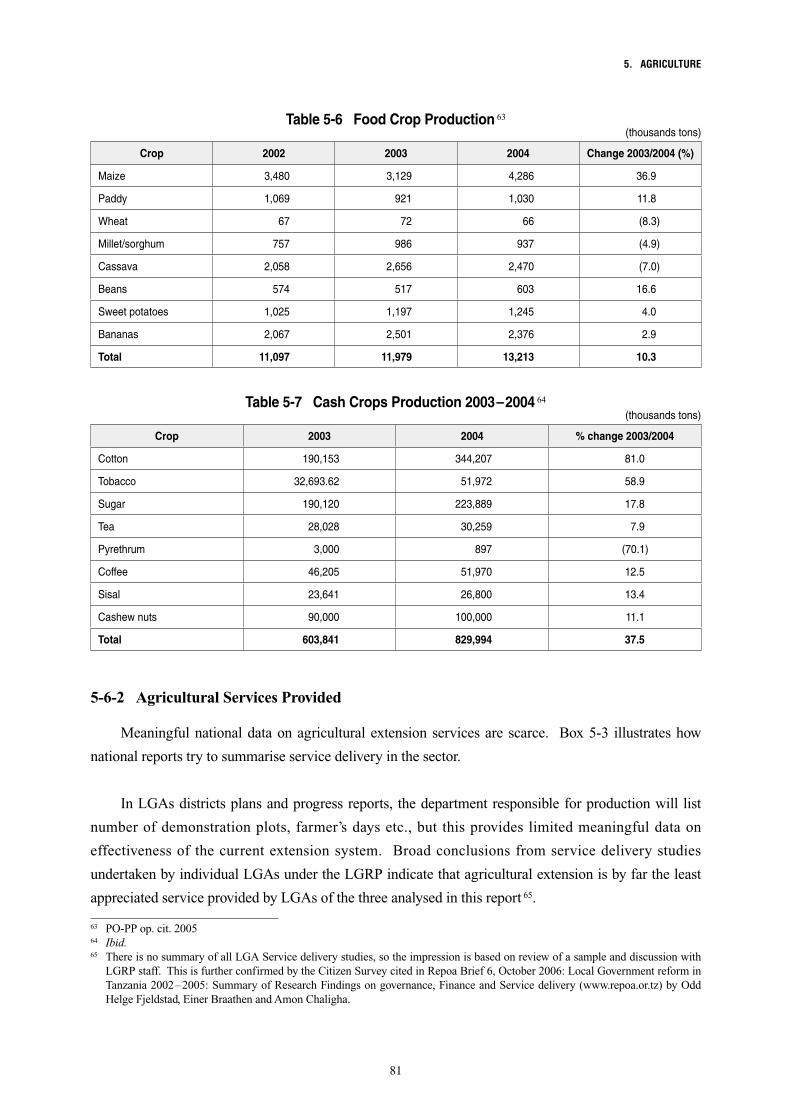
5. AGRICULTURE
81
Table 5-6 Food Crop Production 63
(thousands tons)
Crop 2002 2003 2004 Change 2003/2004 (%)
Maize 3,480 3,129 4,286 36.9
Paddy 1,069 921 1,030 11.8
Wheat 67 72 66 (8.3)
Millet/sorghum 757 986 937 (4.9)
Cassava 2,058 2,656 2,470 (7.0)
Beans 574 517 603 16.6
Sweet potatoes 1,025 1,197 1,245 4.0
Bananas 2,067 2,501 2,376 2.9
Total 11,097 11,979 13,213 10.3
Table 5-7 Cash Crops Production 2003–2004 64
(thousands tons)
Crop 2003 2004 % change 2003/2004
Cotton 190,153 344,207 81.0
Tobacco 32,693.62 51,972 58.9
Sugar 190,120 223,889 17.8
Tea 28,028 30,259 7.9
Pyrethrum 3,000 897 (70.1)
Coffee 46,205 51,970 12.5
Sisal 23,641 26,800 13.4
Cashew nuts 90,000 100,000 11.1
Total 603,841 829,994 37.5
5-6-2 Agricultural Services Provided
Meaningful national data on agricultural extension services are scarce. Box 5-3 illustrates how
national reports try to summarise service delivery in the sector.
In LGAs districts plans and progress reports, the department responsible for production will list
number of demonstration plots, farmer’s days etc., but this provides limited meaningful data on
effectiveness of the current extension system. Broad conclusions from service delivery studies
undertaken by individual LGAs under the LGRP indicate that agricultural extension is by far the least
appreciated service provided by LGAs of the three analysed in this report 65.
63 PO-PP op. cit. 200564 Ibid.65 There is no summary of all LGA Service delivery studies, so the impression is based on review of a sample and discussion with
LGRP staff. This is further confirmed by the Citizen Survey cited in Repoa Brief 6, October 2006: Local Government reform in Tanzania 2002–2005: Summary of Research Findings on governance, Finance and Service delivery (www.repoa.or.tz) by Odd Helge Fjeldstad, Einer Braathen and Amon Chaligha.
Local Level Service Delivery, Decentralisation and Governance TANZANIA CASE REPORT
82
Evaluations of pilots for using community-based grass root institutions to run demand-driven and
participatory extension systems, including Farmer Field Schools (FFS) indicate that these approaches
are more promising than the existing mainstream public extension system (Box 5-4). And based on
these experiences, it is expected to undertake reform of the entire national system for agricultural
service provision 66.
Box 5-3 Report on Agricultural Extension Achievements
In 2004, agriculture and livestock training was strengthened by improving curriculum in order to meet real demand of stakeholders. Training in paddy irrigation practices was offered to 160 farmers. Government scholarships were offered for 400 trainees at diploma level, 3 for first degree and 4 for masters. Moreover, 58 farmers (38 males, 20 females) were given on-farm training, and 1,193 farmers were trained on demonstration sites (657 male, 536 female). In addition, 9 tutors’ houses, 5 dormitories and trainers’ offices were rehabilitated.
In 2004, a total of 1,271 livestock keepers were trained in improved animal husbandry at Buhuri, Madaba, Mpwapwa, Morogoro and Tengeru training institutes. Inspection of meat, and hides and skins was also strengthened and conducted in Dar es Salaam, Mwanza, Dodoma, Mbeya, Kilimanjaro, Arusha, Morogoro and Iringa. In addition, 120 meat, and hides and skins inspectors were trained in Central and Northern Zones. Moreover, 89 Mpwapwa bulls were distributed to Manyoni (16), Mpwapwa (4), Kiteto (6), Ngorongoro (32) and Longido (31) centres.
Presidents Office, Planning and Privatisation June 2005, The Economic Survey
http://www.tanzania.go.tz/economicsurveyf.html
66 The above summary/box is from ASSP op. cit. - adapted from URT/National Agricultural Extension Project (NAEP) II: Lessons from Experiences of NAEP II Micro-projects. Report prepared by NAEP II Team with the assistance of H.B. Lunogelo; Final Draft - February 2004.
5. AGRICULTURE
83
Box 5-4 Review of Pilot Activities Under NAEP II
Thirty-five pilots were facilitated by the NAEP II. The pilot initiatives were designed to test modalities to improve agricultural extension service provision to communities, ranging from training and technical advice, to linking with input/output marketing services. Pilots involved different farm enterprises, such as crop, livestock, agro-forestry, beekeeping and aquaculture. They were designed with the participation of communities and other stakeholders. Typically, communities demanded for extension services, which were sourced from government agents, community trained extension advisers or Farmer Motivators (FAMOs).
In order to increase the interaction between advisors and farmers, the initiatives combined the use of group approaches and training of FAMOs. The establishment of FFSs in a number of pilots gave opportunities to enhance group actions and in-the-field learning, where members shared the associated costs. It also provided a ground for training FAMOs, whose services were highly appreciated by fellow farmers. Besides learning integrated approaches to profitable farming, farmers had the chance to learn-by-doing such skills as artificial insemination, poultry vaccination, pasture management, post-harvest handling, soil and water management, use of animal draught power, water harvesting and irrigation, home economics and human health. These practices reportedly contributed to increased yields, with optimal returns attained when applied in an integrated manner and where markets were available for the produce.
The pilots showed that, if well prepared, community-based institutions can be important players in effective extension service delivery. It was also found that various stakeholders regard FFS as a promising, cost effective method for client-oriented extension services, which responds to their demands, empowers them through group training and participation, and provides effective links between farmers, research and extension.
The review of NAEP II Pilots suggest that several have potential for up-scaling; providing however that some cautionary measures be taken:
•Adequatetimemustbeallowedforthegrassrootsinstitutionstointernalisetheirrolesandgainexperienceascapacity building takes its course;
•LGAsshouldrecognisetheroleofprivatesector,NGOsandCBOsinserviceprovision,andtakeaproactiverole in their CB; follow-up monitoring and backstopping of service providers.
•LGAsmust complement communityeffortswith improvingpublicgoodsandservices (e.g. roadnetworks,storage facilities and marketing systems, schools and health facilities).
The financial ability of most LGAs to support mainstream extension services is limited. Therefore, grassroots institutions should also contribute from their own resources if these new initiatives are to be sustained. This includes rewarding FAMOs for their services and sharing the costs of running FFS. Savings mobilisation and building of grassroots micro-finance institutions is critical for the sustainability of community-based initiatives, as is the careful selection of high value and marketable produce.
Local Level Service Delivery, Decentralisation and Governance TANZANIA CASE REPORT
84
5-7 Impact of Decentralisation
Agriculture sector reforms aim for decentralisation of significant elements of the ASDP through
districts and LGAs, however this is yet to be fully reflected in effective reform implementation. The
following discussion will therefore in part discuss reform intentions addition to the practices to date.
5-7-1 Transparency and Equity
Previous years allocation of government funding to LGAs for the agricultural sector has been
rather untransparent and unequal. Most of the funding has been for extension staff PEs and OC and
based on centrally available information regarding the number of staff employed in each LGA, rather
than some objective criteria. This has led to very unequal resource allocation where several urban
LGAs receive higher level of funding than rural LGAs (Annex 2).
Development funding for the DADPs has from government initially been allocated on an equal
share basis (same amount to all districts) rather than adjusted according to size of LGA, population or
other need criteria. The majority of development funding has to date been transferred to districts from
donors who have focused on selected district. This in turn has led to significant variation of funding
across the country.
The future implementation of the ASDP seeks to address the above through transparent formula-
based allocation of resources.
5-7-2 Participation and Accountability
Lessons on citizen and farmer participation are mainly derived from donor-supported projects 67
where farmer’s involvements in e.g. FFS have proved promising, but where lessons yet are to be
generated regarding other elements of future reform - in particular regarding farmer contracting of
service providers.
Village level participation in planning for investments relevant to agriculture sector developments
were promising in project interventions but appear to have been only marginal in planning for
government funded DADPs to date. This will be addressed in future ASDP interventions.
67 E.g. DANIDA Agricultural Sector Programme Support (ASPS) and Participatory Agricultural Development and Empowerment Project (PADEP) (see various review reports)

5. AGRICULTURE
85
The decentralisation of agricultural extension staff to LGAs, which was affected in 1998–2000,68
sought to enhance local accountability of staff to LGs and thus communities. The transfer of staff was
however not accompanied by any substantial support or redeployment of staff, which from the onset of
reform was considered distributed in a very unequal manner across districts 69.
During our fieldwork - in particularly in Moshi - district councillors complained bitterly of the
performance of especially agriculture sector staffs that were charged as corrupt and absconding from work.
The council felt unable to discipline staff even when some extension staff stayed permanently out of the
district and rarely reported at work. The complaints by the council is also supported by the high numbers
of complaints from the public regarding corruption, where the agriculture sector feature prominently.
However, accountability of agricultural extension staff to the LGs has not been sought strengthened
by the sector. It is felt to be outside the responsibility of MAFS. Instead the sector now seeks several
other very different kinds of accountability enhanced. The most novel, and probably risky, is the
arrangement for public financed, but privately provided services as illustrated in Table 5-8.
Table 5-8 Accountability Arrangements for Different Financing and Provision Mechanisms
Fin
an
cin
g
DADG
Private Public (LG)
Pri
va
te
Market: Farmers buy services and investments from private sector providers – choose providers in competitive market.
Banks and other financial institutions provide capital for farmer investments. Companies provide input/extension packages to farmers (e.g. tobacco).
User fees:
Clients pay (part of) service from public providers. Clients have a (limited) choice in selection of provider.
Pu
bli
c
Outsourcing – private companies provide e.g. extension services (competition among companies mainly controlled by LGs).
“Client sponsorship” – private groups receiving public funds and procure services on competitive market (may include public providers) = ASDP model.
Taxes & democracy:
Citizens (farmers) pay taxes and demand services from LGAs.
Extension staffs etc. are accountable to elected councillors (village, ward and district level) who can hire and fire as well as approve budgets and work plans of extension staff etc.
68 MAFS: Decentralisation of Agricultural Extension Services - Ministerial Presentation Agriculture sector Stakeholders Bunge Hall Dodoma 23–24 March 2001.
69 Ibid. p. 12.

Local Level Service Delivery, Decentralisation and Governance TANZANIA CASE REPORT
86
5-7-3 Service Delivery and Efficiency
Data on service delivery and efficiencies are not available in a form that allows discussion of
trends over time. However, several service delivery analyses have indicated substantive dissatisfaction
with the services provided by the public extension system 70. Extension staff employed in LGAs on the
other hand complains about lack of financial resources. The reduction in public extension service
budgets occurred simultaneously with the decentralisation of staff to LGAs and some sector staff
expressed therefore a yearning for the good old days when the service was centralised. New technical
approaches to the organisation of extension services with more emphasis on FFS (and linkages to
research) have been undertaken in Tanzania on a pilot basis and overall considered as positive, but the
evaluations does not allow for conclusion regarding cost efficiencies and remain to be up scaled under
the future ASDP programme interventions.
5-8 Key Lessons and Challenges
District agricultural extension services and investments are not yet planned and delivered in an
integrated manner that ensures local accountability to locally elected councillors and villages - nor
farmers. Planning has among many LGAs over the years largely been implemented through discrete
donor interventions and central government programmes. It is acknowledged that there are substantial
opportunities to improve the transparency and ways in which DADPs and donor funded projects are
designed in order to offer more room for local discretion and accountability. Furthermore it is
recognized that the present project modalities for supporting district level activities lead to unequal and
non-transparent distribution of resources among districts as well as high transaction costs for both
central and local governments. Therefore, and in line with ASDP, it is acknowledged that there is
a need for donors to work together with government in formulating and delivering a consolidated
programme of support to the DADPs. This form of donor support to DADPs will be provided through
the single ASDP basket fund in joint cooperation among government and development partners.
Through the limited decentralisation of development funds (DADP) and various project
interventions a number of useful and promising lessons have been learned regarding:
• PlanningofinvestmentsthroughVillageAgriculturalDevelopmentPlans(PADEP,DANIDA
etc.), where critical issues have been how to ensure clear ownership and sustainability of
investments and how to link agricultural planning with normal (O&OD) planning
approaches,
70 LGRP Service delivery Surveys undertaken as part of the LGA Restructuring exercise - surveys are carried out for individual LGAs but agriculture sector service delivery is consistently scored lower than other sectors - particularly education and health in these surveys.
5. AGRICULTURE
87
• Organisationofextensionservicesbasedonfarmersgroups(FFS)andlinkingextensionto
research (Eastern Zone Client-Oriented Research and Extension Project (EZCORE))
The ASDP basket is only really becoming effective this financial year and lessons remain yet to be
generated on a number of critical aspects, including:
• Howinpracticetoinitiatethereformoftheextensionsystemthroughagradualprivatisation
and farmer empowerment where public funding is to be provided to the farmers groups in an
integrated manner through the existing agricultural AEBG system,
• An initial stageof theaboveprocesswillbe toaddress theveryunequal allocationof
agricultural extension staff across districts by a central government redeployment - the basic
formula-based AEBG can otherwise not be effected.
• Howtoenhancedistrictagriculturalplanningtobemorestrategicinoutlook:addressingthe
local regulatory framework, restructuring its own public extension system and plan for
infrastructure development and in a manner that facilitates agricultural development,
• How toensure that the integrationof agriculturaldevelopment funding into theLGCDG
system provides effective incentives to LGs for improvement of the sector performance. If
the guidelines are relevant and clear to LGs and if the assessment team can assess LGs
performance in a transparent manner, then the system will enhance LGs adherence to
agricultural sector policies and overall improvements in the sector. However, there is also
a risk that the assessment becomes superficial or corrupted.
• How toprovideLGswith support andcapacitybuilding inaneffectivemanner. There is
a risk for complicating messages. In Uganda it was reported that facilitators themselves did
not understand the rationale for some of the approaches under National Agricultural
Advisary Seruices (NAADS) and in the development of some of the initial guidelines for
ASDP it also appeared as if a very ideal rather than practical approach to planning was
advocated. It has in principle been decided to provide support to LGs in the form of an
enhanced CB grant. This will require very significant work by MAFS to ensure that training
providers and training material is available for procurement by the LGs, otherwise funding
for the CBG is unlikely to make an impact.

Local Level Service Delivery, Decentralisation and Governance TANZANIA CASE REPORT
88
6. CONCLUSION
The decentralisation reforms in Tanzania must be understood as part of a broader governance reform
towards economic and political liberalisation. The decentralisation reforms are in Tanzania often
discussed narrowly as “LGRP” led by a reform team within PMO-RALG, but include in fact also much
wider and bigger (in terms of financing) sector reforms where decentralisation of service delivery
arrangement is but one component of wider sector reforms and service delivery programmes. Within
these sector reforms decentralisation is interpreted differently from what is the official LG reform policy,
where emphasis is on “decentralisation by devolution” whereas sector reforms in to a larger extent
emphasize decentralisation to user groups or outright privatisation. Finally it should be noted that the
intended “decentralisation by devolution” in Tanzania to date only has been partially implemented. This
complicates efforts of establishing simple cause-effect relationships between specific reform elements and
“impact”. Nevertheless, with these caveats, we seek below to summarise the status of the general
decentralisation reforms, the impact of decentralisation on governance and service delivery, related key
challenges and opportunities for future external support to decentralisation reforms.
6-1 Overall Progress and Challenges with LG Reforms
Recent implementation of the LG and decentralisation reforms can note the following key
achievements and challenges.
6-1-1 Policy Development
The local government reform policy outlines a very clear ambition of substantial “decentralisation
by devolution”. While the LGRP has sought to build further inclusive commitment among the different
stakeholders to this policy, then it has not yet been possible to progress very fundamentally with
a stronger policy and legal articulation of this commitment in e.g. a constitutional amendment or
substantive review of LG legislation. On the contrary it can be argued that the current proposed
amendment to the LG laws will undermine the policy ambition of decentralisation by devolution. The
legal framework for LG personnel management has in a similar way not progressed in accordance with
the LG reform ambitions. While the degree of LGA autonomy thus is debated, there is still broad
consensus on the basic intentions regarding having LGAs as key responsible for service provision of
most basic services including education, health and agriculture.
6-1-2 LG Finance
Substantial progress has been made in 2 key areas.

6. CONCLUSION
89
1. The development of a system for formula-based allocation of fiscal transfers for recurrent expenses.
This system provides for a more transparent and equitable distribution of central government
transfers from central government to LGAs for PE and OC. In principle it will also allow LGAs
more discretion in local expenditure decisions, although that would require reforms of the way
personnel and personnel budgeting is managed. Furthermore it is realised that phasing in of formula
for especially agriculture will require a special efforts because the existing allocations are so different
from what would be the outcome of practical implementation of the formula.
2. The introduction of the LGCDG systems for fiscal transfers of development funding to LGAs;
this provides for a much more equitable and transparent allocation of resources to LGAs. It
enables LGAs to plan and budget cross sectorally. The system provides incentives to LGAs for
a compliance with a range of good governance practices including proper financial management,
participatory planning etc. government and development partners have furthermore started to
integrate various sector and project funding into the LGCDG.
In addition financial management procedures and reporting has improved although still a lot is to
be done.
LGA own revenue has declined, but LGAs have been compensated and appears still to be able to
adjust income at the margin. However it is realised that LGA own taxes need to be enhanced further not
least to ensure a basic degree of LGA autonomy and local accountability of LGAs to their taxpayers.
6-1-3 HR
The legal framework for personnel management at LGA is unclear regarding the degree of LGA
autonomy in staff management and the lines of accountability: are staff truly employees of LGAs or
CG? In principle all staff (except the director) are appointed and employed by LGAs, but in reality key
staff including finance staff are often transferred across LGAs by central government, just as CG has
taken responsibility for recruitment/deployment of health and teaching staff.
Another significant problem with HRM at LGA level is how to attract and retain key qualified staff - in
particular in remote and marginalised areas. Proposals regarding having elements of location allowances
or other incentives such as SASE for LGA staff have not been developed or implemented to date 71.
Some of the achievements recorded in later years include:
71 Interview with Dr. Ted Valentine, PO-PSM Consultant on pay reform issues and design of SASE. See also the reports on SASE in LGAs and report on staffing problems in LGAs by Valentine and Tidemand 2005.
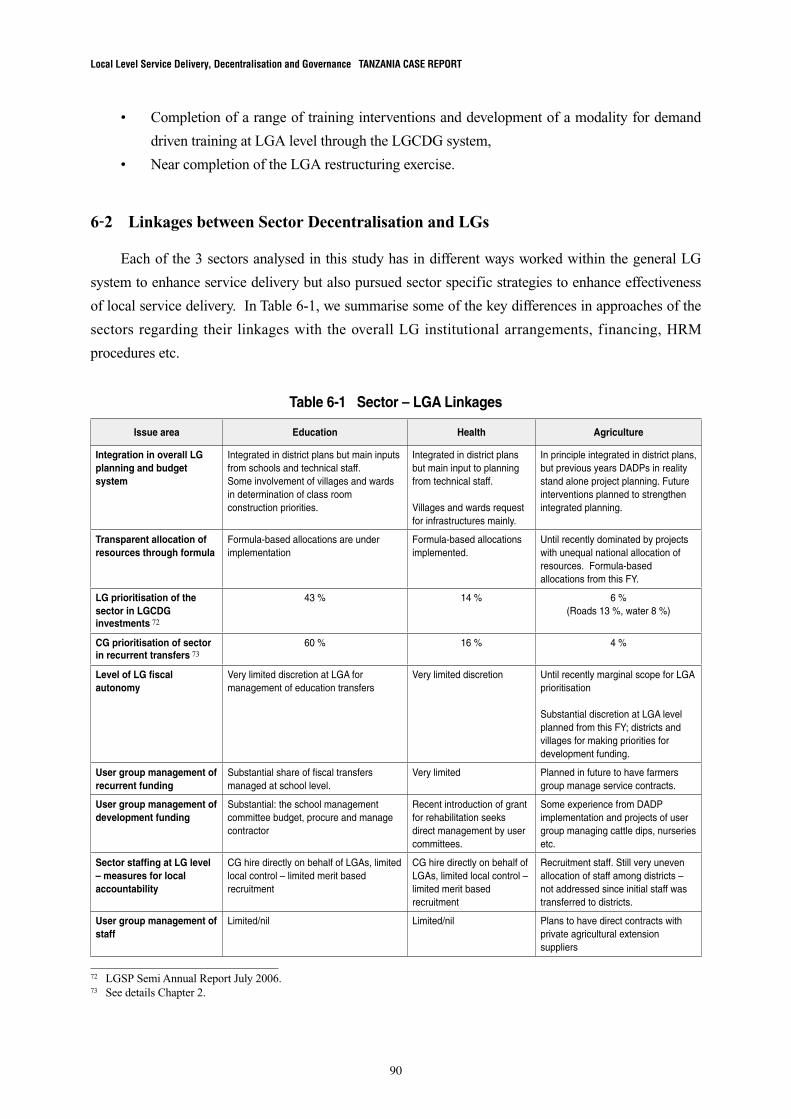
Local Level Service Delivery, Decentralisation and Governance TANZANIA CASE REPORT
90
• Completionofarangeoftraininginterventionsanddevelopmentofamodalityfordemand
driven training at LGA level through the LGCDG system,
• NearcompletionoftheLGArestructuringexercise.
6-2 Linkages between Sector Decentralisation and LGs
Each of the 3 sectors analysed in this study has in different ways worked within the general LG
system to enhance service delivery but also pursued sector specific strategies to enhance effectiveness
of local service delivery. In Table 6-1, we summarise some of the key differences in approaches of the
sectors regarding their linkages with the overall LG institutional arrangements, financing, HRM
procedures etc.
Table 6-1 Sector – LGA Linkages
Issue area Education Health Agriculture
Integration in overall LG planning and budget system
Integrated in district plans but main inputs from schools and technical staff.Some involvement of villages and wards in determination of class room construction priorities.
Integrated in district plans but main input to planning from technical staff.
Villages and wards request for infrastructures mainly.
In principle integrated in district plans, but previous years DADPs in reality stand alone project planning. Future interventions planned to strengthen integrated planning.
Transparent allocation of resources through formula
Formula-based allocations are under implementation
Formula-based allocations implemented.
Until recently dominated by projects with unequal national allocation of resources. Formula-based allocations from this FY.
LG prioritisation of the sector in LGCDG investments 72
43 % 14 % 6 %(Roads 13 %, water 8 %)
CG prioritisation of sector in recurrent transfers 73
60 % 16 % 4 %
Level of LG fiscal autonomy
Very limited discretion at LGA for management of education transfers
Very limited discretion Until recently marginal scope for LGA prioritisation
Substantial discretion at LGA level planned from this FY; districts and villages for making priorities for development funding.
User group management of recurrent funding
Substantial share of fiscal transfers managed at school level.
Very limited Planned in future to have farmers group manage service contracts.
User group management of development funding
Substantial: the school management committee budget, procure and manage contractor
Recent introduction of grant for rehabilitation seeks direct management by user committees.
Some experience from DADP implementation and projects of user group managing cattle dips, nurseries etc.
Sector staffing at LG level – measures for local accountability
CG hire directly on behalf of LGAs, limited local control – limited merit based recruitment
CG hire directly on behalf of LGAs, limited local control – limited merit based recruitment
Recruitment staff. Still very uneven allocation of staff among districts – not addressed since initial staff was transferred to districts.
User group management of staff
Limited/nil Limited/nil Plans to have direct contracts with private agricultural extension suppliers
72 LGSP Semi Annual Report July 2006.73 See details Chapter 2.
6. CONCLUSION
91
Some of the noticeable features that stand out are:
• Allsectorsseekintegrationintotheoveralldistrictplanandbudget,butsectorsdonottothe
same extent integrate the lower level LG system in budget prioritisations,
• All sectorshavenowstarted implementinga formula-based system for allocationof
resources to districts - however, for agriculture there is a significant difference between the
historical allocations and the formula - thus it is not possible gradually to phase the formula
in - a more drastic redeployment of the staff across districts is required,
• TheCGandLGsectorprioritiesinbudgetsarefairlysimilarwithstrongestemphasisonthe
education sector and least emphasis on agriculture; although this emphasis is more
pronounced at CG than LG levels.
• Allsectortransfersarequiteearmarked-withlimiteddiscretionlefttoLGAs,
• Inparticular educationhavedecentralisedmanagementofbothdevelopmentand recurrent
funding to user groups, the agriculture sector will under reforms follow suit, but health sector
have not yet in a similar way pursued this strategy.
6-3 Impact of (Sector) Decentralisation on Governance
As evident from Table 6-1 and the discussion in this report, the 3 sectors we have analysed interact
in very different ways with the local governments. Although all sectors are operating broadly in
adherence to the Local Government Reform Policy, Constitution and LG Act, they also aim in various
ways to enhance the sector specific policies and strategies.
The impact of the sector specific efforts for decentralisation on governance has in a broad sense
been positive regarding enhancing citizens participation in planning and delivery of services through
sector specific user groups but negative regarding enhancing citizen participation in cross sector
planning and budgeting through their district and village councils.
Only the LGCDG provides incentives for broader governance issues such as cross-sectoral
planning, broad based citizen participation, general LG accountability, whereas the earmarked grants in
the three sectors and their focus on up-wards accountability to the central government rather than
downwards to the citizens, have tended to undermine LG autonomy and involvement of citizens in
decision-making and supervision. The governance impact of the sector decentralisation reforms in
selected thematic areas is summarised following.
Local Level Service Delivery, Decentralisation and Governance TANZANIA CASE REPORT
92
6-3-1 Impact on Transparency and Equity
Transparency in allocation of financial resources
Broadly speaking all sectors have recently strived at distributing fiscal resources in a transparent
manner through formula-based allocations across local governments. Especially for the health and
education sectors the bulk of funding is now provided through formula-based grants to districts. For
the agricultural sector, such transparent formula-based allocations are still in their infancy, but
envisaged to change over the next years.
In all sectors it appears that the long-standing geographical disparities in service delivery between
different regions have largely remained unchanged although the future more transparent and formula-
based allocation of finance may contribute to changing this.
Transparency in allocation of HRs
The previous system of centralized allocation of personnel to districts has lead to a very unequal
allocation of staff. This is reflected in the discrepancy between the formula-based allocation of PE/OC
and historical allocations. The agricultural sector is by far the worst in this manner, but the unequal
distribution of teachers and health staff is also well known.
For all sectors there seem to be significant problems in allocation of staff to marginalized/remote
areas - this is partly marginalized/remote districts having problems of attracting staff, but also
a problem within each of the districts where some villages are better served than others. The problem
appears common 74 but not well documented. CG and sectors have taken some steps to address the first
kind of inequalities by assisting the districts in recruitment of key sector staff, however the latter
problem is left to the districts to cater for. The districts in turn have limited scope and capacity to
address these matters. The way decentralisation in practice has been implemented has not yet
contributed to a significant impact on this problem; a complete decentralisation of HRM may worsen
the problems. What is required is central support to marginalised areas (through e.g. allocation of staff
resources according to the fiscal decentralisation formula and permission to LGAs to use part of their
funding for special allowances or other benefits to critical staff).
6-3-2 Impact on Participation
The decentralisation of service delivery has opened opportunities for public participation, which
were not available prior to the start of the process; both through the elected councils and through user
groups within the various sectors. PMO-RALG has advocated for use of O&OD as the preferred
74 Based on fieldwork interviews.
6. CONCLUSION
93
participatory planning methodology. This method is gradually rolled out to all LGAs and bring
community and village priorities into LG planning. However, there is still great room for improvement,
as most of the sector funding to the LGs is earmarked and mainly planned and budgeted for at the
district level.
The sectors, in particular education, have tried to enhance transparency in resource allocation at
user level and in this manner supported community participation and decentralisation below district
level, reflected in school management committee engagement in class room construction and
management. However, the sectors have only rather superf icially sought to involve Village
Governments and wards with some exception of agriculture although this effectively only have
happened through project interventions (PADEP/the WB, DANIDA etc.). Only the LGCDG provides
some room for real local budget priority setting at sub-district levels through the indicative budget
figures announced at ward level. The fact that the Ward Development Committee (WDC) is not a real
governance unit (LG council) and the very small size of village government are also constraining
factors for devolution below district levels and thus effective participation through LG structures.
6-3-3 Impact on Accountability
Staff accountability
Staff has in principle been transferred to LGs, however as evident from the discussion in
Chapter 2, LGs have at present only partial control over personnel management. This is inter alia
reflected in:
• Frequenttransfersofchiefexecutivesandfinancestaffacrossdistricts,
• CG recruitmentof staff inhealthandeducation sectors rather than localmeritbased
recruitment since the targets for recruitment in these sectors at present cannot be met rapidly
otherwise,
• Employmentstopforagriculturalextensionstaffandveryunevendeploymentoftheexisting
staff across districts,
• Limitedapplicationof staff appraisals (openperformanceappraisal system (OPRAS)etc.)
and no council involvement in this process,
• Cumbersome procedures for staff discipline - even signif icant cases of poor staff
performance (absent or drunk teachers etc.) are rarely effectively dealt with,
This and the fact that district councillors have limited insight into what is expected of district
employees limit local accountability substantially.
Lower LGs and user committees have virtually no influence over staff and can do little if public

Local Level Service Delivery, Decentralisation and Governance TANZANIA CASE REPORT
94
servant such as teachers, extension staff or health service staff abscond from work or show other forms
of deviant behaviour.
Financial accountability
Financial accountability has improved at LG levels over the past years. This was recently
documented by the PEFAR, which in 2006 assessed the performance of local governments in Tanzania.
The evidence is found in fairly consistent trends in:
• ThereportsfromtheAuditorGeneral,
• LGRPFinancialmanagementbenchmarkingexercise,and
• LGCDGassessments 75
Efforts have also been made to enhance LGs downward accountability by encouraging LGs to
display key financial data (budgets and expenditures) to the public. A recent assessment by REPOA
concluded 76:
• Councilsconductaffairsbyandlargeaccordingtoregulationsandforinstancedisplaybasic
financial information for the public. However, data is often displayed in a manner that makes
it difficult to use. Councillors, staff and the public also seem to lack skills in analysis of
budgets and accounts,
• Many informants indicated that theydistrusted staff andcouncillors and felt that the
information they received was distorted,
• Atvillagelevelthesituationwasworseasinformationquiteoftennotevenwasdisplayedat
village notice boards,
It was concluded that the situation in large part was “a problem of mindset”; councillors and staff
did not really see it as their duty to share information on LG finances and another aspects of council
affairs. Villagers and communities on the other hand didn’t see their access to information as
entitlements.
The improvements to date of overall LG fiscal accountability have mainly been due to efforts by
PMO-RALG and the LGRP. The sectors have mainly pursued more narrow upwards accountability for
“their” funding, and in some cases, such as the early years of health basket funding, this led to some
overemphasis on LG adherence to project specific and donor specific accounting requirements rather
than holistic LG accounting, reflected in separate audits of one account rather than full audits of entire
accounts. For PEDP financing it has proved a problem to have the account properly audited, as the
75 For details see PEFAR Report 2006.76 REPOA Brief October 2005: Improving Transparency of Financial Affairs at Local Government Level.
6. CONCLUSION
95
procedures did not fully adhere to LG financial regulations. The decentralisation of education funds
from districts directly to schools is nevertheless regarded as having reduced leakages and led to value
for money.
6-4 Impact of (Sector) Decentralisation on Service Delivery
Decentralisation has not been implemented as the only mode of service delivery and multiple
other factors, such as the level of public sector funding and externalities like general economic
developments have impacted on the level of service delivery over the past 5–10 years. However, as
evaluated in other studies, and if compared to the development prior to decentralisation, the system of
LG service delivery is considered as a relatively effective vehicle for enhancing the service delivery and
channelling of funds in particular for the education sector and some extent health services.
The response from communities and councillors on service delivery improvements were rather
similar and in line with what also have been observed in surveys conducted by e.g. REPOA:
“We see improvements in education sector: class rooms are built and more children can
afford going to school, we also see some small improvements in infrastructure of health and
irrigation, but we are not satisfied with agricultural services” (parent and farmer Moshi District)
In the education sector both school enrolment and classroom construction have shown significant
expansion. There is some evidence that the particular modality for classroom construction under PEDP
enabled rapid and relatively efficient expansion of the number of classrooms although problems were
recorded regarding the quality of some constructions. Thus a recent study on decentralisation to user
group refrain from making firm conclusions on the impact of the particular institutional arrangements
and instead concludes that the most significant explanatory factor for service improvements is the
dramatic increase in funding 77. Improvements in health and in particular agriculture have been less
spectacular and cannot be ascribed to decentralisation per se.
The general conclusion is that it is not possible to make a very direct link between the forms of
decentralisation and impact on service delivery. However, it can be argued that the various forms of
decentralisation have had a significant impact on some governance issues as discussed above and that
this in turn will influence service delivery.
77 D. Mushi 2006: Review of the experience with direct support to schools in Tanzania, a report by CODESRIA.

Local Level Service Delivery, Decentralisation and Governance TANZANIA CASE REPORT
96
6-5 Why have Reforms Progressed in This Manner?
Put very simply, we suggest that the particular trajectory and elements of reforms over the last
decade can be explained in the following schematic manner:
• Thefundamentallocalgovernmentstructure(theparticularhierarchyofLGs,theirnumber
and size, the modalities for election of councillors etc.) is the outcome of a long historical
and political process, which was presented in our report in 2004 78. These aspects of the
reforms - including the recent amendment of the LG discussed in Chapter 2 are foremost
influenced by the political leadership/the Chama Cha Mapinduzi (CCM) party, where donors
and the bureaucracy have had less influence. The party abolished the LG in the early 1970s
and introduced them again in the early 1980s. Fundamental aspects of the reforms such as
possible full devolution of staff to LGs will require full backing of the political leadership,
which seems not coming at present and substantive reforms in that direction should not be
expected. The debate surrounding the amendment of the LG legislation gave the impression
that central government and party officials felt it necessary and justified to have a close CG/
party representation at local level.
• Technocratsandthedonorcommunityhavetoalargerextentinfluencedthesectorpolicies,
where donors have been significant or dominant contributors to many aspects of sector
reforms. These reforms have therefore also to a large degree been influenced by what is
considered “international good practices” and expert advice. Some of the reforms have been
implemented only after long and heated policy debates. For instance views on agricultural
policies and programmes differ significantly; where it can be argued that donors have played
a significant role in driving a policy of privatisation of the agricultural extension service
through. Other sector policies, such as UPE, have been less controversial. The general
trend towards introduction of user groups have significantly influenced by donors and
international advice.
• TheLGRPresemblesinthismannerthesectorprogrammes:ithassinceitsinceptionin1999
largely been donor funded and relied extensively on international advice. The depth of policy
buy-in to these technical sector reforms, including the LGRP, is difficult to gauge, but it has
time and again proved difficult for the government to coordinate the different reform
initiatives and certain developments - like the recent legal amendments indicates that the
policy intentions of the LGRP are not fully embedded in central government and party policy
making processes.
78 Steffensen, Tidemand and Eke 2004: A Comparative Analysis of Decentralisation in Tanzania August 2004, for the World Bank; see Chapter 2 herein.
6. CONCLUSION
97
• Wider reformcoordinationhasbeenmademoredifficultdue tobasic capacityproblems
(number of qualified and available senior staff in the respective departments of policy and
planning in ministries) and the sheer scale and numbers of the ongoing reforms in Tanzania
makes overall reform coordination very challenging. Donors have a significant role to play in
this regard as they are so dominant financiers of the various reforms and sector programmes.
Officially all stakeholders share the same intentions of harmonisation as expressed in the joint
assistance strategies etc., but at the same time many donors also have to maintain separate
donor identities in order to serve their home constituencies. The fact that most donor funding
also is tied up in sector programmes further complicates e.g. a move towards fiscal devolution
of the development budget since this may complicate central sector investment planning that
suits both central bureaucrats and donors with sector programmes so well. The progress in
Tanzania on harmonising sector financing through the LGCDG is in this context surprising but
may not be sustained.
6-6 Key Challenges for Decentralised Service Delivery
The key challenges for decentralised sector service delivery in Tanzania can be summarized as
1) Policy: Progress and clarification of the CG institutional arrangements for support to the policy of
decentralisation by devolution. In this regard it is crucial that the current bill for amendment of
the LG legislation is debated and refined in line with the principles suggested by Professor Shivji
in his recent consultancy on the topic. However, it is also important that wider reform is carried
out of the central government structures in support of LGAs. The Regional Administration Act
deserves a general overhaul and it may be argued that CG representation below regional level (the
current structures of DC and DSs) should have no or very limited role to play in general LG
development planning and implementation 79.
2) Finance: Progress has been made in a number of areas of fiscal decentralisation but improvements
still required in areas of:
a) A particular challenge for the sectors is the integration of development funding into the
overall LGCDG system in a manner that will increase transparency, LG autonomy and
harmonise reporting and planning procedures while still safeguard sector policies.
Agriculture have progressed in this area but education and health still need to make headway
b) Effective implementation of the system of formula-based fiscal transfers for all sectors,
c) Sufficient financing of all LG responsibilities – LGs only receive a small share of total
79 PMO-RALG/LGRP: Review of the Local Government Laws, The Regional Administration Act and the Organisational Structure of Regional Administration – a consultancy report by Professor I G Shivji and Professor B. S. Rutinwa (draft 2006)
Local Level Service Delivery, Decentralisation and Governance TANZANIA CASE REPORT
98
government revenue in spite of being made responsible for the delivery of the bulk of basic
services.
d) Improve financial management and reporting -for effective downwards accountability as well
as for effective CG oversight,
e) Development of technically sound and politically acceptable system of LG taxation
subsequent to the recent abolishment of “nuisance taxes”.
3) HRM: Legislation for decentralised personnel management has been put in place, and although
not fully compatibly with the policy of decentralisation by devolution, then the legislation includes
substantial changes towards a more decentralised system, which need support to be
operationalised. Other key aspects of HRM in LGAs that need attention and support are:
a) The need for special attention to peripheral and remote LGAs where persistent problems are
found for attracting and retaining staff;
b) The use of the CBG system in sectors; while agriculture has made some proposals in this
regard, then other sectors like education and health still maintains a very centralised system
of local CB.
6-7 Key Areas for Possible External Assistance
It should be noted that for each of the 3 sectors as well as for LG development/decentralisation the
GoT has in collaboration with development partners established different forms of sector programmes
through which all future development priorities are to be identified and through which development
partners are requested to provide their assistance. In the LG “sub-sector”, this coordination has to date
primarily been through the basket funded LGRP. However this is intended to be phases out by 2008
and future modalities for support to the generic aspects of decentralisation and local government
reform await a planned Review early 2007 of the LGRP.
Within the very wide ranging interventions for improved local service delivery and
decentralisation, then the 3 broad challenges discussed in Section 6-6 warrant primary attention. The
institutional point of entry warrants special consideration; some issues may be addressed through
PMO-RALG and or the particular sectors, others would require additional close involvement of other
central institutions. PO-PSM is for instance a crucial stakeholder for interventions aimed at improved
HRM at LGA levels.

REFERENCES
99
REFERENCES
Chaliga A E, REDET Monograph Series No. 2: The 1999 Neighbourhood, Hamlet and Village Council
Elections in Tanzania
CMI: “Formative Process Research on the Local Government Reform Programme in Tanzania, Field
Report 2”, CMI, NIBIR, REPOA, PO-RALG, 3 September 2003
CMI, NIBR and REPOA: “Formative Process Research on Local Government Programme in Tanzania,
Field Report 1, Methodological challenges and Summary of the Findings”, 8 March 2003, CMI,
NIBR and REPOA
ESRF Team: Public Expenditure Review 2003 - The Development Budget, 28th May 2003 by Prof.
Brian Van Arkadie, Deo P. Mutalemwa and Dr. Stergomena L. Tax.
Georgia State University (GSU): A collection of Technical Reports (2003-1-8) and Notes on the Future
system of Intergovernmental Transfer System (2003–2004)
Government of Tanzania, Draft Local Government (Procurement of Goods and Works) Regulations,
July 2002
Government of Tanzania, Draft Local Government Procurement (Selection and Employment of
Consultants) Regulations, July 2002 (Under Government Finances Act, 1982) (Under Government
Finances Act, 1982)
Government of Tanzania, LGRP, Fiscal Decentralisation Task Force – PricewaterhouseCoopers, Data
Collection and Processing for Assessment of Financial Performance of Local Government
Authorities, March 2003
Government of Tanzania, LGRP, Policy Paper on Local Government Reform, October 1998
Government of Tanzania, Local Government Laws, Revised, 2000
Government of Tanzania, Local Government Laws – Revised 2000, The Local Government (District
Authority) Act No. 7 of 1982
Government of Tanzania, Local Government Laws – Revised 2000, The Local Government (Urban
Authority) Act No. 8 of 1982
Government of Tanzania, Local Government Laws – Revised 2000, The Regional Administration Act
No. 19 of 1997
Government of Tanzania, Ministry of Education: Basic Education Statistics in Tanzania, 2002–2006.
Government of Tanzania, Ministry of Education: Education and Training Sector Development
Programme, Revised August 2001: Education Sector Situation Analysis, Final Report December
2005.
Government of Tanzania, Ministry of Education, PMO-RALG: Education Sector Public Expenditure
Review (PER) 2004/2005, Final Report December 2005; ESDP, Education Sector Review 23–25
February 2006 Aide Memoire
Government of Tanzania: Ministry of Finance: Guidelines for the Preparation of the Medium Term
Plan and Budget Framework for 2004/2005 – 2006/2007, Part One, issued by Ministry of Finance,

Local Level Service Delivery, Decentralisation and Governance TANZANIA CASE REPORT
100
January 2004
Government of Tanzania, Ministry of Finance: The following Budget Publications: i) Vol. I, II and III
Financial Statements and Revenue Estimates for the Year 1st July, 2001 to 30th June, 2002, ii) Vol.
II Estimates of Public Expenditure Consolidated Fund Services (section 1) and Supply Votes
(Ministerial) and Vol. III of Public Expenditure Supply Votes (Regional) Details on Urban and
District Councils Grants and Subventions, for the year from 1st July, 2002 to 30th June 2003, iii)
Vol. II Estimates of Public Expenditure Consolidated Fund Services (section 1) and Supply Votes
(Ministerial) and Vol. III Estimates of Public Expenditure Supply Votes (regional) for the year
from 1st July 2003 to 30th June, 2004 and Appendices to Vol. III Estimates of Public Expenditure
Supply Votes (Regional) Details on Urban and District Councils Grants and Subventions.
Government of Tanzania, MoF, Capacity Building for Participatory Development, Financing Proposal,
March 2003
Government of Tanzania, PO-RALG, Draft Procurement Manual for Local Government Authorities,
Vol. I, Procedures, June 2002
Government of Tanzania, PO-RALG: “Guidelines for Rationalization and Harmonisation of Local
Government Sources of Revenue, Tanzania Mainland”, Dodoma, December 2002.
Government of Tanzania, PO-RALG, LGRP, Institutional Strengthening Programme for Regional
Secretariats, August 2002
Government of Tanzania, PO-RALG, LGRP, Medium Term Plan and Budget, June 2002 – June 2005,
June 2002 and MTPB 2005–2008.
Government of Tanzania, PO-RALG, Medium-tem Strategic Plan, September 2000
Government of Tanzania, PO-RALG: Report on the indebtedness of Local Government Authorities as
of 30th June 2002.
Government of Tanzania, PO-RALG, Restructuring of the President’s Office – Regional and Local
Government - Inception Report, May 2003
Government of Tanzania, PO-RALG, Restructuring Regional Administration: Regional Secretariat’
Operations Manual, February 1999
Government of Tanzania, PO-RALG, Urban Sector Rehabilitation Project, February 2003
Government of Tanzania, PO-RALG (Author Ole Kragh, NCG et all): “Local and Lower Local
Government Revenue Sharing and Management of Finance ad the Village, Ward and Mitaa
Levels, PO-RALG/DFID/UNCDF, December 2003, Vol. I and II.
Government of Tanzania, PO-RALG (LGRP), Restructuring manual: A Strategic Approach to Reform
by Local Authority. March 2000
Government of Tanzania, The President’s Office: The Economic Survey 2002, Produced by the
Presidents Office – Planning and Privatisation, Tanzania, June 2003.
Government of Tanzania, The Public service Regulations 2003 and the Public Service Scheme, 2003
President’s Office, Public Service Management, 2003
Government of Tanzania, The Tanzania Development Vision 2025, President’s Office, Planning
REFERENCES
101
Commission, 1999
Government of Tanzania 2003: Public Expenditure Review 2003 of the Development Budget.
Household Budget Survey 2000/2001.
IMF: “Tanzania Fiscal Decentralisation Issues” – Aid Memoire, March 16, 2001
LGRP 2001: Review of LGRP
LGRP 2004: Review of LGRP
LGRP 2005: Appraisal of the Proposed institutional strengthening programme (ISP) for Regional
Secretariats, by PEMconsult March 2005.
Local Government Laws (Miscellaneous Amendments) Act 2006 (10th July)
Makadirio ya Maendaleo ya Wizara na Mikoa FY 2004/2005 and 2005/2006
MAFS: 2003: “Institutional Arrangements and Capacity Assessment of Public Sector Agricultural
Extension in Tanzania” A Consultancy report by Faustin Maganga and E Jagga.
MAFS: Decentralisation of Agricultural Extension Services – Ministerial Presentation Agriculture
sector Stakeholders Bunge Hall Dodoma 23–24 March 2001.
MAFS, Agriculture Sector Public Expenditure Review for FY 2003/2004
MAFS, ASDP Framework and Process Document (ASDP), Final Draft (March 2003).
MAFS, Tanzania Agricultural Services Programme Document Draft 2004.
Ministry of Health, October 2002; Second Health Sector Strategic Plan (HSSP) July 2003 – June 2008,
Ministry of Health April 2003; Technical Review Report 2006, Final Report April 2006, Independent
Report for MoHSW/PMO-RALG;
MoH, Programme Document, Danida July 2004; Country Health Profile, January 2006, DPP/MoH;
MoH, Review of the State of Health in Tanzania, Independent Review by Swiss Tropical Institute, April
2005. PER, MoH FY 2003, 2004 and 2005.
MoH, Technical Review of Health Service Delivery at District Level, Final Report March 2003; HSPS III
Mushi 2006: Review of the Experience with Direct Support to Schools in Tanzania, a Report by
CODESRIA.
Oxford Policy Management, A Framework for Co-ordinating Local Government and Sector Reforms,
Report to the Ministry of Regional Administration and Local Government, June 2000
PMO-RALG/LGRP/Ministry of Finance. Development of a Strategic Framework for the Financing of
Local Governments in Tanzania June 2006 and the related reports: Local Government Fiscal
Review 2004, LG Fiscal Review 2005 as well as the website with LG Finance information in
Tanzania: http://www.logintanzania.net
PMO-RALG/LGRP 2005: The Staffing Problems of Peripheral or Otherwise Disadvantaged Local
Government Authorities, Consultancy Report by Crown Management (Ted Valentine, Per Tidemand,
Nazar Sola and Alloyce Maziku)
PMO-RALG/LGRP Report on the Bill on the Local Government Laws (Miscellaneous Amendments)
Act 2006, by Professor Issa Shivji September 2006.
PMO-RALG/LGRP: Review of the Local Government Laws, The Regional Administration Act and the
Local Level Service Delivery, Decentralisation and Governance TANZANIA CASE REPORT
102
Organisational Structure of Regional Administration – a consultancy report by Professor I G
Shivji and Professor B. S. Rutinwa (draft 2006)
PMO-RALG/LGRP: Review of the Local Government Laws, The Regional Administration Act and the
Organisational Structure of Regional Administration – a consultancy report by Professor I G
Shivji and Professor B. S. Rutinwa (draft 2006)
PMO-RALG/LGRP: Strategy for Implementation of Government Policy on Devolution of The
Development Budget (Draft 30th January 2006) and updated letter of Sectoral policy for LGSP II.
PMO-RALG/LGSP Semi Annual Report July 2006
PO-PSM: State of Public Service June 2005.
PO-RALG, MAFS and Rural and Agricultural Development Advisory Group of JICA Tanzania Office
(JICA-RADAG): A Study to Review the 2003/2004 DADP Process towards Effective and
Efficient Implementation of District Agricultural Development Plans,
PricewaterhouseCoopers: (Tidemand, Steffensen, Naitore et all): “Development Funding to Regions
and Local Governments, Final Report”, December 2003.
PricewaterhouseCoopers: (Tidemand, Steffensen, Naitore, Pyndt et. All): “Design of Capital Grants
Programme and Capacity Building Programme for Local Governments, Vol. I, II and III, Final
Report December 2003.
Public Expenditure and Financial Accountability review (PEFAR) 2005.
REPOA: “Indebtedness of Local Government Authorities and their Economic Viability and
Sustainability, 2001”
REPOA Brief 6, October 2006: Local Government reform in Tanzania 2002–2005: Summary of
Research Findings on governance, Finance and Service Delivery (www.repoa.or.tz) by Odd Helge
Fjeldstad, Einer Braathen and Amon Chaligha.
REPOA Brief October 2005: Improving Transparency of Financial Affairs at Local Government Level.
Steffensen, Tidemand and Mwaipopo 2004: A Comparative Analysis of Decentralisation, Tanzania
Case
Synthesis report by UNCDF, Area-based Support to Local Government Reform in Tanzania: An
Overview of Five Major Programmes, September 2002
URT, ASDP, Guidelines for District Agricultural Development Planning and Implementation (draft)
June 2006.
URT, ASDP, Guidelines for District Agricultural Development Planning and Implementation (draft)
June 2006 and PMO-RALG Guidelines for the Preparation of LGA medium Term Plans and
Budgets 2006/2007 – 2008/2009.
URT/NAEP II: Lessons from Experiences of NAEP II Micro-projects. Report prepared by NAEP II
Team with the assistance of H. B. Lunogelo; Final Draft - February 2004.
URT, Poverty and Human Development Report 2005 (available at www.repoa.or.tz)
Valentine, Ted and Per Tidemand 2005: Report on Staffing problems in Peripherial and otherwise
disadvantage LGAs.

REFERENCES
103
World Bank, Decentralisation Sector Work (Tanzania), May 4, 2001.
World Bank, Tanzania – LGSP, Aide Memoire, March 2003
World Bank, Tanzania – LGSP, PID, November 2002
World Bank, Tanzania – Public Expenditure Review FY 2003, Managing Public Expenditure for
Poverty Reduction – Report on the Fiscal Developments and Public Expenditure Management
Issues, The World Bank, 2003
World Bank, Tanzania, Project Appraisal Document, Social Action Fund Project, July 2000


ANNEXES

Local Level Service Delivery, Decentralisation and Governance TANZANIA CASE REPORT
106
Annex 1 LGCDG Design Principles
In summary the Local Government Capital Development Grant (LGCDG) system provides
a general development block grant to all Local Government Authorities (LGAs) that fulfil certain
Minimum Condition (MC). The grant (Local Government Development Programme (LGDP) -
LGCDG) will on average provide USD 1.5 per capita to each LGA annually. The funds will be shared
among LGAs according to a formula and the size of each LGA grant will annually be adjusted
according to last years performance in order to provide strong incentives for LGAs to adhere to laws
and policies - in particular regarding accountability and transparency in planning, budgeting,
procurement and financial management and reporting.
Each LGA is given a discretionary Capacity Building Grant (CBG) of USD 35,000 – to give the
LGAs the means to improve their performance.
Key features of the system are further elaborated below.
LGCDG formula
Under LGCDG the resources for development funding will be shared among LGAs according to
a formula. The selection of the formula is based upon substantial technical work and discussion:
• Population: Weight 70 %,
• Sizeoftheland area (caped 80): Weight 10 %, and
• Poverty, based on officially available statistics on the number of people below the basic
poverty line: Weight: 20 %,
Poverty data will initially be based on regional statistics (with a distinction between urban and
rural LGAs). However, it is expected that poverty statistics soon will improve and allow for more
precise LGA poverty data.
Under LGCDG 50 % of the grant to Higher Level Local Government (HLG) (Districts and
Municipalities) are to be further distributed notionally to Lower Level Local Governments (LLGs)
(Wards, Villages and Mtaa) in the form of indicative planning figures. The formula for distribution at
sub-district level is entirely population based as other data are too unreliable. Whereas the formula at
district level is used for actual grant allocations, then the formula at sub-district level is only used in
order to give the villages and wards a notional budget to work within.
80 The formula adjusts for the situations where very large low density LGAs are assumed to have areas without any particular needs for infrastructure and services, a minimum of 20 people per km2 is computed in the formula.
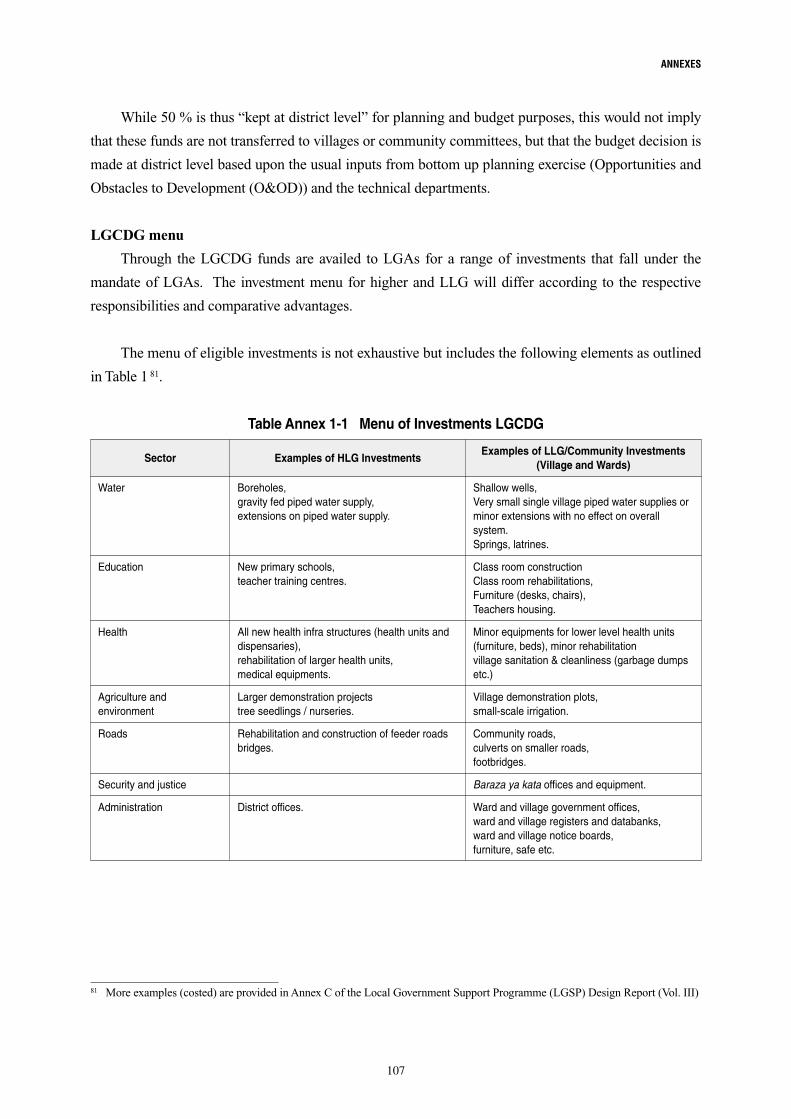
ANNEXES
107
While 50 % is thus “kept at district level” for planning and budget purposes, this would not imply
that these funds are not transferred to villages or community committees, but that the budget decision is
made at district level based upon the usual inputs from bottom up planning exercise (Opportunities and
Obstacles to Development (O&OD)) and the technical departments.
LGCDG menu
Through the LGCDG funds are availed to LGAs for a range of investments that fall under the
mandate of LGAs. The investment menu for higher and LLG will differ according to the respective
responsibilities and comparative advantages.
The menu of eligible investments is not exhaustive but includes the following elements as outlined
in Table 1 81.
Water
Education
Health
Agriculture and environment
Roads
Security and justice
Administration
Table Annex 1-1 Menu of Investments LGCDG
Sector
Boreholes,gravity fed piped water supply, extensions on piped water supply.
New primary schools,teacher training centres.
All new health infra structures (health units and dispensaries),rehabilitation of larger health units, medical equipments.
Larger demonstration projectstree seedlings / nurseries.
Rehabilitation and construction of feeder roads bridges.
District offices.
Shallow wells,Very small single village piped water supplies or minor extensions with no effect on overall system.Springs, latrines.
Class room constructionClass room rehabilitations,Furniture (desks, chairs),Teachers housing.
Minor equipments for lower level health units (furniture, beds), minor rehabilitationvillage sanitation & cleanliness (garbage dumps etc.)
Village demonstration plots,small-scale irrigation.
Community roads,culverts on smaller roads, footbridges.
Baraza ya kata offices and equipment.
Ward and village government offices,ward and village registers and databanks,ward and village notice boards,furniture, safe etc.
Examples of HLG InvestmentsExamples of LLG/Community Investments
(Village and Wards)
81 More examples (costed) are provided in Annex C of the Local Government Support Programme (LGSP) Design Report (Vol. III)
Local Level Service Delivery, Decentralisation and Governance TANZANIA CASE REPORT
108
Under LGCDG - costs for the capital/development investments as well as up to 15 % as
investment servicing costs are covered from the grant. The investment servicing costs include funds for
planning, appraisal and supervision that the LGAs will incur as part of the investment.
Incentive based allocations
The government wishes to establish a link between the financing of Local Government (LG) and
their performance in key areas of financial management, participatory planning, pro-poor budgeting,
budget execution and the broader areas of local governance such as transparency and accountability,
council functional processes and the involvement of LLG. This link first and foremost seeks to
promote compliance with national policies, the legal and regulatory framework. Secondly, it introduces
an incentive system through adjustment of the annual grant allocations to each LGA, upwards or
downwards depending on their performance against a set of performance indicators. The indicators are
designed to encourage LGAs to comply with policy guidelines and regulations aimed at improving the
quality of services and promoting good governance.
The objective of the assessment is to establish the capacities and capabilities of the target LGAs in
the specified functional areas that have been formulated into MCs and performance measures (PMs).
Minimum conditions (MCs)
Before the LGAs access the discretionary funds, they will have to meet a set of minimum
requirements within functional areas that would ensure that funds transferred to LGAs are properly
used and in compliance with the laid down Government of Tanzania (GoT) statutory and administrative
requirements. The MCs are derived from GoT laws and Regulations and guidelines. The MCs, while
seeking to ensure sufficient safeguards for the utilisation of the grant funds, are also designed to
promote compliance with basic statutory and regulatory prescriptions for local government operations.
These conditions are mainly quantitative (usually inform Yes/No questions) and are simple to evaluate
during an assessment. This is in order to ensure that the funds can be used effectively, efficiently,
sustainable and with integrity.
The functional areas include financial management, procurement, planning and budgeting, human
resource management (HRM), project implementation and monitoring and evaluation among others.
Performance measures (PMs)
In addition to the assessment of MCs, a set of PMs has been elaborated as a means of introducing
incentives for performance improvement by providing for adjustment in the yearly size of the grants
received as a reward for good performance and sanction for poor performance. Unlike the MCs, the
PMs are more qualitative and seek to evaluate the detailed performance of the LGA in key functional
areas and compliance with broad policy guidelines on governance issues such as transparency and
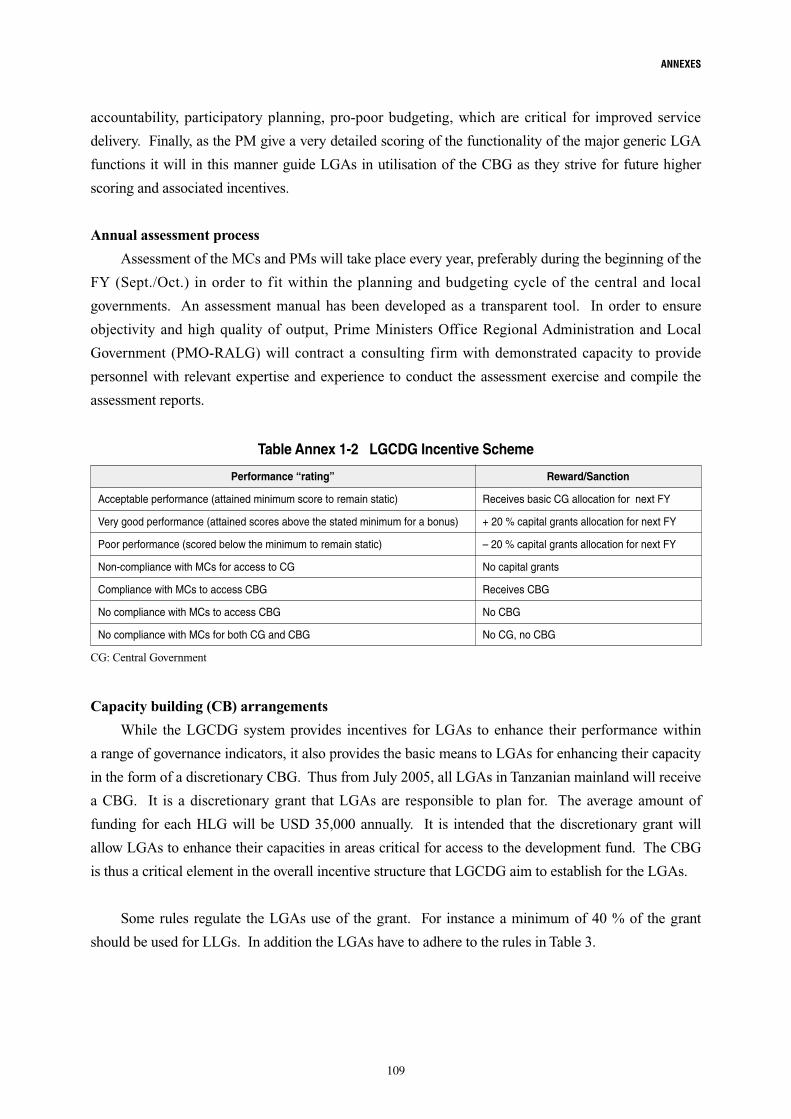
ANNEXES
109
accountability, participatory planning, pro-poor budgeting, which are critical for improved service
delivery. Finally, as the PM give a very detailed scoring of the functionality of the major generic LGA
functions it will in this manner guide LGAs in utilisation of the CBG as they strive for future higher
scoring and associated incentives.
Annual assessment process
Assessment of the MCs and PMs will take place every year, preferably during the beginning of the
FY (Sept./Oct.) in order to fit within the planning and budgeting cycle of the central and local
governments. An assessment manual has been developed as a transparent tool. In order to ensure
objectivity and high quality of output, Prime Ministers Office Regional Administration and Local
Government (PMO-RALG) will contract a consulting firm with demonstrated capacity to provide
personnel with relevant expertise and experience to conduct the assessment exercise and compile the
assessment reports.
Capacity building (CB) arrangements
While the LGCDG system provides incentives for LGAs to enhance their performance within
a range of governance indicators, it also provides the basic means to LGAs for enhancing their capacity
in the form of a discretionary CBG. Thus from July 2005, all LGAs in Tanzanian mainland will receive
a CBG. It is a discretionary grant that LGAs are responsible to plan for. The average amount of
funding for each HLG will be USD 35,000 annually. It is intended that the discretionary grant will
allow LGAs to enhance their capacities in areas critical for access to the development fund. The CBG
is thus a critical element in the overall incentive structure that LGCDG aim to establish for the LGAs.
Some rules regulate the LGAs use of the grant. For instance a minimum of 40 % of the grant
should be used for LLGs. In addition the LGAs have to adhere to the rules in Table 3.
Table Annex 1-2 LGCDG Incentive Scheme
Performance “rating”
Acceptable performance (attained minimum score to remain static)
Very good performance (attained scores above the stated minimum for a bonus)
Poor performance (scored below the minimum to remain static)
Non-compliance with MCs for access to CG
Compliance with MCs to access CBG
No compliance with MCs to access CBG
No compliance with MCs for both CG and CBG
Receives basic CG allocation for next FY
+ 20 % capital grants allocation for next FY
– 20 % capital grants allocation for next FY
No capital grants
Receives CBG
No CBG
No CG, no CBG
Reward/Sanction
CG: Central Government
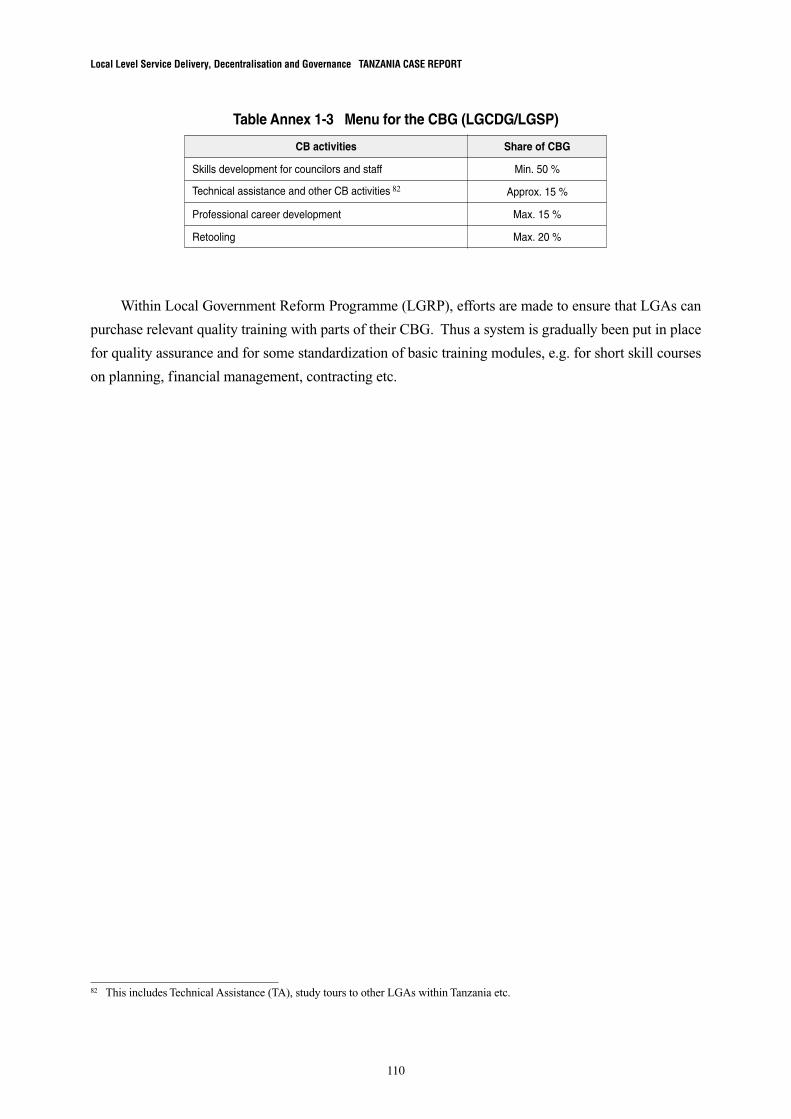
Local Level Service Delivery, Decentralisation and Governance TANZANIA CASE REPORT
110
Within Local Government Reform Programme (LGRP), efforts are made to ensure that LGAs can
purchase relevant quality training with parts of their CBG. Thus a system is gradually been put in place
for quality assurance and for some standardization of basic training modules, e.g. for short skill courses
on planning, financial management, contracting etc.
CB activities Share of CBG
Skills development for councilors and staff
Technical assistance and other CB activities 82
Professional career development
Retooling
Table Annex 1-3 Menu for the CBG (LGCDG/LGSP)
Min. 50 %
Approx. 15 %
Max. 15 %
Max. 20 %
82 This includes Technical Assistance (TA), study tours to other LGAs within Tanzania etc.
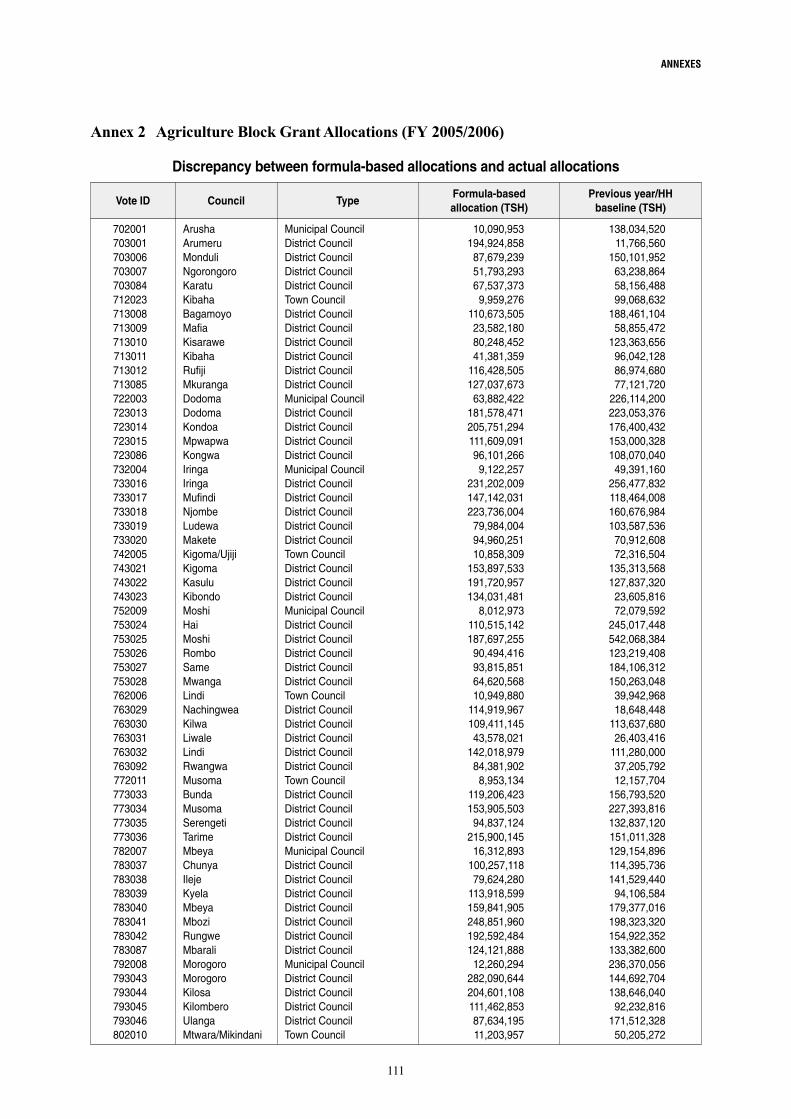
ANNEXES
111
Vote ID Council Type
702001703001703006703007703084712023713008713009713010713011713012713085722003723013723014723015723086732004733016733017733018733019733020742005743021743022743023752009753024753025753026753027753028762006763029763030763031763032763092772011773033773034773035773036782007783037783038783039783040783041783042783087792008793043793044793045793046802010
ArushaArumeruMonduliNgorongoroKaratuKibahaBagamoyoMafiaKisaraweKibahaRufijiMkurangaDodomaDodomaKondoaMpwapwaKongwaIringaIringaMufindiNjombeLudewaMaketeKigoma/UjijiKigomaKasuluKibondoMoshiHaiMoshiRomboSameMwangaLindiNachingweaKilwaLiwaleLindiRwangwaMusomaBundaMusomaSerengetiTarimeMbeyaChunyaIlejeKyelaMbeyaMboziRungweMbaraliMorogoroMorogoroKilosaKilomberoUlangaMtwara/Mikindani
Municipal CouncilDistrict CouncilDistrict CouncilDistrict CouncilDistrict CouncilTown CouncilDistrict CouncilDistrict CouncilDistrict CouncilDistrict CouncilDistrict CouncilDistrict CouncilMunicipal CouncilDistrict CouncilDistrict CouncilDistrict CouncilDistrict CouncilMunicipal CouncilDistrict CouncilDistrict CouncilDistrict CouncilDistrict CouncilDistrict CouncilTown CouncilDistrict CouncilDistrict CouncilDistrict CouncilMunicipal CouncilDistrict CouncilDistrict CouncilDistrict CouncilDistrict CouncilDistrict CouncilTown CouncilDistrict CouncilDistrict CouncilDistrict CouncilDistrict CouncilDistrict CouncilTown CouncilDistrict CouncilDistrict CouncilDistrict CouncilDistrict CouncilMunicipal CouncilDistrict CouncilDistrict CouncilDistrict CouncilDistrict CouncilDistrict CouncilDistrict CouncilDistrict CouncilMunicipal CouncilDistrict CouncilDistrict CouncilDistrict CouncilDistrict CouncilTown Council
10,090,953194,924,858
87,679,23951,793,29367,537,373
9,959,276110,673,50523,582,18080,248,45241,381,359
116,428,505127,037,673
63,882,422181,578,471205,751,294111,609,09196,101,266
9,122,257231,202,009147,142,031223,736,004
79,984,00494,960,25110,858,309
153,897,533191,720,957134,031,481
8,012,973110,515,142187,697,255
90,494,41693,815,85164,620,56810,949,880
114,919,967109,411,14543,578,021
142,018,97984,381,902
8,953,134119,206,423153,905,503
94,837,124215,900,145
16,312,893100,257,11879,624,280
113,918,599159,841,905248,851,960192,592,484124,121,888
12,260,294282,090,644204,601,108111,462,85387,634,19511,203,957
138,034,52011,766,560
150,101,95263,238,86458,156,48899,068,632
188,461,10458,855,472
123,363,65696,042,12886,974,68077,121,720
226,114,200223,053,376176,400,432153,000,328108,070,040
49,391,160256,477,832118,464,008160,676,984103,587,536
70,912,60872,316,504
135,313,568127,837,320
23,605,81672,079,592
245,017,448542,068,384123,219,408184,106,312150,263,048
39,942,96818,648,448
113,637,68026,403,416
111,280,00037,205,79212,157,704
156,793,520227,393,816132,837,120151,011,328129,154,896114,395,736141,529,440
94,106,584179,377,016198,323,320154,922,352133,382,600236,370,056144,692,704138,646,040
92,232,816171,512,328
50,205,272
Annex 2 Agriculture Block Grant Allocations (FY 2005/2006)
Discrepancy between formula-based allocations and actual allocations
Formula-basedallocation (TSH)
Previous year/HHbaseline (TSH)
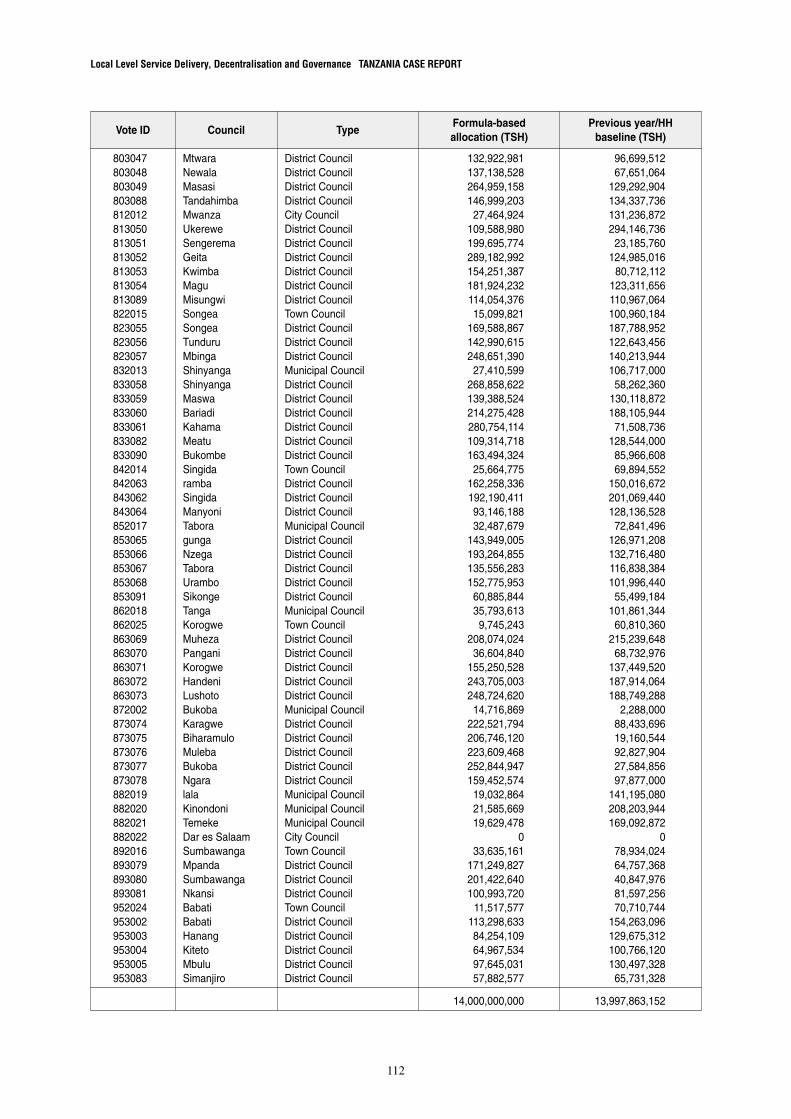
Local Level Service Delivery, Decentralisation and Governance TANZANIA CASE REPORT
112
Vote ID Council TypeFormula-basedallocation (TSH)
Previous year/HHbaseline (TSH)
803047803048803049803088812012813050813051813052813053813054813089822015823055823056823057832013833058833059833060833061833082833090842014842063843062843064852017853065853066853067853068853091862018862025863069863070863071863072863073872002873074873075873076873077873078882019882020882021882022892016893079893080893081952024953002953003953004953005953083
MtwaraNewalaMasasiTandahimbaMwanzaUkereweSengeremaGeitaKwimbaMaguMisungwiSongeaSongeaTunduruMbingaShinyangaShinyangaMaswaBariadiKahamaMeatuBukombeSingidarambaSingidaManyoniTaboragungaNzegaTaboraUramboSikongeTangaKorogweMuhezaPanganiKorogweHandeniLushotoBukobaKaragweBiharamuloMulebaBukobaNgaralalaKinondoniTemekeDar es SalaamSumbawangaMpandaSumbawangaNkansiBabatiBabatiHanangKitetoMbuluSimanjiro
District CouncilDistrict CouncilDistrict CouncilDistrict CouncilCity CouncilDistrict CouncilDistrict CouncilDistrict CouncilDistrict CouncilDistrict CouncilDistrict CouncilTown CouncilDistrict CouncilDistrict CouncilDistrict CouncilMunicipal CouncilDistrict CouncilDistrict CouncilDistrict CouncilDistrict CouncilDistrict CouncilDistrict CouncilTown CouncilDistrict CouncilDistrict CouncilDistrict CouncilMunicipal CouncilDistrict CouncilDistrict CouncilDistrict CouncilDistrict CouncilDistrict CouncilMunicipal CouncilTown CouncilDistrict CouncilDistrict CouncilDistrict CouncilDistrict CouncilDistrict CouncilMunicipal CouncilDistrict CouncilDistrict CouncilDistrict CouncilDistrict CouncilDistrict CouncilMunicipal CouncilMunicipal CouncilMunicipal CouncilCity CouncilTown CouncilDistrict CouncilDistrict CouncilDistrict CouncilTown CouncilDistrict CouncilDistrict CouncilDistrict CouncilDistrict CouncilDistrict Council
132,922,981137,138,528264,959,158146,999,203
27,464,924109,588,980199,695,774289,182,992154,251,387181,924,232114,054,37615,099,821
169,588,867142,990,615248,651,390
27,410,599268,858,622139,388,524214,275,428280,754,114109,314,718163,494,324
25,664,775162,258,336192,190,41193,146,18832,487,679
143,949,005193,264,855135,556,283152,775,953
60,885,84435,793,613
9,745,243208,074,024
36,604,840155,250,528243,705,003248,724,620
14,716,869222,521,794206,746,120223,609,468252,844,947159,452,574
19,032,86421,585,66919,629,478
033,635,161
171,249,827201,422,640100,993,720
11,517,577113,298,63384,254,10964,967,53497,645,03157,882,577
14,000,000,000
96,699,51267,651,064
129,292,904134,337,736131,236,872294,146,736
23,185,760124,985,016
80,712,112123,311,656110,967,064100,960,184187,788,952122,643,456140,213,944106,717,000
58,262,360130,118,872188,105,944
71,508,736128,544,000
85,966,60869,894,552
150,016,672201,069,440128,136,528
72,841,496126,971,208132,716,480116,838,384101,996,440
55,499,184101,861,344
60,810,360215,239,648
68,732,976137,449,520187,914,064188,749,288
2,288,00088,433,69619,160,54492,827,90427,584,85697,877,000
141,195,080208,203,944169,092,872
078,934,02464,757,36840,847,97681,597,25670,710,744
154,263,096129,675,312100,766,120130,497,328
65,731,328
13,997,863,152
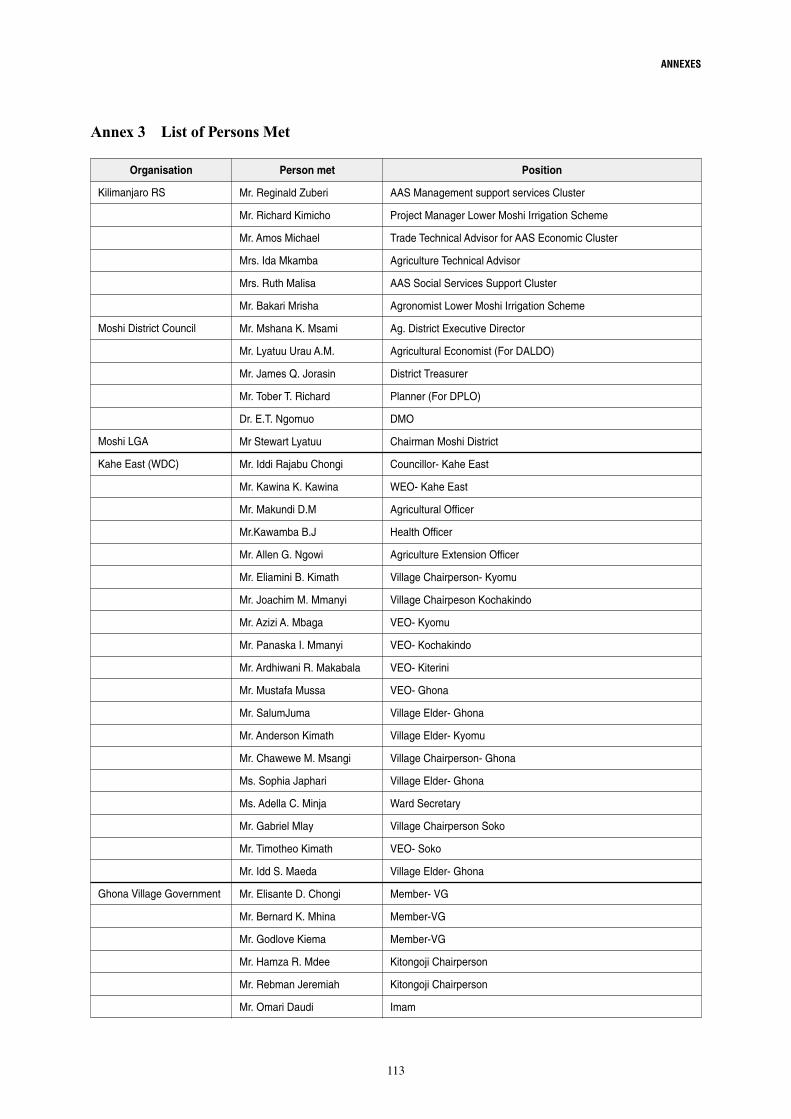
ANNEXES
113
AAS Management support services Cluster
Project Manager Lower Moshi Irrigation Scheme
Trade Technical Advisor for AAS Economic Cluster
Agriculture Technical Advisor
AAS Social Services Support Cluster
Agronomist Lower Moshi Irrigation Scheme
Ag. District Executive Director
Agricultural Economist (For DALDO)
District Treasurer
Planner (For DPLO)
DMO
Chairman Moshi District
Councillor- Kahe East
WEO- Kahe East
Agricultural Officer
Health Officer
Agriculture Extension Officer
Village Chairperson- Kyomu
Village Chairpeson Kochakindo
VEO- Kyomu
VEO- Kochakindo
VEO- Kiterini
VEO- Ghona
Village Elder- Ghona
Village Elder- Kyomu
Village Chairperson- Ghona
Village Elder- Ghona
Ward Secretary
Village Chairperson Soko
VEO- Soko
Village Elder- Ghona
Member- VG
Member-VG
Member-VG
Kitongoji Chairperson
Kitongoji Chairperson
Imam
Organisation Person met Position
Mr. Reginald Zuberi
Mr. Richard Kimicho
Mr. Amos Michael
Mrs. Ida Mkamba
Mrs. Ruth Malisa
Mr. Bakari Mrisha
Mr. Mshana K. Msami
Mr. Lyatuu Urau A.M.
Mr. James Q. Jorasin
Mr. Tober T. Richard
Dr. E.T. Ngomuo
Mr Stewart Lyatuu
Mr. Iddi Rajabu Chongi
Mr. Kawina K. Kawina
Mr. Makundi D.M
Mr.Kawamba B.J
Mr. Allen G. Ngowi
Mr. Eliamini B. Kimath
Mr. Joachim M. Mmanyi
Mr. Azizi A. Mbaga
Mr. Panaska I. Mmanyi
Mr. Ardhiwani R. Makabala
Mr. Mustafa Mussa
Mr. SalumJuma
Mr. Anderson Kimath
Mr. Chawewe M. Msangi
Ms. Sophia Japhari
Ms. Adella C. Minja
Mr. Gabriel Mlay
Mr. Timotheo Kimath
Mr. Idd S. Maeda
Mr. Elisante D. Chongi
Mr. Bernard K. Mhina
Mr. Godlove Kiema
Mr. Hamza R. Mdee
Mr. Rebman Jeremiah
Mr. Omari Daudi
Annex 3 List of Persons Met
Kilimanjaro RS
Moshi District Council
Moshi LGA
Kahe East (WDC)
Ghona Village Government
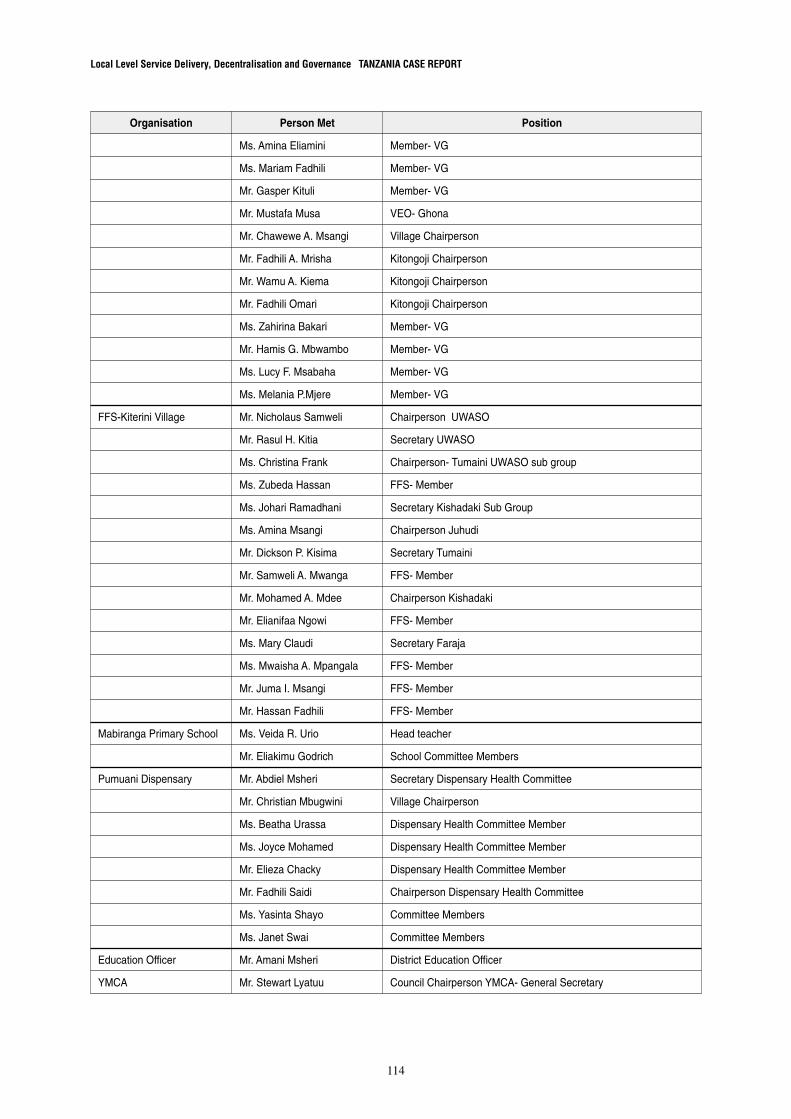
Local Level Service Delivery, Decentralisation and Governance TANZANIA CASE REPORT
114
Ms. Amina Eliamini
Ms. Mariam Fadhili
Mr. Gasper Kituli
Mr. Mustafa Musa
Mr. Chawewe A. Msangi
Mr. Fadhili A. Mrisha
Mr. Wamu A. Kiema
Mr. Fadhili Omari
Ms. Zahirina Bakari
Mr. Hamis G. Mbwambo
Ms. Lucy F. Msabaha
Ms. Melania P.Mjere
Mr. Nicholaus Samweli
Mr. Rasul H. Kitia
Ms. Christina Frank
Ms. Zubeda Hassan
Ms. Johari Ramadhani
Ms. Amina Msangi
Mr. Dickson P. Kisima
Mr. Samweli A. Mwanga
Mr. Mohamed A. Mdee
Mr. Elianifaa Ngowi
Ms. Mary Claudi
Ms. Mwaisha A. Mpangala
Mr. Juma I. Msangi
Mr. Hassan Fadhili
Ms. Veida R. Urio
Mr. Eliakimu Godrich
Mr. Abdiel Msheri
Mr. Christian Mbugwini
Ms. Beatha Urassa
Ms. Joyce Mohamed
Mr. Elieza Chacky
Mr. Fadhili Saidi
Ms. Yasinta Shayo
Ms. Janet Swai
Mr. Amani Msheri
Mr. Stewart Lyatuu
Member- VG
Member- VG
Member- VG
VEO- Ghona
Village Chairperson
Kitongoji Chairperson
Kitongoji Chairperson
Kitongoji Chairperson
Member- VG
Member- VG
Member- VG
Member- VG
Chairperson UWASO
Secretary UWASO
Chairperson- Tumaini UWASO sub group
FFS- Member
Secretary Kishadaki Sub Group
Chairperson Juhudi
Secretary Tumaini
FFS- Member
Chairperson Kishadaki
FFS- Member
Secretary Faraja
FFS- Member
FFS- Member
FFS- Member
Head teacher
School Committee Members
Secretary Dispensary Health Committee
Village Chairperson
Dispensary Health Committee Member
Dispensary Health Committee Member
Dispensary Health Committee Member
Chairperson Dispensary Health Committee
Committee Members
Committee Members
District Education Officer
Council Chairperson YMCA- General Secretary
Organisation Person Met Position
FFS-Kiterini Village
Mabiranga Primary School
Pumuani Dispensary
Education Officer
YMCA
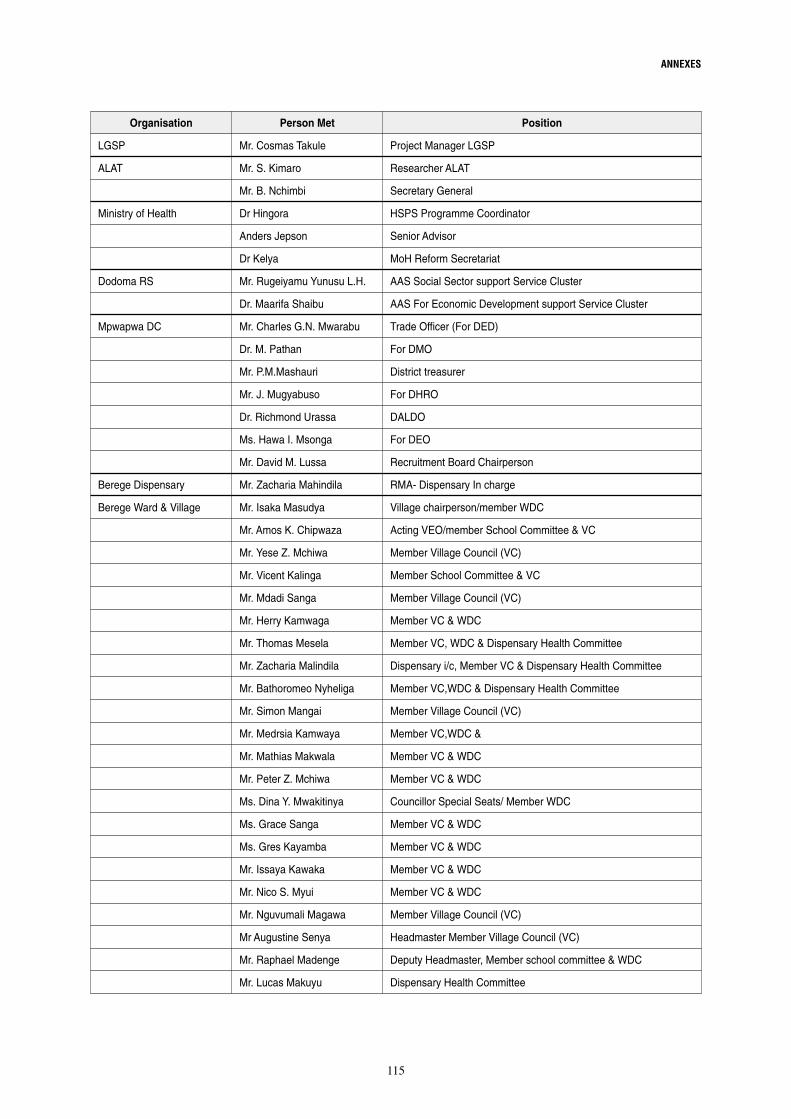
ANNEXES
115
LGSP
ALAT
Ministry of Health
Dodoma RS
Mpwapwa DC
Berege Dispensary
Berege Ward & Village
Mr. Cosmas Takule
Mr. S. Kimaro
Mr. B. Nchimbi
Dr Hingora
Anders Jepson
Dr Kelya
Mr. Rugeiyamu Yunusu L.H.
Dr. Maarifa Shaibu
Mr. Charles G.N. Mwarabu
Dr. M. Pathan
Mr. P.M.Mashauri
Mr. J. Mugyabuso
Dr. Richmond Urassa
Ms. Hawa I. Msonga
Mr. David M. Lussa
Mr. Zacharia Mahindila
Mr. Isaka Masudya
Mr. Amos K. Chipwaza
Mr. Yese Z. Mchiwa
Mr. Vicent Kalinga
Mr. Mdadi Sanga
Mr. Herry Kamwaga
Mr. Thomas Mesela
Mr. Zacharia Malindila
Mr. Bathoromeo Nyheliga
Mr. Simon Mangai
Mr. Medrsia Kamwaya
Mr. Mathias Makwala
Mr. Peter Z. Mchiwa
Ms. Dina Y. Mwakitinya
Ms. Grace Sanga
Ms. Gres Kayamba
Mr. Issaya Kawaka
Mr. Nico S. Myui
Mr. Nguvumali Magawa
Mr Augustine Senya
Mr. Raphael Madenge
Mr. Lucas Makuyu
Project Manager LGSP
Researcher ALAT
Secretary General
HSPS Programme Coordinator
Senior Advisor
MoH Reform Secretariat
AAS Social Sector support Service Cluster
AAS For Economic Development support Service Cluster
Trade Officer (For DED)
For DMO
District treasurer
For DHRO
DALDO
For DEO
Recruitment Board Chairperson
RMA- Dispensary In charge
Village chairperson/member WDC
Acting VEO/member School Committee & VC
Member Village Council (VC)
Member School Committee & VC
Member Village Council (VC)
Member VC & WDC
Member VC, WDC & Dispensary Health Committee
Dispensary i/c, Member VC & Dispensary Health Committee
Member VC,WDC & Dispensary Health Committee
Member Village Council (VC)
Member VC,WDC &
Member VC & WDC
Member VC & WDC
Councillor Special Seats/ Member WDC
Member VC & WDC
Member VC & WDC
Member VC & WDC
Member VC & WDC
Member Village Council (VC)
Headmaster Member Village Council (VC)
Deputy Headmaster, Member school committee & WDC
Dispensary Health Committee
Organisation Person Met Position
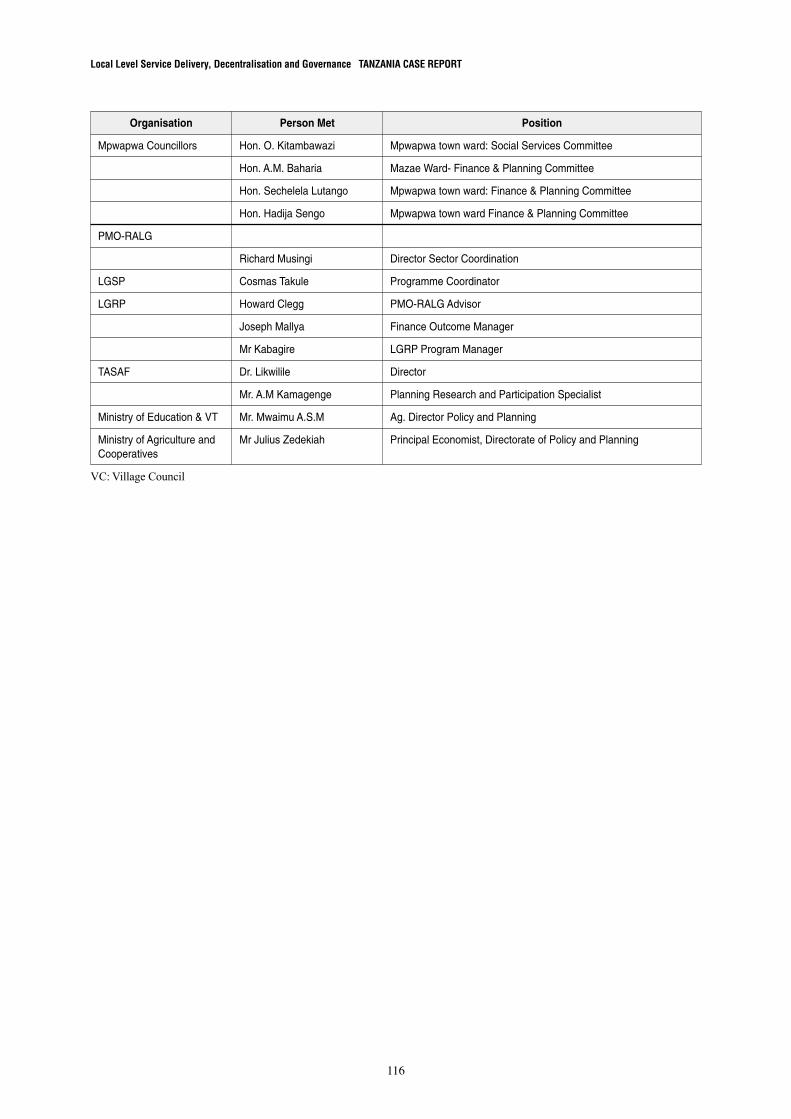
Local Level Service Delivery, Decentralisation and Governance TANZANIA CASE REPORT
116
Mpwapwa Councillors
PMO-RALG
LGSP
LGRP
TASAF
Ministry of Education & VT
Ministry of Agriculture and Cooperatives
Hon. O. Kitambawazi
Hon. A.M. Baharia
Hon. Sechelela Lutango
Hon. Hadija Sengo
Richard Musingi
Cosmas Takule
Howard Clegg
Joseph Mallya
Mr Kabagire
Dr. Likwilile
Mr. A.M Kamagenge
Mr. Mwaimu A.S.M
Mr Julius Zedekiah
Mpwapwa town ward: Social Services Committee
Mazae Ward- Finance & Planning Committee
Mpwapwa town ward: Finance & Planning Committee
Mpwapwa town ward Finance & Planning Committee
Director Sector Coordination
Programme Coordinator
PMO-RALG Advisor
Finance Outcome Manager
LGRP Program Manager
Director
Planning Research and Participation Specialist
Ag. Director Policy and Planning
Principal Economist, Directorate of Policy and Planning
Organisation Person Met Position
VC: Village Council