Local Government Fiscal Distress Monitoring - March 2018 · completing their outstanding financial...
37
LOCAL GOVERNMENT FISCAL DISTRESS MONITORING MARCH 2018 Auditor of Public Accounts Martha S. Mavredes, CPA www.apa.virginia.gov (804) 225-3350
Transcript of Local Government Fiscal Distress Monitoring - March 2018 · completing their outstanding financial...

LOCAL GOVERNMENT
FISCAL DISTRESS MONITORING
MARCH 2018
Auditor of Public Accounts Martha S. Mavredes, CPA www.apa.virginia.gov
(804) 225-3350

EXECUTIVE SUMMARY
Chapter 836 of the 2017 Virginia Acts of Assembly directs the Auditor of Public Accounts (Office) to establish a prioritized early warning system and annually monitor data and information from this system to identify potential fiscal distress within local governments across Virginia. During 2017, the Office developed criteria for making a preliminary determination of potential fiscal distress based on an analysis of calculating ten key financial ratios using audited financial statement data, along with considering other nonfinancial and qualitative factors, for the 171 localities required to annually report to our Office. This analysis, referred to as the Financial Assessment Model (FAM), ranks each locality’s ten ratio results in the model to determine an overall composite FAM score for each locality. The Office analyzed all cities, counties, and the two towns having a separate school system in one model, and we analyzed the other 36 towns required to annually report audited financial statements in a separate model.
The Office evaluated each locality’s ratios and FAM score results over a three-year trend for fiscal
years 2014, 2015, and 2016. Using the fiscal year 2016 FAM score results, we developed an internal threshold to use as an indicator, or starting point, for making a preliminary determination of the need to perform further follow up with a locality that appeared to show signs of potential fiscal distress. For all cities, counties, and the two towns having a separate school system, we set this threshold at a FAM score of less than or equal to 16 percent. Based on the results of this analysis, the Office identified the following eight localities for additional review:
The Cities of Bristol and Richmond, and the Counties of Page and Richmond were identified based on their FAM scores meeting the 16 percent threshold.
The Counties of Giles and Northumberland were identified due to their FAM scores trending significantly downward from the prior years.
The Cities of Hopewell and Manassas Park were qualitatively identified, as they remain delinquent in submitting their 2016 annual financial reports and; therefore, could not be evaluated in the model.
The Financial Assessment Model is used as a starting point to make a preliminary determination of the need for our Office to perform further follow up with a locality. Our follow up process focuses on qualitative factors impacting a locality’s situation to gain information related to budget processes, debt, borrowing, expenses and payables, revenues and receivables, staffing, and any other external variables contributing to a locality's financial position, through use of the financial assessment questionnaire and further discussions with locality officials. The financial assessment questionnaire is a key component of our follow up process as it is designed to examine the more qualitative and external factors unique to each locality that are not easily measured in a financial ratio, along with understanding policy and procedural aspects that contribute to a locality’s FAM score result in the ratio analysis. The primary objective of our follow up is to determine whether a locality is experiencing a situation of fiscal distress that warrants further assistance or intervention from the Commonwealth. If necessary, after completion of our follow up with a locality, the Office then formally notifies, in writing, the Governor, Chairmen of

House Appropriations and Senate Finance Committees (Money Committees), and the locality’s governing body, concerning any specific issues at the locality that may require further assistance or intervention by the Commonwealth. At that point, the process is administered by the Governor’s office and the Money Committees for further consideration of any plan and action by the Commonwealth to help address the locality’s fiscal distress situation.
For the eight localities where we made a determination of the need to perform additional follow
up in 2017, we sent written notification to inform the local governing body and chief executive officer of our identification and preliminary determination to perform further review based on the results of the 2016 FAM analysis. This communication explained that the locality must notify our Office regarding its decision to allow our additional follow up and review through completion of the assessment questionnaire and further discussions. The Office performed review of the completed questionnaires and held additional follow up discussions with locality officials for the Cities of Bristol and Richmond, and the Counties of Giles, Northumberland, and Richmond. The Office did not perform additional follow up with the County of Page, as the county declined our request to complete the questionnaire and allow our further review. In addition, the Office has deferred further review and follow up at this time with the Cities of Hopewell and Manassas Park, as they have not yet submitted their fiscal year 2016 and 2017 annual financial reports. Accordingly, we encouraged the cities to continue to focus their efforts on completing their outstanding financial reporting requirements, prior to completing our assessment questionnaire.
During our follow up process with the City of Richmond and the Counties of Giles,
Northumberland and Richmond, we obtained an understanding of the specific issues and factors that contributed to their low FAM score results or significant downward trends in our ratio analysis, and discussed the policies and plans they have in place to continue to move forward and improve their financial position. As a result of our follow up, the Office concluded that these four localities do not appear to be experiencing a situation of fiscal distress that would warrant further assistance or intervention from the Commonwealth; accordingly, our Office made no further notification or recommendation relating to fiscal distress. During follow up with the City of Bristol, we observed two primary issues that we concluded are contributing to a situation of fiscal distress at the city: issues specific to the operational sustainability of its solid waste disposal fund and the debt and future revenues related to The Falls commercial development project. Accordingly, the Office issued written notification to the Governor, Money Committees, Secretary of Finance, and city officials, detailing these specific issues and recommending that Bristol may warrant further assistance from the Commonwealth to help assess and stabilize these areas of concern with the city’s financial situation. Members of the offices of the Governor and Secretary of Finance have recently been in contact with our Office to discuss additional information on our recommendation regarding the city’s situation of fiscal distress, and to arrange further discussions with Bristol officials to follow up on the city’s progression since our initial review performed last year, in order to further evaluate what Commonwealth assistance may be most appropriate to support the City of Bristol.

- T A B L E O F C O N T E N T S –
Page # EXECUTIVE SUMMARY BACKGROUND 1 THE FINANCIAL ASSESSMENT MODEL 2-5 INTENT OF THE FINANCIAL ASSESSMENT MODEL AND ANALYSIS 6 ADDITIONAL FOLLOW UP REVIEW 6-8 NOTIFICATION TO LOCALITIES FOR FOLLOW UP REVIEW 8-10 Cities of Hopewell and Manassas Park 9-10 RESULTS OF LOCALITY REVIEWS 10-22 City of Bristol 10-13 City of Richmond 13-15 County of Giles 15-17 County of Northumberland 17-19 County of Page 19-20 County of Richmond 21-22 FUTURE REFINEMENTS TO EARLY WARNING SYSTEM AND ANALYSIS 23-26 TRANSMITTAL LETTER 27 APPENDIX A: Ratio Calculations and Interpretation 28-30 APPENDIX B: 2016 Financial Assessment Model Ratio Results by Locality 31-33

1 Monitoring for Local Fiscal Distress
LOCAL GOVERNMENT FISCAL DISTRESS MONITORING
Background
Chapter 836 of the 2017 Virginia Acts of Assembly, Item 4-8.03, (Chapter 836) sets out the requirements and parameters for Virginia’s early warning monitoring system focused on identifying local government fiscal distress. The definition of fiscal distress, as defined in the context of the 2017 Session of the General Assembly, refers to a local government’s situation where the provision and sustainability of public services is threatened by various administrative and financial shortcomings, including but not limited to:
cash flow issues, structurally imbalanced budgets, debt overload, deficit spending, and inability to pay expenses;
revenue shortfalls and billing and revenue collection inadequacies and discrepancies;
failure to meet obligations to authorities, school divisions, or political subdivisions of the Commonwealth; and/or
lack of trained and qualified staff to process administrative and financial transactions.
Chapter 836 directs the Auditor of Public Accounts (Office) to develop criteria for making a
preliminary determination of local government fiscal distress based on audited financial statements, other financial data, and nonfinancial factors. Further, the Office is charged with establishing a prioritized early warning system based on the established criteria and monitoring the data and information on an annual basis to identify potential fiscal distress within localities across Virginia. Should the Office make a preliminary determination of potential fiscal distress at a locality, we are required to notify the local governing body and chief executive officer of our preliminary determination. Based on the request from the local governing body or chief executive officer, in order to determine the extent of any fiscal distress, the Office will then perform a more detailed review of the locality to consider such factors as budget processes, debt, borrowing, expenses and payables, revenues and receivables, staffing, and any other external variables contributing to a locality's financial position. Should the Office determine that a locality is experiencing a situation of fiscal distress, we are required to notify the Governor, Chairmen of House Appropriations and Senate Finance Committees (Money Committees), and the local governing body of the specific areas our Office has evaluated and concluded that state assistance, oversight, or targeted intervention may be needed to further assess, help stabilize, or remediate a locality’s situation.

2 Monitoring for Local Fiscal Distress
The Financial Assessment Model
As our Office conducted various research for this initiative, we reviewed national studies and publications and contacted several other state audit offices to gain an understanding on how other states similarly approach an early warning system and monitoring efforts. As a result of the Office’s outreach, the Louisiana Legislative Auditor’s office shared some of the monitoring efforts they have in place through a financial ratio analysis, called the Financial Assessment Model. This analysis is part of a larger model Louisiana uses to monitor their localities to determine if the state needs to appoint a fiscal administrator at a distressed locality.
The Financial Assessment Model (FAM) calculates
ten financial ratios using audited financial statement data for each entity evaluated in the model, ranks each ratio results against all of the entities’ results included in the model, and converts the results into percentile rankings. The model then calculates an average of the ten ratio percentile rankings to determine an overall composite FAM score for each entity evaluated within the model. When Louisiana reviewed criteria for their monitoring system, they evaluated the performance of about twenty fiscally distressed or bankrupt local governments well known around the nation and applied approximately 1,700 different financial ratios using the financial statement data publicly available for these local governments. Louisiana narrowed down their ratio analysis to ten key financial ratios used in Financial Assessment Model based primarily on which ratios best depicted the financial distress of the local governments reviewed in their model and how poorly the local governments performed in comparison to other entities.
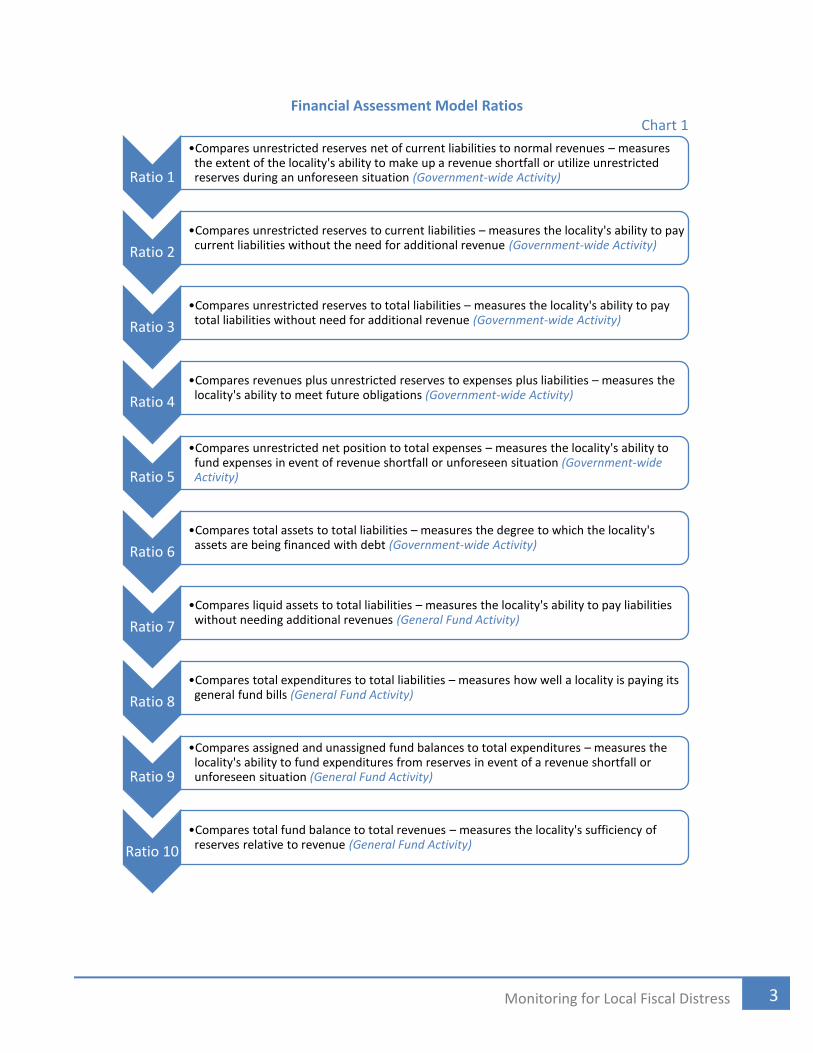
Chart 1 on the following page describes each of the ten ratios included in the Financial
Assessment Model. The first six ratios are calculated using audited data from a locality’s overall financial statement of net position and statement of activities for all governmental and business type activities combined. The last four ratios are calculated using audited data from the balance sheet and income statement of a locality’s general fund—its primary operating fund. Refer to Appendix A at the end of this report for additional information on the detailed calculations for each ratio, along with a further description and interpretation of each ratio’s results.
Louisiana evaluated the performance
of about twenty fiscally distressed or
bankrupt local governments well
known around the nation and
calculated approximately 1,700
different financial ratios for these
local governments. They selected the
10 key financial ratios in the Financial
Assessment Model, based primarily on
which ratios best depicted the
financial distress of the local
governments reviewed in their model
and how poorly the local governments
performed in comparison to other
entities.
3 Monitoring for Local Fiscal Distress
Financial Assessment Model Ratios Chart 1
Ratio 1
•Compares unrestricted reserves net of current liabilities to normal revenues – measures the extent of the locality's ability to make up a revenue shortfall or utilize unrestricted reserves during an unforeseen situation (Government-wide Activity)
Ratio 2
•Compares unrestricted reserves to current liabilities – measures the locality's ability to pay current liabilities without the need for additional revenue (Government-wide Activity)
Ratio 3
•Compares unrestricted reserves to total liabilities – measures the locality's ability to pay total liabilities without need for additional revenue (Government-wide Activity)
Ratio 4
•Compares revenues plus unrestricted reserves to expenses plus liabilities – measures the locality's ability to meet future obligations (Government-wide Activity)
Ratio 5
•Compares unrestricted net position to total expenses – measures the locality's ability to fund expenses in event of revenue shortfall or unforeseen situation (Government-wide Activity)
Ratio 6
•Compares total assets to total liabilities – measures the degree to which the locality's assets are being financed with debt (Government-wide Activity)
Ratio 7
•Compares liquid assets to total liabilities – measures the locality's ability to pay liabilities without needing additional revenues (General Fund Activity)
Ratio 8
•Compares total expenditures to total liabilities – measures how well a locality is paying its general fund bills (General Fund Activity)
Ratio 9
•Compares assigned and unassigned fund balances to total expenditures – measures the locality's ability to fund expenditures from reserves in event of a revenue shortfall or unforeseen situation (General Fund Activity)
Ratio 10
•Compares total fund balance to total revenues – measures the locality's sufficiency of reserves relative to revenue (General Fund Activity)

4 Monitoring for Local Fiscal Distress
During our outreach with Louisiana, the Legislative Auditor’s office previously observed media coverage about the financial distress occurring at the City of Petersburg. To provide our Office a more pertinent example of the results of their Financial Assessment Model, Louisiana evaluated Petersburg as part of the model and ratio analysis for their localities, by calculating the ten ratios for Petersburg using data from the city’s annual financial reports starting with the fiscal year 2009 through the fiscal year 2015. Louisiana’s internal FAM results portrayed the City of Petersburg on a steady fiscal decline starting in fiscal year 2009 with a FAM score of 19.7 percent and ending with a FAM score of 7.4 percent in 2015. Accordingly, our Office determined that using this Financial Assessment Model and ratio analysis would be a reliable starting point during our first year of implementation to establish the foundation of an early warning system and develop criteria to make preliminary determination of potential fiscal distress at Virginia local governments.
In 2017, our Office developed criteria for making a preliminary determination of potential fiscal
distress using the Financial Assessment Model to calculate ten financial ratios for the 171 localities required to annually report to the Auditor of Public Accounts. We also considered other qualitative factors unique to each locality as part of our analysis. Our Office analyzed all cities, counties, and the two towns having a separate school system in one model. We analyzed the other 36 towns, who are statutorily required to report audited annual financial reports, in a separate model due to these towns generally not providing the same breadth of services as the other localities. We evaluated each locality’s ratios and FAM score results over a three-year trend using audited financial statement data for fiscal years 2014, 2015, and 2016. Using the fiscal year 2016 FAM score results, the Office developed an internal threshold to use as an indicator, or starting point, for making a preliminary determination of the need to perform further follow up with a locality that appeared to show signs of potential fiscal distress. For all cities, counties, and the two towns having a separate school system, we set this threshold at a FAM score of less than or equal to 16 percent.
Based on the results of the 2016 FAM analysis, the
Office identified four localities, the Cities of Bristol and Richmond and the Counties of Page and Richmond, whose FAM score met this 16 percent threshold. In addition, we identified the Counties of Giles and Northumberland for follow up due to their 2016 FAM scores trending significantly downward from the prior years. Further, using a qualitative determination, we identified the Cities of Hopewell and Manassas Park for follow up, as they remain delinquent in completing their fiscal year 2016 annual financial reports and; therefore, could not be evaluated in our FAM ratio analysis. The Office did not identify any of the 36 towns evaluated in a separate model as having a 2016 FAM score that indicated a need to perform further review at the time. The Office applied professional judgment and a more qualitative analysis when reviewing the FAM scores and trends for the 36 towns. The City of Petersburg was also evaluated in our model with all other cities, counties, and the two towns having a separate school system, resulting in a 2016
Based on the 2016 FAM analysis,
the Office identified eight localities
for additional follow up:
The Cities of Bristol and Richmond and the Counties of Page and Richmond, as their
FAM scores met the 16 percent threshold.
The Counties of Giles and Northumberland, as their FAM
scores trended significantly downward from the prior years.
The Cities of Hopewell and Manassas Park were
qualitatively identified, as they have not yet submitted their
2016 annual financial reports.
5 Monitoring for Local Fiscal Distress
FAM score of 4.4 percent. While Petersburg’s FAM score was below the 16 percent threshold, our Office performed no further follow up or outreach since the city’s fiscal distress situation was previously identified and the Secretary of Finance’s office was providing assistance to the city at the time of our analysis. Appendix B at the end of this report provides a summary of the FAM analysis showing each locality’s ratio results for fiscal year 2016 and our determination of whether or not further follow up was needed with the locality.
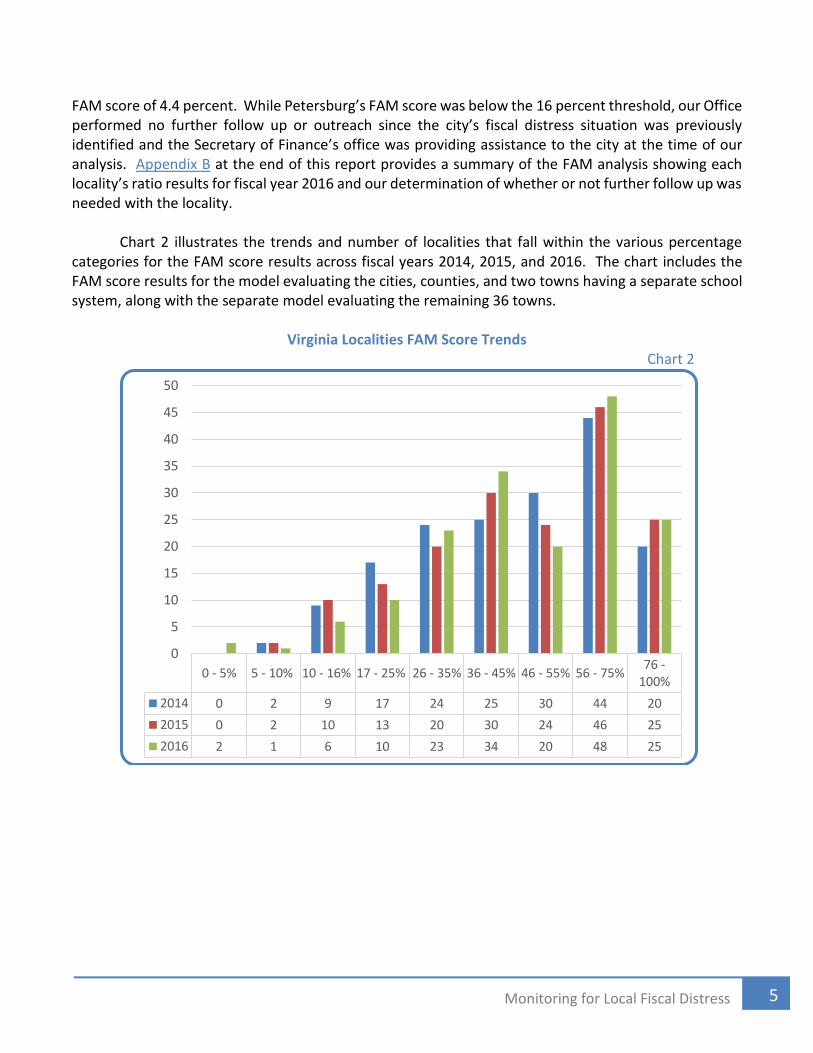
Chart 2 illustrates the trends and number of localities that fall within the various percentage
categories for the FAM score results across fiscal years 2014, 2015, and 2016. The chart includes the FAM score results for the model evaluating the cities, counties, and two towns having a separate school system, along with the separate model evaluating the remaining 36 towns.
Virginia Localities FAM Score Trends
Chart 2
0 - 5% 5 - 10% 10 - 16% 17 - 25% 26 - 35% 36 - 45% 46 - 55% 56 - 75%76 -
100%
2014 0 2 9 17 24 25 30 44 20
2015 0 2 10 13 20 30 24 46 25
2016 2 1 6 10 23 34 20 48 25
0
5
10
15
20
25
30
35
40
45
50

6 Monitoring for Local Fiscal Distress
Intent of the Financial Assessment Model and Analysis
The Office recognizes that the Financial Assessment Model may have its limitations since the analysis is based solely on the calculations of ten financial ratios, and the overall FAM scores are derived by applying a ranking methodology to the ratio results across all localities evaluated within the model. The Office emphasizes that the only purpose for evaluating each locality’s FAM score calculation in the model is for our internal use to set a cut-off threshold as a basis and starting point for making a preliminary determination of the need to perform further follow up with a locality that appears to show signs of potential fiscal distress. Our evaluation and identification of localities meeting the 16 percent threshold is not intended to state definitively that a locality is experiencing fiscal distress that warrants further assistance or action by the Commonwealth. Accordingly, our follow up assessment questionnaire, which is described in more detail below, is a key component of our process, as it is designed to examine the more qualitative and external factors unique to each locality that are not easily measured in a financial ratio, along with understanding policy and procedural aspects contributing to a locality’s FAM score result in the ratio analysis.
Further, the Office stresses the importance of understanding that the FAM ratio analysis and FAM
score results are not meant to give an evaluation nor a rating of financial health to those localities that have a higher FAM score above the 16 percent threshold. Again, the Office’s primary goal for the FAM analysis is to use it as an early indicator to help identify any potential signs of fiscal distress at a locality. Throughout this process, the Office has communicated to localities and other stakeholders that we see no significance in emphasizing each locality’s individual FAM score or how the locality may have scored in the model compared to other localities. Our analysis and this review is not intended to rank one locality better or worse against another locality. In addition, the Office cautions localities and stakeholders about relying too much on locality FAM scores that were above our 16 percent threshold in the 2016 model, as we plan to update and make adjustments to our model during this coming year’s monitoring process. Consequently, the rating process or scoring results could be significantly different for a locality, depending on the additional factors we consider and other criteria and ratios we may add or change in the model, which is discussed later in the Future Refinements to the Early Warning System and Analysis section of the report. Additional Follow Up Review
As noted above, the Financial Assessment Model is used as a starting point to make a preliminary determination of the need for our Office to perform further follow up with a locality that appears to show signs of potential fiscal distress as indicated from the calculated ratios and FAM score results. Our
The only purpose of the FAM score
in the model is for our Office’s
internal assessment to set a cut-off
threshold in making a preliminary
determination of potential distress.
There is no significance in
emphasizing each localities’ FAM
scores compared to other localities;
the analysis is not intended to rank
one locality better or worse against
another locality.

7 Monitoring for Local Fiscal Distress
follow up review focuses on more qualitative factors impacting a locality’s situation to gain information related to budget processes, debt, borrowing, expenses and payables, revenues and receivables, staffing, and any other external variables contributing to a locality's financial position, through use of the financial assessment questionnaire and further discussions with locality management and the governing body. The primary objective of our follow up is to further determine whether a locality is truly experiencing a situation of fiscal distress that warrants further assistance or intervention from the Commonwealth. Given the focus and primary purpose of this follow up process on identifying fiscal distress, the Office’s further review of a locality is not intended to conclude or give an opinion that a locality is fiscally healthy. We emphasize the importance that the legislature has tasked our Office with developing an annual monitoring system that focuses on looking for early warning signs to determine if a locality is in fiscal distress, and make a conclusion of whether a locality needs state assistance or intervention to further assess, help stabilize, or remediate the situation. Accordingly, our annual monitoring and follow up review process is not designed to evaluate or opine on a locality’s fiscal health. The governing body and management at each locality have the responsibility for assessing and monitoring its fiscal health and stability.
Chart 3 outlines some of the key factors when evaluating and defining fiscal distress versus fiscal health.
Focus of Fiscal Distress versus Fiscal Health Chart 3
Fiscal Distress
Generally based on cash flow and immediate short term issues
Often evaluated using ratios focused on cash and fund balance/reserves
Fiscal Health
Based on long-term sustainability of a local government's finances and operations
Measured in terms of assets; revenue and spending per capita; ability to provide services; and structural deficit or surplus
The financial assessment
questionnaire is a key component of
our follow up process, as it is
designed to examine more
qualitative and external factors
unique to each locality that are not
easily measured in a financial ratio,
along with understanding policy and
procedural aspects contributing to a
locality’s FAM score result in the ratio
analysis.
8 Monitoring for Local Fiscal Distress
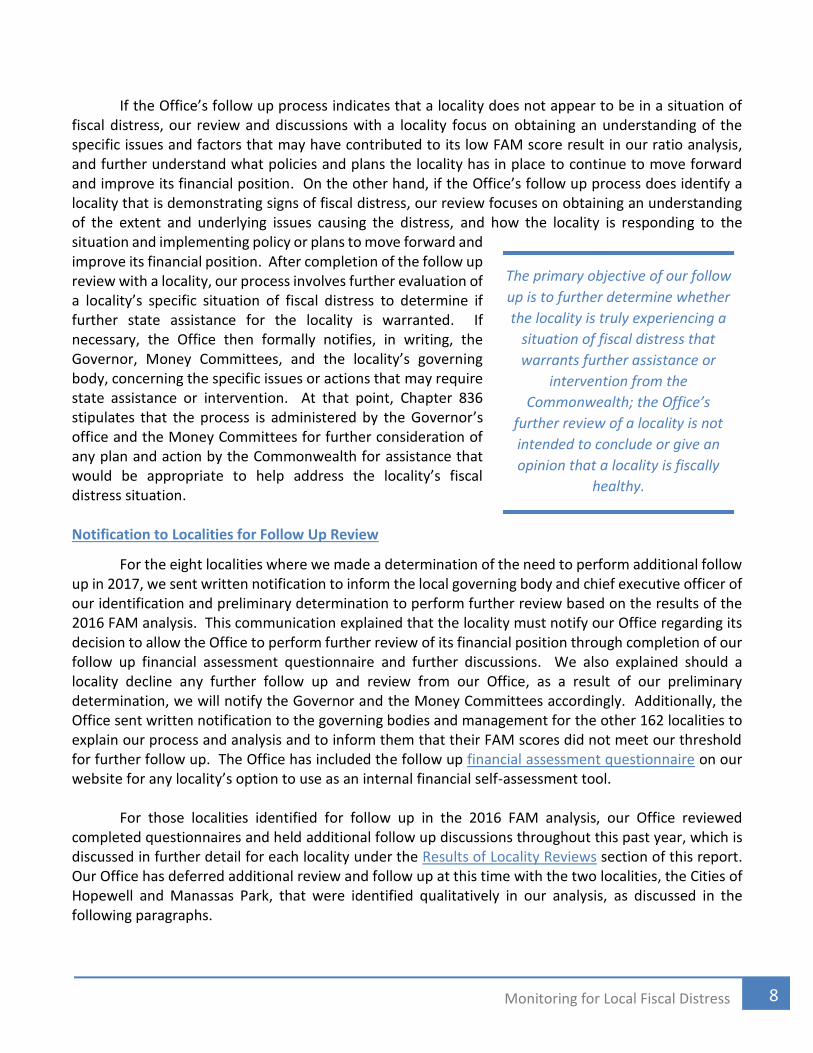
If the Office’s follow up process indicates that a locality does not appear to be in a situation of fiscal distress, our review and discussions with a locality focus on obtaining an understanding of the specific issues and factors that may have contributed to its low FAM score result in our ratio analysis, and further understand what policies and plans the locality has in place to continue to move forward and improve its financial position. On the other hand, if the Office’s follow up process does identify a locality that is demonstrating signs of fiscal distress, our review focuses on obtaining an understanding of the extent and underlying issues causing the distress, and how the locality is responding to the situation and implementing policy or plans to move forward and improve its financial position. After completion of the follow up review with a locality, our process involves further evaluation of a locality’s specific situation of fiscal distress to determine if further state assistance for the locality is warranted. If necessary, the Office then formally notifies, in writing, the Governor, Money Committees, and the locality’s governing body, concerning the specific issues or actions that may require state assistance or intervention. At that point, Chapter 836 stipulates that the process is administered by the Governor’s office and the Money Committees for further consideration of any plan and action by the Commonwealth for assistance that would be appropriate to help address the locality’s fiscal distress situation. Notification to Localities for Follow Up Review
For the eight localities where we made a determination of the need to perform additional follow up in 2017, we sent written notification to inform the local governing body and chief executive officer of our identification and preliminary determination to perform further review based on the results of the 2016 FAM analysis. This communication explained that the locality must notify our Office regarding its decision to allow the Office to perform further review of its financial position through completion of our follow up financial assessment questionnaire and further discussions. We also explained should a locality decline any further follow up and review from our Office, as a result of our preliminary determination, we will notify the Governor and the Money Committees accordingly. Additionally, the Office sent written notification to the governing bodies and management for the other 162 localities to explain our process and analysis and to inform them that their FAM scores did not meet our threshold for further follow up. The Office has included the follow up financial assessment questionnaire on our website for any locality’s option to use as an internal financial self-assessment tool.
For those localities identified for follow up in the 2016 FAM analysis, our Office reviewed
completed questionnaires and held additional follow up discussions throughout this past year, which is discussed in further detail for each locality under the Results of Locality Reviews section of this report. Our Office has deferred additional review and follow up at this time with the two localities, the Cities of Hopewell and Manassas Park, that were identified qualitatively in our analysis, as discussed in the following paragraphs.
The primary objective of our follow
up is to further determine whether
the locality is truly experiencing a
situation of fiscal distress that
warrants further assistance or
intervention from the
Commonwealth; the Office’s
further review of a locality is not
intended to conclude or give an
opinion that a locality is fiscally
healthy.

9 Monitoring for Local Fiscal Distress
Cities of Hopewell and Manassas Park
As noted above, the Office has deferred further review and follow up at this time with the Cities of Hopewell and Manassas Park, as they both remain delinquent in submitting their fiscal year 2016 and 2017 annual financial reports and required information for our annual comparative reports. The Office communicated with the City of Hopewell on several occasions during 2017 to provide an overview of our fiscal distress monitoring process and provide additional clarification as to the timing and completion of the fiscal stress follow-up questionnaire. Hopewell officials have informed the Office that the city’s delinquency with completing its financial reporting requirements over the past four fiscal years is primarily due to issues with implementing a new financial system in September 2014. In addition, the City of Hopewell has experienced turnover in key management positions in the area of finance and budget over these years, resulting in a significant loss of accounting and financial reporting knowledge. Both of these areas have contributed to material weaknesses in internal controls related to accounting and financial reporting, as reported in Hopewell’s fiscal years 2014 and 2015 annual financial reports. While some of the city’s key finance and budget management positions have been recently filled, for example, the Director of Finance position, Hopewell continues to work through post implementation system issues and the transition with filling key finance positions.
Additionally, during 2017, our Office held discussions with the Mayor, City Manager, and Chief
Financial Officer for the City of Manassas Park to gain additional understanding of its situation and the unusual, external factors that have contributed to the delays with the city completing its audit and annual financial reports. Manassas Park officials explained that the city’s delinquency with completing its financial reporting requirements over the past three fiscal years is primarily due to external issues that occurred in the fall of 2015 related to an emergency evacuation of its city hall building because of toxic fumes from roof repairs to the building, along with a sudden, catastrophic failure of its internal system that housed the city’s primary financial system for revenues and receipts. The city’s efforts to repair its internal system were not successful; therefore, forcing the city to work through a time consuming process of reviewing manual supporting documentation in order to load all data into the city’s new financial system. Further, during fiscal year 2016, Manassas Park experienced turnover in several key management positions, resulting in a significant loss of accounting and financial reporting knowledge, coupled with the city engaging a new audit firm to complete its fiscal year 2016 and 2017 audits.
Our Office emphasized to both the Cities of Hopewell and Manassas Park that completion of their
reporting requirements takes precedence over our fiscal distress follow up assessment questionnaire, given the statutorily mandated deadline for localities to complete their annual reporting requirements by November 30 each year. Accordingly, we encouraged the cities to continue to focus their efforts on completing their outstanding financial reporting requirements, prior to completing our assessment questionnaire. In early 2018, our Office received updated information from both Hopewell and Manassas Park that their financial audits are still ongoing, and they continue to work diligently to complete their financial reporting requirements. As soon as the Cities of Hopewell and Manassas Park have completed and submitted the fiscal years 2016 and 2017 financial reporting requirements, our Office will evaluate the cities’ data in our current year model, review any qualitative factors as part of
10 Monitoring for Local Fiscal Distress
our annual monitoring process, and communicate at a later date regarding the need to complete the assessment questionnaire for our further review and follow up.
Results of Locality Reviews
As noted above, our Office performed review of the completed questionnaires and held additional follow up discussions with locality officials for five localities identified in the 2016 FAM analysis (the Cities of Bristol and Richmond, and the Counties of Giles, Northumberland, and Richmond) as further discussed in detail for each locality below. The Office did not perform follow up with the County of Page, which is discussed in detail below, as the county declined our request to complete the questionnaire and allow our further review.
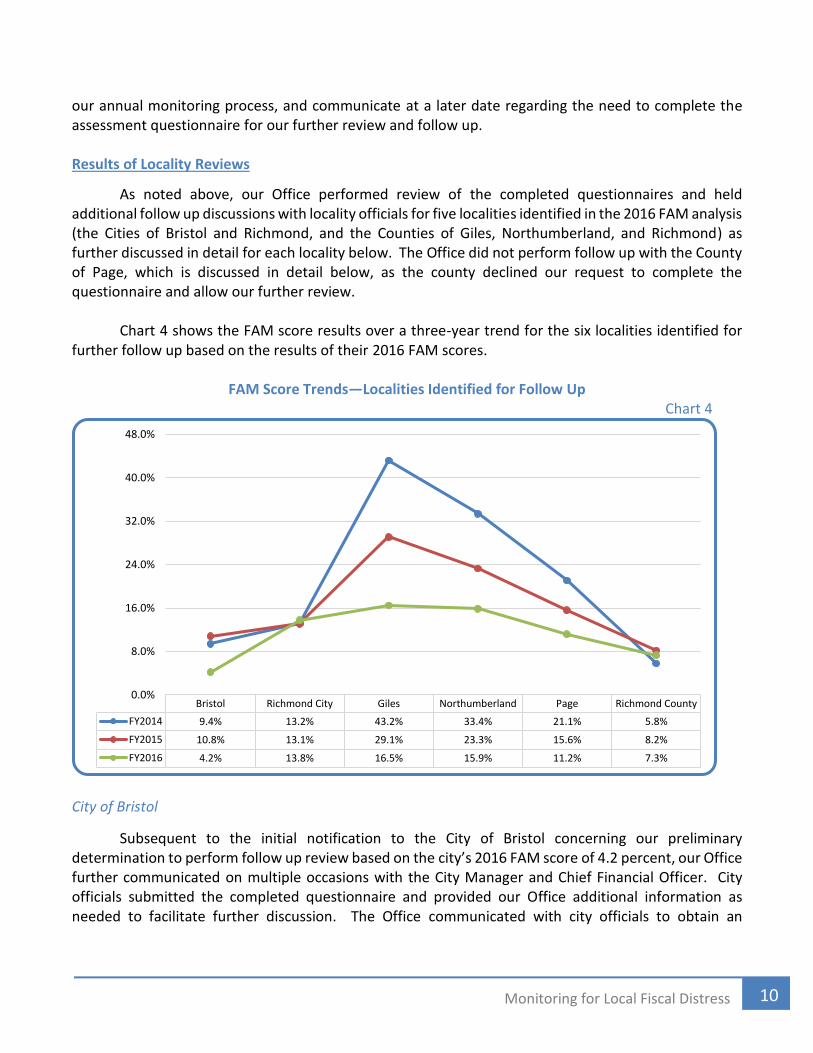
Chart 4 shows the FAM score results over a three-year trend for the six localities identified for
further follow up based on the results of their 2016 FAM scores.
FAM Score Trends—Localities Identified for Follow Up Chart 4
City of Bristol
Subsequent to the initial notification to the City of Bristol concerning our preliminary determination to perform follow up review based on the city’s 2016 FAM score of 4.2 percent, our Office further communicated on multiple occasions with the City Manager and Chief Financial Officer. City officials submitted the completed questionnaire and provided our Office additional information as needed to facilitate further discussion. The Office communicated with city officials to obtain an
Bristol Richmond City Giles Northumberland Page Richmond County
FY2014 9.4% 13.2% 43.2% 33.4% 21.1% 5.8%
FY2015 10.8% 13.1% 29.1% 23.3% 15.6% 8.2%
FY2016 4.2% 13.8% 16.5% 15.9% 11.2% 7.3%
0.0%
8.0%
16.0%
24.0%
32.0%
40.0%
48.0%
11 Monitoring for Local Fiscal Distress
understanding of the specific issues and factors that contributed to its low FAM score result in the ratio analysis.
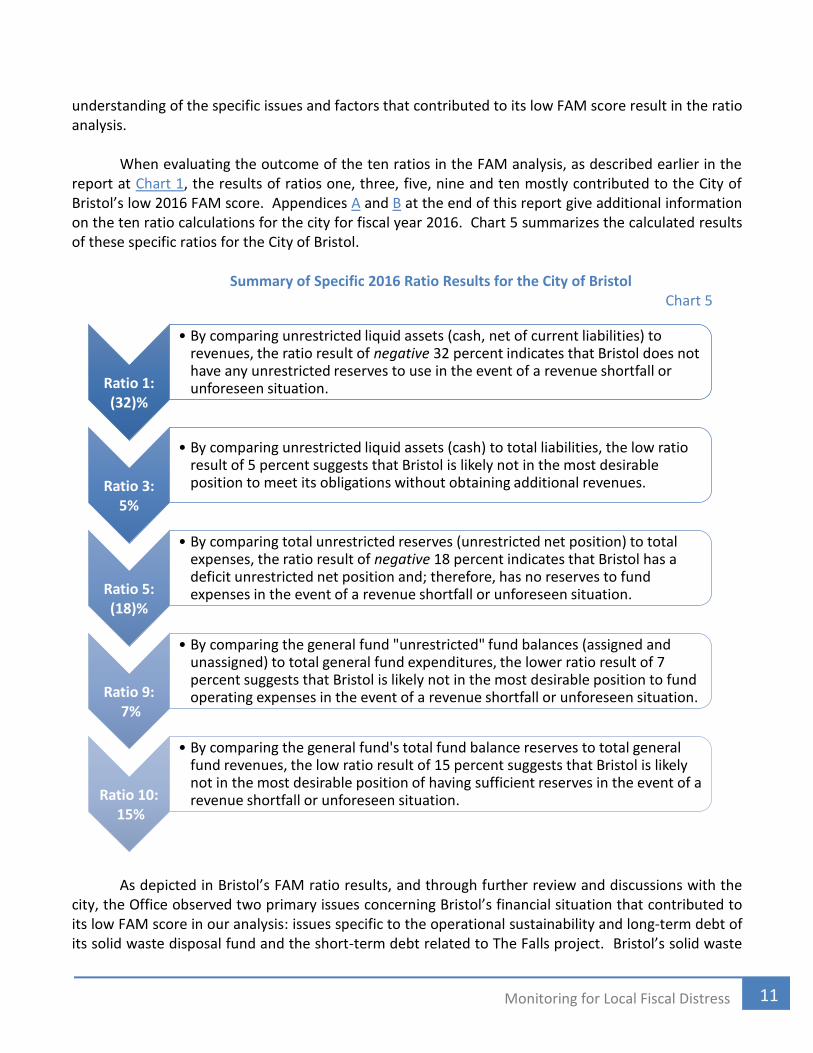
When evaluating the outcome of the ten ratios in the FAM analysis, as described earlier in the
report at Chart 1, the results of ratios one, three, five, nine and ten mostly contributed to the City of Bristol’s low 2016 FAM score. Appendices A and B at the end of this report give additional information on the ten ratio calculations for the city for fiscal year 2016. Chart 5 summarizes the calculated results of these specific ratios for the City of Bristol.
Summary of Specific 2016 Ratio Results for the City of Bristol
Chart 5
As depicted in Bristol’s FAM ratio results, and through further review and discussions with the
city, the Office observed two primary issues concerning Bristol’s financial situation that contributed to its low FAM score in our analysis: issues specific to the operational sustainability and long-term debt of its solid waste disposal fund and the short-term debt related to The Falls project. Bristol’s solid waste
Ratio 1: (32)%
• By comparing unrestricted liquid assets (cash, net of current liabilities) to revenues, the ratio result of negative 32 percent indicates that Bristol does not have any unrestricted reserves to use in the event of a revenue shortfall or unforeseen situation.
Ratio 3: 5%
• By comparing unrestricted liquid assets (cash) to total liabilities, the low ratio result of 5 percent suggests that Bristol is likely not in the most desirable position to meet its obligations without obtaining additional revenues.
Ratio 5: (18)%
• By comparing total unrestricted reserves (unrestricted net position) to total expenses, the ratio result of negative 18 percent indicates that Bristol has a deficit unrestricted net position and; therefore, has no reserves to fund expenses in the event of a revenue shortfall or unforeseen situation.
Ratio 9:7%
• By comparing the general fund "unrestricted" fund balances (assigned and unassigned) to total general fund expenditures, the lower ratio result of 7 percent suggests that Bristol is likely not in the most desirable position to fund operating expenses in the event of a revenue shortfall or unforeseen situation.
Ratio 10:15%
• By comparing the general fund's total fund balance reserves to total general fund revenues, the low ratio result of 15 percent suggests that Bristol is likely not in the most desirable position of having sufficient reserves in the event of a revenue shortfall or unforeseen situation.
12 Monitoring for Local Fiscal Distress
disposal fund, a business-type activity to account for the operations of the city’s landfill and waste collection system, has never been a self-supporting activity. Over the past several fiscal years, Bristol has continued to transfer significant funds from its general fund in order to sustain the operations of the solid waste fund. Consequently, during fiscal year 2016, the city wrote off a receivable of approximately $22 million in its general fund, as management determined this receivable, representing the cumulative amount the solid waste fund owed to the general fund, was uncollectible. Further, Bristol’s recently audited annual financial report continues to report a growing deficit net position in the solid waste fund. Specifically, the annual financial report for fiscal year 2017 disclosed the following on page 41 of the notes to the financial statements:
The solid waste disposal fund has an accumulated deficit in net position of ($17,605,804). The City is currently funding the operating losses out of the general fund; however, it continues to monitor the operations of the landfill and is exploring opportunities to produce operating surpluses in future fiscal years to reduce the deficit. One of the primary factors that contributes to the deficit net position in the solid waste fund is
the high amount of outstanding debt that the city is carrying related to the landfill and waste collection system relative to the total assets reported in the fund. As of fiscal year 2017, the total amount of non-current bonds payable in the solid waste fund was $33,590,539, as reported on page 28 of the city’s annual financial report. Further, the general fund continued to transfer funds during fiscal year 2017 to support the operations of the solid waste fund, as disclosed in the notes to the financial statements at page 48 of the city’s annual financial report.
Additionally, Bristol continues to have concerns about the high amount of outstanding debt it
carries related to The Falls project, a 1.5 million square foot commercial development project for shopping, dining, and entertainment at Exit 5 off Interstate 81. The city’s fiscal year 2017 annual financial report disclosed, on page 51 of the report, the revenue bond anticipation notes issued for The Falls project has a total outstanding balance of $47,530,000. When our Office communicated with city officials last year, Bristol was considering various options at the time for a debt refinancing plan to provide long-term financing for this outstanding debt, which was set to mature during fiscal years 2020 and 2021. Based on further information our Office subsequently received, Bristol successfully closed on a debt restructure plan during February 2018. However, the city’s increasing debt service costs continues to be a concerning factor, as Bristol’s ability to pay the debt service will be contingent upon sufficient future revenues received from The Falls project.
Chapter 551 of the 2014 Virginia Acts of Assembly amended the Code of Virginia requirements
related to the Retail Sales and Use Tax, allowing Bristol to retain sales tax revenues generated from The Falls commercial development project. In accordance with §58.1-608.3 of the Code of Virginia, The Falls project in the City of Bristol meets the requirements for a “development of regional impact” and is deemed a public facility in accordance with this section. Accordingly, Bristol is entitled to an additional 2.5 percent of the general fund portion of state sales tax revenues generated by transactions taking place at The Falls commercial project to pay the cost of any bonds that were issued for the development of this project. Further, this Code section stipulates that in instances where any public facility consists of more than one building or structure, such as The Falls commercial project, the city can start receiving

13 Monitoring for Local Fiscal Distress
from the state any sales tax revenue, which is generated from transactions occurring at any store development that has started to operate at The Falls project, even though the construction of all phases, buildings, and structures of the public facility has not yet been completed. As reported in the city’s annual financial report for fiscal year 2016, Bristol started to see some increase in revenues due to local revenues coming in from the completion of phase one for The Falls retail development and; therefore, an increase of states sales tax remitted to the city. However, Bristol continues to experience some uncertainty with its long term revenue stream and future growth after all phases of The Falls project are implemented.
Upon completion of our follow up review of Bristol’s assessment questionnaire and additional
information, along with discussions with city officials, the Office concluded that the primary financial issues and factors described above are contributing to a situation of fiscal distress that exists at the City of Bristol. Accordingly, our Office issued written notification, in a letter dated December 6, 2017, to the Governor, Money Committees, Secretary of Finance, and locality officials, detailing the specific issues and recommending that Bristol may warrant further assistance from the Commonwealth to help assess and stabilize these areas of concern with the city’s financial situation. Specifically, to address the issue with the solid waste disposal fund, our Office recommended that further Commonwealth assistance may potentially include providing support to Bristol to assist with the city’s desire to have an independent consultant perform an overall assessment and provide an analysis of the landfill situation to determine the necessary costs associated with various scenarios related to the future operations of the city’s landfill. Further, the Office recommended that additional Commonwealth assistance may include providing financial expertise to assist city officials with their desire to develop a long-term financial forecast to assess Bristol’s current financial position related to its high outstanding debt and any other significant financial aspects, and to plan accordingly for the city’s foreseeable future. As of the date of this report, the Secretary of Finance’s office has been in contact with the Office to discuss additional information on our recommendation regarding the city’s situation of fiscal distress, and to arrange further discussions with city officials to obtain more updated information on Bristol’s progression since our follow up discussions and review performed last year, in order to further evaluate what Commonwealth assistance may be most appropriate to support the City of Bristol. City of Richmond
Subsequent to the initial notification to the City of Richmond concerning our preliminary determination to perform follow up review based on the city’s 2016 FAM score of 13.8 percent, the Office further communicated on multiple occasions with City Council, Council staff, and various members of the city’s finance department, to include the Deputy Chief Administrative Officer for Finance and Administration, the Finance Director, the Controller, and the Debt Manager, along with the city’s financial advisors. City officials submitted the completed questionnaire and provided the Office additional information as needed for our further understanding of the city’s current financial condition. To obtain a further understanding of some of the factors contributing to Richmond’s low FAM score result in our ratio analysis, the Office discussed with city
Table 1
City of Richmond Specific 2016 Ratio Results
Ratio 1 1%
Ratio 3 16%
Ratio 5 23%
Ratio 9 17%
Ratio 10 16%

14 Monitoring for Local Fiscal Distress
officials the governing body and management’s overall policies and procedures specific to the operations of the city.
When evaluating the outcome of the ten ratios in the FAM analysis, the results of ratios one,
three, five, nine and ten largely contributed to the City of Richmond’s low 2016 FAM score, as noted in Table 1. Appendices A and B at the end of this report give additional information on the ten ratio calculations for the city for fiscal year 2016.
As described earlier in this report at Chart 1, ratios one, five, nine, and ten primarily focus on
comparing the city’s overall unrestricted reserves to revenues and expenses, as well as the city’s unrestricted general fund balances to its operational revenues and expenses in the general fund. Accordingly, the lower percentage results at these ratios suggest the city has a minimal level of unrestricted reserves to use in the event of a revenue shortfall or unforeseen situation. While these ratios in the FAM analysis are intended to uniformly evaluate the balances that all localities categorize on their financial statements as unrestricted reserves, these ratios do not account for any specific reserves or fund balance that a locality’s policy may establish as a revenue stabilization fund, “rainy day fund,” to use in the event of a revenue shortfall or unforeseen situation. During additional follow up discussions, city officials highlighted that they have established a revenue stabilization fund, which is considered a committed fund balance in accordance with governmental accounting standards and has certain restrictions placed on the use of the funds according to the city’s fund balance policy. However, as noted above, this restricted balance is not factored into our ratio analysis and the calculations for ratios one, five, nine, and ten. As reported in Richmond’s recently audited annual financial report for fiscal year 2017, the notes to the financial statements on page 46 describe the city’s committed fund balance policy and the requirements of its revenue stabilization fund. The city’s overall fund balance policy is also summarized at page 120 of the financial report. In addition, as reported in Richmond’s 2017 annual financial report, the balance sheet, at page 22, reports an ending fund balance of $135,368,309 in the general fund. In accordance with the city’s fund balance policy, a total of $122,949,391 is identified as general fund unassigned and assigned fund balances, which is an increase of $18,888,342 from the prior fiscal year 2016 unrestricted balances used in our FAM ratio analysis. Further, the city’s fund balance policy designates $10,000,000 of the general fund balance as committed to the city’s revenue stabilization fund.
When considering the results of ratio three in the FAM analysis for Richmond, this ratio focuses on comparing the city’s total unrestricted liquid assets (i.e.: balances of cash and cash equivalents) to its total liabilities on a government-wide level, which includes the city’s general fund, other governmental funds, and business-type, proprietary funds. Accordingly, the city’s lower percentage result of 16 percent at ratio three, when compared to other locality’s ratio three results in the FAM analysis, contributes to why the city scored lower when evaluating the ability to meet obligations without obtaining additional revenues. However, as our Office discussed with city officials during the follow up process, Richmond emphasized that its debt levels are necessary given the capital needs of the city’s facilities and its schools, and the city complies with and manages its debt capacity in accordance with its formal debt policies.

15 Monitoring for Local Fiscal Distress
As stated earlier in this report, the Office recognizes that our FAM ratio analysis may have some limitations given the focus on calculating ten financial ratios and using a ranking methodology across all localities evaluated within the model to produce the overall FAM score results. Again, we emphasize that our identification of the City of Richmond as meeting the 16 percent FAM threshold was not intended to state definitively that the city is experiencing fiscal distress that needs further action by the Commonwealth, but was intended as a preliminary determination or a starting point to determine the need of additional follow up and discussions with the city. Richmond’s discussions and information provided to our Office for further understanding that they are not experiencing fiscal distress focused primarily on its strong bond rating process, along with other factors that impact its overall financial position, such as the city’s fund balance and debt policies as discussed above. The city emphasized that over the past eight to ten years, Richmond’s credit ratings have been upgraded seven times and remain in the highest end of the “AA” rating category. Specific to Richmond’s bond rating process, city officials and its financial advisors also discussed the importance of considering other qualitative and environmental factors outside of the ratios, such as the stability and depth of management, the city’s financial operations of having a structurally balanced budget, and the city’s increasing growth in its economic development. Further, the city highlighted the importance of evaluating key demographic factors like the continued growth of the city’s population and the city’s increase in assessed value of over four percent during fiscal year 2016.
Upon completion of our follow up process with the city and review of the various factors
discussed above, the Office concluded that the City of Richmond does not appear to be experiencing a situation of fiscal distress that would warrant further assistance or intervention from the Commonwealth; accordingly, our Office made no further notification or recommendation to the locality, Governor, and Money Committees relating to fiscal distress.
County of Giles
In August, the Office sent initial notification to the County of Giles concerning our preliminary determination to perform follow up review based primarily on the county’s significant downward trend of its 2016 FAM score of 16.5 percent, which trended downward from 43 percent in fiscal year 2014 and 29 percent in fiscal year 2015. Our Office sent additional communication to the county in two separate email correspondence during the months of September and October 2017, to ensure receipt of our initial notification and offer assistance if the county had questions or needed further information on the follow up process. Because our Office received no formal response from county officials during 2017, we concluded the county did not want to participate in our follow up process and issued a final notification on December 5, 2017, stating as such. However, on February 1, 2018, county officials did ultimately respond to our outreach, requested follow up, and apologized for their delayed response. Giles submitted its completed questionnaire and provided the Office additional information as needed to facilitate further discussion. The Office communicated with county officials to obtain an understanding of the specific issues and factors that contributed to the significant downward trend of the county’s 2016 FAM score from the prior years in the ratio analysis.

16 Monitoring for Local Fiscal Distress
When evaluating the outcome of the ten ratios in the
FAM analysis, the results of ratios one, five, nine and ten largely contributed to the County of Giles’ 2016 lower FAM score and significant downward trend from fiscal years 2014 and 2015, as noted in Table 2. Appendices A and B at the end of this report give additional information on the ten ratio calculations for the county for fiscal year 2016.
As described earlier in this report, ratios one, five, nine, and ten primarily focus on comparing
the county’s overall unrestricted reserves to revenues and expenses, as well as its unrestricted general fund balances to operational revenues and expenses in the general fund. Accordingly, Giles’ lower percentage results at these ratios for fiscal year 2016 indicate the county has a minimal level of unrestricted reserves to use in the event of a revenue shortfall or unforeseen situation; in particular, the negative result at ratio one indicates that the county has no unrestricted reserves available on an overall government-wide level due to the county’s deficit unrestricted net position reported in fiscal year 2016. When reviewing the county’s annual financial reports for fiscal years 2014, 2015, and 2016, the county’s general fund unassigned (unrestricted) fund balance has steadily declined over these years starting with a balance of $6,522,206 in 2014, then decreasing to a balance of $4,537,160 in 2015 and $1,619,903 in 2016, as reported on the balance sheet for each fiscal year, page seven in the 2014 financial report, 2015 financial report, and 2016 financial report.
Upon further discussions, Giles county officials explained the primary factors causing the decline
in the county’s general fund unrestricted reserves. As reported on page nine of the annual financial report for fiscal year 2016, the county explained that it used general fund reserves to fund projects in its capital improvement fund related to renovations to county schools, infrastructure in water lines, and public safety facilities, rather than incur additional debt to fund these projects. In addition, the county explained that timing delays of receiving reimbursements for several projects also contributed to the county’s low general fund balance at the end of the fiscal year. The general fund transferred reserves to cover the costs of these projects in other funds; however, the county did not receive the reimbursement of funds in time to include in the fiscal year 2016 financial statements. Further, the county explained that it used its general fund reserves to help balance the high increase in health insurance costs the county has experienced over the past several years, an increase of approximately $900,000 since fiscal year 2012, along with using general fund reserves to supplement the county’s school system with additional funds of approximately $1.9 million dollars over the last few years due to decreases in state funding.
Additionally, the county’s decrease in general fund reserves during fiscal year 2016 is attributed
to a large transfer that occurred from the general fund to the water and sewer fund. Specifically, as reported in the annual financial report for fiscal year 2016, page 26 of the notes to the financial statements, the general fund transferred $2,022,570 to the water and sewer fund. County officials explained that approximately $2 million of this transfer related primarily to a write-off of a receivable balance in its general fund, as management determined this receivable, representing a cumulative amount the water and sewer fund owed to the general fund over many years, was uncollectible. County
Table 2
Giles Specific Ratio Results
FY2016 FY2015 FY2014
Ratio 1 (6)% 15% 29%
Ratio 5 9% 5% 20%
Ratio 9 7% 20% 32%
Ratio 10 6% 19% 28%
17 Monitoring for Local Fiscal Distress
officials further discussed that these receivable and payable balances were likely a result of a combination of outstanding county and public service authority solid waste billings, along with prior uncollectible amounts related to a private water system that the county acquired in the 1990s.
During follow up discussions, Giles officials also explained that prior to our Office’s identification of the county in the FAM analysis and request for a follow up review, the board of supervisors and management have been closely monitoring the county’s situation and have implemented specific plans and actions to work toward increasing the county’s overall financial position. Specifically, Giles has consolidated county services to save costs, such as sharing finance positions across the county, its school system, and its public service authority; and consolidating the county’s maintenance and custodian services to cut back on costs for contractual expenses like cleaning and mowing services. Additionally, the county refinanced debt for its lease revenue bonds during fiscal year 2016 to save in interest costs over the life of the bonds. Further, county officials commented that they recently issued a request for proposal to seek new contract proposals for health insurance in an effort to help reduce the rising health insurance costs that the county pays for its employees. The county has also implemented a plan for maximization of its assets by renting office space to private companies to help increase the county’s revenues.
While the county has experienced significant decline in its local revenues as a result of losing
three Fortune 500 companies over the past several years, the county anticipates seeing local revenues begin to increase, starting in fiscal year 2018, resulting from a significant, private investment by Celanese, a technology and specialty materials company, in its manufacturing plant that has operated in Giles for over seventy-five years. County officials also discussed that during fiscal year 2017 the board of supervisors approved the transfer of certain funds, which were previously designated for the county’s reserve facility maintenance fund, as unrestricted reserves or unassigned fund balance in the general fund. In accordance with the county’s fund balance policy, the board of supervisors is the highest level of decision making authority to approve and modify a fund balance commitment. The general fund balances reported in Giles’ recently audited annual financial report for the fiscal year 2017 appear to confirm the board and management’s plans for improving its financial position, as the balance sheet on page seven, reports an ending general fund unassigned fund balance, or unrestricted reserves, of $3,502,172, an increase of $1,882,269 from the prior fiscal year 2016.
Upon completion of our follow up process with the county and review of the various factors
discussed above, the Office determined that Giles’ board of supervisors and management are closely monitoring the county’s current financial situation and have implemented specific actions and policies to continue to work towards improving its financial position. The Office concluded that the County of Giles does not appear to be experiencing a situation of fiscal distress that would warrant further assistance or intervention from the Commonwealth; accordingly, our Office made no further notification or recommendation to the county, Governor, and Money Committees relating to fiscal distress. County of Northumberland
Subsequent to our initial notification to the County of Northumberland concerning our preliminary determination to perform follow up review based on the county’s 2016 FAM score of 15.9

18 Monitoring for Local Fiscal Distress
percent and its downward trend from prior years, Northumberland submitted the completed questionnaire and provided the Office additional information as needed to facilitate further discussion. The Office discussed further with the County Administrator and Treasurer to obtain an understanding of the specific issues and factors that contributed to the significant downward trend of the county’s 2016 FAM score from the prior years in the ratio analysis.
When evaluating the outcome of the ten ratios in the FAM analysis, the results of ratios one, five,
nine and ten largely contributed to the County of Northumberland’s low 2016 FAM score and downward trend from fiscal years 2014 and 2015, as noted in Table 3. Appendices A and B at the end of this report give additional information on the ten ratio calculations for the county for fiscal year 2016.
As previously noted, ratios one, five, nine, and ten primarily focus on comparing the county’s overall unrestricted reserves to revenues and expenses, as well as its unrestricted general fund balances to operational revenues and expenses in the general fund. Accordingly, Northumberland’s lower percentage results at these ratios for fiscal year 2016 indicate the county has a minimal level of unrestricted reserves to use in the event of a revenue shortfall or unforeseen situation. When reviewing the county’s annual financial reports for fiscal years 2014, 2015, and 2016, the county’s general fund unassigned (unrestricted) fund balance has steadily declined over these years starting with a balance of $6,631,922 in 2014, then decreasing to a balance of $4,782,779 in 2015 and $3,373,428 in 2016, as reported on the balance sheet for each fiscal year, page 13 in the 2014 financial report, 2015 financial report, and 2016 financial report. Upon further discussions, county officials explained that one of the primary factors causing this decline in its general fund unrestricted reserves was the county’s decision to construct a new sheriff's office without issuing any new debt for this project. The county paid for construction of the sheriff’s office at a cost of approximately $2,000,000, which began during fiscal year 2015. As reported in the fiscal year 2015 financial report on page 15, the county’s capital projects expense in the general fund was $2,049,191, with the majority of this amount budgeted for the sheriff’s office as reported on page 107 of the county’s fiscal year 2015 budget to actual schedule.
Additionally, our Office discussed with Northumberland other factors impacting the county’s results in our FAM analysis, along with the county’s policies and plans it has in place to continue to move forward and improve its financial position. Northumberland officials explained that its bond rating was downgraded during October 2016 from an Aa2 to an Aa3 by a bond rating agency, due to the county’s decline in its reserves and liquidity in the past several years. County officials also commented that in prior years Northumberland has generally relied upon a strong secondary home construction market; however, the downward trend in the economy several years ago impacted the county adversely and its secondary home construction has not yet fully recovered. The county explained that prior to our Office’s identification of the county in the FAM analysis and request for a follow up review, the board of supervisors and management were closely monitoring the impact of this issue and have implemented specific plans and actions to address the county’s situation and work toward improving its overall financial position. Specifically, the county’s board made the decision to increase its real estate tax rate
Table 3
Northumberland Specific Ratio Results
FY2016 FY2015 FY2014
Ratio 1 10% 14% 25%
Ratio 5 13% 18% 26%
Ratio 9 14% 19% 28%
Ratio 10 14% 20% 29%

19 Monitoring for Local Fiscal Distress
by $.05 in fiscal year 2017, with an additional $.02 increase in fiscal year 2018. Additionally, Northumberland refinanced its school bonds in the spring of 2016, saving the county approximately $7.7 million over the life of the bonds. In addition, at the time of our follow up discussions, Northumberland commented that management was working with the county’s board to implement and adopt significant policies, such as a fund balance policy, to strengthen the county’s plan of retaining general fund unassigned fund balance reserves of approximately 15 to 20 percent of total expenditures. Further, the general fund balances reported in Northumberland’s recently audited annual financial report for the fiscal year 2017 appear to confirm the board and management’s plans for improving its financial position, as the balance sheet on page 14 reports an ending general fund unassigned fund balance, or unrestricted reserves, of $5,546,316, an increase of $2,172,888 from the prior year fiscal year 2016.
Upon completion of our follow up process with the county and review of the various factors
discussed above, the Office determined that Northumberland’s board of supervisors and management are closely monitoring the county’s current financial situation and have implemented specific actions and policies to continue to work towards improving their financial position. The Office concluded that the County of Northumberland does not appear to be experiencing a situation of fiscal distress that would warrant further assistance or intervention from the Commonwealth; accordingly, our Office made no further notification or recommendation to the county, Governor, and Money Committees relating to fiscal distress.
County of Page
After the initial notification to the County of Page concerning our preliminary determination to perform follow up review based on the county’s 2016 FAM score of 11.2 percent, our Office further communicated with the county in additional email correspondence during September 2017, to ensure receipt of our notification and offer assistance if the county had questions or needed further information. The County Administrator acknowledged our notification and responded in email correspondence sent on September 28, 2017, that the county was not interested in any additional follow up from our Office at the time. Management provided an explanation that the county was aware of its financial issues during the fiscal year 2016 and had planned accordingly for correction, and the county’s fiscal year 2017 annual report would show that it is fiscally stable. Accordingly, the Office did not perform our formal review process with the assessment questionnaire and further discussions to follow up with the County of Page to address its results in our 2016 FAM analysis. However, the Office did perform some additional analysis based on audited financial reports and other public documents to try to obtain an understanding of the particular issues and factors that may have contributed to the county’s low 2016 FAM score in the ratio analysis, as noted in further detail below.
When evaluating the outcome of the ten ratios in the FAM analysis, the results of ratios one,
three, five, nine and ten largely contributed to the County of Page’s low 2016 FAM score, as noted in Table 4. Specifically, ratios one, five, nine and ten focus on comparing the county’s overall unrestricted reserves to revenues and expenses, as well as its unrestricted general fund balances to operational revenues and expenses in the general fund. Accordingly, the lower percentage results at these ratios indicate the county has a minimal level of unrestricted reserves to use in the event of a revenue shortfall

20 Monitoring for Local Fiscal Distress
or unforeseen situation; in particular, the negative result at ratio five indicates that the county has a deficit balance in its ending net position on an overall government-wide level.
When reviewing the county’s annual financial reports for
fiscal years 2014, 2015, and 2016, the county’s general fund unassigned (unrestricted) fund balance has declined over these years starting with a balance of $7,962,516 in 2014, then decreasing to a balance of $7,298,683 in 2015 and $5,706,704 in 2016, as reported on the balance sheet for each fiscal year, page 13 in the 2014 financial report, 2015 financial report, and 2016 financial report. Further, ratio three focuses on comparing the county’s total unrestricted liquid assets (i.e.: cash and cash equivalents) to its total liabilities on a government-wide level; therefore, the county’s low percentage result at this ratio indicates its outstanding liabilities exceed the amount of cash reserves the county has available, which may suggest the county is not in the most desirable position to meet its obligations unless it obtains additional revenue. Appendices A and B at the end of this report give additional information on the ten ratio calculations for the county for fiscal year 2016.
Additionally, the Office reviewed the meeting minutes for the Page board of supervisors meeting
held on November 21, 2017, and noted that county finance management discussed the FAM analysis with the board and how the county was one of the localities identified with a score below the 16 percent threshold. As depicted in the FAM ratio analysis results that the Office analyzed over fiscal years 2014, 2015 and 2016, the meeting minutes describe that Page officials discussed some of the factors that contributed to the county’s declining FAM scores. For example, over these three years, the county’s expenditures continued to exceed the actual revenues the county collected, which was addressed by using carryover funds to make up the differences; that is, general fund unassigned balances were used to balance the budget that was not fiscally stable during these years. In addition, Page’s annual financial report for the fiscal year 2017, reports that the county continues to have a deficit unrestricted net position, as shown on page ten of the statement of net position, and the management’s discussion and analysis, on page four of the financial report, explains that this deficit is primarily attributed to the liability associated with the landfill remediation costs incurred by the county during 2006. The county reports in its notes to the financial statements, page 67, the liability related to landfill closures totals of $6,074,073 as of the end of fiscal year 2017.
During this November board meeting, management also discussed with the board the corrective
actions and plans the county has in place to move forward and improve its financial position, to include ensuring stricter budgeting practices, consolidation of services to reduce costs in future years, and no longer using carryover fund balances to balance the budget. County management also explained that it is moving toward its fund balance policy requirement of having general fund unassigned fund balance reserves of approximately 15 percent of total expenditures. The general fund balances reported in Page’s recently audited annual financial report for fiscal year 2017 appear to confirm the board and management’s plans for improving its financial position, as the balance sheet on page 13 reports the ending general fund unassigned fund balance, or unrestricted general fund reserves, of $7,986,584, an increase of $2,279,880 from the prior fiscal year 2016.
Table 4
Page Specific 2016 Ratio Results
Ratio 1 2%
Ratio 3 11%
Ratio 5 (26)%
Ratio 9 18%
Ratio 10 17%

21 Monitoring for Local Fiscal Distress
County of Richmond
Subsequent to our initial notification to the County of Richmond concerning our preliminary determination to perform follow up review based on the county’s 2016 FAM score of 7.3 percent, the County of Richmond submitted the completed questionnaire and provided our Office additional information as needed to facilitate further discussion. The Office communicated with two board members and the County Administrator to obtain an understanding of the specific issues and factors that contributed to the county’s low FAM score in the ratio analysis, and to discuss the county’s policies and plans it has in place to continue to move forward and improve its financial position.
When evaluating the outcome of the ten ratios in the FAM analysis, the results of ratios one, three, five, nine and ten largely contributed to the County of Richmond’s low 2016 FAM score, as noted in Table 5 on the following page. Appendices A and B at the end of this report give additional information on the ten ratio calculations for the county for fiscal year 2016.
As previously discussed, ratios one, five, nine, and ten primarily focus on comparing the county’s overall unrestricted reserves to revenues and expenses, as well as its unrestricted general fund balances to operational revenues and expenses in the general fund. Accordingly, Richmond’s low percentage results at these ratios indicate the county has a minimal level of unrestricted reserves to use in the event of a revenue shortfall or unforeseen situation; in particular, the negative result at ratio one indicates that the county has no unrestricted reserves available on an overall government-wide level due to the county’s deficit unrestricted net position reported in fiscal year 2016. When reviewing the county’s annual financial reports for fiscal years 2014, 2015, and 2016, the county’s general fund balance has declined over these years starting with a total for assigned and unassigned fund balances of $1,026,067 in 2014, then decreasing to a balance of $429,337 in 2015 and $237,136 in 2016, which includes a negative unassigned fund balance of ($56,958), as reported on the balance sheet for each fiscal year, page 13 in the 2014 financial report, 2015 financial report, and 2016 financial report. Further, ratio three focuses on comparing the county’s total unrestricted liquid assets (i.e.: cash and cash equivalents) to its total liabilities on a government-wide level; therefore, the county’s low percentage results at this ratio indicates its outstanding liabilities exceed the amount of cash reserves the county has available, which may suggest the county is not in the most desirable position to meet its obligations unless it obtains additional revenue.
Upon further discussions between the county and our Office, county officials explained the
primary factors causing the decline in the county’s general fund unrestricted reserves and contributing to the overall decline in its financial position. In general, the county is still striving to recover from the significant revenue decline it has seen over the past several years as a result of the last economic recession, while also seeing annual operating expenses continue to increase and having to fund necessary expenses for capital projects. Specifically, the county issued over $14 million in general obligation debt during the fiscal year 2013 in order to fund significant capital improvements to the county’s school system, thus increasing expenses for capital projects during fiscal years 2014 and 2015.
Table 5
County of Richmond Specific 2016 Ratio Results
Ratio 1 (13)%
Ratio 3 3%
Ratio 5 2%
Ratio 9 2%
Ratio 10 2%

22 Monitoring for Local Fiscal Distress
The county reported total capital projects expense of $6,445,027 in 2014 and $9,339,889 in 2015, as reported on page 15 of the general fund’s financial statement in each respective fiscal year annual financial reports. The school renovations were completed in fiscal year 2016 when construction in progress was completed and the jointly owned asset was reported as a depreciable capital asset, as disclosed on page 34 of the county’s fiscal year 2016 annual financial report.
During follow up discussions, county officials explained that prior to our Office’s identification of
the county in the FAM analysis and request for follow up, the board of supervisors and management have been closely monitoring the county’s situation and have implemented specific plans and actions to work toward improving its overall financial position. Specifically, the County of Richmond has corrected budgetary issues and implemented more sound budgeting practices over fiscal years 2016, 2017 and 2018 to adjust budgeted revenues in line with more conservative revenue estimates, while also accounting for more realistic expenditures that are in line with actual amounts instead of artificially low amounts that the county could not meet. The county’s board and management made the decision that the county would absorb the revenue decline and expenditure increases with very minimal impact and tax increase to the county’s citizens. The county has only increased its real estate tax rate within the last seven years by $0.03 during fiscal year 2017, compared to its neighboring localities that have increased tax rates two to four times over the past several years. County officials explained that the increase in revenues collected in fiscal year 2017, as a result of the increase in real estate taxes, is designated solely towards the county’s general fund balance reserves and its capital improvement plan and not for the county’s day to day operations. In addition, the board and management have implemented a detailed five-year plan to continue to address more accurate budgeting for estimated revenues and expenses and continue to work toward increasing the general fund balance reserves each year to attain the county’s overall goal to have general fund unrestricted reserves at 15 percent of total expenses by fiscal year 2022. The general fund balances reported in the County of Richmond’s recently audited annual financial report for the fiscal year 2017 appear to confirm the board and management’s plans for improving its financial position, as the balance sheet on page 13 reports an ending general fund assigned and unassigned fund balances, of $275,066, and $56,013, respectively, which is a total increase of $93,943 from the prior fiscal year 2016.
Upon completion of our follow up process with the county and review of the various factors
discussed above, the Office determined that the County of Richmond’s board of supervisors and management are closely monitoring the county’s current financial situation and have implemented specific actions and policies to continue to work towards improving its financial position. The Office concluded that the County of Richmond does not appear to be experiencing a situation of fiscal distress that would warrant further assistance or intervention from the Commonwealth; accordingly, our Office made no further notification or recommendation to the county, Governor, and Money Committees relating to fiscal distress.
23 Monitoring for Local Fiscal Distress
Future Refinements to Early Warning System and Analysis
In support of the new local government fiscal distress monitoring initiative, the Office performed various outreach efforts throughout the year to keep all stakeholders well informed of the process. The Office gave presentations to multiple state, local, and national groups including the Joint Subcommittee on Local Government Fiscal Stress, the Local Government Fiscal Distress Workgroup, Virginia Association of Counties, Virginia Municipal League, Virginia Government Finance Officers’ Association, and a national Government Sustainability Workgroup hosted by Pew Charitable Trusts and the Michigan State University Extension Center for Local Government Finance and Policy. We also had meetings with public officials and their financial consultants from multiple counties and cities.
As a result of this outreach, our Office has received valuable feedback and gained additional
insight to consider and apply as we move forward with various changes and refinements that we will implement during this current year to enhance our ratio methodology and analysis and develop a more precise model for annually monitoring and identifying potential fiscal distress at the Commonwealth’s local governments. Specifically, as the Office continues to review the localities’ audited financial statement data for the most recent fiscal year 2017 and we are reexamining the ten ratios currently being calculated to determine if there may be duplicative analysis being performed across some of the ten ratios. Additionally, we are reviewing to determine if our analysis may benefit from the addition of any other ratios, such as a ratio measuring the change in overall net position from year to year and the operations ratio, which measures whether or not a locality’s annual revenues were sufficient to pay for annual operations. During our calculations of the various ratios that measure total assets and total liabilities on an overall government-wide level, we will examine how a locality issues debt on behalf of its school system to finance school owned capital assets, and account for any impact in the ratio analysis specific to how the locality has determined to report the related jointly owned school assets under Virginia’s tenancy in common provision in accordance with §15.2-1800.1 of the Code of Virginia. Further, the Office is currently evaluating improvements to the methodology used in our ratio analysis for how we analyze the overall level of debt for a locality, to include also a locality’s ability to service debt payments; for example, incorporating a ratio to measure the percentage of total general fund expenses committed to annual debt service. In addition, the Office plans to perform outreach this year with outside specialists, such as the Virginia Resources Authority, to gain additional information on the potential for incorporating similar analysis from the authority’s model for evaluating local governments when providing loan financing options.
The Office is also considering other refinements to incorporate into the model to evaluate more
qualitative factors alongside our ratio analysis. For example, the Office anticipates including an assessment of other demographic and economic factors for the localities, such as unemployment rate, poverty rate, and population growth or decline. In addition, we plan to integrate into the model other
As a result of the Office’s outreach
efforts with various stakeholders, we
gained additional insight and
feedback to consider as we
implement various refinements
during 2018 to enhance our ratio
methodology and analysis and
develop a more precise model for
annually monitoring and identifying
potential fiscal distress at Virginia
local governments.
24 Monitoring for Local Fiscal Distress
local government fiscal assessments that are already being performed each year by state entities to meet other monitoring objectives, such as Virginia’s Commission on Local Government fiscal stress index. The fiscal stress index is annually calculated for all cities and counties and is used by state agencies to assist in the allocation of state aid to localities. The fiscal stress index illustrates a locality’s ability to generate additional local revenues from its current tax base relative to the rest of the Commonwealth. In this analysis, the Commission on Local Government uses data from the Office’s annual Comparative Report of Local Government Revenues and Expenditures, along with demographic factors to evaluate the following three primary components for a locality: revenue capacity per capita (the theoretical ability of a locality to raise revenue); revenue effort (the amount of the theoretical revenue capacity that the locality actually collects through taxes and fees); and median household income.
In addition, the Virginia Department of Education (Education) performs an analysis of the local
school divisions’ ability to pay education costs that are fundamental to the Commonwealth’s Standards of Quality through its Composite Index, which is calculated using three primary demographic indicators: true value of real property, adjusted gross income, and taxable retail sales. Further, Education annually collects data for the legislature to demonstrate the locality’s Required Local Effort and Required Local Match. For this analysis, Education assembles data submitted by the school divisions to show the degree to which each school division has met, failed to meet, or surpassed its required local expenditure in support of the Standards of Quality. Accordingly, since the assessment of how a locality is funding educational programs could be a key indicator in evaluating potential fiscal distress, the Office plans to incorporate these metrics as part of our model and analysis for the early warning system.
Chart 6 on the following page illustrates the Office’s proposed changes to the overall components
of the model and progression through each level of the early warning system as discussed above; first performing the ratio analysis using audited financial statement data, then evaluating applicable qualitative and demographic factors to assist the Office’s final analysis of making a preliminary determination of the need to perform further follow up with a locality that appears to show signs of potential fiscal distress.

25 Monitoring for Local Fiscal Distress
Overall Components of Model for Early Warning System
Chart 6
Finally, the Office is considering improvements to the current process for evaluating and
comparing all localities using a ranking methodology in the model, and how an ending score for each locality indicates the need for further follow up and review. Similar to how the ratio analysis currently evaluates the 36 towns not having a school system in their own model, we will consider whether it is beneficial for the model to have multiple tiers where we may group and analyze localities that are comparable to each other based on overall revenues and expenditures and similar demographic factors. In addition, the Office is reconsidering our application of the overall composite FAM score, which was used in the model for our internal assessment for establishing a cut-off threshold when making a preliminary determination of whether a locality shows signs of potential fiscal distress for our further review. Instead of applying an absolute quantitative or numerical score as the overall measure for making a preliminary determination of potential fiscal distress, the Office may implement a more qualitative measure for an overall evaluation. For instance, we could use two categories (the red zone and green zone) to illustrate the results of our analysis. If a locality is in the red zone, further review and follow up is needed; and if a locality is in the green zone, no further review and follow up is needed. Chart 7 on the following page illustrates our proposed changes to defining an overall measure for making a preliminary determination of the need to perform further follow up with a locality that appears to show signs of potential fiscal distress.
Analyze to Make
Preliminary Determination
of Potential Distress
Evaluate Qualitative
and Demographic
Factors
Calculate Ratio
Analysis
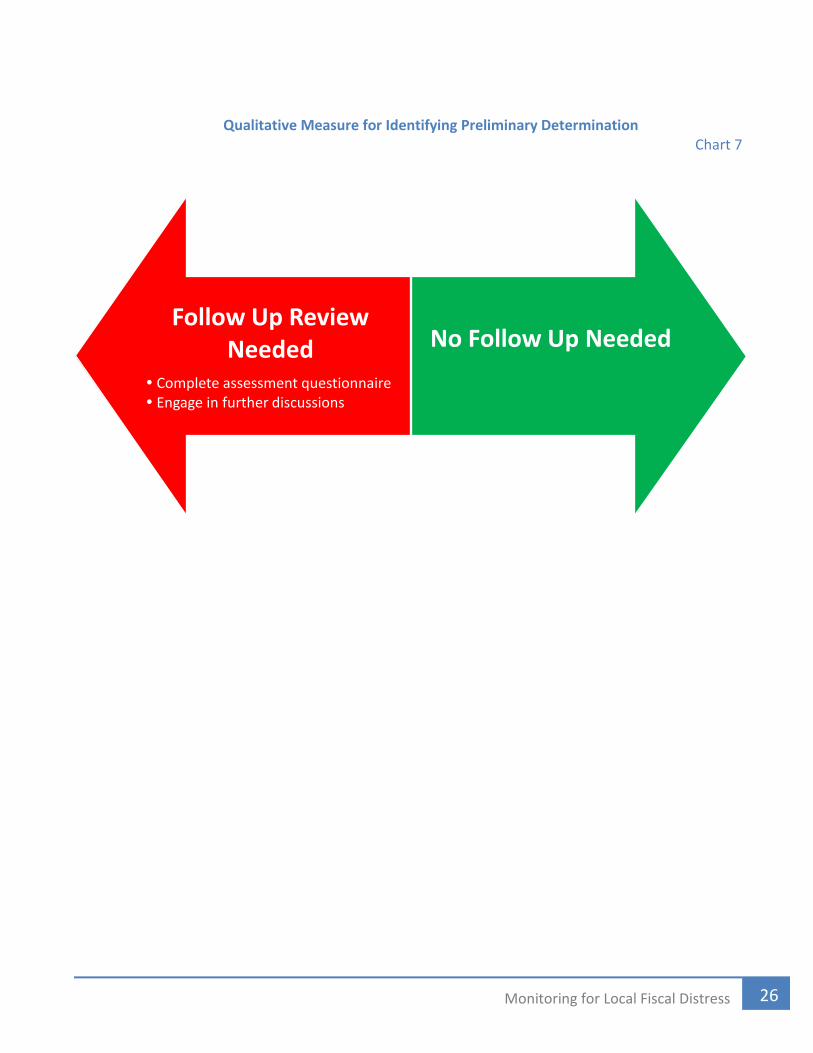
26 Monitoring for Local Fiscal Distress
Qualitative Measure for Identifying Preliminary Determination
Chart 7
Follow Up Review Needed
Complete assessment questionnaire Engage in further discussions
No Follow Up Needed

27 Monitoring for Local Fiscal Distress
March 14, 2018 The Honorable Ralph S. Northam Governor of Virginia The Honorable S. Chris Jones Chairman, House Appropriations Committee The Honorable Thomas K. Norment, Jr. Chairman, Senate Finance Committee The Honorable Emmett W. Hanger, Jr. Chairman, Senate Finance Committee The Honorable Aubrey L. Layne, Jr. Secretary of Finance
We are pleased to submit the Local Government Fiscal Distress Monitoring Report, which describes the results from newly enacted legislation directing our Office to establish an early warning system to monitor fiscal distress at Virginia’s local governments. This report provides you an overview regarding the legislative requirements, background on the process and analysis that our Office implemented to initially develop an early warning monitoring system, the results of our reviews performed with specific localities identified as part of our analysis this past year, and plans to refine our analysis to further enhance the early warning monitoring system for future years.
We would like to express our appreciation to the many individuals whose efforts assisted in
researching and developing this process for an early warning system, and providing valuable feedback to further refine our analysis. We also express our appreciation to the locality officials for their responsiveness to our additional inquiries and cooperation during our follow up reviews.
AUDITOR OF PUBLIC ACCOUNTS RNR/clj

Ratio Calculations and Interpretation Appendix A
28 Monitoring for Local Fiscal Distress
The following information expands on the ten financial ratios used in the Financial Assessment
Model, as described in Chart 1 on page three, to provide the specific calculations and further
interpretation from the Office regarding the outcome of each ratio. The first six ratios are calculated
using audited data from a locality’s overall government-wide statement of net position and statement
of activities for all governmental and business type activities combined. The last four ratios are
calculated using audited data from the balance sheet and the statement of revenues, expenditures, and
changes in fund balances for a locality’s general fund, its primary operating fund.
Ratio Ratio Calculations Ratio Description Ratio Results Interpretation 1 Cash and Cash Equivalents +
Investments ‐ Current Liabilities/ Charges for Services + General
Revenues
This ratio measures the sufficiency of unrestricted reserves relative to the locality's normal revenue (non-grant revenue). By comparing the locality's unrestricted liquid assets (net of current liabilities) to its normal revenue, we can see the locality's ability to make up a revenue shortfall or utilize unrestricted reserves during an unforeseen situation.
A higher ratio percentage suggests a locality is in a desirable position to make up a revenue shortfall or utilize unrestricted reserves during an unforeseen situation.
A lower ratio percentage suggests that a locality may not be in a desirable position to make up a revenue shortfall or utilize unrestricted reserves during an unforeseen situation.
A negative ratio percentage indicates that a locality does not have any unrestricted reserves.
2 Cash and Cash Equivalents + Investments/ Current Liabilities
This ratio measures the sufficiency of unrestricted reserves relative to the locality's current liabilities. By comparing the locality's unrestricted liquid assets to current liabilities, we can see its ability to pay current liabilities without needing additional revenue.
The industry standard is often cited as 2.0 (200%) or higher; that is, the entity would have $2 in cash available to cover each $1 of current liabilities.
A lower ratio percentage suggests that a locality may not have the ability to pay current liabilities unless it obtains additional revenues.
3 Cash and Cash Equivalents + Investments/ Total (Current and
Noncurrent) Liabilities
This ratio measures the sufficiency of unrestricted reserves relative to the locality's total liabilities. By comparing the locality's unrestricted liquid assets to total liabilities, we can see its ability to pay total liabilities without needing additional revenue.
A higher ratio percentage suggests that a locality is in a desirable position to meet its obligations.
A lower ratio percentage suggests that a locality may not be in a desirable position to meet its obligations without obtaining additional revenues.

Ratio Calculations and Interpretation Appendix A
29 Monitoring for Local Fiscal Distress
Ratio Ratio Calculations Ratio Description Ratio Results Interpretation 4 Charges for Services + Operating
Grants & Contributions + Capital Grants & Contributions + General
Revenues + Cash and Cash Equivalents + Investments/ Total
Expenses + Current Liabilities
This ratio measures the locality's ability to meet its future obligations to determine to what extent the locality will be able to cover the following year’s obligations without changes to revenue or expenses.
This ratio has a natural benchmark of 1.0 (100%) or higher.
A lower ratio percentage (under 100%) suggests that a locality may not be in a desirable position to meet its obligations in future years without obtaining additional revenues and/or decreasing expenses.
5 Net Position Unrestricted/ Total Expenses
This ratio measures the sufficiency of unrestricted reserves relative to the locality's expenses. By comparing the locality’s unrestricted net position to its total expenses, we can see to what extent the locality can fund expenses from unrestricted reserves in the event of a revenue shortfall or unforeseen situation.
A higher ratio percentage suggests that a locality is in a desirable position to fund expenses from unrestricted reserves in the event of a revenue shortfall or unforeseen situation.
A lower ratio percentage suggests that a locality may not be in a desirable position to fund expenses from unrestricted reserves in the event of a revenue shortfall or unforeseen situation.
A negative ratio percentage indicates that a locality has a deficit unrestricted net position.
6 Total Assets/ Total (Current and Noncurrent) Liabilities
This ratio measures the degree to which a locality's assets are being financed with debt (short term and long term).
A ratio above 100 percent indicates that a locality has more assets than it has debt.
A ratio under 100 percent indicates that a locality has more debt than it has assets.
A lower ratio percentage suggests that the locality is more leveraged, and may indicate higher risk.
7 Cash and Cash Equivalents + Investments (Unrestricted and Restricted)/ Total Current and
Noncurrent Liabilities
This ratio measures the sufficiency of reserves relative to the locality's general fund liabilities. By comparing the locality's liquid assets to liabilities, we can see its ability to pay general fund liabilities without needing additional revenue.
A higher ratio percentage suggests that a locality is in a desirable position to meet its obligations.
A lower ratio percentage suggests that a locality may not be in a desirable position to meet its obligations without obtaining additional revenues.

Ratio Calculations and Interpretation Appendix A
30 Monitoring for Local Fiscal Distress
Ratio Ratio Calculations Ratio Description Ratio Results Interpretation 8 Total Expenditures/ Total
Liabilities The ratio measures how well the locality is paying its bills in the general fund. The higher the locality’s liabilities are relative to expenditures, the more likely the locality has past due bills.
This ratio calculation is intended to express in a percentage the measure of liabilities relative to expenditures. It is difficult to apply an overall measure of what ratio percentage indicates a desirable or less desirable position, due to varying factors across localities. A locality would want to monitor whether its liabilities are significantly higher than expenditures, as this could likely indicate the locality has past due bills.
9 Unassigned + Assigned Fund Balances/ Total Expenditures
This ratio measures the sufficiency of unrestricted reserves relative to the locality's operating expenditures. By comparing the locality's unassigned and assigned fund balances to its operating expenditures, we can see to what extent the locality can fund operating expenditures from reserves in the event of a revenue shortfall or unforeseen situation.
A higher ratio percentage suggests that a locality is in a desirable position to fund expenses from unrestricted reserves in the event of a revenue shortfall or unforeseen situation.
A lower ratio percentage suggests that a locality may not be in a desirable position to fund expenses from unrestricted reserves in the event of a revenue shortfall or unforeseen situation.
A negative ratio percentage indicates that a locality has a deficit unassigned fund balance in its general fund.
10 Total Fund Balance/ Total Revenues
This ratio measures the sufficiency of reserves relative to the locality's general fund revenue. By comparing the locality's reserves to its revenue, we can see to what extent the locality can make up revenue shortfalls with reserves.
A higher ratio percentage suggests that a locality is in a desirable position to have sufficient reserves in the event of a revenue shortfall.
A lower ratio percentage suggests that a locality may not be in a desirable position to have sufficient reserves in the event of a revenue shortfall.
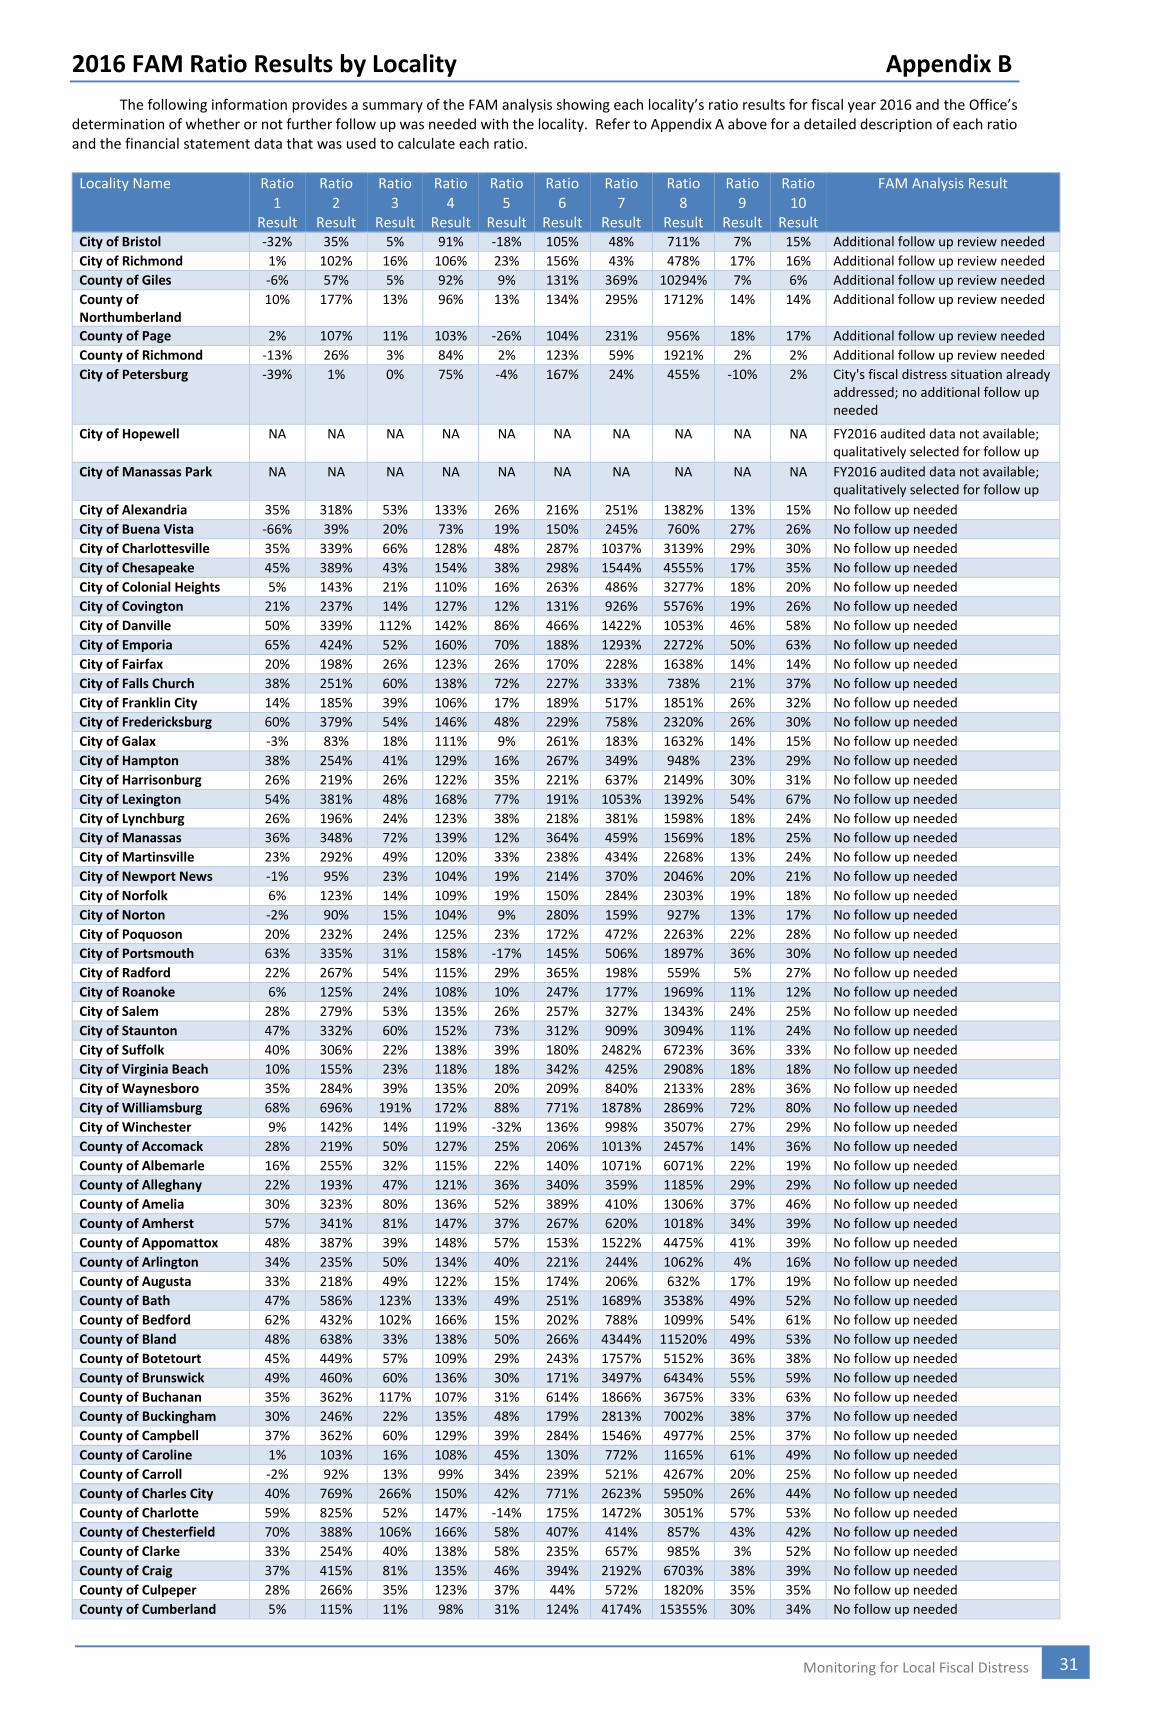
2016 FAM Ratio Results by Locality Appendix B
31 Monitoring for Local Fiscal Distress
The following information provides a summary of the FAM analysis showing each locality’s ratio results for fiscal year 2016 and the Office’s determination of whether or not further follow up was needed with the locality. Refer to Appendix A above for a detailed description of each ratio and the financial statement data that was used to calculate each ratio.
Locality Name Ratio 1
Result
Ratio 2
Result
Ratio 3
Result
Ratio 4
Result
Ratio 5
Result
Ratio 6
Result
Ratio 7
Result
Ratio 8
Result
Ratio 9
Result
Ratio 10
Result
FAM Analysis Result
City of Bristol -32% 35% 5% 91% -18% 105% 48% 711% 7% 15% Additional follow up review needed
City of Richmond 1% 102% 16% 106% 23% 156% 43% 478% 17% 16% Additional follow up review needed
County of Giles -6% 57% 5% 92% 9% 131% 369% 10294% 7% 6% Additional follow up review needed
County of Northumberland
10% 177% 13% 96% 13% 134% 295% 1712% 14% 14% Additional follow up review needed
County of Page 2% 107% 11% 103% -26% 104% 231% 956% 18% 17% Additional follow up review needed
County of Richmond -13% 26% 3% 84% 2% 123% 59% 1921% 2% 2% Additional follow up review needed
City of Petersburg -39% 1% 0% 75% -4% 167% 24% 455% -10% 2% City's fiscal distress situation already addressed; no additional follow up needed
City of Hopewell NA NA NA NA NA NA NA NA NA NA FY2016 audited data not available; qualitatively selected for follow up
City of Manassas Park NA NA NA NA NA NA NA NA NA NA FY2016 audited data not available; qualitatively selected for follow up
City of Alexandria 35% 318% 53% 133% 26% 216% 251% 1382% 13% 15% No follow up needed
City of Buena Vista -66% 39% 20% 73% 19% 150% 245% 760% 27% 26% No follow up needed
City of Charlottesville 35% 339% 66% 128% 48% 287% 1037% 3139% 29% 30% No follow up needed
City of Chesapeake 45% 389% 43% 154% 38% 298% 1544% 4555% 17% 35% No follow up needed
City of Colonial Heights 5% 143% 21% 110% 16% 263% 486% 3277% 18% 20% No follow up needed
City of Covington 21% 237% 14% 127% 12% 131% 926% 5576% 19% 26% No follow up needed
City of Danville 50% 339% 112% 142% 86% 466% 1422% 1053% 46% 58% No follow up needed
City of Emporia 65% 424% 52% 160% 70% 188% 1293% 2272% 50% 63% No follow up needed
City of Fairfax 20% 198% 26% 123% 26% 170% 228% 1638% 14% 14% No follow up needed
City of Falls Church 38% 251% 60% 138% 72% 227% 333% 738% 21% 37% No follow up needed
City of Franklin City 14% 185% 39% 106% 17% 189% 517% 1851% 26% 32% No follow up needed
City of Fredericksburg 60% 379% 54% 146% 48% 229% 758% 2320% 26% 30% No follow up needed
City of Galax -3% 83% 18% 111% 9% 261% 183% 1632% 14% 15% No follow up needed
City of Hampton 38% 254% 41% 129% 16% 267% 349% 948% 23% 29% No follow up needed
City of Harrisonburg 26% 219% 26% 122% 35% 221% 637% 2149% 30% 31% No follow up needed
City of Lexington 54% 381% 48% 168% 77% 191% 1053% 1392% 54% 67% No follow up needed
City of Lynchburg 26% 196% 24% 123% 38% 218% 381% 1598% 18% 24% No follow up needed
City of Manassas 36% 348% 72% 139% 12% 364% 459% 1569% 18% 25% No follow up needed
City of Martinsville 23% 292% 49% 120% 33% 238% 434% 2268% 13% 24% No follow up needed
City of Newport News -1% 95% 23% 104% 19% 214% 370% 2046% 20% 21% No follow up needed
City of Norfolk 6% 123% 14% 109% 19% 150% 284% 2303% 19% 18% No follow up needed
City of Norton -2% 90% 15% 104% 9% 280% 159% 927% 13% 17% No follow up needed
City of Poquoson 20% 232% 24% 125% 23% 172% 472% 2263% 22% 28% No follow up needed
City of Portsmouth 63% 335% 31% 158% -17% 145% 506% 1897% 36% 30% No follow up needed
City of Radford 22% 267% 54% 115% 29% 365% 198% 559% 5% 27% No follow up needed
City of Roanoke 6% 125% 24% 108% 10% 247% 177% 1969% 11% 12% No follow up needed
City of Salem 28% 279% 53% 135% 26% 257% 327% 1343% 24% 25% No follow up needed
City of Staunton 47% 332% 60% 152% 73% 312% 909% 3094% 11% 24% No follow up needed
City of Suffolk 40% 306% 22% 138% 39% 180% 2482% 6723% 36% 33% No follow up needed
City of Virginia Beach 10% 155% 23% 118% 18% 342% 425% 2908% 18% 18% No follow up needed
City of Waynesboro 35% 284% 39% 135% 20% 209% 840% 2133% 28% 36% No follow up needed
City of Williamsburg 68% 696% 191% 172% 88% 771% 1878% 2869% 72% 80% No follow up needed
City of Winchester 9% 142% 14% 119% -32% 136% 998% 3507% 27% 29% No follow up needed
County of Accomack 28% 219% 50% 127% 25% 206% 1013% 2457% 14% 36% No follow up needed
County of Albemarle 16% 255% 32% 115% 22% 140% 1071% 6071% 22% 19% No follow up needed
County of Alleghany 22% 193% 47% 121% 36% 340% 359% 1185% 29% 29% No follow up needed
County of Amelia 30% 323% 80% 136% 52% 389% 410% 1306% 37% 46% No follow up needed
County of Amherst 57% 341% 81% 147% 37% 267% 620% 1018% 34% 39% No follow up needed
County of Appomattox 48% 387% 39% 148% 57% 153% 1522% 4475% 41% 39% No follow up needed
County of Arlington 34% 235% 50% 134% 40% 221% 244% 1062% 4% 16% No follow up needed
County of Augusta 33% 218% 49% 122% 15% 174% 206% 632% 17% 19% No follow up needed
County of Bath 47% 586% 123% 133% 49% 251% 1689% 3538% 49% 52% No follow up needed
County of Bedford 62% 432% 102% 166% 15% 202% 788% 1099% 54% 61% No follow up needed
County of Bland 48% 638% 33% 138% 50% 266% 4344% 11520% 49% 53% No follow up needed
County of Botetourt 45% 449% 57% 109% 29% 243% 1757% 5152% 36% 38% No follow up needed
County of Brunswick 49% 460% 60% 136% 30% 171% 3497% 6434% 55% 59% No follow up needed
County of Buchanan 35% 362% 117% 107% 31% 614% 1866% 3675% 33% 63% No follow up needed
County of Buckingham 30% 246% 22% 135% 48% 179% 2813% 7002% 38% 37% No follow up needed
County of Campbell 37% 362% 60% 129% 39% 284% 1546% 4977% 25% 37% No follow up needed
County of Caroline 1% 103% 16% 108% 45% 130% 772% 1165% 61% 49% No follow up needed
County of Carroll -2% 92% 13% 99% 34% 239% 521% 4267% 20% 25% No follow up needed
County of Charles City 40% 769% 266% 150% 42% 771% 2623% 5950% 26% 44% No follow up needed
County of Charlotte 59% 825% 52% 147% -14% 175% 1472% 3051% 57% 53% No follow up needed
County of Chesterfield 70% 388% 106% 166% 58% 407% 414% 857% 43% 42% No follow up needed
County of Clarke 33% 254% 40% 138% 58% 235% 657% 985% 3% 52% No follow up needed
County of Craig 37% 415% 81% 135% 46% 394% 2192% 6703% 38% 39% No follow up needed
County of Culpeper 28% 266% 35% 123% 37% 44% 572% 1820% 35% 35% No follow up needed
County of Cumberland 5% 115% 11% 98% 31% 124% 4174% 15355% 30% 34% No follow up needed
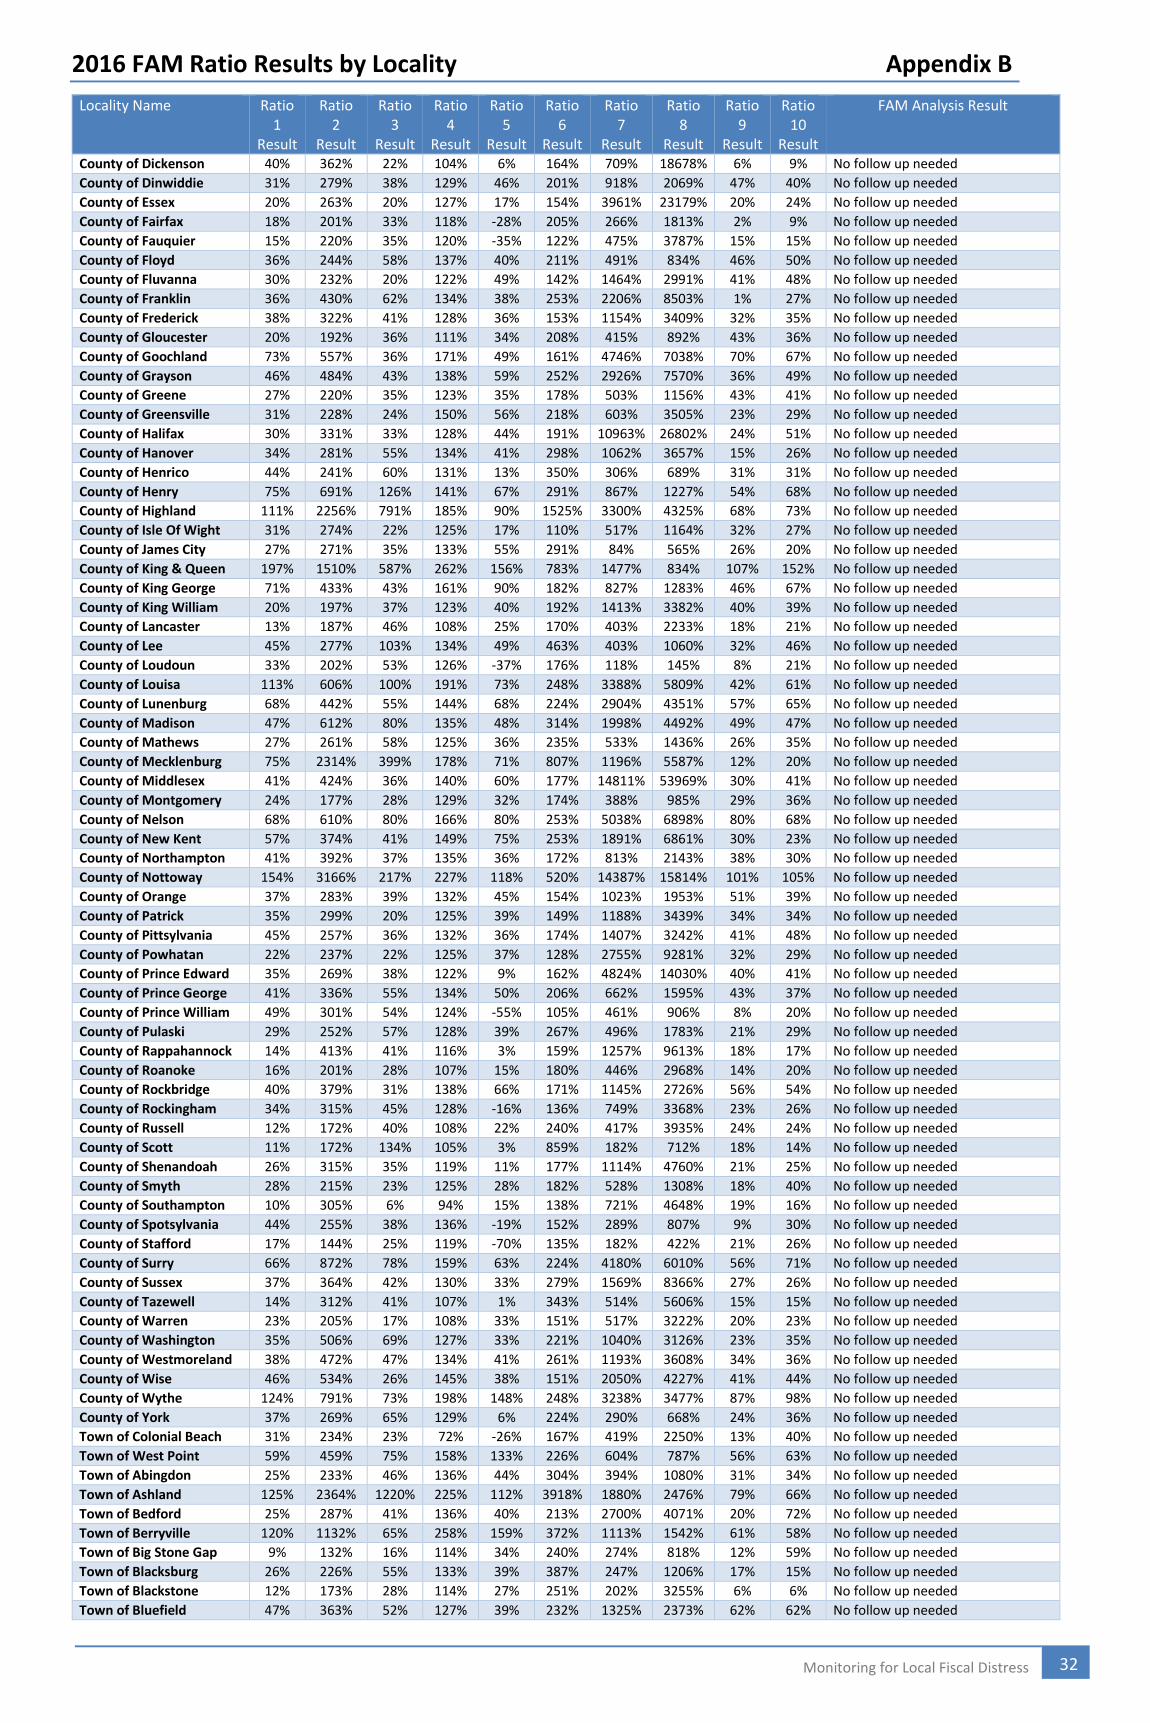
2016 FAM Ratio Results by Locality Appendix B
32 Monitoring for Local Fiscal Distress
Locality Name Ratio 1
Result
Ratio 2
Result
Ratio 3
Result
Ratio 4
Result
Ratio 5
Result
Ratio 6
Result
Ratio 7
Result
Ratio 8
Result
Ratio 9
Result
Ratio 10
Result
FAM Analysis Result
County of Dickenson 40% 362% 22% 104% 6% 164% 709% 18678% 6% 9% No follow up needed
County of Dinwiddie 31% 279% 38% 129% 46% 201% 918% 2069% 47% 40% No follow up needed
County of Essex 20% 263% 20% 127% 17% 154% 3961% 23179% 20% 24% No follow up needed
County of Fairfax 18% 201% 33% 118% -28% 205% 266% 1813% 2% 9% No follow up needed
County of Fauquier 15% 220% 35% 120% -35% 122% 475% 3787% 15% 15% No follow up needed
County of Floyd 36% 244% 58% 137% 40% 211% 491% 834% 46% 50% No follow up needed
County of Fluvanna 30% 232% 20% 122% 49% 142% 1464% 2991% 41% 48% No follow up needed
County of Franklin 36% 430% 62% 134% 38% 253% 2206% 8503% 1% 27% No follow up needed
County of Frederick 38% 322% 41% 128% 36% 153% 1154% 3409% 32% 35% No follow up needed
County of Gloucester 20% 192% 36% 111% 34% 208% 415% 892% 43% 36% No follow up needed
County of Goochland 73% 557% 36% 171% 49% 161% 4746% 7038% 70% 67% No follow up needed
County of Grayson 46% 484% 43% 138% 59% 252% 2926% 7570% 36% 49% No follow up needed
County of Greene 27% 220% 35% 123% 35% 178% 503% 1156% 43% 41% No follow up needed
County of Greensville 31% 228% 24% 150% 56% 218% 603% 3505% 23% 29% No follow up needed
County of Halifax 30% 331% 33% 128% 44% 191% 10963% 26802% 24% 51% No follow up needed
County of Hanover 34% 281% 55% 134% 41% 298% 1062% 3657% 15% 26% No follow up needed
County of Henrico 44% 241% 60% 131% 13% 350% 306% 689% 31% 31% No follow up needed
County of Henry 75% 691% 126% 141% 67% 291% 867% 1227% 54% 68% No follow up needed
County of Highland 111% 2256% 791% 185% 90% 1525% 3300% 4325% 68% 73% No follow up needed
County of Isle Of Wight 31% 274% 22% 125% 17% 110% 517% 1164% 32% 27% No follow up needed
County of James City 27% 271% 35% 133% 55% 291% 84% 565% 26% 20% No follow up needed
County of King & Queen 197% 1510% 587% 262% 156% 783% 1477% 834% 107% 152% No follow up needed
County of King George 71% 433% 43% 161% 90% 182% 827% 1283% 46% 67% No follow up needed
County of King William 20% 197% 37% 123% 40% 192% 1413% 3382% 40% 39% No follow up needed
County of Lancaster 13% 187% 46% 108% 25% 170% 403% 2233% 18% 21% No follow up needed
County of Lee 45% 277% 103% 134% 49% 463% 403% 1060% 32% 46% No follow up needed
County of Loudoun 33% 202% 53% 126% -37% 176% 118% 145% 8% 21% No follow up needed
County of Louisa 113% 606% 100% 191% 73% 248% 3388% 5809% 42% 61% No follow up needed
County of Lunenburg 68% 442% 55% 144% 68% 224% 2904% 4351% 57% 65% No follow up needed
County of Madison 47% 612% 80% 135% 48% 314% 1998% 4492% 49% 47% No follow up needed
County of Mathews 27% 261% 58% 125% 36% 235% 533% 1436% 26% 35% No follow up needed
County of Mecklenburg 75% 2314% 399% 178% 71% 807% 1196% 5587% 12% 20% No follow up needed
County of Middlesex 41% 424% 36% 140% 60% 177% 14811% 53969% 30% 41% No follow up needed
County of Montgomery 24% 177% 28% 129% 32% 174% 388% 985% 29% 36% No follow up needed
County of Nelson 68% 610% 80% 166% 80% 253% 5038% 6898% 80% 68% No follow up needed
County of New Kent 57% 374% 41% 149% 75% 253% 1891% 6861% 30% 23% No follow up needed
County of Northampton 41% 392% 37% 135% 36% 172% 813% 2143% 38% 30% No follow up needed
County of Nottoway 154% 3166% 217% 227% 118% 520% 14387% 15814% 101% 105% No follow up needed
County of Orange 37% 283% 39% 132% 45% 154% 1023% 1953% 51% 39% No follow up needed
County of Patrick 35% 299% 20% 125% 39% 149% 1188% 3439% 34% 34% No follow up needed
County of Pittsylvania 45% 257% 36% 132% 36% 174% 1407% 3242% 41% 48% No follow up needed
County of Powhatan 22% 237% 22% 125% 37% 128% 2755% 9281% 32% 29% No follow up needed
County of Prince Edward 35% 269% 38% 122% 9% 162% 4824% 14030% 40% 41% No follow up needed
County of Prince George 41% 336% 55% 134% 50% 206% 662% 1595% 43% 37% No follow up needed
County of Prince William 49% 301% 54% 124% -55% 105% 461% 906% 8% 20% No follow up needed
County of Pulaski 29% 252% 57% 128% 39% 267% 496% 1783% 21% 29% No follow up needed
County of Rappahannock 14% 413% 41% 116% 3% 159% 1257% 9613% 18% 17% No follow up needed
County of Roanoke 16% 201% 28% 107% 15% 180% 446% 2968% 14% 20% No follow up needed
County of Rockbridge 40% 379% 31% 138% 66% 171% 1145% 2726% 56% 54% No follow up needed
County of Rockingham 34% 315% 45% 128% -16% 136% 749% 3368% 23% 26% No follow up needed
County of Russell 12% 172% 40% 108% 22% 240% 417% 3935% 24% 24% No follow up needed
County of Scott 11% 172% 134% 105% 3% 859% 182% 712% 18% 14% No follow up needed
County of Shenandoah 26% 315% 35% 119% 11% 177% 1114% 4760% 21% 25% No follow up needed
County of Smyth 28% 215% 23% 125% 28% 182% 528% 1308% 18% 40% No follow up needed
County of Southampton 10% 305% 6% 94% 15% 138% 721% 4648% 19% 16% No follow up needed
County of Spotsylvania 44% 255% 38% 136% -19% 152% 289% 807% 9% 30% No follow up needed
County of Stafford 17% 144% 25% 119% -70% 135% 182% 422% 21% 26% No follow up needed
County of Surry 66% 872% 78% 159% 63% 224% 4180% 6010% 56% 71% No follow up needed
County of Sussex 37% 364% 42% 130% 33% 279% 1569% 8366% 27% 26% No follow up needed
County of Tazewell 14% 312% 41% 107% 1% 343% 514% 5606% 15% 15% No follow up needed
County of Warren 23% 205% 17% 108% 33% 151% 517% 3222% 20% 23% No follow up needed
County of Washington 35% 506% 69% 127% 33% 221% 1040% 3126% 23% 35% No follow up needed
County of Westmoreland 38% 472% 47% 134% 41% 261% 1193% 3608% 34% 36% No follow up needed
County of Wise 46% 534% 26% 145% 38% 151% 2050% 4227% 41% 44% No follow up needed
County of Wythe 124% 791% 73% 198% 148% 248% 3238% 3477% 87% 98% No follow up needed
County of York 37% 269% 65% 129% 6% 224% 290% 668% 24% 36% No follow up needed
Town of Colonial Beach 31% 234% 23% 72% -26% 167% 419% 2250% 13% 40% No follow up needed
Town of West Point 59% 459% 75% 158% 133% 226% 604% 787% 56% 63% No follow up needed
Town of Abingdon 25% 233% 46% 136% 44% 304% 394% 1080% 31% 34% No follow up needed
Town of Ashland 125% 2364% 1220% 225% 112% 3918% 1880% 2476% 79% 66% No follow up needed
Town of Bedford 25% 287% 41% 136% 40% 213% 2700% 4071% 20% 72% No follow up needed
Town of Berryville 120% 1132% 65% 258% 159% 372% 1113% 1542% 61% 58% No follow up needed
Town of Big Stone Gap 9% 132% 16% 114% 34% 240% 274% 818% 12% 59% No follow up needed
Town of Blacksburg 26% 226% 55% 133% 39% 387% 247% 1206% 17% 15% No follow up needed
Town of Blackstone 12% 173% 28% 114% 27% 251% 202% 3255% 6% 6% No follow up needed
Town of Bluefield 47% 363% 52% 127% 39% 232% 1325% 2373% 62% 62% No follow up needed
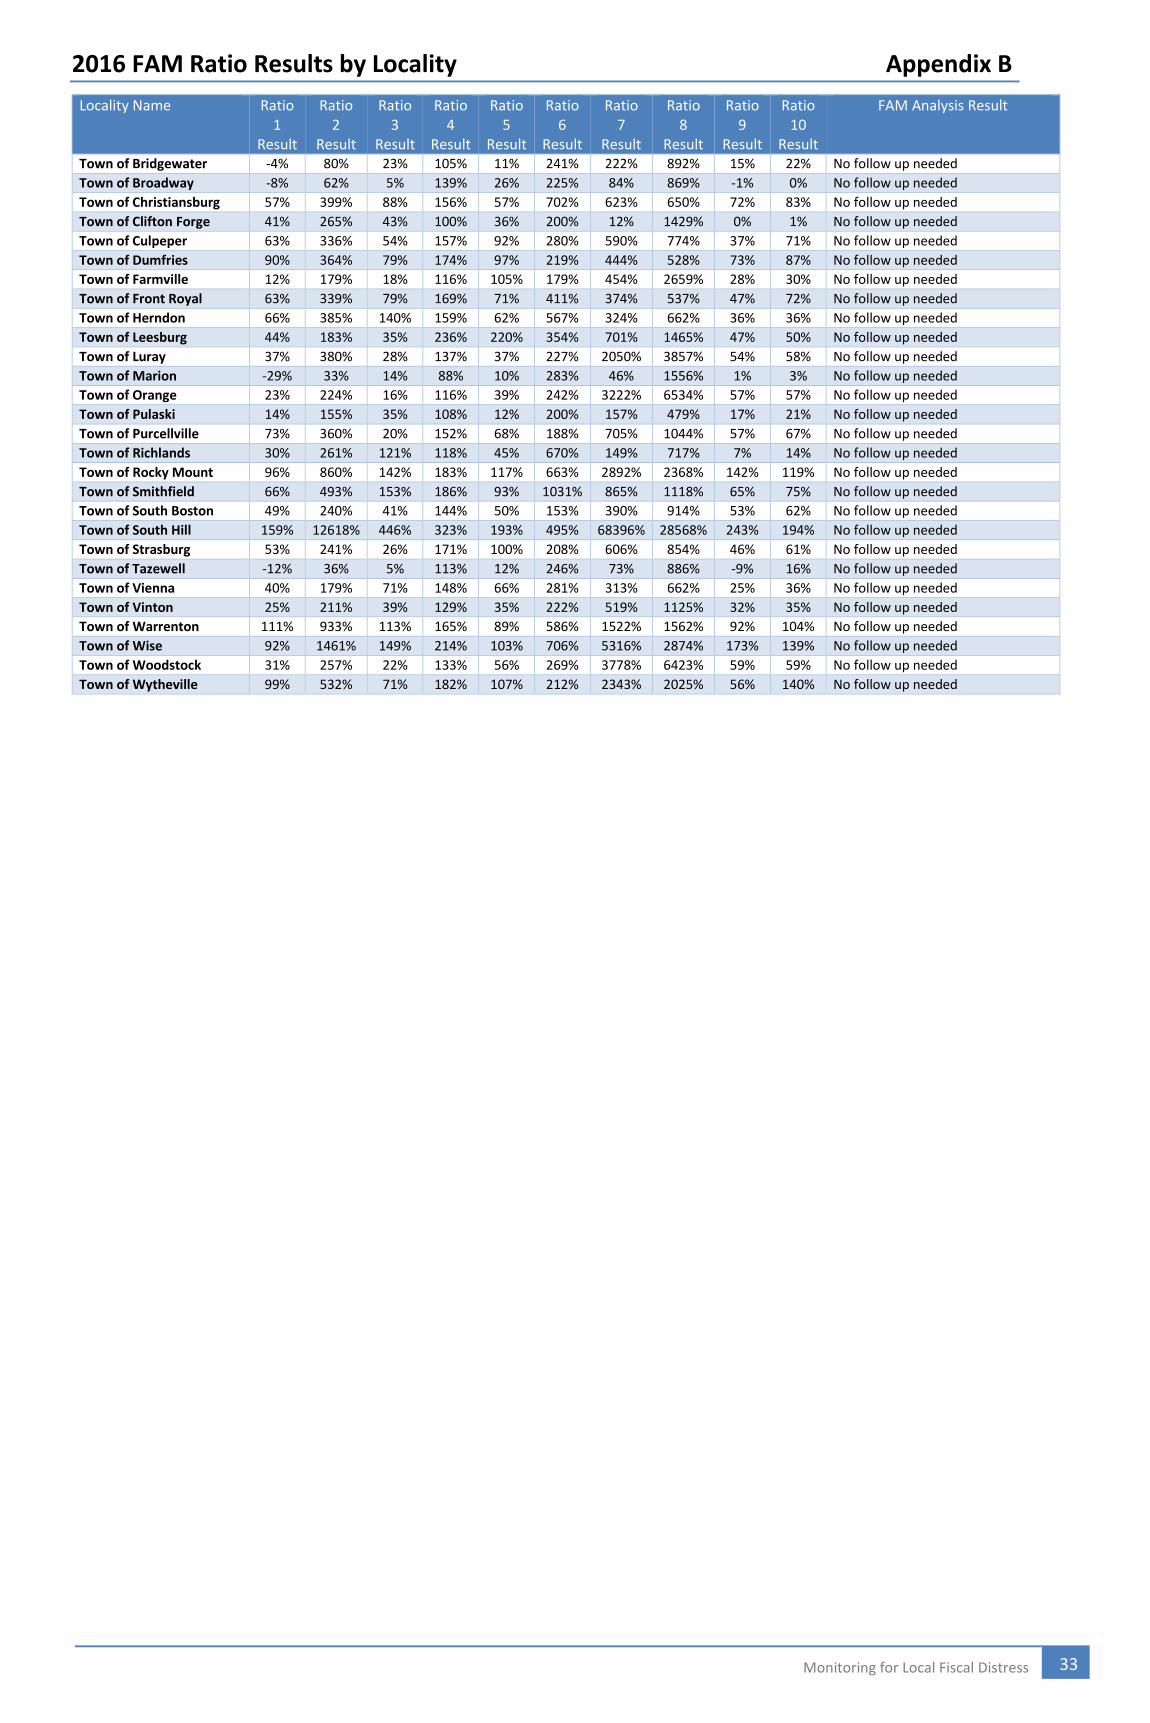
2016 FAM Ratio Results by Locality Appendix B
33 Monitoring for Local Fiscal Distress
Locality Name Ratio 1
Result
Ratio 2
Result
Ratio 3
Result
Ratio 4
Result
Ratio 5
Result
Ratio 6
Result
Ratio 7
Result
Ratio 8
Result
Ratio 9
Result
Ratio 10
Result
FAM Analysis Result
Town of Bridgewater -4% 80% 23% 105% 11% 241% 222% 892% 15% 22% No follow up needed
Town of Broadway -8% 62% 5% 139% 26% 225% 84% 869% -1% 0% No follow up needed
Town of Christiansburg 57% 399% 88% 156% 57% 702% 623% 650% 72% 83% No follow up needed
Town of Clifton Forge 41% 265% 43% 100% 36% 200% 12% 1429% 0% 1% No follow up needed
Town of Culpeper 63% 336% 54% 157% 92% 280% 590% 774% 37% 71% No follow up needed
Town of Dumfries 90% 364% 79% 174% 97% 219% 444% 528% 73% 87% No follow up needed
Town of Farmville 12% 179% 18% 116% 105% 179% 454% 2659% 28% 30% No follow up needed
Town of Front Royal 63% 339% 79% 169% 71% 411% 374% 537% 47% 72% No follow up needed
Town of Herndon 66% 385% 140% 159% 62% 567% 324% 662% 36% 36% No follow up needed
Town of Leesburg 44% 183% 35% 236% 220% 354% 701% 1465% 47% 50% No follow up needed
Town of Luray 37% 380% 28% 137% 37% 227% 2050% 3857% 54% 58% No follow up needed
Town of Marion -29% 33% 14% 88% 10% 283% 46% 1556% 1% 3% No follow up needed
Town of Orange 23% 224% 16% 116% 39% 242% 3222% 6534% 57% 57% No follow up needed
Town of Pulaski 14% 155% 35% 108% 12% 200% 157% 479% 17% 21% No follow up needed
Town of Purcellville 73% 360% 20% 152% 68% 188% 705% 1044% 57% 67% No follow up needed
Town of Richlands 30% 261% 121% 118% 45% 670% 149% 717% 7% 14% No follow up needed
Town of Rocky Mount 96% 860% 142% 183% 117% 663% 2892% 2368% 142% 119% No follow up needed
Town of Smithfield 66% 493% 153% 186% 93% 1031% 865% 1118% 65% 75% No follow up needed
Town of South Boston 49% 240% 41% 144% 50% 153% 390% 914% 53% 62% No follow up needed
Town of South Hill 159% 12618% 446% 323% 193% 495% 68396% 28568% 243% 194% No follow up needed
Town of Strasburg 53% 241% 26% 171% 100% 208% 606% 854% 46% 61% No follow up needed
Town of Tazewell -12% 36% 5% 113% 12% 246% 73% 886% -9% 16% No follow up needed
Town of Vienna 40% 179% 71% 148% 66% 281% 313% 662% 25% 36% No follow up needed
Town of Vinton 25% 211% 39% 129% 35% 222% 519% 1125% 32% 35% No follow up needed
Town of Warrenton 111% 933% 113% 165% 89% 586% 1522% 1562% 92% 104% No follow up needed
Town of Wise 92% 1461% 149% 214% 103% 706% 5316% 2874% 173% 139% No follow up needed
Town of Woodstock 31% 257% 22% 133% 56% 269% 3778% 6423% 59% 59% No follow up needed
Town of Wytheville 99% 532% 71% 182% 107% 212% 2343% 2025% 56% 140% No follow up needed