Local Governance in Rural West Bengal: Capture or...
35
Local Governance in Rural West Bengal: Capture or Clientelism? Pranab Bardhan, Sandip Mitra, Dilip Mookherjee and Abhirup Sarkar June 11, 2009
-
Upload
truongnhan -
Category
Documents
-
view
225 -
download
2
Transcript of Local Governance in Rural West Bengal: Capture or...
Local Governance in Rural West Bengal:
Capture or Clientelism?
Pranab Bardhan, Sandip Mitra, Dilip Mookherjee and Abhirup Sarkar
June 11, 2009

Motivation
Key concern in both academic literature and policy debates regarding decentralization is possible proneness of local governments to capture by local elites, which could offset benefits of greater flexibility, responsiveness and information
Generally recognized this is likely to be context- specific; hence a topic of empirical research
Motivation, contd.
• Two possible ways of gauging extent of capture of local governments:
– Examine determinants of capture-proneness, such as patterns of political participation and awareness across socio-economic groups;
– Seek direct evidence regarding how well local government services have been targeted to designated beneficiaries
Motivation, contd.
In earlier work, Pranab Bardhan and I have studied a village panel of targeting of local government services in West Bengal, using data from records of local governments combined with an indirect household survey to identify characteristics of recipients (``Pro-Poor Targeting…’’ JDE 79 (2006))

Motivation, contd.
• Possible discrepancies between local government records and what households actually received, and between third-party and first-party description of household characteristics
• First objective: study targeting of local government services, relying entirely on a direct household survey (for the same set of villages)
Motivation, contd.
• Second objective: collect evidence from the household survey concerning patterns of political awareness and participation of citizens in local governance, which are hypothesized (in theories of special interest groups a la Grossman-Helpman) to be key determinants of capture, apart from being important in their own right as indicators of functioning local democracy
Third Objective
• Examine another important source of accountability of local governments: how citizens cast their vote, and how this depends on benefits they and others received from local governments
• At the end of the survey, we conducted a secret ballot in which respondents cast a vote from among different political parties

West Bengal: Background• Since 1977 a Left-Front coalition has had an
absolute majority at the state assembly • Embarked on an ambitious program of
implementation of land reform, created local government elected at three tiers every five years (starting 1978)
• Devolved to them significant responsibility over delivery of various benefit programs funded by state and central government (agricultural extension, credit, local infrastructure, welfare)
• Local governments have very limited authority over health or education services
Survey Details• Sample of 89 villages across all major
agricultural districts (exclude Kolkata and Darjeeling)
• Same sample studied in earlier work on land reform and local governance in West Bengal (Bardhan-Mookherjee)
• Selected random sample of (on average) 25 household heads per village, stratified by landholding: total sample of 2200 households
• Carried out in 2003-04

Survey details, contd• Asked detailed questions concerning political
participation, awareness, and benefits of various kinds received from local government bodies, apart from household demographics and socio- economic status
• Rely on recall concerning benefits received, demographics, land status since 1967
• At the end of each interview, administered secret ballot across different political parties active in the area (identified by their election symbol)

Key Socio-Economic Categories
• Two main observable dimensions of economic and social status of households in rural communities in West Bengal: land and caste
• Will focus on variations across different categories of landownership, and of caste (scheduled castes and tribes)
• Currently exploring variations across Hindus and Muslims (not reported in the paper)
Drawbacks and Qualifications
• Problems inherent in survey data: reporting errors, subjectivity, recall problems
• Cross-sectional variations


Table 1: Sample Characteristics: Household Heads
Agricultur al Land Ownership Age
% Malehead
Maxm educ in
hhld % SC% ST
% Agric. Occup.
% Immigrants
Landless 45 88 6.6 35 2.4 26 40
0-1.5 acres 48 88 7.8 34 4.9 65 17
1.5-2.5 acres 56 92 10.8 15 7.4 82 19
2.5-5 acres 58 93 11.1 24 3.1 72 10
5-10 acres 60 89 12.5 22 4.1 66 12
10 acres and above 59 100 13.9 24 6.9 72 14
ALL 49 89 8.0 32 3.4 47 28
Theoretical Determinants of Capture
• Grossman-Helpman (1996) theory of electoral competition between candidates of two parties, with lobbying by special interest groups
• Candidates are willing to bend policies to appease special interests, in exchange for contribution to election campaign funds
• Campaign funds are used to sway votes of `uninformed’ or `unaware’ voters
Grossman-Helpman Capture Theory
• Main determinants of policy tilt in favor of special interest groups: – Patterns (average level, skewness across
socio-economic groups) of political awareness (concerning local politics; LG programs; media exposure)
– Patterns of political participation (voting turnout, attendance in village meetings, contribution/involvement in political campaigns)
Main Results Concerning Capture
• Find little evidence of capture based on intra-village targeting patterns, as well as on patterns of political participation or awareness
• Corroborates results of earlier work with Bardhan based on local government records

Summary of Detailed Results on Political Participation/Awareness
1. 50% households attend political meetings, 25% participate in political campaigns, 70% contribute to political campaigns, 37% attend gram sabha meetings, 11% ask questions at these meetings (high compared to Karnataka, Rajasthan, MP; US and most Latin American countries)
2. Intra-village variation across household attributes: only attributes that matter significantly: education (+), male head (+), immigrant (-)
3. SC/ST status does not matter, with few exceptions: SC/ST are more likely to attend political meetings; SC more likely to participate actively in political campaigns, and less likely to be registered as voter

Participation Results, contd.4. Landownership per se does not matter (i.e.,
controlling for education and caste), with few exceptions: landless somewhat less likely to vote, less likely to contribute to political campaigns
Result concerning significance of education and insignificance of land/wealth or caste/race similar to Rajasthan, MP (Krishna 2006) and Latin America (Gaviria et al 2002)
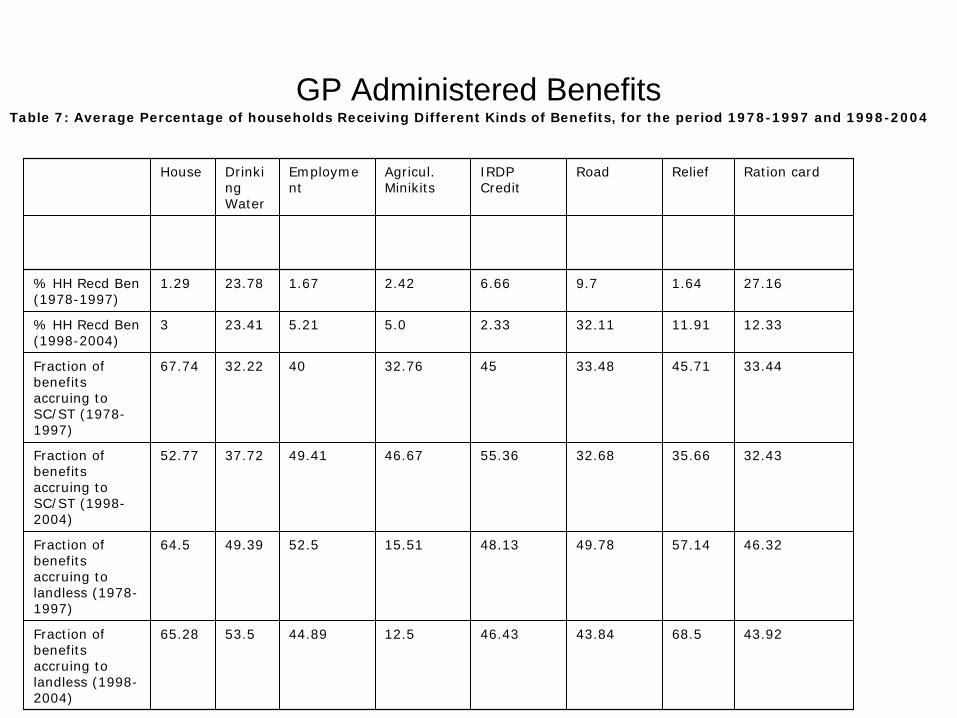
GP Administered Benefits
Table 7: Average Percentage of households Receiving Different Kinds of Benefits, for the period 1978-1997 and 1998-2004
House Drinki ng Water
Employme nt
Agricul. Minikits
IRDP Credit
Road Relief Ration card
% HH Recd Ben (1978-1997)
1.29 23.78 1.67 2.42 6.66 9.7 1.64 27.16
% HH Recd Ben (1998-2004)
3 23.41 5.21 5.0 2.33 32.11 11.91 12.33
Fraction of benefits accruing to SC/ST (1978- 1997)
67.74 32.22 40 32.76 45 33.48 45.71 33.44
Fraction of benefits accruing to SC/ST (1998- 2004)
52.77 37.72 49.41 46.67 55.36 32.68 35.66 32.43
Fraction of benefits accruing to landless (1978- 1997)
64.5 49.39 52.5 15.51 48.13 49.78 57.14 46.32
Fraction of benefits accruing to landless (1998- 2004)
65.28 53.5 44.89 12.5 46.43 43.84 68.5 43.92

Targeting Results
1.Within villages, no tendency to favor households with more education, agricultural land, or non-SC/ST; some bias in favor of those with more non-agricultural land (Table 8A)

Table 8A: Intra Village Targeting Within Villages, Based on Household Responses (OLS Regression with Village Fixed Effects) Number of GP
Benefits Received by Household
Number of GP Benefits Received by Household
Education -0.2 (0.04) -0.02 (0.04) SC Dummy -0.37 (0.36) -0.22 (-0.59) ST Dummy 1.41 (1.02) 1.14 (1.09) Non agricultural land owned 0.70* (0.37) 0.72* (0.39) Agricultural Land Owned -0.03 (0.07) -0.04 (0.08) Political Meeting Attendance Dummy
0.95** (0.42)
Political Campaign Involvement Dummy
-0.87* (0.48)
Campaign Contribution Made Dummy
-0.08 (0.40)
Voted for Winning Party Dummy
-0.32 (0.34)
N, p-value 2176, 0.0000 2001, 0.0000 Note: Standard Errors in Parentheses Controls Include age, gender, occupation, immigrant dummy and interactions of household characteristics with village meeting attendance rates
Targeting Results, contd
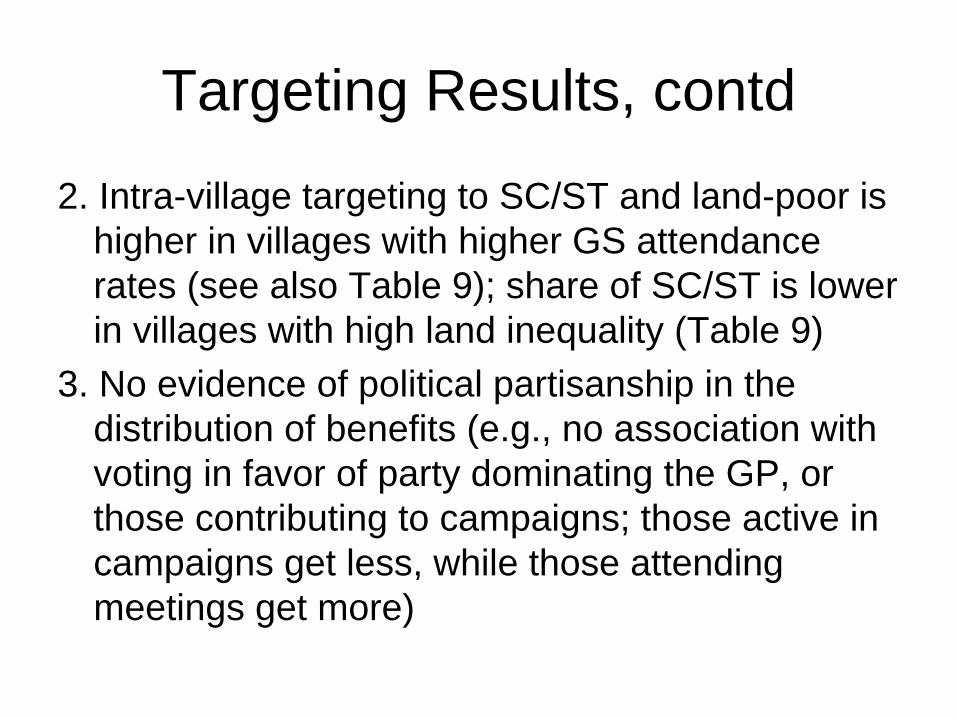
2. Intra-village targeting to SC/ST and land-poor is higher in villages with higher GS attendance rates (see also Table 9); share of SC/ST is lower in villages with high land inequality (Table 9)
3. No evidence of political partisanship in the distribution of benefits (e.g., no association with voting in favor of party dominating the GP, or those contributing to campaigns; those active in campaigns get less, while those attending meetings get more)

Inter-Village Targeting
• Evidence of greater anti-poor bias at higher levels of government: inter-village targeting patterns
• See villages with more landlessness getting fewer benefits; no significant association with caste
• Again consistent with results in Bardhan- Mookherjee 2006

Inter-Village Targeting Table 10A: Cross-Village Benefit Targeting Regressions 1998-2003 (1) (2) (3) Number of Benefits
per Household Number of Benefits per Household
Number of Benefits per Household
Proportion Landless -0.980** -1.099*** -1.076*** (0.391) (0.400) (0.385) Proportion SC -0.133 -0.188 -0.180 (0.385) (0.385) (0.370) Proportion ST 0.015 -0.062 0.163 (0.527) (0.527) (0.513) Left Share 98_03 -1.124 -10.738*** (0.715) (3.517) Left Share Squared 9.475*** (3.400) Constant 1.666*** 2.285*** 4.541*** (0.227) (0.454) (0.920) Observations 89 88 88 R-squared 0.08 0.10 0.18 Standard errors in parentheses * Significant at 10%; ** significant at 5%; *** significant at 1%

Implications of Capture Results
• Seems to be little evidence of capture within communities, greater biases in the inter-jurisdictional allocation decided by higher levels of government
• Suggests that decentralization with formula-based interjurisdictional transfers should do well
• Next turn to voting patterns

Voting Patterns
• Tendency to vote Left significantly higher for those who received large number of GP-administered-program benefits from Left-Front dominated GPs (Table 12)
• Also higher for those who received help in times of personal distress and in connection with difficulties faced in one’s occupation from Left-dominated GPs
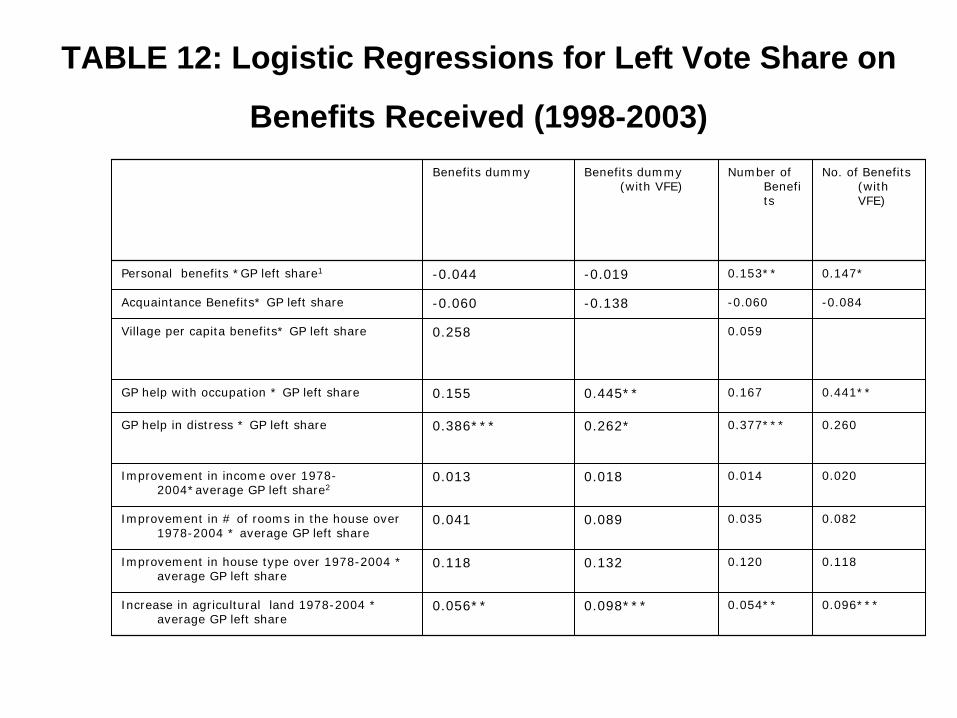
TABLE 12: Logistic Regressions for Left Vote Share on
Benefits Received (1998-2003)
Benefits dummy Benefits dummy (with VFE)
Number of Benefi ts
No. of Benefits (with VFE)
Personal benefits *GP left share1 -0.044 -0.019 0.153** 0.147*
Acquaintance Benefits* GP left share -0.060 -0.138 -0.060 -0.084
Village per capita benefits* GP left share 0.258 0.059
GP help with occupation * GP left share 0.155 0.445** 0.167 0.441**
GP help in distress * GP left share 0.386*** 0.262* 0.377*** 0.260
Improvement in income over 1978- 2004*average GP left share2
0.013 0.018 0.014 0.020
Improvement in # of rooms in the house over 1978-2004 * average GP left share
0.041 0.089 0.035 0.082
Improvement in house type over 1978-2004 * average GP left share
0.118 0.132 0.120 0.118
Increase in agricultural land 1978-2004 * average GP left share
0.056** 0.098*** 0.054** 0.096***
Clientelism?
• Positive effect of GP benefits received from Left-dominated GPs: voter gratitude, or part of an implicit quid pro quo?
• Table 13 shows that the effect pertains only to recurring, private benefits (employment, IRDP, minikits) rather than one-time or infrastructural benefits (roads, water, ration card, land reform)
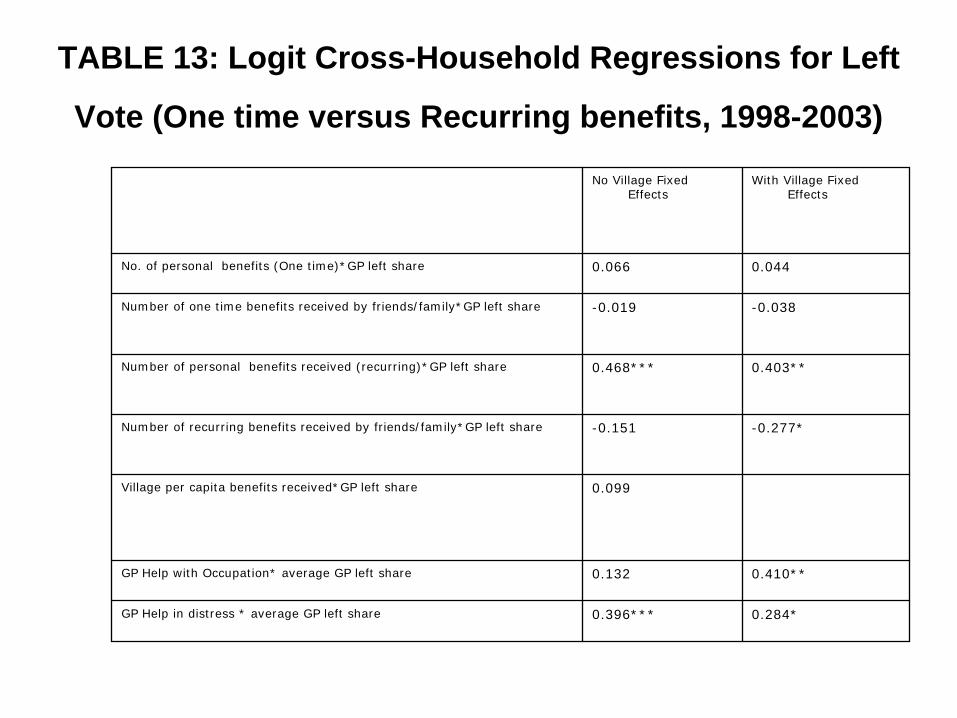
TABLE 13: Logit Cross-Household Regressions for Left
Vote (One time versus Recurring benefits, 1998-2003)
No Village Fixed Effects
With Village Fixed Effects
No. of personal benefits (One time)*GP left share 0.066 0.044
Number of one time benefits received by friends/family*GP left share -0.019 -0.038
Number of personal benefits received (recurring)*GP left share 0.468*** 0.403**
Number of recurring benefits received by friends/family*GP left share -0.151 -0.277*
Village per capita benefits received*GP left share 0.099
GP Help with Occupation* average GP left share 0.132 0.410**
GP Help in distress * average GP left share 0.396*** 0.284*

Clientelism?
• Typical ingredient of local `machine politics’: offer personalized benefits by a cadre of party workers in exchange for votes, on an ongoing basis
• Examples from Argentina (Stokes 2005), India, US, Japan, Latin America (Kitschelt- Wilkinson 2007)

Clientelism
• Takes the form of distribution of personalized private benefits or club goods
• Consistent with secret ballot owing to:– Vote counting practices (Stokes 2005)– Close monitoring by party workers– Geographic targeting by support levels– Job offers in government (Robinson-Verdier
2003)

Implications of Clientelism
• A form of `perverse accountability’ (Stokes): reduces pressure on governments to perform well, provide public goods, keeps voters from expressing their policy preferences
• Bias in favor of immediate, tangible favors: private over public goods, consumption over investment; geographic clustering of benefits

Implications of Clientelism, contd.
• Adds to pro-incumbency bias• Pro-poor bias may reflect low price at
which votes can be purchased from the poor
• Can create perverse incentives among those in power to perpetuate dependence and vulnerability among citizens
Questions for Future Research
• How to test for clientelism?– Need to develop models with testable predictions– Nature of benefits: personalized favors; help in
distress; one-time vs recurring benefits– Geographic clustering; – Relation to incumbency/dominance; to size and
nature of community• Does decentralization increase clientelism? • More generally, need to think more about
clientelism when evaluating decentralization