Local Finance in Kerala: A Study of Five Grama Panchayats ... · PDF Local Finance in Kerala:...
43
Local Finance in Kerala: A Study of Five Grama Panchayats in Ernakulam District Working paper No. 2 May 2016 ABSTRACT The study attempts to review the existing structure of different sources of finance for Grama Panchayats (GPs) in Kerala and analyze the effectiveness of such fund mobilization. It also looks into the problems associated with revenue mobilization and suggests how to improve its effectiveness. Five sample GPs namely Arakuzha, Edathala, Ezhikkara, Kalady, and Thiruvaniyoor in Ernakulam district were selected. The study suggested the need for strengthening the potentiality of GPs in generating own revenue. Arranging collection campaign program including online remittance, increasing the non- tax revenue and revenue through ‘other items’, innovating agency functions coupled with independent activities etc are the methods suggested for improving the effectiveness of fund mobilization by GPs. Dr Martin Patrick Chief Economist, Centre for Public Policy Research Centre for Public Policy Research
Transcript of Local Finance in Kerala: A Study of Five Grama Panchayats ... · PDF Local Finance in Kerala:...

Local Finance in Kerala: A
Study of Five Grama
Panchayats in Ernakulam
District
Working paper No. 2
May 2016
ABSTRACT
The study attempts to review the existing structure of
different sources of finance for Grama Panchayats (GPs) in
Kerala and analyze the effectiveness of such fund
mobilization. It also looks into the problems associated
with revenue mobilization and suggests how to improve
its effectiveness. Five sample GPs namely Arakuzha,
Edathala, Ezhikkara, Kalady, and Thiruvaniyoor in
Ernakulam district were selected. The study suggested the
need for strengthening the potentiality of GPs in
generating own revenue. Arranging collection campaign
program including online remittance, increasing the non-
tax revenue and revenue through ‘other items’,
innovating agency functions coupled with independent
activities etc are the methods suggested for improving the
effectiveness of fund mobilization by GPs.
Dr Martin Patrick
Chief Economist, Centre for Public Policy Research
Centre for Public Policy Research

www.cppr.in
1 Local Finance in Kerala: A Study of Five Grama Panchayats in Ernakulam
Wwwwww
District
Working Paper
Abbreviations
AFS
BPs
CHC
CSS
DPs
DPC
GPs
PPC
PRIs
LGs
LSGs
LSGIs
SOTR
SSFC
SSS
TSFC
Annual Financial Statement
Block Panchayats
Community Health Centre
Centrally Sponsored Scheme
District Panchayats
District Planning Committee
Grama Panchayats
People’s Plan Campaign
Panchayat Raj Institutions
Local Governments
Local Self Governments
Local Self Government Institutions
State’s Own Tax Revenue
Second State Finance Commission
State Sponsored Scheme
Third State Finance Commission
www.cppr.in
2 Local Finance in Kerala: A Study of Five Grama Panchayats in Ernakulam
Wwwwww
District
Working Paper
List of Tables and Diagram
Table
Table 1: Annual Growth rate in Total Revenue (% change)
Table 2: Proportion of Own Fund to TR (%)
Table 3: Average and Proportion of Own Fund to TR
Table 4: Average of Own Fund and Proportion of Own fund across
GPs
Table 5: The Proportion of Own Revenue to Total Revenue (%)
Table 6: Average of OR to own fund Over the period (%)
Table 7: Proportion of General Purpose Fund to Total Revenue
Table 8: Annual Growth in Tax Revenue (%)
Table 9: Proportion of Tax Revenue to Total Revenue (%)
Table 10: Proportion of Property Tax to Tax Revenue (%)
Table 11: Proportion of Professional Tax to Tax Revenue (%)
Table 12: Percentage Change in Non-tax Revenue
Table 13: Proportion of Non-tax Revenue to Total Revenue
Table 14: Proportion of Grants to Total Revenue (%)
Table 15: Proportion of ‘Others’ to Total Revenue (%)
Table 16: Proportion of Actual Total Revenue to Estimated Total
Revenue
Table 17: Proportion of Actual Tax Revenue to Estimated Tax
Revenue
Page Number
11
12
13
14
14
16
16
18
18
20
20
22
23
24
25
27
29

www.cppr.in
3 Local Finance in Kerala: A Study of Five Grama Panchayats in Ernakulam
Wwwwww
District
Working Paper
Table 18: Proportion of Actual Property Tax to Estimated Property
Tax
Table 19: Proportion of Actual Professional Tax to Estimated
Professional tax
Table 20: Proportion of Actual Non-tax Revenue to Estimated Non-
tax Revenue
Table 21: Proportion of Actual Own revenue to Estimated Own
Revenue
Table 22: Proportion of Actual Plan Fund to Estimated Plan Fund
Table 23: Proportion of Actual CSS and SSS Fund to Estimated
Figures
30
31
32
32
33
34
Diagram
Diagram 1: Total Revenue of Sample GPs
Diagram 2: Average of Total Revenue for Various GPs (in Rs Lakhs)
Diagram 3: Average of Total Revenue for Various Years (in Rs lakhs)
Diagram 4: Own Fund
Diagram 5: Proportion of Own Revenue to TR over the Period
Diagram 6: Tax Revenue of Sample GPs (in lakhs of rupees)
Diagram 7: Average Proportion of Professional Tax to Tax Revenue
over the Period
Diagram 8: Trend in Non-tax Revenue
Diagram 9: Proportion of Total Revenue Realized with Respect to
Budget Estimate
Diagram 10: Proportion of Actual Tax Revenue to Budget Estimate
Page Number
9
10
10
12
15
17
21
22
26
28

www.cppr.in
4 Local Finance in Kerala: A Study of Five Grama Panchayats in Ernakulam
Wwwwww
District
Working Paper
Local Finance in Kerala: A Study of Five Grama Panchayats in
Ernakulam District
Kerala, the tiny state in the southernmost tip of India, has been widely acclaimed as the
pioneer of genuine decentralization and democratization of local governments for the whole
country for over two decades. Decentralization has also produced remarkable changes in the
institutional setting of local governments and ushered in a new era of democratic governance
at the local level. This has been made possible by the multiplicity of programmes initiated by
Local Self Governments (LSGs). One prerequisite for a smoothly functioning system of fiscal
decentralization is that state finances must be in a healthy condition. At present, local
governments get revenue from different sources, including own revenue, central transfers,
state transfers and finance commission awards. Certain questions that arise at this juncture
are: What are the different revenue sources? What is the relative share of each revenue
source? How far is the potential of each revenue source tapped?
1.1 Review of Literature
A report by the World Bank (2004) has highlighted Kerala’s problems with the productivity of
local revenue systems, particularly with property tax. It is further pointed out that
decentralization should result in local governments having autonomy and sufficient resources
to provide meaningful services to their communities. Earmarked transfers (schemes) designed
by higher levels of government cannot dominate local government finances in a successful
fiscal decentralization program. Under the present arrangement, panchayats make no
contribution towards designing various schemes and are given little discretion in
implementation. However, Grama Panchayats (GPs) have more expenditure discretion
because grant funds tend to be unconditional, and there is more locally raised revenue.
In her study, Rashmi Sharma (2003) found that revenue generation was not taken up with any
enthusiasm in the Grama Panchayats (GPs). The methods used to deal with defaulters
consisted of launching revenue collection drives while persuasion and stringent actions were
rare. In Sharma’s case study of Palakkad district to assess the achievements and limitations of
the decentralized planning and implementation process, it was found that although the GP
received and spent large fund amounts, they had no trained manpower to keep accounts and
manage finances (Sharma, Rashmi 2009). She discussed the implementation problems faced
www.cppr.in
5 Local Finance in Kerala: A Study of Five Grama Panchayats in Ernakulam
Wwwwww
District
Working Paper
by local governments and assessed the reasons for their shortcomings during plan
implementation. Important factors in this context include the impact of political affiliations,
issues of staffing and lack of technical expertise on plan implementation modes.
The World Bank study (2004) revealed that in 1999 own source revenues accounted for about
18 percent of total GP revenues, down from 31 percent in 1994. This decline stemmed from
an increase in state transfers rather than a decline in local own source revenues. In fact, the
per capita level of own source revenues increased from Rs. 24 in 1994 to Rs. 57 in 1999.
However, within own source revenues, non-tax revenues have been much more buoyant than
tax revenues. The tax base does not appear to have responded to a booming construction
sector in the state nor do they reflect the relatively large inflow of foreign remittances. This
is likely due the valuation system’s failure to capture increases in property values. It is
estimated that only about 40 percent of the revenue potential has been captured. In general,
per capita own source revenues are significantly higher in GPs where the level of economic
activity is stronger, where population is larger, and where there is a smaller land area.
1.2 Research Problem
Initially, one of the greatest weaknesses of LGs was that they were starved of funds. A small
untied grant was given to the GPs from 1990 onwards, but allotment was irregular and subject
to much discretion exercised by the state government. Prior to the People’s Plan Campaign in
Kerala, the village panchayats, the only tier of the local government in the state, had a
revenue base adequate for their civic functions (Oommen, 2004). Now the situation has
changed substantially and the own fund collection and fund transfers have risen, thanks to
decentralization.
The popular decentralization project in Kerala created synergy between the state and civil
society at the grassroots level and accelerated development planning and local governance.
Innovative systems and new processes have strengthened the state’s democratic footing at
the grassroots level through democratic deliberations and horizontal power relations among
different social sections. In 1996, along with the People’s Plan Campaign (PPC), a decision
was taken to devolve 35-40 per cent of the plan funds to the panchayats at three tiers. Of the
three tiers, the maximum financial devolution is to the Grama Panchayat, and funds are
divided in the ratio of 60:20:20 at the village, block and district levels respectively. It must
be noted that while GPs have their own source of revenue, the block and district level

www.cppr.in
6 Local Finance in Kerala: A Study of Five Grama Panchayats in Ernakulam
Wwwwww
District
Working Paper
Panchayati Raj Institutions (PRIs) are totally dependent on grants. Now beneficiaries’ share
(the contribution made by the beneficiaries of the project) has become another source of
revenue along with donations and contributions. All these fall under the label ‘other sources’.
Plan funding is the major source of financing for Local Governments (LGs) in Kerala. This is
followed by other funds such as maintenance fund and own revenue. Own revenue levels are
more in Kerala than in other States. Grants are also awarded through the recommendations of
State Finance Commission. Funds that flow from the Central Government through its flagship
programmes constitute the next important source. Beneficiaries’ share, though negligible in
many contexts, is yet another source of funding. As a result of all these measures, the
revenue of LGs has increased tremendously over the years. This has produced positive
outcomes in the implementation of programmes.
At this point, the crucial questions are: What are the different sources of revenue? Do the GPs
earn adequate revenue by way of ‘own fund’? What are the ways by which the GPs can
improve own revenue collection?
1.3 Objectives of the Study
The main objectives of the study are laid down:
1. To review the existing structure of different sources of finance for GPs in Kerala
2. To analyze the effectiveness of such fund mobilization.
3. To look into the problems associated with revenue mobilization.
4. To make suggestions for the effective fund collection.
1.4 Methodology
The study will rely on both primary as well as secondary data. The different stages involved in
the study are as below: Ernakulam district has been selected based on its moderate value in
the deprivation index (16.8). It is proposed to select five sample GPs representing high-land,
mid-land and low-land as selected by the Fourth State Finance Commission (IV FC) for their
study. The sample GPs are Arakuzha, Edathala, Ezhikkara, Kalady and Thiruvaniyoor.
Interviews and discussions were held with officials, elected representatives, politicians, social
activists and experts in this area.

www.cppr.in
7 Local Finance in Kerala: A Study of Five Grama Panchayats in Ernakulam
Wwwwww
District
Working Paper
II
Local Finance: An Overview
Finance is a necessary input for the proper functioning of LGs but such funds are not
sufficient. The revenue sources of LGs can also be classified as (1) own revenue (2) funds
from central government (3) funds from state government (4) other sources (Rai, Manoj et.al,
2001). Another way of grouping the resources of LGs may be: (1) own resources (2) assigned
revenues, (3) grants (4) loans (Oommen and Datta, 1995).
2.1 Own Revenue
Own revenue consists of tax and non-tax revenues. There are three types of tax revenue—own
taxes, assigned taxes and shared taxes. Own taxes are assigned to LGs and are levied by
them. Property tax is an important item of local finance and a tool for empowering Local
Governments. House tax, professional tax, vehicle tax, agricultural land tax, entertainment
tax, pilgrim tax and tax on animals are the other important sources of tax revenue. Non-tax
revenues include income from properties, fees and receipts.
2.1.1 Assigned taxes
The taxes that are assigned to the LGs but collected by the State government (and then
passed on to the LGs) are called assigned taxes.
2.1.2 Shared taxes
Shared taxes are those that are assigned to and collected by the State government but a
share of these tax proceeds go to LGs.
2.2 Grants
The funds to LGs from State and Central governments are termed as grants. These grants may
be tied (scheme specific) or untied. The State grants consist of General Purpose
Grants/Funds, Development Funds/Plan Grants, and Maintenance Grants separately for road
and non-road purposes. The General Purpose Fund is an item of transfers created in lieu of
specific assigned and shared taxes and sundry grants traditionally given to Local Governments
(LGs). It is generally counted along with own funds. Loans from government and other
financial institutions constitute ‘other sources’. Debt heads, borrowed funds, donations and
contributions occupy a position of less importance (Sethi, 2004).

www.cppr.in
8 Local Finance in Kerala: A Study of Five Grama Panchayats in Ernakulam
Wwwwww
District
Working Paper
III
The next two sections focus on data analysis. To start with, the broad picture relating to total
revenue needs to be examined.
3.1 Total Revenue
The total revenue of the sample GPs is shown in Diagram 1.
Diagram 1: Total Revenue of Sample GPs
Source: AFS of the GPs concerned for various years
The income levels as reported in Diagam 1 for five GPs establish that the selection of these is
justified on the ground of revenue earned. Arakuzha panchayat representing the high-land
category has the lowest income level income whereas Edathala GP representing the mid-land
category has the highest revenue level. Kalady and Thiruvaniyoor panchayats also
representing the mid-land lie in between these two GPs in terms of total revenue, especially
in recent years. Ezhikara GP representing the low-land and coastal land can also be included
in the low income category. It is evident from the diagram that total revenue has been
increasing over the past five years in the five selected GPs. Ezhikkara and Kalady witnessed a
fall in the absolute revenue during 2014-15, a disturbing trend for these GPs. Thiruvaniyoor
witnessed a fall in the absolute revenue during 2012-13 and 2013-14 but picked up
tremendously in 2014-15.

www.cppr.in
9 Local Finance in Kerala: A Study of Five Grama Panchayats in Ernakulam
Wwwwww
District
Working Paper
Diagram 2: Average of Total Revenue for Various GPs (in Rs Lakhs )
The average total revenue for all sample GPs during the five year period under consideration
amounts to Rs 471.11 lakhs. It is Rs 248.29 lakhs for Arakuzha GP, the lowest one among all
GPs and Rs 617.47 Lakhs for Edathala GP, the highest total revenue. It was Rs 335.36 lakhs in
2010-11 but increased to Rs 621.92 lakhs in 2014-15 and showing an increase of 85 per cent
over the period (see Diagram 3).
Diagram 3: Average of Total Revenue for Various Years (in Rs lakhs)
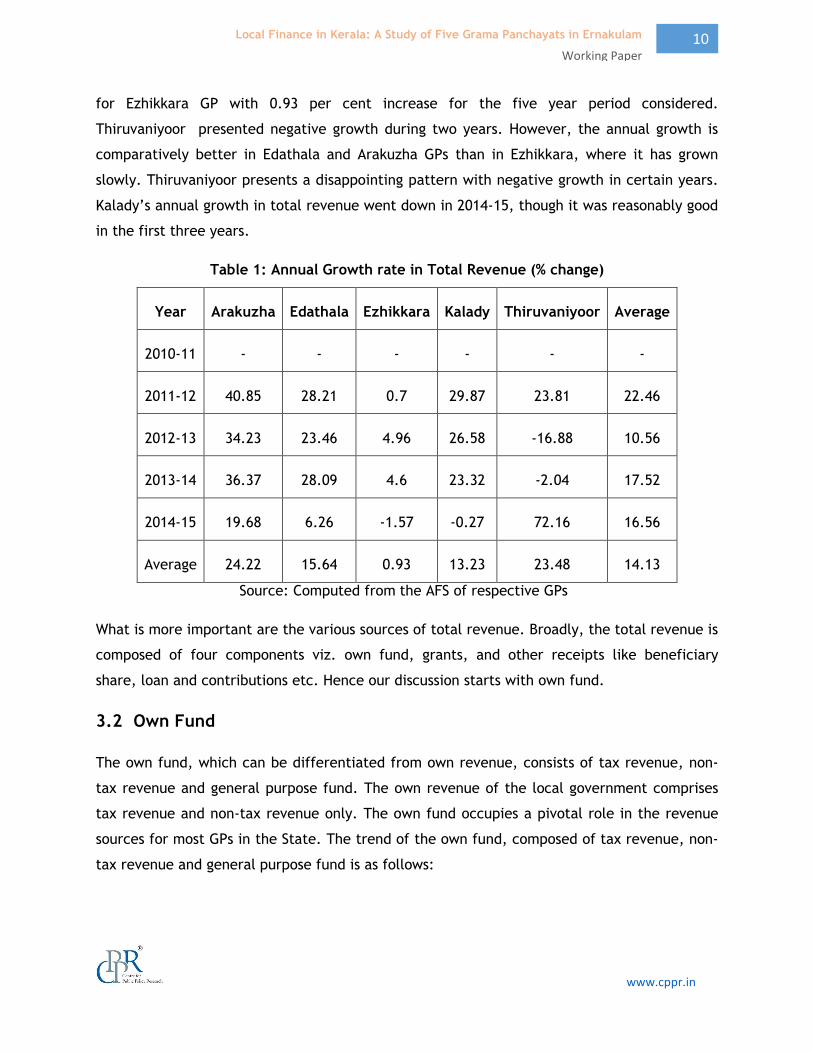
The percentage change in total revenue presents a slightly different picture. Table 1 shows
that the annual growth rate of total revenue has fallen from 22.46 per cent in 2011-12 to
16.56 per cent in 2014-15 for all panchayats. Taking the GPs separately it is clear that the
highest increase is in Thiruvaniyoor panchayat, followed by Arakuzha. The lowest is reported
www.cppr.in
10 Local Finance in Kerala: A Study of Five Grama Panchayats in Ernakulam
Wwwwww
District
Working Paper
for Ezhikkara GP with 0.93 per cent increase for the five year period considered.
Thiruvaniyoor presented negative growth during two years. However, the annual growth is
comparatively better in Edathala and Arakuzha GPs than in Ezhikkara, where it has grown
slowly. Thiruvaniyoor presents a disappointing pattern with negative growth in certain years.
Kalady’s annual growth in total revenue went down in 2014-15, though it was reasonably good
in the first three years.
Table 1: Annual Growth rate in Total Revenue (% change)
Year Arakuzha Edathala Ezhikkara Kalady Thiruvaniyoor Average
2010-11 - - - - - -
2011-12 40.85 28.21 0.7 29.87 23.81 22.46
2012-13 34.23 23.46 4.96 26.58 -16.88 10.56
2013-14 36.37 28.09 4.6 23.32 -2.04 17.52
2014-15 19.68 6.26 -1.57 -0.27 72.16 16.56
Average 24.22 15.64 0.93 13.23 23.48 14.13
Source: Computed from the AFS of respective GPs
What is more important are the various sources of total revenue. Broadly, the total revenue is
composed of four components viz. own fund, grants, and other receipts like beneficiary
share, loan and contributions etc. Hence our discussion starts with own fund.
3.2 Own Fund
The own fund, which can be differentiated from own revenue, consists of tax revenue, non-
tax revenue and general purpose fund. The own revenue of the local government comprises
tax revenue and non-tax revenue only. The own fund occupies a pivotal role in the revenue
sources for most GPs in the State. The trend of the own fund, composed of tax revenue, non-
tax revenue and general purpose fund is as follows:

www.cppr.in
11 Local Finance in Kerala: A Study of Five Grama Panchayats in Ernakulam
Wwwwww
District
Working Paper
Diagram 4: Own Fund
It is evident that the own funds of all the GPs have increased over the years. During 2014-15
Edathala had the highest own fund with Rs 278.47 lakhs, followed by Kalady with Rs 254.01
lakhs. The lowest is reported by Arakuzha GP with Rs 79.20 lakhs and Ezhikkara with s 83.97
lakhs. The own fund of Thiruvaniyoor during 2014-15 was Rs 192.25 lakhs. The own fund
average for all GPs for the period under consideration stood at Rs 122.45 lakhs. This amounts
to 26 per cent of the total revenue of the sample GPs. The proportion of own fund to total
revenue (TR) across GPs and various years are shown in Table 2.
Table 2: Proportion of Own Fund to TR (%)
Year Arakuzha Edathala Ezhikkara Kalady Thiruvaniyoor
2010-11 26.87 21.89 11.41 33.47 24.74
2011-12 25.28 24.64 14.20 33.06 24.14
2012-13 24.53 26.3 16.34 33.27 24.50
2013-14 21.72 27.38 19.7 27.61 24.63
2014-15 20.60 33.69 21.76 35.95 25.18
Average 23.80 26.78 16.68 32.67 24.64
Source: Computed from the AFS of respective GPs

www.cppr.in
12 Local Finance in Kerala: A Study of Five Grama Panchayats in Ernakulam
Wwwwww
District
Working Paper
Table 2 shows that the proportion of own fund constitutes almost one-third of the total
revenue in Kalady while Ezhikkara has the lowest proportion. The proportion of own fund to
total revenue in Arakuzha takes a mid-path between Kalady and Ezhikkara. It amounts to one-
fourth of the total revenue during the first three years but comes down to one-fifth during
the last two years. A similar trend is noticed in Thiruvaniyoor and Edathala with slight
differences for certain years. The current proportion of own fund to total revenue ranges
from 20 per cent to 34 per cent and hence it may be concluded that more than one-fourth of
the total revenue of these GPs is contributed by own fund. The simple arithmatic mean of the
proportion of own fund to total revenue among the five GPs is 24.64 per cent. The proportion
of own fund to total revenue for various years varies from 24 per cent to 29 per cent
approximately.
Table 3: Average and Proportion of Own Fund to TR
Years
Average
(Rs in
Lakhs)
% to TR
2010-11 83.09 24.78
2011-12 100.30 24.42
2012-13 115.03 25.33
2013-14 136.17 25.52
2014-15 177.63 28.56
Combined
Average 122.45
26.00
Source: Computed from the AFS of respective GPs
The analysis across GPs is shown in Table 4. The highest proportion is noticed for Kalady with
32.54 per cent, followed by Edathala with 27.74 per cent. The lowest proportion of own fund
is noticed in Ezhikkara with 16.82 per cent.

www.cppr.in
13 Local Finance in Kerala: A Study of Five Grama Panchayats in Ernakulam
Wwwwww
District
Working Paper
Table 4: Average of Own Fund and Proportion of Own fund across GPs
GPs
Average
(Rs in
Lakhs)
% to TR
Arakuzha 56.92 22.92
Edathala 171.27 27.74
Ezhikkara 62.72 16.82
Kalady 181.74 32.54
Thiruvaniyoor 139.58 25.00
Combined Average 122.45
26.00
Source: Computed from the AFS of respective GPs
3.2.1 Own Revenue
The figures obtained after deducting general purpose fund, a statutory transfer, from own
fund representing ‘own revenue’ of the GPs has also increased over the period. The
significant variable to be examined is the own revenue because it is the actual revenue
generated by the GP, as it is constituted by tax and non-tax revenue. The proportion of own
revenue to total revenue needs to be examined and this is shown in Table 5.
Table 5: The Proportion of Own Revenue to Total Revenue (%)
Year Arakuzha Edathala Ezhikkara Kalady Thiruvaniyoor
2010-11 12.1 11.6 5 24.1 24.09
2011-12 12.1 12.9 5.7 23.5 16.93
2012-13 12.1 14 5.3 23.5 11.79

www.cppr.in
14 Local Finance in Kerala: A Study of Five Grama Panchayats in Ernakulam
Wwwwww
District
Working Paper
2013-14 10.1 14.9 5.2 18.2 14.36
2014-15 9.18 21.1 7.55 24.93 15.44
Average 11.12 14.90 5.75 22.85 16.52
Source: Computed from the AFS of respective GPs
OF: Own Fund OR: Own revenue
In all GPs the own revenue levels reveal a falling trend except for Edathala where it is 21 per
cent of the total revenue during 2014-15. The proportion of own revenue (as composed of tax
and non-tax revenue), to total revenue ranges from 5 per cent (for Ezhikkara during 2010-11)
to 25 per cent (for Kalady during 2014-15). There are clear differences across GPs with regard
to the proportion of own revenue to total revenue. The fall is partially attributed to the
growth in other revenues like plan fund.
Diagram 5: Proportion of Own Revenue to TR over the Period
The proportion of own revenue to total revenue is almost constant at 15 per cent over the
period. The combined average of the proportion of own revenue to total revenue is 14.23 per
cent. It was 15.38 in 2010-11, which amounts to 57.70 per cent of the own fund.

www.cppr.in
15 Local Finance in Kerala: A Study of Five Grama Panchayats in Ernakulam
Wwwwww
District
Working Paper
Table 6: Average of OR to own fund Over the period (%)
GPs
Proportion of
OR to OF
2010-11 62.04
2011-12 58.95
2012-13 54.44
2013-14 50.95
2014-15 62.11
Combined Average 57.70
Source: Computed from the AFS of respective GPs
It means that major chunk of the own fund is contributed by the general purpose fund which
is a statutory contribtution done by the state government. In order to understand the extent
of the general purpose fund in the own fund, the proportion of general purpose fund to total
revenue (TR) may be assessed.
Table 7: Proportion of General Purpose Fund to Total Revenue
Year Arakuzha Edathala Ezhikkara Kalady Thiruvaniyoor Average
2010-11 14.75 10.32 6.41 9.35 5.97 9.36
2011-12 13.16 11.76 8.53 9.54 6.58 9.91
2012-13 12.41 12.32 11.03 9.75 10.24 11.15
2013-14 11.65 12.45 14.51 9.45 12.39 12.09
2014-15 11.42 12.58 14.21 11.02 8.44 11.53
Average 12.68 11.89 10.94 9.82 8.72 10.81
Source: Computed from the AFS of respective GPs

www.cppr.in
16 Local Finance in Kerala: A Study of Five Grama Panchayats in Ernakulam
Wwwwww
District
Working Paper
The largest component in the own fund of Ezhikkara is the general purpose fund and the
lowest category is non-tax revenue. The average of the proportion of general purpose fund for
the five GPs increased from 9.36 per cent in 2010-11 to 12.09 per cent in 2013-14 and came
down to 12.09 per cent in 2014-15. The statistics quoted above indicate that the general
purpose fund occupies a pivotal position in the own fund because the difference between own
fund and own revenue is constituted by this fund which amounts to about 11 per cent of the
total revenue, which is almost 58 per cent of own fund.
A high proportion of general purpose fund in the own fund suggests that the potential of the
GPs in generating own revenue (through tax and non-tax revenue) needs to be strengthened
to become self-sufficient in planning and implementing its own projects. This corroborates an
earlier finding that no panchayat had generated a surplus from own revenue (including
assigned tax grants) consistently for the four years from 1999 to 2002 (World Bank, 2004).
Further disaggregation of own revenue into tax and non-tax revenues will help to analyse the
problems in detail.
3.2.1.1 Tax Revenue
The tax revenue trend in absolute terms for the five sample GPs is on the increase over the
specified period as per Diagram 6. However, the growth in Arakuzha and Ezhikkara is not
satisfactory while clear growth can be observed with regard to Edathala, Kalady and
Thiruvaniyoor.
Diagram 6: Tax Revenue of Sample GPs (in lakhs of rupees)
Source: Various AFS of respective GPs

www.cppr.in
17 Local Finance in Kerala: A Study of Five Grama Panchayats in Ernakulam
Wwwwww
District
Working Paper
The trend in tax revenue levels is the same as that of total revenue. The average of tax
revenue for all GPs during the five year period amounts to Rs 50.27 lakhs. The highest tax
revenue collection is in Edathala, followed by Kalady, Thiruvaniyoor, Arakuzha and Ezhikkara.
Average tax collection during 2014-15 was Rs 83.18 lakhs, which increased from Rs 27.77 lakhs
during 2010-11. The percentage change in tax revenue shown in Table 8 adds clarity to the
picture.
Table 8: Annual Growth in Tax Revenue (%)
Year Arakuzha Edathala Ezhikkara Kalady Thiruvaniyoor Average
2010-11 - - - - - -
2011-12 40.85 44.47 33.21 26.58 23.39 33.70
2012-13 34.23 31.58 4.96 26.58 12.41 21.95
2013-14 21.67 34.24 16.26 39.27 13.38 24.96
2014-15 24.84 45.95 46.29 15.52 87.73 44.07
Average 30.40 39.06 25.18 26.99 34.23 31.17
Source: Computed from AFS of respective GPs
The percentage change in tax revenue is satisfactory for Kalady GP but the tax revenue
collection presents some problems in Ezhikkara GP. While a steady annual growth in tax
revenue has been noticed in Kalady, an unsteady picture is protrayed by Ezhikkara GP.
Thiruvaniyoor also joins in the latter category, whereas Arakuzha and Edathala present
satisfactory growth but with a fall during the period under consideration. The proportion of
tax to total revenue is reported in Table 9 below:
Table 9: Proportion of Tax Revenue to Total Revenue (%)
Year Arakuzha Edathala Ezhikkara Kalady Thiruvaniyoor Average
2010-11 7.63 9.92 2.88 12.76 7.85 8.21
2011-12 7.63 11.18 3.81 12.44 7.82 8.58

www.cppr.in
18 Local Finance in Kerala: A Study of Five Grama Panchayats in Ernakulam
Wwwwww
District
Working Paper
2012-13 7.63 11.91 3.81 12.44 10.58 9.27
2013-14 6.81 12.48 4.23 14.05 12.24 9.96
2014-15 7.1 17.15 6.29 16.27 13.35 12.03
Average 7.36 12.53 4.20 13.59 10.37 9.61
Source: Computed from AFS of respective GPs
The proportion of tax revenue to total revenue is almost stagnant but not the same over the
five-year period in Kalady and Arakuzha. Ezhikkara, Thiruvaniyoor and Edathala have
succeeded in raising the contribution of tax revenue to total revenue. Thiruvaniyoor increased
its share of tax revenue to total revenue from 7.85 per cent in 2010-11 to 10.37 per cent in
2014-15 whereas it is 9.92 per cent to 12.53 per cent during the concerned period for
Edathala. Ezhikkara has the lowest share but steadily increased its proportion from 2.88 per
cent in 2010-11 to 4.20 per cent in 2014-15. The highest and most reasonable proportion is
noticed in Kalady GP with 13.59 per cent in 2014-15 whereas in Ezhikkara GP it is the lowest
and constitutes less than five per cent. The average proportion of tax revenue to total
revenue of five GPs reveals that 9.61 per cent of the total revenue is contributed by tax
revenue in the total revenue during the five year period. It was 8.21 per cent in 2010-11 and
increased to 12.03 per cent in 2014-15.
The tax revenue is not considered as reaching a desired level. It is much less than the official
expectation of officials. What are the reasons for this? To find an answer to this problem, the
disaggregated analysis of tax revenue needs to be examined first.
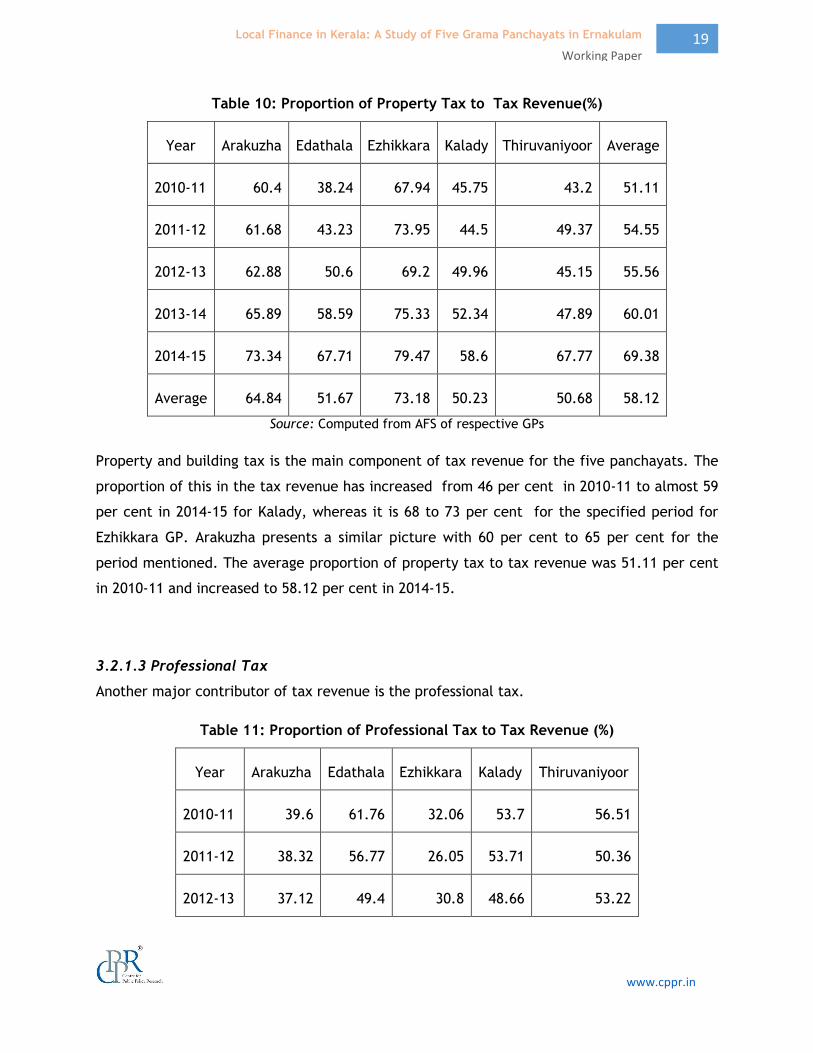
3.2.1.2 Property and Building Tax
The various components of tax revenue include property and building tax, profession tax,
entertainment tax, advertisement tax and show tax. Table 10 depicts the proportion of
property tax to tax revenue.
www.cppr.in
19 Local Finance in Kerala: A Study of Five Grama Panchayats in Ernakulam
Wwwwww
District
Working Paper
Table 10: Proportion of Property Tax to Tax Revenue(%)
Year Arakuzha Edathala Ezhikkara Kalady Thiruvaniyoor Average
2010-11 60.4 38.24 67.94 45.75 43.2 51.11
2011-12 61.68 43.23 73.95 44.5 49.37 54.55
2012-13 62.88 50.6 69.2 49.96 45.15 55.56
2013-14 65.89 58.59 75.33 52.34 47.89 60.01
2014-15 73.34 67.71 79.47 58.6 67.77 69.38
Average 64.84 51.67 73.18 50.23 50.68 58.12
Source: Computed from AFS of respective GPs
Property and building tax is the main component of tax revenue for the five panchayats. The
proportion of this in the tax revenue has increased from 46 per cent in 2010-11 to almost 59
per cent in 2014-15 for Kalady, whereas it is 68 to 73 per cent for the specified period for
Ezhikkara GP. Arakuzha presents a similar picture with 60 per cent to 65 per cent for the
period mentioned. The average proportion of property tax to tax revenue was 51.11 per cent
in 2010-11 and increased to 58.12 per cent in 2014-15.
3.2.1.3 Professional Tax
Another major contributor of tax revenue is the professional tax.
Table 11: Proportion of Professional Tax to Tax Revenue (%)
Year Arakuzha Edathala Ezhikkara Kalady Thiruvaniyoor
2010-11 39.6 61.76 32.06 53.7 56.51
2011-12 38.32 56.77 26.05 53.71 50.36
2012-13 37.12 49.4 30.8 48.66 53.22

www.cppr.in
20 Local Finance in Kerala: A Study of Five Grama Panchayats in Ernakulam
Wwwwww
District
Working Paper
2013-14 34.11 41.1 22.67 47.04 51.83
2014-15 26.66 32.14 19.57 40.17 31.93
Average 35.16 48.23 26.23 48.66 48.77
Source: Computed from AFS of respective GPs
The proportion of professional tax is coming down in all GPs over the period mentioned. The
simple arithmatic mean of the proportion of professional tax to total tax revenue was 48.73
per cent in 2010-11 but this decreased to 41.41 per cent in 2014-15. Thiruvaniyoor, Kalady
and Edathala can claim a substantial professional tax contribution towards total tax revenue.
The presence of many industrial units in Kalady, Edathala, and Thiruvaniyoor is the main
reason for good professional tax collection.
Diagram 7: Average Proportion of Professional Tax to Tax Revenue over the Period
It is evident that other taxes such as show tax and entertainment tax contribute an abysmal
amount to the tax revenue. The average of ‘other taxes’ amounts to just 0.74 per cent of tax
revenue in 2014-15 and was merely 0.17 per cent in 2010-11.
3.3 Trend in Non-tax Revenue
It is disappointing to note that non-tax revenue has come down over the period concerned in
all GPs except for Edathala where the proportion is very low.

www.cppr.in
21 Local Finance in Kerala: A Study of Five Grama Panchayats in Ernakulam
Wwwwww
District
Working Paper
Diagram 8: Trend in Non-tax Revenue
Diagram 8a Diagram 8b Diagram 8c
Diagram 8d Diagram 8e
Source: AFS of respective GPs
The percentage change in non-tax revenue as given in Table 12 clearly shows a declining
trend for all GPs. Continous negative growth in non-tax revenue has been registered in
Ezhikkara GP and negative growth in this area has also been reported for all GPs during 2013-
14.
Table 12: Percentage Change in Non-tax Revenue
Year Arakuzha Edathala Ezhikkara Kalady Thiruvaniyoor Average
2010-11 - - - - - -
2011-12 40.85 32.33 -11.91 26.58 -30.52 11.47

www.cppr.in
22 Local Finance in Kerala: A Study of Five Grama Panchayats in Ernakulam
Wwwwww
District
Working Paper
2012-13 34.23 49.25 -15.12 26.58 -88.99 1.19
2013-14 -0.83 51.83 -33.74 -54.27 71.46 6.89
2014-15 -23.66 71.95 30.08 110.1 70.22 51.74
Average 12.65 51.34 -7.67 27.25 5.54 17.82
Source: Computed from AFS of respective GPs
Although the proportion is satisfactory in respect of Kalady GP, it has come down from 11 per
cent 2012-13 to 4.11 per cent in 2013-14. For Thiruvaniyoor, the figures show a fall from
16.24 per cent to 2.09 per cent during 2014-15. Arakuzha, Ezhikkara and Edathala have a low
contribution of non-tax revenue for all periods. Arakuzha presents a slightly better picture in
terms of composition but the low share of non-tax revenue and falling proportion of tax
revenue in own fund are concerns to be addressed. The average proportion of non-tax
revenue to total revenue for all GPs considered came to 3.61 per cent in 2014-15.
Table 13: Proportion of Non-tax Revenue to Total Revenue
Year Arakuzha Edathala Ezhikkara Kalady Thiruvaniyoor Average
2010-11 4.48 1.65 2.13 11.37 16.24 7.17
2011-12 4.48 1.71 1.86 11.09 9.11 5.65
2012-13 4.48 2.06 1.5 11.09 1.21 4.07
2013-14 3.26 2.45 0.95 4.11 2.11 2.58
2014-15 2.08 3.96 1.26 8.66 2.09 3.61
Average 3.76 2.37 1.54 9.26 6.15 4.62
Source: Computed from AFS of respective GPs
Table 13 reveals that the combined average proportion of non-tax revenue to total revenue is
merely 4.62 per cent. The highest is observed in Kalady with 9.26 per cent, followed by
Thiruvaniyoor while the lowest is reported by Ezhikkara with 1.61 per cent. No steady trend is

www.cppr.in
23 Local Finance in Kerala: A Study of Five Grama Panchayats in Ernakulam
Wwwwww
District
Working Paper
observed in the proportion of non-tax revenue, as it decreased from 7.17 per cent in 2010-11
to 3.61 per cent in 2014-15.
The generation of own assets is less in Arakuzha panchayat. Kalady GP has several sources of
non-tax revenue: a bus stand, shopping complex, market, comfort station and a
crematorium. Kalady GP also gains a fair amount of revenue by way of rent and auction
income. The construction of a new slaughter house is due to be completed, which would be
another source of non-tax revenue. However, such revenue sources are lacking in the other
two GPs, except the crematorium for Arakuzha which generates only a negligible income.
Sand ghats (the process of sand mining and selling it for commercial purposes) provided
income to Arakuzha and Kalady GPs earlier. At present it is very difficult to get the necessary
pass (legal sanction to mine the sand) and hence the revenue from this source has reduced.
All these aspects explain the fall in non-tax revenue. The Kalady model needs to be
replicated by other GPs with regard to non-tax revenue.
3.4 Grants
This item is constituted by all kinds of grants received from central and state governments.
Table 14: Proportion of Grants to Total Revenue (%)
Year Arakuzha Edathala Ezhikkara Kalady Thiruvaniyoor Average
2010-11 73.05 76.17 86.68 66.24 60.90 72.61
2011-12 74.64 73.70 84.95 66.93 71.55 74.35
2012-13 75.39 72.24 82.42 66.72 77.26 74.81
2013-14 78.23 71.37 80.27 71.73 68.92 74.10
2014-15 79.34 65.15 78.20 63.53 81.66 73.58
Average 76.13 71.73 83.10 67.03 72.06 73.89
Source: Computed from AFS of respective GPs
Plan grants, maintenance grants, grants for centrally sponsored schemes and grants for state
sponsored schemes constitute the major items classified as grants. Interestingly, this is the
major source of revenue for the GPs. It constitutes almost two-third of the total revenue for

www.cppr.in
24 Local Finance in Kerala: A Study of Five Grama Panchayats in Ernakulam
Wwwwww
District
Working Paper
all the years. It is more than 75 per cent for Ezhikkara GP which has the lowest own revenue
too. However, the average proportion of grants to total revenue is calculated as 73.89 per
cent for the five year period for all GPs. This shows a slight increase from 72.61 per cent in
2010-11.
3.5 Others
Beneficiary contributions, donations, loans and contributions from other LSGIs are the major
components of ‘other’ sources. The contribution from this component to the total revenue
seems to be insignificant. It amounts to just 1.57 per cent of total revenue of the GPs.
Table 15: Proportion of ‘Others’ to Total Revenue (%)
Year Arakuzha Edathala Ezhikkara Kalady Thiruvaniyoor Average
2010-11 0.08 1.94 1.91 0.29 9.04 2.66
2011-12 0.08 1.66 0.85 0.01 4.94 1.51
2012-13 0.08 1.46 1.24 0.01 0.71 0.70
2013-14 0.05 1.25 0.03 0.66 4.33 1.26
2014-15 0.06 1.16 0.04 0.52 4.46 1.25
Average 0.07 1.49 0.81 0.30 4.70 1.48
Source: Computed from AFS of respective GPs
The GPs must pay more attention to this area for revenue improvement and thereby initiate
more feasible projects for implementation.

www.cppr.in
25 Local Finance in Kerala: A Study of Five Grama Panchayats in Ernakulam
Wwwwww
District
Working Paper
IV
Effectiveness of Fund Mobilization
The fund mobilization of various GPs as discussed in the previous chapter does not reach
expected levels. The various ratios that have been worked out substantiate this point. The
same situation applies to most funding sources. In this context, it is worthwhile to understand
the effectiveness of fund mobilization from various sources. Fund mobilization effectiveness
is an important aspect that has to be examined in relation to certain parameters. To
understand this, the potential revenue from each fund has to be compared with the actual
revenue. The potential revenue from each source can be gauged from the relevant budget
estimates and discussion with officials and experts. It may be noted that the budget figures
for four years (2010-11 to 2013-14) have been collected to evaluate this particular aspect.
4.1 Effectiveness in Terms of Budget Estimation
To begin with, total revenue may be considered. Potential total revenue envisaged in the
budget and actual revenue from all sources for the selected five GPs is shown in diagrams 9a
to 9e.
Diagram 9: Proportion of Total Revenue Realized with Respect to Budget Estimate
9a Arakuzha 9b Edathala

www.cppr.in
26 Local Finance in Kerala: A Study of Five Grama Panchayats in Ernakulam
Wwwwww
District
Working Paper
9c Kalady 9d Ezhikkara
9 e Thiruvaniyoor
Source: Budgets and AFS of GPs
The diagrams indicate that all GPs, except Edathala, exhibit poor performance in collecting
potential revenue as devised by their budgets. The proportion of actual total revenue to
estimated total revenue as shown in Table 16 further substantiates this point.
Table 16: Proportion of Actual Total Revenue to Estimated Total Revenue
Year Arakuzha Edathala Ezhikara Kalady Thiruvaniyoor
2010-11 41.41 68.11 52.56 15.06 50.29
2011-12 51.47 92.39 70.25 21.6 61.62
2012-13 51.8 91.57 51.26 23.48 53.76
www.cppr.in
27 Local Finance in Kerala: A Study of Five Grama Panchayats in Ernakulam
Wwwwww
District
Working Paper
2013-14 55.58 89.78 45.51 24.88 53.59
2014-15 58.35 52.94 41.55 25.2 79.61
Source: Computed from AFS and Budgets of respective GPs
Edathala GP has done justice in collecting potential revenue. In other words, the budget is
realistic and hence realisation is 90 per cent for most of the years (see Table 16). Kalady is
very poor in collecting the potential revenue as per budget estimates.Other GPs are not even
realising the one-third of the budget estimates.
Taking the average proportion of total revenue realised across various years it was 45.49 per
cent in 2010-11 and increased to 53.87 per cent. However, this figure still reveals very low
mobilisation. The main reason is that there are no serious attempts to collect the revenue at
GP level. Another possible reason is the preparation of an unrealistic budget. The
disaggragation picture will provide more insights. The tax revenue mobilisation can be taken
up first.
4.2 Tax Revenue
As a component of total revenue, the mobilisation of tax revenue is slightly better in relation
to the budget estimate. Again, the picture in Kalady is not satisfactory and Ezhikkara also
joins this GP in poor mobilisation of tax revenue.
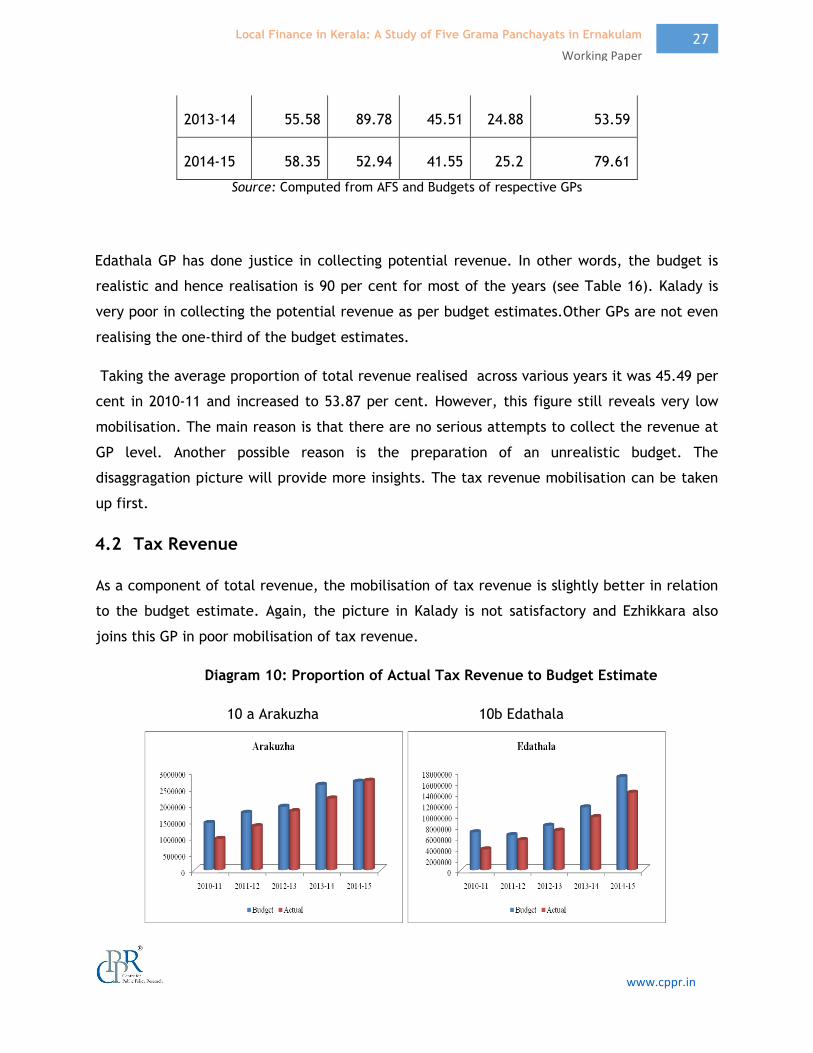
Diagram 10: Proportion of Actual Tax Revenue to Budget Estimate
10 a Arakuzha 10b Edathala

www.cppr.in
28 Local Finance in Kerala: A Study of Five Grama Panchayats in Ernakulam
Wwwwww
District
Working Paper
10 c Ezhikkara 10 d Kalady
10 e Thiruvaniyoor
Source: Budgets and AFS of GPs
The proportions worked out and shown in Table 10 reveals that Ezhikkara is poor in realising
budget estimates in reference to tax revenue, followed by Kalady whereas realisation is the
highest in Edathala. This is almost same in Arakuzha and Thiruvaniyoor.
Table 17: Proportion of Actual Tax Revenue to Estimated Tax Revenue
Year Arakuzha Edathala Ezhikkara Kalady Thiruvaniyoor
2010-11 66.01 54.86 42.48 33.69 91.04
2011-12 76.60 85.64 52.17 70.55 90.70
2012-13 92.89 88.76 46.05 48.57 87.40
2013-14 84.02 84.45 35.45 50.22 83.47
www.cppr.in
29 Local Finance in Kerala: A Study of Five Grama Panchayats in Ernakulam
Wwwwww
District
Working Paper
2014-15 101.15 83.22 49.59 76.67 152.68
Source: Computed from AFS and Budgets of respective GPs
The simple arithmatic mean of tax revenue realisation was 57.62 per cent of the budgeted
figure in 2010-11 and it increased to 72.73 per cent in 2013-14. Going for further
disaggregation of tax revenue, property tax may be considered first.
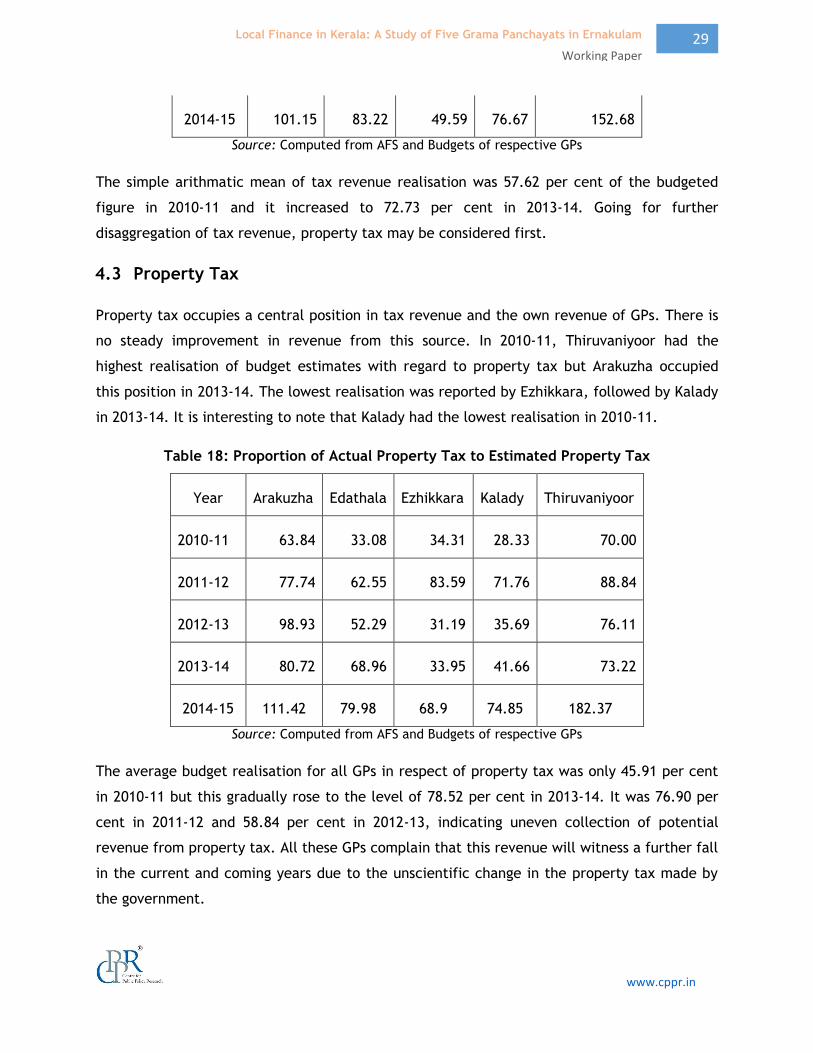
4.3 Property Tax
Property tax occupies a central position in tax revenue and the own revenue of GPs. There is
no steady improvement in revenue from this source. In 2010-11, Thiruvaniyoor had the
highest realisation of budget estimates with regard to property tax but Arakuzha occupied
this position in 2013-14. The lowest realisation was reported by Ezhikkara, followed by Kalady
in 2013-14. It is interesting to note that Kalady had the lowest realisation in 2010-11.
Table 18: Proportion of Actual Property Tax to Estimated Property Tax
Year Arakuzha Edathala Ezhikkara Kalady Thiruvaniyoor
2010-11 63.84 33.08 34.31 28.33 70.00
2011-12 77.74 62.55 83.59 71.76 88.84
2012-13 98.93 52.29 31.19 35.69 76.11
2013-14 80.72 68.96 33.95 41.66 73.22
2014-15 111.42 79.98 68.9 74.85 182.37
Source: Computed from AFS and Budgets of respective GPs
The average budget realisation for all GPs in respect of property tax was only 45.91 per cent
in 2010-11 but this gradually rose to the level of 78.52 per cent in 2013-14. It was 76.90 per
cent in 2011-12 and 58.84 per cent in 2012-13, indicating uneven collection of potential
revenue from property tax. All these GPs complain that this revenue will witness a further fall
in the current and coming years due to the unscientific change in the property tax made by
the government.
www.cppr.in
30 Local Finance in Kerala: A Study of Five Grama Panchayats in Ernakulam
Wwwwww
District
Working Paper
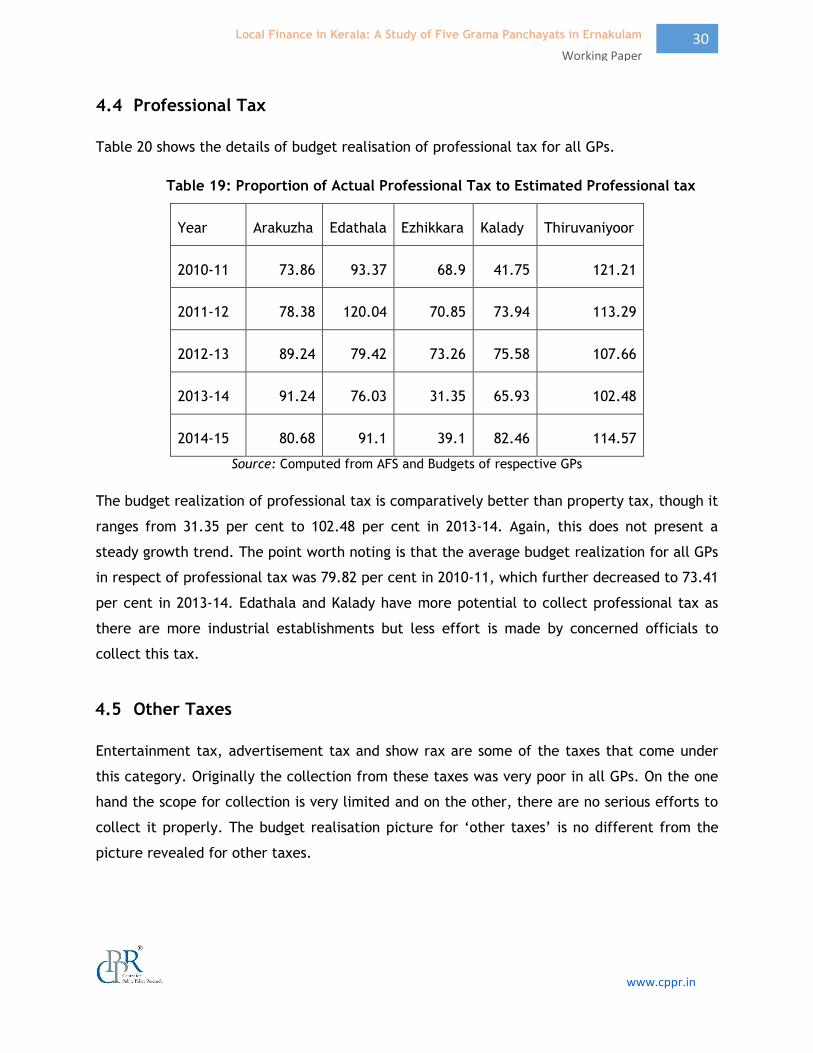
4.4 Professional Tax
Table 20 shows the details of budget realisation of professional tax for all GPs.
Table 19: Proportion of Actual Professional Tax to Estimated Professional tax
Year Arakuzha Edathala Ezhikkara Kalady Thiruvaniyoor
2010-11 73.86 93.37 68.9 41.75 121.21
2011-12 78.38 120.04 70.85 73.94 113.29
2012-13 89.24 79.42 73.26 75.58 107.66
2013-14 91.24 76.03 31.35 65.93 102.48
2014-15 80.68 91.1 39.1 82.46 114.57
Source: Computed from AFS and Budgets of respective GPs
The budget realization of professional tax is comparatively better than property tax, though it
ranges from 31.35 per cent to 102.48 per cent in 2013-14. Again, this does not present a
steady growth trend. The point worth noting is that the average budget realization for all GPs
in respect of professional tax was 79.82 per cent in 2010-11, which further decreased to 73.41
per cent in 2013-14. Edathala and Kalady have more potential to collect professional tax as
there are more industrial establishments but less effort is made by concerned officials to
collect this tax.
4.5 Other Taxes
Entertainment tax, advertisement tax and show rax are some of the taxes that come under
this category. Originally the collection from these taxes was very poor in all GPs. On the one
hand the scope for collection is very limited and on the other, there are no serious efforts to
collect it properly. The budget realisation picture for ‘other taxes’ is no different from the
picture revealed for other taxes.

www.cppr.in
31 Local Finance in Kerala: A Study of Five Grama Panchayats in Ernakulam
Wwwwww
District
Working Paper
4.6 Non-tax Revenue
Table 20 depicts the budget realization of non-tax revenue.
Table 20: Proportion of Actual Non-tax Revenue to Estimated Non-tax Revenue
Year Arakuzha Edathala Ezhikkara Kalady Thiruvaniyoor
2010-11 35.5 12.82 19.33 20.45 41.35
2011-12 36.44 41.89 20.82 47.52 41.92
2012-13 42 58.93 17.99 76.77 44.37
2013-14 53.86 55.56 9.47 28.4 65.93
2014-15 15.46 68.52 12.27 54.96 158.38
Source: Computed from AFS and Budgets of respective GPs
Budget realization of non-tax revenue is steadily increasing for Thiruvaniyoor, Edathala and
Arakuzha GPs. The performance in Kalady has also registered improvement although in recent
years it had dropped down to a pathetic level. Ezhikkara GP is performing badly in realizing
non-tax revenue. The average budget realization in respect of non-tax revenue was 25.0 per
cent in 2010-11 and it increased to 42.64 per cent in 2013-14. However, these rates are not
satisfactory. The effectiveness of non-tax revenue collection is low because of limited
potential for many GPs.
4.6.1 Own Revenue: A Summary
Own revenue is computed by taking the sum total of tax revenue and non-tax revenue. Table
21 gives an overview regarding the budget realization of own revenue.
Table 21:Proportion of Actual Own revenue to Estimated Own Revenue
Year Ezhikkara Arakuzha Edathala Kalady Thiruvaniyoor
2010-11 5 12.12 11.57 24.13 24.09
2011-12 5.67 12.12 12.88 23.52 16.93
2012-13 5.31 12.12 13.98 23.52 11.79

www.cppr.in
32 Local Finance in Kerala: A Study of Five Grama Panchayats in Ernakulam
Wwwwww
District
Working Paper
2013-14 5.19 10.07 14.93 18.16 14.36
2014-15 32.9 44.86 80.00 67.42 153.42
Source: Computed from AFS and budgets of respective GPs
It has been found that the simple arithmatic mean of tax revenue realisation was 57.62 per
cent of the budgeted figure in 2010-11 and it increased to 72.73 per cent in 2013-14. The
average budget realization in respect of non-tax revenue was 25.0 per cent in 2010-11 and it
increased to 42.64 per cent in 2013-14. Taking these two revenues together, it can be
ascertained from Table 4.7 that the realization of own revenue is very poor. Ezhikkara
presents a pathetic picture in this aspect. The simple arithmetic mean of budget realization
of own revenue shows that it was only 15.38 per cent in 2010-11 and it further decreased to
12.54 per cent in 2013-14. Hence it is very clear that the effectiveness in collecting own
revenue (both tax & non-tax revenues) is the area where serious efforts have to be
undertaken.
4.7 Plan Fund
It is learnt that plan fund is a major funding source for GPs. The realization rate of the plan
fund shows that GPs are not preparing the plan fund realistically, just as in the case of tax
and non-tax revenues.
Table 22: Proportion of Actual Plan Fund to Estimated Plan Fund
Year Arakuzha Kalady Ezhikkara Edathala Thiruvaniyoor
2010-11 45.63 7.22 61.98 46.04 44.09
2011-12 47.60 19.57 69.94 55.24 65.46
2012-13 38.80 17.40 36.81 42.38 39.41
2013-14 32.22 7.40 21.28 19.42 23.56
Source: Computed from AFS and budgets of respective GPs

www.cppr.in
33 Local Finance in Kerala: A Study of Five Grama Panchayats in Ernakulam
Wwwwww
District
Working Paper
Kalady has a very poor record in realizing the plan fund in relation to budget estimates. Other
GPs are showing similar realization rates. The average proportion of actual plan fund to the
estimated plan fund decreased from 41 per cent in 2010-11 to 20.78 per cent.
4.8 Maintenance Fund, CSS, SSS and others
The budget realization of maintenance fund has not been worked out due to the paucity of
data. The same is the case with ‘others.’ For CSS and SSS, the results are shown below.
Table 23: Proportion of Actual CSS and SSS Fund to Estimated Figures
Year Kalady Arakuzha Ezhikkara Thiruvaniyoor Edathala
2010-11 38.84 87.83 67.63 57.84 69.81
2011-12 42.02 89.04 80.47 94.91 91.18
2012-13 37.78 50.49 58.89
65.12 84.13
2013-14 34.93 54.43 56.44 63.47 82.05
Source: Computed from AFS and budgets of respective GPs
At present, the criticism against the GPs is that they are undertaking agency functions largely
due to the increased funds for sponsored schemes from central and state governments. Table
23 presents the details of the budget realization of CSS and SSS funds.

www.cppr.in
34 Local Finance in Kerala: A Study of Five Grama Panchayats in Ernakulam
Wwwwww
District
Working Paper
V
Summary and Conclusions
5.1 Major Findings
The major observations of this study can be summarised as follows:
The average of total revenue for all sample GPs during the five year period considered
comes to the extent of Rs 471.11 lakhs. It was Rs 335.36 lakhs in 2010-11 but increased
to Rs 621.92 lakhs in 2014-15 and hence registered an increase of 85 per cent over the
period. The annual growth rate of total revenue has fallen from 22.46 per cent in
2011-12 to 16.56 per cent in 2014-15 for all panchayats. Taking GPs separately it is
evident that the highest increase is in Thiruvaniyoor panchayat, followed by Arakuzha.
The lowest is reported in Ezhikkara GP with 0.93 per cent increase for the five year
period considered.
The average of own fund (tax revenue, non-tax revenue and general purpose fund) for
all GPs for the period considered is worked out at Rs 122.45 lakhs.This comes to the
extent of 26 per cent of total revenue of the sample GPs. The proportion of own fund
to total revenue for various years is ranging from 24 per cent to 29 per cent
approximately. The highest proportion is noticed for Kalady with 32.54 per cent,
followed by Edathala with 27.74 per cent. The lowest proportion of own fund is in
Ezhikkara with 16.82 per cent.
The proportion of own revenue (own fund minus general purpose fund), composed of
both tax revenue and non-tax revenue as compared to total revenue varies from 5 per
cent (for Ezhikkara during 2010-11) to 24.93 per cent (for Kalady during 2014-15) over
the years but with clear differences across GPs. The average proportion of tax revenue
to total revenue of five GPs reveals that 9.61 per cent of the total revenue is
contributed by tax revenue in the total revenue during the five year period. It was
8.21 per cent in 2010-11 and increased to 12.03 per cent in 2014-15.
The explanation about own fund and own revenue highlights the pivotal position of the
general purpose fund in the own fund, because the difference between these two is
constituted by this fund, which amounts to about 12.08 per cent of the total revenue.
www.cppr.in
35 Local Finance in Kerala: A Study of Five Grama Panchayats in Ernakulam
Wwwwww
District
Working Paper
It means that the largest component of own fund is the general purpose fund which is
a statutory transfer.
Property and building tax is the main component of tax revenue for the five
panchayats. Its proportion in the tax revenue has increased from 46 per cent in 2010-
11 to almost 59 per cent in 2014-15 for Kalady, whereas it is 68 to 73 per cent for the
period mentioned for Ezhikkara GP. Arakuzha presents a similar picture with 60 to 65
per cent for the respective period mentioned. The average proportion of property tax
to tax revenue was 51.11 per cent in 2010-11 and this increased to 58.12 per cent in
2014-15.
The proportion of professional tax is falling in all GPs over the period mentioned. The
simple arithmatic mean of the proportion of professional tax to total tax revenue was
48.73 per cent in 2010-11 but decreased to 41.41 per cent in 2014-15. Thiruvaniyoor,
Kalady and Edathala have a good contribution of professional tax towards total tax
revenue. The presence of many industrial units in Kalady, Edathala and Thiruvaniyoor
is the main reason for good professional tax collection.
The combined average of the proportion of non-tax revenue to total revenue is merely
4.62 per cent. The highest is noticed in Kalady with 9.26 per cent, followed by
Thiruvaniyoor and the lowest is reported by Ezhikkara with 1.61 per cent. There is no
steady trend in the proportion of non-tax revenue as it decreased from 7.17 per cent
in 2010-11 to 3.61 per cent in 2014-15.
The generation of own assets is less in most of the panchayats. Kalady GP has several
sources of non-tax revenue: a bus stand, shopping complex, market, comfort station
and a crematorium. Kalady gets substantial revenue by way of rent and auction
income. The construction of a new slaughter house is also due to be completed, which
would be yet another source of non-tax revenue for Kalady GP. However, such sources
are lacking in other two GPs. The Kalady model can be replicated by other GPs in
respect of non-tax revenue.
Grants, which are a major component of total revenue, needs special mention. Plan
grants, maintenance grants, grants for centrally sponsored schemes and grants for
state sponsored schemes, constitute the major items of grants. Interstingly grants are

www.cppr.in
36 Local Finance in Kerala: A Study of Five Grama Panchayats in Ernakulam
Wwwwww
District
Working Paper
the major sources of revenue for the GPs. It is almost two-third of the total revenue
for all the years. It is more than 75 per cent for Ezhikkara GP, which has the lowest
own reveneue too. However, the average proportion of grants to total revenue is
calculated as 73.89 per cent for the five year period for all GPs.
All other incomes of the GPs are labelled ‘other items’. Beneficiary contributions,
donations, loans and contributions from other LSGIs are the major components of
‘other’ items. The contribution from this component to the total revenue seems to be
insignificant. It amounts to just 1.57 per cent of total revenue of the GPs.
In short, two-third of the total revenue is constituted by grants (exactly 73.89 %),
hardly one–fourth is contributed by own fund, which includes general purpose fund
(exactly 24.64 %) and the rest is contributed by ‘other items’ (1.48 %).
The poor mobilisation of own revenue is evident from the budget realisation figures
and conclusions drawn from the discussions and interviews. It is learnt that all GPs,
except Edathala, exhibit poor performance in collecting potential revenue as devised
by their budgets. The average proportion of total revenue realised with respect to
budget estimates was 45.49 per cent in 2010-11 although this increased to 53.87 per
cent in 2013-14, it still indicates very low mobilisation. The main reason is the lack of
serious attempts to collect the revenue at GP level. Another possible reason is the
preparation of an unrealistic budget.
The simple arithmatic mean of tax revenue realisation was 57.62 per cent of budgeted
figure in 2010-11 and this increased to 72.73 per cent in 2013-14. Going for further
disaggregation of tax revenue, property tax occupies a central position in tax revenue
and own revenue of GPs. The average of budget realisation for all GPs in respect of
property tax was 45.91 per cent in 2010-11 but this gradually rose to 78.52 per cent in
2013-14.
A point worth noting is that the average budget realization for all GPs in respect of
professional tax was 79.82 per cent in 2010-11, which further decreased to 73.41 per
cent in 2013-14. Edathala and Kalady have more potential to collect professional tax
as there are industrial establishments but inadequate collection efforts are being
made by the officials.

www.cppr.in
37 Local Finance in Kerala: A Study of Five Grama Panchayats in Ernakulam
Wwwwww
District
Working Paper
The ‘other’ sources include entertainment tax, advertisement tax and show tax.
Originally the collection from these taxes was very poor for all GPs. On the one hand,
the scope is very limited and on the other, there are no serious efforts to collect these
taxes properly.
The average budget realization in respect of non-tax revenue was 25.0 per cent in
2010-11 and it increased to 42.64 per cent in 2013-14. However, these rates are not
satisfactory. The effectiveness in the collection of non-tax revenue is low because of
limited potential for many GPs.
The average proportion of actual plan fund to estimated plan fund decreased from 41
per cent in 2010-11 to 20.78 per cent in 2013-14.
5.2 Problems
Through discussion and interviews, several problems have been identified that impede the
effectiveness in collecting the tax revenue.
1. Untimely and Unscientifc Tax Amendment
One major setback pinpointed by all GPs is the tax rate amendment made by the Government
with regard to building tax. The tax slabs were increased in the beginning of 2015 but due to
political pressure and lobbying, the government was compelled to reduce the slabs before the
panchayat election. Earlier tax exemption was given to those with building area of 350 sq ft,
which is now raised to 660 sq.ft. In fact, the GPs had already collected as per the increased
rates. Now they have to refund the excess tax amount collected by making adjustments in the
coming year’s bill. Thus the tax revenue in the coming year would come down by 20-40 per
cent. It has been suggested that 40 per cent of houses in most GPs have an area less than 660
sq.ft, while 50 per cent have an area under 2000 sq. ft and only 10 per cent have an area
above 2000 sq.ft. The first category is more significant in respect of Arakuzha and Ezhikkara
(low income panchayats). Such houses may constitute around 60 per cent of the total.
Ezhikkara GP authorities have reported that their tax revenue from property and building tax
fell from 14 lakh to 4 lakh due to this amendment. Morover, taxpayers are not remitting the
tax because of the amendment and hence there was an absolute fall in the collection of tax
revenue during 2014-15. The problem would be aggravated further in the coming years.
www.cppr.in
38 Local Finance in Kerala: A Study of Five Grama Panchayats in Ernakulam
Wwwwww
District
Working Paper
Political amateurism has a crucial impact on the collection of potential revenue by local
bodies. The improper and partial method of assessing property tax by officials aggravates the
problem. Even when people were
prepared to pay increased
property tax, political leaders
reduced or made amendments
for short term political gains,
which adversely affected
collection levels.
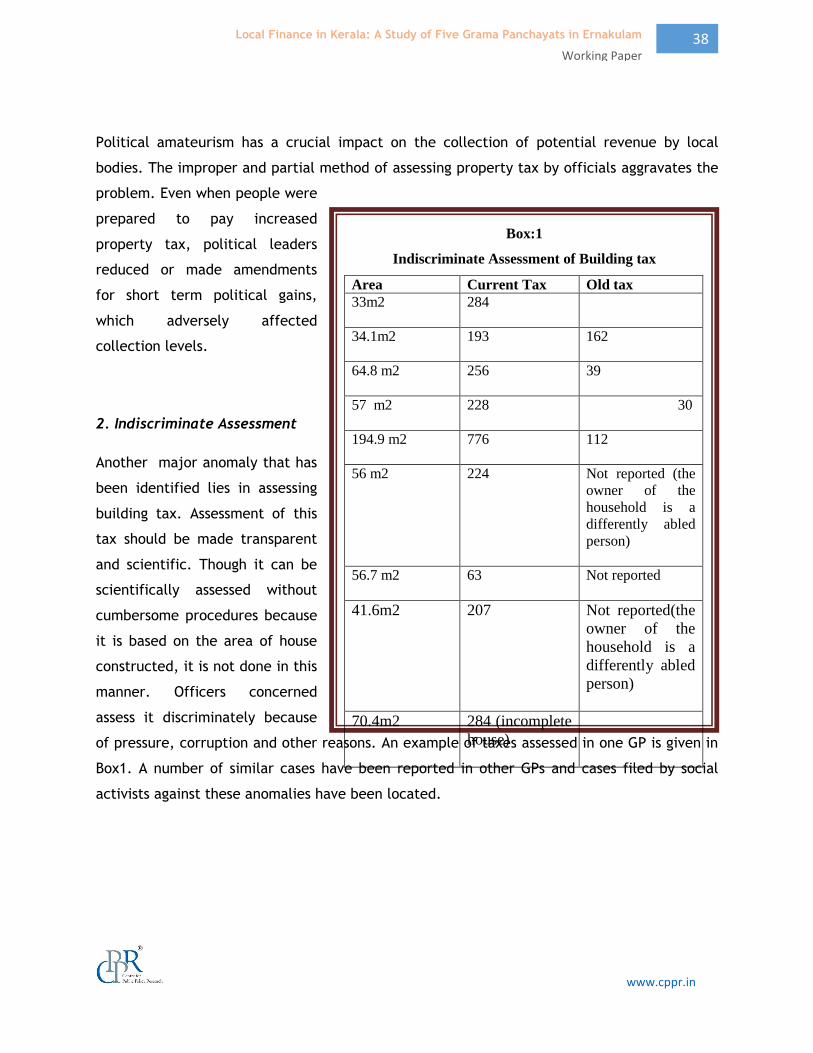
2. Indiscriminate Assessment
Another major anomaly that has
been identified lies in assessing
building tax. Assessment of this
tax should be made transparent
and scientific. Though it can be
scientifically assessed without
cumbersome procedures because
it is based on the area of house
constructed, it is not done in this
manner. Officers concerned
assess it discriminately because
of pressure, corruption and other reasons. An example of taxes assessed in one GP is given in
Box1. A number of similar cases have been reported in other GPs and cases filed by social
activists against these anomalies have been located.
Box:1
Indiscriminate Assessment of Building tax
Area Current Tax Old tax
33m2 284
34.1m2 193 162
64.8 m2 256 39
57 m2 228 30
194.9 m2 776 112
56 m2 224 Not reported (the
owner of the
household is a
differently abled
person)
56.7 m2 63
Not reported
41.6m2 207 Not reported(the
owner of the
household is a
differently abled
person)
70.4m2 284 (incomplete
house)
Source : Petition filed by social activists

www.cppr.in
39 Local Finance in Kerala: A Study of Five Grama Panchayats in Ernakulam
Wwwwww
District
Working Paper
3. Neglect of Non-tax Revenue
There are less efforts by most GPs to tap non-tax revenue sources. It is learnt that many GPs
have scope for raising revenue by way of non-tax revenue sources. However, these sources
are completely neglected except in a few GPs like Kalady.
4. Neglect of ‘other items’
There are a lot of other incomes to be tapped by the GPs. Beneficary contribution is one
source of income but the GPs are hesitant to tap potential resources by way of beneficary
contribution. Another potential source of income is contributions from other LSGs by way of
joint projects. The atittude of the GPs is not positive in this matter. The same is the case
with loans and voluntary donations.
5. Unscientific Way of Budget Preparation
The unscientific estimation of revenues in the budget adds to the problem of realising the
revenues effectively. Lack of experts to prepare the budget is a common problem for all GPs.
5.3 Suggestions
1. Tapping Potential Tax Revenue
A high proportion of general purpose funds in the own fund category emphasizes the fact that
the potential of GPs to generate own revenue (through tax and non-tax revenue) must be
strengthened to make them self-sufficient in planning and implementing their own projects.
The study throws a question on the point that whether own revenue as a funding source is
effectively tapped. The share of own revenue is not significant and the proportion of tax
revenue in the total revnue presents a decline.
2. Collection campaign including online remittance
Collection of revenue should be made more effective by arranging collection campaigns and
other programmes, including online remittance. Earlier, the local bodies successfully
practiced it and hence the actual collection was better than the current one. Still, it is learnt
that some GPs follow collection campaigns that help to achieve efficiency in revenue
generation.

www.cppr.in
40 Local Finance in Kerala: A Study of Five Grama Panchayats in Ernakulam
Wwwwww
District
Working Paper
3.Attempts to Realise Non-tax Revenue
The scope of non-tax revenue is very much restricted. Non-tax revenue constitutes a small
fraction of the total revenue of the GPs. There should be attempts to increase the non-tax
revenue as the potential in this area is less in the GP. The Kalady GP presents a good model in
this respect. Kalady gains revenue from its own bus stand, commercial complex and slaughter
house. Constructing crematoriums throughout the GPs is not a wise step. However, the
construction of commercial complexes and similar efforts would help the GPs to gain more
revenue by way of non-tax. Certainly, a GP should not only be viewed as an agency to spend
the money but also a platform to mobilize revenue and thereby start more developmental
projects with its own revenue.
4. Attempts to raise revenue through ‘other items’
The GPs should take efforts to raise revenue through beneficiary contributions, donations,
contributions from other GPs and loans. In reality, there is immense scope for raising revenue
through these sources but local governments are not tapping these sources effectively. If they
are properly and wisely tapped, the GPs can develop and devise innovative and useful
projects.
5. Agency Functions to Independent Activities
Plan fund, maintenance fund and other transfers constitute major funding sources of GPs. In
fact the GPs undertake a lot of agency functions as the bulk of the revenue is by way of
grants which have to be implemented as per stipulated guidelines. On the one hand, this
restricts the freedom of GPs to devise independent projects with own revenue and on the
other, the GPs lack sufficient own revenue to formulate new projects that are useful to
society. As a result, GPs are undertaking agency functions for central and state government.
6. Innovative way of undertaking Agency Functions
The grant guidelines restrict the freedom of GPs to undertake agency functions. There should
be some freedom on the part of GPs so as to effectively implement the projects, recognising
locally felt needs.

www.cppr.in
41 Local Finance in Kerala: A Study of Five Grama Panchayats in Ernakulam
Wwwwww
District
Working Paper
5.4 Conclusion
Grama panchayats are performing better compared to their performance three decades
earlier but they are still not meeting expected standards. Dramatic improvement in
generating own income, particularly in collecting potential building and professional tax has
to be initiated. Steps are also necessary for generating own assets and thereby collecting
more non-tax revenue. The beneficiary contributions, other voluntary donations and
contributions from other local bodies are not being properly tapped. The plight of the GPs is
that they are performing with certain tools and controlled by many procedures and
formalities. Instead they must operate within a specific framework to generate and collect
more revenue so that they can design and implement more innovative and fruitful projects
that are beneficial to their local communities.

www.cppr.in
42 Local Finance in Kerala: A Study of Five Grama Panchayats in Ernakulam
Wwwwww
District
Working Paper
References
Chakraborty, Pinaki (2004): Thirteenth Finance Commission and Local Bodies: An
Assessment, NIPEP, New Delhi.
Economic Review 2014 (2015): State Planning Board, Government of Kerala, Trivandrum
Government of Kerala, (2000): Report of the Second State Finance Commission
(Volume I), Government of Kerala.
Government of Kerala, (2010): Report of the Fourth State Finance Commission (Volume
I), Government of Kerala.
Government of Kerala (2015): Report of the Comptroller and Auditor General of India
on Local Self-Government Institutions for the year ended March 2014, Report No.3 of
the year 2015.
Nataraj V K, N. Premalatha, Veeranna Gowda, and G.S. Ganesh Prasad (2014): Study of
Panchayat Finances in Karnataka, Institute for Development and Empowerment, Mysore.
Oommen M A and Abhijit Datta (1995): Panchayats and their Finance, Institute of Social
Sciences, New Delhi.
Sharma, Rashmi (2003): Kerala’s Decentralization: Idea in Practice, EPW, Vol.38 (36), 6
September.
Thimmaiah G (2002): Local Government Finances: Some Issues, in Konard Adenauer
Foundation (ed), Local Government Finances in India, Manohar, New Delhi
Roy Bahl, Geetha Sethi et. al (2004): India, Fiscal Decentralization to Rural
Government, Vol-I, January 7, 2004, World Bank.
World Bank (2004): India Fiscal Decentralization to Rural Governments, Report No.
26654-IN, Rural Development Unit South Asia Region