
Local field potentials indicate network state and account for neuronal response variability
13
J Comput Neurosci DOI 10.1007/s10827-009-0208-9 Local field potentials indicate network state and account for neuronal response variability Ryan C. Kelly · Matthew A. Smith · Robert E. Kass · Tai Sing Lee Received: 28 July 2009 / Revised: 25 November 2009 / Accepted: 22 December 2009 © Springer Science+Business Media, LLC 2010 Abstract Multineuronal recordings have revealed that neurons in primary visual cortex (V1) exhibit coordi- nated fluctuations of spiking activity in the absence and in the presence of visual stimulation. From the pers- pective of understanding a single cell’s spiking activity relative to a behavior or stimulus, these network fluc- tuations are typically considered to be noise. We show that these events are highly correlated with another commonly recorded signal, the local field potential (LFP), and are also likely related to global network state phenomena which have been observed in a num- ber of neural systems. Moreover, we show that at- Action Editor: Alain Destexhe R. C. Kelly (B ) · M. A. Smith · R. E. Kass · T. S. Lee Center for the Neural Basis of Cognition, Pittsburgh, PA, USA e-mail: [email protected] R. C. Kelly · T. S. Lee Computer Science Department, Carnegie Mellon University, Pittsburgh, PA, USA M. A. Smith Department of Neuroscience, University of Pittsburgh, Pittsburgh, PA, USA R. E. Kass Department of Statistics, Carnegie Mellon University, Pittsburgh, PA, USA R. E. Kass Machine Learning Department, Carnegie Mellon University, Pittsburgh, PA, USA tributing a component of cell firing to these network fluctuations via explicit modeling of the LFP improves the recovery of cell properties. This suggests that the impact of network fluctuations may be estimated using the LFP, and that a portion of this network activity is unrelated to the stimulus and instead reflects ongoing cortical activity. Thus, the LFP acts as an easily acces- sible bridge between the network state and the spiking activity. Keywords Local field potential · Correlation · Network state · Spontaneous activity · Multielectrode array · Decoding · Population coding 1 Introduction One of the most striking features of spike trains is their variability—that is, the same visual stimulus does not elicit the same spike pattern for repeated trials. This variability is often considered “noise,” the connotation being that it is due to unknown factors. Identifying these factors should improve understanding and enable better characterization of neural response. One as- pect of trial-to-trial fluctuation that has been examined is correlation between neurons. From neuroanatomy, we know that the visual cortex contains a rich pat- tern of connections. Because of these connections, the spiking activity of groups of cortical neurons is not independent—instead it is correlated on a range of time scales (Smith and Kohn 2008). The correlation among neurons has most often been measured by simultaneous recording of nearby pairs. In the retina, it has recently become possible to record from a nearly complete pop- ulation of certain types of ganglion cells in a region
Transcript of Local field potentials indicate network state and account for neuronal response variability

J Comput NeurosciDOI 10.1007/s10827-009-0208-9
Local field potentials indicate network stateand account for neuronal response variability
Ryan C. Kelly · Matthew A. Smith ·Robert E. Kass · Tai Sing Lee
Received: 28 July 2009 / Revised: 25 November 2009 / Accepted: 22 December 2009© Springer Science+Business Media, LLC 2010
Abstract Multineuronal recordings have revealed thatneurons in primary visual cortex (V1) exhibit coordi-nated fluctuations of spiking activity in the absence andin the presence of visual stimulation. From the pers-pective of understanding a single cell’s spiking activityrelative to a behavior or stimulus, these network fluc-tuations are typically considered to be noise. We showthat these events are highly correlated with anothercommonly recorded signal, the local field potential(LFP), and are also likely related to global networkstate phenomena which have been observed in a num-ber of neural systems. Moreover, we show that at-
Action Editor: Alain Destexhe
R. C. Kelly (B) · M. A. Smith · R. E. Kass · T. S. LeeCenter for the Neural Basis of Cognition,Pittsburgh, PA, USAe-mail: [email protected]
R. C. Kelly · T. S. LeeComputer Science Department,Carnegie Mellon University,Pittsburgh, PA, USA
M. A. SmithDepartment of Neuroscience,University of Pittsburgh,Pittsburgh, PA, USA
R. E. KassDepartment of Statistics,Carnegie Mellon University,Pittsburgh, PA, USA
R. E. KassMachine Learning Department,Carnegie Mellon University,Pittsburgh, PA, USA
tributing a component of cell firing to these networkfluctuations via explicit modeling of the LFP improvesthe recovery of cell properties. This suggests that theimpact of network fluctuations may be estimated usingthe LFP, and that a portion of this network activity isunrelated to the stimulus and instead reflects ongoingcortical activity. Thus, the LFP acts as an easily acces-sible bridge between the network state and the spikingactivity.
Keywords Local field potential · Correlation ·Network state · Spontaneous activity ·Multielectrode array · Decoding · Population coding
1 Introduction
One of the most striking features of spike trains is theirvariability—that is, the same visual stimulus does notelicit the same spike pattern for repeated trials. Thisvariability is often considered “noise,” the connotationbeing that it is due to unknown factors. Identifyingthese factors should improve understanding and enablebetter characterization of neural response. One as-pect of trial-to-trial fluctuation that has been examinedis correlation between neurons. From neuroanatomy,we know that the visual cortex contains a rich pat-tern of connections. Because of these connections, thespiking activity of groups of cortical neurons is notindependent—instead it is correlated on a range of timescales (Smith and Kohn 2008). The correlation amongneurons has most often been measured by simultaneousrecording of nearby pairs. In the retina, it has recentlybecome possible to record from a nearly complete pop-ulation of certain types of ganglion cells in a region

J Comput Neurosci
and identify the correlation structure of this popula-tion (Shlens et al. 2009). However, in cerebral cortexrecording a full population of individual neurons in aregion has been impossible, and large scale recordingsin vivo have been rare. Correlated variability has astrong influence on population coding—it can enhanceor diminish the information encoded within that popu-lation depending on a number of factors (Zohary et al.1994; Shadlen and Newsome 1998; Abbott and Dayan1999; Averbeck et al. 2006). Although it is possiblefor a signal to be encoded in the correlation strengthitself (Kohn and Smith 2005; Samonds and Bonds 2005;Smith and Kohn 2008; Huang and Lisberger 2009),correlated variability is more often thought of as noisewhich is to be removed in order to better reveal thesignal. Experimenters typically deal with this problemthrough multiple trial repetitions and simply averagingthe neuronal responses, assuming that any noise isthereby diminished or removed.
An understanding of neuronal population activity isincomplete when measured only with spiking activityfrom a small subset of the total neurons in a region.Intracellular measurements of subthreshold activityhave revealed that membrane potentials are continu-ously correlated between nearby cells in primary visualcortex (V1) (Lampl et al. 1999). In addition, the firingof neurons has been strongly linked to ongoing popu-lation activity measured with optical imaging (Tsodykset al. 1999) and LFP (Nauhaus et al. 2009). This link tothe state of the local population is an influential forceaffecting the variability in a cell’s spiking behavior.Indeed, groups of neurons transition between “Up”(depolarized) and “Down” (hyperpolarized) states,which leads to cycles of higher and lower than normalfiring rates (for review, see Destexhe and Contreras2006). Though they are often referred to as discretestates, this is somewhat deceptive—neuronal popula-tions transition smoothly between epochs of high andlow responsivity. These state transitions occur in sleep-ing and anesthetized animals, as well as in cortical slices(Johnson and Buonomano 2007). Similar fluctuationsin responsivity have also been reported in awake animalsubjects (Leopold et al. 2003; Luczak et al. 2007) aswell as awake human patients (He et al. 2008; Nir et al.2008). Thus, a signal which reflects these states, and inturn helps account for some variability, would be animportant tool for decoding a neuron’s response.
The local field potential (LFP) is one such candidatesignal. It is thought to reflect the average synapticinput to a region near the electrode (Mitzdorf 1987;Buzsaki 2004), and is known to be correlated withthe subthreshold membrane potential fluctuations innearby neurons (Eggermont and Smith 1995; Petersen
et al. 2003). Furthermore, slow dynamics of spikingactivity can be inferred from the LFP (Rasch et al.2008), and the phase of the LFP is predictive of multi-unit activity (Haslinger et al. 2006). However, thereare a number of reasons why the LFP might not be asuitable signal for this purpose. Estimates of the spatialspread of LFP range from a few hundred microns toa few millimeters (Mitzdorf 1987; Kruse and Eckhorn1996; Kreiman et al. 2006; Liu and Newsome 2006;Berens et al. 2008; Katzner et al. 2009; Xing et al. 2009),and depend on laminae (Xing et al. 2009) and fre-quency (Frien et al. 2000; Henrie and Shapley 2005; Liuand Newsome 2006; Siegel and Koenig 2003). Further-more, the feature selectivity of the LFP is broader thanthat of spiking activity (Kreiman et al. 2006; Liu andNewsome 2006; Berens et al. 2008; Katzner et al. 2009).Though it is clear there is a relationship between LFP,neuronal states, and spiking activity, it is not knownto what extent these factors can be disentangled tobetter decode spike–stimulus relationships. We there-fore recorded spiking activity and LFP simultaneouslyfrom a population of cells with a multielectrode array,and we used the LFP to decompose neuronal firinginto stimulus-dependent and network-state dependentcomponents. We used a generalized linear model toexamine the correlation of network fluctuations withLFP and to correct the neural response to the stimulusfor the effects of LFP. Generalized linear models havebecome a standard framework for spike train analysis(Paninski et al. 2007, 2009; Pillow 2007; Pillow et al.2008). We found that the stimulus-dependent firing ratefunction reveals greater signal to noise in orientationtuning than the same measure computed via the usualmean firing rate function. An improvement in signalto noise was also present for stimulation with nat-ural movies, demonstrating the generality of the effect.These results show that each spike’s relationship to thestimulus can be estimated using merely the LFP fromthe same electrode—a new connection between theLFP, the ongoing network state, and spiking activity.
2 Recording methods
This experiment involved extracellular recording frommicroelectrode arrays implanted in V1 of three adultmale cynomolgus (Macaca fascicularis) macaque mon-keys. The techniques we use to record from the vi-sual cortex of anesthetized, paralyzed macaques havebeen described in detail elsewhere (Cavanaugh et al.2002; Smith and Kohn 2008). Briefly, we maintainedanesthesia throughout the experiment by a continu-ous intravenous infusion of sufentanil citrate (typically
J Comput Neurosci
6–18 μg/kg, adjusted as needed for each animal). Tominimize eye movements, the animal was paralyzedwith a continuous intravenous infusion of vecuroniumbromide (0.1 mg/kg/h). We monitor vital signs continu-ously (EEG, ECG, blood pressure, end-tidal PCO2 , tem-perature and lung pressure). The pupils were dilatedwith topical atropine and the corneas protected withgas-permeable hard contact lenses. We used supple-mentary lenses to bring the retinal image into focusby direct ophthalmoscopy, and then adjusted the re-fraction further to optimize the response of recordedunits. Experiments typically lasted 4–5 days. All exper-imental procedures complied with guidelines approvedby the Albert Einstein College of Medicine of YeshivaUniversity Animal Welfare Committee.
We recorded neural activity with the “Utah” Array(Blackrock Microsystems, Salt Lake City, Utah) usingtechniques reported previously (Kelly et al. 2007). Thisdevice is a 10 × 10 grid of silicon microelectrodes (1 mmin length) spaced 400 μm apart, covering 12.96 mm2.The details of the array insertion have been describedin detail elsewhere (Smith and Kohn 2008). Briefly, weinserted the array 0.6 mm into cortex using a pneu-matic insertion device (Rousche and Normann 1992),which led to recordings confined mostly to layers 2–3 ofparafoveal V1 (receptive fields within 5◦ of the fovea).Signals from each microelectrode were amplified andbandpass filtered (250 Hz to 7.5 kHz) to acquire spikingdata. Waveform segments that exceeded a threshold(set as a multiple of the rms noise on each channel)were digitized (30 kHz) and sorted off-line. We firstperformed a principal components analysis by wave-form shape (Shoham et al. 2003) and then refined theoutput by hand with custom time-amplitude windowdiscrimination software (written in MATLAB; Math-Works). This yielded 105–129 candidate neural unitsfrom the three array implants, with roughly one halfestimated to be well isolated single units similar inquality to those recorded with single microelectrodes(Kelly et al. 2007). LFPs were acquired from the sameelectrodes simultaneously by low pass filtering the rawsignal (0.3 to 250 Hz) and sampling at 1 kHz. The LFPsignal was then smoothed with a 100 ms boxcar filter forall subsequent analysis (50 and 200 ms filters producedthe same results).
All stimuli were generated with custom software ona Silicon Graphics Octane2 Workstation and displayedat a resolution of 1,024 × 768 pixels and frame rate of100 Hz on a CRT monitor (stimulus intensities werelinearized in luminance). Three kinds of stimuli werepresented: gratings, natural movies, and a blank screen.The full-contrast sinusoidal gratings (presented in twoof the three array implants) consisted of a pseudo-
randomly chosen sequence of directions of drift, eachlasting 300 ms and then proceeding to the next directionwith no blank frames between. We used a total of 98 di-rections, evenly spaced, resulting in a sequence lastingroughly 30 s. Because we never repeated the same di-rection in a block, this 30 s stimulus comprised a unique“movie” of gratings in which no frame was repeated.This movie, with the same pseudo-random order ofdrift direction, was repeated 120 times. The spatialfrequency (1.3 cpd) and temporal frequency (6.25 Hz)were chosen to fit the preference of parafoveal V1neurons (DeValois et al. 1982; Foster et al. 1985; Smithet al. 2002), while the position and size (8◦ diametercircular aperture) of the grating were sufficient tocover the receptive fields of all the neurons. The nat-ural movie stimulus (presented in one of the threeimplants) was a square 5◦ 30-s movie of a consumerfilm, repeated 120 times. The grating and movie stimuliwere surrounded by a gray field of average luminance.We also recorded spontaneous activity in each of thethree array implants (mean luminance approximately40 cd/m2), consisting of 30 min of responses measuredin the presence of a blank gray screen of averageluminance.
3 Correlated fluctuations in spiking and the localfield potential
We simultaneously recorded single- and multiple-unitneuronal activity (sorted offline) and LFPs from 100-electrode Utah arrays implanted in V1. We measuredresponses to sequences of sinusoidal gratings and nat-ural movies as well as spontaneous activity with a meangray screen. By pairing the spiking response on eachelectrode with the LFPs recorded from each of 96 activeelectrodes, we were able to measure and model thedependence of spike trains on the LFP.
In the absence of a visual stimulus, neurons in V1respond at a baseline rate which varies from nearlyno activity to tens of spikes per second. This rate isof course not constant—neuronal activity changes in aseemingly random pattern over time. However, someof that apparent randomness can be explained whenthe simultaneous responses of other neurons are ob-served. In Fig. 1(a), the responses from 129 single andmulti-unit recordings from a single array are shown ina raster plot for a 15 s period. If the neurons wereresponding randomly and independently, there wouldbe no structure apparent in this plot. However, thereare a number of prominent vertical bands present (forinstance, one at roughly 8 s). These bands are producedby the temporally coordinated responses of a large

J Comput Neurosci
Fig. 1 The activity of aneuronal population recordedwith the array. In the upperplot, each row depicts thefiring of one cell duringspontaneous activity (theroom is dark). Most cells inthe population exhibitcorrelated activity on a slowtime scale. The local fieldpotential, shown below,typically contains peaksduring the epochs of highcorrelated firing. The localfield potential is averagedacross all electrodes in thisfigure, and the y-axis isflipped for illustrativepurposes
0
20
40
60
80
100
120
Cel
l num
ber
Spontaneous activity
2 4 6 8 10 12 14
100
0
100
Time (s)
Vol
tage
(m
V)
(a)
(b)
portion of the neurons in the population. This kind ofcorrelation in spiking has been reported previously inspontaneous and evoked activity in both anesthetizedand awake animals (Zohary et al. 1994; Shadlen andNewsome 1998; Bair et al. 2001; Kohn and Smith 2005;Smith and Kohn 2008; Huang and Lisberger 2009).
Patterns of network activity such as these, or net-work “states”, are well characterized in a number ofsystems and recording preparations (for review, seeKohn et al. 2009). One means of measuring the stateof a system is through the field potentials, which arethought to represent the sum of all synaptic inputs to aregion of cortex (Legatt et al. 1980; Gray et al. 1995).We compared the LFP (Fig. 1(b) recorded simulta-neously) with the spontaneous spiking activity in apopulation of neurons. We found that the states whichcontained a large number of spikes (“Up”, or depo-larized states) tended to correspond to large negativefluctuations in the LFP. Similarly, the absence of spikes(“Down”, or depolarized states) correspond to positivetrends in the LFP.
Although Fig. 1 only displayed correlated fluctua-tions in spontaneous activity, they were also presentduring the presentation of a visual stimulus. Figure 2shows two sets of 5 raster plots, each created in thesame way as Fig. 1(a), for five repeated presentations
of a sequence of gratings (Fig. 2(a)) or a natural movie(Fig. 2(b)). In panel (a), the sequence of gratings isidentical in trials 1–5. Thus, the presence of a period ofhigh activity on one of the trials that does not occur atthe same time on all of the trials represents an “Up”state. Because the neurons prefer different orienta-tions, there is no period in the grating sequence duringwhich all of the neurons tended to fire in response tothe visual stimulus. For this reason, the “Up” stateswere easy to identify. For the five identical naturalmovie repeats (Fig. 2(b)), stimulus-dependent and in-dependent correlated activity were more difficult toseparate. Although correlated “Up” states are present,there were also periods of high activity in the entirepopulation corresponding to stimulus events, presum-ably abrupt scene transitions, that altered the responseof a large group of the recorded neurons. This minglingof stimulus-driven and state-driven activity makes itdifficult to decode the signals sent by the spikes froma single neuron. However, with information about thepopulation activity, it is possible to separate these twofactors. Such a separation is certain to be imperfect—itis difficult or impossible to assess the “true” meaning ofan individual spike. Nonetheless, we use a quantitativemeasurement (orientation tuning, Section 6) which al-lows us to infer that the signal due to the stimulus has

J Comput Neurosci
Fig. 2 Network fluctuationsdiffer across repeatedidentical visual stimulation.(a) The stimulus is a movie ofdrifting gratings of differentorientations, 300 ms perorientation. For each trial, thestimulus is identical. Stimulusindependent correlatedactivity occurs differently oneach trial. (b) The stimulus is10 s of a single natural movie,for a different populationthan the one shown in (a).Stimulus independentcorrelated activity is apparentand also somestimulus-dependent activity isvisible. For example, at 9 sinto the stimulus a feature ofthe movie that drives most ofthe population elevatesactivity on every trial
2 4 6 8 10
1
2
3
4
5
Time (s)
Tria
l
Gratings
2 4 6 8 10
1
2
3
4
5
Time (s)
Tria
l
Natural movie(b)(a)
been increased relative to the network “noise”, utilizingthe assumption that the stimulus and network com-ponents are independent components which togethercomprise the neural response.
4 A generalized linear model for the effectsof network state
Each spike train is a sequence of spike times and thenatural statistical framework for spike train analysisis that of point processes, which may take a rathergeneral form (Paninski et al. 2009). It is simplest toassume the spike trains follow inhomogeneous Poissonprocesses, and for our analyses it is unlikely that morecomplicated models would change our conclusions. Weused time bins of duration 1 ms, ensuring that each binhas at most one spike. A spike train may thereby beconsidered a binary sequence Y = Y1 . . . YT , each valueYt indicating whether or not the cell fired at time t.According to the Poisson assumption the probability ofobserving yt spikes at time t is given by
P(Yt = yt
) = (rt�)yt exp(−rt�) (1)
where rt is a rate parameter for the process at time tand � = 1 ms. The likelihood of observing the entire
spike train Y = y1 . . . yT is the product of the likeli-hoods for each time bin, where these observations areindependent:
P(Y = y1 . . . yT) =∏
t
(rt�)yt exp(−rt�) (2)
In our context, the rate parameter r is an unobserv-able property of the neuron, and we proceed by fitting rso that this likelihood value is maximized. Equivalently,and for computational convenience, we can maximizethe log-likelihood
L =T∑
t
(yt log rt − rt
)(3)
We make the assumption that the relationship be-tween the rate r and the observables for any givencell is a linear relationship, followed by a nonlinearity,the exponential function. Paninski (2004) gives therationale for using this kind of model as a trade-offbetween neural system faithfulness and computationaltractability. The observed components are a networkstate component and a stimulus component.
log r(i)t = s(i)
t + β(i)x(i)t (4)

J Comput Neurosci
where r(i)t is the expected number of spikes at time t
from cell i, s(i)t is the stimulus-dependent component of
cell i’s firing rate, x(i)t is an independent variable corre-
sponding to the LFP value (taken to be an indicationof the local network activity) at time t, and β(i) is aconstant which controls the extent to which the networkstate affects the firing of cell i.
Thus, the values s(i)t and β(i) which maximize the log-
likelihood function
L(i) =T∑
t
[y(i)
t
(s(i)
t + β(i)x(i)t
)
− exp(
s(i)t + β(i)x(i)
t
)− log y(i)
t !]
(5)
make up the best model of r(i)t given the data. This is a
convex function of β(i) and s(i), and we can easily fit itwith iteratively reweighted least squares (IRLS), whichis equivalent to the Newton–Raphson method (Hardinand Hilbe 2007) in this context.
We further made the assumption that β(i) is notdependent on the stimulus. Since s(i)
t was just a constantc(i) when the stimulus is constant (a mean gray screen),
we fit β(i) with spontaneous activity data, which is thesimpler formula
L(i) =T∑
t
[y(i)
t
(c(i) + β(i)x(i)
t
)
− exp(
c(i) + β(i)x(i)t
)− log y(i)
t !]
(6)
involving finding the values of only two parameters, c(i)
and β(i) for each cell i. Larger |β(i)| indicates a greaterdependence of firing on the value of the LFP.
In Fig. 3(a), the model fits are shown schematicallyfor two example neurons. On the left, spikes are shownalong with the corresponding LFP from the same elec-trode. The predicted firing rate function after the fittingprocedure is shown on the right along with the actualspike train. The value of β varied across neurons in thepopulation—some cells tended to be more influencedby network state than others. To give context for thevalues of β, a value β = −0.017 means that an LFPchange of −100 mV predicts a 5.5 fold increase infiring rate. A value β = 0.014 predicts for the sameLFP change, a 4 fold increase in firing rate. The rasterplot in Fig. 3(b), sorted by β, demonstrates this trend.
Fig. 3 Description of themodel. (a) For each cell, β(i)
is fit using the generalizedlinear model and spontaneousspiking data, withsimultaneous LFP data. (b)Cells with low |β(i)| are at thetop and generally are notdriven by the large correlatedevents. Cells with high |β(i)|are at the bottom and arehighly susceptible to thenetwork state
Cell 1, Spikes and LFP
Cell 2, Spikes and LFP
Fit (1) = 0.017
Fit (2) = 0.014
Predicted firing rate of cell 1
Predicted firing rate of cell 2
......
(a)
(b)
0 5 10 150.053
0.014
0.000
Time (s)
Population raster, sorted by
J Comput Neurosci
Neurons in the upper rows of this plot tended to notbe very influenced by network state, and thus had lowβ values. They also tended to have higher tonic firingrates (r = 0.48, p <0.0001). Neurons in the lower rowsof the plot had a strong tendency to fire during negativeinflections of the LFP, and thus had highly negative β
values. In the extreme, those neurons tended to fireonly during “Up” states.
5 Spatial distribution of state dependence
Correlation is known to decrease as the distance be-tween recorded neurons grows (Smith and Kohn 2008).While LFPs reflect signal from a larger region of tissue,they also tend to cohere more for nearby electrodesthan distant ones (Leopold et al. 2003). If the network-driven activity we describe here is one source of cor-
relation between spiking neurons, it is likely to alsoshow a distance dependence. In Fig. 3, β was computedusing the LFP recorded from the same electrode as thespiking activity. We tested the spatial dependence ofspiking on the LFP by using LFPs recorded from eachelectrode in the array to compute β.
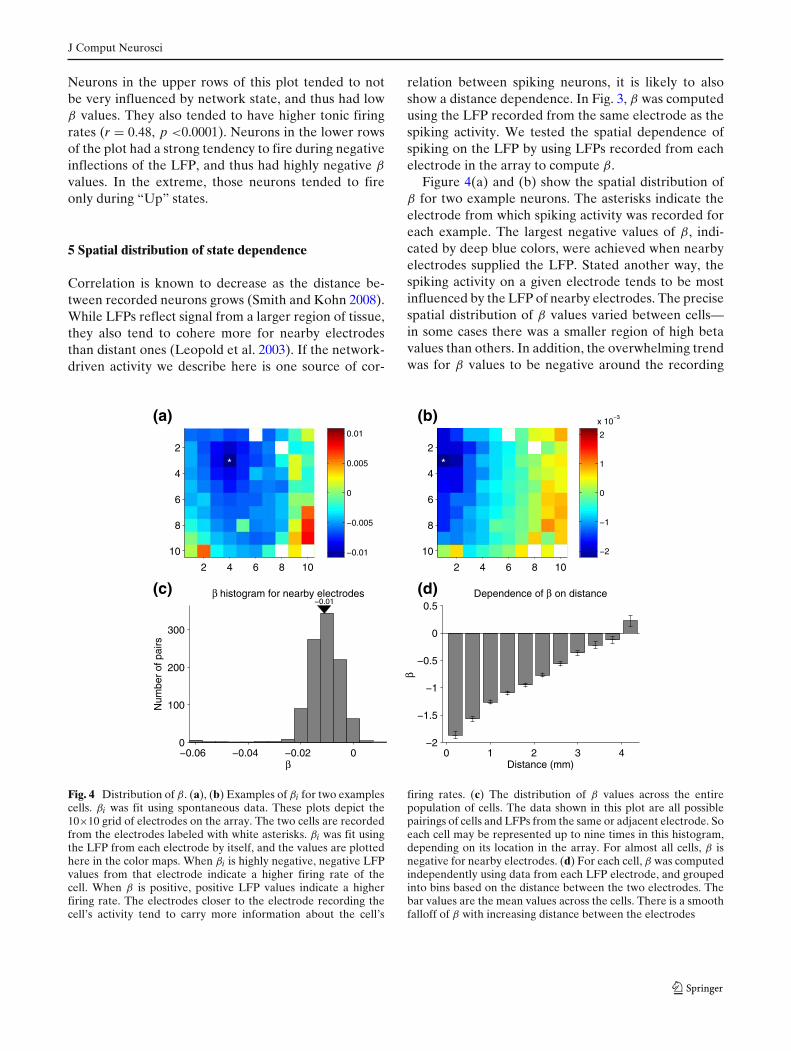
Figure 4(a) and (b) show the spatial distribution ofβ for two example neurons. The asterisks indicate theelectrode from which spiking activity was recorded foreach example. The largest negative values of β, indi-cated by deep blue colors, were achieved when nearbyelectrodes supplied the LFP. Stated another way, thespiking activity on a given electrode tends to be mostinfluenced by the LFP of nearby electrodes. The precisespatial distribution of β values varied between cells—in some cases there was a smaller region of high betavalues than others. In addition, the overwhelming trendwas for β values to be negative around the recording
*
2 4 6 8 10
2
4
6
8
10 0.01
0.005
0
0.005
0.01
*
2 4 6 8 10
2
4
6
8
10 2
1
0
1
2
x 103
0.06 0.04 0.02 00
100
200
300
0.01
Num
ber
of p
airs
histogram for nearby electrodes
0 1 2 3 42
1.5
1
0.5
0
0.5
Distance (mm)
Dependence of on distance(c) (d)
(a) (b)
Fig. 4 Distribution of β. (a), (b) Examples of βi for two examplescells. βi was fit using spontaneous data. These plots depict the10×10 grid of electrodes on the array. The two cells are recordedfrom the electrodes labeled with white asterisks. βi was fit usingthe LFP from each electrode by itself, and the values are plottedhere in the color maps. When βi is highly negative, negative LFPvalues from that electrode indicate a higher firing rate of thecell. When β is positive, positive LFP values indicate a higherfiring rate. The electrodes closer to the electrode recording thecell’s activity tend to carry more information about the cell’s
firing rates. (c) The distribution of β values across the entirepopulation of cells. The data shown in this plot are all possiblepairings of cells and LFPs from the same or adjacent electrode. Soeach cell may be represented up to nine times in this histogram,depending on its location in the array. For almost all cells, β isnegative for nearby electrodes. (d) For each cell, β was computedindependently using data from each LFP electrode, and groupedinto bins based on the distance between the two electrodes. Thebar values are the mean values across the cells. There is a smoothfalloff of β with increasing distance between the electrodes

J Comput Neurosci
electrode (Fig. 4(c)). This reflects the fact that spikingactivity tended to occur when the LFP voltages werenegative (as seen in the figures above).
To summarize its spatial dependence, we computedthe average β for all pairs of spiking electrode and LFPelectrode across the entire array. The results of thisanalysis are shown in Fig. 4(d), which plots average β asa function of the distance between the spiking and LFPelectrodes. The largest negative values of β were forthe same electrode. β was reduced in magnitude withincreasing distance throughout the range in which wecould make reliable measurements (4 mm).
6 Improvement in orientation selectivity afteraccounting for state dependence
The observed spiking activity of a neuron in responseto a stimulus such as a grating, as we demonstratedabove in Fig. 2(a), includes effects of both the stimulusand the network state. Our model factor βxt is anattempt to assess the influence of the network state oneach neuron. Once we determined the value of β(i) foreach neuron i during spontaneous activity, we assumedthat the relationship between spiking and the networkstate (LFP value x(i)
t ) remained the same during visualstimulation. We thus fit s(i)
t using the LFP and spikingdata from repeated trials of drifting grating recordings,now holding β(i) fixed. The expression is
log r(i)t,n = s(i)
t + β(i)x(i)t,n (7)
where rt,n and xt,n are with respect to time and the trialnumber n, while the stimulus-dependent components(i) only varies with time, since it is the same on eachtrial.
One caveat is that during visual stimulation acrosstrials of the same stimulus, the LFP has a significantcomponent of activity which is related to the stimulus.We therefore subtracted the mean LFP across repeatedtrials from each trial’s data before computing the fixedoffset term β(i)x(i)
t .
x̄(i)t = 1
N
N∑
n
x(i)t,n (8)
log r(i)t,n = s(i)
t + β(i)[x(i)
t,n − x̄(i)t
](9)
Figure 5(a) shows some trial data for an example cell.We solved for s(i)
t , and exp(s(i)t ) is the firing rate
function with the LFP effect taken into account, in
spikes/ms. Figure 5(b) shows the raw peri-stimulus timehistogram (PSTH), or r(i)
t in our model, and the LFP-adjusted firing rate function (aPSTH). The aPSTH canbe thought of as the stimulus-dependent componentof firing, since the component of firing that can beattributed to the LFP, or network effect, has beenremoved. For points in time which happened to havemore network state influence, the aPSTH estimate wasvery different than the PSTH value, and converselysome time points had a small amount of influence.Even with a large number of trials (N = 120), networkfluctuations were not evenly distributed in time, a factthat can bias any computed estimate of orientationtuning. Figure 5(c) shows the orientation tuning forthis cell, computed both from the PSTH and fromthe aPSTH. The aPSTH estimate of orientation tuninghas a more pronounced difference between preferredand non-preferred orientations, possibly reflecting theremoval of action potential contributions that are un-related to the stimulus. The orientation tuning curvesare normalized by their mean firing rate for illustrativepurposes.
We characterized the variability of the raw and LFP-adjusted firing by computing Fano factors for each.Specifically, for each neuron we computed the Fanofactor (ratio of variance to mean) for each orienta-tion with respect to the spike counts obtained fromeach repetition of that orientation. Because we foundno dependence of the Fano factor on orientation, weaveraged across these conditions to produce a singleFano factor for each cell. We then similarly computedthe Fano factor among the LFP-adjusted firing rates.Examining the Fano factors across neurons in the twopopulations shows a substantial and highly significantreduction in variability (p < 10−6, paired t-test) in theLFP-adjusted data. Figure 5(d) and (e) are histogramsof the differences between the two variability measuresfor the two neural populations. For both populations,the LFP-adjusted component tended to have a smallerFano factor, or more reliability, than the raw spiketrain. This reduction was not specific to responsesevoked with grating stimuli. We performed the sameanalysis on the natural movie data shown in Fig. 2and determined there is also a significant reduction inFano factor for spikes evoked by this stimulus (mean =−0.32, p < 10−6, paired t-test).
Figure 6(a) and (b) show the orientation tuningcurves measured from two other neurons. In both ofthese examples, again it is apparent that the orientationselectivity improved after we accounted for networkstate—the peaks are higher and the troughs are lower.Note that the values on the y axis are relative to themean firing rate across all conditions, where a value of

J Comput Neurosci
0 0.3 0.6 0.9 1.2 1.5 1.8 2.1 2.4 2.7 30
50
100
Time (s)
Spi
kes/
s
Firing rate functions
PSTHaPSTH
Orientation
Nor
mal
ized
Res
pons
e
Orientation tuning
PSTHaPSTH
4 2 0 2 40
20
40
60
80
0.37
Population 1
Fano factor change
Num
ber
of c
ells
4 2 0 2 40
20
40
60
0.72
Population 2
Fano factor change
Num
ber
of c
ells
Trial 1
Trial 3
Trial 2
Trial 4
Spikes [ri(t)] and LFP [x
i(t)] during drifting gratings (cell i)
using estimate i = 0.014221, find the
component of firing due the stimulus, esi(t)
esi(t) = r
i(t)/
i x
i(t)
PSTH: ri(t)
Adjusted PSTH (aPSTH): esi(t)
(a)
(b) (c)
(d) (e)
Fig. 5 Using the model to find orientation tuning with the net-work state removed. (a) Data recorded during four trials of asingle grating movie. The stimulus consisted of drifting gratingsof different orientations, ordered randomly. Each orientation waspresented for 300 ms. Shown in the plots are the spike trains foreach trial and the LFP from the same electrode. The data is usedto compute exp(si(t)), the component of firing due to the stimulus.It is essentially a LFP-weighted version of the PSTH. (b) Thefiring rate function was calculated by fitting the model for thecomponent of firing due to the stimulus, given a fixed βi, which
were calculated from the spontaneous data as in Fig. 3. Therewere 120 trials in total. (c) The orientation tuning was calculatedby averaging the firing rate function over bins corresponding tothe 300 ms grating orientation stimuli epochs. (d), (e) In the twocell populations for which the grating stimulus was shown, theFano factors were calculated for the raw spike train and alsothe model adjusted spike train. Most cells show a Fano factordecrease after the network state is accounted for, indicating areduction in variability
1 is exactly the mean firing rate and a value of v is v
times the mean firing rate. We evaluated this selectivitychange quantitatively using vector averaging:
Selectivity = | ∑ j ρ j exp(2iθ j)|∑
j ρ j(10)
θ j is a specific orientation presented, and ρ j is the firingrate corresponding to that orientation. i = √−1. Selec-tivity is 1 when the neural firing is concentrated at one
or opposite orientations (e.g. 90◦ and 270◦). We foundan average improvement of 0.04 (Fig. 6(c)), whichwas statistically significant (p < 10−6, paired t-test).This improvement in selectivity was strongest whenwe used the LFP from the same or nearby electrodes(Fig. 6(d)).
We have used the LFP as a signal to reflect networkstate and account for neuronal variability, and throughour model aid in decoding neuronal responses. It is alsothe case that the spikes themselves could serve as sucha signal. Because the LFP has significant differences

J Comput Neurosci
Fig. 6 Increased orientationselectivity. (a), (b) Examplesfor two cells of orientationtuning, computed from theraw firing rate and from theestimate ci (the firing due tothe stimulus). The estimate ciis computed here using theLFP from the same electrodethat recorded the cell’sactivity. (c) Improvement intwo array populations. Formost cells in the populations,selectivity was improvedwhen accounting for theongoing network activity withthe LFP factor. The LFP wasfrom the same electrode thatrecorded the cell’s activity.(d) Falloff of improvementwith distance in the same twopopulations. Improvementwas calculated using the LFPfrom each electrode, and thishistogram shows the averageimprovement for electrodesat given distances
0 90 180 2700
1
2
3
4
Orientation (degrees)N
orm
aliz
ed a
ctiv
ity
PSTHaPSTH
0 90 180 2700
1
2
3
4
Orientation (degrees)
Nor
mal
ized
act
ivity
PSTHaPSTH
0.2 0.1 0 0.1 0.20
20
40
60
0.04
Num
ber
of c
ells
0.2 0.1 0 0.1 0.20
20
40
60
0.03
Selectivity improvement
Num
ber
of c
ells
0 1 2 3 4 50
0.02
0.04
0.06
Sel
ectiv
ity im
prov
emen
t
0 1 2 3 4 50
0.01
0.02
0.03
0.04
Distance (mm)
Sel
ectiv
ity im
prov
emen
t
(a) (b)
(c) (d)
from spiking activity in terms of spatial extent andtuning selectivity, it was not known whether it wouldproduce better results in our model. We therefore madea direct comparison between the orientation selectivityimprovement using the LFP and spike trains in theGLM. We treated each spike train as a time series, andperformed smoothing in exactly the same manner as forthe LFP time series data. The rest of the analysis wasidentical, with the smoothed spike train used insteadof the LFP as the measure of network state (xt). Inorder to be sure that the distances were equal and thatsorting errors did not contribute to the shared variabil-ity, we used the spike trains from only the neighboringelectrodes. We found that at this distance (equivalentto the second bin in Fig. 6(d)), the average improve-ment in selectivity when using spike trains was halfthe magnitude), significantly lower than what we ob-served using the LFP (0.013 vs. 0.026, p < 10−4, pairedt-test).
7 Discussion
We recorded spiking activity and the LFP simultane-ously from a group of neurons with a microelectrodearray implanted in primary visual cortex. We foundthat large negative fluctuations in the LFP tended tocoincide with times of heightened spiking activity, or“Up” states, in neuronal firing. By using the value of theLFP as the indicator of network state, we attempted toseparate neuronal responses into stimulus-dependentand state-dependent components. After adjustment forLFP effects the variability of individual neuronal re-sponses was reduced, leading to increased SNR in ori-entation tuning. This finding demonstrates the value ofadjusting firing rates for LFP effects, which are likelydue to ongoing network activity rather than a visualstimulus.
Slow, correlated fluctuations in the firing rate ofneurons were present in both spontaneous and evoked

J Comput Neurosci
activity. This type of correlated variability, often mea-sured by the Pearson’s correlation between the spikecounts of pairs of neurons over many repeats of thesame stimulus (rsc), has been previously reported in anumber of experiments in both awake and anesthetizedanimals (Zohary et al. 1994; Shadlen and Newsome1998; Bair et al. 2001; Kohn and Smith 2005; Smith andKohn 2008; Huang and Lisberger 2009). Nonetheless,the visual effect of such correlation on the pattern ofspikes in a large neuronal population is quite striking(Fig 1(a)) and has been rarely visualized before.
The epochs of correlated activity, lasting typically200 to 800 ms, were highly correlated with large nega-tive peaks in the LFP (Fig 1(b)). This pattern is similarto “Up” and “Down” states, which occur with roughlythe same frequency (0.3–1 Hz) and have been reportedin a number of different species, cortical areas, andexperimental conditions (for review, see Destexhe andContreras 2006). While it is not clear that a commonmechanism underlies all of these fluctuations in corticalresponsivity, it is known that global network states areintimately related to anatomical connectivity, such asamong orientation columns (Areili et al. 1996; Tsodykset al. 1999). However, while spontaneous activity mightreveal the underlying cortical network in which theneurons are embedded, it poses a problem for charac-terizing cell tuning properties, and for decoding stim-ulus information based on the spiking activity of theneurons.
The activity of neurons is affected by both the dy-namical changes in these cortical states and the tuning-based response to input stimuli. Here, we proposed asimple generalized linear model technique as a firstattempt to estimate the contribution of the global cor-tical state during responses to a visual stimulus. Theresulting weighting of the spikes allows a more efficientestimate of the response properties of the neurons, andit demonstrates the relative shortage of stimulus infor-mation in the spikes which occur during “Up” states.We used the LFP as an indicator of the network state,a signal which can be obtained simultaneously withspiking activity from the same electrode. We found thatvariability decreased after accounting for the LFP inboth stimulus conditions, gratings and natural movies,demonstrating that this result generalizes. In addition,the LFP is a better indicator of the network state thanthe spike trains of other neurons, and produces largerdecreases in variability using our model. Fluctuations infield potentials have long been known to be related tospiking activity (Eggermont and Smith 1995; Petersenet al. 2003; Rasch et al. 2008). However, the full re-lationship between the LFP and spiking activity hasbeen the subject of much recent interest and some con-
troversy (Liu and Newsome 2006; Berens et al. 2008;Katzner et al. 2009; Xing et al. 2009), and it was not cer-tain that a simple model such as the one presented herecould successfully improve the reliability of a stimulusdependent activity measure.
The model makes a number of simplifying assump-tions about the relationship between spiking behaviorand the LFP, and is limited in its ability to model precisespike timing due to its having only a single parameter β
derived from spontaneous activity. It is also likely thatthis parameter β is somewhat different during stimula-tion, and fitting β with data acquired during visual stim-ulation would improve the model. Moreover, it doesnot allow for modeling the way a visual stimulus couldbe interacting with the network state—the componentsof the model are independent. It is known that neuronalresponse properties, such as receptive field structure(Ringach et al. 2002; David et al. 2004; Körding et al.2004), can change depending on the visual stimulus withwhich they are measured. In our case, we can’t be surethat the state-dependence measured from spontaneousactivity is the best predictor of state-dependence togratings, or to other visual stimuli.
Nevertheless, this simple model shows that the LFPcan indicate the state of the network, and it takes a sig-nificant step toward a true factorization of a spike traininto stimulus-dependent and independent components.Our results demonstrate that it is possible to harnessthe information in the LFP to explicitly decouple thesecomponents to a significant extent. The model may beenhanced by incorporating additional effects, includingsupplementary indicators of the network state suchas the full grid of LFP electrode responses, variablesidentifying high-frequency components of LFP, historyeffects, effects of other cells, or nonlinear interactions.All such effects could be incorporated as in other appli-cations of generalized linear models (Kass and Ventura2001; Pillow 2007; Pillow and Latham 2008; Pillow et al.2008; Paninski et al. 2009).
In this paper, we have laid out a procedure that isgenerally applicable to neural data which is subject tonetwork state effects on action potential generation.While it was necessary for us to record many neuronsand field potentials simultaneously in order to directlyobserve the population activity fluctuations, our basicfinding is a general one that is relevant to single unitrecording data. It can be implemented with spikes andLFP from even a single electrode, and does not requirea large array. Despite the simplicity of the model,we have shown that using this procedure essentiallyboosts the signal to noise ratio of the orientation tuningprovided by individual neurons. Thus, our findings area powerful demonstration of the way in which field
J Comput Neurosci
potential measurements relate to spiking activity. Thiskind of modeling can be used to compute a stimulus-dependent firing rate estimate in preparation for othercomputations as well, from receptive field estimation tolatency calculations. It is especially appropriate for datawith a limited number of trials, which is subject to largetrial by trial variations in the effect of the network state.Providing a better model of these spontaneous statesand their transitions, as well as further elucidating theirorigin and the connection with the underlying network,is an important goal of future experimental and theo-retical research.
Acknowledgements This work was supported by a NationalScience Foundation (NSF) Integrative Graduate Educationand Research Traineeship to RCK (DGE-0549352), NationalEye Institute (NEI) grants EY015958 and EY018894 to MAS,National Institute of Mental Health (NIMH) Grant MH64445and NSF CISE IIS 0713206 to TSL, and NIMH grant MH064537to REK. Data was collected by RCK, MAS and Adam Kohnin his laboratory as a part of a collaborative effort between theKohn laboratory at Albert Einstein College of Medicine andthe Lee laboratory at Carnegie Mellon University. We thankAdam Kohn for collaboration, and we are also grateful to AminZandvakili, Xiaoxuan Jia and Stephanie Wissig for assistance indata collection.
References
Abbott, L. F., & Dayan, P. (1999). The effect of correlated vari-ability on the accuracy of a population code. Neural Compu-tation, 11, 91–101.
Areili, A., Sterkin, A., Grinvald, A., & Aertson, A. (1996).Dynamics of ongoing activity: Explanation of the largevariability in evoked cortical responses. Science, 273(5283),1868–1871.
Averbeck, B. B., Latham, P. E., & Pouget, A. P. (2006). Neuralcorrelations, population coding and computation. NatureReviews. Neuroscience, 7, 358–366.
Bair, W., Zohary, E., & Newsome, W. T. (2001). Correlated firingin macaque visual area MT: Time scales and relationship tobehavior. Journal of Neuroscience, 21, 1676–1697.
Berens, P., Keliris, G., Ecker, A., Logothetis, N., & Tolias, A.(2008). Feature selectivity of the gamma-band of the localfield potential in primate primary visual cortex. Frontiers inNeuroscience, 2, 199–207.
Buzsaki, G. (2004). Large-scale recording of neuronal ensembles.Nature Neuroscience, 7, 446–451.
Cavanaugh, J. R., Bair, W., & Movshon, J. A. (2002). Nature andinteraction of signals from the receptive field center and sur-round in macaque V1 neurons. Journal of Neurophysiology,88, 2530–2546.
David, S., Vinje, W., & Gallant, J. (2004). Natural stimulus statis-tics alter the receptive field structure of V1 neurons. Journalof Neuroscience, 24, 6991–7006.
Destexhe, A., & Contreras, D. (2006). Neuronal computationswith stochastic network states. Science, 314, 85–90.
DeValois, R. L., Albrecht, D. G., & Thorell, L. G. (1982). Spatialfrequency selectivity of cells in macaque visual cortex. VisionResearch, 22, 545–559.
Eggermont, J., & Smith, G. (1995). Synchrony between single-unit activity and local field potentials in relation toperiodicity coding in primary auditory cortex. Journal ofNeurophysiology, 73, 227–245.
Foster, K. H., Gaska, J. P., Nagler, M., & Pollen, D. A. (1985).Spatial and temporal frequency selectivity of neurones invisual cortical areas V1 and V2 of the Macaque monkey.Journal of Physiology, 365, 331–363.
Frien, A., Eckhorn, R., Bauer, R., Woelbern, T., & Gabriel, A.(2000). Fast oscillations display sharper orientation tuningthan slower components of the same recordings in striatecortex of the awake monkey. European Journal of Neuro-science, 12, 1453–1465.
Gray, C. M., Maldonado, P. E., Wilson, M., & McNaughton, B.(1995). Tetrodes markedly improve the reliability and yieldof multiple single-unit isolation from multi-unit recordingsin cat striate cortex. Journal of Neuroscience Methods, 63,43–54.
Hardin, J. W., & Hilbe, J. (2007). Generalized linear models andextensions. College Station: Stata.
Haslinger, R., Ulbert, I., Moore, C., Brown, E., & Devor, A.(2006). Analysis of LFP phase predicts sensort responseof barrel cortex. Journal of Neurophysiology, 96, 1658–1663.
He, B., Snyder, A., Zempel, J., Smyth, M., & Raichle, M. (2008).Electrophysiological correlates of the brains intrinsic large-scale functional architecture. Proceedings of the NationalAcademy of Sciences of the United States of America, 105,16039–16044.
Henrie, J., & Shapley, R. (2005). LFP power spectra in V1 cortex:The graded effect of stimulus contrast. Journal of Neuro-physiology, 94, 479–490.
Huang, X., & Lisberger, S. (2009). Noise correlations in corticalarea MT and their potential impact on trial-by-trial variationin the direction and speed of smooth pursuit eye movements.Journal of Neurophysiology, 101, 3012–3030.
Johnson, H., & Buonomano, D. (2007). Development and plas-ticity of spontaneous activity and up states in corticalorganotypic slices. Journal of Neuroscience, 27(22), 5915–5925.
Kass, R., & Ventura, V. (2001). A spike-train probability model.Neural Computation, 13, 1713–1720.
Katzner, S., Nauhaus, I., Benucci, A., Bonin, V., Ringach, D., &Carandini, M. (2009). Local origin of field potentials in visualcortex. Neuron, 61, 35–41.
Kelly, R. C., Smith, M. A., Samonds, J. M., Kohn, A., Bonds,A. B., Movshon, J. A., et al. (2007). Comparison of record-ings from microelectrode arrays and single electrodes in thevisual cortex. Journal of Neuroscience, 27, 261–264.
Kohn, A., & Smith, M. A. (2005). Stimulus dependence of neu-ronal correlation in primary visual cortex of the Macaque.Journal of Neuroscience, 25, 3661–3673.
Kohn, A., Zandvakili, A., & Smith, M. A. (2009). Correlationsand brain states: From electrophysiology to functional imag-ing. Current Opinion in Neurobiology, 19, 434–438.
Körding, K., Kayser, C., Einhäuser, W., & König, P. (2004). Howare complex cell properties adapted to the statistics of nat-ural stimuli? Journal of Neurophysiology, 91, 206–212.
Kreiman, G., Hung, C., Kraskov, A., Quiroga, R., Poggio, T., &DiCarlo, J. (2006). Object selectivity of local field potentialsand spikes in the Macaque inferior temporal cortex. Neuron,49, 433–445.
Kruse, W., & Eckhorn, R. (1996). Inhibition of sustained gammaoscillations (35–80 Hz) by fast transient responses in catvisual cortex. Proceedings of the National Academy of Sci-ences, 93, 6112–6117.

J Comput Neurosci
Lampl, I., Reichova, I., & Ferster, D. (1999). Synchronousmembrane potential fluctuations in neurons of the cat visualcortex. Neuron, 22, 361–374.
Legatt, A. D., Arezzo, J., & Vaughan, H. G. (1980). Averagedmultiple unit activity as an estimate of phasic changes in localneuronal activity: Effects of volume-conducted potentials.Journal of Neuroscience Methods, 2, 203–217.
Leopold, D. A., Murayama, Y., & Logothetis, N. K. (2003). Veryslow activity fluctuations in monkey visual cortex: Impli-cations for functional brain imaging. Cerebral Cortex, 13,422–433.
Liu, J., & Newsome, W. (2006). Local field potential in corti-cal area MT: Stimulus tuning and behavioral correlations.Journal of Neuroscience, 26, 7779–7790.
Luczak, A., Bartho, P., Marguet, S., Buzsaki, G., & Harris, K.(2007). Sequential structure of neocortical spontaneousactivity in vivo. Proceedings of the National Academy ofSciences of the United States of America, 104, 347–352.
Mitzdorf, U. (1987). Properties of the evoked potential gen-erators: Current source-density analysis of visually evokedpotentials in the cat cortex. International Journal of Neuro-science, 33, 33–59.
Nauhaus, I., Busse, L., Carandini, M., & D.L., R. (2009). Stimuluscontrast modulates functional connectivity in visual cortex.Nature Neuroscience, 12, 70–76.
Nir, Y., Mukamel, R., Dinstein, I., Privman, E., Harel, M., Fisch,L., et al. (2008). Interhemispheric correlations of slow spon-taneous neuronal fluctuations revealed in human sensorycortex. Nature Neuroscience, 11(9), 1100–1108.
Paninski, L. (2004). Maximum likelihood estimation of cascadepoint-process encoding models. Network: Computation inNeural Systems, 15, 243–262.
Paninski, L., Brown, E., Iyengar, S., & Kass, R. (2009). Statisti-cal models of spike trains. In C. Liang, & G. Lord (Eds.),Stochastic methods in neuroscience (pp. 278–303). Oxford:Clarendon.
Paninski, L., Pillow, J., & Lewi, J. (2007). Statistical modelsfor neural encoding, decoding, and optimal stimulus design.Progress in Brain Research, 165, 493.
Petersen, C., Grinvald, A., & Sakmann, B. (2003). Spatiotempo-ral dynamics of sensory responses in layer 2/3 of rat barrelcortex measured in vivo by voltage-sensitive dye imagingcombined with whole-cell recordings and neuron reconstruc-tions. Journal of Neuroscience, 23, 1298–1309.
Pillow, J. (2007). Likelihood-based approaches to modeling theneural code. In K. Doya, S. Ishii, A. Pouget, & R. Rao,(Eds.), Bayesian brain: Probabilistic approaches to neuralcoding (pp. 53–70). Cambridge: MIT.
Pillow, J., & Latham, P. (2008). Neural characterization in par-tially observed populations of spiking neurons. Advances inNeural Information Processing Systems, 20, 1161–1168.
Pillow, J., Shlens, J., Paninski, L., Sher, A., Litke, A.,Chichilnisky, E., et al. (2008). Spatio-temporal correlationsand visual signalling in a complete neuronal population.Nature, 454, 995–999.
Rasch, M., Gretton, A., Murayama, Y., Maass, W., & Logothetis,N. (2008). Inferring spike trains from local field potentials.Journal of Neurophysiology, 99, 1461–1476.
Ringach, D., Hawken, M., & Shapley, R. (2002). Receptive fieldstructure of neurons in monkey primary visual cortex re-vealed by stimulation with natural image sequences. Journalof Visualization, 2, 12–24.
Rousche, P. J., & Normann, R. A. (1992). A method forpneumatically inserting an array of penetrating electrodesinto cortical tissue. Annals of Biomedical Engineering, 20,413–422.
Samonds, J. M., & Bonds, A. B. (2005). Gamma oscilla-tion maintains stimulus structure-dependent synchroniza-tion in cat visual cortex. Journal of Neurophysiology, 93,223–236.
Shadlen, M. N., & Newsome, W. T. (1998). The variable dis-charge of cortical neurons: Implications for connectivity,computation, and information coding. Journal of Neuro-science, 18, 3870–3896.
Shlens, J., Field, G., Gauthier, J., Greschner, M., Sher, A., Litke,A., & Chichilnisky, E. (2009). The structure of large-scalesynchronized firing in primate retina. Journal of Neuro-science, 29, 5022–5031.
Shoham, S., Fellows, M., & Normann, R. (2003). Robust,automatic spike sorting using mixtures of multivariatet-distributions. Journal of Neuroscience Methods, 127,111–122.
Siegel, M., & Koenig, P. (2003). A functional gamma-banddefined by stimulus-dependent synchronization in area18 of awake behaving cats. Journal of Neuroscience, 23,4251–4260.
Smith, M. A., Bair, W., & Movshon, J. A. (2002). Signals inmacaque V1 neurons that support the perception of Glasspatterns. Journal of Neuroscience, 22, 8334–8345.
Smith, M. A., & Kohn, A. (2008). Spatial and temporal scalesof neuronal correlation in primary visual cortex. Journal ofNeuroscience, 28, 12591–12603.
Tsodyks, M., Kenet, T., Grinvald, A., & Arieli, A. (1999). Link-ing spontaneous activity of single cortical neurons and theunderlying functional architecture. Science, 286(5446), 1943–1946.
Xing, D., Yeh, C., & Shapley, R. (2009). Spatial spread of thelocal field potential and its laminar variation in visual cortex.Journal of Neuroscience, 29, 11540–11549.
Zohary, E., Shadlen, M. N., & Newsome, W. T. (1994). Corre-lated neuronal discharge rate and its implications for psy-chophysical performance. Nature, 370, 140–143.


![A Multi-GPU Algorithm for Large-scale Neuronal Networks · molecular dynamics [15], electrostatic potentials [16] and fluid flows [17]. In the area of neural networks, Bernhard](https://static.fdocuments.in/doc/165x107/5fb8946f08c9000ab400de11/a-multi-gpu-algorithm-for-large-scale-neuronal-molecular-dynamics-15-electrostatic.jpg)

