Introduction to Agribusiness IAFNR Agribusiness ModuleIAFNR Agribusiness Module.
local entrepreneurship, agribusiness cluster formation and the development of competitive value chains
Evaluation of the Strategic Alliance for Agricultural Development in Africa (SAADA program) 2006-2009
September 2010
Moussiliou AlidouMarjolein LemTed SchraderFons de Zeeuw

2 | SAADA Evaluation 2006-2009
| 3
Local entrepreneurship, agribusiness cluster formation and the development of competitive value chains
Evaluation of the Strategic Alliance for Agricultural Development in Africa (SAADA program) 2006-2009
September 2010
Moussiliou Alidou
Marjolein Lem
Ted Schrader
Fons de Zeeuw
4 | SAADA Evaluation 2006-2009
Bologòni tè dòlòmin, nka, a bèse ka dòlò sòrò yòrò djina — A finger does not drink beer, but it can indicate where to find it(Bambara proverb used by Malian farmer to typify the facilitating
role of IFDC and business service providers in agribusiness
cluster development, Koutiala, July 19th 2010)
| 5
Table of contents
LiST of AcronymS . . . . . . . . . . . . . . . . . . . . . . . . . . . . . . . . . . . . . . . . . . . . . . . . . . . . . . . . . . . . . . . . . . . . . . . . . . . . . . . . . . . . . . . . . . . . . 7
LiST of TAbLES, figurES AnD boxES . . . . . . . . . . . . . . . . . . . . . . . . . . . . . . . . . . . . . . . . . . . . . . . . . . . . . . . . . . . . . . . . . . . . . . . 8
ExEcuTivE SummAry . . . . . . . . . . . . . . . . . . . . . . . . . . . . . . . . . . . . . . . . . . . . . . . . . . . . . . . . . . . . . . . . . . . . . . . . . . . . . . . . . . . . . . . . . 11
SAADA program and evaluation objectives . . . . . . . . . . . . . . . . . . . . . . . . . . . . . . . . . . . . . . . . . . . . . . . . . . . . . . . . . . . . . . . . . . . 11
Evaluation methodology . . . . . . . . . . . . . . . . . . . . . . . . . . . . . . . . . . . . . . . . . . . . . . . . . . . . . . . . . . . . . . . . . . . . . . . . . . . . . . . . . . . . . . . 11
SAADA A: main conclusions . . . . . . . . . . . . . . . . . . . . . . . . . . . . . . . . . . . . . . . . . . . . . . . . . . . . . . . . . . . . . . . . . . . . . . . . . . . . . . . . . . 13
SAADA B and C: main findings . . . . . . . . . . . . . . . . . . . . . . . . . . . . . . . . . . . . . . . . . . . . . . . . . . . . . . . . . . . . . . . . . . . . . . . . . . . . . . . 15
Continuation into SAADA 2012-2015 . . . . . . . . . . . . . . . . . . . . . . . . . . . . . . . . . . . . . . . . . . . . . . . . . . . . . . . . . . . . . . . . . . . . . . . . 15
inTroDucTion . . . . . . . . . . . . . . . . . . . . . . . . . . . . . . . . . . . . . . . . . . . . . . . . . . . . . . . . . . . . . . . . . . . . . . . . . . . . . . . . . . . . . . . . . . . . . . . . 17
1 . ApproAch AnD inTErvEnTion STrATEgy . . . . . . . . . . . . . . . . . . . . . . . . . . . . . . . . . . . . . . . . . . . . . . . . . . . . . . . . . . . 19
1.1 CASE approach . . . . . . . . . . . . . . . . . . . . . . . . . . . . . . . . . . . . . . . . . . . . . . . . . . . . . . . . . . . . . . . . . . . . . . . . . . . . . . . . . . . . . . . . . . . . 19
1.2 Cluster actor collaboration . . . . . . . . . . . . . . . . . . . . . . . . . . . . . . . . . . . . . . . . . . . . . . . . . . . . . . . . . . . . . . . . . . . . . . . . . . . . . . . 21
2 . progrAmmE SET-up . . . . . . . . . . . . . . . . . . . . . . . . . . . . . . . . . . . . . . . . . . . . . . . . . . . . . . . . . . . . . . . . . . . . . . . . . . . . . . . . . . . . . . 25
Introduction . . . . . . . . . . . . . . . . . . . . . . . . . . . . . . . . . . . . . . . . . . . . . . . . . . . . . . . . . . . . . . . . . . . . . . . . . . . . . . . . . . . . . . . . . . . . . . . . . . . . 25
2.1 Funding arrangements . . . . . . . . . . . . . . . . . . . . . . . . . . . . . . . . . . . . . . . . . . . . . . . . . . . . . . . . . . . . . . . . . . . . . . . . . . . . . . . . . . . . 25
2.2 Program implementers: capacities and relations . . . . . . . . . . . . . . . . . . . . . . . . . . . . . . . . . . . . . . . . . . . . . . . . . . . . . . . 28
2.3 Selection of Agribusiness Clusters . . . . . . . . . . . . . . . . . . . . . . . . . . . . . . . . . . . . . . . . . . . . . . . . . . . . . . . . . . . . . . . . . . . . . . . 36
2.4 Monitoring and Evaluation system . . . . . . . . . . . . . . . . . . . . . . . . . . . . . . . . . . . . . . . . . . . . . . . . . . . . . . . . . . . . . . . . . . . . . . 39
2.5 Social inclusion . . . . . . . . . . . . . . . . . . . . . . . . . . . . . . . . . . . . . . . . . . . . . . . . . . . . . . . . . . . . . . . . . . . . . . . . . . . . . . . . . . . . . . . . . . . . 42
3 . cApAciTy STrEngThEning SErvicES . . . . . . . . . . . . . . . . . . . . . . . . . . . . . . . . . . . . . . . . . . . . . . . . . . . . . . . . . . . . . . . . 45
3.1 Training and learning activities . . . . . . . . . . . . . . . . . . . . . . . . . . . . . . . . . . . . . . . . . . . . . . . . . . . . . . . . . . . . . . . . . . . . . . . . . . 45
3.2 Effectiveness of farmer organizations . . . . . . . . . . . . . . . . . . . . . . . . . . . . . . . . . . . . . . . . . . . . . . . . . . . . . . . . . . . . . . . . . . . . 52
4 . Ab-cLuSTEr AccESS To SErvicES, finAncE, TEchnoLogy AnD informATion . . . . . . . . . . . 55
4.1 Private service provision . . . . . . . . . . . . . . . . . . . . . . . . . . . . . . . . . . . . . . . . . . . . . . . . . . . . . . . . . . . . . . . . . . . . . . . . . . . . . . . . . . 55
4.2 Resource mobilization . . . . . . . . . . . . . . . . . . . . . . . . . . . . . . . . . . . . . . . . . . . . . . . . . . . . . . . . . . . . . . . . . . . . . . . . . . . . . . . . . . . . . 57
4.3 Access to input . . . . . . . . . . . . . . . . . . . . . . . . . . . . . . . . . . . . . . . . . . . . . . . . . . . . . . . . . . . . . . . . . . . . . . . . . . . . . . . . . . . . . . . . . . . . 59
4.4 New technologies . . . . . . . . . . . . . . . . . . . . . . . . . . . . . . . . . . . . . . . . . . . . . . . . . . . . . . . . . . . . . . . . . . . . . . . . . . . . . . . . . . . . . . . . . . 60
4.5 Market information . . . . . . . . . . . . . . . . . . . . . . . . . . . . . . . . . . . . . . . . . . . . . . . . . . . . . . . . . . . . . . . . . . . . . . . . . . . . . . . . . . . . . . . 62
6 | SAADA Evaluation 2006-2009
5 . EnAbLing EnvironmEnT . . . . . . . . . . . . . . . . . . . . . . . . . . . . . . . . . . . . . . . . . . . . . . . . . . . . . . . . . . . . . . . . . . . . . . . . . . . . . . . 64
5.1 Regional policy environment . . . . . . . . . . . . . . . . . . . . . . . . . . . . . . . . . . . . . . . . . . . . . . . . . . . . . . . . . . . . . . . . . . . . . . . . . . . . . 64
5.2 National-level policy environment . . . . . . . . . . . . . . . . . . . . . . . . . . . . . . . . . . . . . . . . . . . . . . . . . . . . . . . . . . . . . . . . . . . . . . 65
5.3 Cluster-level policy environment . . . . . . . . . . . . . . . . . . . . . . . . . . . . . . . . . . . . . . . . . . . . . . . . . . . . . . . . . . . . . . . . . . . . . . . . 66
6 . SuSTAinAbLE impAcT . . . . . . . . . . . . . . . . . . . . . . . . . . . . . . . . . . . . . . . . . . . . . . . . . . . . . . . . . . . . . . . . . . . . . . . . . . . . . . . . . . . . . 69
6.1 Agricultural productivity . . . . . . . . . . . . . . . . . . . . . . . . . . . . . . . . . . . . . . . . . . . . . . . . . . . . . . . . . . . . . . . . . . . . . . . . . . . . . . . . . . 69
6.2 Income growth . . . . . . . . . . . . . . . . . . . . . . . . . . . . . . . . . . . . . . . . . . . . . . . . . . . . . . . . . . . . . . . . . . . . . . . . . . . . . . . . . . . . . . . . . . . . 71
6.3 Sustainable production . . . . . . . . . . . . . . . . . . . . . . . . . . . . . . . . . . . . . . . . . . . . . . . . . . . . . . . . . . . . . . . . . . . . . . . . . . . . . . . . . . . 73
6.4 Food security . . . . . . . . . . . . . . . . . . . . . . . . . . . . . . . . . . . . . . . . . . . . . . . . . . . . . . . . . . . . . . . . . . . . . . . . . . . . . . . . . . . . . . . . . . . . . . . 74
6.5 Private service providers . . . . . . . . . . . . . . . . . . . . . . . . . . . . . . . . . . . . . . . . . . . . . . . . . . . . . . . . . . . . . . . . . . . . . . . . . . . . . . . . . . 76
6.6 Impact distribution and spin-off . . . . . . . . . . . . . . . . . . . . . . . . . . . . . . . . . . . . . . . . . . . . . . . . . . . . . . . . . . . . . . . . . . . . . . . . . 77
7 . EfficiEncy . . . . . . . . . . . . . . . . . . . . . . . . . . . . . . . . . . . . . . . . . . . . . . . . . . . . . . . . . . . . . . . . . . . . . . . . . . . . . . . . . . . . . . . . . . . . . . . . . 81
7.1 Costs per farmer . . . . . . . . . . . . . . . . . . . . . . . . . . . . . . . . . . . . . . . . . . . . . . . . . . . . . . . . . . . . . . . . . . . . . . . . . . . . . . . . . . . . . . . . . . . 81
7.2 Efficiency of implementation modalities . . . . . . . . . . . . . . . . . . . . . . . . . . . . . . . . . . . . . . . . . . . . . . . . . . . . . . . . . . . . . . . . 82
7.3 Less is more . . . . . . . . . . . . . . . . . . . . . . . . . . . . . . . . . . . . . . . . . . . . . . . . . . . . . . . . . . . . . . . . . . . . . . . . . . . . . . . . . . . . . . . . . . . . . . . . 84
8 . SAADA b AnD c . . . . . . . . . . . . . . . . . . . . . . . . . . . . . . . . . . . . . . . . . . . . . . . . . . . . . . . . . . . . . . . . . . . . . . . . . . . . . . . . . . . . . . . . . . . . 85
8.1 Introduction . . . . . . . . . . . . . . . . . . . . . . . . . . . . . . . . . . . . . . . . . . . . . . . . . . . . . . . . . . . . . . . . . . . . . . . . . . . . . . . . . . . . . . . . . . . . . . . 85
8.2 Implementation agreement IFDC - DGIS . . . . . . . . . . . . . . . . . . . . . . . . . . . . . . . . . . . . . . . . . . . . . . . . . . . . . . . . . . . . . . . 85
8.3 Budget versus actual expenses . . . . . . . . . . . . . . . . . . . . . . . . . . . . . . . . . . . . . . . . . . . . . . . . . . . . . . . . . . . . . . . . . . . . . . . . . . . . 87
8.4 Organisation, monitoring and reporting . . . . . . . . . . . . . . . . . . . . . . . . . . . . . . . . . . . . . . . . . . . . . . . . . . . . . . . . . . . . . . . . 88
8.5 Achievements of SAADA B . . . . . . . . . . . . . . . . . . . . . . . . . . . . . . . . . . . . . . . . . . . . . . . . . . . . . . . . . . . . . . . . . . . . . . . . . . . . . . . . 88
8.6 Achievements of SAADA C . . . . . . . . . . . . . . . . . . . . . . . . . . . . . . . . . . . . . . . . . . . . . . . . . . . . . . . . . . . . . . . . . . . . . . . . . . . . . . . 90
8.7 Conclusions on SAADA B and C . . . . . . . . . . . . . . . . . . . . . . . . . . . . . . . . . . . . . . . . . . . . . . . . . . . . . . . . . . . . . . . . . . . . . . . . . 91
9 . concLuSionS EvALuATion SAADA progrAm 2006-2009 . . . . . . . . . . . . . . . . . . . . . . . . . . . . . . . . . . . . . . . 93
A) Result chain . . . . . . . . . . . . . . . . . . . . . . . . . . . . . . . . . . . . . . . . . . . . . . . . . . . . . . . . . . . . . . . . . . . . . . . . . . . . . . . . . . . . . . . . . . . . . . . . . 93
B) Qualified judgment of the 1000s+ project on the basis of the result chain . . . . . . . . . . . . . . . . . . . . . . . . . . . . 97
10 . fuTurE pErSpEcTivES . . . . . . . . . . . . . . . . . . . . . . . . . . . . . . . . . . . . . . . . . . . . . . . . . . . . . . . . . . . . . . . . . . . . . . . . . . . . . . . . . . . . . 99
AnnExES . . . . . . . . . . . . . . . . . . . . . . . . . . . . . . . . . . . . . . . . . . . . . . . . . . . . . . . . . . . . . . . . . . . . . . . . . . . . . . . . . . . . . . . . . . . . . . . . . . . . . . . 103
| 7
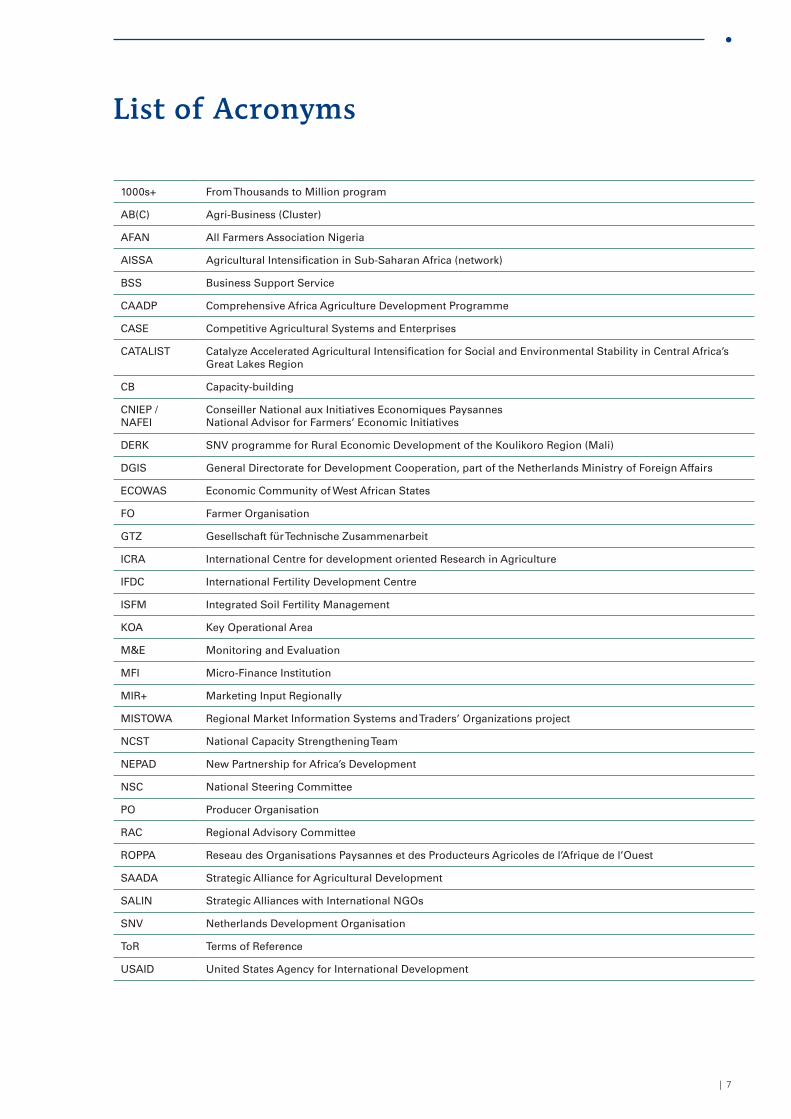
List of Acronyms
1000s+ From Thousands to Million program
AB(C) Agri-Business (Cluster)
AFAN All Farmers Association Nigeria
AISSA Agricultural Intensification in Sub-Saharan Africa (network)
BSS Business Support Service
CAADP Comprehensive Africa Agriculture Development Programme
CASE Competitive Agricultural Systems and Enterprises
CATALIST Catalyze Accelerated Agricultural Intensification for Social and Environmental Stability in Central Africa’s Great Lakes Region
CB Capacity-building
CNIEP / NAFEI
Conseiller National aux Initiatives Economiques Paysannes National Advisor for Farmers’ Economic Initiatives
DERK SNV programme for Rural Economic Development of the Koulikoro Region (Mali)
DGIS General Directorate for Development Cooperation, part of the Netherlands Ministry of Foreign Affairs
ECOWAS Economic Community of West African States
FO Farmer Organisation
GTZ Gesellschaft für Technische Zusammenarbeit
ICRA International Centre for development oriented Research in Agriculture
IFDC International Fertility Development Centre
ISFM Integrated Soil Fertility Management
KOA Key Operational Area
M&E Monitoring and Evaluation
MFI Micro-Finance Institution
MIR+ Marketing Input Regionally
MISTOWA Regional Market Information Systems and Traders’ Organizations project
NCST National Capacity Strengthening Team
NEPAD New Partnership for Africa’s Development
NSC National Steering Committee
PO Producer Organisation
RAC Regional Advisory Committee
ROPPA Reseau des Organisations Paysannes et des Producteurs Agricoles de l’Afrique de l’Ouest
SAADA Strategic Alliance for Agricultural Development
SALIN Strategic Alliances with International NGOs
SNV Netherlands Development Organisation
ToR Terms of Reference
USAID United States Agency for International Development
8 | SAADA Evaluation 2006-2009
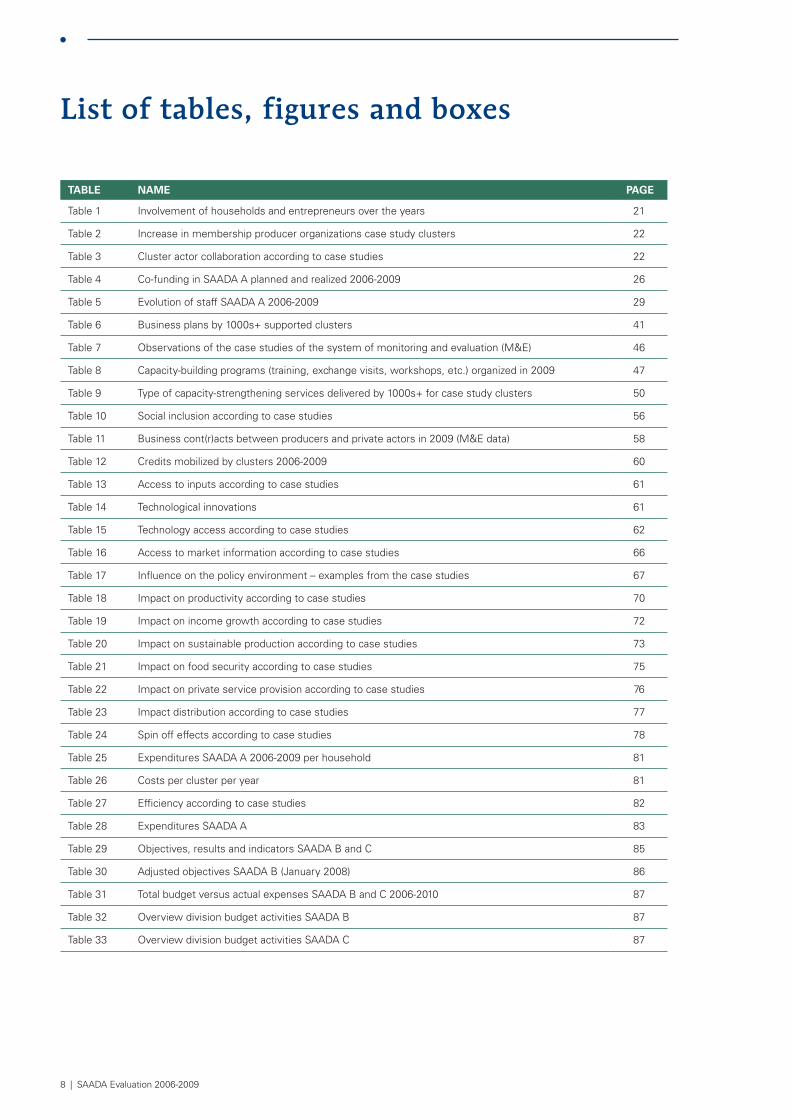
List of tables, figures and boxes
Table Name Page
Table 1 Involvement of households and entrepreneurs over the years 21
Table 2 Increase in membership producer organizations case study clusters 22
Table 3 Cluster actor collaboration according to case studies 22
Table 4 Co-funding in SAADA A planned and realized 2006-2009 26
Table 5 Evolution of staff SAADA A 2006-2009 29
Table 6 Business plans by 1000s+ supported clusters 41
Table 7 Observations of the case studies of the system of monitoring and evaluation (M&E) 46
Table 8 Capacity-building programs (training, exchange visits, workshops, etc.) organized in 2009 47
Table 9 Type of capacity-strengthening services delivered by 1000s+ for case study clusters 50
Table 10 Social inclusion according to case studies 56
Table 11 Business cont(r)acts between producers and private actors in 2009 (M&E data) 58
Table 12 Credits mobilized by clusters 2006-2009 60
Table 13 Access to inputs according to case studies 61
Table 14 Technological innovations 61
Table 15 Technology access according to case studies 62
Table 16 Access to market information according to case studies 66
Table 17 Influence on the policy environment – examples from the case studies 67
Table 18 Impact on productivity according to case studies 70
Table 19 Impact on income growth according to case studies 72
Table 20 Impact on sustainable production according to case studies 73
Table 21 Impact on food security according to case studies 75
Table 22 Impact on private service provision according to case studies 76
Table 23 Impact distribution according to case studies 77
Table 24 Spin off effects according to case studies 78
Table 25 Expenditures SAADA A 2006-2009 per household 81
Table 26 Costs per cluster per year 81
Table 27 Efficiency according to case studies 82
Table 28 Expenditures SAADA A 83
Table 29 Objectives, results and indicators SAADA B and C 85
Table 30 Adjusted objectives SAADA B (January 2008) 86
Table 31 Total budget versus actual expenses SAADA B and C 2006-2010 87
Table 32 Overview division budget activities SAADA B 87
Table 33 Overview division budget activities SAADA C 87
| 9
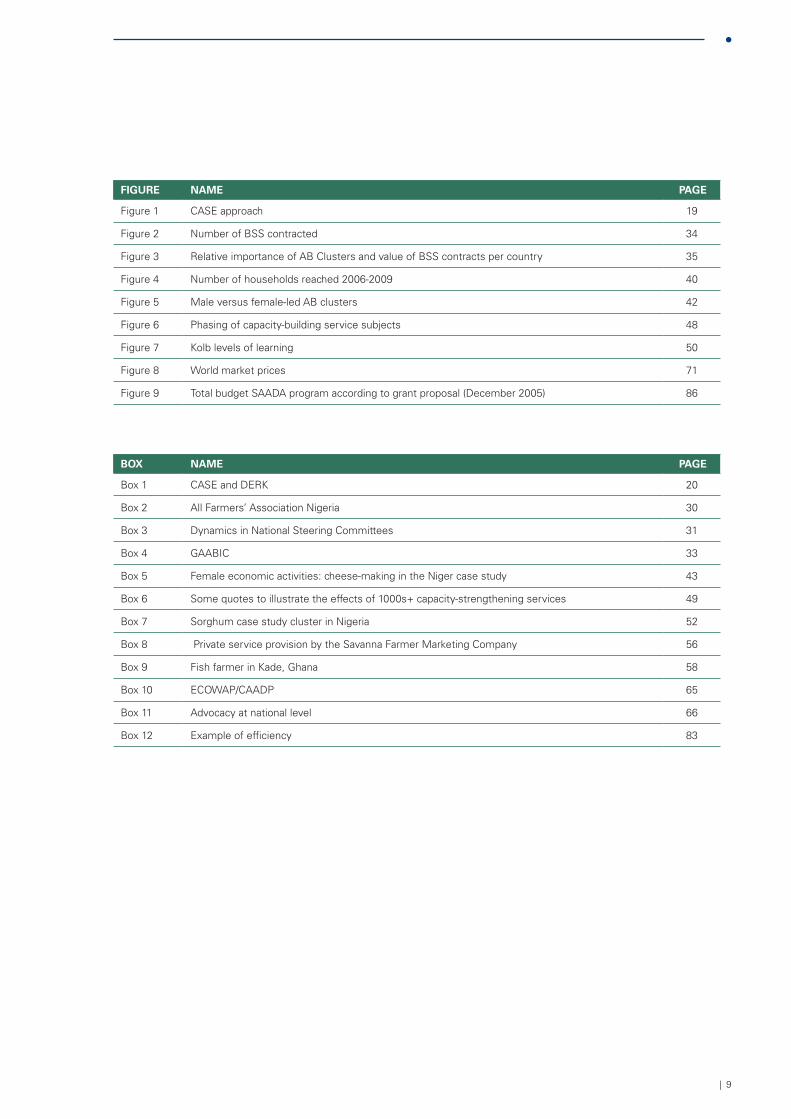
Figure Name Page
Figure 1 CASE approach 19
Figure 2 Number of BSS contracted 34
Figure 3 Relative importance of AB Clusters and value of BSS contracts per country 35
Figure 4 Number of households reached 2006-2009 40
Figure 5 Male versus female-led AB clusters 42
Figure 6 Phasing of capacity-building service subjects 48
Figure 7 Kolb levels of learning 50
Figure 8 World market prices 71
Figure 9 Total budget SAADA program according to grant proposal (December 2005) 86
box Name Page
Box 1 CASE and DERK 20
Box 2 All Farmers’ Association Nigeria 30
Box 3 Dynamics in National Steering Committees 31
Box 4 GAABIC 33
Box 5 Female economic activities: cheese-making in the Niger case study 43
Box 6 Some quotes to illustrate the effects of 1000s+ capacity-strengthening services 49
Box 7 Sorghum case study cluster in Nigeria 52
Box 8 Private service provision by the Savanna Farmer Marketing Company 56
Box 9 Fish farmer in Kade, Ghana 58
Box 10 ECOWAP/CAADP 65
Box 11 Advocacy at national level 66
Box 12 Example of efficiency 83

10 | SAADA Evaluation 2006-2009
| 11
Executive summary
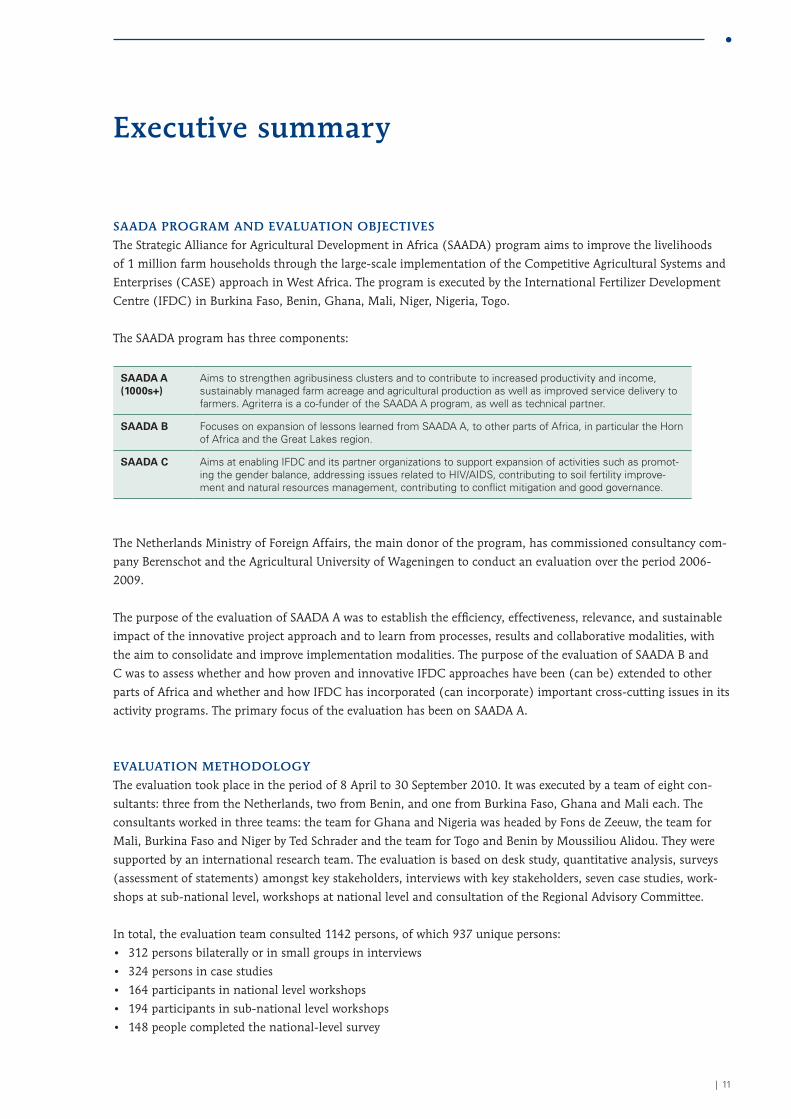
SAADA progrAm AnD EvALuATion objEcTivES
The Strategic Alliance for Agricultural Development in Africa (SAADA) program aims to improve the livelihoods
of 1 million farm households through the large-scale implementation of the Competitive Agricultural Systems and
Enterprises (CASE) approach in West Africa. The program is executed by the International Fertilizer Development
Centre (IFDC) in Burkina Faso, Benin, Ghana, Mali, Niger, Nigeria, Togo.
The SAADA program has three components:
SaaDa a (1000s+)
Aims to strengthen agribusiness clusters and to contribute to increased productivity and income, sustainably managed farm acreage and agricultural production as well as improved service delivery to farmers. Agriterra is a co-funder of the SAADA A program, as well as technical partner.
SaaDa b Focuses on expansion of lessons learned from SAADA A, to other parts of Africa, in particular the Horn of Africa and the Great Lakes region.
SaaDa C Aims at enabling IFDC and its partner organizations to support expansion of activities such as promot-ing the gender balance, addressing issues related to HIV/AIDS, contributing to soil fertility improve-ment and natural resources management, contributing to conflict mitigation and good governance.
The Netherlands Ministry of Foreign Affairs, the main donor of the program, has commissioned consultancy com-
pany Berenschot and the Agricultural University of Wageningen to conduct an evaluation over the period 2006-
2009.
The purpose of the evaluation of SAADA A was to establish the efficiency, effectiveness, relevance, and sustainable
impact of the innovative project approach and to learn from processes, results and collaborative modalities, with
the aim to consolidate and improve implementation modalities. The purpose of the evaluation of SAADA B and
C was to assess whether and how proven and innovative IFDC approaches have been (can be) extended to other
parts of Africa and whether and how IFDC has incorporated (can incorporate) important cross-cutting issues in its
activity programs. The primary focus of the evaluation has been on SAADA A.
EvALuATion mEThoDoLogy
The evaluation took place in the period of 8 April to 30 September 2010. It was executed by a team of eight con-
sultants: three from the Netherlands, two from Benin, and one from Burkina Faso, Ghana and Mali each. The
consultants worked in three teams: the team for Ghana and Nigeria was headed by Fons de Zeeuw, the team for
Mali, Burkina Faso and Niger by Ted Schrader and the team for Togo and Benin by Moussiliou Alidou. They were
supported by an international research team. The evaluation is based on desk study, quantitative analysis, surveys
(assessment of statements) amongst key stakeholders, interviews with key stakeholders, seven case studies, work-
shops at sub-national level, workshops at national level and consultation of the Regional Advisory Committee.
In total, the evaluation team consulted 1142 persons, of which 937 unique persons:
• 312 persons bilaterally or in small groups in interviews
• 324 persons in case studies
• 164 participants in national level workshops
• 194 participants in sub-national level workshops
• 148 people completed the national-level survey
12 | SAADA Evaluation 2006-2009
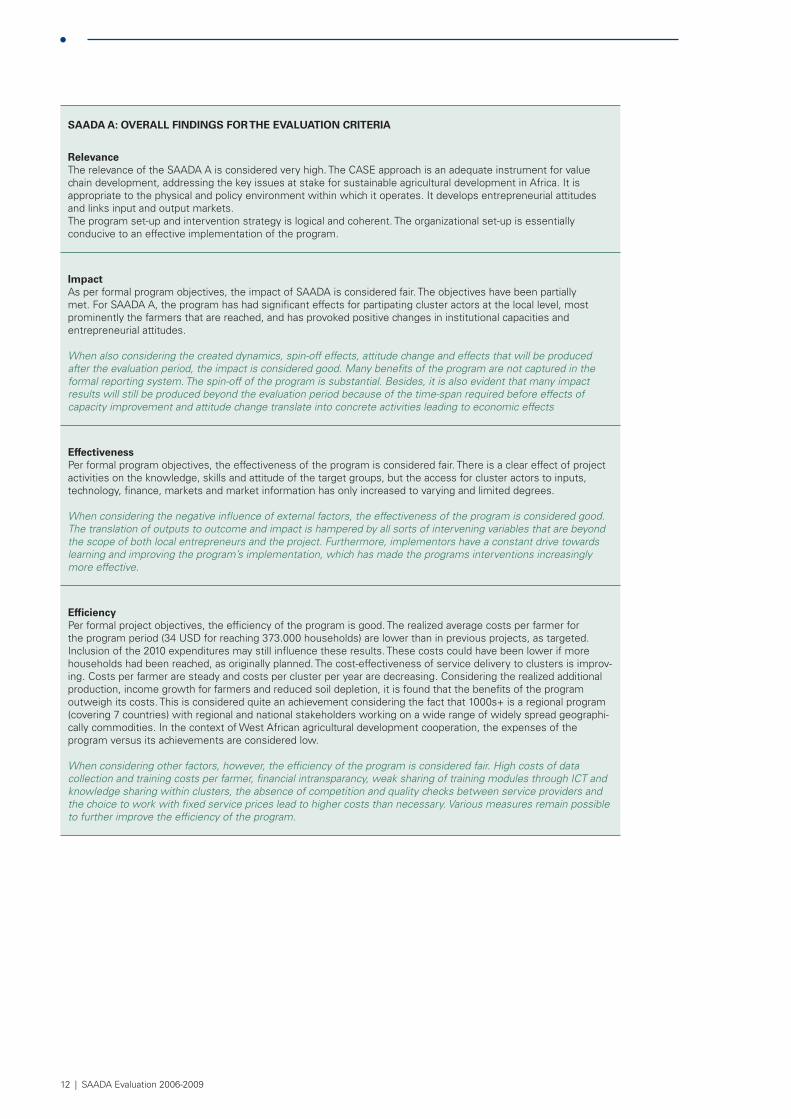
SaaDa a: overall FiNDiNgS For The evaluaTioN CriTeria
relevanceThe relevance of the SAADA A is considered very high. The CASE approach is an adequate instrument for value chain development, addressing the key issues at stake for sustainable agricultural development in Africa. It is appropriate to the physical and policy environment within which it operates. It develops entrepreneurial attitudes and links input and output markets. The program set-up and intervention strategy is logical and coherent. The organizational set-up is essentially conducive to an effective implementation of the program.
impactAs per formal program objectives, the impact of SAADA is considered fair. The objectives have been partially met. For SAADA A, the program has had significant effects for partipating cluster actors at the local level, most prominently the farmers that are reached, and has provoked positive changes in institutional capacities and entrepreneurial attitudes.
When also considering the created dynamics, spin-off effects, attitude change and effects that will be produced after the evaluation period, the impact is considered good. Many benefits of the program are not captured in the formal reporting system. The spin-off of the program is substantial. Besides, it is also evident that many impact results will still be produced beyond the evaluation period because of the time-span required before effects of capacity improvement and attitude change translate into concrete activities leading to economic effects
effectivenessPer formal program objectives, the effectiveness of the program is considered fair. There is a clear effect of project activities on the knowledge, skills and attitude of the target groups, but the access for cluster actors to inputs, technology, finance, markets and market information has only increased to varying and limited degrees.
When considering the negative influence of external factors, the effectiveness of the program is considered good. The translation of outputs to outcome and impact is hampered by all sorts of intervening variables that are beyond the scope of both local entrepreneurs and the project. Furthermore, implementors have a constant drive towards learning and improving the program’s implementation, which has made the programs interventions increasingly more effective.
efficiencyPer formal project objectives, the efficiency of the program is good. The realized average costs per farmer for the program period (34 USD for reaching 373.000 households) are lower than in previous projects, as targeted. Inclusion of the 2010 expenditures may still influence these results. These costs could have been lower if more households had been reached, as originally planned. The cost-effectiveness of service delivery to clusters is improv-ing. Costs per farmer are steady and costs per cluster per year are decreasing. Considering the realized additional production, income growth for farmers and reduced soil depletion, it is found that the benefits of the program outweigh its costs. This is considered quite an achievement considering the fact that 1000s+ is a regional program (covering 7 countries) with regional and national stakeholders working on a wide range of widely spread geographi-cally commodities. In the context of West African agricultural development cooperation, the expenses of the program versus its achievements are considered low.
When considering other factors, however, the efficiency of the program is considered fair. High costs of data collection and training costs per farmer, financial intransparancy, weak sharing of training modules through ICT and knowledge sharing within clusters, the absence of competition and quality checks between service providers and the choice to work with fixed service prices lead to higher costs than necessary. Various measures remain possible to further improve the efficiency of the program.
| 13
SAADA A: mAin concLuSionS
1. The CASE approach is widely considered as a relevant and effective instrument to promote
commodity value chain development. There is a need to further extend the knowledge about the
approach, which is still confined to those directly involved in project facilitated cluster development
processes. There is great potential for out scaling within farmer unions and federations.
2. Business-oriented collaboration between different actors is a key condition for agribusiness development.
The quantity of new links established and relations reinforced by 1000s+ is impressive. The quality of these
relations however depends on a wide range of factors. Results regarding cluster actor collaboration range
from unsuccessful to quite successful. Financial institutions are in most instances not well connected yet.
3. Regarding the program’s funding arrangements, it is found that the SALIN co-funding
requirement of 100% is not met. Depending on the definition of co-funding used, realization
ranges between 20-75% of the target. The intention to levy €16 million of co-funding has
been too ambitious and was not supported by a proper resource mobilization strategy.
4. Although it took time, a sufficient basis for fruitful collaboration between IFDC, Agriterra
and ROPPA has been created. Co-funding requirements for the SAADA program and the
dual roles of Agriterra and ROPPA have unnecessarily complicated matters.
5. The institutional set-up of the 1000s+ project is in essence good. The CASE approach requires working in
different intervention domains, which requires complementary core capacities. Most relevant actors are
connected and the structures are in place, even though it has taken time and energy before they started
functioning and their effectiveness can still be improved in various regards. It is expected that many positive
(side)effects of the institutional structure are yet to be attained, after a couple of years of implementation.
6. Regarding the strategy for service-delivery, IFDC has chosen a challenging way of working through
BSSs rather than with own staff. This is a more sustainable way of working, which is found to be
highly relevant. In the execution of the strategy, more could be done to develop instruments for BSS
selection, methods for BSS strengthening, and tools for quality control and client satisfaction.
7. The procedures for cluster selection and cluster action plan formulation are transparent and largely effective.
The fact that there are no strategic criteria for starting and ending cluster support (entry and exit strategy) is
a point of serious attention. The current portfolio of agribusiness clusters allows for developing a typology of
agribusiness clusters and defining evidence-based strategies for inception and cessation of support to clusters.
8. The system for monitoring and evaluation, despite all the efforts that have gone into it, does not really
live up to expectations. While the 1000s+ project is aimed at practical grass-root solutions, the M&E
system is mainly geared towards upward accountability. A large part of the information it renders is
neither very useful for the donor nor for cluster actors, as a result of methodological concerns related
to attribution, quality of data entry, indicator definitions, and inappropriate aggregation levels.
9. Female participation of around 35% in the West African context is considered good. Many female-
led clusters are being supported. Low female participation in the NSCs is a point of attention.
10. The capacity-building services delivered by 1000s+ are good and relevant. Between 2006-2009, about
120.000-140.000 people (around 35.000 unique persons) were trained, of which 36% woman.
Numerically, farmers were the main beneficiaries of the CB efforts (87%), but also processors and
business service providers have profited. The capacity-building services have had significant direct
14 | SAADA Evaluation 2006-2009
and indirect effects on these cluster actors and contributed to changing dynamics in agribusiness.
Other cluster actors, such as financial service providers and research institutes have not been much
targeted. Their capacity to fulfill the role of cluster actor should be further strengthened.
11. The capacity-strengthening services delivered by the 1000s+ project have contributed towards making
producer organizations more effective. POs supported by the program are increasingly capable to represent
and serve their members. The effectiveness of the capacity-strengthening services, in particular their
reach and uptake, can be further improved in the field of didactics (relevance of training methods,
trainers and training material), knowledge transfer (availability of modules and tools, restitution
by participants) and orientation (financial/business aspects, institutional strengthening).
12. Farmers are increasingly served by private service providers. Many business links have been
established and/or reinforced at cluster level. Around 1500 unique private service providers are
involved. The foundations for increased business between chain operators and supporters have
been laid and the number of business transactions and opportunities has significantly increased,
although difficult to quantify. Notwithstanding these achievements, in most clusters robust
collaboration between cluster actors (in terms of concrete transactions) is still lacking. They
need more time and efforts to include relevant stakeholders, develop necessary levels of trust
between actors and attain the size and viability that make them attractive business partners.
13. The program has probably contributed towards increasing or leveraging resources from
other sources. Cluster actors have been able to mobilize 9 million Euro (of which 6 million
in Togo) for their activities. A relation with 1000s+ is however hard to establish.
14. The knowledge of cluster actors - farmers most prominently– about agricultural inputs has strongly
increased as a result of 1000s+ activities. This has resulted in, amongst others, increased use of organic
fertilizers, higher quality products and safer procedures. The access to inputs however remains challenging,
because of the high politicization of the input market and the high costs of seeds, fertilizers and land.
15. Many new technologies have been introduced by the program. The knowledge of new technologies
for production and soil management has strongly increased. This increase can to a large extent
be attributed to 1000s+. Cluster actors are eager to adopt the new technologies, having become
convinced of their added value. Most easily adopted are those innovations that are supportive to
the activities of producers or processors and bring about tangible advantages. Widespread adoption
of new technologies is however hampered by lack of funds or other resources (such as land).
16. The influence of 1000s+ on market information provision has been limited. Reported improvements
mainly result from increased interaction between the stakeholders (informal exchange of information).
17. The influence of 1000s+ on the policy environment has been modest. In the beginning of the program, the
conditions for effective influencing of the policy environment were not yet in place. However, the project
set-up and the current number of AB clusters now allow for a more prominent role in policy development.
18. Impact objective 1 to reach 50% average increases in agricultural productivity (production) and 30% average
income growth for the farmers supported by 1000s+ is met, albeit for a lower number of farmers than targeted.
19. For impact objective 2, the target of 2 million hectares of farmland under environmentally
sustainable production in 2010 will certainly not be achieved. The target for this
objective is considered unrealistic and its indicator not properly measurable.
| 15
20. For impact objective 3, it is concluded that the program has contributed to enhanced food production.
With 1.718.619 tons, the reported increase in cereal equivalents production is nearly four times
higher than planned. Livelihood conditions (not necessarily being food insecurity conditions)
have increased as a result of enhanced production and income. Although the contribution of
other factors to this increase is substantial, it is found that the target has been met.
21. Impact objective 4 has been partially met. Private service provision to farmers has improved, but
not to the expected extent. Over 4000 dealers, traders, processors and others (of which 1500
unique actors, 25% less than targeted) have been reached by the program. The foundations
have been laid for increased business between chain operators and supporters. The number
of business transactions and opportunities have significantly increased, but is difficult to
quantify. Size and viability of many clusters has hampered commercial transactions.
22. The 1000s+ project has brought about important spin-off effects and is likely to remain doing so as
more and more cluster actors are included and lessons learned are disseminated within and beyond
clusters. Impact distribution is skewed towards the more resource-endowed male producer, but also other
actors have profited. Many impact results are expected to still render beyond the evaluation period.
SAADA b AnD c: mAin finDingS
A ‘light evaluation’ was conducted into the SAADA B and C components of the program. Evaluation methods com-
prised desk study, a questionnaire and a limited number of telephone interviews.
It proved not possible to determine whether the SAADA B and C components achieved satisfactory results. To a
large extent, this is due to the fact that the objectives for SAADA B and C were very general. Furthermore, the
objectives of SAADA B were replaced by others, two year after the start of the program. The new objectives of
SAADA B were again very general. The absence of clear objectives, expected results or targets makes evaluation
troublesome. Conclusions about impact, effectiveness, efficiency or relevance of the two components could hence
not be drawn.
For SAADA B, some activities can be described as successful, like the organization of the Africa Fertilizer Summit
or the overall knowledge increase of IFDC staff on cross-cutting issues. The evaluation team concluded that the
ambition to introduce the CASE approach in other regions in Africa was too high. However, with the integration
of CASE in the Catalyst program, a base has been created for implementation of the approach in Burundi, Rwanda
and DRC.
SAADA C may be considered as a form of institutional support to IFDC, which makes the need for clear objectives
arguably somewhat lower. Institutionally or programmatically, the SAADA C component and SAADA A were poorly
connected, which - even though this was not aimed for - is considered a missed opportunity
conTinuATion inTo SAADA 2012-2015
Given the positive results of the evaluation regarding relevance, effectiveness, sustainable impact and efficiency of
the SAADA A/1000s+ program, the evaluators recommend the continuation of the program. It is advised to con-
sider 2011 as a transition year during which a successive program 2012-2015 is formulated. To ensure continuity
of agribusiness cluster development and staff retention, explicit decision-making is required on the shortest notice
possible regarding the continuation of SAADA A activities in 2011, including the elaboration of a work plan 2011
and the continuation of contracts during 2011. It is recommended that remaining SAADA B and C funds, and
some additional funding from DGIS, be utilized for the continuation of SAADA A in 2011 as well as investments
16 | SAADA Evaluation 2006-2009
related to the formulation of SAADA 2012-2015. It is important to formulate realistic and feasible objectives for
2012-2015.
The SAADA 2012-2015 program, focusing on strengthening business-oriented collaboration between differ-
ent actors in agribusiness clusters, remains to be coordinated by IFDC. SAADA 2012-2015 should include action
research components and should give sufficient attention to cross-cutting issues, thus integrating former SAADA
B and C elements. Whereas under SAADA A 2006-2010, about 80 to 90% of the capacity strengthening services
was targeted at producer organizations, a more balanced attention towards all cluster actor groups is recommended
for SAADA 2012-2015. Strategic partnerships should be concluded under the CASE framework program to ensure
that the needs of all actors are taken into account. When the relatively heavy focus on producer organisations is
replaced in the SAADA 2012-2015 program by a more balanced attention to all cluster actors, continued support to
producer organisations – where and when required – could be provided under a separate Farmers Fighting Poverty
II program. We suggest that the Farmers Fighting Poverty II program, to be coordinated by Agriterra, is aligned with
the SAADA 2012-2015 program, under the CASE framework program.
More suggestions for improvement of the implementation modalities have been provided in the report.
| 17
introduction
SAADA progrAm
The SAADA1 program is mainly financed by the Dutch Ministry of Foreign Affairs and implemented by the Interna-
tional Fertilizer Development Centre (IFDC) in seven countries in West Africa: Burkina Faso, Benin, Ghana, Mali,
Niger, Nigeria, Togo. The SAADA program has three components: SAADA A (or 1000s+), SAADA B and SAADA C.
The SAADA A program focuses on strengthening agribusiness clusters and aims to contribute to productivity
increase, income improvement, increase in sustainably managed farm acreage, increased agricultural production
and improved service delivery to farmers. Agriterra is a co-funder of the SAADA A program and acts as well as
technical partner.
The SAADA B program focuses on expansion of lessons learned, from SAADA A, to other parts of Africa, in particu-
lar the Horn of Africa and the Great Lakes region.
The SAADA C program aims at enabling IFDC and its partner organisations to support expansion of activities such
as promoting the gender balance, addressing issues related to HIV/AIDS, contributing to soil fertility improvement
and natural resources management, contributing to conflict mitigation and good governance.
objEcTivES of ThE EvALuATion
The purpose of the evaluation of SAADA A is to establish the efficiency, effectiveness, relevance, and sustainable
impact of the innovative project approach and to learn from processes, results and collaborative modalities, with
the aim to consolidate and improve implementation modalities.
The purpose of the evaluation of SAADA-B and C is to assess whether and how proven and innovative IFDC
approaches have been (can be) extended to other parts of Africa and whether and how IFDC has incorporated (can
incorporate) important cross-cutting issues in its activity programs.
The report is structured around a significant number of evaluation questions, presented in the terms of reference.
These questions have been regrouped into an evaluation matrix, which can be found in the inception report pre-
pared by the evaluation team.
The evaluation’s prime focus has been on SAADA A.
mEThoDoLogy
The Ministry of Foreign Affairs granted the consortium of Berenschot and Wageningen University (Centre for
Development Innovation) the assignment to conduct an evaluation of the SAADA program over the period 2006-
2009. Faced with the challenge to evaluate a complex program, running in seven countries, in a few months’ time,
an evaluation team of seven experts has been composed. The evaluation team consisted of Dutch consultants and
African consultants, supported by an international research team. The evaluation is based on desk study, quan-
titative analysis, surveys (assessment of statements) amongst key stakeholders of SAADA A, interviews with key
stakeholders, seven case studies (1 per country), workshops at sub-national level, workshops at national level and
consultation of the Regional Advisory Committee.
1 Strategic Alliance for Agricultural Development in Africa
18 | SAADA Evaluation 2006-2009
The evaluation team consulted a total of 1142 persons, of which 937 unique person:
• 312 persons bilaterally in interviews
• 324 persons in case studies
• 164 participants in national level workshops
• 194 participants in sub-national level workshops
Details regarding the methodology can be found in the inception report.
prESEnTATion rEporT
In the report, we clearly marked the evaluation questions derived from the
terms of reference. The report is structured as follows:
In chapter 1, we review the Competitive Agricultural Systems and Enterprises
(CASE) approach. This approach is leading for the SAADA program.
In chapter 2, we evaluate the program set-up of SAADA A. We zoom in on issues
related to funding and implanting organisations and structures.
In chapter 3, we evaluate capacity strengthening services provided through the SAADA A program.
In chapter 4, we evaluate the access of agribusiness clusters to services / finance / technology / information.
In fact, the access to these services is considered as results of cluster strengthening activities by SAADA A.
In chapter 5, the influence of SAADA A on the national and regional policy / business environment is evaluated.
In chapter 6, we systematically assess the achievements of the SAADA A program regarding the impacts targets.
In chapter 7, we investigate the efficiency of SAADA A.
In chapter 8, we evaluate the SAADA B and C components. This evaluation is a ‘light’ one,
based only on a study of documents and a few interviews with program implementers.
In chapter 9, we present the conclusions following the structure of the result chain.
Finally, in chapter 10, we present future perspectives.
The annexes are presented separately. Amongst others, an executive sum-
mary and detailed case study reports have been included in the annexes.
| 19
1 . Approach and intervention strategy
is the cASE approach an effective instrument to promote commodity chain development?
1 .1 cASE ApproAch
1 .1 .1 The concept
The Competitive Agricultural Systems and Enterprises (CASE) approach was gradually conceived and developed
during an IFDC Integrated Soil Fertility Management (ISFM) program in West-Africa (1998-2005). The CASE
approach combines strategies for ISFM, such as the combined use of mineral fertilizers and locally available organic
amendments to replenish soil nutrients and improve the efficiency of fertilizers and other inputs, with conditions
for competitive commodity chain development.
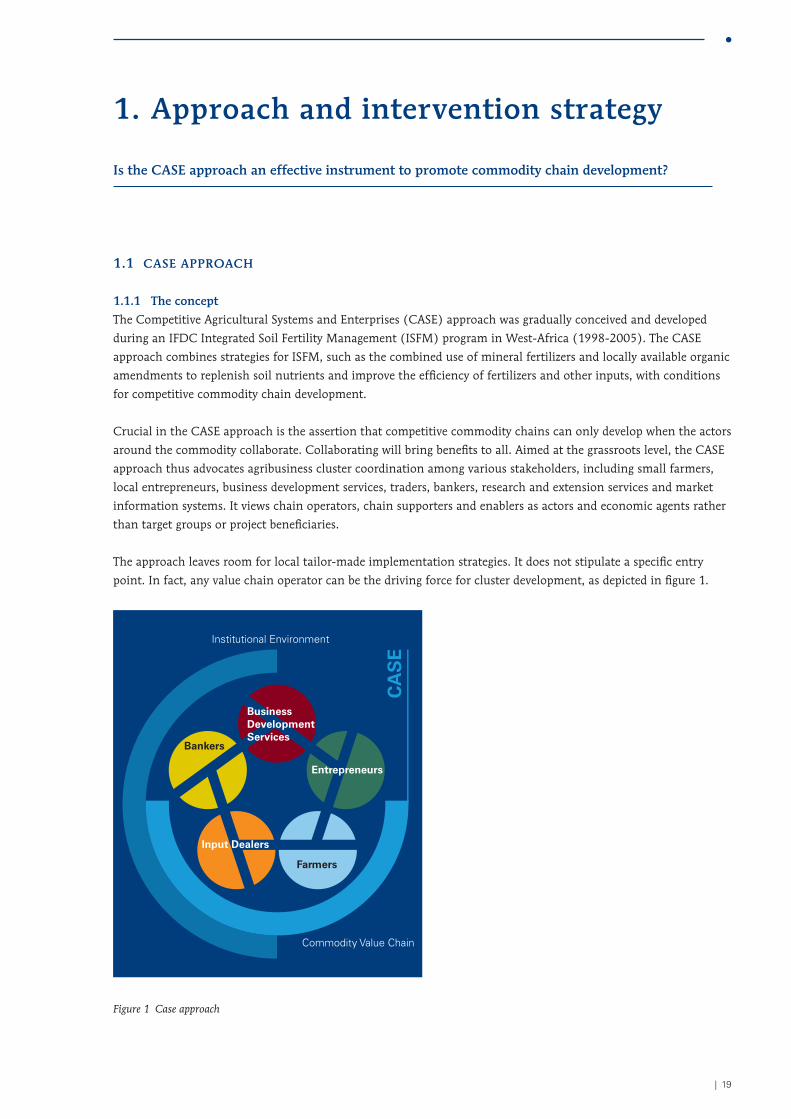
Crucial in the CASE approach is the assertion that competitive commodity chains can only develop when the actors
around the commodity collaborate. Collaborating will bring benefits to all. Aimed at the grassroots level, the CASE
approach thus advocates agribusiness cluster coordination among various stakeholders, including small farmers,
local entrepreneurs, business development services, traders, bankers, research and extension services and market
information systems. It views chain operators, chain supporters and enablers as actors and economic agents rather
than target groups or project beneficiaries.
The approach leaves room for local tailor-made implementation strategies. It does not stipulate a specific entry
point. In fact, any value chain operator can be the driving force for cluster development, as depicted in figure 1.
CA
SE
Institutional Environment
Commodity Value Chain
BusinessDevelopmentServices
Bankers
Entrepreneurs
Farmers
Input Dealers
Figure 1 Case approach
20 | SAADA Evaluation 2006-2009
1 .1 .2 Assessment of the cASE approach
Across stakeholders and countries, the CASE approach is highly appreciated as an innovative and relevant
approach. Respondents strongly appreciate the attention for improving the effectiveness of farmer organizations in
the value chain and the establishment of professional relations with other stakeholders. In the survey at national
level, capturing the opinions of 148 respondents2, the approach stands out as the best appreciated aspect of the
1000s+ project. The statements in this chapter were scored 23% above average. This appreciation has been further
confirmed during interviews with national steering committees, during many interviews and during the sub-
national and national workshops.
The evaluation team has found that the CASE approach and the 1000s+ project have definitely contributed to atti-
tude change among those involved in the 218 clusters. Cluster actors increasingly recognize business opportunities
and take collective action, slowly drifting away from passivity and donor dependency. The approach has created an
important sense of ownership within farmers’ organizations at different levels. Agribusiness cluster formation and
development is a learning by doing process. Local entrepreneurs involved in AB clusters regularly affirmed that it is
“their program”.
Stakeholders in West-Africa are aware that there are also other approaches towards local economic development
and value chain development, such as:
• Making markets work for the poor (M4P; Springfield Centre,
www.springfieldcentre.com/currentprogrammes.php),
• Value Links (GTZ, www.value-links.de/manual/distributor.html)
• Sustainable Livelihoods Approach (SLA; DFID),
• First Mile (IFAD, www.ifad.org/rural/firstmile/index.htm)
• Client Oriented Research Management Approach (KIT)
• DERK programme (SNV)
The evaluation team did not investigate these approaches other than – briefly – DERK:
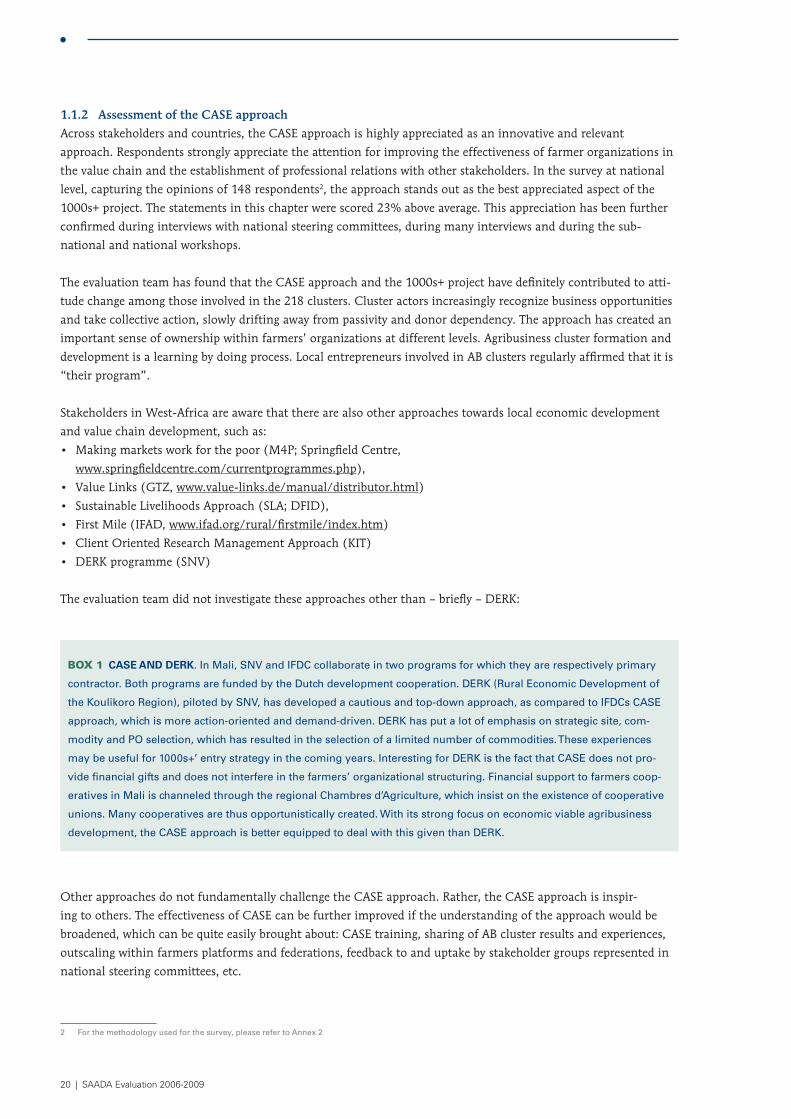
Box 1 CaSe aND DerK. In Mali, SNV and IFDC collaborate in two programs for which they are respectively primary
contractor. Both programs are funded by the Dutch development cooperation. DERK (Rural Economic Development of
the Koulikoro Region), piloted by SNV, has developed a cautious and top-down approach, as compared to IFDCs CASE
approach, which is more action-oriented and demand-driven. DERK has put a lot of emphasis on strategic site, com-
modity and PO selection, which has resulted in the selection of a limited number of commodities. These experiences
may be useful for 1000s+’ entry strategy in the coming years. Interesting for DERK is the fact that CASE does not pro-
vide financial gifts and does not interfere in the farmers’ organizational structuring. Financial support to farmers coop-
eratives in Mali is channeled through the regional Chambres d’Agriculture, which insist on the existence of cooperative
unions. Many cooperatives are thus opportunistically created. With its strong focus on economic viable agribusiness
development, the CASE approach is better equipped to deal with this given than DERK.
Other approaches do not fundamentally challenge the CASE approach. Rather, the CASE approach is inspir-
ing to others. The effectiveness of CASE can be further improved if the understanding of the approach would be
broadened, which can be quite easily brought about: CASE training, sharing of AB cluster results and experiences,
outscaling within farmers platforms and federations, feedback to and uptake by stakeholder groups represented in
national steering committees, etc.
2 For the methodology used for the survey, please refer to Annex 2
| 21
Î In conclusion, the CASE approach is widely considered as a relevant and effective instrument to promote
commodity value chain development. There is no need to fundamentally alter the concept. Promoters of the
approach can of course continue seeking inspiration from economic theories and development approaches
and learn from other projects working in the realm of agribusiness development. There is a need to further
extend the knowledge about the approach, which is still confined to those directly involved in project facili-
tated cluster development processes. There is great potential for out scaling within farmer unions and federa-
tions. Considering its relevance for addressing challenges for sustainable agricultural development in Africa,
the real challenge lies in making the approach to work, in all its virtues, as explored in the rest of this report.
1 .2 cLuSTEr AcTor coLLAborATion
Stakeholder collaboration in so-called agribusiness clusters is the operational feature of the CASE approach. There-
fore, we address this aspect in this section, before going into the modalities for implementation and the results
achieved by the 1000s+ project in the following chapters.
Section 1.1 established that the CASE approach is a relevant and innovative approach. Stories of ABC actors indi-
cate that the coaching of agribusiness cluster formation, for instance with the ‘cluster mapping tool’, has provided
a lot of insights to local entrepreneurs. Producers realize that they cannot successfully operate in isolation; they
need others to enhance their business. Local actors are increasingly aware of ‘missing actors’ in their local market
system.
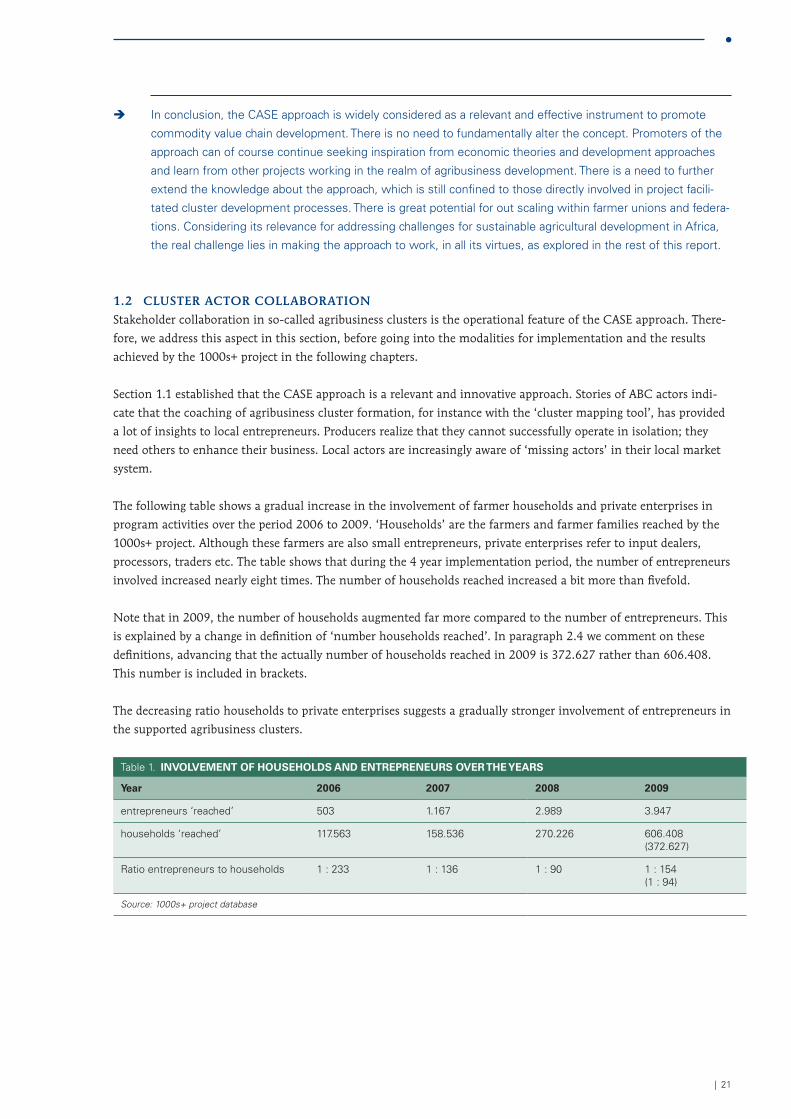
The following table shows a gradual increase in the involvement of farmer households and private enterprises in
program activities over the period 2006 to 2009. ‘Households’ are the farmers and farmer families reached by the
1000s+ project. Although these farmers are also small entrepreneurs, private enterprises refer to input dealers,
processors, traders etc. The table shows that during the 4 year implementation period, the number of entrepreneurs
involved increased nearly eight times. The number of households reached increased a bit more than fivefold.
Note that in 2009, the number of households augmented far more compared to the number of entrepreneurs. This
is explained by a change in definition of ‘number households reached’. In paragraph 2.4 we comment on these
definitions, advancing that the actually number of households reached in 2009 is 372.627 rather than 606.408.
This number is included in brackets.
The decreasing ratio households to private enterprises suggests a gradually stronger involvement of entrepreneurs in
the supported agribusiness clusters.
Table 1. iNvolvemeNT oF houSeholDS aND eNTrePreNeurS over The yearS
year 2006 2007 2008 2009
entrepreneurs ‘reached’ 503 1.167 2.989 3.947
households ‘reached’ 117.563 158.536 270.226 606.408 (372.627)
Ratio entrepreneurs to households 1 : 233 1 : 136 1 : 90 1 : 154 (1 : 94)
Source: 1000s+ project database
22 | SAADA Evaluation 2006-2009
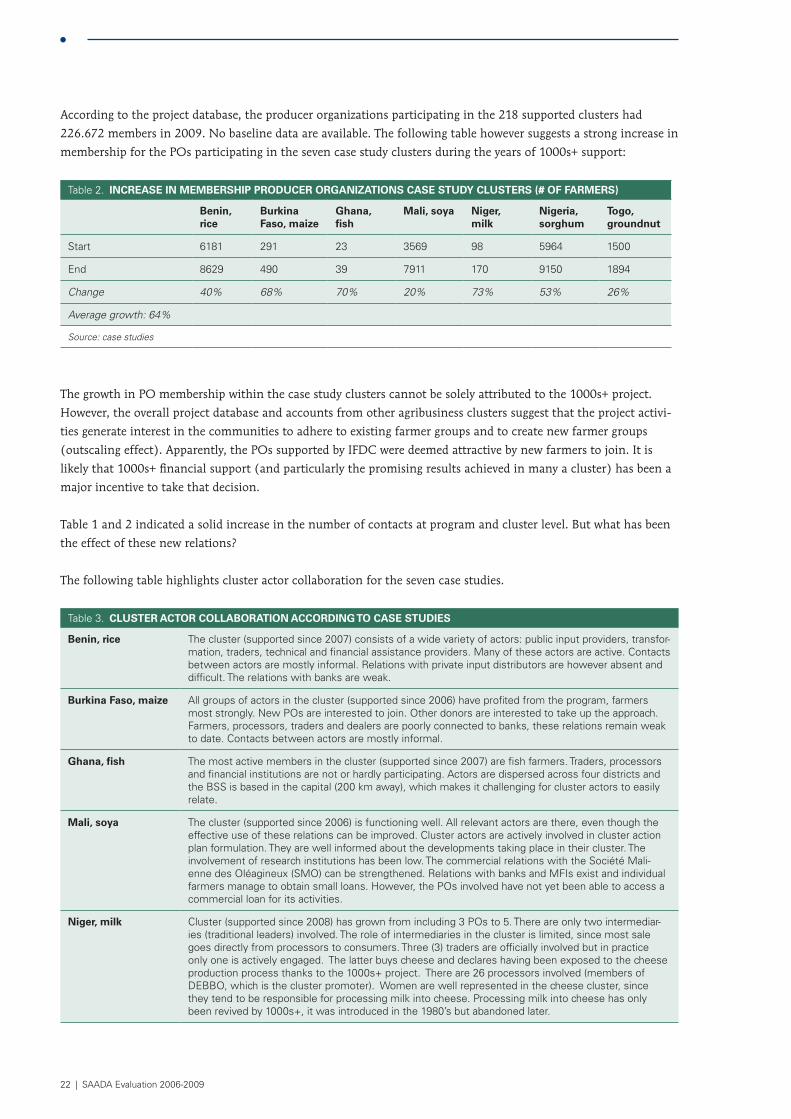
According to the project database, the producer organizations participating in the 218 supported clusters had
226.672 members in 2009. No baseline data are available. The following table however suggests a strong increase in
membership for the POs participating in the seven case study clusters during the years of 1000s+ support:
Table 2. iNCreaSe iN memberShiP ProDuCer orgaNizaTioNS CaSe STuDy CluSTerS (# oF FarmerS)
benin, rice
burkina Faso, maize
ghana, fish
mali, soya Niger, milk
Nigeria, sorghum
Togo, groundnut
Start 6181 291 23 3569 98 5964 1500
End 8629 490 39 7911 170 9150 1894
Change 40% 68% 70% 20% 73% 53% 26%
Average growth: 64%
Source: case studies
The growth in PO membership within the case study clusters cannot be solely attributed to the 1000s+ project.
However, the overall project database and accounts from other agribusiness clusters suggest that the project activi-
ties generate interest in the communities to adhere to existing farmer groups and to create new farmer groups
(outscaling effect). Apparently, the POs supported by IFDC were deemed attractive by new farmers to join. It is
likely that 1000s+ financial support (and particularly the promising results achieved in many a cluster) has been a
major incentive to take that decision.
Table 1 and 2 indicated a solid increase in the number of contacts at program and cluster level. But what has been
the effect of these new relations?
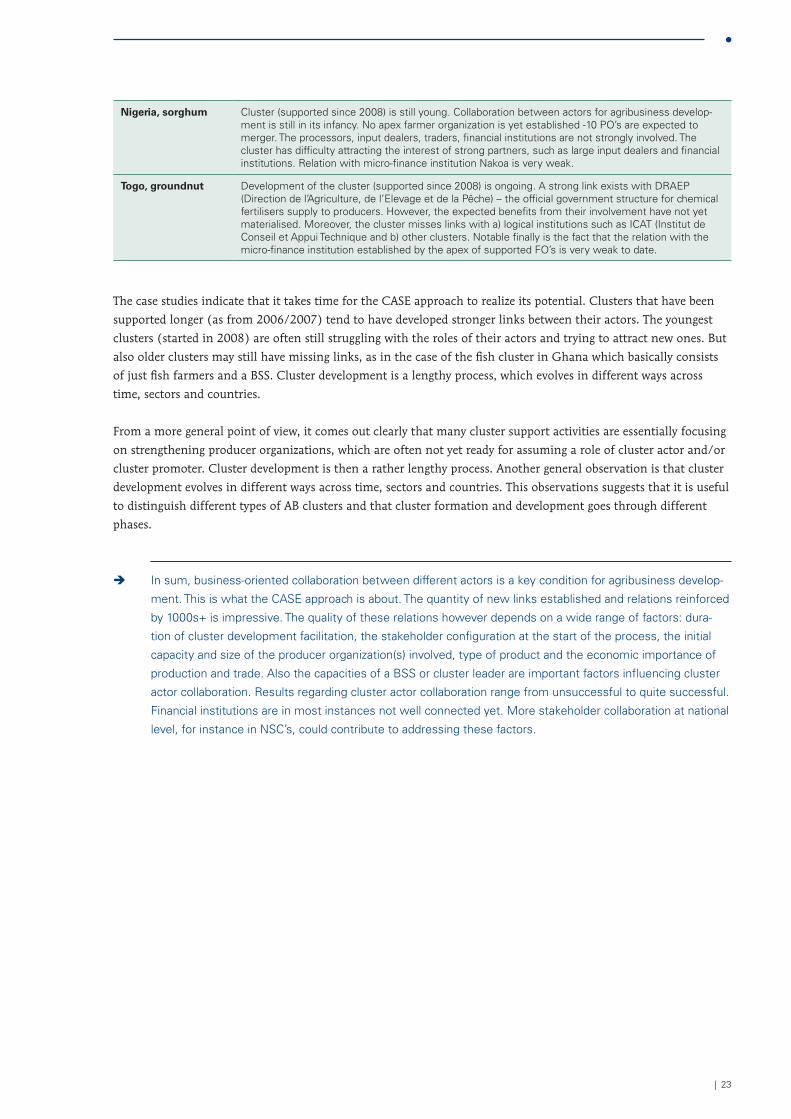
The following table highlights cluster actor collaboration for the seven case studies.
Table 3. CluSTer aCTor CollaboraTioN aCCorDiNg To CaSe STuDieS
benin, rice The cluster (supported since 2007) consists of a wide variety of actors: public input providers, transfor-mation, traders, technical and financial assistance providers. Many of these actors are active. Contacts between actors are mostly informal. Relations with private input distributors are however absent and difficult. The relations with banks are weak.
burkina Faso, maize All groups of actors in the cluster (supported since 2006) have profited from the program, farmers most strongly. New POs are interested to join. Other donors are interested to take up the approach. Farmers, processors, traders and dealers are poorly connected to banks, these relations remain weak to date. Contacts between actors are mostly informal.
ghana, fish The most active members in the cluster (supported since 2007) are fish farmers. Traders, processors and financial institutions are not or hardly participating. Actors are dispersed across four districts and the BSS is based in the capital (200 km away), which makes it challenging for cluster actors to easily relate.
mali, soya The cluster (supported since 2006) is functioning well. All relevant actors are there, even though the effective use of these relations can be improved. Cluster actors are actively involved in cluster action plan formulation. They are well informed about the developments taking place in their cluster. The involvement of research institutions has been low. The commercial relations with the Société Mali-enne des Oléagineux (SMO) can be strengthened. Relations with banks and MFIs exist and individual farmers manage to obtain small loans. However, the POs involved have not yet been able to access a commercial loan for its activities.
Niger, milk Cluster (supported since 2008) has grown from including 3 POs to 5. There are only two intermediar-ies (traditional leaders) involved. The role of intermediaries in the cluster is limited, since most sale goes directly from processors to consumers. Three (3) traders are officially involved but in practice only one is actively engaged. The latter buys cheese and declares having been exposed to the cheese production process thanks to the 1000s+ project. There are 26 processors involved (members of DEBBO, which is the cluster promoter). Women are well represented in the cheese cluster, since they tend to be responsible for processing milk into cheese. Processing milk into cheese has only been revived by 1000s+, it was introduced in the 1980’s but abandoned later.
| 23
Nigeria, sorghum Cluster (supported since 2008) is still young. Collaboration between actors for agribusiness develop-ment is still in its infancy. No apex farmer organization is yet established -10 PO’s are expected to merger. The processors, input dealers, traders, financial institutions are not strongly involved. The cluster has difficulty attracting the interest of strong partners, such as large input dealers and financial institutions. Relation with micro-finance institution Nakoa is very weak.
Togo, groundnut Development of the cluster (supported since 2008) is ongoing. A strong link exists with DRAEP (Direction de l’Agriculture, de l’Elevage et de la Pêche) – the official government structure for chemical fertilisers supply to producers. However, the expected benefits from their involvement have not yet materialised. Moreover, the cluster misses links with a) logical institutions such as ICAT (Institut de Conseil et Appui Technique and b) other clusters. Notable finally is the fact that the relation with the micro-finance institution established by the apex of supported FO’s is very weak to date.
The case studies indicate that it takes time for the CASE approach to realize its potential. Clusters that have been
supported longer (as from 2006/2007) tend to have developed stronger links between their actors. The youngest
clusters (started in 2008) are often still struggling with the roles of their actors and trying to attract new ones. But
also older clusters may still have missing links, as in the case of the fish cluster in Ghana which basically consists
of just fish farmers and a BSS. Cluster development is a lengthy process, which evolves in different ways across
time, sectors and countries.
From a more general point of view, it comes out clearly that many cluster support activities are essentially focusing
on strengthening producer organizations, which are often not yet ready for assuming a role of cluster actor and/or
cluster promoter. Cluster development is then a rather lengthy process. Another general observation is that cluster
development evolves in different ways across time, sectors and countries. This observations suggests that it is useful
to distinguish different types of AB clusters and that cluster formation and development goes through different
phases.
Î In sum, business-oriented collaboration between different actors is a key condition for agribusiness develop-
ment. This is what the CASE approach is about. The quantity of new links established and relations reinforced
by 1000s+ is impressive. The quality of these relations however depends on a wide range of factors: dura-
tion of cluster development facilitation, the stakeholder configuration at the start of the process, the initial
capacity and size of the producer organization(s) involved, type of product and the economic importance of
production and trade. Also the capacities of a BSS or cluster leader are important factors influencing cluster
actor collaboration. Results regarding cluster actor collaboration range from unsuccessful to quite successful.
Financial institutions are in most instances not well connected yet. More stakeholder collaboration at national
level, for instance in NSC’s, could contribute to addressing these factors.

24 | SAADA Evaluation 2006-2009
| 25
2 . programme set-up
Are the institutional arrangements conducive for effective implementation of the program?
inTroDucTion
The evaluation question that underpins this chapter has mainly been addressed at the national level. That is to
say that the main research methods used to answer this question concern desk study, interviews with IFDC staff
(regional and national), members of national steering committees and apex farmer associations and the national-
level survey and workshop. At cluster level, people tend to be little informed about the organizational implementa-
tion structure of the program, although they have their opinion about specific aspects such as cluster action plan
formulation. Where relevant, we provide feedback from cluster actors about these issues.
The outcomes of the national-level survey for this chapter well represent the overall opinions encountered. The
organizational set-up of 1000s+ is generally appreciated (average scores). What the survey shows is that according
to respondents:
• IFDC is well capable to fulfill its tasks within the SAADA program;
• The 1000s+ project is very effective in supporting the development of cluster action plans;
• Cluster selection is being done on an objective basis;
• Funding sources for the SAADA program are considered not sufficient;
• The number of CASE trainers is not sufficient;
• Women participation in the clusters is sufficiently promoted by the SAADA/1000s+ project;
• Women participation in National Steering Committees is low;
• Lessons learnt are incorporated and contributing to an improving program set-up
In this chapter we explore the various aspects of the 1000s+ organization.
2 .1 funDing ArrAngEmEnTS
2 .1 .1 funding and co-funding
In December 2005, the Ministry of Foreign Affairs (DGIS) awarded a grant of €16 million to IFDC to imple-
ment SAADA A, B, C during a five year period from 2006 to end 2010. An amount of €10 million was reserved for
SAADA A.
At the time of signing of the SAADA agreement, IFDC committed itself to mobilizing €15 million as co-funding for
SAADA A and at least €1 million as co-funding for SAADA B & C to match the €16 million provided by DGIS. In
the grant proposal submitted to DGIS in October 2005, IFDC lists AgriCord, USAID, MISTOWA and the Interna-
tional Fertilizer Association (IFA) as major donors expected to together contribute about €13 million. These envis-
aged co-funders were not involved in program formulation and approached after approval by DGIS of the SALIN
grant proposal.
Further to the co-financing by other donors, an in-kind contribution of nearly €2 million was expected to be pro-
vided by producer organizations and other program beneficiaries to training events and cluster-building activities.
The program activity budget attached to the grant proposal concerned the €16 million DGIS contribution. Given
the SALIN requirement of 100% co-funding, the evaluation team would have expected a program activity budget of
26 | SAADA Evaluation 2006-2009
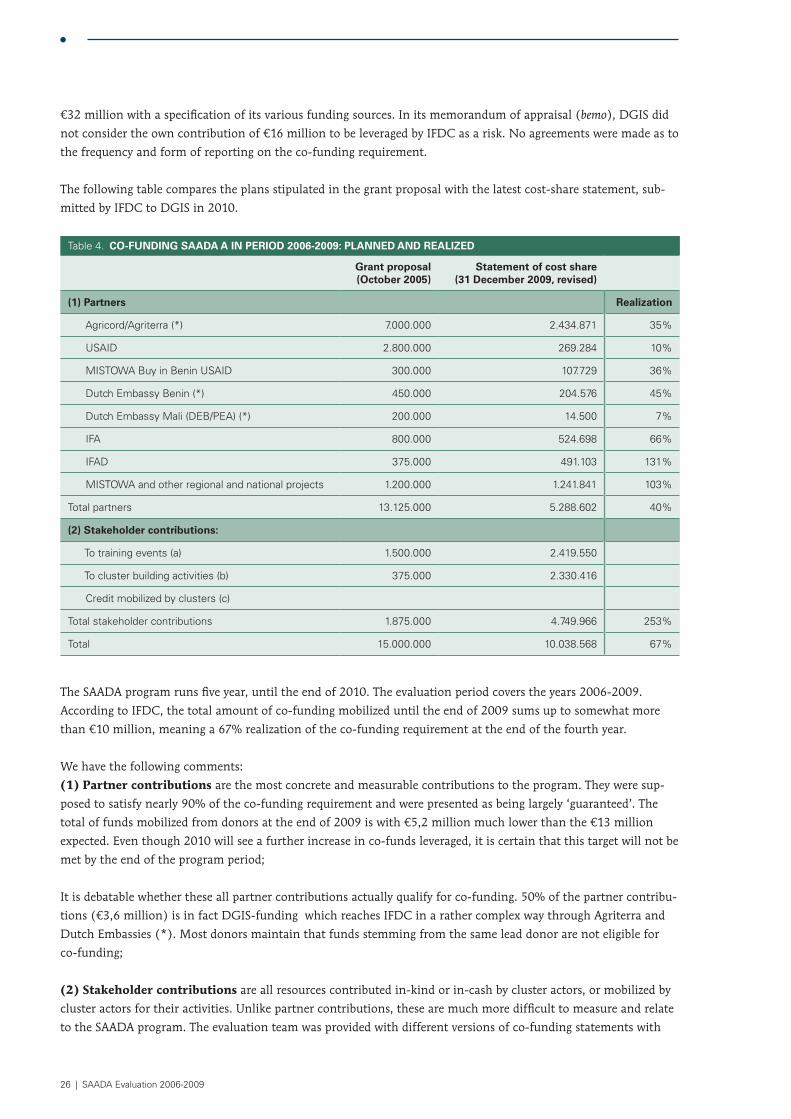
€32 million with a specification of its various funding sources. In its memorandum of appraisal (bemo), DGIS did
not consider the own contribution of €16 million to be leveraged by IFDC as a risk. No agreements were made as to
the frequency and form of reporting on the co-funding requirement.
The following table compares the plans stipulated in the grant proposal with the latest cost-share statement, sub-
mitted by IFDC to DGIS in 2010.
Table 4. Co-FuNDiNg SaaDa a iN PerioD 2006-2009: PlaNNeD aND realizeD
grant proposal (october 2005)
Statement of cost share (31 December 2009, revised)
(1) Partners realization
Agricord/Agriterra (*) 7.000.000 2.434.871 35%
USAID 2.800.000 269.284 10%
MISTOWA Buy in Benin USAID 300.000 107.729 36%
Dutch Embassy Benin (*) 450.000 204.576 45%
Dutch Embassy Mali (DEB/PEA) (*) 200.000 14.500 7%
IFA 800.000 524.698 66%
IFAD 375.000 491.103 131%
MISTOWA and other regional and national projects 1.200.000 1.241.841 103%
Total partners 13.125.000 5.288.602 40%
(2) Stakeholder contributions:
To training events (a) 1.500.000 2.419.550
To cluster building activities (b) 375.000 2.330.416
Credit mobilized by clusters (c)
Total stakeholder contributions 1.875.000 4.749.966 253%
Total 15.000.000 10.038.568 67%
The SAADA program runs five year, until the end of 2010. The evaluation period covers the years 2006-2009.
According to IFDC, the total amount of co-funding mobilized until the end of 2009 sums up to somewhat more
than €10 million, meaning a 67% realization of the co-funding requirement at the end of the fourth year.
We have the following comments:
(1) Partner contributions are the most concrete and measurable contributions to the program. They were sup-
posed to satisfy nearly 90% of the co-funding requirement and were presented as being largely ‘guaranteed’. The
total of funds mobilized from donors at the end of 2009 is with €5,2 million much lower than the €13 million
expected. Even though 2010 will see a further increase in co-funds leveraged, it is certain that this target will not be
met by the end of the program period;
It is debatable whether these all partner contributions actually qualify for co-funding. 50% of the partner contribu-
tions (€3,6 million) is in fact DGIS-funding which reaches IFDC in a rather complex way through Agriterra and
Dutch Embassies (*). Most donors maintain that funds stemming from the same lead donor are not eligible for
co-funding;
(2) Stakeholder contributions are all resources contributed in-kind or in-cash by cluster actors, or mobilized by
cluster actors for their activities. Unlike partner contributions, these are much more difficult to measure and relate
to the SAADA program. The evaluation team was provided with different versions of co-funding statements with
| 27
widely varying amounts of realized co-funding. Particularly the height of reported stakeholder contributions varies
largely, depending on the definition used.
(2a) ‘Stakeholder contributions to training events’ has been calculated by multiplying the number of training
man-days in the period 2007-2009 (1.209.775) by two, following the assumption that participants contribute €2
in kind per day training. According to the evaluation team, this assumption cannot be substantiated:
Although occasionally some in-kind support is provided, such as free provision of the training location, individual
participants do not contribute in cash. On the contrary, the costs for training – including meals, transport and
accommodation – are fully covered by IFDC, both for participants and trainers. In Koubry (Burkina Faso), a maize
cooperative is building its office, among others on the savings trainees realize on their per diems. According to most
AB cluster advisors and cluster actors, it is not easy to have cluster actors participating in the cost of trainings;
financial means are in most case limited and – more importantly – it is not the culture
(2b) ‘Stakeholder contribution to cluster building activities’ refers to donor funding mobilized by stakehold-
ers in clusters. For this category it is difficult to establish whether it covers the funding of the cluster action plans
(see chapter 4) which would imply indeed co-funding, or whether it includes additional / different activities by
other donors in the same areas where IFDC is intervening;
(2c). ‘Credit mobilized by clusters’. IFDC monitors one other form of resource mobilization, namely resources
leveraged by SAADA stakeholders at cluster level from rural banks and other financial institutions. Unlike 2b,
which concern grants, these concern loans. The amount sums up to €8.692.072. Originally, IFDC included 50% of
this amount in the cost share statement. Early 2010, DGIS however objected to this, claiming that credit mobilized
at cluster level should be considered as spin-off for beneficiaries rather than funding available for program activi-
ties. Consequently, IFDC has removed ‘credit mobilized’ from the co-funding statement. Credit mobilized at cluster
level is further discussed in section 4.2 below.
Î Summarizing the findings regarding the program’s funding arrangements, it is found that the SALIN co-fund-
ing requirement of 100% will not be met. The extent to which this requirement is not satisfied depends on
the definition of co-funding used:
− Following IFDC’s line of argumentation, we establish that 67% of the objective has been met with one
more year of implementation to go. By the end of 2010, a realization of 70-75% of the objective may then
be expected;
− When adopting a formalistic view, it is found that funds indirectly coming from DGIS and contributions by
stakeholders that cannot be substantiated should not be advanced as co-funding. A realization of 20% by
the end of 2010 is more realistic; which would be a poor performance.
In any case, it is concluded that IFDCs intention to levy €16 million of co-funding has been too ambitious and
was not supported by a proper resource mobilization strategy.
2 .1 .2 Agriterra and roppA
In 2006, IFDC and ROPPA approached Agriterra with the request to step in with co-financing of the SAADA pro-
gram. The missions and orientations of the three parties were deemed complementary:
• agricultural intensification, smart fertilizer technology and use, input market
development and market-oriented agricultural development (IFDC)
28 | SAADA Evaluation 2006-2009
• advocating interests of small family farmers, influencing policies at regional and international
level, representation at national level through national farmers’ platforms (ROPPA)
• involvement, capacity strengthening and funding of farmers’ organizations (Agriterra )
Even though all parties were interested, discussions between IFDC, ROPPA and Agriterra proved difficult. When
discussing financial contributions and budget use, the differences between the three parties were further accentu-
ated. It took three years before the tripartite collaboration agreement was signed (Sept. 2008), according to which
Agriterra would contribute €6,5 million to the program. The collaboration agreement indicated joint considera-
tions, agreements on project innovations and priorities and stipulated various services to be delivered by Agriterra.
During implementation, we note that the financial objective (Agriterra as donor) overtook the co-execution objec-
tive (Agriterra as a provider of PO capacity strengthening services). While Agriterra and ROPPA achieved various
results, such as the foundation of the national apex farmer platform in Ghana and positioning CNIEP’s within
national farmers’ federations (mandated PO’s), several activities foreseen in the tripartite agreement were not
realized, such as making an inventory of business service providers, the mapping of producers’ organizations and
studying the feasibility of a support fund for agribusiness clusters. It appears that fund transfer and management
and reporting required a lot of Agriterra’s and ROPPA’s energy and resources. The co-funding objective however
proved difficult too. By the end of 2009, Agriterra was forced to withdraw its support, leaving IFDC with a budget
deficit of €4 million. This gap limited the extension of AB clusters and limited the intensity of support the clusters.
From DGIS funds, IFDC (to an important extent) managed to keep the recently recruited CNIEPs on board.
All problems notwithstanding, IFDC, Agriterra and ROPPA, together composing the Regional Advisory Committee,
are coming closer. IFDC has adopted the farmer-led CASE approach and has made a lot of efforts to involve farm-
ers’ organizations (inclusive meetings, partial repair of Agriterra budget gap, training of PO staff and farmers, ….).
As a result, IFDC knows the farmers’ movements of the seven countries much better. The latter increasingly appre-
ciate the work of IFDC (cf. survey results). Agriterra and ROPPA are increasingly interested in the economic services
PO’s can provide to their members, understand the CASE approach and have seen field level activities and results.
Î Although it took long, it can be asserted that a sufficient basis for fruitful collaboration between IFDC, Agri-
terra and ROPPA has been created. Co-funding requirements for the SAADA program and the dual roles of
Agriterra and ROPPA have unnecessarily complicated matters. Collaboration could have been more fruitful
if the budget mobilization question would have been addressed already in the formulation of the SAADA
program. Agreements could then have been made about one reporting line and collaboration could have been
focused more on the advisory role of Agriterra, and the information sharing and representative policy devel-
opment role of ROPPA.
2 .2 progrAm impLEmEnTErS: cApAciTiES AnD rELATionS
2 .2 .1 ifDc
IFDC is the coordinator of the SAADA program. IFDC’s competitive edge, especially through its innovative CASE
approach, is in linking input and output markets. It is an ‘American style’ program implementer: good marketing
of new program ideas, ambitious goals and hard-working staff. Stakeholders, as results from the survey and has
been confirmed in interviews and workshops, perceive IFDC as a professional organization which they strongly
appreciate. In the past years, IFDC has invested a lot in its relations with farmer organizations and other actors.
It has produced detailed guidelines and manuals to facilitate implementation, while attempting to keep reporting
lines and procedures short. Staff members are of high quality and motivated; internal reflections are at a high level.
IFDC disposes of a regional team of professionals combined with AB cluster advisors in each program country.
| 29
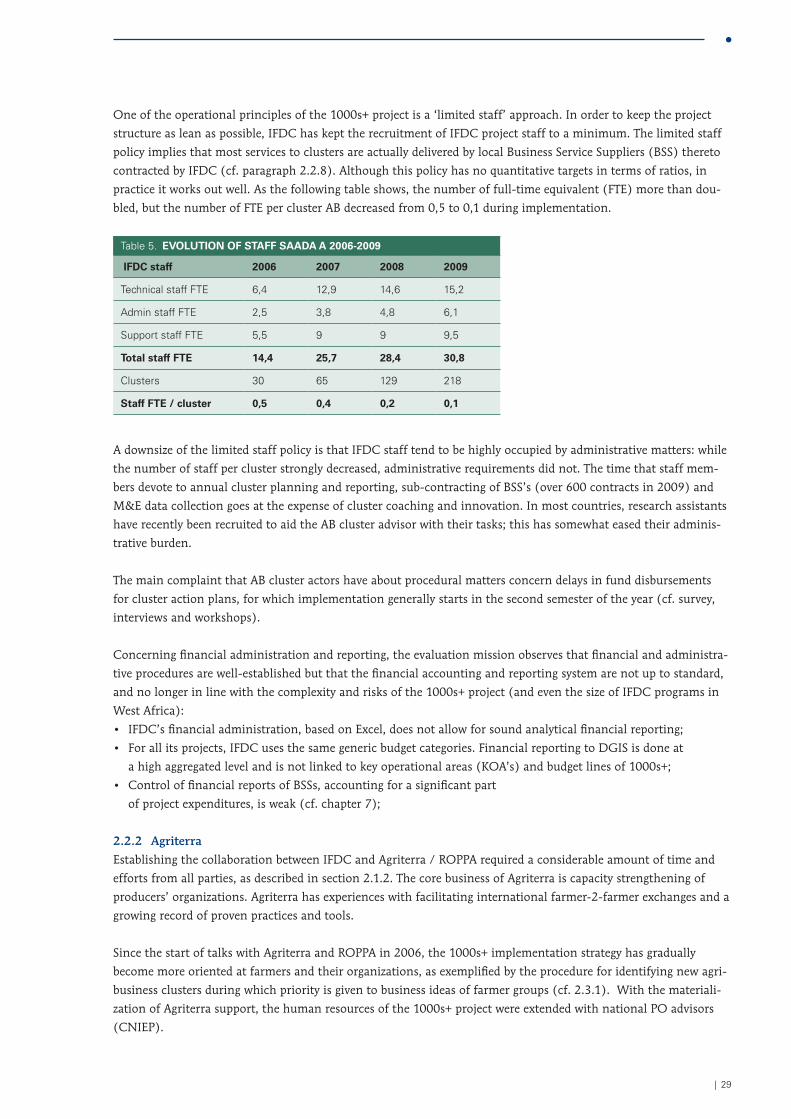
One of the operational principles of the 1000s+ project is a ‘limited staff’ approach. In order to keep the project
structure as lean as possible, IFDC has kept the recruitment of IFDC project staff to a minimum. The limited staff
policy implies that most services to clusters are actually delivered by local Business Service Suppliers (BSS) thereto
contracted by IFDC (cf. paragraph 2.2.8). Although this policy has no quantitative targets in terms of ratios, in
practice it works out well. As the following table shows, the number of full-time equivalent (FTE) more than dou-
bled, but the number of FTE per cluster AB decreased from 0,5 to 0,1 during implementation.
Table 5. evoluTioN oF STaFF SaaDa a 2006-2009
iFDC staff 2006 2007 2008 2009
Technical staff FTE 6,4 12,9 14,6 15,2
Admin staff FTE 2,5 3,8 4,8 6,1
Support staff FTE 5,5 9 9 9,5
Total staff FTe 14,4 25,7 28,4 30,8
Clusters 30 65 129 218
Staff FTe / cluster 0,5 0,4 0,2 0,1
A downsize of the limited staff policy is that IFDC staff tend to be highly occupied by administrative matters: while
the number of staff per cluster strongly decreased, administrative requirements did not. The time that staff mem-
bers devote to annual cluster planning and reporting, sub-contracting of BSS’s (over 600 contracts in 2009) and
M&E data collection goes at the expense of cluster coaching and innovation. In most countries, research assistants
have recently been recruited to aid the AB cluster advisor with their tasks; this has somewhat eased their adminis-
trative burden.
The main complaint that AB cluster actors have about procedural matters concern delays in fund disbursements
for cluster action plans, for which implementation generally starts in the second semester of the year (cf. survey,
interviews and workshops).
Concerning financial administration and reporting, the evaluation mission observes that financial and administra-
tive procedures are well-established but that the financial accounting and reporting system are not up to standard,
and no longer in line with the complexity and risks of the 1000s+ project (and even the size of IFDC programs in
West Africa):
• IFDC’s financial administration, based on Excel, does not allow for sound analytical financial reporting;
• For all its projects, IFDC uses the same generic budget categories. Financial reporting to DGIS is done at
a high aggregated level and is not linked to key operational areas (KOA’s) and budget lines of 1000s+;
• Control of financial reports of BSSs, accounting for a significant part
of project expenditures, is weak (cf. chapter 7);
2 .2 .2 Agriterra
Establishing the collaboration between IFDC and Agriterra / ROPPA required a considerable amount of time and
efforts from all parties, as described in section 2.1.2. The core business of Agriterra is capacity strengthening of
producers’ organizations. Agriterra has experiences with facilitating international farmer-2-farmer exchanges and a
growing record of proven practices and tools.
Since the start of talks with Agriterra and ROPPA in 2006, the 1000s+ implementation strategy has gradually
become more oriented at farmers and their organizations, as exemplified by the procedure for identifying new agri-
business clusters during which priority is given to business ideas of farmer groups (cf. 2.3.1). With the materiali-
zation of Agriterra support, the human resources of the 1000s+ project were extended with national PO advisors
(CNIEP).
30 | SAADA Evaluation 2006-2009
Agriterra has formulated three programs in support of 1000s+, of which two transit via IFDC. The third program is
concluded with ROPPA. It supports the role of ROPPA and national farmers’ platforms and pays for the costs of the
PO advisors. Collaboration between cluster advisors of IFDC and PO Advisors has been working quite well, albeit
there are different ways of doing so in the different countries. In operational terms, Agriterra has been strongly
focusing on financial and administrative matters. As a ‘donor’, Agriterra was not able to realize the co-funding as
foreseen in the tripartite agreement. The financial contribution of Agriterra was interrupted by the end of 2009
because of insufficient funding for its 2007-2010 Farmers Fighting Poverty Program. This unexpected shortage of
agreed co-funding necessitated IFDC to take drastic measures in 2010, such as reducing the funds available for
cluster action plans by 50% and findings ways to remain paying the CNIEPs from own means. The funds that Agri-
terra eventually contributed to SAADA A amounted to 2,4 million Euro, 65% less than the planned 7 million.
2 .2 .3 roppA
The network of Farmers’ Organizations and Producers in West Africa (Réseau des Organisations Paysannes et des
Producteurs Agricoles de l’Afrique de l’Ouest or ROPPA) was founded in 2000. In the context of the 1000s+ project,
ROPPA is the lead partner of Agriterra. The reports of PO Advisors (CNIEPs) transit via ROPPA to Agriterra.
ROPPA’s membership is composed of national farmers’ platforms.
ROPPA aims to create united National Farmers’ Platforms in 16 West African Countries. The idea is that per coun-
try only one platform is ROPPA member, representing all farmers organizations in the country. The objectives of
ROPPA are to defend farmers’ interests in West Africa, to initiate and support the farmers’ platforms at national
level (member organizations), and to represent its members at regional and international level.
In six out of seven countries, the National Farmers’ Platforms are members of ROPPA. Nigeria is an exception,
see textbox.
Box 2 The all FarmerS aSSoCiaTioN oF Nigeria (aFaN) is a large, federal organization representing the
farmer organizations in all 36 states of Nigeria. AFAN is not a member of ROPPA. The Nigerian organization is larger
than ROPPA and differently structured. It is organized on the basis of 26 commodity associations and it is member
of various regional professional bodies other than ROPPA. AFAN is not willing to abide by the requirements that
ROPPA poses to its members. Membership on short term is therefore not likely.
According to a recent evaluation study3, ROPPA has effectively contributed to the emergence of a stronger and
more visible West-African farmers’ movement and has effectively influenced regional policies in the interest of its
members. At the same time, ROPPA is internally relatively weakly organized and not strong in providing and moni-
toring strategies support to its members. ROPPA recognizes these operational weaknesses, following an audit it had
conducted.
ROPPA shows a profound understanding of the CASE approach and cluster activities on the ground. It has a track
record in voicing small farmers’ interests internationally. However, the evaluation team notes that ROPPA has
assumed a role of primarily (critically) following the evolution of the SAADA/1000s+ program. It has not really
made operational contributions to the realization of the program’s goals and objectives, such as for instance capi-
talization and sharing of cluster experiences and the uptake of constraints for lobby and advocacy activities.
3 Rapport Final Mission d’Évaluation Externe ‘Programme de Renforcement des Capacités et des Actions du Réseau des Organisations Paysannes et des
Producteurs Agricoles 2000-2008 (ROPPA) ‘, 2009.
| 31
2 .2 .4 regional Advisory committee
The Regional Advisory Committee (RAC) was established by the tripartite agreement between IFDC, ROPPA and
Agriterra in September 2008. Originally called Regional Steering Committee, its name was shortly afterwards
changed to emphasize the CASE and 1000s+ orientation at national and grass-root level. The RAC is chaired by
ROPPA and has IFDC and Agriterra as participating members and DGIS as observing member. Since 2008, the
RAC has met three times, during which mainly project implementation modalities and administrative matters were
discussed, rather than strategic issues. The meetings have however contributed to increased mutual understanding.
2 .2 .5 national Steering committees
The main tasks of the National Steering Committee (NSC) are to guide and monitor the 1000s+ project activities
at national level. The National Steering Committee’s objective is to promote the CASE approach within the institu-
tions of its members, contribute to the mobilization of business ideas and the selection of new AB clusters, and
the monitoring of activities. The NSC is supposed to reflect the stakeholder configurations that are necessary at the
local level. Membership is in principle composed of representatives of the national farmers’ platform, the man-
dated PO, the agri-input sector, the private sector (traders and processors), the Government (most often Ministry
of Agriculture), NGO’s and BSSs, and of research and higher education institutes.
The process leading to the establishment of the NSCs, the composition and functioning of the NSC’s varies per
country:
Box 3 DyNamiCS iN NaTioNal STeeriNg CommiTTeeS. In Ghana, early 2009, conflicts occurred in the NSC on
interests, leadership, financial issues. The situation was managed by the reinstitution of the Chairman and the re-
placement of the PO Advisor (NAFEI) in the mandated farmer organization. The steering committee is now structur-
ally referred to as the “Farmer-led National Steering Committee”.
In Mali, the NSC only became operational early 2009. For years, CNOP and AOPP could not come to an agreement
on the division of tasks and responsibilities. Field visits and recent CASE training of NSC members have had an
important positive effects.
In Burkina Faso, the NSC has been operational as from 2006-7. The IFDC agribusiness advisor has played an impor-
tant facilitating role. At the farmers’ side, FEPA-B (mandated PO) takes the lead. The role of the platform (CPF) is not
very clear. There are no tensions like in Mali because the FEPA-B president is also the CPF president.
In Niger, the Farmers’ Platform dominates the NSC. Some other groups actively participate as well, but the private
sector (input dealers, traders, processors) is largely absent.
In Nigeria, the National Farmer Platform AFAN became a member of the NSC in 1998, upon request by Agriterra.
AFAN is the only farmer organization in the NSC and provides the vice president. The commitment of the Nigerian
NSC members to 1000s+ is reportedly very high.
In Togo, the NSC is effectively playing its role since 2007. In Benin, this is the case since 2008. In both countries,
farmer organizations (members of the National Farmers’ Platforms) are well represented as compared to other
stakeholders. In Togo, a consumers’ and a processing association is member of the NSC.
On the basis of interviews, survey and validation workshops, the evaluation team establishes that the role of NSC
representatives is mainly limited to NSC meetings and the monitoring of AB clusters. In most countries, not all
actor groups are represented and/or actively participating. There are several cases of NSC members that are called
to other duties and are not replaced by their organization or stakeholder group. National farmers’ platforms gener-
ally assume presidency well. The IFDC AB advisor and CNIEP generally participate as advisors in NSC team meet-
ings and in NSC field visits. In the NSC, decisions are usually taken by consensus. The agenda follows the logic of
the annual plan of SAADA A. The NSC mainly approves cluster action plans and monitors cluster activities (reports
of cluster activities reach the NSC via the Cluster Advisor). Normally there are quarterly meetings of the NSCs
32 | SAADA Evaluation 2006-2009
but in general not all members participate (sometimes only 50% of the members participate). NSC members are
supposed to give feedback to the institutions and stakeholder groups they represent. This is however not organized
systematically but left to the discretion of its members. In actual practice, feedback varies from non-existent to
extensive briefings.
Women are underrepresented in the NSCs. Only 11% of the NSC members are female. In Benin, the NSC has no
female members at all. Nigeria and Mali score relatively high with 18% female members. Stakeholders find this a
matter of concern, according to the survey.
The functioning of the national steering committees could improve and that their roles could evolve. Attention to
the policy and business environment is a major role of the NSC’s that could be further strengthened.
2 .2 .6 cASE coaches and trainers
Looking back at the strategies for developing a critical mass for the promotion of the CASE approach, the evalua-
tion team finds that these have been (too) many and parallel, which, taken individually, have not yet lived up to
the expectations.
Initially, the project strategy focused on creating so-called National Capacity Strengthening Teams (NCST). The
basic idea was to have a core of resource persons per country that were intensively trained in participatory multi-
stakeholder processes towards agricultural development. These persons would spread the CASE approach not
only in their respective organizations but also within their broader professional networks and amongst BSSs to be
contracted for 1000s+ project implementation. The International Centre for development oriented Research in
Agriculture (ICRA) was contracted by IFDC to realize the trainings.
In 2006, a first team of 13 people from Benin and Mali, of which 3 women, was sent to the Netherlands to become
trained by ICRA. A second team of 6 people, all men, visited ICRA in 2007. The members trained in 2006 had left
to other jobs. A third team of 10 persons, of which 3 women, was then sent to ICRA in 2008. The idea was that
by training members of IFDC partner organizations in CASE strategy and in CASE training, these persons would
spread the CASE philosophy not only in their own organization but also within their broader professional networks
and amongst BSS in SAADA. The trainings, which were quite costly, have resulted in 4 NCST teams (Benin, Burkina
Faso, Ghana and Mali).
Because there were no specific selection criteria, the trained persons were not always effective in training and influ-
encing. Some were too senior in the organization and therefore too busy to dedicate time to training while oth-
ers were too young and did not have sufficient influence or the right skills or attitude to be a trainer. Quite some
trained persons have left to other jobs and did not take up the envisaged transfer role.
Learning from the experiences, IFDC decided to train 35 resource persons (of which 8 women) in the CASE
approach (Sagakope, Ghana, Sept. 2009). Additionally, ICRA organized courses in the Netherlands on CASE
facilitation for 11 selected NSCT team members (often people attached to universities or other education-related
organizations) and for 4 new members.
The people trained by ICRA Netherlands are referred to as Agribusiness coaches whereas the people trained by IFDC
in Ghana are referred to as CASE trainers. There is some confusion on these qualifications and the roles that are to
be assumed. Are CASE trainers to become members of the NCSTs or not? In most cases, the organizations of which
the CASE coaches and trainers are part, are partnered with IFDC and provide training services to IFDC.
To sum up, we find that by the end of 2009 a core group of people knowing the CASE approach has been created,
both through formal training of CASE coaches and CASE trainers and informal training at cluster level and within
| 33
NSC’s. A critical mass for CASE promotion has been created. For the coming years, it is important to double efforts
and to better define the role of different categories of CASE facilitators.
2 .2 .7 AiSSA network
During the final years of the ISFM project that preceded the 1000s+ project, IFDC prepared the AISSA platform and
invested in the elaboration of training modules. AISSA stands for Agricultural Intensification in Sub-Saharan Africa
and was envisaged as a pan-African platform of practitioners involved in IFDC related activities.
In 2004, a website was launched as leading AISSA instrument to stimulate exchange between BSSs involved in
the IFDC program. Initially, the website was mainly visited by scientists and extension specialists for exchanging
ideas. After a promising start, the site served a decreasing number of visitors and IFDC was too occupied with the
formulation and the start-up of the 1000s+ project to stimulate actively the exchange between the AISSA network
members. In relation to CASE and 1000s+, AISSA was supposed to become a learning platform for BSSs involved
in applying the CASE approach. The initiative to produce ‘Faces of AISSA’ (testimonies of cluster actors) was not
pursued.
Box 4. The Ghanaian BSS gaabiC visits the AISSA site “from time to time” to read news and articles posted. The
information is perceived as “refreshment on CASE, rather than something new”. No articles have been uploaded
by GAABIC as this was not yet possible until the end of 2009. In addition to the website, GAABIC exchanges with
other BSSs in Ghana during workshops, several times per year organized by IFDC. There is no structured exchange
between GAABIC and BSSs outside Ghana.
In the years after the launch of the website and the 1000s+ project, scientists and extension specialists became
less active and organizations involved group dynamics and marketing became relatively more active. In 2008, the
website was hacked and closed. A web-blog, with limited possibilities for exchange other than chats, continued
until the launch of a new website in 2010. Although many training-related activities can be presented under the
heading of AISSA, the website / blog has been the only instrument through which direct exchange between BSSs
from different countries has been promoted. Analyzing the information exchange reveals an obvious divergence in
exchange between francophone BSSs and Anglophone BSSs. There is very limited exchange between Francophone
and Anglophone BSSs. In principle, every BSS is invited to become an AISSA member although until now mainly
IFDC partners are involved. No quality criteria are applied for AISSA membership. As a result, in the eyes of the
evaluation team, there is a risk that the network becomes a loose collection of heterogeneous organizations.
Thus far, the AISSA website appears to be the primary instrument to reinforce coherence and tying together the BSS
organizations across the program countries. According to the evaluation team, more efforts are needed to facilitate
knowledge development and exchange across clusters and country borders. There is a strong need to make training
modules, options for agribusiness development, facilitation tools, case studies and cluster actor testimonies avail-
able, by harnessing the potential of ICT.
2 .2 .8 business Support Services (bSS)
Sub-contracting. For the large part of the capacity building services delivered by 1000s+, IFDC has chosen to work
through business support service providers (BSS). In most cases, BSSs are NGOs, but in some cases they are small
enterprises or state agencies. As from 2007, (apex) farmers’ organizations are part of the contracted organizations.
They represent approximately 20% of the BSSs. BSSs are often not specialized in specific areas but provide training
and support on all elements of CASE: from group formation to ISFM.
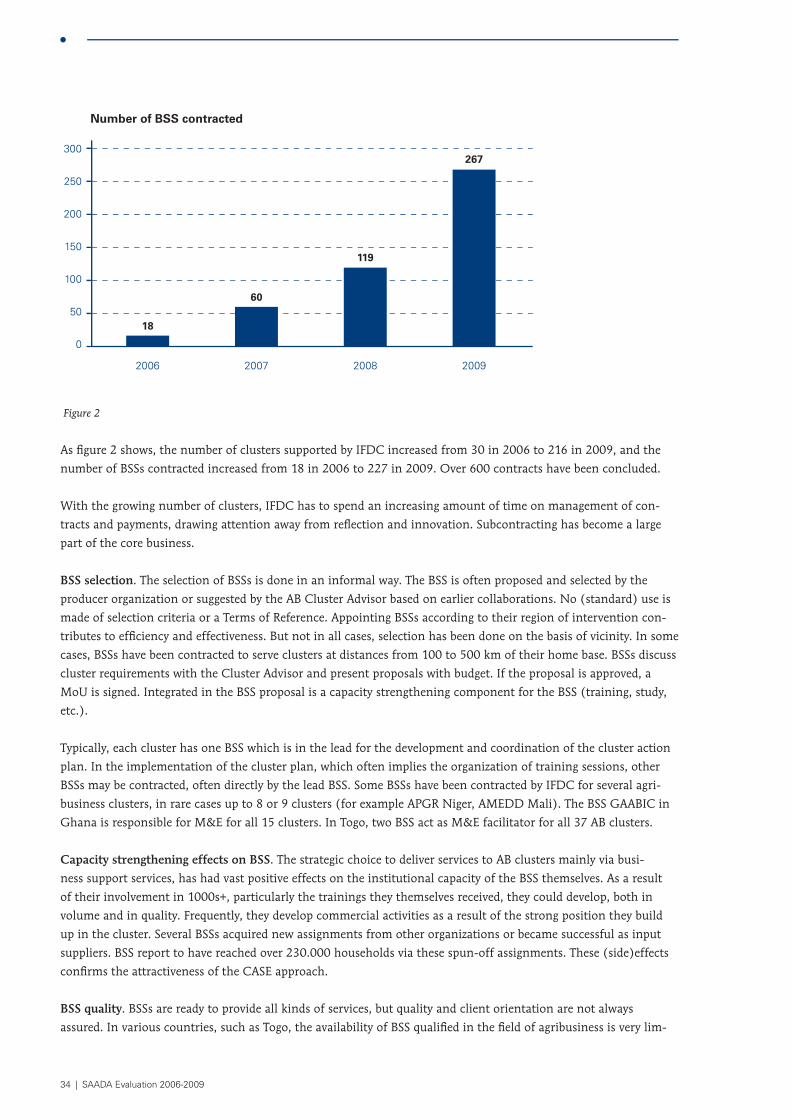
34 | SAADA Evaluation 2006-2009
300
250
200
150
100
50
0
2006
18
Number of BSS contracted
2007
60
2008
119
2009
267
Figure 2
As fi gure 2 shows, the number of clusters supported by IFDC increased from 30 in 2006 to 216 in 2009, and the
number of BSSs contracted increased from 18 in 2006 to 227 in 2009. Over 600 contracts have been concluded.
With the growing number of clusters, IFDC has to spend an increasing amount of time on management of con-
tracts and payments, drawing attention away from refl ection and innovation. Subcontracting has become a large
part of the core business.
bSS selection. The selection of BSSs is done in an informal way. The BSS is often proposed and selected by the
producer organization or suggested by the AB Cluster Advisor based on earlier collaborations. No (standard) use is
made of selection criteria or a Terms of Reference. Appointing BSSs according to their region of intervention con-
tributes to effi ciency and effectiveness. But not in all cases, selection has been done on the basis of vicinity. In some
cases, BSSs have been contracted to serve clusters at distances from 100 to 500 km of their home base. BSSs discuss
cluster requirements with the Cluster Advisor and present proposals with budget. If the proposal is approved, a
MoU is signed. Integrated in the BSS proposal is a capacity strengthening component for the BSS (training, study,
etc.).
Typically, each cluster has one BSS which is in the lead for the development and coordination of the cluster action
plan. In the implementation of the cluster plan, which often implies the organization of training sessions, other
BSSs may be contracted, often directly by the lead BSS. Some BSSs have been contracted by IFDC for several agri-
business clusters, in rare cases up to 8 or 9 clusters (for example APGR Niger, AMEDD Mali). The BSS GAABIC in
Ghana is responsible for M&E for all 15 clusters. In Togo, two BSS act as M&E facilitator for all 37 AB clusters.
capacity strengthening effects on bSS. The strategic choice to deliver services to AB clusters mainly via busi-
ness support services, has had vast positive effects on the institutional capacity of the BSS themselves. As a result
of their involvement in 1000s+, particularly the trainings they themselves received, they could develop, both in
volume and in quality. Frequently, they develop commercial activities as a result of the strong position they build
up in the cluster. Several BSSs acquired new assignments from other organizations or became successful as input
suppliers. BSS report to have reached over 230.000 households via these spun-off assignments. These (side)effects
confi rms the attractiveness of the CASE approach.
bSS quality. BSSs are ready to provide all kinds of services, but quality and client orientation are not always
assured. In various countries, such as Togo, the availability of BSS qualifi ed in the fi eld of agribusiness is very lim-
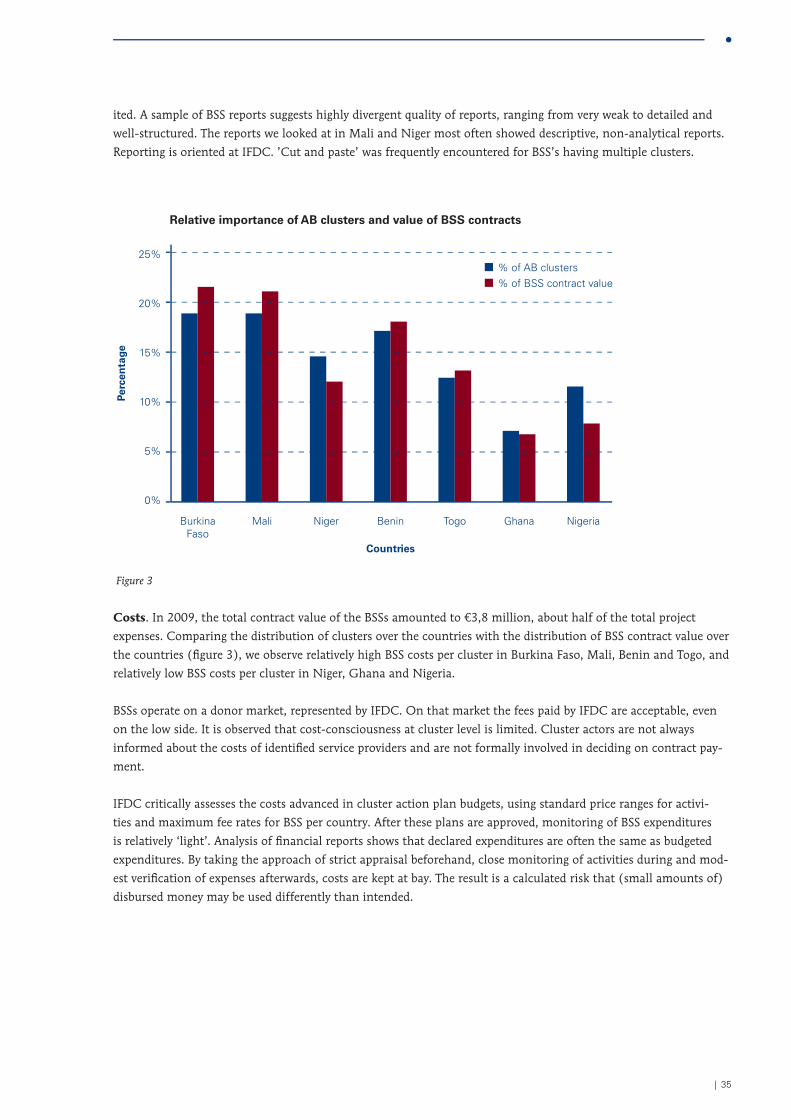
| 35
ited. A sample of BSS reports suggests highly divergent quality of reports, ranging from very weak to detailed and
well-structured. The reports we looked at in Mali and Niger most often showed descriptive, non-analytical reports.
Reporting is oriented at IFDC. ’Cut and paste’ was frequently encountered for BSS’s having multiple clusters.
25%
20%
15%
10%
5%
0%
Relative importance of AB clusters and value of BSS contracts
BurkinaFaso
Mali Niger Benin
Countries
Perc
enta
ge
Togo Ghana Nigeria
% of AB clusters% of BSS contract value
Figure 3
Costs. In 2009, the total contract value of the BSSs amounted to €3,8 million, about half of the total project
expenses. Comparing the distribution of clusters over the countries with the distribution of BSS contract value over
the countries (fi gure 3), we observe relatively high BSS costs per cluster in Burkina Faso, Mali, Benin and Togo, and
relatively low BSS costs per cluster in Niger, Ghana and Nigeria.
BSSs operate on a donor market, represented by IFDC. On that market the fees paid by IFDC are acceptable, even
on the low side. It is observed that cost-consciousness at cluster level is limited. Cluster actors are not always
informed about the costs of identifi ed service providers and are not formally involved in deciding on contract pay-
ment.
IFDC critically assesses the costs advanced in cluster action plan budgets, using standard price ranges for activi-
ties and maximum fee rates for BSS per country. After these plans are approved, monitoring of BSS expenditures
is relatively ‘light’. Analysis of fi nancial reports shows that declared expenditures are often the same as budgeted
expenditures. By taking the approach of strict appraisal beforehand, close monitoring of activities during and mod-
est verifi cation of expenses afterwards, costs are kept at bay. The result is a calculated risk that (small amounts of)
disbursed money may be used differently than intended.
36 | SAADA Evaluation 2006-2009
2 .2 .9 collaborative arrangements
In every country, there are convincing examples of effective collaboration (with input suppliers, banks, MFIs,
research institutes, and other donor organizations) established by IFDC, which are contributing to the objectives of
SAADA. For example in Benin, IFDC is involved in the Non-Cotton program that aims to increase the production
and productivity of high-value food crops by 40% and to increase the incomes of 30.000 smallholder farmers by
20%. The program is funded by the Dutch Embassy and is implemented by IFDC in partnership with the Nether-
lands Development Organization (SNV). As an element of the program, micro-financing is provided by Fédération
des caisses d’épargne et de crédit agricole mutuel (FECECAM) of Benin and the Banque Regionale de Solidarité (BRS)
and many other microfinance institutions in Togo. In Ghana, IFDC established collaboration with GTZ (joint
support to a cluster in chili pepper), the Ghana School Feeding Program (supply of products by SAADA supported
clusters), and the Research Institute CSIR-SARI (field testing and promotion of new technologies). In Burkina Faso,
many collaborative arrangements have been established in the banking sector, with private enterprises active in
input and output markets and with universities and training centers. In Niger, good relations are established with
Ministries and governmental services, but collaboration with the private sector is less developed. The case of Mali
reflects the general finding that collaborative arrangements reflect the active participation of different stakeholder
groups in the national steering committees.
Examples in all 7 countries indicate that IFDC is keen on establishing collaboration agreements with local and
international organizations contributing to the objectives of SAADA. Alignment of initiatives in a region where so
many governments, donors and NGOs are running programs with comparable objectives, this is a useful and nec-
essary strategy. The downside of this – at least for evaluation purposes - is the increased difficulty to establish causal
relations between SAADA interventions and outcomes and impacts realized. This is further discussed in chapter 6.
Î Summarizing the main points addressed in this paragraph, it is found that the institutional set-up of the
1000s+ project is in essence good. The CASE approach requires working in different intervention domains,
which requires complementary core capacities. Most relevant actors are connected and the structures are in
place, even though it has taken time and energy before they started functioning and their effectiveness can
still be improved in various regards. It is expected that many positive (side)effects of the institutional structure
are yet to be attained, after a couple of years of implementation.
As regards the strategy for service-delivery, the evaluation team takes the view that IFDC has chosen a
challenging way of working through BSSs rather than with own staff. Using BSSs is a more sustainable and
efficient way of working compared to using own staff. The chosen strategy is considered highly relevant. In
the execution of the strategy, more could be done to develop instruments for BSS selection, methods for
BSS strengthening, and tools for quality control and client satisfaction. The price-quality ratio and sustain-
ability of BSS services can be improved by promoting internal service delivery within clusters, supporting PO
staff recruitment, using local (sometime free) government extension staff and harnessing services of existing
programs and projects.
2 .3 SELEcTion of AgribuSinESS cLuSTErS
2 .3 .1 new clusters
In this report, we differentiate between ‘business ideas’, ‘cluster action plans’ and ‘business plans’:
• Business ideas are advanced by clusters to IFDC/NSC to test whether a cluster is eligible
for 1000s+ support. Generally one of the cluster actors acts as cluster promoter;
• Cluster action plans are formulated by a cluster upon the invitation of IFDC on an annual basis.
They focus on capacity strengthening and are meant to be (mainly) funded by IFDC;
| 37
• Business plans are plans of specific enterprises focusing on achieving their economic goals, indicating
investments, priority activities and/or capacity strengthening needs. Business plans need sound economic data,
can be submitted to banks and FMI’s and/or to external donors for commercial or non-commercial funding.
Thirty out of 218 clusters have been selected during the previous ISFM program. The other clusters have been
selected on the basis of promising business ideas. A cluster aiming to be part of SAADA will submit a business idea
to the IFDC AB cluster advisor in their country. The notification that business ideas may be submitted, is done by
word of mouth within the networks of NSC members, Cluster Advisors, BSSs, producer groups, etc. Although this
may seem to be a selective and restrictive way of information dissemination, hardly any complaints were heard
about the procedures for selecting agribusiness clusters.
The national-level survey confirms that in all 7 countries, procedures for AB cluster selection are considered to be
transparent. There is a widespread feeling that all kinds of commodities and different geographical areas are eligi-
ble. The forms and templates that are currently used for describing a business idea, provide a lot of information on
the initiators (notably farmers, producers) and on indicators that are part of the SAADA M&E system. The evalu-
ation team however is surprised that the forms do not invite the initiators to clearly indicate the economic results
they pursue.
The final selection of cluster business ideas is done by the Steering Committee, upon the advice of the AB Cluster
and PO Advisor. Consequently, the selected cluster is asked to prepare a cluster action plan (paragraph 2.3.2).
IFDC does not have a clear entry strategy for support to new clusters. Although there are checklists, cluster selec-
tion is in practice done on the basis of professional assessments of NSC members at national level. No strategic
criteria exist at program level exist, related to for instance type of intervention area, type of chain/product, mini-
mum or maximum cluster size, composition, history, level of organization within the cluster etc. In some coun-
tries, not all, there is a preference for a certain concentration of clusters in order to facilitate exchange and for the
sake of efficiency. Market potential is often mentioned as a condition for cluster selection. Gender is sometimes
mentioned as a consideration for cluster selection.
In terms of commodities, there seems to be a preference for diversification rather than focus. After 3 years of
selecting new additional clusters, the number of commodities went up from 13 in 2006 to 47 in 2009. In contrast
to many other value chain development projects, SAADA/1000s+ does not preselect certain sub-sectors or certain
value chains. The large number of commodities illustrates that SAADA/1000s+ is a program that first of all seeks to
implement the CASE approach, which can be applied to all kinds of agro-sylvo-pastoral products.
2 .3 .2 cluster action plans
Annually, cluster action plans are elaborated at cluster level. This process is typically driven by BSSs, who bring
together producers and other cluster actors for 2 or 3 day-planning workshops. These workshops are usually moder-
ated by IFDC (cluster advisor or CNIEP) or the BSS. When a cluster is more developed, cluster leaders tend to
become more steering in cluster action plan formulation.
A typical cluster action plan contains 2-3 training activities, a study tour, and data collection to be funded by
1000s+/SAADA. Within given budget ceilings per cluster, the NSC ‘decides’ positively or negatively on the cluster
action plan and the Cluster Advisor takes the ‘final decision’. Criteria for evaluation of cluster proposals include:
gender, empowerment local groups, spreading CASE experiences across the country, geographic concentration,
cluster size, potential economic viability, etc. The interpretation of these criteria has been different in the 7 coun-
tries, leading to quite different portfolios.
The support by the SAADA program for developing the cluster action plans is very positively perceived in the survey.
The evaluators studied cluster action plans and noticed that, overall, the action plans are of good quality: they have
38 | SAADA Evaluation 2006-2009
a sufficient level of detail; include market descriptions; relate planned activities with past activities; link activities to
targets, planning and budget. Regarding market opportunities, the action plans sometimes present overoptimistic
expectations.
The annual exercise requires considerable investments for meetings and documentation. The format of the cluster
action plans is extensive which makes the approval procedure by NSC and IFDC time consuming. A late submis-
sion by clusters and a long process of appraisal causes delays in action plan implementation. An action plan must
first be approved before funds can be disbursed. As a result, the implementation period for the annual cluster
action plan is relatively short: August-February (well after the start of the rainy season). IFDC has decentralized
some of the checks and balances to speed up action plan assessment in the past 2 years.
Although action plan formulation is a time-consuming process, the planning meetings are far more than an
administrative endeavor. They provide excellent opportunities for cluster actors to exchange information and
debate on joint challenges. The planning cycle includes the evaluation of results obtained and the identification
of most important capacity strengthening needs. Meetings that bring together different ABC’s have a capacity
strengthening effect and have the potential to establish relations.
While business ideas and cluster action plans are numerous, business plans are more limited. The evaluation
team has identified 15 business plans which have been made by cluster actors and were provided to IFDC. These
plans have been developed by cluster actors in four countries: 5 from Mali, 5 from Togo, 4 from Benin and 1 from
Nigeria. Most (12) of these have been developed by cooperatives of producers, 2 by private companies and 1 by
a public actor. All concern significant investments, which are supposed to benefit many farmers or processors. It
is unknown whether this list of business plans is complete. Neither is it known whether these plans have been
commercially financed, except for the 5 plans in Togo, out of which just 2 were submitted to the Banque Régional
de Solidarité to be financed. The others were withheld due to a lack of guaranty funds (2 plans) and an envisaged
donor investment (1 plan).
2 .3 .3 Exit strategy
IFDC has not developed an exit strategy for phasing out the support to clusters. This is consistent with the fact that
there is no entry strategy. According to the evaluation team, the lack of an exit strategy entails two major risks:
(1) clusters become dependent on IFDC support, and (2) resources are not efficiently used (more impact from the
same resources can be expected in new clusters as compared to clusters that are already mature).
There are certainly some mature clusters that could be phased out; cluster representatives in all researched coun-
tries confirm this. But, as one cluster representative stated: “rivers are always eager to get more water”. There are
also clusters that did not make a lot of progress, which may as well be a justification for phasing out. There is quite
some agreement that the program needs to formulate an exit strategy (or better: exit strategies for different types of
AB clusters). Participants to workshops indicate however the need for a medium-term perspective on ABC develop-
ment. This translates the idea that any entry strategy already requires an exit strategy. Although ‘beneficiaries’ are
reluctant, there is also acceptance of the idea that local actors, pursuing their economic objectives and benefits,
should – progressively - contribute to the costs of training. This is currently not the case.
Î In short, it is found that the procedures for cluster selection and cluster action plan formulation are transpar-
ent and largely effective. The fact that there are no strategic criteria for starting and ending cluster support
(entry and exit strategy) is a point of attention. The current portfolio of agribusiness clusters allows for devel-
oping a typology of agribusiness clusters and defining evidence-based strategies for inception and cessation
of support to clusters.
| 39
2 .4 moniToring AnD EvALuATion SySTEm
SAADA’s monitoring and evaluation (M&E) system is meant to provide the stakeholders of the program with rele-
vant information on an annual basis to support decision making towards the achievement of the program objectives:
1. 50% average increase in agricultural productivity and 30% average
income growth for 1 million rural farm households;
2. Measurable increase in environmentally sustainable production on an additional 2 million hectares;
3. Improved food security through an increase in aggregated agricultural
production of 500.000 tons cereal equivalents;
4. At least 2000 program beneficiary input dealers, traders, processors and others are
expected to increase their business by 50% and to expand the number of stores,
warehouses, agencies, other processing units and employees, by another 50%;
5. Increased institutional capacities of producer organizations, agro-entrepreneurs, credit and business
service providers, trade associations, and National Research and Extension Services (NARES).
Currently, IFDC is building an on-line monitoring database to make data collection easier and information more
regularly and widely available. The evaluators positively appreciate the on-going improvements made by IFDC on
the monitoring system as this indicates that IFDC applies lessons learned continuously. However, we note that
outcome indicators lack coherence: there are important differences between the working packages in the project
proposal, the key operational areas (KOAs) that lie at the basis of the work plans and the 10 intermediate results of
the M&E system (see also Annex 2. Methodology). Comparison over time is difficult when indicators are changing.
In 2009, the monitoring system was adjusted by removing and replacing certain indicators and by reducing the
number of data collection sheets from 9 to 5. The monitoring system included indicators that were not well under-
stood by the BSS enumerators, such as: “% change in local entrepreneurs’ business volume” and “number of cluster
actors that confirmed having changed attitude and behavior towards HIV/AIDS and improved nutrition” and
“number of learning groups experimenting with new farming, breeding, processing, storing technologies and mar-
keting strategies”. BSSs confirm that these type of indicators resulted in unreliable data. The indicators mentioned
as examples have been replaced in 2009 by more specific ones. However, confusion remains about some indicators,
as exemplified by the following:
Example indicator: “number of households reached” . To determine the value of this indicator, POs are asked by
the BSS enumerators to quantify their members, but also to add additional households – being members of other
POs – that are reached by the program activities. At this point, it is undefined what ‘reaching’ means. Reaching
can mean taking notice of information (by radio emissions or by information sessions or by the word of mouth).
Reaching can also mean using information or being trained. Depending on the interpretation of the BSS, the value
of the indicator may vary roughly from 50 households being ‘reached’ by one study tour to 5000 households being
‘reached’ by one radio emission.
IFDC has added a third element, next to PO household members and non-members reached, which is ‘households
reached through other agribusiness value chain programs owned by IFDC partner institutions (BSS) as a result of capacity
development through the CASE approach’.
In practice, this means that BSSs, involved in SAADA, may add households being served in the context of another
program as SAADA beneficiaries as well. By adjusting this indicator for ‘households reached’ in 2009 in this
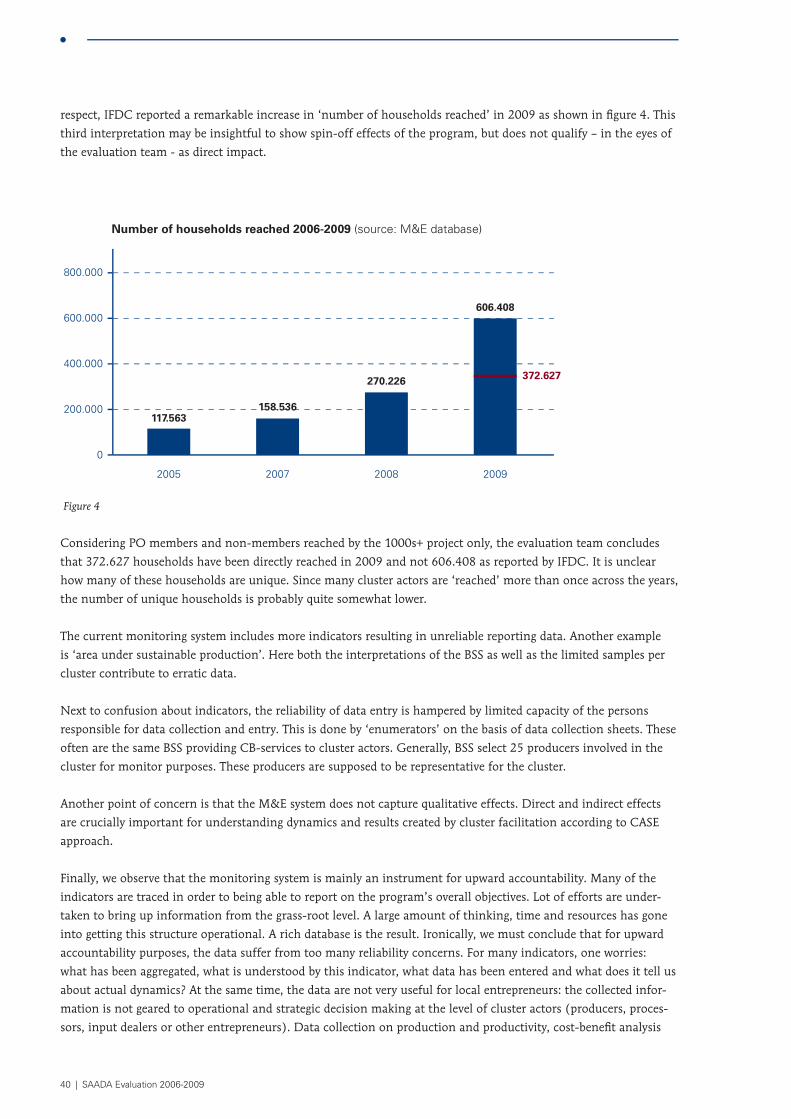
40 | SAADA Evaluation 2006-2009
respect, IFDC reported a remarkable increase in ‘number of households reached’ in 2009 as shown in fi gure 4. This
third interpretation may be insightful to show spin-off effects of the program, but does not qualify – in the eyes of
the evaluation team - as direct impact.
800.000
600.000
400.000
200.000
0
2005
117.563
Number of households reached 2006-2009 (source: M&E database)
2007
158.536
2008
270.226
2009
606.408
372.627
Figure 4
Considering PO members and non-members reached by the 1000s+ project only, the evaluation team concludes
that 372.627 households have been directly reached in 2009 and not 606.408 as reported by IFDC. It is unclear
how many of these households are unique. Since many cluster actors are ‘reached’ more than once across the years,
the number of unique households is probably quite somewhat lower.
The current monitoring system includes more indicators resulting in unreliable reporting data. Another example
is ‘area under sustainable production’. Here both the interpretations of the BSS as well as the limited samples per
cluster contribute to erratic data.
Next to confusion about indicators, the reliability of data entry is hampered by limited capacity of the persons
responsible for data collection and entry. This is done by ‘enumerators’ on the basis of data collection sheets. These
often are the same BSS providing CB-services to cluster actors. Generally, BSS select 25 producers involved in the
cluster for monitor purposes. These producers are supposed to be representative for the cluster.
Another point of concern is that the M&E system does not capture qualitative effects. Direct and indirect effects
are crucially important for understanding dynamics and results created by cluster facilitation according to CASE
approach.
Finally, we observe that the monitoring system is mainly an instrument for upward accountability. Many of the
indicators are traced in order to being able to report on the program’s overall objectives. Lot of efforts are under-
taken to bring up information from the grass-root level. A large amount of thinking, time and resources has gone
into getting this structure operational. A rich database is the result. Ironically, we must conclude that for upward
accountability purposes, the data suffer from too many reliability concerns. For many indicators, one worries:
what has been aggregated, what is understood by this indicator, what data has been entered and what does it tell us
about actual dynamics? At the same time, the data are not very useful for local entrepreneurs: the collected infor-
mation is not geared to operational and strategic decision making at the level of cluster actors (producers, proces-
sors, input dealers or other entrepreneurs). Data collection on production and productivity, cost-benefi t analysis
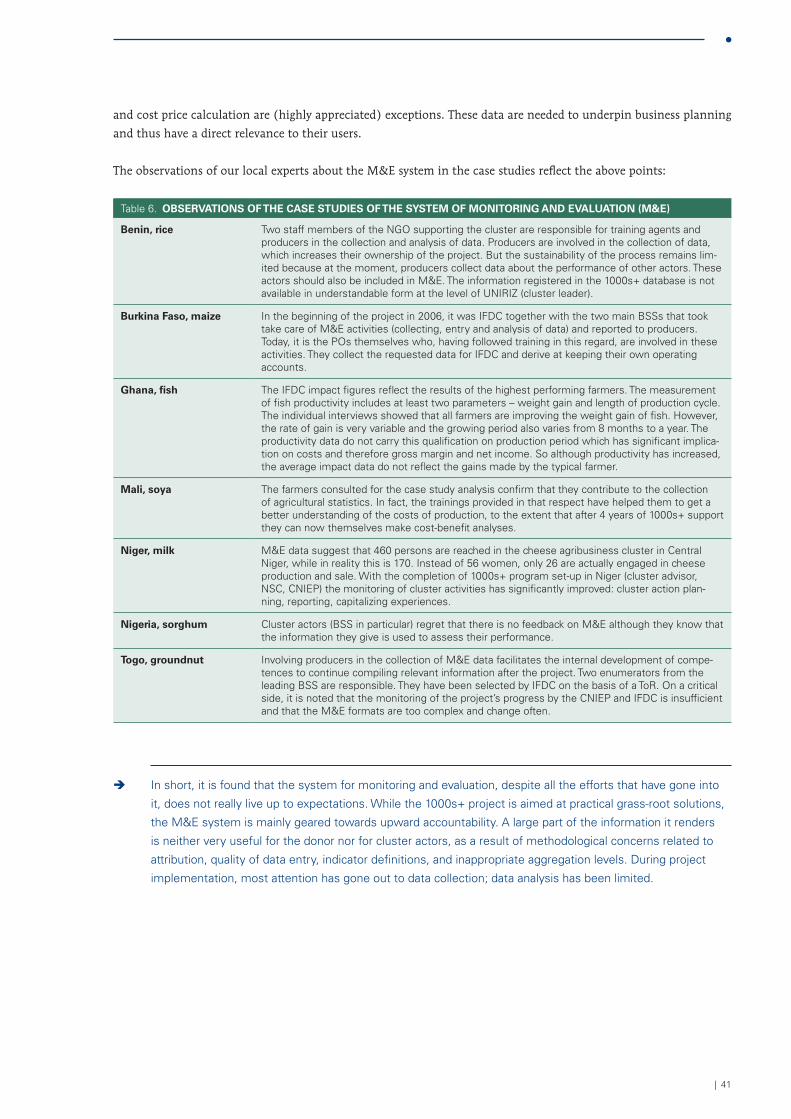
| 41
and cost price calculation are (highly appreciated) exceptions. These data are needed to underpin business planning
and thus have a direct relevance to their users.
The observations of our local experts about the M&E system in the case studies reflect the above points:
Table 6. obServaTioNS oF The CaSe STuDieS oF The SySTem oF moNiToriNg aND evaluaTioN (m&e)
benin, rice Two staff members of the NGO supporting the cluster are responsible for training agents and producers in the collection and analysis of data. Producers are involved in the collection of data, which increases their ownership of the project. But the sustainability of the process remains lim-ited because at the moment, producers collect data about the performance of other actors. These actors should also be included in M&E. The information registered in the 1000s+ database is not available in understandable form at the level of UNIRIZ (cluster leader).
burkina Faso, maize In the beginning of the project in 2006, it was IFDC together with the two main BSSs that took take care of M&E activities (collecting, entry and analysis of data) and reported to producers. Today, it is the POs themselves who, having followed training in this regard, are involved in these activities. They collect the requested data for IFDC and derive at keeping their own operating accounts.
ghana, fish The IFDC impact figures reflect the results of the highest performing farmers. The measurement of fish productivity includes at least two parameters – weight gain and length of production cycle. The individual interviews showed that all farmers are improving the weight gain of fish. However, the rate of gain is very variable and the growing period also varies from 8 months to a year. The productivity data do not carry this qualification on production period which has significant implica-tion on costs and therefore gross margin and net income. So although productivity has increased, the average impact data do not reflect the gains made by the typical farmer.
mali, soya The farmers consulted for the case study analysis confirm that they contribute to the collection of agricultural statistics. In fact, the trainings provided in that respect have helped them to get a better understanding of the costs of production, to the extent that after 4 years of 1000s+ support they can now themselves make cost-benefit analyses.
Niger, milk M&E data suggest that 460 persons are reached in the cheese agribusiness cluster in Central Niger, while in reality this is 170. Instead of 56 women, only 26 are actually engaged in cheese production and sale. With the completion of 1000s+ program set-up in Niger (cluster advisor, NSC, CNIEP) the monitoring of cluster activities has significantly improved: cluster action plan-ning, reporting, capitalizing experiences.
Nigeria, sorghum Cluster actors (BSS in particular) regret that there is no feedback on M&E although they know that the information they give is used to assess their performance.
Togo, groundnut Involving producers in the collection of M&E data facilitates the internal development of compe-tences to continue compiling relevant information after the project. Two enumerators from the leading BSS are responsible. They have been selected by IFDC on the basis of a ToR. On a critical side, it is noted that the monitoring of the project’s progress by the CNIEP and IFDC is insufficient and that the M&E formats are too complex and change often.
Î In short, it is found that the system for monitoring and evaluation, despite all the efforts that have gone into
it, does not really live up to expectations. While the 1000s+ project is aimed at practical grass-root solutions,
the M&E system is mainly geared towards upward accountability. A large part of the information it renders
is neither very useful for the donor nor for cluster actors, as a result of methodological concerns related to
attribution, quality of data entry, indicator definitions, and inappropriate aggregation levels. During project
implementation, most attention has gone out to data collection; data analysis has been limited.
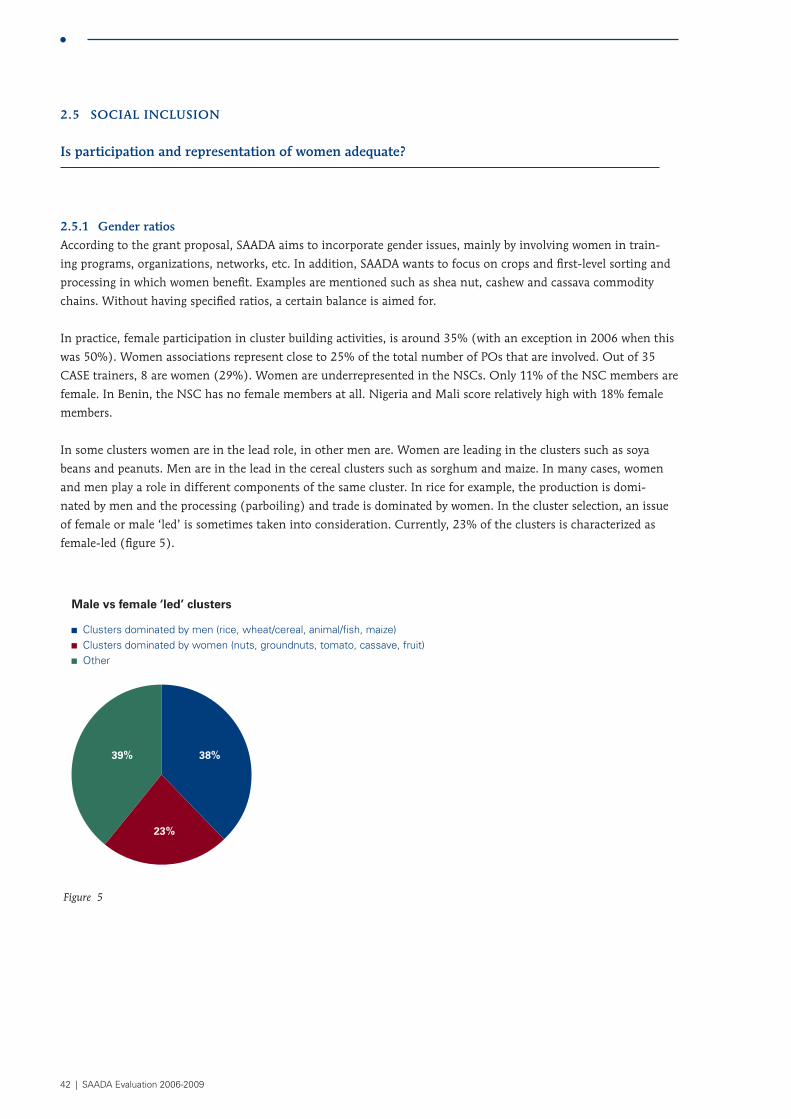
42 | SAADA Evaluation 2006-2009
2 .5 SociAL incLuSion
is participation and representation of women adequate?
2 .5 .1 gender ratios
According to the grant proposal, SAADA aims to incorporate gender issues, mainly by involving women in train-
ing programs, organizations, networks, etc. In addition, SAADA wants to focus on crops and first-level sorting and
processing in which women benefit. Examples are mentioned such as shea nut, cashew and cassava commodity
chains. Without having specified ratios, a certain balance is aimed for.
In practice, female participation in cluster building activities, is around 35% (with an exception in 2006 when this
was 50%). Women associations represent close to 25% of the total number of POs that are involved. Out of 35
CASE trainers, 8 are women (29%). Women are underrepresented in the NSCs. Only 11% of the NSC members are
female. In Benin, the NSC has no female members at all. Nigeria and Mali score relatively high with 18% female
members.
In some clusters women are in the lead role, in other men are. Women are leading in the clusters such as soya
beans and peanuts. Men are in the lead in the cereal clusters such as sorghum and maize. In many cases, women
and men play a role in different components of the same cluster. In rice for example, the production is domi-
nated by men and the processing (parboiling) and trade is dominated by women. In the cluster selection, an issue
of female or male ‘led’ is sometimes taken into consideration. Currently, 23% of the clusters is characterized as
female-led (figure 5).
Clusters dominated by men (rice, wheat/cereal, animal/fish, maize)Clusters dominated by women (nuts, groundnuts, tomato, cassave, fruit)Other
Male vs female ‘led’ clusters
38%39%
23%
Figure 5

| 43
Box 5 CulTural CoNTexT oF Female eCoNomiC aCTiviTieS: CheeSe maKiNg iN The Niger CaSe STuDy
In Niger, cheese production used to be limited, mainly being practiced by women for the conservation of excess milk
during the rainy season for home consumption. Men need to authorize their wives to transform the milk into cheese,
which is beyond traditional Fulani cultural rules on milk processing. DEBBO, the PO promoting the cheese cluster,
seeks to develop cheese production as a cooperative economic venture, but the socio-cultural environment is not very
favorable. However, the high net benefits and the good sales on the local market are helping to convince village chiefs
and traditional leaders to authorize women to engage in cheese production, as has been the case for two villages where
women are now having a profitable processing activity.
2 .5 .2 pro-poor objectives
SAADA aims to contribute to increased production and income, without specifically focusing on poor people in the
selected countries. The 1000s+ project addresses the first four pillars of the Netherlands’ agricultural development
cooperation policy (DGIS-LNV). The CASE approach is oriented at the development of entrepreneurial capacities.
The evaluators are aware that this is – by definition – only possible for people, households and small enterprises
that have a minimum resource endowment and have the possibility to create surplus, to take certain risks and/or
to specialize on certain commodities. In practice, the 1000s+ project thus works on commodities, in geographical
areas and with actors that have potential.
Furthermore, working through organized farmers creates a bias, as the poorest farmers tend not to be member of a
producer organization. With a business-oriented approach, working with local farmer groups is however probably
as close as you can get to the traditional target groups of development cooperation.
Î In short, female participation of around 35% in the West African context is considered good. Many female-led
clusters are being supported. Low female participation in the NSCs is a point of attention.
Having a business orientation, 1000s+ does not specifically target poor people. Nevertheless, poor people
certainly benefit from the project as outlined in section 6.7.

44 | SAADA Evaluation 2006-2009
| 45
3 . capacity strengthening services
3 .1 TrAining AnD LEArning AcTiviTiES
have the activities to strengthen the capacities of different actors contributed towards making commodity chains more effective?
Introduction
The capacity strengthening services delivered by 1000s+ are highly appreciated by the stakeholders of the program.
This is a finding that has unambiguously resulted from the interviews, the national-level survey and the cluster-
level studies, and was confirmed in the validation workshops. In the survey, representing the opinions of 148
stakeholders, the 1000s+ services are scored 5% higher than average. This is second after the CASE approach, which
is scored 23% higher than average. This implies that capacity strengthening services are one of the best appreciated
aspects of the program.
3 .1 .1 planned and realized training activities
Capacity-building (CB) is at the core of the 1000s+ approach. As the grant proposal4 set out:
“The current project will build or strengthen the capacities of other organizations, enabling them to gradually take over
IFDC’s role during the project. […]. Capacity building activities involve all the stakeholders and focus on the following
activities:
1. Raising awareness on the importance of agricultural intensification and agribusiness linkages
through activities oriented towards both private and public sector stakeholders (e.g. study tours,
round table meetings, participation of stakeholders in agribusiness trade fairs and meetings)
2. Strengthening of ‘individual’ competencies of farmers, local entrepreneurs, and business development
and financial services. This covers both managerial (e.g. business planning, financial analysis and
management, customer relationships) and technical (e.g. product and process knowledge) issues
3. Strengthening of ‘collective’ competencies of farmers, local entrepreneurs, and business
development and financial services. This covers leadership, as well as organizational
and institutional (e.g. networking, dialogue and lobbying) issues
4. Facilitation of networking and dialogue among stakeholders. This includes dialogue on effective private
and public sector roles to create enabling environments for competitive cluster formation”
The CB activities thus foreseen would comprise a wide range of topics and stakeholders. Other than the listing of
‘training, facilitation of platforms, round table meetings, study tours’ and some others, not much information was
provided as to the envisaged form and approach of these CB services.
In the course of implementation, a large number of people have been trained in one way or another by the 1000s+
project. In 2009 only, 47.631 people participated in capacity-building activities, as the following table shows5:
4 Grant proposal (Part A) for submission to DGIS by IFDC, October 2005, p. 16-17 (emphasis added)
5 M&E database 2009 (version 10, first semester SAADA report 2010)
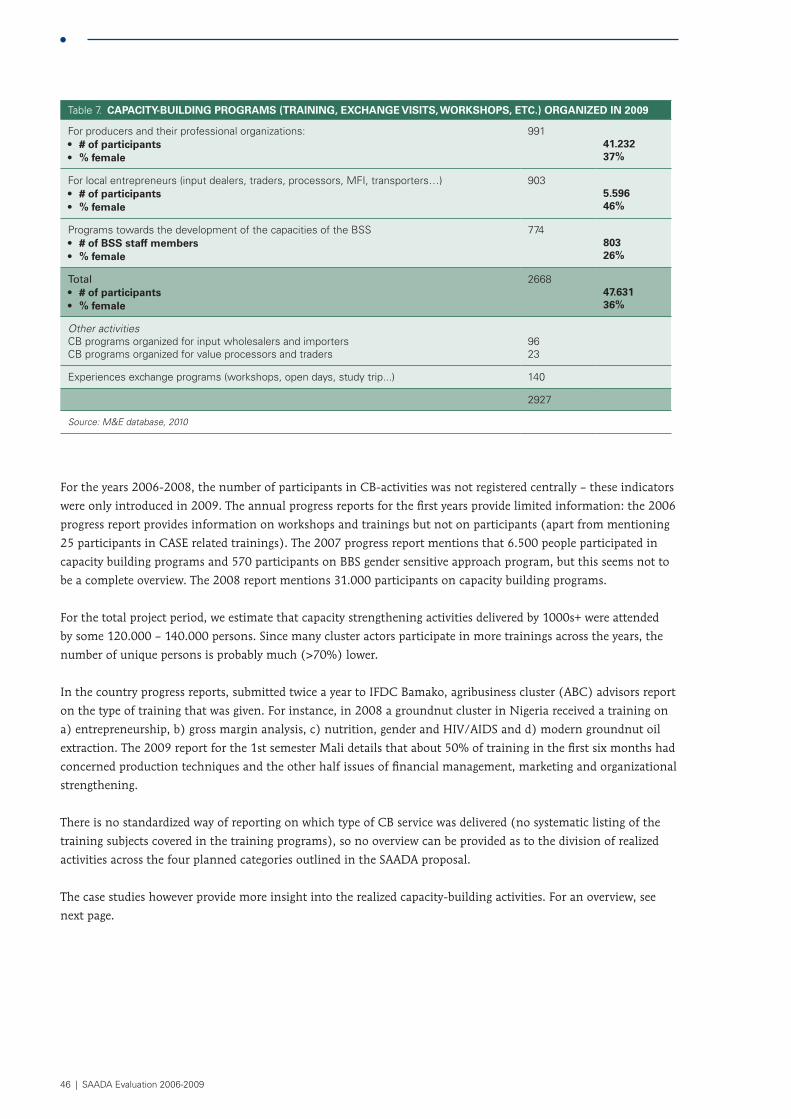
46 | SAADA Evaluation 2006-2009
Table 7. CaPaCiTy-builDiNg ProgramS (TraiNiNg, exChaNge viSiTS, worKShoPS, eTC.) orgaNizeD iN 2009
For producers and their professional organizations:• # of participants• % female
99141.23237%
For local entrepreneurs (input dealers, traders, processors, MFI, transporters…)• # of participants• % female
9035.59646%
Programs towards the development of the capacities of the BSS• # of bSS staff members• % female
77480326%
Total • # of participants• % female
266847.63136%
Other activitiesCB programs organized for input wholesalers and importersCB programs organized for value processors and traders
9623
Experiences exchange programs (workshops, open days, study trip...) 140
2927
Source: M&E database, 2010
For the years 2006-2008, the number of participants in CB-activities was not registered centrally – these indicators
were only introduced in 2009. The annual progress reports for the first years provide limited information: the 2006
progress report provides information on workshops and trainings but not on participants (apart from mentioning
25 participants in CASE related trainings). The 2007 progress report mentions that 6.500 people participated in
capacity building programs and 570 participants on BBS gender sensitive approach program, but this seems not to
be a complete overview. The 2008 report mentions 31.000 participants on capacity building programs.
For the total project period, we estimate that capacity strengthening activities delivered by 1000s+ were attended
by some 120.000 – 140.000 persons. Since many cluster actors participate in more trainings across the years, the
number of unique persons is probably much (>70%) lower.
In the country progress reports, submitted twice a year to IFDC Bamako, agribusiness cluster (ABC) advisors report
on the type of training that was given. For instance, in 2008 a groundnut cluster in Nigeria received a training on
a) entrepreneurship, b) gross margin analysis, c) nutrition, gender and HIV/AIDS and d) modern groundnut oil
extraction. The 2009 report for the 1st semester Mali details that about 50% of training in the first six months had
concerned production techniques and the other half issues of financial management, marketing and organizational
strengthening.
There is no standardized way of reporting on which type of CB service was delivered (no systematic listing of the
training subjects covered in the training programs), so no overview can be provided as to the division of realized
activities across the four planned categories outlined in the SAADA proposal.
The case studies however provide more insight into the realized capacity-building activities. For an overview, see
next page.

| 47
Table 8. TyPe oF CaPaCiTy-STreNgTheNiNg ServiCeS DelivereD by 1000S+ For CaSe STuDy CluSTerS
year oF SuPPorT
beNiN riCe
burKiNa FaSo maize
ghaNa FiSh
mali Soya
Niger milK
Nigeria Sorghum
Togo araChiDe
1
Training: • Production
techniques • Post-harvest
recollection• Budgeting
and M&E• Lobby & advocacy
Training: • Business
management• Cooperative life• Planning of
future harvests
Training:• Pond construction• Feeding practices• Pond management• Processing:
smoking
Other: • Forums with
Rural banks• Field visit to FRI• Fish Mini Fair• Study tour
Training:• Market research
(marketing and sales)
• Processing techniques for female processors
• Other:• Linkages with soya
and cowpea (visit to research institute)
• Installation of 20 demonstration plots
• Support with concluding a contract
• Exchange visit to agronomic research centre
• Multi-stakeholder workshops
• Market fair• 15 communication
posters
Training:• Milk to cheese
processing• Hygiene• Packaging• Quality
improvement• Marketing and sales• Other:• Multi-stakeholder
workshop
Training:• ISFM technologies• Gross margin
analysis• Other:• Establishment of 6
demonstration plots• Multi-stakeholder
workshop
Training:• ISFM• Principles of
working in a cooperation
• Production of arachide
• Seed production• Data collection
2
Training:• Lobby• Marketing• Production
techniques for seed multiplification
• Collective bargaining
• Rice processing• Financial and
administrative management
Other: • Installation of
seed plots
Training: • Strategic planning• Water and soil
conservation techniques
Other:• Use of organic
fertilizers• Use of Burkina
phosphate
Training:• Pond Construction• Feeding practices• Pond management• Economics of
Aquaculture• All male fingerling
production• M&E / data
collection• Association Building
Other:• Cluster Actor For a
Training:• Knowledge
about soya and cowpea inputs
• Phyto-sanitary techniques for cowpea production
• Cooperative management of maize, soya and cowpea
• Stocking of maize and soya
• Collective procurement
Other:• Soil fertility tests• Exchange visits and
contractualization of maize, soya and cowpea
• Setting up support system for financial institutions
Same as for year 1 Training:• Safe handling
and use of agrochemicals
• Compost making• Advocacy and
cooperatives• Nutrition, gender
and HIV/Aids
Training:• ISFM• Principles of
working in a cooperation
• Data collection• Management tools• CASE approach• Conflict
management
Other:• Multi-stakeholder
workshop
3
Training:• Refreshing
earlier trainings on production techniques
• Monitoring and data collection
• Business plan development
• CASE approach
Training:• Negotiation
techniques• M&E• Intensification of
maize production techniques
• Zaï technique (rational use of fertilizers)
• Water and soil conservation techniques
Training:• Hatchery and pond
construction• Feeding practices• Hatchery and pond
management• Association Building• Fish processing • M&E/ data
collection
Training: • Capacity-
strengthening of agents at NGOs and MFIs to elaborate and assess business plans
• Management of a cooperation: roles and responsibilities
Other:• Assistance to
four associations in business plan elaboration and liaising with banks
• Research for a female association into improved transformation techniques of soya
• Study visit to various industrial soya processors
4
Training:• Negotiation• M&E • Zaï technique • Water and soil
conservation techniques
Other: • Exchange workshop
with MFIs• Study tours
on warehouse receipt systems
Training: • Capacity-
strengthening of PO leaders in business management
• Negotiation techniques
Other:• Planning workshop
for soya producers, processors and traders
• Workshop for soya producers of different community unions to debate on new orientation on soya distribution/sale
• Facilitate access to credit
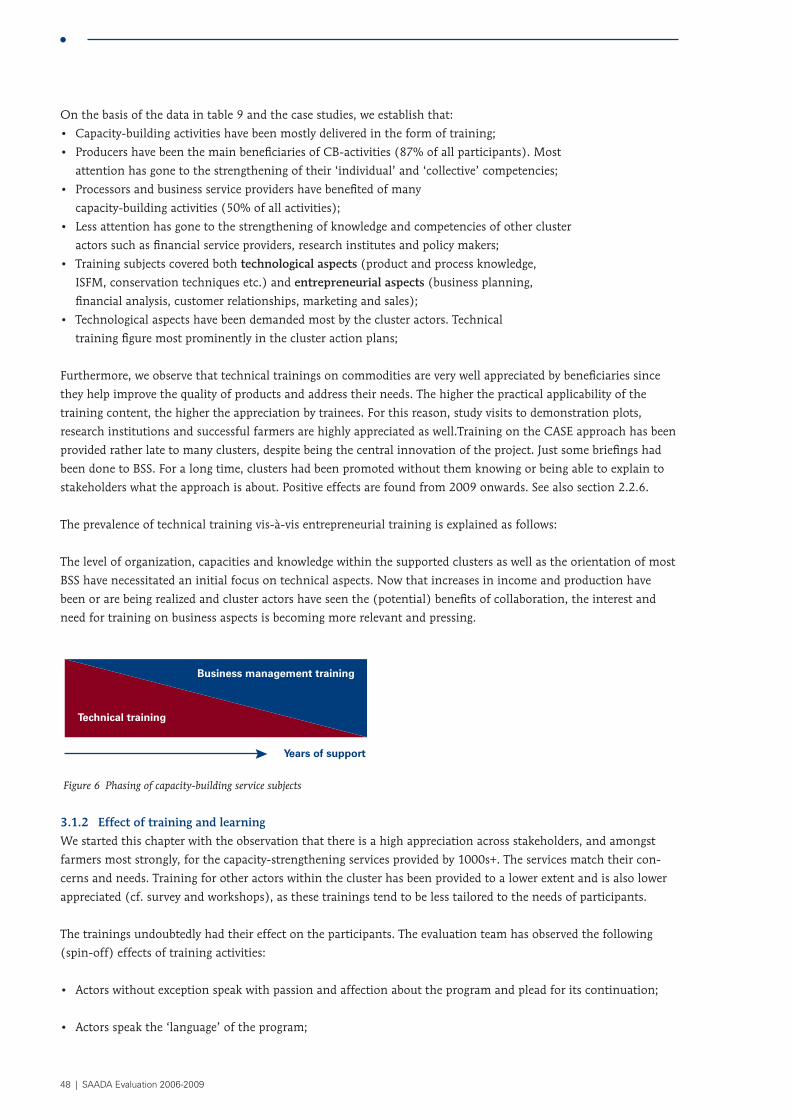
48 | SAADA Evaluation 2006-2009
On the basis of the data in table 9 and the case studies, we establish that:
• Capacity-building activities have been mostly delivered in the form of training;
• Producers have been the main beneficiaries of CB-activities (87% of all participants). Most
attention has gone to the strengthening of their ‘individual’ and ‘collective’ competencies;
• Processors and business service providers have benefited of many
capacity-building activities (50% of all activities);
• Less attention has gone to the strengthening of knowledge and competencies of other cluster
actors such as financial service providers, research institutes and policy makers;
• Training subjects covered both technological aspects (product and process knowledge,
ISFM, conservation techniques etc.) and entrepreneurial aspects (business planning,
financial analysis, customer relationships, marketing and sales);
• Technological aspects have been demanded most by the cluster actors. Technical
training figure most prominently in the cluster action plans;
Furthermore, we observe that technical trainings on commodities are very well appreciated by beneficiaries since
they help improve the quality of products and address their needs. The higher the practical applicability of the
training content, the higher the appreciation by trainees. For this reason, study visits to demonstration plots,
research institutions and successful farmers are highly appreciated as well.Training on the CASE approach has been
provided rather late to many clusters, despite being the central innovation of the project. Just some briefings had
been done to BSS. For a long time, clusters had been promoted without them knowing or being able to explain to
stakeholders what the approach is about. Positive effects are found from 2009 onwards. See also section 2.2.6.
The prevalence of technical training vis-à-vis entrepreneurial training is explained as follows:
The level of organization, capacities and knowledge within the supported clusters as well as the orientation of most
BSS have necessitated an initial focus on technical aspects. Now that increases in income and production have
been or are being realized and cluster actors have seen the (potential) benefits of collaboration, the interest and
need for training on business aspects is becoming more relevant and pressing.
Technical training
Years of support
Business management training
Figure 6 Phasing of capacity-building service subjects
3 .1 .2 Effect of training and learning
We started this chapter with the observation that there is a high appreciation across stakeholders, and amongst
farmers most strongly, for the capacity-strengthening services provided by 1000s+. The services match their con-
cerns and needs. Training for other actors within the cluster has been provided to a lower extent and is also lower
appreciated (cf. survey and workshops), as these trainings tend to be less tailored to the needs of participants.
The trainings undoubtedly had their effect on the participants. The evaluation team has observed the following
(spin-off) effects of training activities:
• Actors without exception speak with passion and affection about the program and plead for its continuation;
• Actors speak the ‘language’ of the program;
| 49
• Actors have grown used to looking at opportunities, rather than focus on problems, although the
influence of country dynamics are considerable. As a result of being ‘into business’, opportunities are
translated in new capacity strengthening needs: mechanization, conservation and storage, processing,
contract farming, elaboration of business plans and requests for bank loans, enterprise management
(processors), linkages and collaboration with agro-industry and prospection of new markets.
• Farmers and processors cite with enthusiasm what they have seen at demonstration plots and
during excursions. Many of these visits have created breakthroughs, opening their eyes for the
improvements that are possible. The importance of these trips should not be underestimated.
Box 6. Some quoTeS To illuSTraTe The eFFeCTS oF 1000S+ CaPaCiTy-STreNgTheNiNg ServiCeS
A Togolese farmer in an interview: “We just spent 2 years with the project, and farmers are already developing the
reflex to find buyers before producing. “Let’s find the market first”, “let’s contract”; “let’s sell it together”, etc. Before,
they just produced and waited for hypothetic buyers. So we can conclude that we are now moving progressively
towards value chains”.
A Beninese farmer in an interview: “Today illiterate farmers are behaving as specialists because we’ve been trained
on new production and management methods. And we learnt that it’s better to produce less and being able to look
after/ to take care of it, instead of increasing and not being able to care. We learnt how to negotiate with partners.”
A Nigerian farmer in the sub-national workshop: “I have learnt to keep records. It was not easy to structurally
register my expenditures and revenues, but the BSS helped me to do so by coming by every week. After a while I
had insight in my business. While I had thought that I was getting a good price for my rice, it turned out that I was
producing at a loss. This was the actual gain of the training. Now I am doing things differently”.
From the above, it is obvious that the various trainings are contributing to changing dynamics in agribusiness clus-
ters. In general, trained farmers have mastered technical itineraries. Many are able to develop economic capacities
(e.g. cash flow analysis) when they are engaged in AB-clusters. Collective selling is also an acquired asset of various
FOs, particularly amid the ones that have been supported longer. Some are able to negotiate good prices with trad-
ers/merchants. 1000s+ contributed to making farmers use mineral fertilizers; and demonstrations and trials under-
taken on different combinations convinced them about combining fertilizers (mineral with organic) and choosing
dosage according to the potential of their soil.
Three issues have been identified which have negatively influenced the effectiveness of the 1000s+ capacity-
strengthening services:
• Lack of resources. This is a problem encountered in all countries. Without means, producers are
not able to apply the knowledge or new techniques learnt. Capacity building in the area of relations
building and resource mobilization has received too little attention, as discussed in chapter 4.
• Availability of the trainer. Contracted trainers often come from far and return after a training
session. This negatively affects after-training monitoring, advise and follow-up.
• Quality of training modules and materials. Various stakeholders have pointed out in interviews
and workshops that the quality and/or availability of training modules is often not sufficient.
This is also – and more strongly - the case for training materials left with trainees. Especially
the lack of documents in local languages is regretted. Trainings are often organized in an
ad-hoc manner with insufficient use of attractive and adapted training didactics.
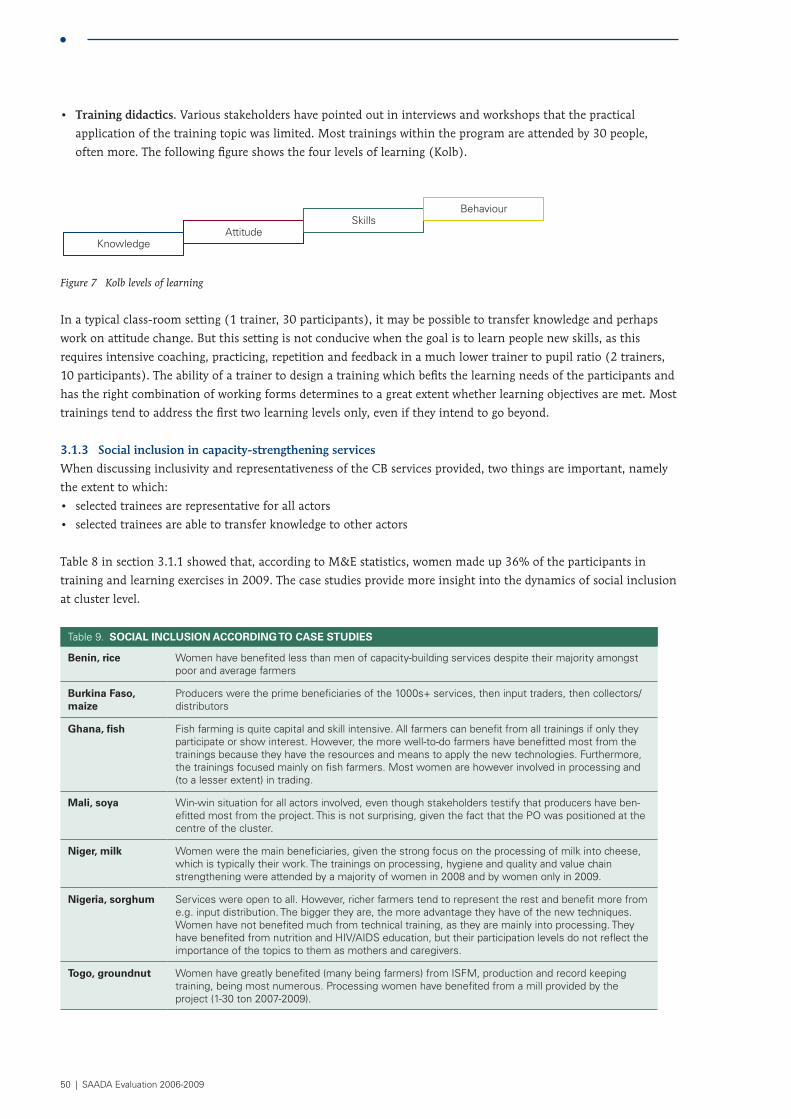
50 | SAADA Evaluation 2006-2009
• Training didactics. Various stakeholders have pointed out in interviews and workshops that the practical
application of the training topic was limited. Most trainings within the program are attended by 30 people,
often more. The following figure shows the four levels of learning (Kolb).
Figure 7
KnowledgeAttitude
SkillsBehaviour
Kolb levels of learning
In a typical class-room setting (1 trainer, 30 participants), it may be possible to transfer knowledge and perhaps
work on attitude change. But this setting is not conducive when the goal is to learn people new skills, as this
requires intensive coaching, practicing, repetition and feedback in a much lower trainer to pupil ratio (2 trainers,
10 participants). The ability of a trainer to design a training which befits the learning needs of the participants and
has the right combination of working forms determines to a great extent whether learning objectives are met. Most
trainings tend to address the first two learning levels only, even if they intend to go beyond.
3 .1 .3 Social inclusion in capacity-strengthening services
When discussing inclusivity and representativeness of the CB services provided, two things are important, namely
the extent to which:
• selected trainees are representative for all actors
• selected trainees are able to transfer knowledge to other actors
Table 8 in section 3.1.1 showed that, according to M&E statistics, women made up 36% of the participants in
training and learning exercises in 2009. The case studies provide more insight into the dynamics of social inclusion
at cluster level.
Table 9. SoCial iNCluSioN aCCorDiNg To CaSe STuDieS
benin, rice Women have benefited less than men of capacity-building services despite their majority amongst poor and average farmers
burkina Faso, maize
Producers were the prime beneficiaries of the 1000s+ services, then input traders, then collectors/distributors
ghana, fish Fish farming is quite capital and skill intensive. All farmers can benefit from all trainings if only they participate or show interest. However, the more well-to-do farmers have benefitted most from the trainings because they have the resources and means to apply the new technologies. Furthermore, the trainings focused mainly on fish farmers. Most women are however involved in processing and (to a lesser extent) in trading.
mali, soya Win-win situation for all actors involved, even though stakeholders testify that producers have ben-efitted most from the project. This is not surprising, given the fact that the PO was positioned at the centre of the cluster.
Niger, milk Women were the main beneficiaries, given the strong focus on the processing of milk into cheese, which is typically their work. The trainings on processing, hygiene and quality and value chain strengthening were attended by a majority of women in 2008 and by women only in 2009.
Nigeria, sorghum Services were open to all. However, richer farmers tend to represent the rest and benefit more from e.g. input distribution. The bigger they are, the more advantage they have of the new techniques. Women have not benefited much from technical training, as they are mainly into processing. They have benefited from nutrition and HIV/AIDS education, but their participation levels do not reflect the importance of the topics to them as mothers and caregivers.
Togo, groundnut Women have greatly benefited (many being farmers) from ISFM, production and record keeping training, being most numerous. Processing women have benefited from a mill provided by the project (1-30 ton 2007-2009).

| 51
On the basis of the M&E data and the case studies, we conclude that women have benefited from the capacity-
strengthening services, albeit to a lower extent than men. For many products, women are involved in processing
rather than production. Since the 1000s+ focus for capacity-building has been strongest on improving production
techniques, they have benefited less of the introduced technologies. More attention is needed for the training needs
of women in ‘mixed’ clusters, e.g. clusters that are not dominated by women, and to processors. Because women
tend to be more confronted with social and economic constraints which hinder them, for instance, to attend a
training far away, innovative approaches are needed to involve women more. More conclusions regarding social
inclusion are presented in section 6.7 - ‘impact distribution’.
3 .1 .4 Transfer of knowledge
M&E data stipulate that over 600.000 households have been reached in four year’s time. In section 2.4 we estab-
lished that this figure rather lies around 372.000, because households indirectly reached (through BSSs in other
programs) should in our view not be counted.
Assuming that some 35.000 unique actors have participated in trainings (cf. section 3.1.3), about 10% of actors
have directly benefited from capacity-strengthening services. Realizing that - as with training participants - not all
households counted may effectively be unique households, the reach of the program is probably somewhat lower.
Nonetheless, the large majority of cluster actors is not directly reached by CB-services, which explains the impor-
tance of internal transfer of knowledge and skills within farmers’ organizations and the agribusiness clusters at
large.
The survey shows that learning within clusters needs to be further improved. This is the case for both farmers and
other cluster actors. Farmer organizations appear to have better mechanisms to assure dissemination of knowledge
and information than other actors, but neither are deemed sufficient.
Firstly, the numbers of people per PO involved in training are too limited to effectively disseminate learning to all
others. Just a limited number of people attend trainings. Surely, training provides comparative advantages to those
who participate. Restitution of training knowledge depends on the willingness to share information with others,
the leadership and the arrangements made within each PO. Problems encountered in this regard are:
• Participants are selected on other grounds than their ability and willingness to report back to their group;
• Restitution is often delayed because it is organized during periodical meetings
(because POs do not have means to organize ad hoc ones) at the end of these meetings
in a hurry when members are already tired and inclined to go back;
• Finally there’s also a problem of resources (for transport, mobilization of
participants, lodging and per diem) to go to each group for restitution;
• Lack of adequate arrangements to ensure that training will be effectively transferred
(selection of participants’ logistics, organization of debriefing, vicinity of trainers
for follow-up monitoring, training materials in local language, …)
The AISSA network is unknown to most actors and has not been able to live up to its potential to function as a tool
for knowledge and information sharing to date. It is striking that also experienced BSSs, the first target/member-
ship group of AISSA, do not spontaneously speak about the network.
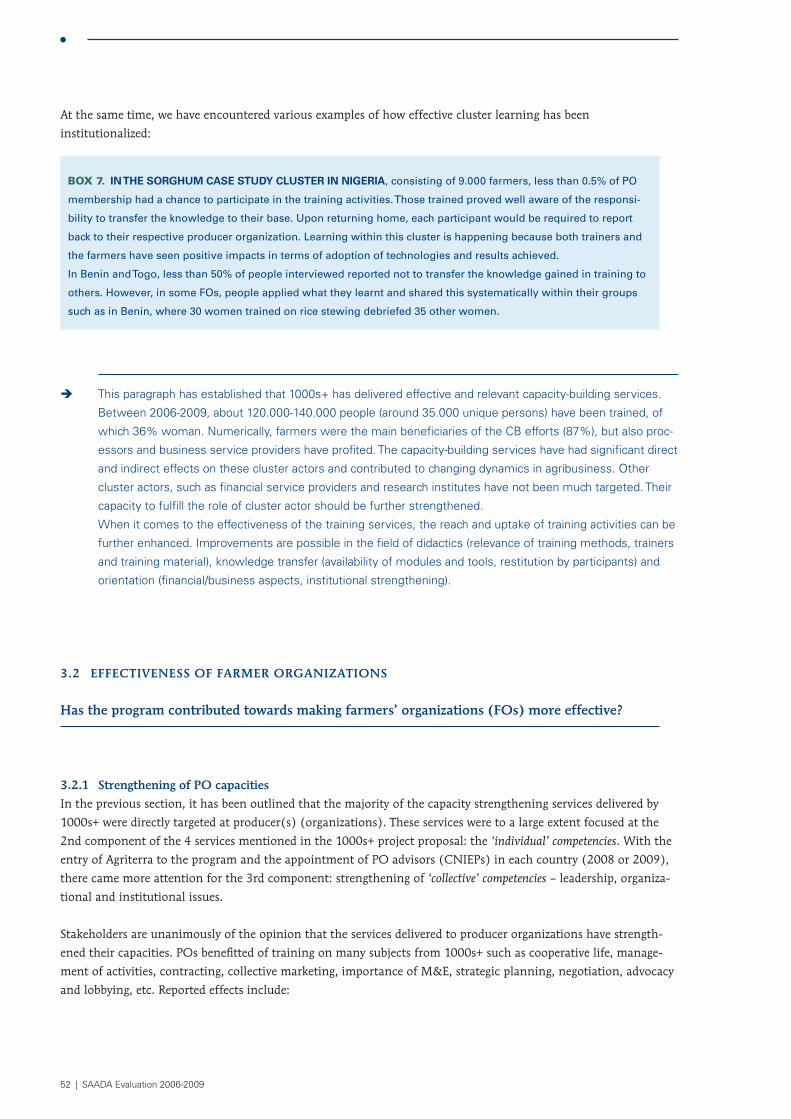
52 | SAADA Evaluation 2006-2009
At the same time, we have encountered various examples of how effective cluster learning has been
institutionalized:
Box 7. iN The Sorghum CaSe STuDy CluSTer iN Nigeria, consisting of 9.000 farmers, less than 0.5% of PO
membership had a chance to participate in the training activities. Those trained proved well aware of the responsi-
bility to transfer the knowledge to their base. Upon returning home, each participant would be required to report
back to their respective producer organization. Learning within this cluster is happening because both trainers and
the farmers have seen positive impacts in terms of adoption of technologies and results achieved.
In Benin and Togo, less than 50% of people interviewed reported not to transfer the knowledge gained in training to
others. However, in some FOs, people applied what they learnt and shared this systematically within their groups
such as in Benin, where 30 women trained on rice stewing debriefed 35 other women.
Î This paragraph has established that 1000s+ has delivered effective and relevant capacity-building services.
Between 2006-2009, about 120.000-140.000 people (around 35.000 unique persons) have been trained, of
which 36% woman. Numerically, farmers were the main beneficiaries of the CB efforts (87%), but also proc-
essors and business service providers have profited. The capacity-building services have had significant direct
and indirect effects on these cluster actors and contributed to changing dynamics in agribusiness. Other
cluster actors, such as financial service providers and research institutes have not been much targeted. Their
capacity to fulfill the role of cluster actor should be further strengthened.
When it comes to the effectiveness of the training services, the reach and uptake of training activities can be
further enhanced. Improvements are possible in the field of didactics (relevance of training methods, trainers
and training material), knowledge transfer (availability of modules and tools, restitution by participants) and
orientation (financial/business aspects, institutional strengthening).
3 .2 EffEcTivEnESS of fArmEr orgAnizATionS
has the program contributed towards making farmers’ organizations (fos) more effective?
3 .2 .1 Strengthening of po capacities
In the previous section, it has been outlined that the majority of the capacity strengthening services delivered by
1000s+ were directly targeted at producer(s) (organizations). These services were to a large extent focused at the
2nd component of the 4 services mentioned in the 1000s+ project proposal: the ‘individual’ competencies. With the
entry of Agriterra to the program and the appointment of PO advisors (CNIEPs) in each country (2008 or 2009),
there came more attention for the 3rd component: strengthening of ‘collective’ competencies – leadership, organiza-
tional and institutional issues.
Stakeholders are unanimously of the opinion that the services delivered to producer organizations have strength-
ened their capacities. POs benefitted of training on many subjects from 1000s+ such as cooperative life, manage-
ment of activities, contracting, collective marketing, importance of M&E, strategic planning, negotiation, advocacy
and lobbying, etc. Reported effects include:
| 53
• The appointment of the PO Advisor, delegated to the mandated producer organization at national level, appears
to function well in reinforcing the institutional capacity of POs. For instance, in Togo and Benin, the assistance
of the PO Advisor allowed POs to control how BSS are managing resources and cooperating with POs. Platforms
are now capable to collect information from grassroots POs. There’s more visibility and POs stand together;
• POs consistently worked on the improvement of the project (clusters ideas selection and assessment,
monitoring through field visits, etc…). All this contributed to a better understanding by POs of the
1000s+ project and their role. Consequently this impacted (positively) on relationships between BSS and
POs who became partners instead of receivers. As a result, PO’s are now more in the ‘drivers’ seat’.
• At organizational level, the various trainings have contributed to new dynamics within POs. They are
developing new reflexes (budget management, monitoring the work done by BSSs, collective marketing,
standing together, voicing their concerns and opinions, partnering; awareness of their importance
and potential to influence, presence in forum on agriculture and lobbying and advocacy;
Challenges remain:
• There is a strong need for consolidation and outscaling within the farmer groups: informing and training of
other farmers is recurrently mentioned as a priority. This requires internal PO training and coaching capacities
and training materials that are suited for adult learning in rural contexts and that allow for information sharing;
• An inventory of national farmers’ movements is lacking. There is no overview of the
performance/quality of producer organizations and what support they have received in the
past. This was an activity foreseen in the tripartite agreement with Agriterra and ROPPA.
Agriterra already has relations with quite a number of national and sub-national PO’s.
3 .2 .2 po service provision to farmers
Strengthened capacity of producer organizations should logically result in a more effective service delivery to their
members. If farmers are convinced that being member of a PO brings them benefits which offset the cost of mem-
bership, an increase in the membership of cooperatives would be expected. As table 2 indicated, during the years of
1000s+ support, membership in the supported clusters increased with over 60%. This increase is not fully attribut-
able to 1000s+, but at least it indicates the allure of these POs to ungrouped farmers.
The case studies report the following improvements in service delivery by POs to their members:
• In the fish cluster in Ghana, a PO successfully lobbied to obtain permission to dig holes
for fish ponds in a mining area where this was previously not allowed. Whether this is
the result of 1000s+ training on lobby and advocacy, is difficult to establish;
• In the sorghum cluster in Nigeria, funds generated from membership dues are being
used to support the poorer farmers to buy inputs (albeit marginally);
• For the rice cluster in Benin, since 2007, the links of producer organization UNIRIZ-C with its
local structures (UCR) have become stronger because of more frequent contact within the cluster,
with a more regular payment of membership fees as one of its positive consequences;
• In Niger, the PO promoter of the cheese cluster (DEBBO) could be instrumental to scale
out the positive effects of cheese production and marketing which is now only reaching
26 women, whereas the PO reports a potential reach of 75000 farmers;
54 | SAADA Evaluation 2006-2009
• In the maize cluster in Burkina Faso, organized (group) sale has become a practice after 4 years of
1000s+ support. POs are now capable to facilitate collective bargaining and provide their members
with useful information about production techniques, prices and availability of inputs etc;
Generally speaking, improvements in service delivery reported by stakeholders include a strengthened collective
purchase of inputs, group sale, the availability of more market information and knowledge about ISFM, production
techniques, demonstration sites, stronger lobby etc. In some cases, POs directly function as service providers to the
supported cluster, as in the case of Togo where producer organization ANPAT has been sub-contracted to sensitize
its members on yellow maize and the organization UAR to support farmers in elaboration of action plans. This
unlike e.g. Benin where all POs are required to contract an external BSS.
It is noted that the longer the clusters have been supported by 1000s+, the more positive its members are about
their services. For the case study clusters that started in 2008 (Niger, Nigeria and Togo), 1000s+ support has been
too short to observe substantial service improvements, although it is remarkable that farmers of recent clusters
have started talking business and perceiving opportunities.
Finally, well-structured, commodity-based organizations have the potential to generate internal resources, which
could, among others, be used for hiring own staff and service providers (such as trainers). Just a few of the POs in
the selected case studies reported having a collective bank account.
Î Summarizing the findings in this section, we maintain that the capacity-strengthening services delivered by
the 1000s+ project are likely to have contributed towards making producer organizations more effective. POs
supported by the program are increasingly capable to represent and serve their members. The exact contribu-
tion of 1000s+ is hard to quantify, since many POs are supported by other donors too, or have been so prior
to the start of 1000s+ support.
| 55
4 . Ab-cluster access to services, finance, technology and information
Introduction
While the survey conducted in all countries showed high appreciation by stakeholders for the capacity strength-
ening services delivered by 1000s+ (chapter 3), the statements regarding increased access to services, finance
and information were scored significantly (8%) lower, indicating less appreciation for the results attained in this
regard.
Indeed, as we will see in this chapter, results in the fields of improved access for cluster actors to services, resources,
technologies and information have been mixed. While impressive results have been attained for access to inputs
and technology, achievements in the field of increased access to private services, information and markets have
been modest. Access to finance remains challenging for most cluster actors.
4 .1 privATE SErvicE proviSion
To what extent has the program achieved that farmers are more effectively served by private service providers?
4 .1 .1 farmers’ access to private services
The question to be answered in this section is whether farmers as a result of the program have increased access to
private services such as processing, trade and marketing and veterinary care. Both our general (interviews, survey,
desk study) and in-depth (case studies) research point at two conclusions in this light:
1. Many new relations have been created in clusters, both within and between groups of actors.
The contacts are there and actors increasingly know how to make use of them;
2. However, few of these relations have thus far resulted in stable economic transactions among cluster actors.
And, stakeholder collaboration is not inducing the elaboration of bankable business plans. Many of the expected
benefits from bringing actors together in a cluster appear not to have (yet) materialized. It must however be
acknowledged that there is an inevitable delay between capacity strengthening and actual change in behavior.
The former is described in this section, the latter in section 4.2 below.
M&E data indicate that:
• an average cluster is composed of 4-5 different actor groups
• about 4.000 local entrepreneurs were involved in the supported clusters at the end of 2009
Case studies, combined with validation workshops, confirm that these figures are realistic. The number of unique
private service providers is estimated around 1.500, given that various entrepreneurs are involved in more than one
cluster.
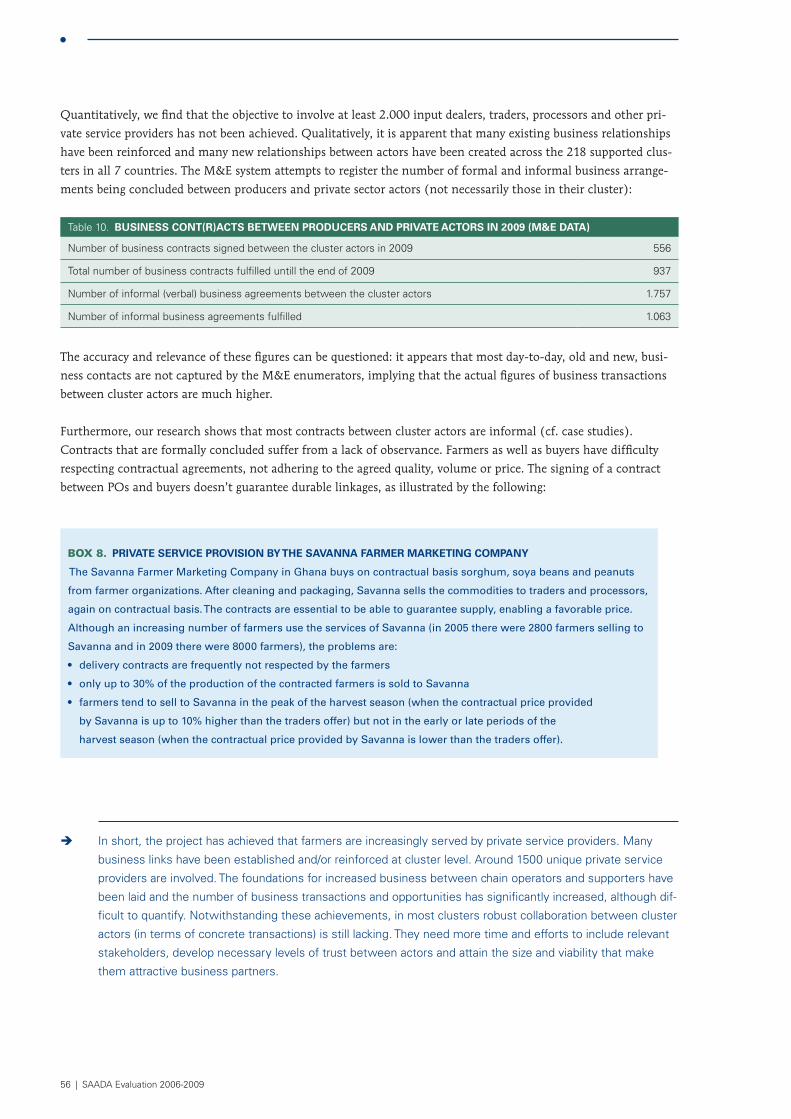
56 | SAADA Evaluation 2006-2009
Quantitatively, we find that the objective to involve at least 2.000 input dealers, traders, processors and other pri-
vate service providers has not been achieved. Qualitatively, it is apparent that many existing business relationships
have been reinforced and many new relationships between actors have been created across the 218 supported clus-
ters in all 7 countries. The M&E system attempts to register the number of formal and informal business arrange-
ments being concluded between producers and private sector actors (not necessarily those in their cluster):
Table 10. buSiNeSS CoNT(r)aCTS beTweeN ProDuCerS aND PrivaTe aCTorS iN 2009 (m&e DaTa)
Number of business contracts signed between the cluster actors in 2009 556
Total number of business contracts fulfilled untill the end of 2009 937
Number of informal (verbal) business agreements between the cluster actors 1.757
Number of informal business agreements fulfilled 1.063
The accuracy and relevance of these figures can be questioned: it appears that most day-to-day, old and new, busi-
ness contacts are not captured by the M&E enumerators, implying that the actual figures of business transactions
between cluster actors are much higher.
Furthermore, our research shows that most contracts between cluster actors are informal (cf. case studies).
Contracts that are formally concluded suffer from a lack of observance. Farmers as well as buyers have difficulty
respecting contractual agreements, not adhering to the agreed quality, volume or price. The signing of a contract
between POs and buyers doesn’t guarantee durable linkages, as illustrated by the following:
Box 8. PrivaTe ServiCe ProviSioN by The SavaNNa Farmer marKeTiNg ComPaNy
The Savanna Farmer Marketing Company in Ghana buys on contractual basis sorghum, soya beans and peanuts
from farmer organizations. After cleaning and packaging, Savanna sells the commodities to traders and processors,
again on contractual basis. The contracts are essential to be able to guarantee supply, enabling a favorable price.
Although an increasing number of farmers use the services of Savanna (in 2005 there were 2800 farmers selling to
Savanna and in 2009 there were 8000 farmers), the problems are:
• delivery contracts are frequently not respected by the farmers
• only up to 30% of the production of the contracted farmers is sold to Savanna
• farmers tend to sell to Savanna in the peak of the harvest season (when the contractual price provided
by Savanna is up to 10% higher than the traders offer) but not in the early or late periods of the
harvest season (when the contractual price provided by Savanna is lower than the traders offer).
Î In short, the project has achieved that farmers are increasingly served by private service providers. Many
business links have been established and/or reinforced at cluster level. Around 1500 unique private service
providers are involved. The foundations for increased business between chain operators and supporters have
been laid and the number of business transactions and opportunities has significantly increased, although dif-
ficult to quantify. Notwithstanding these achievements, in most clusters robust collaboration between cluster
actors (in terms of concrete transactions) is still lacking. They need more time and efforts to include relevant
stakeholders, develop necessary levels of trust between actors and attain the size and viability that make
them attractive business partners.
| 57
4 .2 rESourcE mobiLizATion
has the program contributed towards increasing or leveraging resources from other sources? Support to resource mobilization
In chapter 3, we asserted that the large part of capacity-building services delivered by 1000s+ has concerned the
more ‘technical aspects’ of value chain development: training in the CASE approach, production and processing
techniques, integrated soil fertility management, etc. As the overview of CB-services for the 7 case studies (table
9, section 3.1.1) showed, business-oriented training comprised perhaps 20% of total training received. With more
clusters maturing, the focus is gradually shifting to more business-oriented training. To support resource mobiliza-
tion at cluster level, the following services were delivered:
• Training to farmers on record-keeping
• Cost-benefit /gross margin analysis
• Business plan development
• Financial management
• Marketing
The extent to which clusters have included these issues in their action plans greatly differs. Training farmers in
record-keeping appears to be a standard (and very important) activity found across clusters. Whether the other
items were addressed is determined by aspects as: number of years support to the cluster, level of organization
and professionalism of cluster actors; success of introduction of improved production, harvesting and processing
techniques and the business-orientation of the BSS and AB cluster advisor. In general, actors note that training on
financial aspects, in particular writing a business plan, has been limited.
In addition to capacity-building on financial and business aspects, 1000s+ has undertaken various efforts to sup-
port resource mobilization at cluster level, mainly through National Steering Committees (NSCs), AB cluster advi-
sors, PO advisors and BSSs. For instance:
• NSC members in various countries, while visiting clusters for monitoring purposes,
were able to establish high-level links with interesting actors in the region;
• In Benin, the BSS ‘DEDRAS’, supporting the cashew value chain, managed to attract funds from the Millennium
Challenge Account. At the local level, the BSS (together with the AB cluster advisor) assisted producer
organizations to enter into partnerships with parties as VECO, PAFIRIZ, MCA, GTZ, AFDI, DED, etc.
• In Togo, international cooperation did not fully restart. Now that donors are progressively coming back,
IFDC Togo is watching out for opportunities. For instance, the SAADA staff member in charge of rural
finance organized an excursion and sharing visit between staff members of the Banque Regionale de
Solidarity (BRS) from Benin, Togo and Burkina Faso to the Banque Nationale pour le Développement
Agricole (BNDA) in Mali. In Togo, BRS has subsequently provided credit to some cluster actors.
• The AB Cluster Advisor in Nigeria makes a point of actively linking the clusters in his country
to donors and negotiating in-kind contributions from the governments of the 5 states in which
SAADA is operating for free use of transport, agricultural inputs etc. Owing to his efforts, other
donors now providing kind and cash include the UNDP Millennium Village (groundnuts cluster
Kaduna) and the World Bank BDS project (catfish cluster Kaduna). For 2010, guaranteed cash
contributions to the program comprise 200.000 USD by DFID and 20.00 USD by BiD Network;
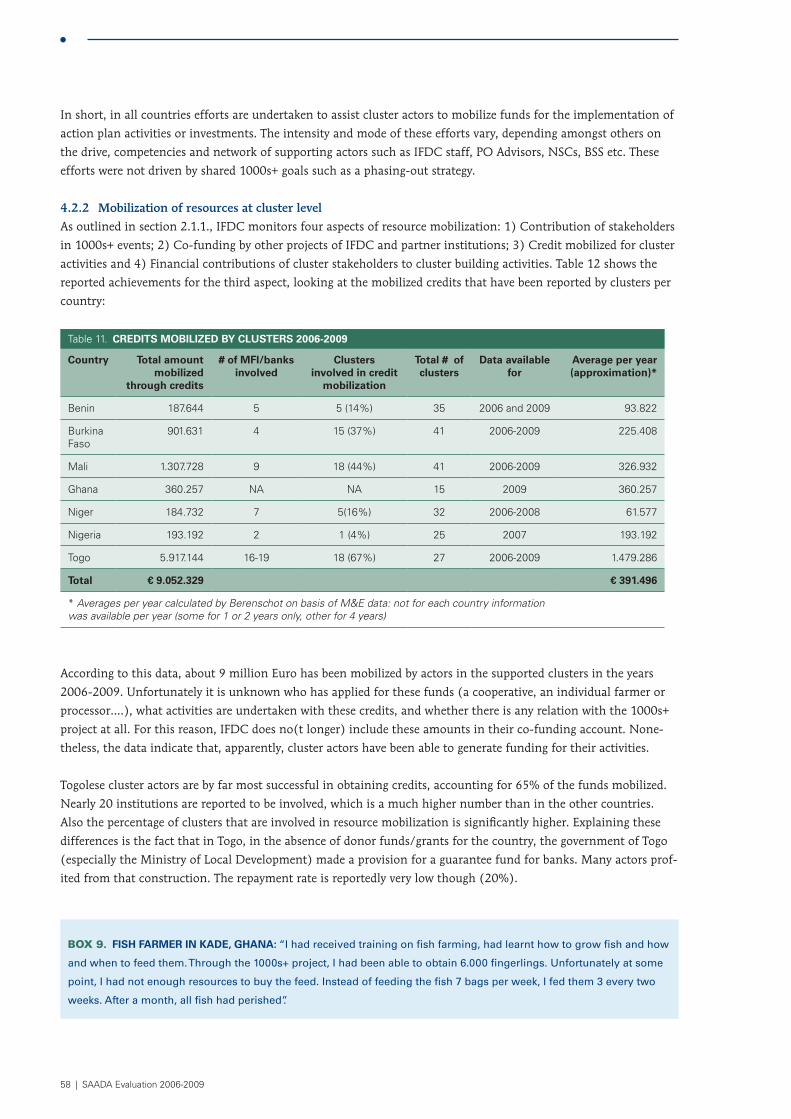
58 | SAADA Evaluation 2006-2009
In short, in all countries efforts are undertaken to assist cluster actors to mobilize funds for the implementation of
action plan activities or investments. The intensity and mode of these efforts vary, depending amongst others on
the drive, competencies and network of supporting actors such as IFDC staff, PO Advisors, NSCs, BSS etc. These
efforts were not driven by shared 1000s+ goals such as a phasing-out strategy.
4 .2 .2 mobilization of resources at cluster level
As outlined in section 2.1.1., IFDC monitors four aspects of resource mobilization: 1) Contribution of stakeholders
in 1000s+ events; 2) Co-funding by other projects of IFDC and partner institutions; 3) Credit mobilized for cluster
activities and 4) Financial contributions of cluster stakeholders to cluster building activities. Table 12 shows the
reported achievements for the third aspect, looking at the mobilized credits that have been reported by clusters per
country:
Table 11. CreDiTS mobilizeD by CluSTerS 2006-2009
Country Total amount mobilized
through credits
# of mFi/banks involved
Clusters involved in credit
mobilization
Total # of clusters
Data available for
average per year (approximation)*
Benin 187.644 5 5 (14%) 35 2006 and 2009 93.822
Burkina Faso
901.631 4 15 (37%) 41 2006-2009 225.408
Mali 1.307.728 9 18 (44%) 41 2006-2009 326.932
Ghana 360.257 NA NA 15 2009 360.257
Niger 184.732 7 5(16%) 32 2006-2008 61.577
Nigeria 193.192 2 1 (4%) 25 2007 193.192
Togo 5.917.144 16-19 18 (67%) 27 2006-2009 1.479.286
Total € 9.052.329 € 391.496
* Averages per year calculated by Berenschot on basis of M&E data: not for each country information was available per year (some for 1 or 2 years only, other for 4 years)
According to this data, about 9 million Euro has been mobilized by actors in the supported clusters in the years
2006-2009. Unfortunately it is unknown who has applied for these funds (a cooperative, an individual farmer or
processor….), what activities are undertaken with these credits, and whether there is any relation with the 1000s+
project at all. For this reason, IFDC does no(t longer) include these amounts in their co-funding account. None-
theless, the data indicate that, apparently, cluster actors have been able to generate funding for their activities.
Togolese cluster actors are by far most successful in obtaining credits, accounting for 65% of the funds mobilized.
Nearly 20 institutions are reported to be involved, which is a much higher number than in the other countries.
Also the percentage of clusters that are involved in resource mobilization is significantly higher. Explaining these
differences is the fact that in Togo, in the absence of donor funds/grants for the country, the government of Togo
(especially the Ministry of Local Development) made a provision for a guarantee fund for banks. Many actors prof-
ited from that construction. The repayment rate is reportedly very low though (20%).
Box 9. FiSh Farmer iN KaDe, ghaNa: “I had received training on fish farming, had learnt how to grow fish and how
and when to feed them. Through the 1000s+ project, I had been able to obtain 6.000 fingerlings. Unfortunately at some
point, I had not enough resources to buy the feed. Instead of feeding the fish 7 bags per week, I fed them 3 every two
weeks. After a month, all fish had perished”.
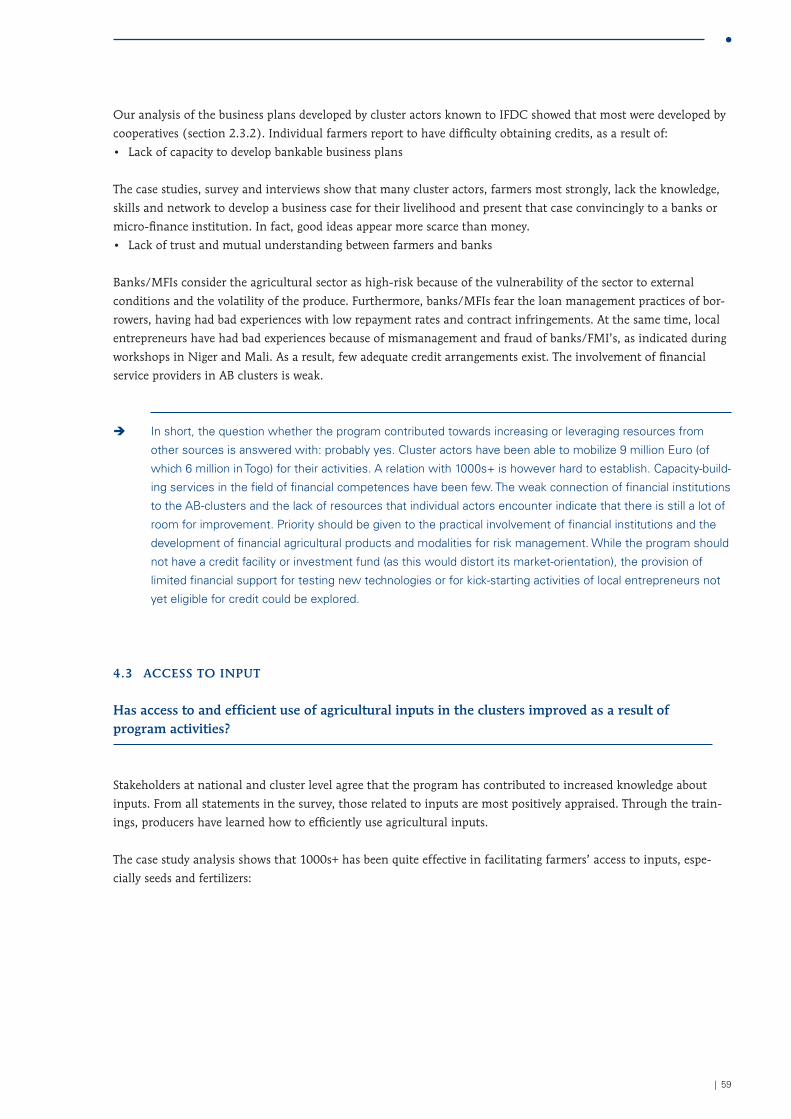
| 59
Our analysis of the business plans developed by cluster actors known to IFDC showed that most were developed by
cooperatives (section 2.3.2). Individual farmers report to have difficulty obtaining credits, as a result of:
• Lack of capacity to develop bankable business plans
The case studies, survey and interviews show that many cluster actors, farmers most strongly, lack the knowledge,
skills and network to develop a business case for their livelihood and present that case convincingly to a banks or
micro-finance institution. In fact, good ideas appear more scarce than money.
• Lack of trust and mutual understanding between farmers and banks
Banks/MFIs consider the agricultural sector as high-risk because of the vulnerability of the sector to external
conditions and the volatility of the produce. Furthermore, banks/MFIs fear the loan management practices of bor-
rowers, having had bad experiences with low repayment rates and contract infringements. At the same time, local
entrepreneurs have had bad experiences because of mismanagement and fraud of banks/FMI’s, as indicated during
workshops in Niger and Mali. As a result, few adequate credit arrangements exist. The involvement of financial
service providers in AB clusters is weak.
Î In short, the question whether the program contributed towards increasing or leveraging resources from
other sources is answered with: probably yes. Cluster actors have been able to mobilize 9 million Euro (of
which 6 million in Togo) for their activities. A relation with 1000s+ is however hard to establish. Capacity-build-
ing services in the field of financial competences have been few. The weak connection of financial institutions
to the AB-clusters and the lack of resources that individual actors encounter indicate that there is still a lot of
room for improvement. Priority should be given to the practical involvement of financial institutions and the
development of financial agricultural products and modalities for risk management. While the program should
not have a credit facility or investment fund (as this would distort its market-orientation), the provision of
limited financial support for testing new technologies or for kick-starting activities of local entrepreneurs not
yet eligible for credit could be explored.
4 .3 AccESS To inpuT
has access to and efficient use of agricultural inputs in the clusters improved as a result of program activities?
Stakeholders at national and cluster level agree that the program has contributed to increased knowledge about
inputs. From all statements in the survey, those related to inputs are most positively appraised. Through the train-
ings, producers have learned how to efficiently use agricultural inputs.
The case study analysis shows that 1000s+ has been quite effective in facilitating farmers’ access to inputs, espe-
cially seeds and fertilizers:
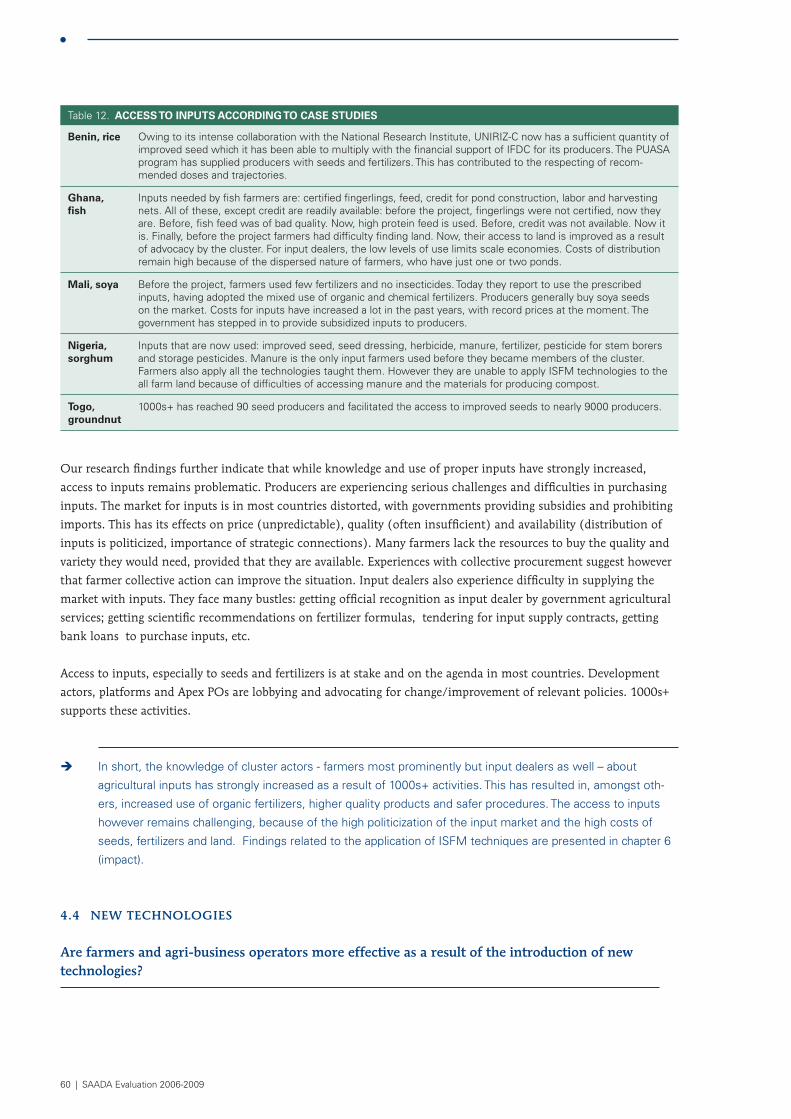
60 | SAADA Evaluation 2006-2009
Table 12. aCCeSS To iNPuTS aCCorDiNg To CaSe STuDieS
benin, rice Owing to its intense collaboration with the National Research Institute, UNIRIZ-C now has a sufficient quantity of improved seed which it has been able to multiply with the financial support of IFDC for its producers. The PUASA program has supplied producers with seeds and fertilizers. This has contributed to the respecting of recom-mended doses and trajectories.
ghana, fish
Inputs needed by fish farmers are: certified fingerlings, feed, credit for pond construction, labor and harvesting nets. All of these, except credit are readily available: before the project, fingerlings were not certified, now they are. Before, fish feed was of bad quality. Now, high protein feed is used. Before, credit was not available. Now it is. Finally, before the project farmers had difficulty finding land. Now, their access to land is improved as a result of advocacy by the cluster. For input dealers, the low levels of use limits scale economies. Costs of distribution remain high because of the dispersed nature of farmers, who have just one or two ponds.
mali, soya Before the project, farmers used few fertilizers and no insecticides. Today they report to use the prescribed inputs, having adopted the mixed use of organic and chemical fertilizers. Producers generally buy soya seeds on the market. Costs for inputs have increased a lot in the past years, with record prices at the moment. The government has stepped in to provide subsidized inputs to producers.
Nigeria, sorghum
Inputs that are now used: improved seed, seed dressing, herbicide, manure, fertilizer, pesticide for stem borers and storage pesticides. Manure is the only input farmers used before they became members of the cluster. Farmers also apply all the technologies taught them. However they are unable to apply ISFM technologies to the all farm land because of difficulties of accessing manure and the materials for producing compost.
Togo, groundnut
1000s+ has reached 90 seed producers and facilitated the access to improved seeds to nearly 9000 producers.
Our research findings further indicate that while knowledge and use of proper inputs have strongly increased,
access to inputs remains problematic. Producers are experiencing serious challenges and difficulties in purchasing
inputs. The market for inputs is in most countries distorted, with governments providing subsidies and prohibiting
imports. This has its effects on price (unpredictable), quality (often insufficient) and availability (distribution of
inputs is politicized, importance of strategic connections). Many farmers lack the resources to buy the quality and
variety they would need, provided that they are available. Experiences with collective procurement suggest however
that farmer collective action can improve the situation. Input dealers also experience difficulty in supplying the
market with inputs. They face many bustles: getting official recognition as input dealer by government agricultural
services; getting scientific recommendations on fertilizer formulas, tendering for input supply contracts, getting
bank loans to purchase inputs, etc.
Access to inputs, especially to seeds and fertilizers is at stake and on the agenda in most countries. Development
actors, platforms and Apex POs are lobbying and advocating for change/improvement of relevant policies. 1000s+
supports these activities.
Î In short, the knowledge of cluster actors - farmers most prominently but input dealers as well – about
agricultural inputs has strongly increased as a result of 1000s+ activities. This has resulted in, amongst oth-
ers, increased use of organic fertilizers, higher quality products and safer procedures. The access to inputs
however remains challenging, because of the high politicization of the input market and the high costs of
seeds, fertilizers and land. Findings related to the application of ISFM techniques are presented in chapter 6
(impact).
4 .4 nEw TEchnoLogiES
Are farmers and agri-business operators more effective as a result of the introduction of new technologies?
| 61
4 .4 .1 Technological innovations
For this section, three sources of information are used: M&E database, survey and case study.
Firstly, the M&E database renders impressive outcomes as regards the numbers of technological innovations that
have been realized by the program. Cluster members confirm to have increasingly adopted the technologies advo-
cated by 1000s+. The evaluation team deems these figures reliable. It is noted that many of these technological
innovations have not been documented well, as a result of the AISSA network not being operational for a long time.
Table 13. TeChNologiCal iNNovaTioNS
indicators 2006 2007 2008 2009
Number of new agricultural technologies validated by farmers (for men/women)
42 117 146 359
Number of new livestock farming technologies validated by breeders(men/women)
3 8 24 55
Number of new storage, processing and handling technologies validated by local entrepreneurs (men/women)
48 109 227 368
Source M&E data
Respondents in the national-level survey were positive about the technological innovations brought about by the
1000s+ project. They confirm that new technologies are being used, although farmers are somewhat less positive
about these gains than IFDC staff and other actors. An explanation may be that less resource-endowed farmers feel
hampered in the adoption of the techniques, because they cannot make the necessary investments.
Lastly, looking at cluster level, we find the following changes:
Table 14. TeChNology aCCeSS aCCorDiNg To CaSe STuDieS
Case Assessment local consultants
benin, rice 1000s+ has contributed to the adoption of new practices by a) financial assistance to training activities; b) exten-sion of practices to 427 producers; c) making available inputs for the production of certified seeds and d) facilitat-ing relations between UNIRIZ and other actors.
burkina Faso, maize
Prior to the project, farmers did not use chemical fertilizers. It is because of the intensification of maize advo-cated by the project that natural fertilization techniques combined with chemical inputs has become the present-day reality. 1000s+ provides regularly information about new technologies. However, the collaboration with research institutes remains limited to study tours.
ghana, fish
The innovations that farmers have been taught and are using are following good agricultural practices in aquacul-ture: site selection, soil suitability testing, preservation of fish to reduce post-harvest losses, pond management to ensure high productivity, water management, proper pond construction, appropriate methods of applying manure. In addition, farmers have shifted from the old practice of stocking ponds with fingerlings from the wild to stocking with all male fingerlings. Depending on the type of technology, farmers estimate that 70-90% of them are using the new technologies.The Directorate of Fisheries/Ministry of Food and agriculture is the source of most of the technologies. Input dealers also provide advice on how to use their inputs. Finally farmers share information gained from experience. 1000s+ supported the Ministry to provide this technical innovation to partners. The technology transfer activities are included in action plans and 100% financed by 1000s+.
mali, soya Production increases are due primarily to the impact of innovations rather than an increase in area under produc-tion. The new techniques on fertilization, production, conservation and marketing have brought about economic gains. The technologies are positively appraised.
Niger, milk Newly introduced technologies: modern transformation techniques for milk into cheese; hygiene practices and use of lactoserum.
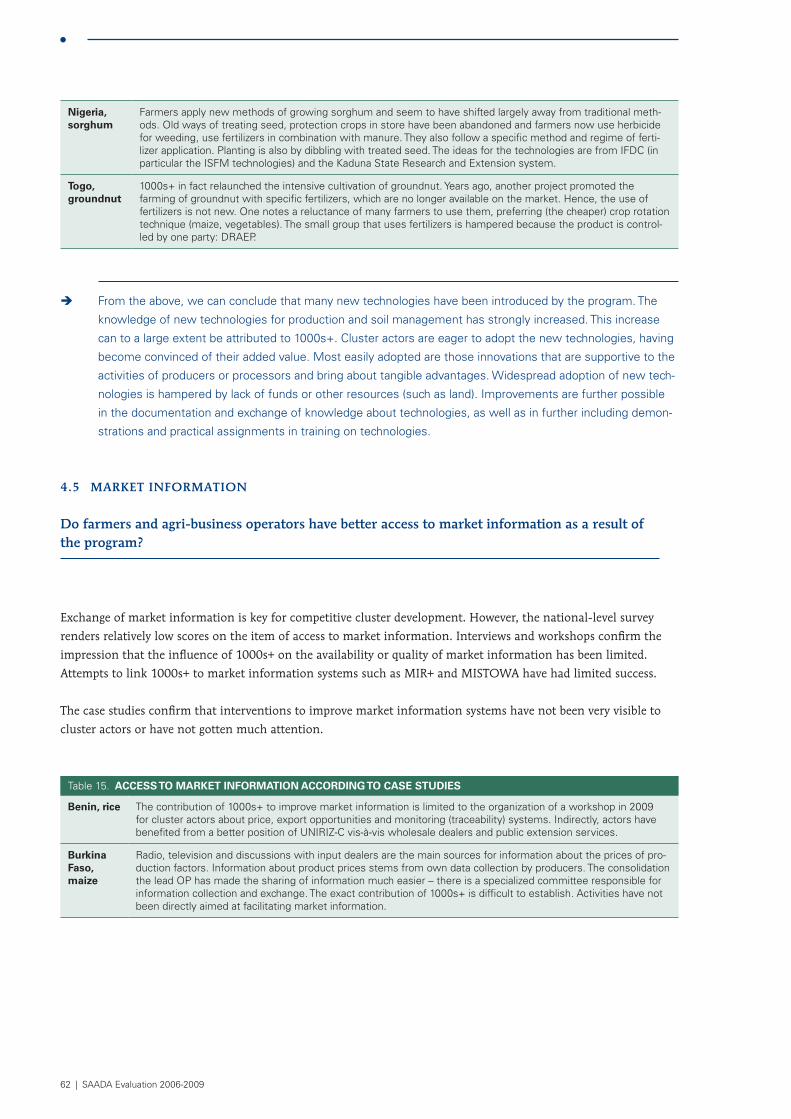
62 | SAADA Evaluation 2006-2009
Nigeria, sorghum
Farmers apply new methods of growing sorghum and seem to have shifted largely away from traditional meth-ods. Old ways of treating seed, protection crops in store have been abandoned and farmers now use herbicide for weeding, use fertilizers in combination with manure. They also follow a specific method and regime of ferti-lizer application. Planting is also by dibbling with treated seed. The ideas for the technologies are from IFDC (in particular the ISFM technologies) and the Kaduna State Research and Extension system.
Togo, groundnut
1000s+ in fact relaunched the intensive cultivation of groundnut. Years ago, another project promoted the farming of groundnut with specific fertilizers, which are no longer available on the market. Hence, the use of fertilizers is not new. One notes a reluctance of many farmers to use them, preferring (the cheaper) crop rotation technique (maize, vegetables). The small group that uses fertilizers is hampered because the product is control-led by one party: DRAEP.
Î From the above, we can conclude that many new technologies have been introduced by the program. The
knowledge of new technologies for production and soil management has strongly increased. This increase
can to a large extent be attributed to 1000s+. Cluster actors are eager to adopt the new technologies, having
become convinced of their added value. Most easily adopted are those innovations that are supportive to the
activities of producers or processors and bring about tangible advantages. Widespread adoption of new tech-
nologies is hampered by lack of funds or other resources (such as land). Improvements are further possible
in the documentation and exchange of knowledge about technologies, as well as in further including demon-
strations and practical assignments in training on technologies.
4 .5 mArkET informATion
Do farmers and agri-business operators have better access to market information as a result of the program?
Exchange of market information is key for competitive cluster development. However, the national-level survey
renders relatively low scores on the item of access to market information. Interviews and workshops confirm the
impression that the influence of 1000s+ on the availability or quality of market information has been limited.
Attempts to link 1000s+ to market information systems such as MIR+ and MISTOWA have had limited success.
The case studies confirm that interventions to improve market information systems have not been very visible to
cluster actors or have not gotten much attention.
Table 15. aCCeSS To marKeT iNFormaTioN aCCorDiNg To CaSe STuDieS
benin, rice The contribution of 1000s+ to improve market information is limited to the organization of a workshop in 2009 for cluster actors about price, export opportunities and monitoring (traceability) systems. Indirectly, actors have benefited from a better position of UNIRIZ-C vis-à-vis wholesale dealers and public extension services.
burkina Faso, maize
Radio, television and discussions with input dealers are the main sources for information about the prices of pro-duction factors. Information about product prices stems from own data collection by producers. The consolidation the lead OP has made the sharing of information much easier – there is a specialized committee responsible for information collection and exchange. The exact contribution of 1000s+ is difficult to establish. Activities have not been directly aimed at facilitating market information.
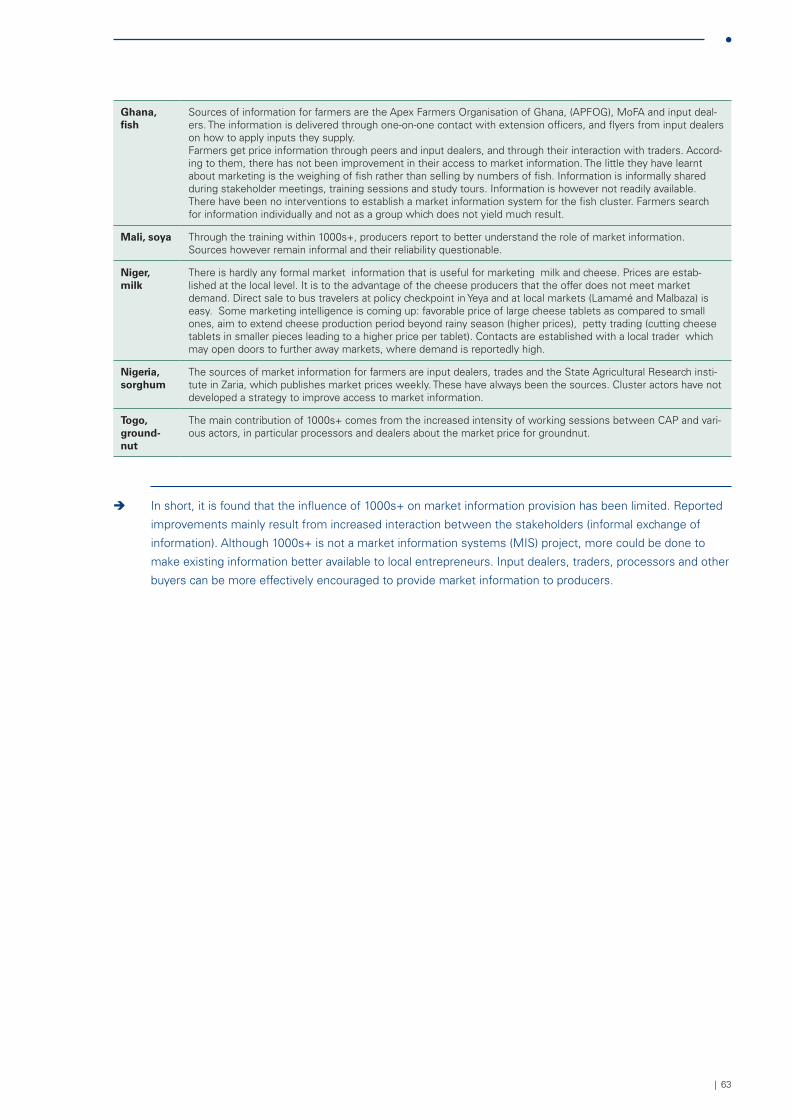
| 63
ghana, fish
Sources of information for farmers are the Apex Farmers Organisation of Ghana, (APFOG), MoFA and input deal-ers. The information is delivered through one-on-one contact with extension officers, and flyers from input dealers on how to apply inputs they supply.Farmers get price information through peers and input dealers, and through their interaction with traders. Accord-ing to them, there has not been improvement in their access to market information. The little they have learnt about marketing is the weighing of fish rather than selling by numbers of fish. Information is informally shared during stakeholder meetings, training sessions and study tours. Information is however not readily available. There have been no interventions to establish a market information system for the fish cluster. Farmers search for information individually and not as a group which does not yield much result.
mali, soya Through the training within 1000s+, producers report to better understand the role of market information. Sources however remain informal and their reliability questionable.
Niger, milk
There is hardly any formal market information that is useful for marketing milk and cheese. Prices are estab-lished at the local level. It is to the advantage of the cheese producers that the offer does not meet market demand. Direct sale to bus travelers at policy checkpoint in Yeya and at local markets (Lamamé and Malbaza) is easy. Some marketing intelligence is coming up: favorable price of large cheese tablets as compared to small ones, aim to extend cheese production period beyond rainy season (higher prices), petty trading (cutting cheese tablets in smaller pieces leading to a higher price per tablet). Contacts are established with a local trader which may open doors to further away markets, where demand is reportedly high.
Nigeria, sorghum
The sources of market information for farmers are input dealers, trades and the State Agricultural Research insti-tute in Zaria, which publishes market prices weekly. These have always been the sources. Cluster actors have not developed a strategy to improve access to market information.
Togo, ground-nut
The main contribution of 1000s+ comes from the increased intensity of working sessions between CAP and vari-ous actors, in particular processors and dealers about the market price for groundnut.
Î In short, it is found that the influence of 1000s+ on market information provision has been limited. Reported
improvements mainly result from increased interaction between the stakeholders (informal exchange of
information). Although 1000s+ is not a market information systems (MIS) project, more could be done to
make existing information better available to local entrepreneurs. Input dealers, traders, processors and other
buyers can be more effectively encouraged to provide market information to producers.

64 | SAADA Evaluation 2006-2009
| 65
5 . Enabling environment
• what have program implementers at regional and national level done to effectively improve the enabling environment?
• what have local stakeholders done to effectively improve the enabling environment?
Introduction
The influence of the program on the policy environment is one of the most difficult things to establish, because it
one of the most difficult things to achieve. In the previous chapter we saw that the large-scale uptake of innova-
tions is hampered because of ‘access’ problems. Many of these tend to have political components. In the CASE
approach, a conducive institutional environment is a key condition for the effective functioning of commodity
value chains. In the program set-up, it was hence foreseen that difficulties encountered by stakeholders at cluster
level would be aggregated and taken up by different project actors, such as ROPPA and National Steering Commit-
tees, to be addressed through advocacy.
In the national-level survey, the low score given to the program’s impact on the surrounding environment (13%
lower than average) suggests that respondents are sceptical about the impact of the 1000s+ project on the policy
and business environment although they perceive IFDC as an institution that has the position and capacity to do
so. They are more positive about effects at cluster and national level than at regional level, but assign high impor-
tance to the influence of other factors.
5 .1 rEgionAL poLicy EnvironmEnT
Interviews with ROPPA staff revealed that amongst the RAC members there is a predominant sentiment that
advocacy at regional level is not a task of a grassroots program such as SAADA/1000s+. Active support to regional
(West-African) policy development by SAADA is therefore exceptional. In 2006, IFDC supported the preparation
and implementation of a regional fertilizer summit and its follow-up. Only in the 2009 work plan, it was foreseen
that at least one advocacy/lobbying activity would be undertaken (for example on free movement of people and
goods). However, the 2009 report indicates on this activity: Not yet started. This activity is still to be further developed
and should be based upon constraints identified at the cluster and commodity chain levels.
• Beyond the framework of SAADA, ROPPA has undertaken advocacy and lobbying activities
at regional level towards ECOWAS and WAEMU, alone or in cooperation with West African
network of agriculture chambers and international NGOs. A few examples:
• Advocacy towards ECOWAS and WAEMU to take into account and to mention family farming in
ECOWAP and WAEMU policy, and not to promote large scale farms at the expense of small farmers;
• Contribution to implementation of ECOWAP (ECOWAS agriculture policy) and
WAEMU policy in countries through elaboration of PRIA and PNIA (Regional/National
Agriculture Investment Plans) in the frame of implementation of CAADP plans;
• ROPPA has advocated together with other actors to make ECOWAS and
WAEMU create Regional Funds for Agriculture Development;
66 | SAADA Evaluation 2006-2009
• ROPPA is partnering with research institutes (CORAF, CILSS, FARA, etc.) to persuade
ECOWAS and WAEMU to fund these institutes so research can be focused on the
regional specific relevant issues and not on northern donors interest.
• Lessons and experiences from 1000s+ led ROPPA to adopt a new structure with
two dimensions: political dimension (with advocacy and facilitation role) and
economic dimension (with support and promotion of value chains).
Finally, it can be said that SAADA contributes to the region’s leading regional agricultural policy plan:
Box 10. eCowaP/CaaDP. In 2005, the Economic Community of West African States (ECOWAS), jointly with the
African Union’s New Partnership for Africa’s Development (NEDAP), developed an action plan for the period 2005-
2010 for the development of the agricultural sector: the ECOWAP/CAADP action plan. The action plan provides the
framework for formulation and implementation of concrete investment programs at national and regional level. The
ECOWAP/CAADP action plan aims to contribute to improvements in terms of agricultural policies, agriculture com-
modity markets, income from agriculture, sustainable environment, enterprise development related to the agricul-
tural sector, and natural resource management. Member States have developed national action plans on the basis
of the framework. Without directly developing or improving regional policies, it is obvious that SAADA contributes
to the implementation of the ECOWAP/CAADP action plan, in particular to the sections on agriculture commodity
markets, income from agriculture, sustainable environment, enterprise development related to the agricultural sec-
tor, and natural resource management.
5 .2 nATionAL-LEvEL poLicy EnvironmEnT
Within the organizational set-up of the program, there are sufficient opportunities for influencing the policy
environment (think about the role of ROPPA, the NSCs, the PO advisors etc.). Whether this effectively works in
practice depends to a great extent on the specific actor constellations in the cluster and the country. It is remark-
able that the respondents in the survey for Nigeria are considerably more positive about the impact of the 1000s+
project on the policy environment than the respondents in other countries. It appears that in this country, more
has been achieved in terms of influencing the environment. One explanation may be that governmental agen-
cies in Nigeria are quite closely connected to the supported clusters, as in the example of the Kaduna Agricultural
Development Program (KADP) in the case study.
The SAADA monitoring data indicate an increase in lobbying events from 2006 to 2009:
Table 16. lobby eveNTS
2006 2007 2008 2009
Number of successful lobbying events towards a better business environment at local level
7 30 92 53
Number of successful lobbying events towards a better business environment at national or international level
2 21 31 23
These figures however, do not correspond with the totals from the country reports and are therefore considered
unreliable. In addition, the relevance of the indicator ‘successful lobbying event’ is debatable. The M&E database
| 67
does not capture qualitative achievements. Efforts are currently undertaken to collect success stories in the field of
policy influence, but these were not available yet. The evaluation team collected some examples of advocacy activi-
ties at national level:
Box 11. aDvoCaCy aT NaTioNal level. On the promotion of smart use of fertilizers in Ghana. Several IFDC
programs (amongst which Mistowa and SAADA) supported the Ghanaian government in:
• registration and training of input dealers (2007)
• the start of the Ghana Agro-dealers Development Project (2007)
• the elaboration by the Ministry of Food and Agriculture of a whitepaper on agro-input use (2008)
In Nigeria, subsidized fertilizer is distributed via governmental organizations, politicians, and the All Farmers As-
sociation of Nigeria (AFAN, the National Farmers Platform). AFAN received last year about 25% of the available
subsidized fertilizer. The subsidy percentages may vary from state to state and range from 25 to 50%. The volume of
the subsidized fertilizer is limited and part of it actually does not reach the Nigerian farmers (due to illegal export).
Subsidized fertilizer is often used as ‘reward’ for loyalty and its distribution is politicized. Farmers thus cannot count
on provision of subsidized fertilizer, and in addition distribution is often delayed. Meanwhile, the private market for
fertilizers is distorted, although buying more expensive from input dealers is often a better guarantee for timely
provision of sufficient quality fertilizer then waiting for uncertain provision of subsidized fertilizer. IFDC, through
SAADA, contributes to more transparency in subsidized fertilizer distribution by informing producers on distribution
procedures and by reinforcing producer organizations that may claim their rights.
Other examples were on road harassment (Togo) and access to loans for small farmers (Nigeria), contributions to
the ECOWAP/CAADP action plan (Benin).
5 .3 cLuSTEr-LEvEL poLicy EnvironmEnT
At cluster level, some positive effects of policy interventions have been reported:
Table 17. iNFlueNCe oN The PoliCy eNviroNmeNT – examPleS From The CaSe STuDieS
benin, rice The environment for rice cultivation is favorable. Political support is high and many support structures exist. With 1000s+ support, UNIRIZ has undertaken several lobby & advocacy actions. The main challenge remains rice dona-tions and imports. Work on this topic is not very successful to date.
burkina Faso, maize
The policy environment for the maize cluster in Koubri is favorable. National Steering Committee members partici-pate in national workshops, permitting them to align the project with governmental programs.
ghana, fish
There are positive aspects of the policy environment, including prioritization of fish farming in the food and agriculture policy, free extension services for farmers, and ban on importation of cultured fish. The high interest rates and generally low funding for agriculture has negatively affected the cluster activities. No successful lobby attempts have yet been reported (weak level of organization within the cluster).
mali, soya The producer organization Union Communale is increasingly taking up a role to advocate on behalf of its mem-bers. For instance when Ourekila was flooded during the harvesting season, Union Communale intervention resulted in the involvement of Yorosso officials.
Niger, milk
The major (informal) lobby activites were efforts of women and their organization DEBBO to convince local lead-ers to accept cheese production and marketing as a income generating activity for women. This was successful in 3 of the 5 sites. Economic performance, exemplified by higher daily income and contributions to household economy, contribute to the recognition that cheese production is good. Issues related to animal feeding and health have not been addressed. The national policies recognize that milk production has important potential to reduce poverty in rural areas. This recognition could be harnessed.
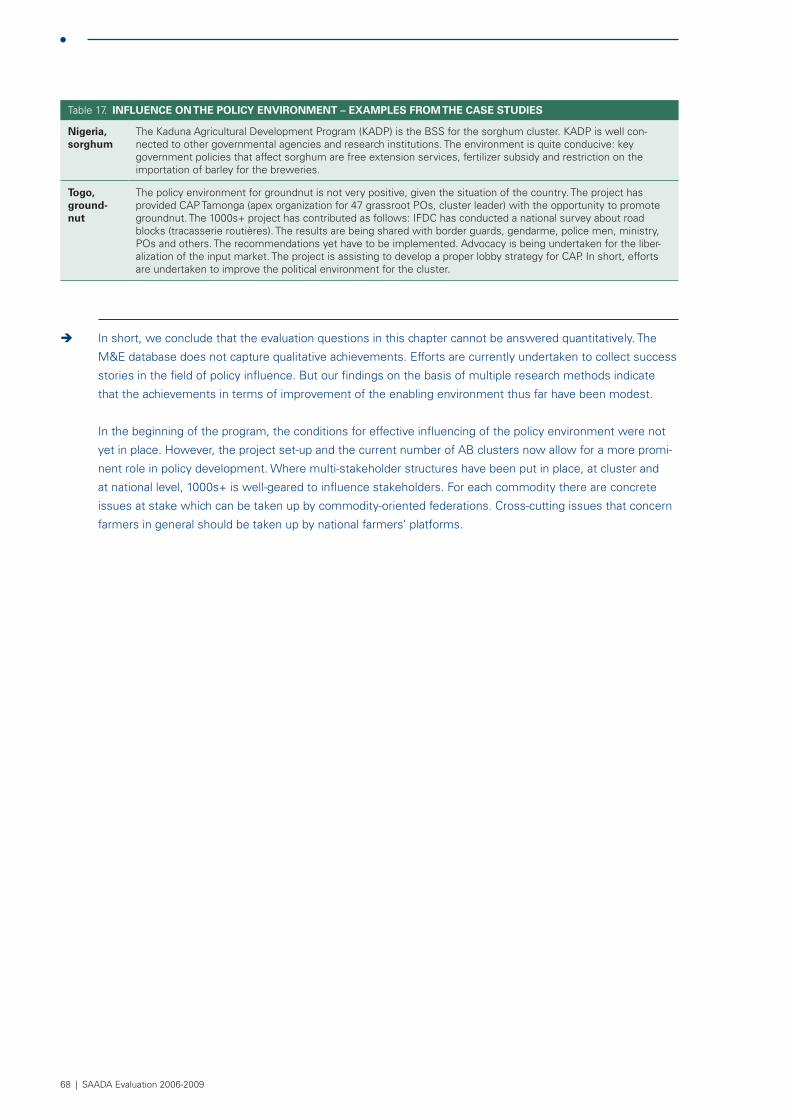
68 | SAADA Evaluation 2006-2009
Table 17. iNFlueNCe oN The PoliCy eNviroNmeNT – examPleS From The CaSe STuDieS
Nigeria, sorghum
The Kaduna Agricultural Development Program (KADP) is the BSS for the sorghum cluster. KADP is well con-nected to other governmental agencies and research institutions. The environment is quite conducive: key government policies that affect sorghum are free extension services, fertilizer subsidy and restriction on the importation of barley for the breweries.
Togo, ground-nut
The policy environment for groundnut is not very positive, given the situation of the country. The project has provided CAP Tamonga (apex organization for 47 grassroot POs, cluster leader) with the opportunity to promote groundnut. The 1000s+ project has contributed as follows: IFDC has conducted a national survey about road blocks (tracasserie routières). The results are being shared with border guards, gendarme, police men, ministry, POs and others. The recommendations yet have to be implemented. Advocacy is being undertaken for the liber-alization of the input market. The project is assisting to develop a proper lobby strategy for CAP. In short, efforts are undertaken to improve the political environment for the cluster.
Î In short, we conclude that the evaluation questions in this chapter cannot be answered quantitatively. The
M&E database does not capture qualitative achievements. Efforts are currently undertaken to collect success
stories in the field of policy influence. But our findings on the basis of multiple research methods indicate
that the achievements in terms of improvement of the enabling environment thus far have been modest.
In the beginning of the program, the conditions for effective influencing of the policy environment were not
yet in place. However, the project set-up and the current number of AB clusters now allow for a more promi-
nent role in policy development. Where multi-stakeholder structures have been put in place, at cluster and
at national level, 1000s+ is well-geared to influence stakeholders. For each commodity there are concrete
issues at stake which can be taken up by commodity-oriented federations. Cross-cutting issues that concern
farmers in general should be taken up by national farmers’ platforms.
| 69
6 . Sustainable impact
• To what extent has the program had a verifiable and measurable impact in terms of stated objectives in the target countries for SAADA A?
• what are the perceptions of stakeholders on the role of the program in the realization of the results?
• is there additional evidence that supports conclusions about the possible impact of the program?
Introduction
The purpose of the evaluation is, amongst others, to verify whether the reported impact gains have indeed been
realized. To establish this, we have conducted primary research at grass-root level: the case studies. The main
quantitative source of information in this chapter therefore are the case studies. The national-level survey and the
interviews conducted provided us with the more qualitative insights of 1000s+ impact. We start with the main
findings of the survey and zoom in at different aspects of impact achieved in the seven selected clusters. For a note
on the representativeness of the selected clusters, we refer to annex 2 on methodology.
Survey findings
In the survey, the chapter with statements about the sustainable impact of the 1000s+ project has received
relatively low scores (9% lower than average).
The survey reveals that according to respondents:
• 1000s+ has contributed strongly to increased agricultural productivity and
income and (less strongly) to improvement of food security;
• The program has contributed to some degree to increase in farm land under sustainable
cultivation, and to enhanced business for input dealers, traders, processors;
• These impact results cannot be entirely attributed to the interventions of 1000s+ - other
factors play an important role in the achievement of the impact objectives;
• The replication of the CASE approach is quite weak. It seems that the
realised impacts are limited to the involved clusters.
These findings are explored in the following.
6 .1 AgricuLTurAL proDucTiviTy
In the perception of the stakeholders consulted for this research, agricultural productivity strongly increased as a
result of SAADA. This perception is confirmed by the monitoring data: it is reported that an average of 99% change
in agricultural productivity has been achieved by 2009. The evaluation team makes the following comments:
• As was remarked by a regional IFDC staff member, the term ‘productivity’ is often confused with ‘production’.
It appears that the data discussed in this section indeed relate to production increases rather than productivity;
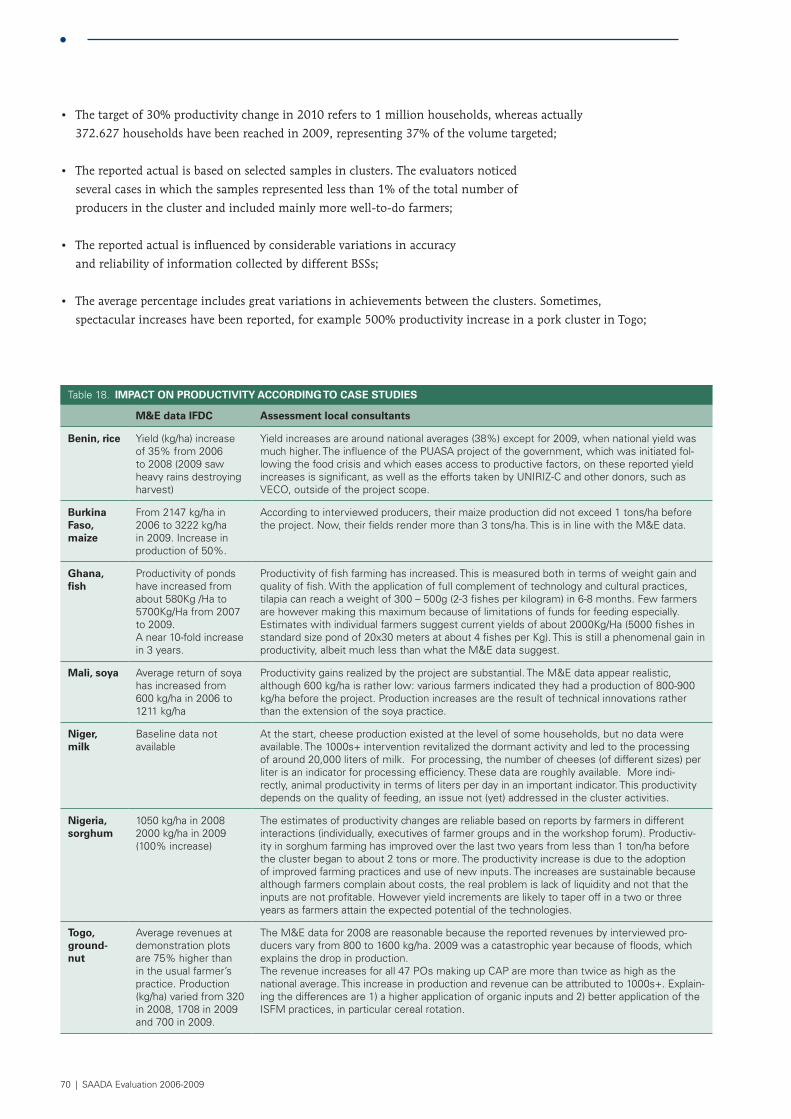
70 | SAADA Evaluation 2006-2009
• The target of 30% productivity change in 2010 refers to 1 million households, whereas actually
372.627 households have been reached in 2009, representing 37% of the volume targeted;
• The reported actual is based on selected samples in clusters. The evaluators noticed
several cases in which the samples represented less than 1% of the total number of
producers in the cluster and included mainly more well-to-do farmers;
• The reported actual is influenced by considerable variations in accuracy
and reliability of information collected by different BSSs;
• The average percentage includes great variations in achievements between the clusters. Sometimes,
spectacular increases have been reported, for example 500% productivity increase in a pork cluster in Togo;
Table 18. imPaCT oN ProDuCTiviTy aCCorDiNg To CaSe STuDieS
m&e data iFDC assessment local consultants
benin, rice Yield (kg/ha) increase of 35% from 2006 to 2008 (2009 saw heavy rains destroying harvest)
Yield increases are around national averages (38%) except for 2009, when national yield was much higher. The influence of the PUASA project of the government, which was initiated fol-lowing the food crisis and which eases access to productive factors, on these reported yield increases is significant, as well as the efforts taken by UNIRIZ-C and other donors, such as VECO, outside of the project scope.
burkina Faso, maize
From 2147 kg/ha in 2006 to 3222 kg/ha in 2009. Increase in production of 50%.
According to interviewed producers, their maize production did not exceed 1 tons/ha before the project. Now, their fields render more than 3 tons/ha. This is in line with the M&E data.
ghana, fish
Productivity of ponds have increased from about 580Kg /Ha to 5700Kg/Ha from 2007 to 2009. A near 10-fold increase in 3 years.
Productivity of fish farming has increased. This is measured both in terms of weight gain and quality of fish. With the application of full complement of technology and cultural practices, tilapia can reach a weight of 300 – 500g (2-3 fishes per kilogram) in 6-8 months. Few farmers are however making this maximum because of limitations of funds for feeding especially. Estimates with individual farmers suggest current yields of about 2000Kg/Ha (5000 fishes in standard size pond of 20x30 meters at about 4 fishes per Kg). This is still a phenomenal gain in productivity, albeit much less than what the M&E data suggest.
mali, soya Average return of soya has increased from 600 kg/ha in 2006 to 1211 kg/ha
Productivity gains realized by the project are substantial. The M&E data appear realistic, although 600 kg/ha is rather low: various farmers indicated they had a production of 800-900 kg/ha before the project. Production increases are the result of technical innovations rather than the extension of the soya practice.
Niger, milk
Baseline data not available
At the start, cheese production existed at the level of some households, but no data were available. The 1000s+ intervention revitalized the dormant activity and led to the processing of around 20,000 liters of milk. For processing, the number of cheeses (of different sizes) per liter is an indicator for processing efficiency. These data are roughly available. More indi-rectly, animal productivity in terms of liters per day in an important indicator. This productivity depends on the quality of feeding, an issue not (yet) addressed in the cluster activities.
Nigeria, sorghum
1050 kg/ha in 20082000 kg/ha in 2009(100% increase)
The estimates of productivity changes are reliable based on reports by farmers in different interactions (individually, executives of farmer groups and in the workshop forum). Productiv-ity in sorghum farming has improved over the last two years from less than 1 ton/ha before the cluster began to about 2 tons or more. The productivity increase is due to the adoption of improved farming practices and use of new inputs. The increases are sustainable because although farmers complain about costs, the real problem is lack of liquidity and not that the inputs are not profitable. However yield increments are likely to taper off in a two or three years as farmers attain the expected potential of the technologies.
Togo, ground-nut
Average revenues at demonstration plots are 75% higher than in the usual farmer’s practice. Production (kg/ha) varied from 320 in 2008, 1708 in 2009 and 700 in 2009.
The M&E data for 2008 are reasonable because the reported revenues by interviewed pro-ducers vary from 800 to 1600 kg/ha. 2009 was a catastrophic year because of floods, which explains the drop in production. The revenue increases for all 47 POs making up CAP are more than twice as high as the national average. This increase in production and revenue can be attributed to 1000s+. Explain-ing the differences are 1) a higher application of organic inputs and 2) better application of the ISFM practices, in particular cereal rotation.
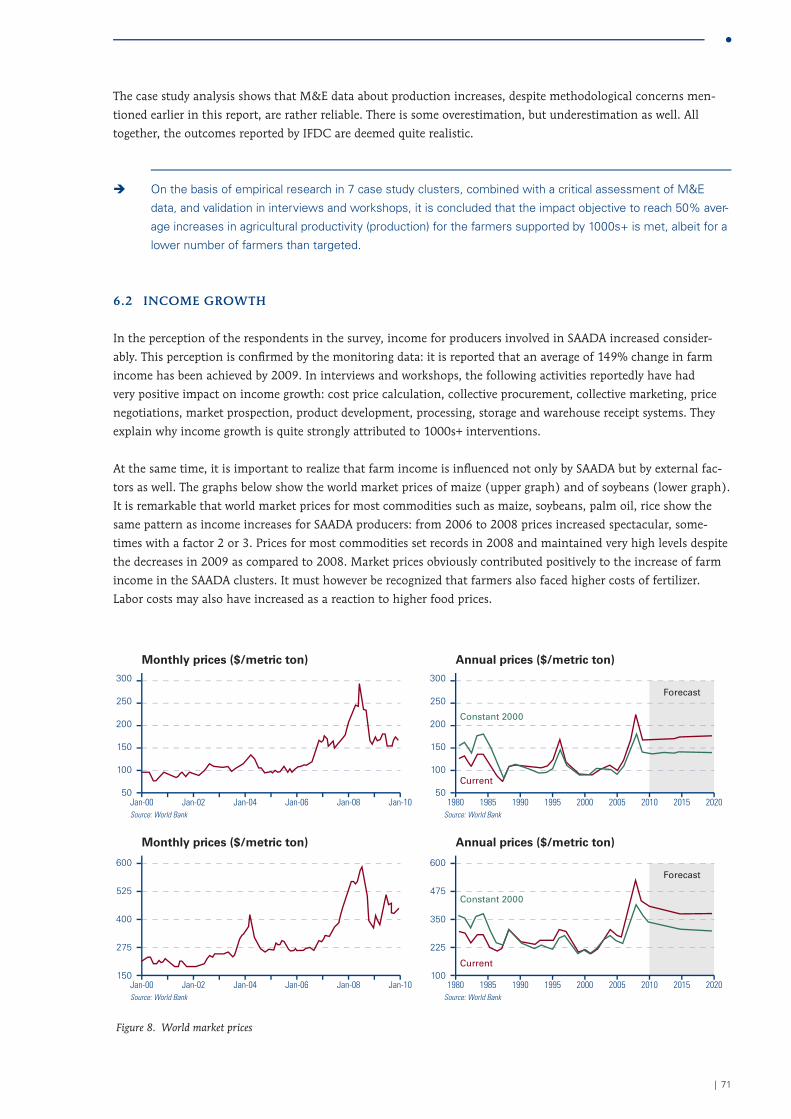
| 71
The case study analysis shows that M&E data about production increases, despite methodological concerns men-
tioned earlier in this report, are rather reliable. There is some overestimation, but underestimation as well. All
together, the outcomes reported by IFDC are deemed quite realistic.
Î On the basis of empirical research in 7 case study clusters, combined with a critical assessment of M&E
data, and validation in interviews and workshops, it is concluded that the impact objective to reach 50% aver-
age increases in agricultural productivity (production) for the farmers supported by 1000s+ is met, albeit for a
lower number of farmers than targeted.
6 .2 incomE growTh
In the perception of the respondents in the survey, income for producers involved in SAADA increased consider-
ably. This perception is confi rmed by the monitoring data: it is reported that an average of 149% change in farm
income has been achieved by 2009. In interviews and workshops, the following activities reportedly have had
very positive impact on income growth: cost price calculation, collective procurement, collective marketing, price
negotiations, market prospection, product development, processing, storage and warehouse receipt systems. They
explain why income growth is quite strongly attributed to 1000s+ interventions.
At the same time, it is important to realize that farm income is infl uenced not only by SAADA but by external fac-
tors as well. The graphs below show the world market prices of maize (upper graph) and of soybeans (lower graph).
It is remarkable that world market prices for most commodities such as maize, soybeans, palm oil, rice show the
same pattern as income increases for SAADA producers: from 2006 to 2008 prices increased spectacular, some-
times with a factor 2 or 3. Prices for most commodities set records in 2008 and maintained very high levels despite
the decreases in 2009 as compared to 2008. Market prices obviously contributed positively to the increase of farm
income in the SAADA clusters. It must however be recognized that farmers also faced higher costs of fertilizer.
Labor costs may also have increased as a reaction to higher food prices.
300
250
200
150
100
50Jan-00Source: World Bank
Jan-02 Jan-04 Jan-06 Jan-08 Jan-10
Monthly prices ($/metric ton)300
250
200
150
100
501980 1985 1990 1995 2000 2005 2010 2015 2020
Source: World Bank
Annual prices ($/metric ton)
Constant 2000
Current
Forecast
600
525
400
275
150Jan-00Source: World Bank
Jan-02 Jan-04 Jan-06 Jan-08 Jan-10
Monthly prices ($/metric ton)
600
475
350
225
1001980 1985 1990 1995 2000 2005 2010 2015 2020
Source: World Bank
Annual prices ($/metric ton)
Constant 2000
Current
Forecast
Figure 8. World market prices
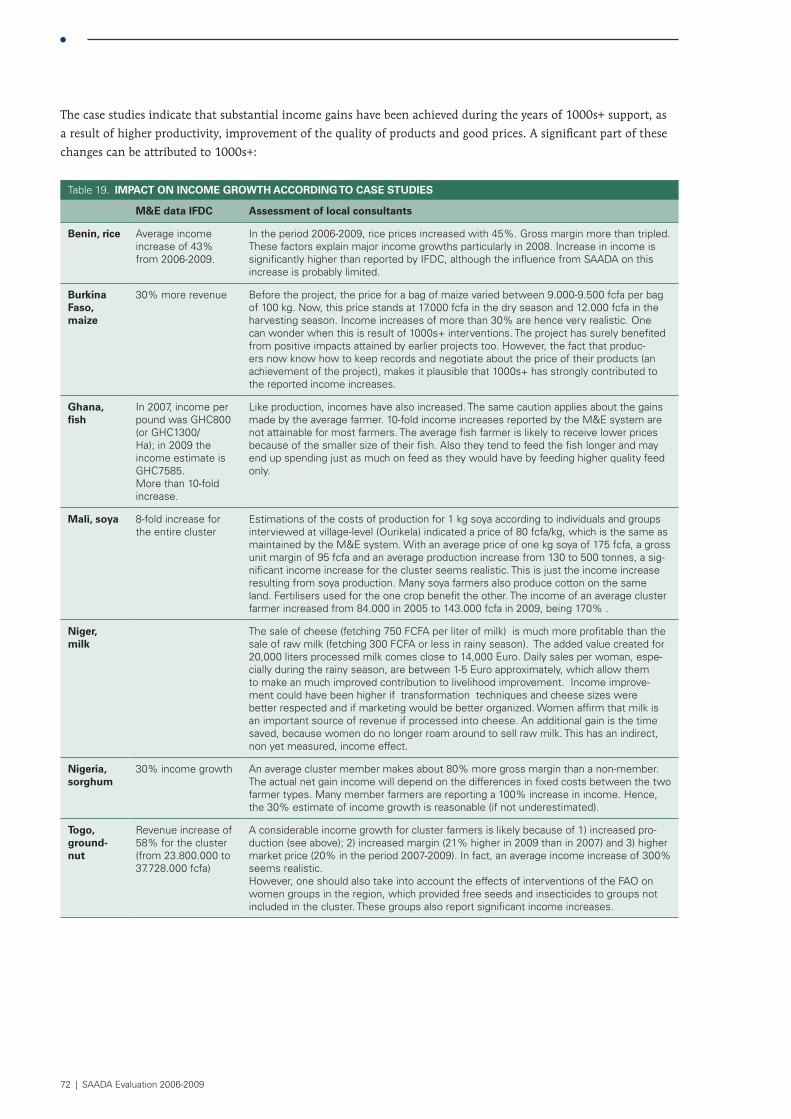
72 | SAADA Evaluation 2006-2009
The case studies indicate that substantial income gains have been achieved during the years of 1000s+ support, as
a result of higher productivity, improvement of the quality of products and good prices. A significant part of these
changes can be attributed to 1000s+:
Table 19. imPaCT oN iNCome growTh aCCorDiNg To CaSe STuDieS
m&e data iFDC assessment of local consultants
benin, rice Average income increase of 43% from 2006-2009.
In the period 2006-2009, rice prices increased with 45%. Gross margin more than tripled. These factors explain major income growths particularly in 2008. Increase in income is significantly higher than reported by IFDC, although the influence from SAADA on this increase is probably limited.
burkina Faso, maize
30% more revenue Before the project, the price for a bag of maize varied between 9.000-9.500 fcfa per bag of 100 kg. Now, this price stands at 17.000 fcfa in the dry season and 12.000 fcfa in the harvesting season. Income increases of more than 30% are hence very realistic. One can wonder when this is result of 1000s+ interventions. The project has surely benefited from positive impacts attained by earlier projects too. However, the fact that produc-ers now know how to keep records and negotiate about the price of their products (an achievement of the project), makes it plausible that 1000s+ has strongly contributed to the reported income increases.
ghana, fish
In 2007, income per pound was GHC800 (or GHC1300/Ha); in 2009 the income estimate is GHC7585.More than 10-fold increase.
Like production, incomes have also increased. The same caution applies about the gains made by the average farmer. 10-fold income increases reported by the M&E system are not attainable for most farmers. The average fish farmer is likely to receive lower prices because of the smaller size of their fish. Also they tend to feed the fish longer and may end up spending just as much on feed as they would have by feeding higher quality feed only.
mali, soya 8-fold increase for the entire cluster
Estimations of the costs of production for 1 kg soya according to individuals and groups interviewed at village-level (Ourikela) indicated a price of 80 fcfa/kg, which is the same as maintained by the M&E system. With an average price of one kg soya of 175 fcfa, a gross unit margin of 95 fcfa and an average production increase from 130 to 500 tonnes, a sig-nificant income increase for the cluster seems realistic. This is just the income increase resulting from soya production. Many soya farmers also produce cotton on the same land. Fertilisers used for the one crop benefit the other. The income of an average cluster farmer increased from 84.000 in 2005 to 143.000 fcfa in 2009, being 170% .
Niger, milk
The sale of cheese (fetching 750 FCFA per liter of milk) is much more profitable than the sale of raw milk (fetching 300 FCFA or less in rainy season). The added value created for 20,000 liters processed milk comes close to 14,000 Euro. Daily sales per woman, espe-cially during the rainy season, are between 1-5 Euro approximately, which allow them to make an much improved contribution to livelihood improvement. Income improve-ment could have been higher if transformation techniques and cheese sizes were better respected and if marketing would be better organized. Women affirm that milk is an important source of revenue if processed into cheese. An additional gain is the time saved, because women do no longer roam around to sell raw milk. This has an indirect, non yet measured, income effect.
Nigeria, sorghum
30% income growth An average cluster member makes about 80% more gross margin than a non-member. The actual net gain income will depend on the differences in fixed costs between the two farmer types. Many member farmers are reporting a 100% increase in income. Hence, the 30% estimate of income growth is reasonable (if not underestimated).
Togo, ground-nut
Revenue increase of 58% for the cluster (from 23.800.000 to 37.728.000 fcfa)
A considerable income growth for cluster farmers is likely because of 1) increased pro-duction (see above); 2) increased margin (21% higher in 2009 than in 2007) and 3) higher market price (20% in the period 2007-2009). In fact, an average income increase of 300% seems realistic. However, one should also take into account the effects of interventions of the FAO on women groups in the region, which provided free seeds and insecticides to groups not included in the cluster. These groups also report significant income increases.
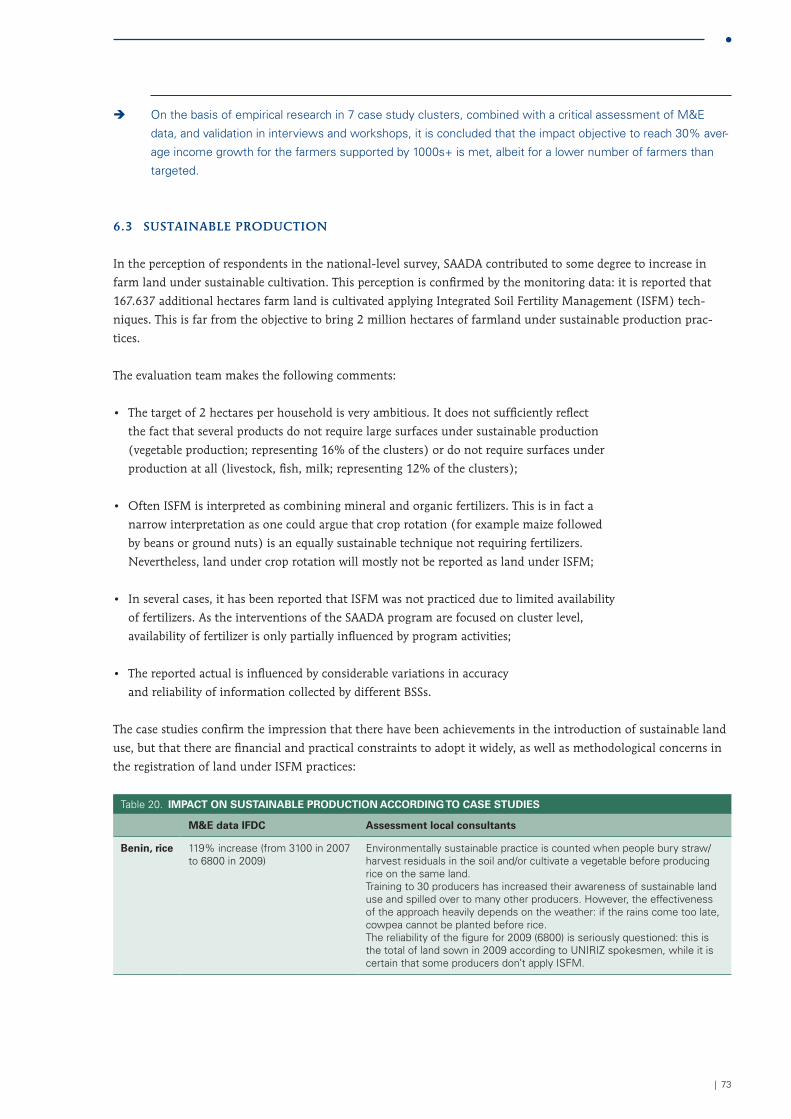
| 73
Î On the basis of empirical research in 7 case study clusters, combined with a critical assessment of M&E
data, and validation in interviews and workshops, it is concluded that the impact objective to reach 30% aver-
age income growth for the farmers supported by 1000s+ is met, albeit for a lower number of farmers than
targeted.
6 .3 SuSTAinAbLE proDucTion
In the perception of respondents in the national-level survey, SAADA contributed to some degree to increase in
farm land under sustainable cultivation. This perception is confirmed by the monitoring data: it is reported that
167.637 additional hectares farm land is cultivated applying Integrated Soil Fertility Management (ISFM) tech-
niques. This is far from the objective to bring 2 million hectares of farmland under sustainable production prac-
tices.
The evaluation team makes the following comments:
• The target of 2 hectares per household is very ambitious. It does not sufficiently reflect
the fact that several products do not require large surfaces under sustainable production
(vegetable production; representing 16% of the clusters) or do not require surfaces under
production at all (livestock, fish, milk; representing 12% of the clusters);
• Often ISFM is interpreted as combining mineral and organic fertilizers. This is in fact a
narrow interpretation as one could argue that crop rotation (for example maize followed
by beans or ground nuts) is an equally sustainable technique not requiring fertilizers.
Nevertheless, land under crop rotation will mostly not be reported as land under ISFM;
• In several cases, it has been reported that ISFM was not practiced due to limited availability
of fertilizers. As the interventions of the SAADA program are focused on cluster level,
availability of fertilizer is only partially influenced by program activities;
• The reported actual is influenced by considerable variations in accuracy
and reliability of information collected by different BSSs.
The case studies confirm the impression that there have been achievements in the introduction of sustainable land
use, but that there are financial and practical constraints to adopt it widely, as well as methodological concerns in
the registration of land under ISFM practices:
Table 20. imPaCT oN SuSTaiNable ProDuCTioN aCCorDiNg To CaSe STuDieS
m&e data iFDC assessment local consultants
benin, rice 119% increase (from 3100 in 2007 to 6800 in 2009)
Environmentally sustainable practice is counted when people bury straw/harvest residuals in the soil and/or cultivate a vegetable before producing rice on the same land.Training to 30 producers has increased their awareness of sustainable land use and spilled over to many other producers. However, the effectiveness of the approach heavily depends on the weather: if the rains come too late, cowpea cannot be planted before rice. The reliability of the figure for 2009 (6800) is seriously questioned: this is the total of land sown in 2009 according to UNIRIZ spokesmen, while it is certain that some producers don’t apply ISFM.
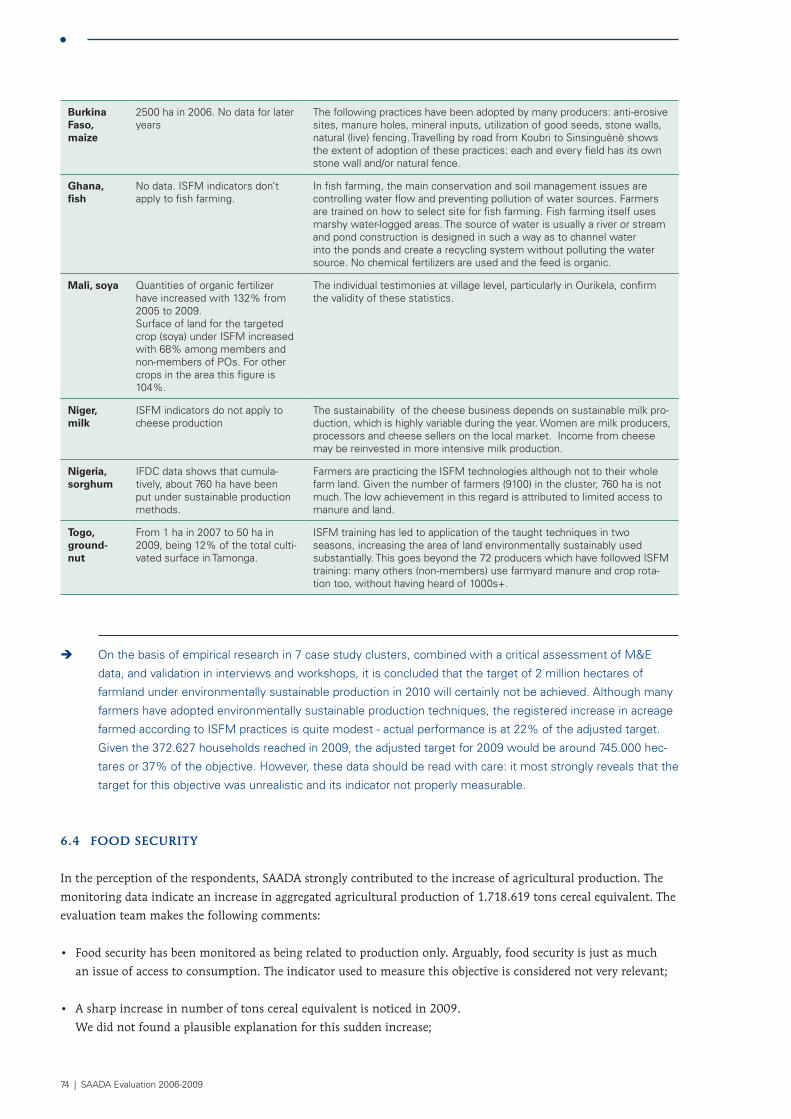
74 | SAADA Evaluation 2006-2009
burkina Faso, maize
2500 ha in 2006. No data for later years
The following practices have been adopted by many producers: anti-erosive sites, manure holes, mineral inputs, utilization of good seeds, stone walls, natural (live) fencing. Travelling by road from Koubri to Sinsinguènè shows the extent of adoption of these practices: each and every field has its own stone wall and/or natural fence.
ghana, fish
No data. ISFM indicators don’t apply to fish farming.
In fish farming, the main conservation and soil management issues are controlling water flow and preventing pollution of water sources. Farmers are trained on how to select site for fish farming. Fish farming itself uses marshy water-logged areas. The source of water is usually a river or stream and pond construction is designed in such a way as to channel water into the ponds and create a recycling system without polluting the water source. No chemical fertilizers are used and the feed is organic.
mali, soya Quantities of organic fertilizer have increased with 132% from 2005 to 2009. Surface of land for the targeted crop (soya) under ISFM increased with 68% among members and non-members of POs. For other crops in the area this figure is 104%.
The individual testimonies at village level, particularly in Ourikela, confirm the validity of these statistics.
Niger, milk
ISFM indicators do not apply to cheese production
The sustainability of the cheese business depends on sustainable milk pro-duction, which is highly variable during the year. Women are milk producers, processors and cheese sellers on the local market. Income from cheese may be reinvested in more intensive milk production.
Nigeria, sorghum
IFDC data shows that cumula-tively, about 760 ha have been put under sustainable production methods.
Farmers are practicing the ISFM technologies although not to their whole farm land. Given the number of farmers (9100) in the cluster, 760 ha is not much. The low achievement in this regard is attributed to limited access to manure and land.
Togo, ground-nut
From 1 ha in 2007 to 50 ha in 2009, being 12% of the total culti-vated surface in Tamonga.
ISFM training has led to application of the taught techniques in two seasons, increasing the area of land environmentally sustainably used substantially. This goes beyond the 72 producers which have followed ISFM training: many others (non-members) use farmyard manure and crop rota-tion too, without having heard of 1000s+.
Î On the basis of empirical research in 7 case study clusters, combined with a critical assessment of M&E
data, and validation in interviews and workshops, it is concluded that the target of 2 million hectares of
farmland under environmentally sustainable production in 2010 will certainly not be achieved. Although many
farmers have adopted environmentally sustainable production techniques, the registered increase in acreage
farmed according to ISFM practices is quite modest - actual performance is at 22% of the adjusted target.
Given the 372.627 households reached in 2009, the adjusted target for 2009 would be around 745.000 hec-
tares or 37% of the objective. However, these data should be read with care: it most strongly reveals that the
target for this objective was unrealistic and its indicator not properly measurable.
6 .4 fooD SEcuriTy
In the perception of the respondents, SAADA strongly contributed to the increase of agricultural production. The
monitoring data indicate an increase in aggregated agricultural production of 1.718.619 tons cereal equivalent. The
evaluation team makes the following comments:
• Food security has been monitored as being related to production only. Arguably, food security is just as much
an issue of access to consumption. The indicator used to measure this objective is considered not very relevant;
• A sharp increase in number of tons cereal equivalent is noticed in 2009.
We did not found a plausible explanation for this sudden increase;
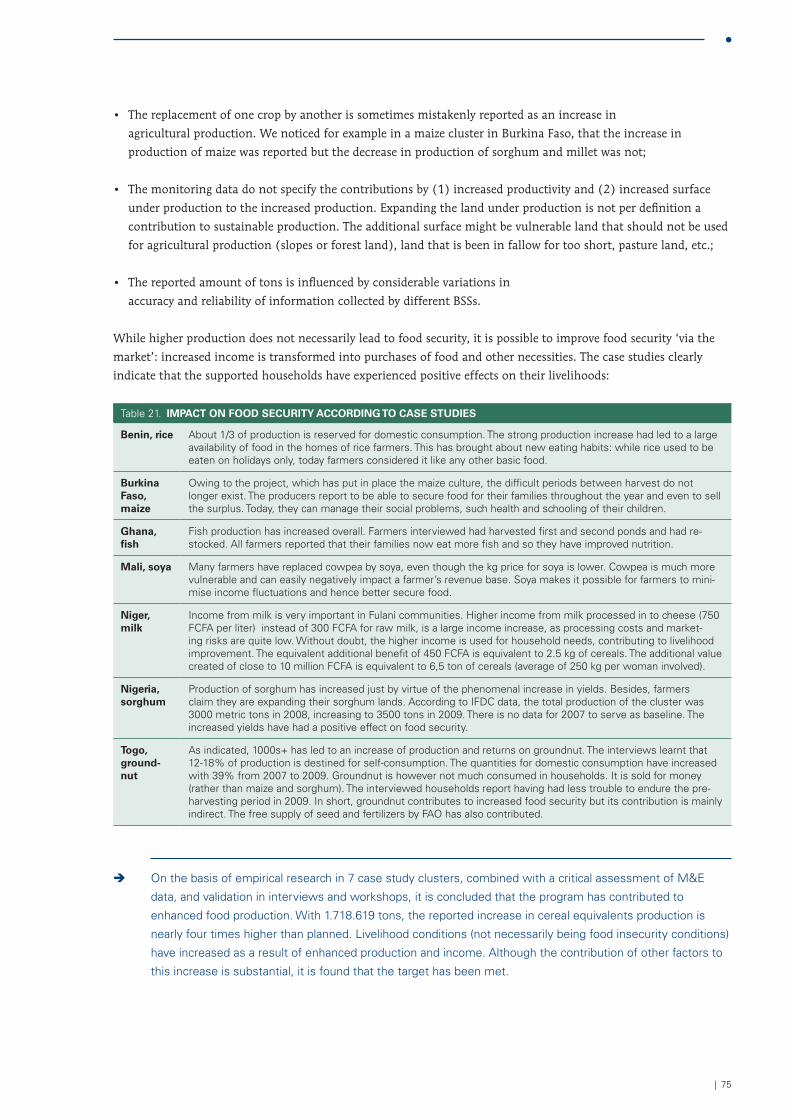
| 75
• The replacement of one crop by another is sometimes mistakenly reported as an increase in
agricultural production. We noticed for example in a maize cluster in Burkina Faso, that the increase in
production of maize was reported but the decrease in production of sorghum and millet was not;
• The monitoring data do not specify the contributions by (1) increased productivity and (2) increased surface
under production to the increased production. Expanding the land under production is not per definition a
contribution to sustainable production. The additional surface might be vulnerable land that should not be used
for agricultural production (slopes or forest land), land that is been in fallow for too short, pasture land, etc.;
• The reported amount of tons is influenced by considerable variations in
accuracy and reliability of information collected by different BSSs.
While higher production does not necessarily lead to food security, it is possible to improve food security ‘via the
market’: increased income is transformed into purchases of food and other necessities. The case studies clearly
indicate that the supported households have experienced positive effects on their livelihoods:
Table 21. imPaCT oN FooD SeCuriTy aCCorDiNg To CaSe STuDieS
benin, rice About 1/3 of production is reserved for domestic consumption. The strong production increase had led to a large availability of food in the homes of rice farmers. This has brought about new eating habits: while rice used to be eaten on holidays only, today farmers considered it like any other basic food.
burkina Faso, maize
Owing to the project, which has put in place the maize culture, the difficult periods between harvest do not longer exist. The producers report to be able to secure food for their families throughout the year and even to sell the surplus. Today, they can manage their social problems, such health and schooling of their children.
ghana, fish
Fish production has increased overall. Farmers interviewed had harvested first and second ponds and had re-stocked. All farmers reported that their families now eat more fish and so they have improved nutrition.
mali, soya Many farmers have replaced cowpea by soya, even though the kg price for soya is lower. Cowpea is much more vulnerable and can easily negatively impact a farmer’s revenue base. Soya makes it possible for farmers to mini-mise income fluctuations and hence better secure food.
Niger, milk
Income from milk is very important in Fulani communities. Higher income from milk processed in to cheese (750 FCFA per liter) instead of 300 FCFA for raw milk, is a large income increase, as processing costs and market-ing risks are quite low. Without doubt, the higher income is used for household needs, contributing to livelihood improvement. The equivalent additional benefit of 450 FCFA is equivalent to 2.5 kg of cereals. The additional value created of close to 10 million FCFA is equivalent to 6,5 ton of cereals (average of 250 kg per woman involved).
Nigeria, sorghum
Production of sorghum has increased just by virtue of the phenomenal increase in yields. Besides, farmers claim they are expanding their sorghum lands. According to IFDC data, the total production of the cluster was 3000 metric tons in 2008, increasing to 3500 tons in 2009. There is no data for 2007 to serve as baseline. The increased yields have had a positive effect on food security.
Togo, ground-nut
As indicated, 1000s+ has led to an increase of production and returns on groundnut. The interviews learnt that 12-18% of production is destined for self-consumption. The quantities for domestic consumption have increased with 39% from 2007 to 2009. Groundnut is however not much consumed in households. It is sold for money (rather than maize and sorghum). The interviewed households report having had less trouble to endure the pre-harvesting period in 2009. In short, groundnut contributes to increased food security but its contribution is mainly indirect. The free supply of seed and fertilizers by FAO has also contributed.
Î On the basis of empirical research in 7 case study clusters, combined with a critical assessment of M&E
data, and validation in interviews and workshops, it is concluded that the program has contributed to
enhanced food production. With 1.718.619 tons, the reported increase in cereal equivalents production is
nearly four times higher than planned. Livelihood conditions (not necessarily being food insecurity conditions)
have increased as a result of enhanced production and income. Although the contribution of other factors to
this increase is substantial, it is found that the target has been met.
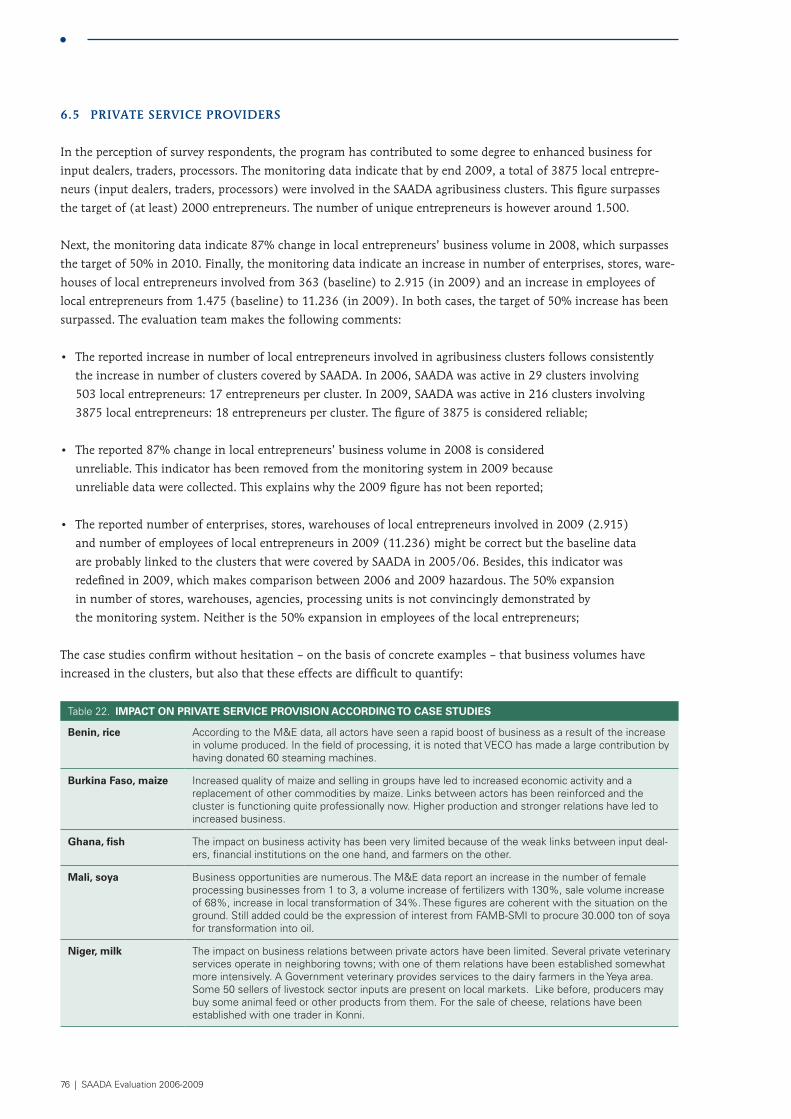
76 | SAADA Evaluation 2006-2009
6 .5 privATE SErvicE proviDErS
In the perception of survey respondents, the program has contributed to some degree to enhanced business for
input dealers, traders, processors. The monitoring data indicate that by end 2009, a total of 3875 local entrepre-
neurs (input dealers, traders, processors) were involved in the SAADA agribusiness clusters. This figure surpasses
the target of (at least) 2000 entrepreneurs. The number of unique entrepreneurs is however around 1.500.
Next, the monitoring data indicate 87% change in local entrepreneurs’ business volume in 2008, which surpasses
the target of 50% in 2010. Finally, the monitoring data indicate an increase in number of enterprises, stores, ware-
houses of local entrepreneurs involved from 363 (baseline) to 2.915 (in 2009) and an increase in employees of
local entrepreneurs from 1.475 (baseline) to 11.236 (in 2009). In both cases, the target of 50% increase has been
surpassed. The evaluation team makes the following comments:
• The reported increase in number of local entrepreneurs involved in agribusiness clusters follows consistently
the increase in number of clusters covered by SAADA. In 2006, SAADA was active in 29 clusters involving
503 local entrepreneurs: 17 entrepreneurs per cluster. In 2009, SAADA was active in 216 clusters involving
3875 local entrepreneurs: 18 entrepreneurs per cluster. The figure of 3875 is considered reliable;
• The reported 87% change in local entrepreneurs’ business volume in 2008 is considered
unreliable. This indicator has been removed from the monitoring system in 2009 because
unreliable data were collected. This explains why the 2009 figure has not been reported;
• The reported number of enterprises, stores, warehouses of local entrepreneurs involved in 2009 (2.915)
and number of employees of local entrepreneurs in 2009 (11.236) might be correct but the baseline data
are probably linked to the clusters that were covered by SAADA in 2005/06. Besides, this indicator was
redefined in 2009, which makes comparison between 2006 and 2009 hazardous. The 50% expansion
in number of stores, warehouses, agencies, processing units is not convincingly demonstrated by
the monitoring system. Neither is the 50% expansion in employees of the local entrepreneurs;
The case studies confirm without hesitation – on the basis of concrete examples – that business volumes have
increased in the clusters, but also that these effects are difficult to quantify:
Table 22. imPaCT oN PrivaTe ServiCe ProviSioN aCCorDiNg To CaSe STuDieS
benin, rice According to the M&E data, all actors have seen a rapid boost of business as a result of the increase in volume produced. In the field of processing, it is noted that VECO has made a large contribution by having donated 60 steaming machines.
burkina Faso, maize Increased quality of maize and selling in groups have led to increased economic activity and a replacement of other commodities by maize. Links between actors has been reinforced and the cluster is functioning quite professionally now. Higher production and stronger relations have led to increased business.
ghana, fish The impact on business activity has been very limited because of the weak links between input deal-ers, financial institutions on the one hand, and farmers on the other.
mali, soya Business opportunities are numerous. The M&E data report an increase in the number of female processing businesses from 1 to 3, a volume increase of fertilizers with 130%, sale volume increase of 68%, increase in local transformation of 34%. These figures are coherent with the situation on the ground. Still added could be the expression of interest from FAMB-SMI to procure 30.000 ton of soya for transformation into oil.
Niger, milk The impact on business relations between private actors have been limited. Several private veterinary services operate in neighboring towns; with one of them relations have been established somewhat more intensively. A Government veterinary provides services to the dairy farmers in the Yeya area. Some 50 sellers of livestock sector inputs are present on local markets. Like before, producers may buy some animal feed or other products from them. For the sale of cheese, relations have been established with one trader in Konni.
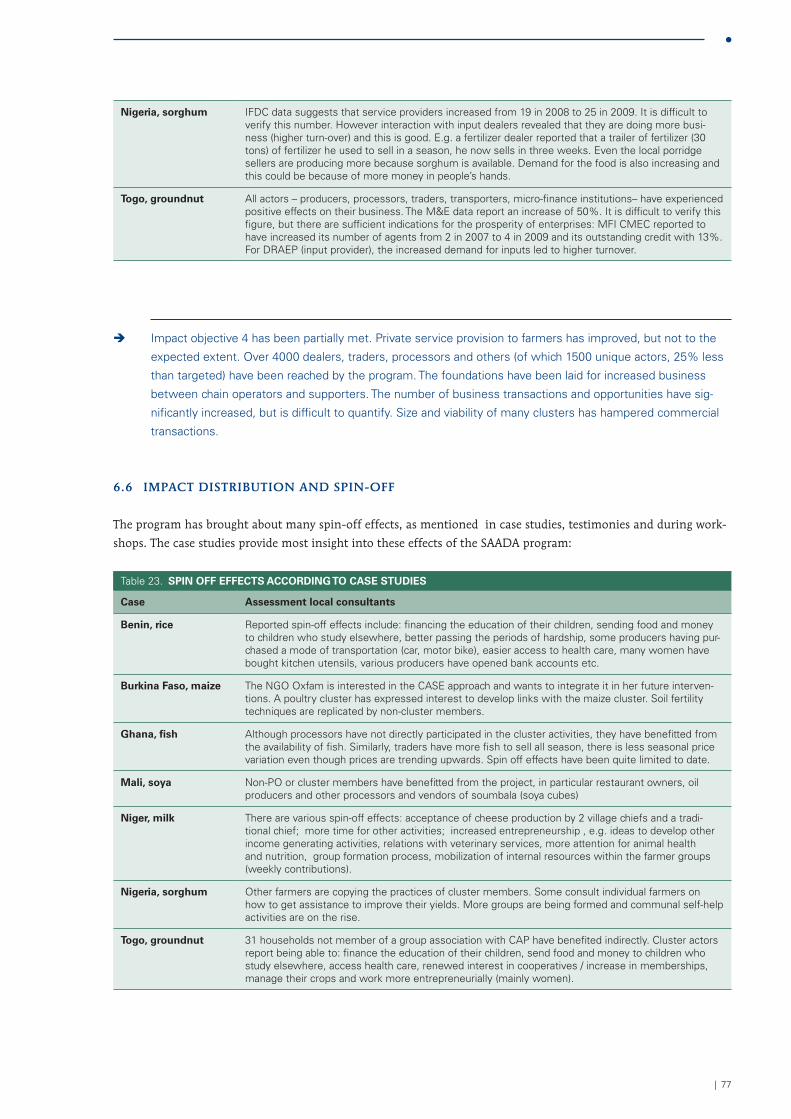
| 77
Nigeria, sorghum IFDC data suggests that service providers increased from 19 in 2008 to 25 in 2009. It is difficult to verify this number. However interaction with input dealers revealed that they are doing more busi-ness (higher turn-over) and this is good. E.g. a fertilizer dealer reported that a trailer of fertilizer (30 tons) of fertilizer he used to sell in a season, he now sells in three weeks. Even the local porridge sellers are producing more because sorghum is available. Demand for the food is also increasing and this could be because of more money in people’s hands.
Togo, groundnut All actors – producers, processors, traders, transporters, micro-finance institutions– have experienced positive effects on their business. The M&E data report an increase of 50%. It is difficult to verify this figure, but there are sufficient indications for the prosperity of enterprises: MFI CMEC reported to have increased its number of agents from 2 in 2007 to 4 in 2009 and its outstanding credit with 13%. For DRAEP (input provider), the increased demand for inputs led to higher turnover.
Î Impact objective 4 has been partially met. Private service provision to farmers has improved, but not to the
expected extent. Over 4000 dealers, traders, processors and others (of which 1500 unique actors, 25% less
than targeted) have been reached by the program. The foundations have been laid for increased business
between chain operators and supporters. The number of business transactions and opportunities have sig-
nificantly increased, but is difficult to quantify. Size and viability of many clusters has hampered commercial
transactions.
6 .6 impAcT DiSTribuTion AnD Spin-off
The program has brought about many spin-off effects, as mentioned in case studies, testimonies and during work-
shops. The case studies provide most insight into these effects of the SAADA program:
Table 23. SPiN oFF eFFeCTS aCCorDiNg To CaSe STuDieS
Case assessment local consultants
benin, rice Reported spin-off effects include: financing the education of their children, sending food and money to children who study elsewhere, better passing the periods of hardship, some producers having pur-chased a mode of transportation (car, motor bike), easier access to health care, many women have bought kitchen utensils, various producers have opened bank accounts etc.
burkina Faso, maize The NGO Oxfam is interested in the CASE approach and wants to integrate it in her future interven-tions. A poultry cluster has expressed interest to develop links with the maize cluster. Soil fertility techniques are replicated by non-cluster members.
ghana, fish Although processors have not directly participated in the cluster activities, they have benefitted from the availability of fish. Similarly, traders have more fish to sell all season, there is less seasonal price variation even though prices are trending upwards. Spin off effects have been quite limited to date.
mali, soya Non-PO or cluster members have benefitted from the project, in particular restaurant owners, oil producers and other processors and vendors of soumbala (soya cubes)
Niger, milk There are various spin-off effects: acceptance of cheese production by 2 village chiefs and a tradi-tional chief; more time for other activities; increased entrepreneurship , e.g. ideas to develop other income generating activities, relations with veterinary services, more attention for animal health and nutrition, group formation process, mobilization of internal resources within the farmer groups (weekly contributions).
Nigeria, sorghum Other farmers are copying the practices of cluster members. Some consult individual farmers on how to get assistance to improve their yields. More groups are being formed and communal self-help activities are on the rise.
Togo, groundnut 31 households not member of a group association with CAP have benefited indirectly. Cluster actors report being able to: finance the education of their children, send food and money to children who study elsewhere, access health care, renewed interest in cooperatives / increase in memberships, manage their crops and work more entrepreneurially (mainly women).
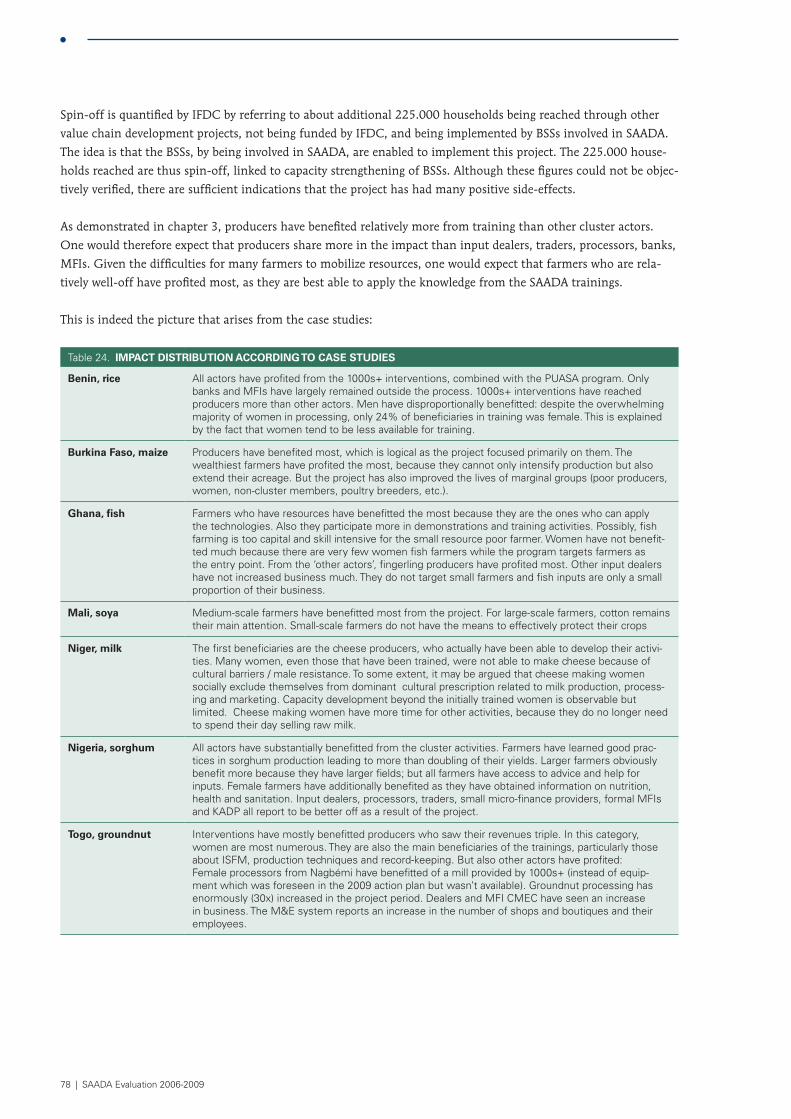
78 | SAADA Evaluation 2006-2009
Spin-off is quantified by IFDC by referring to about additional 225.000 households being reached through other
value chain development projects, not being funded by IFDC, and being implemented by BSSs involved in SAADA.
The idea is that the BSSs, by being involved in SAADA, are enabled to implement this project. The 225.000 house-
holds reached are thus spin-off, linked to capacity strengthening of BSSs. Although these figures could not be objec-
tively verified, there are sufficient indications that the project has had many positive side-effects.
As demonstrated in chapter 3, producers have benefited relatively more from training than other cluster actors.
One would therefore expect that producers share more in the impact than input dealers, traders, processors, banks,
MFIs. Given the difficulties for many farmers to mobilize resources, one would expect that farmers who are rela-
tively well-off have profited most, as they are best able to apply the knowledge from the SAADA trainings.
This is indeed the picture that arises from the case studies:
Table 24. imPaCT DiSTribuTioN aCCorDiNg To CaSe STuDieS
benin, rice All actors have profited from the 1000s+ interventions, combined with the PUASA program. Only banks and MFIs have largely remained outside the process. 1000s+ interventions have reached producers more than other actors. Men have disproportionally benefitted: despite the overwhelming majority of women in processing, only 24% of beneficiaries in training was female. This is explained by the fact that women tend to be less available for training.
burkina Faso, maize Producers have benefited most, which is logical as the project focused primarily on them. The wealthiest farmers have profited the most, because they cannot only intensify production but also extend their acreage. But the project has also improved the lives of marginal groups (poor producers, women, non-cluster members, poultry breeders, etc.).
ghana, fish Farmers who have resources have benefitted the most because they are the ones who can apply the technologies. Also they participate more in demonstrations and training activities. Possibly, fish farming is too capital and skill intensive for the small resource poor farmer. Women have not benefit-ted much because there are very few women fish farmers while the program targets farmers as the entry point. From the ‘other actors’, fingerling producers have profited most. Other input dealers have not increased business much. They do not target small farmers and fish inputs are only a small proportion of their business.
mali, soya Medium-scale farmers have benefitted most from the project. For large-scale farmers, cotton remains their main attention. Small-scale farmers do not have the means to effectively protect their crops
Niger, milk The first beneficiaries are the cheese producers, who actually have been able to develop their activi-ties. Many women, even those that have been trained, were not able to make cheese because of cultural barriers / male resistance. To some extent, it may be argued that cheese making women socially exclude themselves from dominant cultural prescription related to milk production, process-ing and marketing. Capacity development beyond the initially trained women is observable but limited. Cheese making women have more time for other activities, because they do no longer need to spend their day selling raw milk.
Nigeria, sorghum All actors have substantially benefitted from the cluster activities. Farmers have learned good prac-tices in sorghum production leading to more than doubling of their yields. Larger farmers obviously benefit more because they have larger fields; but all farmers have access to advice and help for inputs. Female farmers have additionally benefited as they have obtained information on nutrition, health and sanitation. Input dealers, processors, traders, small micro-finance providers, formal MFIs and KADP all report to be better off as a result of the project.
Togo, groundnut Interventions have mostly benefitted producers who saw their revenues triple. In this category, women are most numerous. They are also the main beneficiaries of the trainings, particularly those about ISFM, production techniques and record-keeping. But also other actors have profited: Female processors from Nagbémi have benefitted of a mill provided by 1000s+ (instead of equip-ment which was foreseen in the 2009 action plan but wasn’t available). Groundnut processing has enormously (30x) increased in the project period. Dealers and MFI CMEC have seen an increase in business. The M&E system reports an increase in the number of shops and boutiques and their employees.

| 79
Î In short, the 1000s+ project has brought about important spin-off effects and is likely to remain doing so as
more and more cluster actors are included and lessons learned are disseminated within and beyond clusters.
Impact distribution is skewed towards the more resource-endowed male producer, but also other actors have
profited. Many impact results will still be produced beyond the evaluation period because of the time-span
required before effects of capacity improvement and attitude change translate into concrete activities leading
to economic effects.

80 | SAADA Evaluation 2006-2009
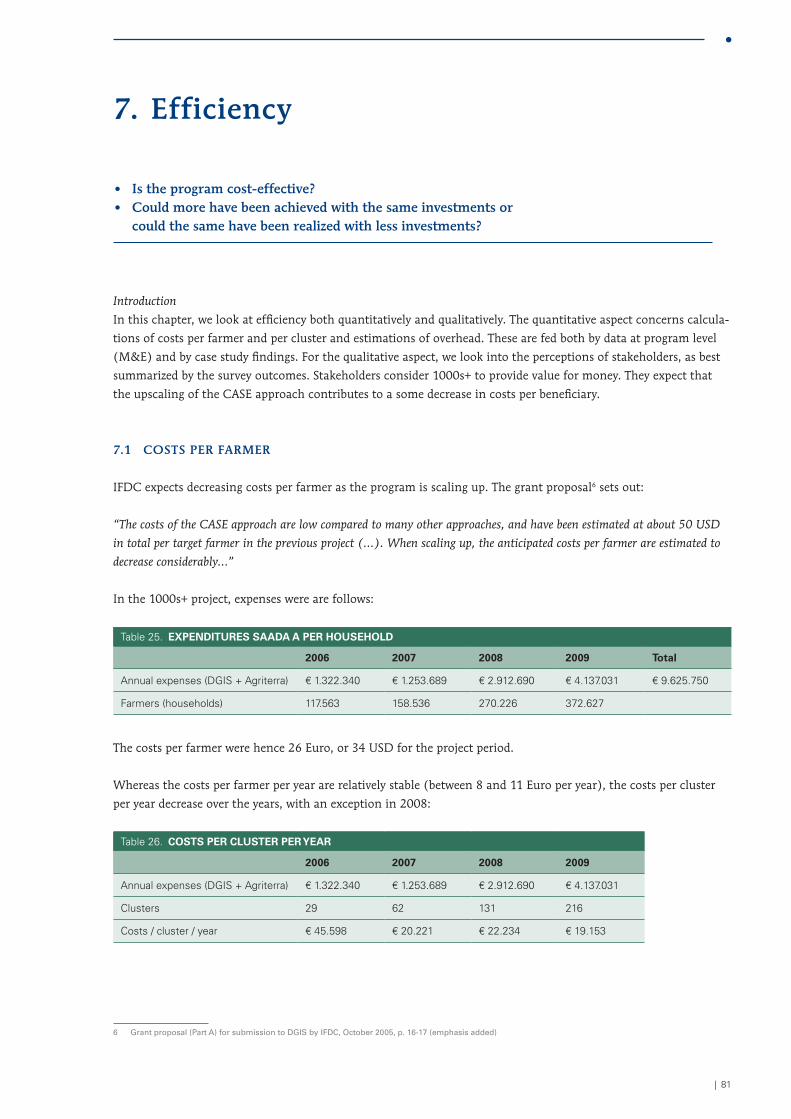
| 81
7 . Efficiency
• is the program cost-effective?• could more have been achieved with the same investments or
could the same have been realized with less investments?
Introduction
In this chapter, we look at efficiency both quantitatively and qualitatively. The quantitative aspect concerns calcula-
tions of costs per farmer and per cluster and estimations of overhead. These are fed both by data at program level
(M&E) and by case study findings. For the qualitative aspect, we look into the perceptions of stakeholders, as best
summarized by the survey outcomes. Stakeholders consider 1000s+ to provide value for money. They expect that
the upscaling of the CASE approach contributes to a some decrease in costs per beneficiary.
7 .1 coSTS pEr fArmEr
IFDC expects decreasing costs per farmer as the program is scaling up. The grant proposal6 sets out:
“The costs of the CASE approach are low compared to many other approaches, and have been estimated at about 50 USD
in total per target farmer in the previous project (...). When scaling up, the anticipated costs per farmer are estimated to
decrease considerably...”
In the 1000s+ project, expenses were are follows:
Table 25. exPeNDiTureS SaaDa a Per houSeholD
2006 2007 2008 2009 Total
Annual expenses (DGIS + Agriterra) € 1.322.340 € 1.253.689 € 2.912.690 € 4.137.031 € 9.625.750
Farmers (households) 117.563 158.536 270.226 372.627
The costs per farmer were hence 26 Euro, or 34 USD for the project period.
Whereas the costs per farmer per year are relatively stable (between 8 and 11 Euro per year), the costs per cluster
per year decrease over the years, with an exception in 2008:
Table 26. CoSTS Per CluSTer Per year
2006 2007 2008 2009
Annual expenses (DGIS + Agriterra) € 1.322.340 € 1.253.689 € 2.912.690 € 4.137.031
Clusters 29 62 131 216
Costs / cluster / year € 45.598 € 20.221 € 22.234 € 19.153
6 Grant proposal (Part A) for submission to DGIS by IFDC, October 2005, p. 16-17 (emphasis added)
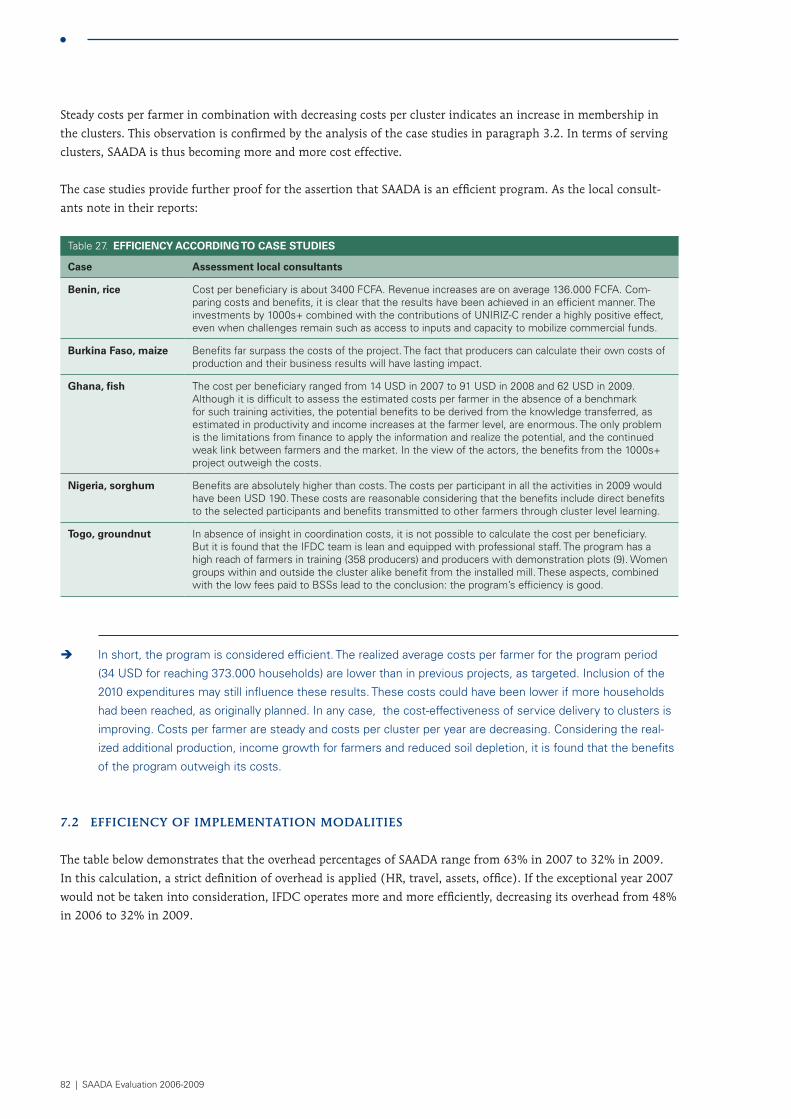
82 | SAADA Evaluation 2006-2009
Steady costs per farmer in combination with decreasing costs per cluster indicates an increase in membership in
the clusters. This observation is confirmed by the analysis of the case studies in paragraph 3.2. In terms of serving
clusters, SAADA is thus becoming more and more cost effective.
The case studies provide further proof for the assertion that SAADA is an efficient program. As the local consult-
ants note in their reports:
Table 27. eFFiCieNCy aCCorDiNg To CaSe STuDieS
Case assessment local consultants
benin, rice Cost per beneficiary is about 3400 FCFA. Revenue increases are on average 136.000 FCFA. Com-paring costs and benefits, it is clear that the results have been achieved in an efficient manner. The investments by 1000s+ combined with the contributions of UNIRIZ-C render a highly positive effect, even when challenges remain such as access to inputs and capacity to mobilize commercial funds.
burkina Faso, maize Benefits far surpass the costs of the project. The fact that producers can calculate their own costs of production and their business results will have lasting impact.
ghana, fish The cost per beneficiary ranged from 14 USD in 2007 to 91 USD in 2008 and 62 USD in 2009. Although it is difficult to assess the estimated costs per farmer in the absence of a benchmark for such training activities, the potential benefits to be derived from the knowledge transferred, as estimated in productivity and income increases at the farmer level, are enormous. The only problem is the limitations from finance to apply the information and realize the potential, and the continued weak link between farmers and the market. In the view of the actors, the benefits from the 1000s+ project outweigh the costs.
Nigeria, sorghum Benefits are absolutely higher than costs. The costs per participant in all the activities in 2009 would have been USD 190. These costs are reasonable considering that the benefits include direct benefits to the selected participants and benefits transmitted to other farmers through cluster level learning.
Togo, groundnut In absence of insight in coordination costs, it is not possible to calculate the cost per beneficiary. But it is found that the IFDC team is lean and equipped with professional staff. The program has a high reach of farmers in training (358 producers) and producers with demonstration plots (9). Women groups within and outside the cluster alike benefit from the installed mill. These aspects, combined with the low fees paid to BSSs lead to the conclusion: the program’s efficiency is good.
Î In short, the program is considered efficient. The realized average costs per farmer for the program period
(34 USD for reaching 373.000 households) are lower than in previous projects, as targeted. Inclusion of the
2010 expenditures may still influence these results. These costs could have been lower if more households
had been reached, as originally planned. In any case, the cost-effectiveness of service delivery to clusters is
improving. Costs per farmer are steady and costs per cluster per year are decreasing. Considering the real-
ized additional production, income growth for farmers and reduced soil depletion, it is found that the benefits
of the program outweigh its costs.
7 .2 EfficiEncy of impLEmEnTATion moDALiTiES
The table below demonstrates that the overhead percentages of SAADA range from 63% in 2007 to 32% in 2009.
In this calculation, a strict definition of overhead is applied (HR, travel, assets, office). If the exceptional year 2007
would not be taken into consideration, IFDC operates more and more efficiently, decreasing its overhead from 48%
in 2006 to 32% in 2009.
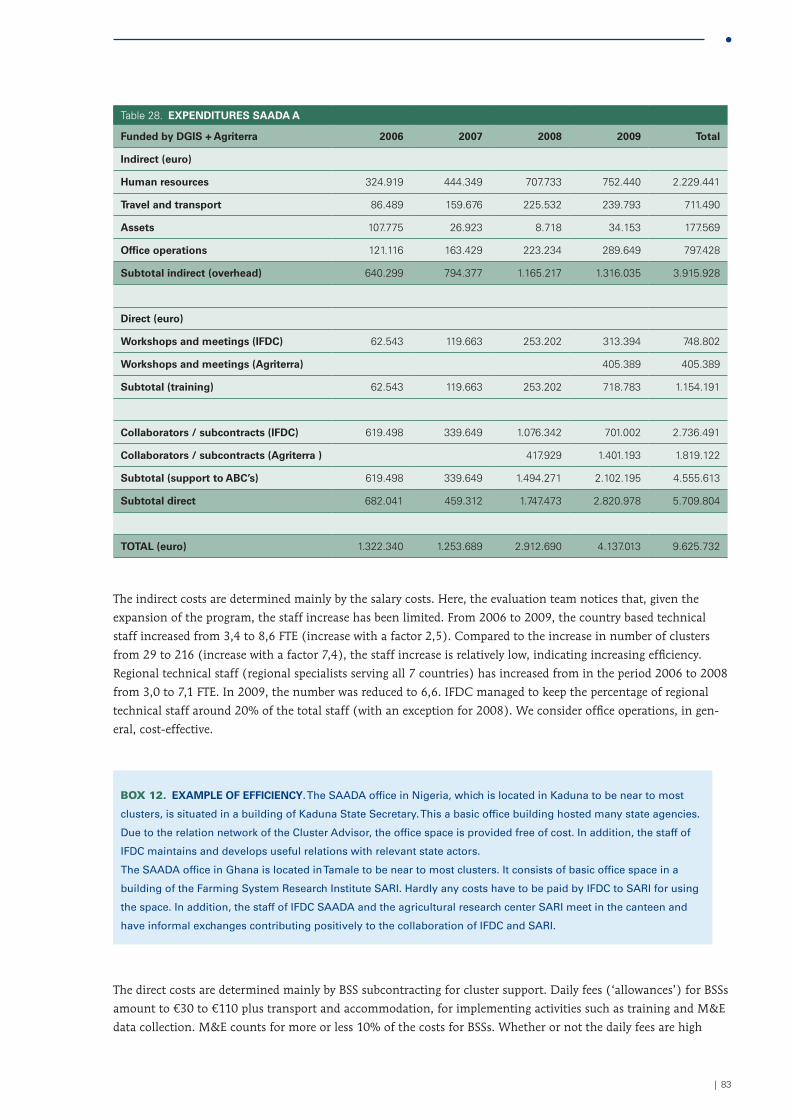
| 83
Table 28. exPeNDiTureS SaaDa a
Funded by DgiS + agriterra 2006 2007 2008 2009 Total
indirect (euro)
human resources 324.919 444.349 707.733 752.440 2.229.441
Travel and transport 86.489 159.676 225.532 239.793 711.490
assets 107.775 26.923 8.718 34.153 177.569
office operations 121.116 163.429 223.234 289.649 797.428
Subtotal indirect (overhead) 640.299 794.377 1.165.217 1.316.035 3.915.928
Direct (euro)
workshops and meetings (iFDC) 62.543 119.663 253.202 313.394 748.802
workshops and meetings (agriterra) 405.389 405.389
Subtotal (training) 62.543 119.663 253.202 718.783 1.154.191
Collaborators / subcontracts (iFDC) 619.498 339.649 1.076.342 701.002 2.736.491
Collaborators / subcontracts (agriterra ) 417.929 1.401.193 1.819.122
Subtotal (support to abC’s) 619.498 339.649 1.494.271 2.102.195 4.555.613
Subtotal direct 682.041 459.312 1.747.473 2.820.978 5.709.804
ToTal (euro) 1.322.340 1.253.689 2.912.690 4.137.013 9.625.732
The indirect costs are determined mainly by the salary costs. Here, the evaluation team notices that, given the
expansion of the program, the staff increase has been limited. From 2006 to 2009, the country based technical
staff increased from 3,4 to 8,6 FTE (increase with a factor 2,5). Compared to the increase in number of clusters
from 29 to 216 (increase with a factor 7,4), the staff increase is relatively low, indicating increasing efficiency.
Regional technical staff (regional specialists serving all 7 countries) has increased from in the period 2006 to 2008
from 3,0 to 7,1 FTE. In 2009, the number was reduced to 6,6. IFDC managed to keep the percentage of regional
technical staff around 20% of the total staff (with an exception for 2008). We consider office operations, in gen-
eral, cost-effective.
Box 12. examPle oF eFFiCieNCy. The SAADA office in Nigeria, which is located in Kaduna to be near to most
clusters, is situated in a building of Kaduna State Secretary. This a basic office building hosted many state agencies.
Due to the relation network of the Cluster Advisor, the office space is provided free of cost. In addition, the staff of
IFDC maintains and develops useful relations with relevant state actors.
The SAADA office in Ghana is located in Tamale to be near to most clusters. It consists of basic office space in a
building of the Farming System Research Institute SARI. Hardly any costs have to be paid by IFDC to SARI for using
the space. In addition, the staff of IFDC SAADA and the agricultural research center SARI meet in the canteen and
have informal exchanges contributing positively to the collaboration of IFDC and SARI.
The direct costs are determined mainly by BSS subcontracting for cluster support. Daily fees (‘allowances’) for BSSs
amount to €30 to €110 plus transport and accommodation, for implementing activities such as training and M&E
data collection. M&E counts for more or less 10% of the costs for BSSs. Whether or not the daily fees are high
84 | SAADA Evaluation 2006-2009
depends on the quality of the services provided for the money. Monitoring on the quality of the sub-contractors by
IFDC is not yet systematically done. We notice that the fee range of BSSs is below the local commercial consultancy
fees.
The evaluators noticed some incidents such as:
• Indications that services by BSSs are actually not provided according to action plans
(sub-sub contracting leading to juniors providing the services, shorter duration of
trainings, less participants, activities that may not have been conducted at all);
• Costs for hiring a film camera, amounting 97.500 FCFA (€150) per day;
• Costs for group training amounting 40.000 FCFA (€60) per person per day.
Despite these types of incidents, the evaluators consider the sub-contracting of the BSSs both cost-effective as well
as instrumental in achieving sustainability of program interventions.
Î In short, the implementation modalities chosen by 1000s+ are considered generally efficient. Various meas-
ures remain possible to further improve the efficiency of the program, such as reduced costs of data collec-
tion and training costs per farmer, quality checks between service providers, increased cost consciousness
of cluster actors by requiring own contributions and giving financial transparency, involving the clusters more
actively in budgeting and by stimulating transparent competency between BSSs.
7 .3 LESS iS morE
One additional question asked in the Terms of Reference is whether the decision to maintain the number of
clusters in 2009 at 218 rather than further extend to 300 for quality reasons was right.
The situation per 2009 is that SAADA is active in 216 clusters covering more than 7.000 villages. SAADA contrib-
utes to capacity strengthening of 6700 producer organizations, of which 25% are women groups. About 375.000
households are reached and almost 4.000 entrepreneurs. The expansion of the SAADA program is less than
expected. In consultation with DGIS, IFDC decided to limit the expansion of clusters in 2009 to 85 which implied
that the 300 clusters in 2010 would not be realized as foreseen. The idea behind this decision was that quality
and impact should prevail over quantity and coverage. The evaluation team appreciates this decision, but has no
objective arguments to justify this decision. Given the current implementing capacity for SAADA, we assume that
expanding towards new clusters requires freeing up capacity elsewhere. There is no exit strategy and there are no
hard criteria to decide upon decreasing the intensity of support to older, more mature clusters (or phasing out).
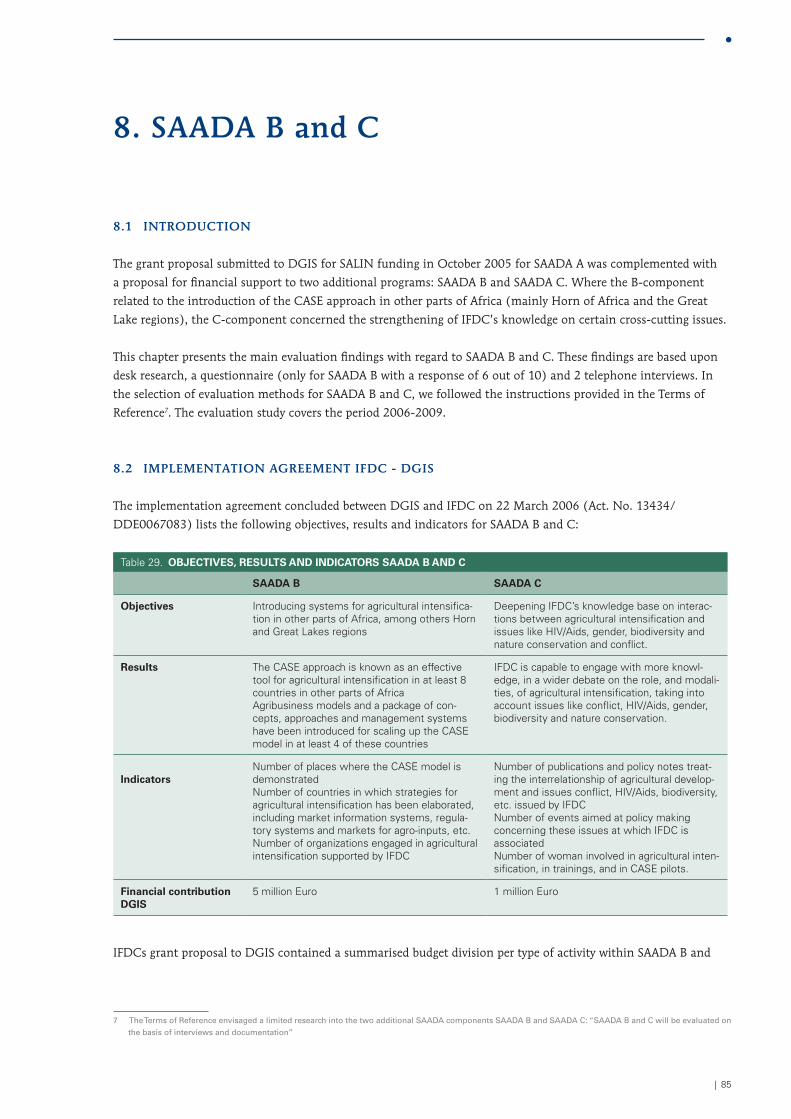
| 85
8 . SAADA b and c
8 .1 inTroDucTion
The grant proposal submitted to DGIS for SALIN funding in October 2005 for SAADA A was complemented with
a proposal for financial support to two additional programs: SAADA B and SAADA C. Where the B-component
related to the introduction of the CASE approach in other parts of Africa (mainly Horn of Africa and the Great
Lake regions), the C-component concerned the strengthening of IFDC’s knowledge on certain cross-cutting issues.
This chapter presents the main evaluation findings with regard to SAADA B and C. These findings are based upon
desk research, a questionnaire (only for SAADA B with a response of 6 out of 10) and 2 telephone interviews. In
the selection of evaluation methods for SAADA B and C, we followed the instructions provided in the Terms of
Reference7. The evaluation study covers the period 2006-2009.
8 .2 impLEmEnTATion AgrEEmEnT ifDc - DgiS
The implementation agreement concluded between DGIS and IFDC on 22 March 2006 (Act. No. 13434/
DDE0067083) lists the following objectives, results and indicators for SAADA B and C:
Table 29. objeCTiveS, reSulTS aND iNDiCaTorS SaaDa b aND C
SaaDa b SaaDa C
objectives Introducing systems for agricultural intensifica-tion in other parts of Africa, among others Horn and Great Lakes regions
Deepening IFDC’s knowledge base on interac-tions between agricultural intensification and issues like HIV/Aids, gender, biodiversity and nature conservation and conflict.
results The CASE approach is known as an effective tool for agricultural intensification in at least 8 countries in other parts of AfricaAgribusiness models and a package of con-cepts, approaches and management systems have been introduced for scaling up the CASE model in at least 4 of these countries
IFDC is capable to engage with more knowl-edge, in a wider debate on the role, and modali-ties, of agricultural intensification, taking into account issues like conflict, HIV/Aids, gender, biodiversity and nature conservation.
indicatorsNumber of places where the CASE model is demonstratedNumber of countries in which strategies for agricultural intensification has been elaborated, including market information systems, regula-tory systems and markets for agro-inputs, etc. Number of organizations engaged in agricultural intensification supported by IFDC
Number of publications and policy notes treat-ing the interrelationship of agricultural develop-ment and issues conflict, HIV/Aids, biodiversity, etc. issued by IFDCNumber of events aimed at policy making concerning these issues at which IFDC is associatedNumber of woman involved in agricultural inten-sification, in trainings, and in CASE pilots.
Financial contribution DgiS
5 million Euro 1 million Euro
IFDCs grant proposal to DGIS contained a summarised budget division per type of activity within SAADA B and
7 The Terms of Reference envisaged a limited research into the two additional SAADA components SAADA B and SAADA C: “SAADA B and C will be evaluated on
the basis of interviews and documentation”
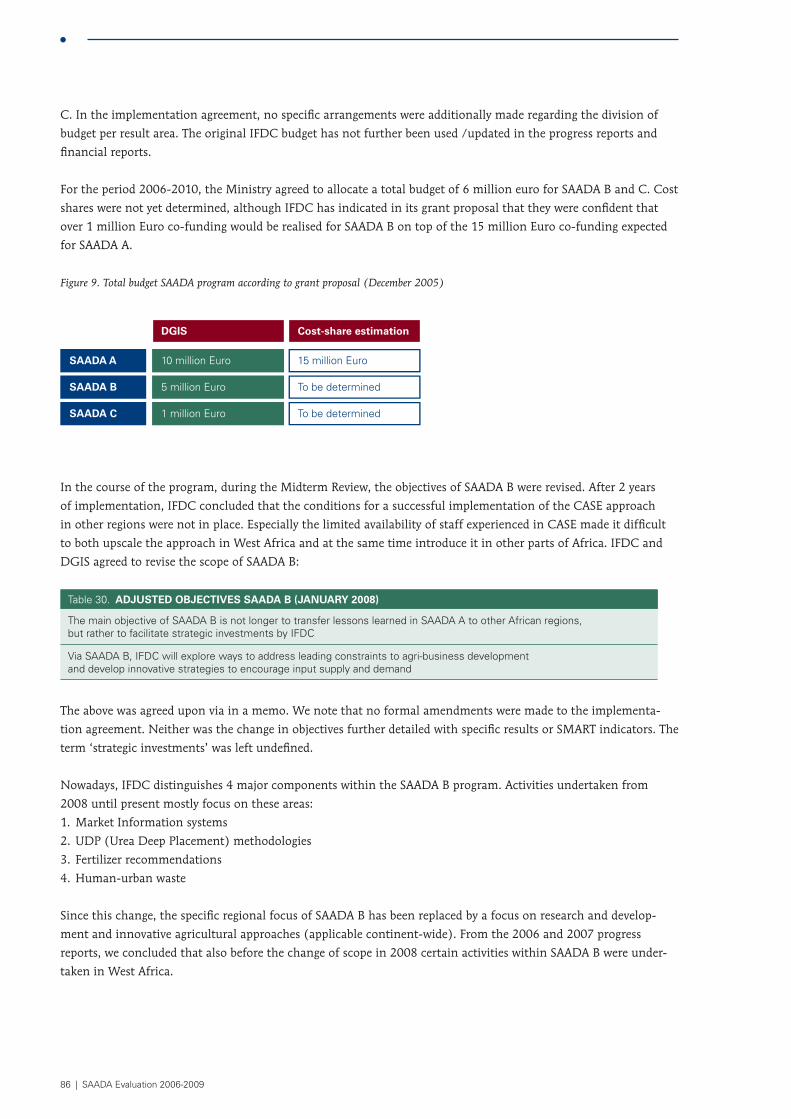
86 | SAADA Evaluation 2006-2009
C. In the implementation agreement, no specific arrangements were additionally made regarding the division of
budget per result area. The original IFDC budget has not further been used /updated in the progress reports and
financial reports.
For the period 2006-2010, the Ministry agreed to allocate a total budget of 6 million euro for SAADA B and C. Cost
shares were not yet determined, although IFDC has indicated in its grant proposal that they were confident that
over 1 million Euro co-funding would be realised for SAADA B on top of the 15 million Euro co-funding expected
for SAADA A.
Figure 9. Total budget SAADA program according to grant proposal (December 2005)
SAADA A 10 million Euro
DGIS
15 million Euro
SAADA B 5 million Euro To be determined
SAADA C 1 million Euro To be determined
Cost-share estimation
In the course of the program, during the Midterm Review, the objectives of SAADA B were revised. After 2 years
of implementation, IFDC concluded that the conditions for a successful implementation of the CASE approach
in other regions were not in place. Especially the limited availability of staff experienced in CASE made it difficult
to both upscale the approach in West Africa and at the same time introduce it in other parts of Africa. IFDC and
DGIS agreed to revise the scope of SAADA B:
Table 30. aDjuSTeD objeCTiveS SaaDa b (jaNuary 2008)
The main objective of SAADA B is not longer to transfer lessons learned in SAADA A to other African regions, but rather to facilitate strategic investments by IFDC
Via SAADA B, IFDC will explore ways to address leading constraints to agri-business development and develop innovative strategies to encourage input supply and demand
The above was agreed upon via in a memo. We note that no formal amendments were made to the implementa-
tion agreement. Neither was the change in objectives further detailed with specific results or SMART indicators. The
term ‘strategic investments’ was left undefined.
Nowadays, IFDC distinguishes 4 major components within the SAADA B program. Activities undertaken from
2008 until present mostly focus on these areas:
1. Market Information systems
2. UDP (Urea Deep Placement) methodologies
3. Fertilizer recommendations
4. Human-urban waste
Since this change, the specific regional focus of SAADA B has been replaced by a focus on research and develop-
ment and innovative agricultural approaches (applicable continent-wide). From the 2006 and 2007 progress
reports, we concluded that also before the change of scope in 2008 certain activities within SAADA B were under-
taken in West Africa.
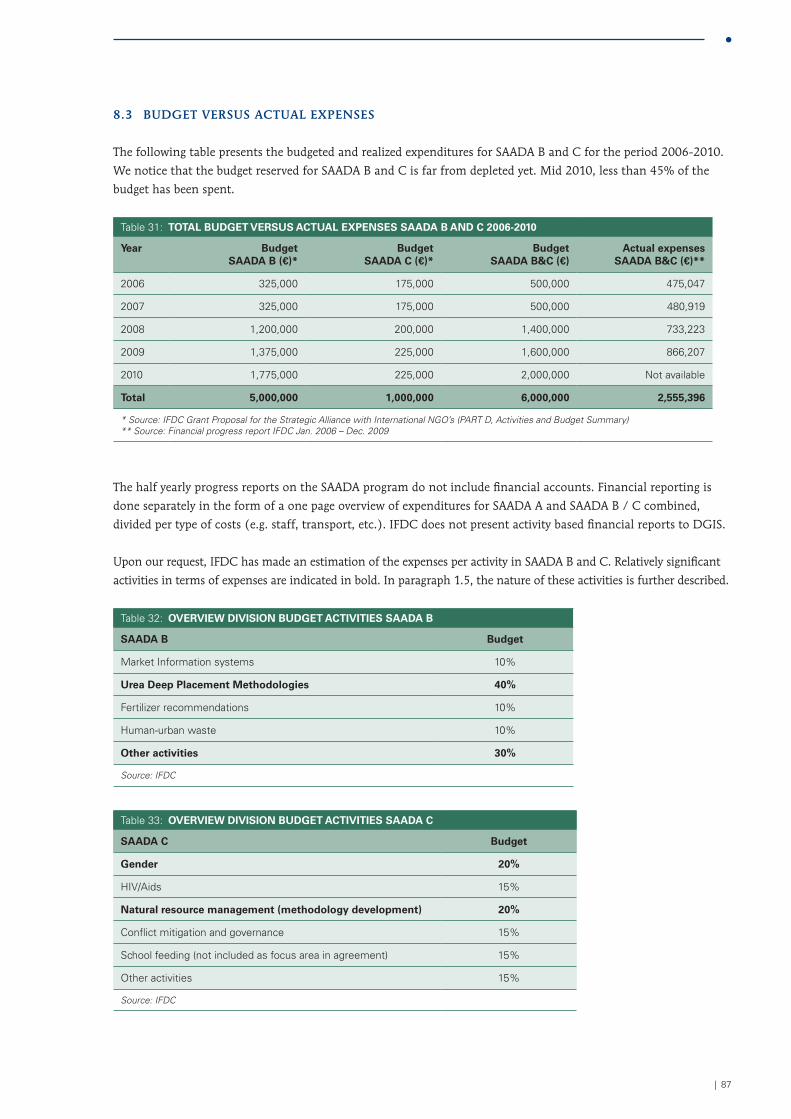
| 87
8 .3 buDgET vErSuS AcTuAL ExpEnSES
The following table presents the budgeted and realized expenditures for SAADA B and C for the period 2006-2010.
We notice that the budget reserved for SAADA B and C is far from depleted yet. Mid 2010, less than 45% of the
budget has been spent.
Table 31: ToTal buDgeT verSuS aCTual exPeNSeS SaaDa b aND C 2006-2010
year budget SaaDa b (€)*
budget SaaDa C (€)*
budget SaaDa b&C (€)
actual expenses SaaDa b&C (€)**
2006 325,000 175,000 500,000 475,047
2007 325,000 175,000 500,000 480,919
2008 1,200,000 200,000 1,400,000 733,223
2009 1,375,000 225,000 1,600,000 866,207
2010 1,775,000 225,000 2,000,000 Not available
Total 5,000,000 1,000,000 6,000,000 2,555,396
* Source: IFDC Grant Proposal for the Strategic Alliance with International NGO’s (PART D, Activities and Budget Summary) ** Source: Financial progress report IFDC Jan. 2006 – Dec. 2009
The half yearly progress reports on the SAADA program do not include financial accounts. Financial reporting is
done separately in the form of a one page overview of expenditures for SAADA A and SAADA B / C combined,
divided per type of costs (e.g. staff, transport, etc.). IFDC does not present activity based financial reports to DGIS.
Upon our request, IFDC has made an estimation of the expenses per activity in SAADA B and C. Relatively significant
activities in terms of expenses are indicated in bold. In paragraph 1.5, the nature of these activities is further described.
Table 32: overview DiviSioN buDgeT aCTiviTieS SaaDa b
SaaDa b budget
Market Information systems 10%
urea Deep Placement methodologies 40%
Fertilizer recommendations 10%
Human-urban waste 10%
other activities 30%
Source: IFDC
Table 33: overview DiviSioN buDgeT aCTiviTieS SaaDa C
SaaDa C budget
gender 20%
HIV/Aids 15%
Natural resource management (methodology development) 20%
Conflict mitigation and governance 15%
School feeding (not included as focus area in agreement) 15%
Other activities 15%
Source: IFDC
88 | SAADA Evaluation 2006-2009
8 .4 orgAniSATion, moniToring AnD rEporTing
Within IFDC one program coordinator is responsible for SAADA B and C. Next to the coordinator, around 10
other IFDC staff members work on the SAADA B and C program. It includes people with different backgrounds
(gender, HIV/Aids, training, etc.) spending parts of their time on activities reported under SAADA B and C.
Respondents indicated that at strategic level there is some interaction with SAADA-A (annual action plans)
although the collaboration at operational level is limited.
Overall the evaluation team has the impression that there is very limited synergy between SAADA A and SAADA
B/C. The annual work plans and progress reports include separate chapters for SAADA A, B and C. There is no joint
perspective on the general implementation of SAADA in the yearly reports. Coordination is complicated by the
fact that the program coordinator of SAADA A is situated in Mali whereas the coordinator for SAADA B and C is
situated in Ghana. With regard to the organisation of the SAADA B and C components we further notice that the
annual work plans and progress reports contain limited information on organisational and management issues.
For example, we haven’t identified a specific mechanism for the allocation of budget to activities. Since the activi-
ties and results for SAADA B and C haven’t been strictly outlined, we consider the supervision to decision-making
processes important. It is remarkable for example that almost 30% of the budget for SAADA B has been spent on
non-specified ‘other activities’.
Respondents indicate that for SAADA B and C specific and measurable outputs and results are lacking. Indeed,
the evaluation team notices that the progress reports of SAADA B and C have a narrative character and are very
detailed. However, they contain limited quantitative data and progress mostly concerns achievements at output
level. Results at outcome and impact level are not provided.
8 .5 AchiEvEmEnTS of SAADA b
In this paragraph, we review SAADA B on the basis of the evaluation questions derived from the Terms of Refer-
ence. We notice that these questions mostly refer to the originally presented SAADA B program. The change in
focus of SAADA B and the lack of specific indicators related to the (revised) objectives, make it difficult to evaluate
the program.
has the cASE approach been successfully introduced in other regions in Africa?
The introduction of CASE in other regions did not really materialize until 2008/2009, the period in which the
CASE approach was integrated in the Catalyst program. This program which IFDC started managing in Rwanda,
Burundi and DRC from October 2006 can be considered the only vehicle through which CASE is currently being
introduced in other parts of Africa. IFDC staff from West Africa has been assisting in elaborating a strategy to
incorporate CASE within Catalyst from 2008 onwards. Between 2006 and 2008 a few CASE trainings have been
organized for producer organizations, NGO’s and staff of Catalyst.
Apart from the contributions to the Catalyst program, there are no examples of successful introduction of CASE in
other regions in Africa. Apparently IFDC also felt that ambitions of SAADA B as laid down in the agreement with
DGIS were difficult to reach as halfway the program it was decided to change the objectives of the program. Con-
sidering the constraints IFDC was confronted with at the beginning of implementation of SAADA B (limited staff
with CASE experience, no office in the region, intensity required for 1000s+, and diverging agricultural settings)
the evaluation team concludes that the objective to replicate the CASE approach in other regions was not realistic
in the first place. However, the consciousness that targets could not be reached came rather late: 2 years after the
start.
| 89
what actions have been undertaken to expand the capacities for commodity chain development in other regions / countries in Africa (especially horn of Africa and great Lakes) and were these actions successful in strengthening capacities?
The main actions undertaken in this area include:
• Deployment of IFDC staff at NEPAD (The New Partnership for Africa’s Development),
a program of the African Union offering an integrated socio-economic development framework
for Africa. IFDC staff mostly contributed to the CAADP (the Comprehensive Africa Agriculture
Development Program) of NEPAD and the organisation of the Africa Fertilizer Summit.
• A revision by the SAADA team of its strategy to assist in building associations. This resulted in
the development of training kits for association management and training of trainers.
• The establishment of the AISSA (Agricultural Intensification in Sub-Saharan Africa) Network.
This network for individuals and organisation aims to provide an exchange platform and
to stimulation joint actions between members.
• The organisation of 2 management trainings for members of
associations (36 participants) in Burundi and Rwanda
• The organisation of 4 train-the-trainer trainings for private partners in Burundi, Rwanda
and DRC to enable them to provide training to inputs dealers in the future.
The progress reports don’t mention how the training to associations and private entities have received follow-up,
which makes it hard to judge whether these trainings contributed to the strengthening of capacities. With regard
to the AISSA network, we note that it was launched end 2009 and that it cannot be assessed who benefited of the
available information and which linkages between members have been established via the platform (no targets in
this regard have been listed in the progress reports). The organisation of the Africa Fertilizer Summit is considered
very successful by respondents. Particularly the fertilizer strategies and action plans that have been developed as a
result of the summit are being considered valuable. The Summit almost certainly has resulted in relevant changes
in policies, although we cannot specify these effects on the basis of the information available. We conclude that
activities related to commodity chain development have been rather scattered. There is no information on the
effects and the impact of these activities.
what actions have been taken to improve the functioning of input markets in other parts of Africa and have these actions been successful?
Two types of actions can be distinguished here: actions related to policy dialogue and lobby and advocacy and
actions aimed at the introduction of Market Information Systems (MIS). The first range of actions includes the
organisation of the Africa Fertilizer Summit which resulted in 30 country action plans and 4 regional action plans
for the improvement of input markets and the use of fertilizers. The major results in the area of Market Informa-
tion Systems include the start of AMITSA, a database with market information. The full public launch took place in
2010. Further, IFDC supported the establishment of Africafertilizer.org, a web-based portal with information and
data on fertilizers. By sharing information, IFDC aims to influence supporting policies and to create equal market
opportunities. AMITSA focuses on Eastern Africa whereas AfricaFertilizer.org is designed to serve the entire conti-
nent. Through SAADA B, IFDC contributed around 10% of the costs for establishing AMITSA and AfricaFertilizer.
org. So far, the interest in the systems is high and it is expected this will further increase. It seems that IFDC has no
90 | SAADA Evaluation 2006-2009
problem to involve private partners in input market related activities. The evaluation team considers the establish-
ment of the two systems as innovative and as tangible results of the SAADA B program which have the potential
to create impact at a large scale. Proper monitoring will be key to measure the true impact achieved through these
systems and will require another form of reporting by IFDC as done so far (better use of SMART indicators).
what actions have been taken in other parts of Africa to transfer technologies to pos and other cluster operators with the aim using inputs efficiently?
The major achievement in terms of technological innovation is the elaboration of the Urea Deep Placement (UDP)
/ Urea Super Granules (UGS) methodologies in West Africa. This methodology originates from Bangladesh where
it has been proven to be successful. In 2008, the UDP methodology has been introduced in 6 countries in West
Africa and Madagascar. UDP has been tested in 20 irrigation schemes with 1500 farmers participating. Participa-
tory demonstration, trainings and field days were organised and reached around 15,000 farmers. Via the Catalyst
program efforts have been undertaken to introduce UDP methodologies in Eastern Africa. In conclusion, the
achievements, mostly realized in West Africa, can be considered successful and it was because of SAADA B that the
introduction of the innovative UDP technology was possible. The recently introduced MIS systems (AMITSA and
AfricaFertilizer.org) include some interesting technical features such as the distribution of information (e.g. on
prices) by cell phone but the effects cannot yet be assessed.
which other skills and knowledge have been transferred in other parts of Africa to pos, traders and other cluster operators with the aim of getting access to inputs or using them more efficiently?
The larger part of skills and knowledge transferred to Eastern Africa took place via the Catalyst program. The vari-
ous agro-inputs trainings and other initiatives such as the support to the Rural Outreach Program in Kenya have
been organised in collaboration with the Catalyst program. Respondents acknowledge that the available funds
within SAADA B contributed greatly the set-up of the Catalyst program, making it possible to transfer all type of
knowledge and experience available within the West African region.
8 .6 AchiEvEmEnTS of SAADA c
In this paragraph, we review SAADA C on the basis of the evaluation questions derived from the
Terms of Reference.
To what extent have gender issues been effectively introduced within the program?
SAADA C funded the development of methodologies, strategies and trainings to integrate gender aspects in SAADA
A. This resulted for example in a tool to improve gender inclusion in value chains via the SAADA A program. In
this sense gender has been successfully introduced in SAADA A and other IFDC programs. Furthermore, the overall
knowledge of IFDC staff on gender issues has most probably increased.
To what extent have hiv/AiDS issues been effectively introduced within the program?
The issue of HIV/Aids has become an integral part of the SAADA A program. In the progress reports many trainings
have been listed that focused on the subject and which have been organised through SAADA A. Furthermore, IFDC
| 91
developed via SAADA C strategies and action plans to address HIV/Aids issues and raise awareness among IFDC
staff in entire region.
However, Malaria rather than HIV/Aids is being considered by IFDC a priority area in West Africa. Nonetheless, it
seems that IFDC has been able to link the issue of HIV/Aids with its own core business as activities focuses mostly
on the nutrition conditions of HIV affected people. The overall knowledge of IFDC staff on HIV/Aids has most
probably increased.
To what extent have nrm issues been effectively introduced within the program?
The first years of the program has been used to develop a conceptual framework for IFDC’s work in the field of
natural resource management with the idea to disseminate this knowledge to partners. Thereupon, time has been
invested in exploring possible linkages with partners and platforms. Pilot projects on NRM have been organised
(e.g. community forestry project in Benin) and strategies and action plans have been developed in collaboration
with partners (NGO’s, research institutes and universities). An actual implementation of NRM methodologies
only took place in Northern Ghana. It is not clear to which extent NRM was really embedded within SAADA at a
more aggregate regional level. The overall knowledge of IFDC staff on NRM has most probably increased.
To what extent have conflict mitigation and governance issues been effectively introduced within the program?
Until 2008 progress reports of SAADA C made no reference to activities on the terrain of conflict mitigation and
governance. In fact, the only actions undertaken in this field include exploratory studies in Sierra Leone and Liberia
to see how input markets could be improved there. The concrete follow-up of these initiatives is unclear. Partner-
ships have been explored but have not been closed. In our view, the actions undertaken cannot be considered as
structural ways to integrate the subject within the SAADA program.
what other activities have been taken under the title SAADA c, that have not been mentioned in the Tor?
The major additional activity which was funded via the SAADA C program is the support to the Ghana School
Feeding Program (GSFP). IFDC provided support to the GSFP Secretariat and regional actors in linking agricultural
clusters to the feeding program. Gradually IFDC focussed more on a selection of specific areas and provided several
trainings. We miss data on the local production used for GSFP as a result of IFDC’s interventions which would be
an indicator to measure impact. Furthermore, SAADA C funds have been used for the preparation and organisa-
tion of the Africa Fertilizer Summit although achievements in this field have mostly been reported under SAADA B.
Since activity based financial accounts are not available it is difficult to trace down exactly which funds of SAADA
C have been used for which type of activities.
8 .7 concLuSionS on SAADA b AnD c
On the basis of the available material it is not possible to determine if the SAADA B and C programs achieved
satisfactory results. First of all, no targets have been specified for SAADA B and C. Secondly, even if targets would
have been specified, the reported results do not allow any conclusions at impact or effect level. Some activities can
be described as successful, like the organisation of the Africa Fertilizer Summit or the overall knowledge of IFDC
92 | SAADA Evaluation 2006-2009
staff on cross-cutting issues. However, nothing can be said about impact, effectiveness, efficiency or relevance of
the programs.
More specifically, we note:
• Too high ambition to introduce CASE in other regions
The conditions to successfully introduce the CASE approach in other regions in Africa were not in place at the
beginning of the SAADA B program:
1. IFDC did not have an office in the region;
2. Staff with experience in CASE was limited and besides was situated in West Africa;
3. The intensity of 1000s+ made it difficult to make available staff for activities in other regions;
4. Diverging agricultural conditions required the approach and the skills of people to be adopted first.
In fact, a solid approach for the replication of the CASE approach in other African regions was missing and in this
perspective the formulated ambitions within SAADA B can be considered unrealistic. With the integration of CASE
in the Catalyst program a base have been created for implementation of the approach in Burundi, Rwanda and
DRC. The support that has been provided to the Catalyst program is much appreciated and contributed greatly to
the existence which would not have been possible without SAADA B.
• A lack of clear results and SMART indicators
The challenges encountered in the first years of SAADA B gave reason to change its directions. From 2008 DGIS
and IFDC decided that SAADA B funds could be used for developing innovative agricultural models and for all type
of strategic investments, not necessarily focusing on other parts of Africa. This revised focus has not been trans-
lated into clear targets and indicators which in our view is a missed chance in guaranteeing the effectiveness of the
program. This gave IFDC much liberty to allocate funds as they wanted which is not per se bad. It enabled IFDC for
example to work on innovative methodologies (such as UDP).
For SAADA C we also come to the conclusion that specific targets have been lacking, making it very difficult to
determine whether the program was effective. SAADA C funds can be considered as a form of institutional support
to IFDC. The expectation of DGIS towards IFDC was to increase the knowledge on certain cross cutting issue and
to implement these subjects within their programs. It seems that funds have been spent quite randomly focussing a
bit more on certain issues than others. It is not possible to assess the impact reached via SAADA C without look-
ing to the SAADA A program which served as major vehicle to implement the cross cutting issues and to reach the
target group. This requires close collaboration between the programs which brings us to our next point.
• Weak interaction with SAADA A program
SAADA B and C are organized more or less independently from SAADA A. Where SAADA A has very specific targets
to be reached, there is extreme flexibility in B and C. Some of the actions organised under B and C have been linked
to SAADA A or served to strengthen the CASE approach. It is not clear why there are separate programs. In terms
of planning and monitoring, it would have been more effective and efficient to closely collaborate. At this moment,
the responsibility of the programs lies with two different coordinators. Reporting is done at the same moment to
DGIS in one document but in fact, the chapters on SAADA A, B and C can be considered separate reports.
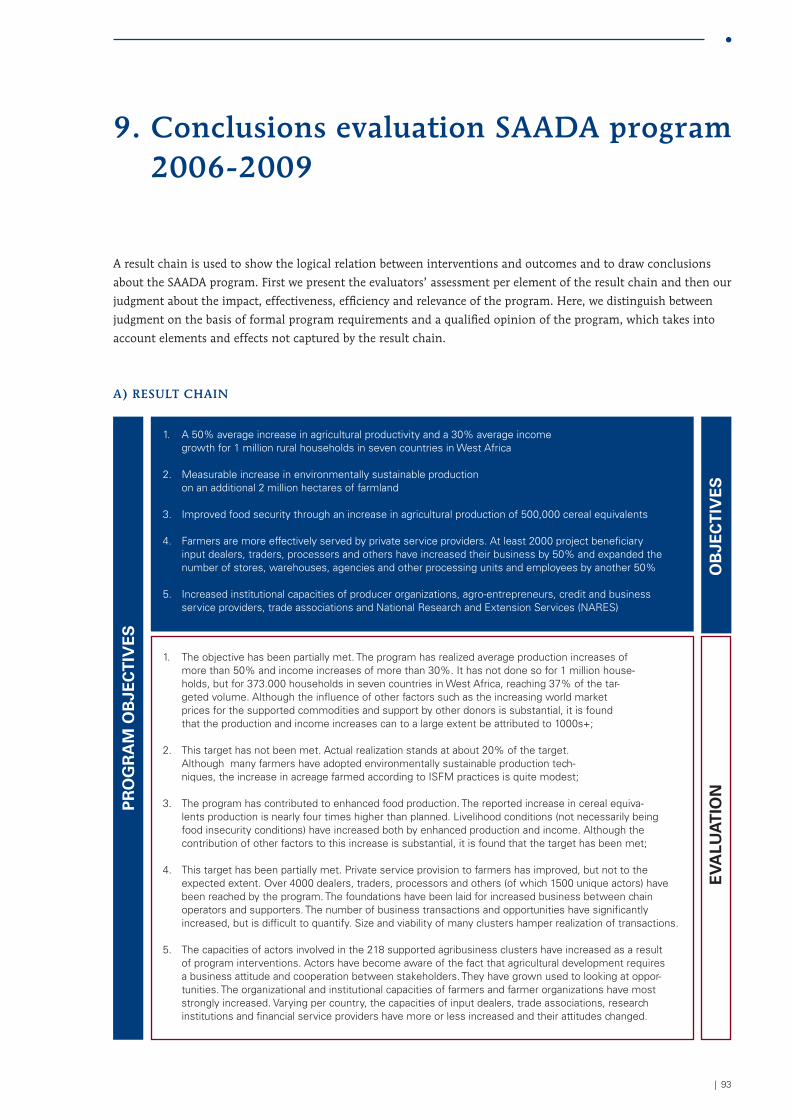
| 93
9 . conclusions evaluation SAADA program 2006-2009
A result chain is used to show the logical relation between interventions and outcomes and to draw conclusions
about the SAADA program. First we present the evaluators’ assessment per element of the result chain and then our
judgment about the impact, effectiveness, efficiency and relevance of the program. Here, we distinguish between
judgment on the basis of formal program requirements and a qualified opinion of the program, which takes into
account elements and effects not captured by the result chain.
A) rESuLT chAin
1. A 50% average increase in agricultural productivity and a 30% average income growth for 1 million rural households in seven countries in West Africa
2. Measurable increase in environmentally sustainable production on an additional 2 million hectares of farmland
3. Improved food security through an increase in agricultural production of 500,000 cereal equivalents
4. Farmers are more effectively served by private service providers. At least 2000 project beneficiary input dealers, traders, processers and others have increased their business by 50% and expanded the number of stores, warehouses, agencies and other processing units and employees by another 50%
5. Increased institutional capacities of producer organizations, agro-entrepreneurs, credit and business service providers, trade associations and National Research and Extension Services (NARES)
Pr
og
ra
m o
bje
CT
ive
S
ob
jeC
Tiv
eS
ev
alu
aT
ioN
1. The objective has been partially met. The program has realized average production increases of more than 50% and income increases of more than 30%. It has not done so for 1 million house-holds, but for 373.000 households in seven countries in West Africa, reaching 37% of the tar-geted volume. Although the influence of other factors such as the increasing world market prices for the supported commodities and support by other donors is substantial, it is found that the production and income increases can to a large extent be attributed to 1000s+;
2. This target has not been met. Actual realization stands at about 20% of the target. Although many farmers have adopted environmentally sustainable production tech-niques, the increase in acreage farmed according to ISFM practices is quite modest;
3. The program has contributed to enhanced food production. The reported increase in cereal equiva-lents production is nearly four times higher than planned. Livelihood conditions (not necessarily being food insecurity conditions) have increased both by enhanced production and income. Although the contribution of other factors to this increase is substantial, it is found that the target has been met;
4. This target has been partially met. Private service provision to farmers has improved, but not to the expected extent. Over 4000 dealers, traders, processors and others (of which 1500 unique actors) have been reached by the program. The foundations have been laid for increased business between chain operators and supporters. The number of business transactions and opportunities have significantly increased, but is difficult to quantify. Size and viability of many clusters hamper realization of transactions.
5. The capacities of actors involved in the 218 supported agribusiness clusters have increased as a result of program interventions. Actors have become aware of the fact that agricultural development requires a business attitude and cooperation between stakeholders. They have grown used to looking at oppor-tunities. The organizational and institutional capacities of farmers and farmer organizations have most strongly increased. Varying per country, the capacities of input dealers, trade associations, research institutions and financial service providers have more or less increased and their attitudes changed.
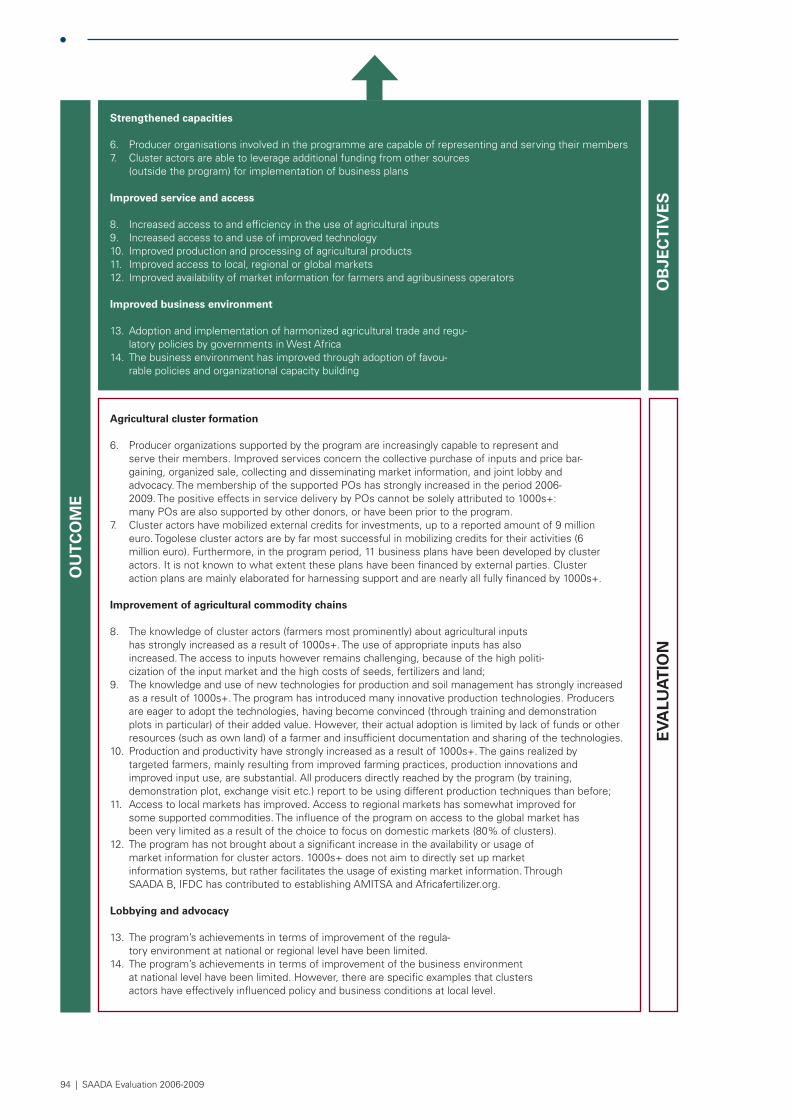
94 | SAADA Evaluation 2006-2009
Strengthened capacities
6. Producer organisations involved in the programme are capable of representing and serving their members 7. Cluster actors are able to leverage additional funding from other sources
(outside the program) for implementation of business plans
improved service and access
8. Increased access to and efficiency in the use of agricultural inputs9. Increased access to and use of improved technology10. Improved production and processing of agricultural products11. Improved access to local, regional or global markets12. Improved availability of market information for farmers and agribusiness operators
improved business environment
13. Adoption and implementation of harmonized agricultural trade and regu-latory policies by governments in West Africa
14. The business environment has improved through adoption of favou-rable policies and organizational capacity building
ou
TC
om
e
ob
jeC
Tiv
eS
ev
alu
aT
ioN
agricultural cluster formation
6. Producer organizations supported by the program are increasingly capable to represent and serve their members. Improved services concern the collective purchase of inputs and price bar-gaining, organized sale, collecting and disseminating market information, and joint lobby and advocacy. The membership of the supported POs has strongly increased in the period 2006-2009. The positive effects in service delivery by POs cannot be solely attributed to 1000s+: many POs are also supported by other donors, or have been prior to the program.
7. Cluster actors have mobilized external credits for investments, up to a reported amount of 9 million euro. Togolese cluster actors are by far most successful in mobilizing credits for their activities (6 million euro). Furthermore, in the program period, 11 business plans have been developed by cluster actors. It is not known to what extent these plans have been financed by external parties. Cluster action plans are mainly elaborated for harnessing support and are nearly all fully financed by 1000s+.
improvement of agricultural commodity chains
8. The knowledge of cluster actors (farmers most prominently) about agricultural inputs has strongly increased as a result of 1000s+. The use of appropriate inputs has also increased. The access to inputs however remains challenging, because of the high politi-cization of the input market and the high costs of seeds, fertilizers and land;
9. The knowledge and use of new technologies for production and soil management has strongly increased as a result of 1000s+. The program has introduced many innovative production technologies. Producers are eager to adopt the technologies, having become convinced (through training and demonstration plots in particular) of their added value. However, their actual adoption is limited by lack of funds or other resources (such as own land) of a farmer and insufficient documentation and sharing of the technologies.
10. Production and productivity have strongly increased as a result of 1000s+. The gains realized by targeted farmers, mainly resulting from improved farming practices, production innovations and improved input use, are substantial. All producers directly reached by the program (by training, demonstration plot, exchange visit etc.) report to be using different production techniques than before;
11. Access to local markets has improved. Access to regional markets has somewhat improved for some supported commodities. The influence of the program on access to the global market has been very limited as a result of the choice to focus on domestic markets (80% of clusters).
12. The program has not brought about a significant increase in the availability or usage of market information for cluster actors. 1000s+ does not aim to directly set up market information systems, but rather facilitates the usage of existing market information. Through SAADA B, IFDC has contributed to establishing AMITSA and Africafertilizer.org.
lobbying and advocacy
13. The program’s achievements in terms of improvement of the regula-tory environment at national or regional level have been limited.
14. The program’s achievements in terms of improvement of the business environment at national level have been limited. However, there are specific examples that clusters actors have effectively influenced policy and business conditions at local level.
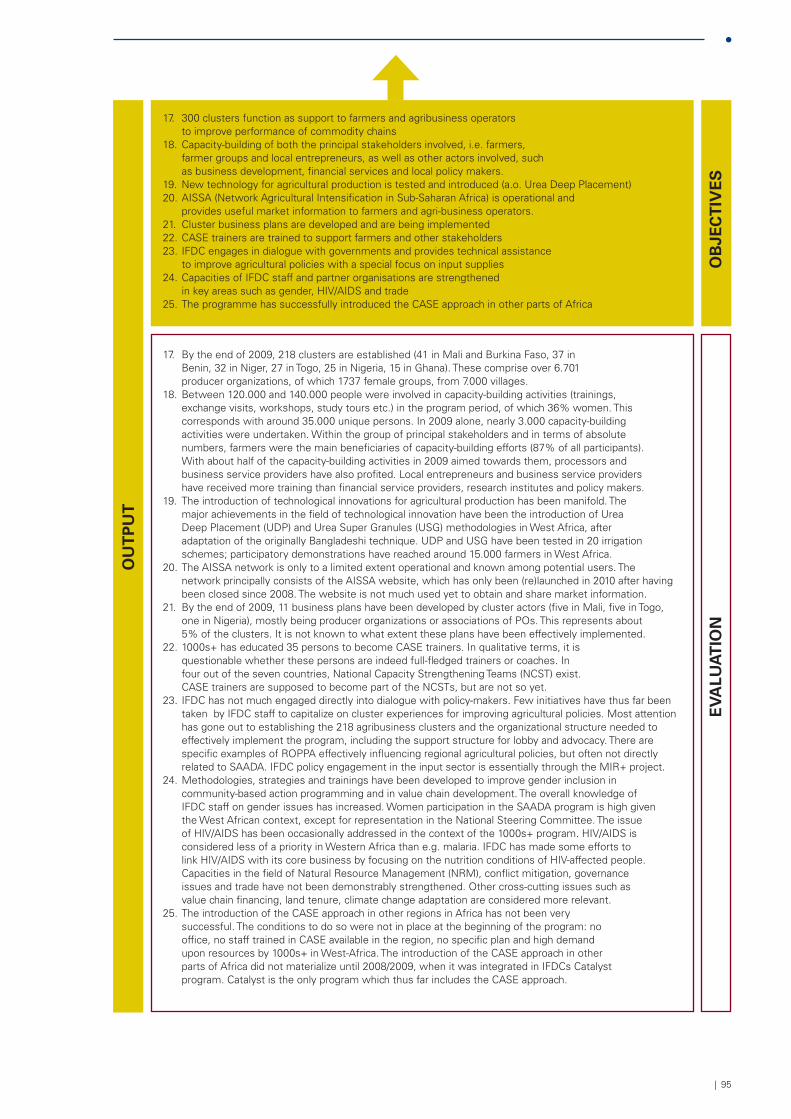
| 95
17. 300 clusters function as support to farmers and agribusiness operators to improve performance of commodity chains
18. Capacity-building of both the principal stakeholders involved, i.e. farmers, farmer groups and local entrepreneurs, as well as other actors involved, such as business development, financial services and local policy makers.
19. New technology for agricultural production is tested and introduced (a.o. Urea Deep Placement)20. AISSA (Network Agricultural Intensification in Sub-Saharan Africa) is operational and
provides useful market information to farmers and agri-business operators.21. Cluster business plans are developed and are being implemented22. CASE trainers are trained to support farmers and other stakeholders 23. IFDC engages in dialogue with governments and provides technical assistance
to improve agricultural policies with a special focus on input supplies24. Capacities of IFDC staff and partner organisations are strengthened
in key areas such as gender, HIV/AIDS and trade25. The programme has successfully introduced the CASE approach in other parts of Africa
ou
TP
uT
ob
jeC
Tiv
eS
ev
alu
aT
ioN
17. By the end of 2009, 218 clusters are established (41 in Mali and Burkina Faso, 37 in Benin, 32 in Niger, 27 in Togo, 25 in Nigeria, 15 in Ghana). These comprise over 6.701 producer organizations, of which 1737 female groups, from 7.000 villages.
18. Between 120.000 and 140.000 people were involved in capacity-building activities (trainings, exchange visits, workshops, study tours etc.) in the program period, of which 36% women. This corresponds with around 35.000 unique persons. In 2009 alone, nearly 3.000 capacity-building activities were undertaken. Within the group of principal stakeholders and in terms of absolute numbers, farmers were the main beneficiaries of capacity-building efforts (87% of all participants). With about half of the capacity-building activities in 2009 aimed towards them, processors and business service providers have also profited. Local entrepreneurs and business service providers have received more training than financial service providers, research institutes and policy makers.
19. The introduction of technological innovations for agricultural production has been manifold. The major achievements in the field of technological innovation have been the introduction of Urea Deep Placement (UDP) and Urea Super Granules (USG) methodologies in West Africa, after adaptation of the originally Bangladeshi technique. UDP and USG have been tested in 20 irrigation schemes; participatory demonstrations have reached around 15.000 farmers in West Africa.
20. The AISSA network is only to a limited extent operational and known among potential users. The network principally consists of the AISSA website, which has only been (re)launched in 2010 after having been closed since 2008. The website is not much used yet to obtain and share market information.
21. By the end of 2009, 11 business plans have been developed by cluster actors (five in Mali, five in Togo, one in Nigeria), mostly being producer organizations or associations of POs. This represents about 5% of the clusters. It is not known to what extent these plans have been effectively implemented.
22. 1000s+ has educated 35 persons to become CASE trainers. In qualitative terms, it is questionable whether these persons are indeed full-fledged trainers or coaches. In four out of the seven countries, National Capacity Strengthening Teams (NCST) exist. CASE trainers are supposed to become part of the NCSTs, but are not so yet.
23. IFDC has not much engaged directly into dialogue with policy-makers. Few initiatives have thus far been taken by IFDC staff to capitalize on cluster experiences for improving agricultural policies. Most attention has gone out to establishing the 218 agribusiness clusters and the organizational structure needed to effectively implement the program, including the support structure for lobby and advocacy. There are specific examples of ROPPA effectively influencing regional agricultural policies, but often not directly related to SAADA. IFDC policy engagement in the input sector is essentially through the MIR+ project.
24. Methodologies, strategies and trainings have been developed to improve gender inclusion in community-based action programming and in value chain development. The overall knowledge of IFDC staff on gender issues has increased. Women participation in the SAADA program is high given the West African context, except for representation in the National Steering Committee. The issue of HIV/AIDS has been occasionally addressed in the context of the 1000s+ program. HIV/AIDS is considered less of a priority in Western Africa than e.g. malaria. IFDC has made some efforts to link HIV/AIDS with its core business by focusing on the nutrition conditions of HIV-affected people. Capacities in the field of Natural Resource Management (NRM), conflict mitigation, governance issues and trade have not been demonstrably strengthened. Other cross-cutting issues such as value chain financing, land tenure, climate change adaptation are considered more relevant.
25. The introduction of the CASE approach in other regions in Africa has not been very successful. The conditions to do so were not in place at the beginning of the program: no office, no staff trained in CASE available in the region, no specific plan and high demand upon resources by 1000s+ in West-Africa. The introduction of the CASE approach in other parts of Africa did not materialize until 2008/2009, when it was integrated in IFDCs Catalyst program. Catalyst is the only program which thus far includes the CASE approach.
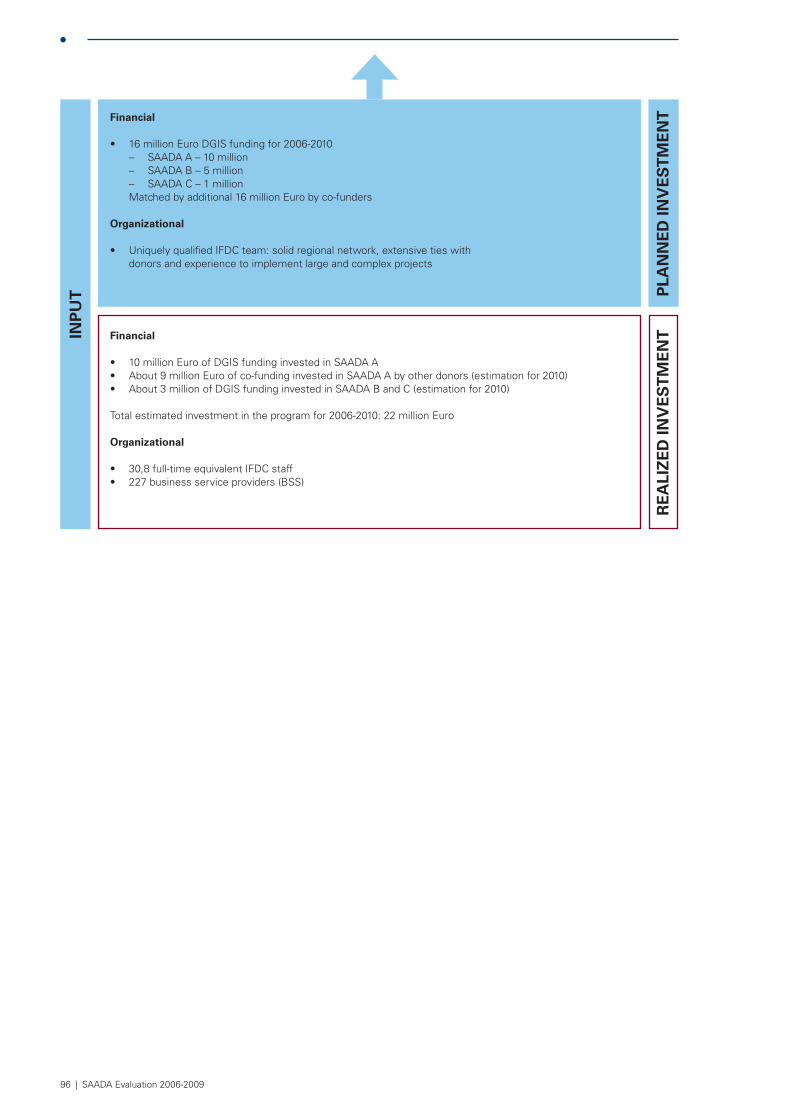
96 | SAADA Evaluation 2006-2009
Financial
• 16 million Euro DGIS funding for 2006-2010 – SAADA A – 10 million – SAADA B – 5 million – SAADA C – 1 million
Matched by additional 16 million Euro by co-funders
organizational
• Uniquely qualified IFDC team: solid regional network, extensive ties with donors and experience to implement large and complex projects
iNP
uT P
laN
Ne
D iN
ve
ST
me
NT
re
ali
ze
D iN
ve
ST
me
NTFinancial
• 10 million Euro of DGIS funding invested in SAADA A• About 9 million Euro of co-funding invested in SAADA A by other donors (estimation for 2010)• About 3 million of DGIS funding invested in SAADA B and C (estimation for 2010)
Total estimated investment in the program for 2006-2010: 22 million Euro
organizational
• 30,8 full-time equivalent IFDC staff• 227 business service providers (BSS)
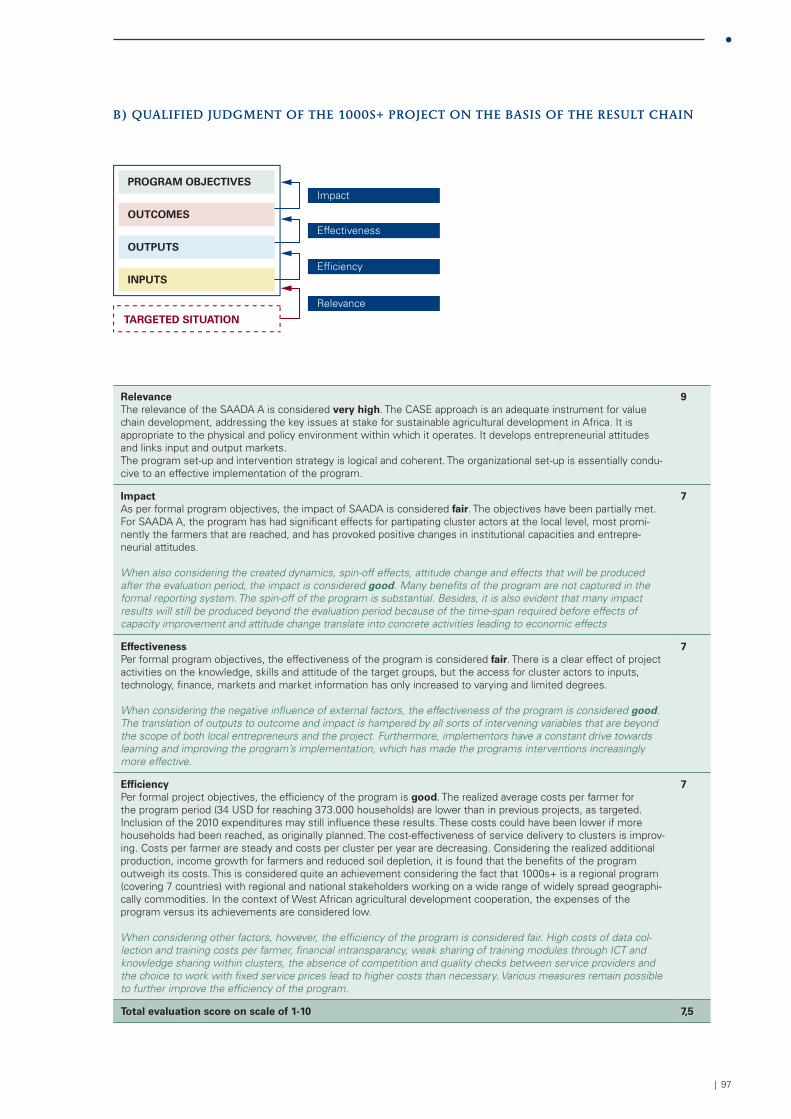
| 97
b) QuALifiED juDgmEnT of ThE 1000S+ projEcT on ThE bASiS of ThE rESuLT chAin
PROGRAM OBJECTIVES
OUTCOMES
OUTPUTS
INPUTS
TARGETED SITUATION
Impact
Effectiveness
Efficiency
Relevance
relevanceThe relevance of the SAADA A is considered very high. The CASE approach is an adequate instrument for value chain development, addressing the key issues at stake for sustainable agricultural development in Africa. It is appropriate to the physical and policy environment within which it operates. It develops entrepreneurial attitudes and links input and output markets. The program set-up and intervention strategy is logical and coherent. The organizational set-up is essentially condu-cive to an effective implementation of the program.
9
impactAs per formal program objectives, the impact of SAADA is considered fair. The objectives have been partially met. For SAADA A, the program has had significant effects for partipating cluster actors at the local level, most promi-nently the farmers that are reached, and has provoked positive changes in institutional capacities and entrepre-neurial attitudes.
When also considering the created dynamics, spin-off effects, attitude change and effects that will be produced after the evaluation period, the impact is considered good. Many benefits of the program are not captured in the formal reporting system. The spin-off of the program is substantial. Besides, it is also evident that many impact results will still be produced beyond the evaluation period because of the time-span required before effects of capacity improvement and attitude change translate into concrete activities leading to economic effects
7
effectivenessPer formal program objectives, the effectiveness of the program is considered fair. There is a clear effect of project activities on the knowledge, skills and attitude of the target groups, but the access for cluster actors to inputs, technology, finance, markets and market information has only increased to varying and limited degrees.
When considering the negative influence of external factors, the effectiveness of the program is considered good. The translation of outputs to outcome and impact is hampered by all sorts of intervening variables that are beyond the scope of both local entrepreneurs and the project. Furthermore, implementors have a constant drive towards learning and improving the program’s implementation, which has made the programs interventions increasingly more effective.
7
efficiencyPer formal project objectives, the efficiency of the program is good. The realized average costs per farmer for the program period (34 USD for reaching 373.000 households) are lower than in previous projects, as targeted. Inclusion of the 2010 expenditures may still influence these results. These costs could have been lower if more households had been reached, as originally planned. The cost-effectiveness of service delivery to clusters is improv-ing. Costs per farmer are steady and costs per cluster per year are decreasing. Considering the realized additional production, income growth for farmers and reduced soil depletion, it is found that the benefits of the program outweigh its costs. This is considered quite an achievement considering the fact that 1000s+ is a regional program (covering 7 countries) with regional and national stakeholders working on a wide range of widely spread geographi-cally commodities. In the context of West African agricultural development cooperation, the expenses of the program versus its achievements are considered low.
When considering other factors, however, the efficiency of the program is considered fair. High costs of data col-lection and training costs per farmer, financial intransparancy, weak sharing of training modules through ICT and knowledge sharing within clusters, the absence of competition and quality checks between service providers and the choice to work with fixed service prices lead to higher costs than necessary. Various measures remain possible to further improve the efficiency of the program.
7
Total evaluation score on scale of 1-10 7,5

98 | SAADA Evaluation 2006-2009
| 99
10 . future perspectives
continuation of the SAADA program . . .
Given the positive results of the evaluation regarding relevance, effectiveness, sustainable impact and efficiency
of the SAADA A/1000s+ program, the evaluation team recommends the continuation of the program. We suggest
considering 2011 as a transition year during which a successive program 2012-2015 is formulated. To ensure con-
tinuity of agribusiness cluster development and staff retention, explicit decision-making is required on the shortest
notice possible regarding the continuation of SAADA A activities in 2011, including the elaboration of a work plan
2011 and the continuation of contracts during 2011. It is recommended that remaining SAADA B and C funds,
and some additional funding from DGIS, be utilized for the continuation of SAADA A in 2011 as well as invest-
ments related to the formulation of SAADA 2012-2015. It is important to formulate realistic and feasible objectives
for 2012-2015.
… embedded in a cASE framework program …
The essence of SAADA 2012-2015 is recommended to remain unchanged: the CASE approach focusing on stake-
holder collaboration for building competitive agricultural systems and enterprises. While the approach is solid, it
may be enriched by introducing conditions and strategies for successful implementation. To broaden the critical
mass of organizations and people understanding the CASE approach, relevant partners should be involved in the
formulation of SAADA 2012-2015. The program should have a logical intervention strategy, with clearly identi-
fied key operational areas and budget categories. The SAADA 2012-2015 program would form the basis of a CASE
framework program. Additional funding is handled either as direct contribution to the CASE framework program
(i.e. included in the program set-up and reporting logic), or as projects overtly related to the framework program
(i.e. with distinct objectives, implementation and reporting modalities, but contributing to the same impact goals).
. . . with ifDc leading SAADA . . .
The SAADA 2012-2015 program, focusing on strengthening business-oriented collaboration between differ-
ent actors in agribusiness clusters, remains to be coordinated by IFDC. SAADA 2012-2015 should include action
research components and should give sufficient attention to cross-cutting issues, thus integrating former SAADA B
and C elements. For SAADA 2012-2015, we propose to limit the interventions to the seven countries in West Africa
(not expanding to other parts of Africa) in order to keep the program manageable and in order to avoid effects and
impact becoming diluted. Whereas under SAADA A 2006-2010, about 80 to 90% of the capacity strengthening
services was targeted at producer organizations, a more balanced attention towards all cluster actor groups is rec-
ommended for SAADA 2012-2015. Strategic partnerships shall be concluded under the CASE framework program
to ensure that the needs of all actors are taken into account. We plea for not installing a credit facility or invest-
ment fund in the CASE framework program as this is in contradiction with market driven approach.
. . . Agriterra providing additional support to producer organisations . . .
When the relatively heavy focus on producer organisations is replaced in the SAADA 2012-2015 program by more
equal attention to all cluster actors, continued support to producer organisations – where and when required
– could be provided under a separate Farmers Fighting Poverty II program. We suggest that the Farmers Fight-
ing Poverty II program, to be coordinated by Agriterra, is aligned with the SAADA 2012-2015 program, under the
CASE framework program. This implies for example that specific producer groups, in need of additional capacity
strengthening support, are identified by the SAADA Cluster Advisors and served by the Agriterra program. Coor-
dination and monitoring of alignment could be done at national level by the National Steering Committees. It is
recommended that Agriterra assumes an expert role under the CASE framework program, rather than a role as
donor of the SAADA program.
100 | SAADA Evaluation 2006-2009
. . . the ministry promoting alignment under the cASE framework program . . .
Other programs may be aligned under the CASE framework program, depending on needs and opportunities at
national level. We suggest to minimally seek alignment with programs focussing on strengthening financial service
provision in rural areas, and with organizations strengthening BSSs (or so-called ‘local capacity builders’). As far as
the Dutch Ministry of Foreign Affairs (through DGIS and Embassies) is involved in funding these complementary
programs and organisations, an active role of the Ministry is recommended in promoting alignment under the
CASE framework program. In addition, programs by (multinational) companies aiming at sourcing production,
may be integrated in the CASE framework program as well.
. . . and roppA as ‘spokesperson’ of producers .
We propose a more articulated contribution of ROPPA as ‘spokesperson’ of rural producers at (national and)
regional level. A specific procedure should be developed to translate burning issues at cluster level into subjects for
advocacy and lobbying at national and regional level. We suggest that Agriterra supports producer organisations
and ROPPA, in developing and implementing lobby and advocacy agendas based on cluster inputs. Particular atten-
tion is paid to out-scaling: promotion of CASE experiences within national farmer federations.
clusters are selected on the basis of explicit criteria . . .
On the basis of experiences with SAADA 2006-2010, we suggest that a typology of agribusiness clusters be devel-
oped with different pathways and key success factors for AB cluster formation and development. In the SAADA
2011-2015 program, it is recommended that clusters be selected on the basis of country-specific entry strategies.
These strategies make clear what balance between social considerations (empowerment of local groups, gender bal-
ance, CASE experiences across the country) and economic considerations (geographic concentration, cluster size,
cluster networking, economic viability,…) is aimed for.
For instance:
• preferences for certain commodities could be elaborated (for example in order to benefit from
economies of scale, or in order to ensure a minimum number of female-led clusters);
• choices could be made for a certain geographical concentration (in order to increase effects and
impact by collaboration between neighbouring cluster, and in order to reduce costs);
• priority could be given to clusters where complementary collaboration
can be established with programs and partners;
AB cluster development is eligible for SAADA support only when the cluster is comprised of all CASE actors. Busi-
ness ideas will continue to be submitted by producer organisations, but other actor groups are actively encouraged
to submit business ideas too.
. . . supported on the basis of multi-annual cluster plans . . .
Rather than developing cluster action plans on an annual basis, we suggest to introduce cluster action plans with
a 3 to 5 years’ horizon. These plans should contain both SMART economic objectives for the cluster as a whole
and for respective cluster actors, as well as capacity strengthening objectives of all actors. Additionally, they should
contain yearly increasing own contributions and a phasing out strategy. Finally, cluster action plans should specify
required services of CASE coaches and business service providers, as well as their costs. CASE coaches should have
a gradually larger role in cluster action planning and evaluation. Annually, the results of the multi-annual cluster
plan should be evaluated and the plan may be updated or specified for the coming year while planned activities
remain to be financed without interruption.
. . . trained on the basis of proven didactics . . .
In SAADA 2011-2015, it is recommended that more attention be paid to the effectiveness of trainings. Training of
trainers is required to ensure that training didactics are relevant to participants’ needs and to ensure more effective
use of training material. The business management component of training should be intensified: more attention to
| 101
issues as production and productivity figures, cost-benefit analysis, business plan development, financial manage-
ment, opportunities for product and market development. Other capacity-building instruments, such as audio-
visual support for sharing information about new technologies, demonstration plots, farmer field schools and study
tours, could be more actively promoted. The effects of training are to be monitored in quantitative and qualitative
terms.
…by capable business support services …
The delivery of capacity strengthening services at cluster level should remain to be provided by BSSs, under guid-
ance of IFDCs AB Cluster Advisor. Contracts with BSSs should stipulate clear results (milestones) to be achieved as
a basis for monitoring and control by IFDC. In order to enhance the focus of BSS on results and to reduce finan-
cial administration at IFDC, it is recommended that BSSs be paid lump sum amounts on the basis of performance
agreements. For more mature clusters, the responsibilities for contracting BSS may be transferred to the cluster
actors themselves.
… supported by a proper institutional structure . . .
Given the growing number of actors, it is important that the roles and required qualifications of different types of
CASE facilitators be further defined. The proposed categories comprise: IFDC staff, NSCs, CASE trainers (certified),
CASE coaches, business services providers to clusters and own staff of cluster actors. IFDCs limited staff policy
should be maintained, although additional strategic capacity at national level is required to catalyze multi-stake-
holder cluster formation and out-scaling.
We recommend that the AISSA network be turned into a ‘training shop’ or ‘boutique de formation’, providing
training modules, case studies, a toolbox for cluster facilitation, and cluster actor testimonies. The training modules
should include a trainers’ guide, hand-outs for trainees and audio-visual support when appropriate, contributing
to improved training didactics. BSSs can use existing training modules without developing each of these independ-
ently. It is suggested that AISSA define criteria for membership. IFDC staff, NSC representatives, CASE coaches
and trainers may comprise the core membership of AISSA and have preferential access to resources. Development
practitioners and others may source materials in the public section of the AISSA platform. The network should be
actively moderated to ensure high quality.
Furthermore, the effectiveness of National Steering Committees should be further enhanced in a second phase
of SAADA, becoming a real national-level multi-stakeholder action forum. NSC members actively represent their
organizations, pro-actively establish linkages between relevant actors at national level and develop lobby and advo-
cacy trajectories for improved access to credit and inputs, agricultural investment funds and measures to reduce
risks for investing in agricultural sector. A division of tasks amongst members (advocacy, partnerships, service
provision to grass-root actors etc.) may be thereto required.
. . . phased out if maturity is reached . . .
The above-mentioned typology of agribusiness clusters with different pathways and key success factors for AB clus-
ter formation and development is used to determine exit strategies. Support to clusters should be phased and time-
bound. Per phase, clusters receive different support. Limited financial support for testing new technologies and/or
kick-start economic activities should be considered for ‘young’ clusters with a high number of poor inexperienced
local entrepreneurs not yet eligible for credit. More mature clusters should receive relatively more business manage-
ment training and less technical training. They increasingly finance cluster activities from own means. Support to
insufficiently motivated or insufficiently performing clusters should be discontinued. Mature clusters supported by
SAADA 2006-2010 should be gradually phased out, but cluster development remains to be monitored.
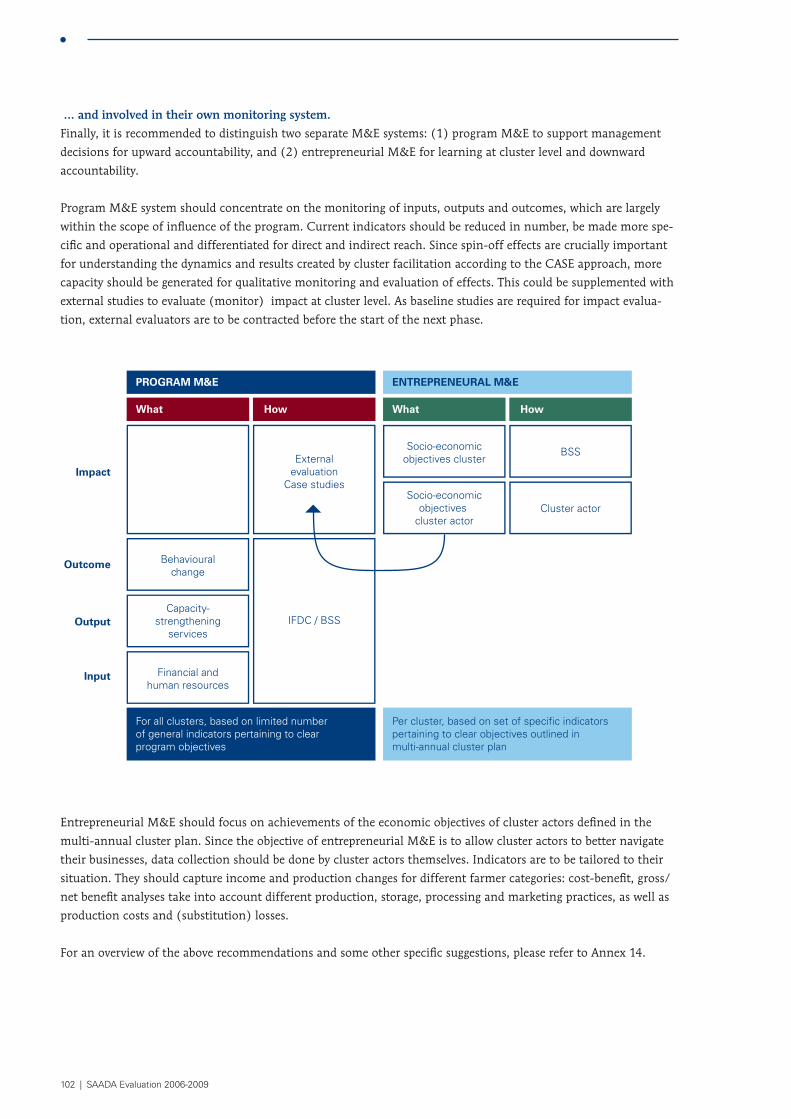
102 | SAADA Evaluation 2006-2009
… and involved in their own monitoring system .
Finally, it is recommended to distinguish two separate M&E systems: (1) program M&E to support management
decisions for upward accountability, and (2) entrepreneurial M&E for learning at cluster level and downward
accountability.
Program M&E system should concentrate on the monitoring of inputs, outputs and outcomes, which are largely
within the scope of influence of the program. Current indicators should be reduced in number, be made more spe-
cific and operational and differentiated for direct and indirect reach. Since spin-off effects are crucially important
for understanding the dynamics and results created by cluster facilitation according to the CASE approach, more
capacity should be generated for qualitative monitoring and evaluation of effects. This could be supplemented with
external studies to evaluate (monitor) impact at cluster level. As baseline studies are required for impact evalua-
tion, external evaluators are to be contracted before the start of the next phase.
Impact
Outcome
Output
Input
PROGRAM M&E
For all clusters, based on limited number of general indicators pertaining to clear program objectives
What How
Externalevaluation
Case studies
IFDC / BSS
Behaviouralchange
Capacity-strengthening
services
Financial andhuman resources
ENTREPRENEURAL M&E
Per cluster, based on set of specific indicatorspertaining to clear objectives outlined inmulti-annual cluster plan
What How
Socio-economicobjectives cluster
Socio-economicobjectives
cluster actor
BSS
Cluster actor
Entrepreneurial M&E should focus on achievements of the economic objectives of cluster actors defined in the
multi-annual cluster plan. Since the objective of entrepreneurial M&E is to allow cluster actors to better navigate
their businesses, data collection should be done by cluster actors themselves. Indicators are to be tailored to their
situation. They should capture income and production changes for different farmer categories: cost-benefit, gross/
net benefit analyses take into account different production, storage, processing and marketing practices, as well as
production costs and (substitution) losses.
For an overview of the above recommendations and some other specific suggestions, please refer to Annex 14.
| 103
Annexes
Annex 1 . Terms of Reference SAADA evaluation 2006-2009
Annex 2 . Evaluation methodology
Annex 3 . Overview of stakeholders consulted
Annex 4 . Resultats de l’enquête
Annex 5 . Country analysis SWOT
Annex 6 . Case study report Benin
Annex 7 . Case study report Burkina Faso
Annex 8 . Case study report Ghana
Annex 9 . Case study report Mali
Annex 10 . Case study report Niger
Annex 11 . Case study report Nigeria
Annex 12 . Case study report Togo
Annex 13 . Summary discussions Regional Advisory Committee meeting 6-7 September 2010
Annex 14 . List of specific recommendations

104 | SAADA Evaluation 2006-2009