Local Economic Development in B.C. 2016 Survey · The level of support and resources accessible to...
31
Local Economic Development in B.C. 2016 Survey Technical Report: Results Tables June 2016
Transcript of Local Economic Development in B.C. 2016 Survey · The level of support and resources accessible to...

Local Economic Development in B.C.
2016 Survey
Technical Report: Results Tables
June 2016

P a g e | 2
Contents
About the Survey ...................................................................................................................................................................................... 3
Overview ................................................................................................................................................................................................ 3
Response ................................................................................................................................................................................................ 3
Comparability ....................................................................................................................................................................................... 4
Additional Reports ................................................................................................................................................................................ 4
Respondent Profile ................................................................................................................................................................................... 5
Structure ..................................................................................................................................................................................................... 8
Support ..................................................................................................................................................................................................... 11
Planning, Measurement and Reporting .............................................................................................................................................. 14
Priorities and Activities ............................................................................................................................................................................ 21
Resources ................................................................................................................................................................................................. 25
Collaboration and Communication .................................................................................................................................................... 26
Economic Diversity ................................................................................................................................................................................. 28
Challenges .............................................................................................................................................................................................. 30
P a g e | 3
About the Survey
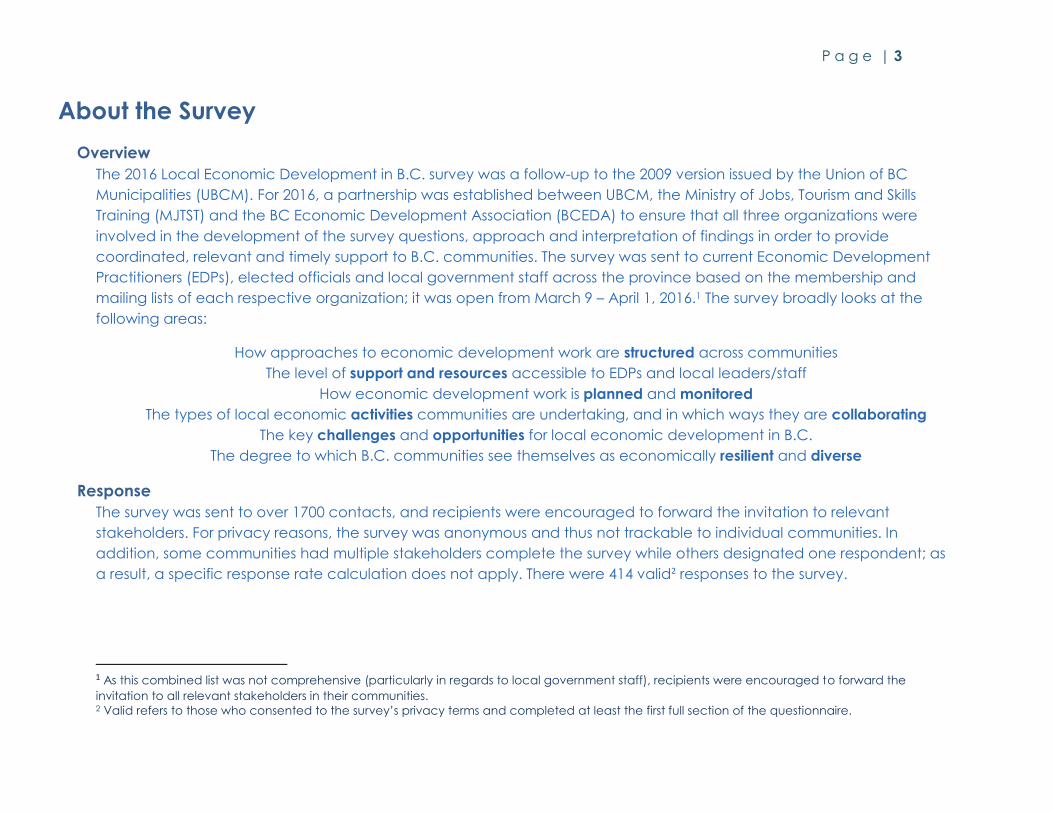
Overview
The 2016 Local Economic Development in B.C. survey was a follow-up to the 2009 version issued by the Union of BC
Municipalities (UBCM). For 2016, a partnership was established between UBCM, the Ministry of Jobs, Tourism and Skills
Training (MJTST) and the BC Economic Development Association (BCEDA) to ensure that all three organizations were
involved in the development of the survey questions, approach and interpretation of findings in order to provide
coordinated, relevant and timely support to B.C. communities. The survey was sent to current Economic Development
Practitioners (EDPs), elected officials and local government staff across the province based on the membership and
mailing lists of each respective organization; it was open from March 9 – April 1, 2016.1 The survey broadly looks at the
following areas:
How approaches to economic development work are structured across communities
The level of support and resources accessible to EDPs and local leaders/staff
How economic development work is planned and monitored
The types of local economic activities communities are undertaking, and in which ways they are collaborating
The key challenges and opportunities for local economic development in B.C.
The degree to which B.C. communities see themselves as economically resilient and diverse
Response
The survey was sent to over 1700 contacts, and recipients were encouraged to forward the invitation to relevant
stakeholders. For privacy reasons, the survey was anonymous and thus not trackable to individual communities. In
addition, some communities had multiple stakeholders complete the survey while others designated one respondent; as
a result, a specific response rate calculation does not apply. There were 414 valid2 responses to the survey.
1 As this combined list was not comprehensive (particularly in regards to local government staff), recipients were encouraged to forward the
invitation to all relevant stakeholders in their communities. 2 Valid refers to those who consented to the survey’s privacy terms and completed at least the first full section of the questionnaire.

P a g e | 4
Comparability
The current survey had approximately 70% consistency with the previous survey that was fielded by UBCM in 2009. While
the original intent was to compare the time periods directly, the respondent group size (414 in 2016 versus 124 in 2009) as
well as the change to privacy approach (anonymous in 2016 versus targeted to individual communities in 2009) means
any direct comparison should be made with caution.
Within this technical report, the following demographics are presented for comparison3 on the various survey questions,
broken down into the following categories:
Role
o Economic Development Practitioners (EDPs)
o Elected officials
o Local government staff
Community size
o Small (under 5,000)
o Mid-sized (5,000 – 50,000)
o Large (over 50,000)
Area Association
Additional Reports
A summary report of the 2016 survey is available that draws out the key trends of the survey results. This report presents
the results by question and does not contain any analysis. gov.bc.ca/economicdevelopment/resources
Questions?
The survey data was compiled and analyzed by the Economic Development Division of MJTST. If you have any questions
or would like more information about any aspect of the survey, please send a note to
3 These categories are not exhaustive; for each there are other excluded categories, as well as the option to select “don’t know/not applicable”.
Results may not sum to 100% due to rounding.

P a g e | 5
Respondent Profile
Please identify the Area Association you work within: 2016
Percent
2009
Percent
Association of Kootenay and Boundary Local Governments
(AKBLG) 12% 12%
Association of Vancouver Island and Coastal Communities
(AVICC) 24% 27%
Lower Mainland Local Government Association (LMLGA) 17% 23%
North Central Local Government Association (NCLGA) 17% 18%
Southern Interior Local Government Association (SILGA) 21% 20%
Don't know/Not applicable 10% --
2016 n=414; 2009 n=124
In which Economic Region in B.C. are you located? 2016
Percent
Cariboo 5%
Kootenay 12%
Lower Mainland/Southwest 19%
Nechako 6%
North Coast 5%
Northeast 4%
Thompson/Okanagan 22%
Vancouver Island/Coast 26%
2016 n=414
What is the population of your community? 2016
Percent
Under 1,000 8%
1,000 – 5,000 26%
5,001 – 10,000 16%

P a g e | 6
What is the population of your community? 2016
Percent
10,001 – 20,000 17%
20,001 – 50,000 9%
Larger than 50,000 23%
Not applicable 1%
2016 n=414
Population - Combined comparison 2016 Percent 2009 Percent
Small (under 5,000) 34% 40%
Mid-sized (5,000 - 20,000) 33% 25%
Large (20,000 - 50,000) 9% 14%
Metropolitan (over 50,000) 23% 21%
2016 n=414; 2009 n= 124 Note: the comparisons of population below are based on small, mid-sized and large communities as outlined in the introduction.
2016 n=414
Which of the following best describes your role as related to local
economic development?
2016
Percent
Elected official 31%
Local government staff 22%
Economic development officer/manager/director (local, regional or arms-
length) 18%
Chamber of Commerce 9%
Other (please specify) 7%
Community Futures 6%
Not-for-profit organization 5%
Employee within an economic trust or agency 2%

P a g e | 7
How long have you been working in a position related to local
government and/or economic development?
2016
Percent
Less than a year 7%
1-3 years 24%
4-7 years 22%
8-10 years 11%
More than ten years 34%
Prefer not to say 3%
2016 n=303
To what age group do you belong? 2016
Percent
21-30 5%
31-40 14%
41-50 17%
51-60 32%
Over 60 26%
Prefer not to say 6%
2016 n=303
With what gender do you identify? 2016
Percent
Female 44%
Male 53%
Prefer not to say 3%
2016 n=303
P a g e | 8
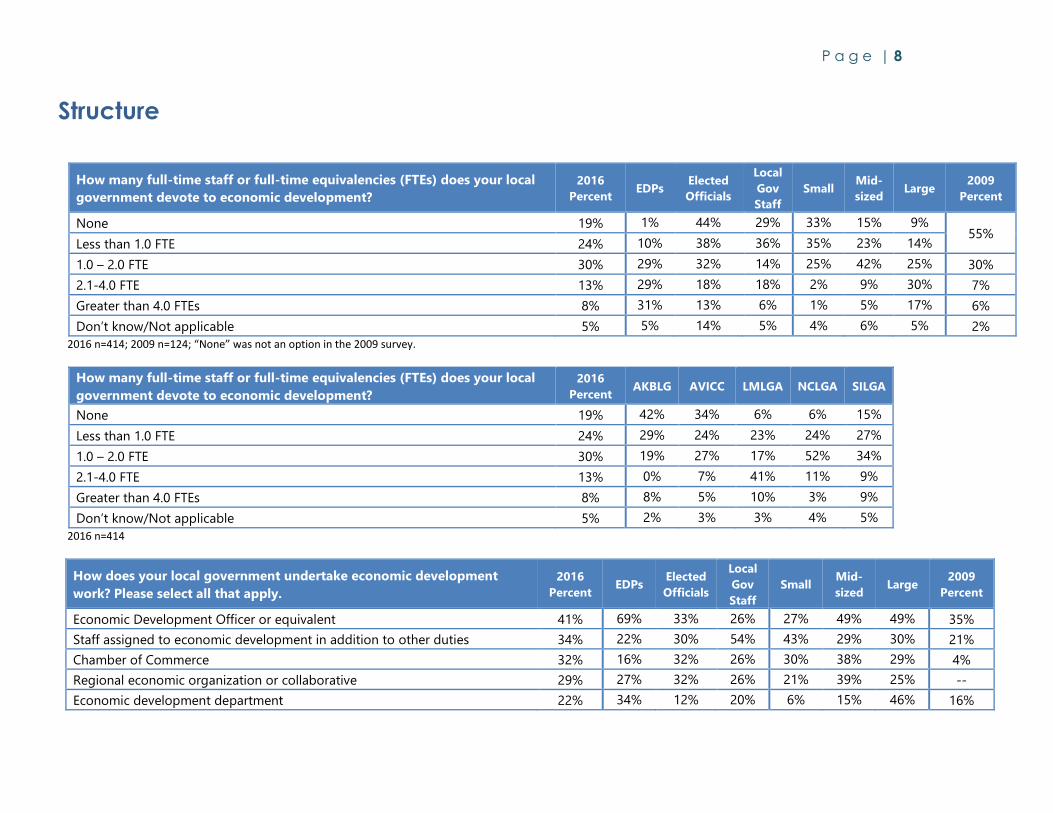
Structure
How many full-time staff or full-time equivalencies (FTEs) does your local
government devote to economic development?
2016
Percent EDPs
Elected
Officials
Local
Gov
Staff
Small Mid-
sized Large
2009
Percent
None 19% 1% 44% 29% 33% 15% 9% 55%
Less than 1.0 FTE 24% 10% 38% 36% 35% 23% 14%
1.0 – 2.0 FTE 30% 29% 32% 14% 25% 42% 25% 30%
2.1-4.0 FTE 13% 29% 18% 18% 2% 9% 30% 7%
Greater than 4.0 FTEs 8% 31% 13% 6% 1% 5% 17% 6%
Don’t know/Not applicable 5% 5% 14% 5% 4% 6% 5% 2%
2016 n=414; 2009 n=124; “None” was not an option in the 2009 survey.
How many full-time staff or full-time equivalencies (FTEs) does your local
government devote to economic development?
2016
Percent AKBLG AVICC LMLGA NCLGA SILGA
None 19% 42% 34% 6% 6% 15%
Less than 1.0 FTE 24% 29% 24% 23% 24% 27%
1.0 – 2.0 FTE 30% 19% 27% 17% 52% 34%
2.1-4.0 FTE 13% 0% 7% 41% 11% 9%
Greater than 4.0 FTEs 8% 8% 5% 10% 3% 9%
Don’t know/Not applicable 5% 2% 3% 3% 4% 5%
2016 n=414
How does your local government undertake economic development
work? Please select all that apply.
2016
Percent EDPs
Elected
Officials
Local
Gov
Staff
Small Mid-
sized Large
2009
Percent
Economic Development Officer or equivalent 41% 69% 33% 26% 27% 49% 49% 35%
Staff assigned to economic development in addition to other duties 34% 22% 30% 54% 43% 29% 30% 21%
Chamber of Commerce 32% 16% 32% 26% 30% 38% 29% 4%
Regional economic organization or collaborative 29% 27% 32% 26% 21% 39% 25% --
Economic development department 22% 34% 12% 20% 6% 15% 46% 16%

P a g e | 9
How does your local government undertake economic development
work? Please select all that apply.
2016
Percent EDPs
Elected
Officials
Local
Gov
Staff
Small Mid-
sized Large
2009
Percent
Voluntary committee mandated by local government 20% 19% 22% 17% 21% 23% 14% 21%
Non-profit society 16% 26% 10% 4% 9% 17% 22% 18%
Related department (non-economic development specific) 10% 10% 9% 12% 6% 13% 13% 13%
Community Futures 9% 0% 10% 11% 13% 7% 4% --
Private corporation or consultant 2% 3% 3% 1% 1% 2% 5% 12%
2016 n=414; 2009 n=124
How does your local government undertake economic development
work? Please select all that apply.
2016
Percent AKBLG AVICC LMLGA NCLGA SILGA
Economic Development Officer or equivalent 41% 19% 28% 41% 68% 42%
Staff assigned to economic development in addition to other duties 34% 27% 30% 39% 37% 41%
Chamber of Commerce 32% 35% 30% 26% 25% 35%
Regional economic organization or collaborative 29% 25% 34% 13% 37% 31%
Economic development department 22% 2% 16% 54% 20% 14%
Voluntary committee mandated by local government 20% 13% 23% 23% 14% 24%
Non-profit society 16% 10% 13% 10% 10% 24%
Related department (non-economic development specific) 10% 8% 7% 14% 14% 11%
Community Futures 9% 27% 10% 1% 4% 6%
Private corporation or consultant 2% 0% 2% 4% 1% 2%
2016 n=414
In your opinion, how effective has this approach
been in delivering economic development support
to your community?
2016
Percent EDPs
Elected
Officials
Local
Gov Staff Small
Mid-
sized Large
2009
Percent
Somewhat/very effective 61% 89% 53% 56% 46% 62% 76% 58%
Not too effective/not effective at all 34% 9% 41% 35% 48% 35% 18% 27%
Don't know/Not applicable 5% 1% 6% 9% 6% 3% 6% 15%
2016 n=414; 2009 n=121

P a g e | 10
In your opinion, how effective has this approach
been in delivering economic development support
to your community?
2016
Percent AKBLG AVICC LMLGA NCLGA SILGA
Somewhat/very effective 61% 37% 48% 87% 60% 67%
Not too effective/not effective at all 34% 48% 46% 12% 34% 29%
Don't know/Not applicable 5% 15% 6% 1% 6% 4%
2016 n=414
P a g e | 11
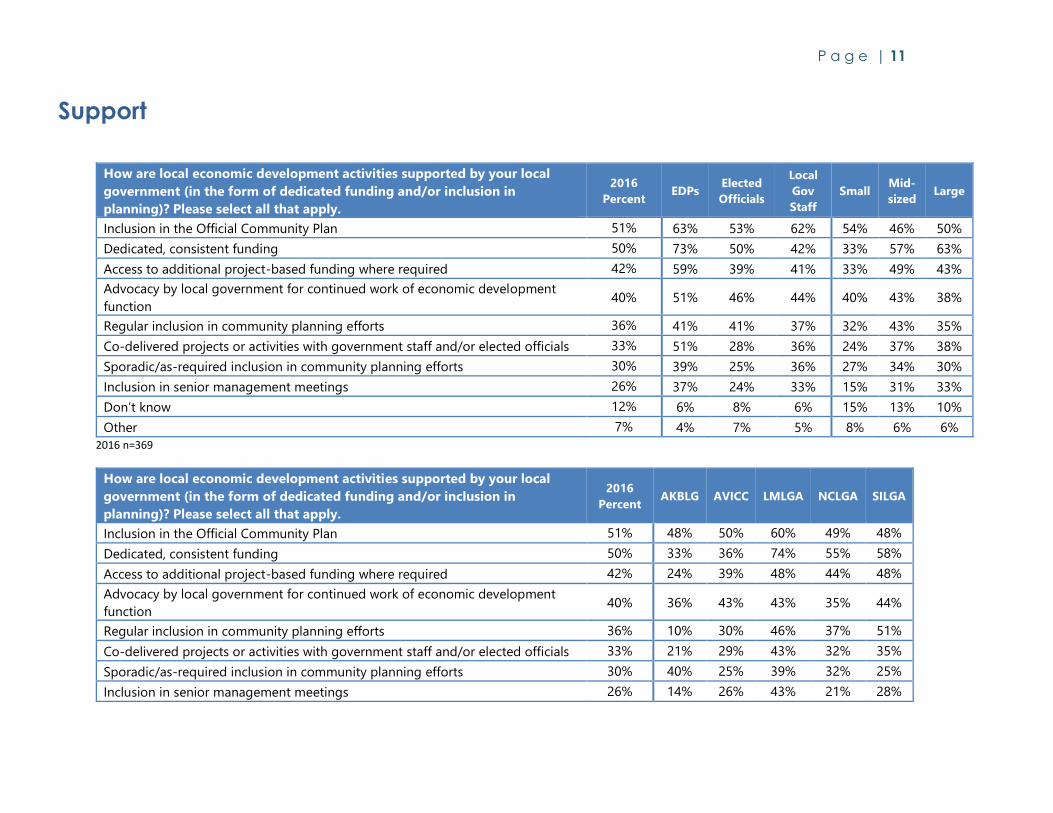
Support
How are local economic development activities supported by your local
government (in the form of dedicated funding and/or inclusion in
planning)? Please select all that apply.
2016
Percent EDPs
Elected
Officials
Local
Gov
Staff
Small Mid-
sized Large
Inclusion in the Official Community Plan 51% 63% 53% 62% 54% 46% 50%
Dedicated, consistent funding 50% 73% 50% 42% 33% 57% 63%
Access to additional project-based funding where required 42% 59% 39% 41% 33% 49% 43%
Advocacy by local government for continued work of economic development
function 40% 51% 46% 44% 40% 43% 38%
Regular inclusion in community planning efforts 36% 41% 41% 37% 32% 43% 35%
Co-delivered projects or activities with government staff and/or elected officials 33% 51% 28% 36% 24% 37% 38%
Sporadic/as-required inclusion in community planning efforts 30% 39% 25% 36% 27% 34% 30%
Inclusion in senior management meetings 26% 37% 24% 33% 15% 31% 33%
Don’t know 12% 6% 8% 6% 15% 13% 10%
Other 7% 4% 7% 5% 8% 6% 6%
2016 n=369
How are local economic development activities supported by your local
government (in the form of dedicated funding and/or inclusion in
planning)? Please select all that apply.
2016
Percent AKBLG AVICC LMLGA NCLGA SILGA
Inclusion in the Official Community Plan 51% 48% 50% 60% 49% 48%
Dedicated, consistent funding 50% 33% 36% 74% 55% 58%
Access to additional project-based funding where required 42% 24% 39% 48% 44% 48%
Advocacy by local government for continued work of economic development
function 40% 36% 43% 43% 35% 44%
Regular inclusion in community planning efforts 36% 10% 30% 46% 37% 51%
Co-delivered projects or activities with government staff and/or elected officials 33% 21% 29% 43% 32% 35%
Sporadic/as-required inclusion in community planning efforts 30% 40% 25% 39% 32% 25%
Inclusion in senior management meetings 26% 14% 26% 43% 21% 28%

P a g e | 12
How are local economic development activities supported by your local
government (in the form of dedicated funding and/or inclusion in
planning)? Please select all that apply.
2016
Percent AKBLG AVICC LMLGA NCLGA SILGA
Don’t know 12% 17% 15% 2% 11% 9%
Other 7% 17% 8% 3% 3% 4%
2016 n=369
How much influence does local economic development work have on
your community’s planning and direction?
2016
Percent EDPs
Elected
Officials
Local
Gov
Staff
Small Mid-
sized Large
Strong influence 22% 26% 25% 24% 19% 29% 20%
Moderate influence 38% 53% 36% 37% 38% 34% 44%
Limited influence 28% 19% 29% 28% 31% 28% 26%
No influence 7% 1% 6% 7% 9% 6% 4%
Don’t know 4% 1% 4% 4% 3% 4% 6%
2016 n=363
How much influence does local economic development work have on
your community’s planning and direction?
2016
Percent AKBLG AVICC LMLGA NCLGA SILGA
Strong influence 22% 10% 22% 23% 19% 32%
Moderate influence 38% 33% 34% 54% 41% 31%
Limited influence 28% 40% 29% 18% 31% 28%
No influence 7% 14% 6% 3% 7% 4%
Don’t know 4% 2% 8% 2% 3% 5%
2016 n=363

P a g e | 13
Is there an expectation that your local
government’s economic development
expenditures will increase, decrease or remain
the same in the next three to five years?
2016
Percent EDPs
Elected
Officials
Local Gov
Staff Small Mid-sized Large
2009
Percent
Increase 35% 32% 48% 36% 38% 32% 37% 39%
Remain the same 45% 59% 38% 48% 44% 46% 44% 58%
Decrease 4% 3% 2% 5% 3% 7% 3% 3%
2016 n=359; 2009 n=119; there was not a “don’t know” option available in 2009, and thus 2016 responses do not sum to 100%.
Is there an expectation that your local
government’s economic development
expenditures will increase, decrease or remain
the same in the next three to five years?
2016
Percent AKBLG AVICC LMLGA NCLGA SILGA
Increase 35% 29% 41% 37% 23% 43%
Remain the same 45% 45% 34% 53% 60% 38%
Decrease 4% 7% 7% 2% 5% 4%
2016 n=359; 2016 responses do not sum to 100% as “do not know” was an option.

P a g e | 14
Planning, Measurement and Reporting
Does your local government/organization have an economic
development plan or strategy?
2016
Percent EDPs
Elected
Officials
Local
Gov
Staff
Small Mid-
sized Large
2009
Percent
Yes, we currently have and actively use an economic development strategy 38% 62% 31% 35% 23% 40% 51% --
Yes, we currently have an economic development strategy but don’t actively
use it 14% 10% 15% 16% 18% 13% 12%
--
YES 52% 72% 46% 51% 41% 53% 63% 53%
No, a strategy has been created in the past but it is not current 18% 19% 15% 16% 17% 17% 21% --
No, economic development work is done on an as-needed/requested basis 21% 6% 32% 27% 33% 21% 8% --
NO 39% 25% 47% 43% 50% 38% 29% 45%
Don’t know/Not applicable 9% 3% 8% 7% 9% 9% 8% 3%
2016 n=355; 2009 n=121
Does your local government/organization have an economic
development plan or strategy?
2016
Percent AKBLG AVICC LMLGA NCLGA SILGA
Yes, we currently have and actively use an economic development strategy 38% 12% 28% 56% 35% 46%
Yes, we currently have an economic development strategy but don’t actively
use it 14% 14% 15% 12% 18% 13%
YES 52% 26% 43% 68% 53% 59%
No, a strategy has been created in the past but it is not current 18% 19% 21% 16% 25% 14%
No, economic development work is done on an as-needed/requested basis 21% 48% 21% 11% 16% 25%
NO 39% 67% 42% 27% 41% 39%
Don’t know/Not applicable 9% 7% 14% 5% 7% 3%
2016 n=355

P a g e | 15
How often is the plan updated? 2016
Percent EDPs
Elected
Officials
Local
Gov
Staff
Small Mid-
sized Large
2009
Percent
More than once a year 3% 2% 6% 0% 4% 3% 3% --
Annually 43% 43% 49% 26% 30% 51% 46% 23%
Every 2-4 years 26% 41% 22% 24% 28% 27% 26% 23%
Less often than every four years 9% 8% 8% 18% 8% 2% 16% 7%
Only when the need arises 11% 4% 14% 21% 20% 11% 4% 32%
Don’t know 8% 2% 2% 11% 10% 6% 6% 12%
2016 n=185; 2009 n=75
How often is the plan updated? 2016
Percent AKBLG AVICC LMLGA NCLGA SILGA
More than once a year 3% 9% 5% 0% 3% 4%
Annually 43% 55% 46% 28% 30% 58%
Every 2-4 years 26% 9% 22% 36% 30% 27%
Less often than every four years 9% 9% 11% 18% 7% 2%
Only when the need arises 11% 9% 5% 13% 23% 6%
Don’t know 8% 9% 11% 5% 7% 2%
2016 n=185
What stakeholder groups were involved in the process of
developing your economic development plan? Please select all that
apply.
2016
Percent EDPs
Elected
Officials
Local
Gov
Staff
Small Mid-
sized Large
2009
Percent
Local elected leaders 80% 84% 84% 79% 76% 90% 76% --
Members of the business community 72% 78% 70% 71% 68% 71% 77% 73%
Local government staff 70% 67% 64% 79% 60% 77% 71% --
Local Chamber of Commerce 62% 69% 66% 55% 50% 71% 64% 61%
Community groups or non-profit societies 56% 69% 50% 55% 60% 60% 53% 51%
General members of the public 45% 49% 46% 53% 60% 47% 34% 42%
Neighbouring First Nations 38% 63% 32% 24% 32% 48% 36% 31%
Youth 18% 29% 14% 16% 22% 21% 13% --

P a g e | 16
What stakeholder groups were involved in the process of
developing your economic development plan? Please select all that
apply.
2016
Percent EDPs
Elected
Officials
Local
Gov
Staff
Small Mid-
sized Large
2009
Percent
Other 10% 12% 12% 5% 14% 6% 11% 33%
Non-resident property owners 5% 6% 6% 8% 8% 5% 4% --
None of the above 1% 0% 2% 0% 2% 0% 1% 11%
2016 n=185; 2009 n=85
What stakeholder groups were involved in the process of
developing your economic development plan? Please select all that
apply.
2016
Percent AKBLG AVICC LMLGA NCLGA SILGA
Local elected leaders 80% 82% 84% 79% 83% 81%
Members of the business community 72% 64% 73% 82% 57% 72%
Local government staff 70% 64% 70% 74% 67% 70%
Local Chamber of Commerce 62% 73% 59% 72% 47% 70%
Community groups or non-profit societies 56% 36% 65% 56% 43% 68%
General members of the public 45% 36% 46% 41% 47% 51%
Neighbouring First Nations 38% 9% 41% 28% 37% 57%
Youth 18% 0% 24% 18% 7% 23%
Other 10% 9% 8% 8% 7% 13%
Non-resident property owners 5% 0% 3% 8% 10% 4%
None of the above 1% 0% 0% 0% 0% 4%
2016 n=185
In your opinion, how effective has the economic development plan
been at fostering economic development in your community?
2016
Percent EDPs
Elected
Officials
Local
Gov
Staff
Small Mid-
sized Large
2009
Percent
Very effective 23% 31% 19% 18% 11% 20% 32% 16%
Somewhat effective 53% 63% 46% 50% 49% 54% 55% 39%
Effective 75% 94% 65% 68% 60% 74% 87% 55%
Not too effective 17% 6% 31% 18% 28% 17% 10% 6%
Not effective at all 5% 0% 4% 3% 6% 7% 0% 6%

P a g e | 17
In your opinion, how effective has the economic development plan
been at fostering economic development in your community?
2016
Percent EDPs
Elected
Officials
Local
Gov
Staff
Small Mid-
sized Large
2009
Percent
Not effective 22% 6% 35% 21% 34% 24% 10% 12%
Don’t know/Not applicable 3% 0% 0% 12% 6% 2% 3% 32%
2016 n=177; 2009 n=94
In your opinion, how effective has the economic development plan
been at fostering economic development in your community?
2016
Percent AKBLG AVICC LMLGA NCLGA SILGA
Very effective 23% 10% 15% 29% 7% 28%
Somewhat effective 53% 50% 50% 58% 55% 52%
Effective 76% 60% 65% 87% 62% 80%
Not too effective 17% 30% 24% 13% 21% 15%
Not effective at all 5% 0% 6% 0% 7% 4%
Not effective 22% 30% 30% 13% 28% 19%
Don’t know/Not applicable 3% 10% 6% 0% 10% 0%
2016 n=177
Do you have a specific performance measurement or monitoring
strategy in place to track your economic development activities?
2016
Percent EDPs
Elected
Officials
Local
Gov
Staff
Small Mid-
sized Large
Yes, we have a performance measurement strategy in place and
regularly collect information and report out 16% 29% 12% 10% 8% 17% 23%
Yes, we have a performance measurement strategy in place, though we
do not have a regular schedule for information collection and reporting 16% 24% 15% 11% 8% 16% 23%
No, we do not have a specific strategy but provide information as
needed 32% 32% 38% 35% 37% 32% 28%
No, we do not have a specific strategy and are not asked to provide
performance-related information for our economic development
activities
20% 3% 21% 32% 28% 18% 10%
Other (please specify) 6% 9% 5% 7% 9% 5% 4%
Don’t know 10% 3% 8% 6% 9% 12% 10%
2016 n=344

P a g e | 18
Do you have a specific performance measurement or monitoring
strategy in place to track your economic development activities?
2016
Percent
AKBLG AVICC LMLGA NCLGA SILGA
Yes, we have a performance measurement strategy in place and
regularly collect information and report out 16% 7% 15% 18% 11% 19%
Yes, we have a performance measurement strategy in place, though we
do not have a regular schedule for information collection and reporting 16% 10% 8% 31% 16% 21%
No, we do not have a specific strategy but provide information as
needed 32% 32% 41% 29% 30% 29%
No, we do not have a specific strategy and are not asked to provide
performance-related information for our economic development
activities
20% 39% 19% 11% 20% 21%
Other (please specify) 6% 7% 5% 4% 11% 4%
Don’t know 10% 5% 13% 7% 13% 6%
2016 n=344
Is the overall budget allocation for economic development
activities linked to reporting/performance measurement, either
formally or informally?
2016
Percent EDPs
Elected
Officials
Local
Gov
Staff
Small Mid-
sized Large
Yes, formally 12% 21% 8% 13% 8% 18% 10%
Yes, informally 21% 30% 24% 13% 21% 20% 23%
No 54% 42% 61% 69% 62% 50% 52%
Don’t know 13% 7% 8% 6% 10% 12% 14%
2016 n=339
Is the overall budget allocation for economic development
activities linked to reporting/performance measurement, either
formally or informally?
2016
Percent AKBLG AVICC LMLGA NCLGA SILGA
Yes, formally 12% 12% 6% 11% 11% 18%
Yes, informally 21% 15% 25% 17% 22% 19%
No 54% 66% 57% 63% 51% 53%
Don’t know 13% 7% 12% 9% 16% 10%
2016 n=339

P a g e | 19
How often are local economic development efforts reported on
(regardless of whether there is a monitoring plan in place)?
2016
Percent EDPs
Elected
Officials
Local
Gov
Staff
Small Mid-
sized Large
Ad hoc/as requested 21% 9% 30% 32% 32% 17% 14%
Quarterly 19% 25% 20% 16% 11% 22% 24%
Monthly 18% 33% 15% 14% 21% 19% 15%
Annually 16% 19% 13% 16% 14% 14% 19%
Don't know 10% 3% 4% 4% 6% 12% 12%
Never 6% 0% 4% 12% 9% 4% 4%
Semi-annually 6% 7% 9% 1% 3% 5% 10%
Less than once per year 3% 0% 6% 3% 3% 4% 2%
Weekly 1% 3% 0% 1% 0% 3% 1%
2016 n=336
How often are local economic development efforts reported on
(regardless of whether there is a monitoring plan in place)?
2016
Percent AKBLG AVICC LMLGA NCLGA SILGA
Ad hoc/as requested 21% 24% 18% 19% 25% 23%
Quarterly 19% 5% 16% 25% 31% 19%
Monthly 18% 12% 12% 25% 15% 23%
Annually 16% 12% 16% 17% 11% 22%
Don't know 10% 12% 17% 6% 5% 1%
Never 6% 24% 9% 2% 0% 1%
Semi-annually 6% 5% 8% 8% 5% 5%
Less than once per year 3% 5% 5% 0% 5% 1%
Weekly 1% 0% 0% 0% 2% 3%
2016 n=336

P a g e | 20
What form(s) does reporting on your economic development
efforts take? Please select all that apply.
2016
Percent EDPs
Elected
Officials
Local
Gov
Staff
Small Mid-
sized Large
Formal reports 57% 75% 59% 64% 49% 60% 63%
Website for municipality/region 25% 34% 27% 30% 20% 30% 27%
Public events 24% 33% 22% 23% 24% 24% 22%
Social media 23% 39% 19% 25% 14% 28% 27%
Website for economic development organization 21% 36% 14% 14% 8% 25% 30%
e-newsletters 17% 30% 15% 16% 9% 14% 30%
Other 17% 22% 15% 17% 21% 14% 17%
Printed newsletters 12% 16% 12% 13% 15% 13% 8%
2016 n=336
What form(s) does reporting on your economic development
efforts take? Please select all that apply.
2016
Percent AKBLG AVICC LMLGA NCLGA SILGA
Formal reports 57% 41% 39% 70% 71% 68%
Website for municipality/region 25% 7% 22% 32% 35% 31%
Public events 24% 12% 19% 23% 29% 32%
Social media 23% 12% 16% 34% 25% 30%
Website for economic development organization 21% 10% 17% 28% 24% 19%
e-newsletters 17% 10% 17% 30% 7% 21%
Other 17% 20% 17% 15% 18% 17%
Printed newsletters 12% 2% 10% 9% 18% 16%
2016 n=336

P a g e | 21
Priorities and Activities
What are the top three priorities that represent the focus of your local
government’s economic development efforts?
2016
Percent EDPs
Elected
Officials
Local
Gov
Staff
Small Mid-
sized Large
2009
Percent
Local business retention and expansion 65% 67% 67% 65% 66% 60% 71% 70%
Tourism and cultural activities (e.g., local attractions, events,
arts/culture/heritage)
48% 30% 55% 50% 62% 52% 27% --
Attracting external industry, businesses and resources 41% 50% 42% 41% 34% 43% 47% 57%
Fostering new enterprises/entrepreneurial development 25% 35% 22% 20% 24% 24% 28% 27%
Investment in hard strategic infrastructure (e.g., public works, utilities,
telecommunications)
21% 17% 24% 29% 26% 27% 12% 40%
Resident attraction 21% 15% 27% 18% 30% 20% 13% --
Sector/business cluster development (including resource sectors) 21% 35% 16% 20% 8% 20% 37% 29%
Workforce development 14% 23% 8% 9% 12% 11% 18% --
Investment in soft infrastructure (e.g., education, health, recreation) 11% 12% 14% 8% 13% 12% 8% 18%
Area targeting/regeneration strategies (e.g., revitalization programs, stimulus
programs)
11% 9% 10% 12% 7% 13% 14% 23%
Other 10% 6% 6% 14% 5% 8% 16% 10%
2016 n=332; 2009 n=113
What are the top three priorities that represent the focus of your local
government’s economic development efforts?
2016
Percent AKBLG AVICC LMLGA NCLGA SILGA
Local business retention and expansion 65% 61% 56% 80% 67% 70%
Tourism and cultural activities (e.g., local attractions, events,
arts/culture/heritage)
48% 54% 56% 29% 37% 59%
Attracting external industry, businesses and resources 41% 34% 35% 53% 44% 36%
Fostering new enterprises/entrepreneurial development 25% 27% 32% 29% 20% 19%
Investment in hard strategic infrastructure (e.g., public works, utilities,
telecommunications)
21% 29% 19% 14% 28% 26%
Resident attraction 21% 24% 21% 4% 22% 26%

P a g e | 22
What are the top three priorities that represent the focus of your local
government’s economic development efforts?
2016
Percent AKBLG AVICC LMLGA NCLGA SILGA
Sector/business cluster development (including resource sectors) 21% 12% 19% 45% 15% 14%
Workforce development 14% 17% 11% 16% 6% 18%
Investment in soft infrastructure (e.g., education, health, recreation) 11% 7% 7% 4% 28% 11%
Area targeting/regeneration strategies (e.g., revitalization programs, stimulus
programs)
11% 10% 11% 8% 17% 8%
Other 10% 10% 18% 10% 7% 5%
2016 n=332
Which of the following business retention, expansion and attraction
activities does your community engage in?
2016
Percent EDPs
Elected
Officials
Local
Gov
Staff
Small Mid-
sized Large
2009
Percent
Community profile 70% 86% 67% 70% 63% 74% 77% 68%
Developed website including promo material/community profile 64% 83% 57% 63% 54% 69% 73% 72%
Personal contact with existing businesses 56% 78% 51% 45% 46% 57% 67% 52%
Business Walks program 45% 60% 47% 34% 40% 50% 45% --
Promotional brochure 44% 62% 40% 39% 36% 48% 52% 39%
Promotion of “Buy Local” events 44% 45% 47% 44% 46% 43% 43% 19%
Marketing strategy 43% 58% 42% 38% 32% 42% 57% 40%
Downtown business improvement program or similar 41% 38% 51% 31% 33% 37% 56% 37%
Survey of local businesses 41% 52% 40% 25% 24% 46% 52% 22%
Business recognition events 33% 38% 28% 34% 21% 34% 47% 25%
Business roundtables or similar forum 32% 48% 30% 28% 14% 39% 45% 32%
“One stop shop” for business/development opportunities 29% 55% 19% 27% 11% 28% 49% 35%
Industry specific trade shows 28% 49% 21% 25% 16% 29% 43% 30%
Database of available commercial and industrial land 27% 40% 22% 28% 15% 33% 35% 37%
Business development support (e.g., incubation, co-working spaces) 17% 25% 15% 14% 11% 13% 30% 15%
Export development assistance 12% 37% 4% 2% 1% 8% 31% 8%
Not applicable/Don't know 5% 2% 3% 13% 4% 6% 4% --
Other 6% 3% 5% 5% 5% 6% 5% 28%
2016 n=318; 2009 n=111

P a g e | 23
Which of the following business retention, expansion and attraction
activities does your community engage in?
2016
Percent AKBLG AVICC LMLGA NCLGA SILGA
Community profile 70% 56% 64% 77% 81% 74%
Developed website including promo material/community profile 64% 51% 50% 70% 69% 74%
Personal contact with existing businesses 56% 44% 38% 77% 57% 67%
Business Walks program 45% 34% 24% 47% 61% 60%
Promotional brochure 44% 34% 29% 51% 54% 53%
Promotion of “Buy Local” events 44% 39% 35% 49% 61% 45%
Marketing strategy 43% 34% 29% 60% 41% 52%
Downtown business improvement program or similar 41% 24% 38% 55% 54% 34%
Survey of local businesses 41% 27% 25% 51% 35% 49%
Business recognition events 33% 27% 24% 53% 31% 33%
Business roundtables or similar forum 32% 20% 22% 60% 30% 36%
“One stop shop” for business/development opportunities 29% 22% 17% 55% 19% 36%
Industry specific trade shows 28% 15% 21% 40% 30% 36%
Database of available commercial and industrial land 27% 24% 17% 34% 31% 33%
Business development support (e.g., incubation, co-working spaces) 17% 12% 17% 30% 13% 15%
Export development assistance 12% 2% 8% 26% 7% 12%
Not applicable/Don't know 5% 7% 8% 0% 4% 4%
Other 6% 7% 6% 6% 6% 3%
2016 n=318
Is your local government involved in any regional economic
development partnerships?
2016
Percent EDPs
Elected
Officials
Local
Gov
Staff
Small Mid-
sized Large
2009
Percent
Yes 64% 67% 70% 63% 66% 73% 50% 70%
No 24% 30% 18% 27% 23% 17% 35% Unclear
Don’t know 12% 3% 12% 11% 12% 10% 15%
2016 n=315; 2009 n=83

P a g e | 24
Is your local government involved in any regional economic
development partnerships?
2016
Percent AKBLG AVICC LMLGA NCLGA SILGA
Yes 64% 61% 59% 43% 78% 77%
No 24% 34% 31% 41% 7% 15%
Don’t know 12% 5% 10% 15% 15% 8%
2016 n=315

P a g e | 25
Resources
Percent who agree (strongly agree or agree) to the following
statements:
2016
Percent EDPs
Elected
Officials
Local
Gov
Staff
Small Mid-
sized Large
I have access to sufficient information-based resources, training and
support for economic development work in my community. 58% 73% 60% 51% 48% 65% 62%
My community has the resources to develop and maintain economic
data for potential investors. 46% 61% 43% 39% 23% 52% 64%
Access to local and current demographic, labour market and education
statistics is important to economic development in my community. 86% 99% 86% 80% 79% 91% 90%
I would find additional information-based resources, training and
external support valuable for my community’s economic development
efforts.
85% 89% 84% 86% 80% 87% 90%
2016 n=313
Percent who agree (strongly agree or agree) to the following
statements:
2016
Percent AKBLG AVICC LMLGA NCLGA SILGA
I have access to sufficient information-based resources, training and
support for economic development work in my community. 58% 46% 56% 69% 62% 56%
My community has the resources to develop and maintain economic
data for potential investors. 46% 33% 35% 76% 45% 47%
Access to local and current demographic, labour market and education
statistics is important to economic development in my community. 86% 85% 82% 93% 83% 85%
I would find additional information-based resources, training and
external support valuable for my community’s economic development
efforts.
85% 78% 80% 91% 89% 86%
2016 n=313

P a g e | 26
Collaboration and Communication
Percent who agree (strongly agree or agree) to the following
statements:
2016
Percent EDPs
Elected
Officials
Local
Gov
Staff
Small Mid-
sized Large
2009
Percent
Champions within the community exist to see projects to completion 75% 86% 80% 56% 69% 75% 84% 70%
Community buy-in and engagement is sought 75% 95% 77% 59% 71% 75% 78% 78%
Political will and support exists among local elected officials for ED work 73% 81% 84% 72% 71% 77% 70% 81%
Sustainability is a consideration in ED plans/ projects 73% 92% 79% 59% 68% 78% 75% 78%
ED efforts attempt to foster innovation and entrepreneurship 71% 94% 71% 61% 62% 74% 78% 66%
There is an awareness of business interests and needs among staff and
local elected officials 68% 83% 71% 67% 70% 69% 66% 82%
Business leaders are involved in the process of economic development
efforts 65% 75% 69% 53% 57% 70% 70% 72%
Public-private partnerships are used where possible to deliver economic
development initiatives 57% 78% 59% 48% 46% 66% 58% 57%
First Nations are involved in regional economic development efforts 49% 57% 47% 45% 52% 49% 46% 58%
There is sufficient staff expertise to deliver ED initiatives 46% 73% 43% 44% 29% 50% 63% 45%
2016 n=308; 2009 n=116
Percent who agree (strongly agree or agree) to the following
statements:
2016
Percent AKBLG AVICC LMLGA NCLGA SILGA
Champions within the community exist to see projects to completion 75% 75% 75% 87% 72% 71%
Community buy-in and engagement is sought 75% 58% 73% 89% 74% 77%
Political will and support exists among local elected officials for ED work 73% 65% 65% 87% 79% 76%
Sustainability is a consideration in ED plans/ projects 73% 58% 73% 89% 75% 70%
ED efforts attempt to foster innovation and entrepreneurship 71% 65% 55% 93% 72% 76%
There is an awareness of business interests and needs among staff and
local elected officials 68% 68% 61% 84% 66% 71%
Business leaders are involved in the process of economic development
efforts 65% 65% 61% 84% 57% 69%

P a g e | 27
Percent who agree (strongly agree or agree) to the following
statements:
2016
Percent AKBLG AVICC LMLGA NCLGA SILGA
Public-private partnerships are used where possible to deliver economic
development initiatives 57% 60% 48% 64% 55% 60%
First Nations are involved in regional economic development efforts 49% 35% 54% 42% 51% 56%
There is sufficient staff expertise to deliver ED initiatives 46% 23% 27% 78% 53% 56%
2016 n=308

P a g e | 28
Economic Diversity
Do you consider your community to be reliant on a single resource or
industry for your economic activity?
2016
Percent EDPs
Elected
Officials
Local
Gov
Staff
Small Mid-
sized Large
Yes (please specify sector) 33% 30% 27% 38% 48% 35% 9%
No 64% 68% 69% 56% 49% 62% 87%
Don't know 3% 2% 3% 6% 3% 3% 4%
2016 n=308
Do you consider your community to be reliant on a single resource or
industry for your economic activity?
2016
Percent AKBLG AVICC LMLGA NCLGA SILGA
Yes (please specify sector) 33% 38% 39% 9% 49% 26%
No 64% 63% 55% 89% 47% 70%
Don't know 3% 0% 6% 2% 4% 4%
2016 n=308
To what degree would you say your community is
resilient to economic fluctuations?
2016
Percent EDPs
Elected
Officials
Local
Gov
Staff
Small Mid-
sized Large
Very resilient 14% 22% 16% 13% 5% 12% 27%
Moderately resilient 29% 41% 23% 28% 24% 31% 35%
Somewhat resilient 39% 22% 51% 36% 49% 38% 27%
Not at all resilient 15% 13% 10% 19% 19% 18% 7%
Don’t know 3% 2% 0% 5% 3% 0% 4%
2016 n=306
To what degree would you say your community is
resilient to economic fluctuations?
2016
Percent AKBLG AVICC LMLGA NCLGA SILGA
Very resilient 14% 3% 13% 36% 8% 14%
Moderately resilient 29% 43% 19% 36% 26% 29%

P a g e | 29
Somewhat resilient 39% 45% 48% 22% 49% 37%
Not at all resilient 15% 10% 19% 7% 15% 17%
Don’t know 3% 0% 1% 0% 2% 3%
2016 n=306

P a g e | 30
Challenges
From the list below, please identify the top two internal barriers
to economic development in your community.
2016
Percent EDPs
Elected
Officials
Local
Gov
Staff
Small Mid-
sized Large
2009
Percent
Lack of financial resources 52% 62% 51% 47% 61% 50% 45% 67%
Lack of human resources 46% 59% 41% 53% 52% 48% 39% 57%
Lack of leadership or priority given to economic development 34% 22% 36% 28% 32% 36% 33% 23%
Lack of formal economic development plans or mandate 28% 24% 27% 23% 25% 30% 29% 25%
Lack of information or expertise 17% 10% 14% 25% 13% 14% 24% 10%
Other 13% 19% 16% 14% 9% 14% 16% Unclear
2016 n=306; 2009 n=107
From the list below, please identify the top two internal barriers
to economic development in your community.
2016
Percent AKBLG AVICC LMLGA NCLGA SILGA
Lack of financial resources 52% 45% 45% 49% 47% 69%
Lack of human resources 46% 28% 51% 51% 49% 49%
Lack of leadership or priority given to economic development 34% 40% 39% 16% 32% 34%
Lack of formal economic development plans or mandate 28% 48% 26% 24% 32% 19%
Lack of information or expertise 17% 18% 22% 22% 15% 10%
Other 13% 15% 7% 20% 19% 9%
2016 n=306
From the list below, please identify the top two external barriers
to economic development in your community.
2016
Percent EDPs Elected
Officials
Local
Gov
Staff
Small Mid-
sized Large
2009
Percent
Lack of support (resources, funding or programs) external to local
government 55% 46% 54% 52% 63% 50% 51%
--
Global economic conditions 50% 48% 52% 56% 42% 58% 51% 60%
Other resource restructuring/downturn 29% 24% 28% 33% 32% 31% 21% 35%

P a g e | 31
Legislative restrictions or policy changes 23% 27% 24% 14% 21% 22% 27% 14%
Forest industry restructuring 19% 25% 16% 25% 24% 17% 17% 49%
Other 17% 24% 16% 17% 13% 16% 22% Unclear
2016 n=306; 2009 n=116
From the list below, please identify the top two external barriers
to economic development in your community.
2016
Percent AKBLG AVICC LMLGA NCLGA SILGA
Lack of support (resources, funding or programs) external to local
government 55% 63% 59% 42% 43% 60%
Global economic conditions 50% 63% 43% 53% 45% 56%
Other resource restructuring/downturn 29% 35% 20% 18% 45% 26%
Legislative restrictions or policy changes 23% 15% 20% 36% 19% 21%
Forest industry restructuring 19% 10% 29% 7% 38% 10%
Other 17% 10% 20% 33% 6% 19%
2016 n=306