Local Control Funding Formula (LCFF) & Local Control Accountability Plan (LCAP)
Local Control Funding Formula:
Evaluation Rubrics
State Board of Education, September 2015
Evaluation Rubrics
• LCFF legislation calls for evaluation rubrics: • To assist local education agencies to identify strengths,
weaknesses, and areas that require improvement
• To assist County Offices of Education to identify school districts and charter schools in need of technical assistance
• To assist the State Superintendent in identifying school districts for which intervention is warranted
• To reflect a holistic, multidimensional assessment of school district and individual school site performance and include all of the state priorities
• To include standards for school district and individual school site performance and expectation for improvement in regard to each of the state priorities
Evaluation Rubric Development Updates
Directions based on State Board of Education (SBE)
feedback
Draw from research and California data analysis to inform design
Incorporate practice descriptions
Ensure connection to resource alignment
Develop recommendations for the SBE to consider consistent
with its policy making responsibilities
2015-16 Education Omnibus Bill (Assembly Bill 104) includes
one year extension to evaluation rubric timeline – now due
October 2016
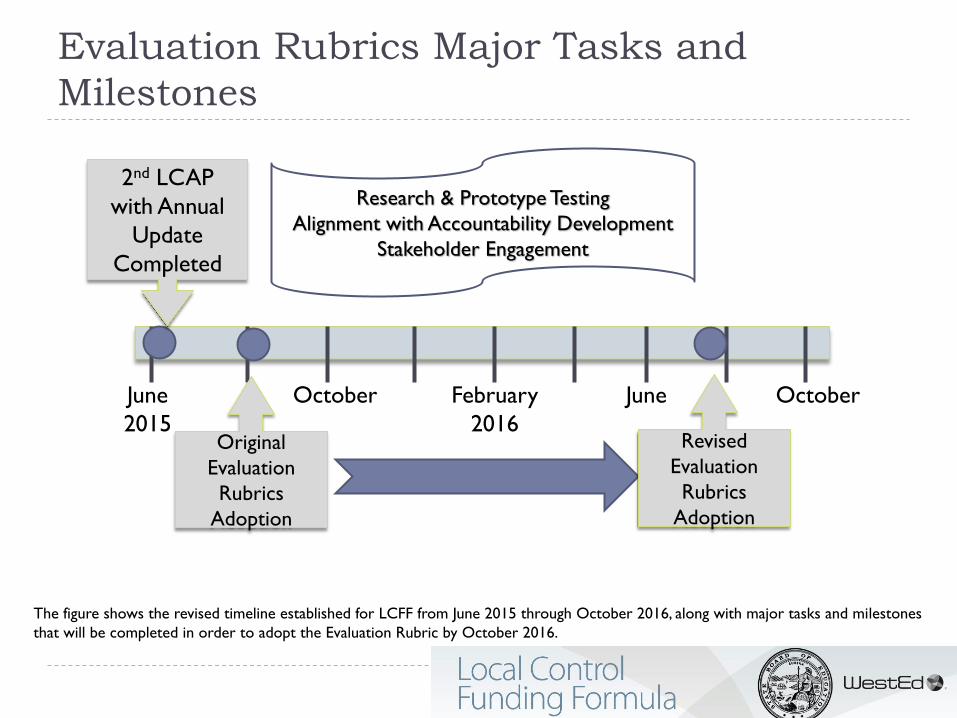
Evaluation Rubrics Major Tasks and
Milestones
June
2015
February
2016
October June October
2nd LCAP
with Annual
Update
Completed
Original
Evaluation
Rubrics
Adoption
Revised
Evaluation
Rubrics
Adoption
Research & Prototype Testing
Alignment with Accountability Development
Stakeholder Engagement
The figure shows the revised timeline established for LCFF from June 2015 through October 2016, along with major tasks and milestones
that will be completed in order to adopt the Evaluation Rubric by October 2016.
State Board of Education Policy Statements
All students are provided with access and opportunities
that support learning
All students are college and career ready, exhibiting early
and continuing signs of college and career readiness
All students graduate from high school
Evaluation Rubric Features
The evaluation rubric will:
Include all state priorities
Include data and information related to local educational agencies,
schools, and subgroups as appropriate and to the extent practical
Offer clear statements and descriptors of standards that indicate
practice and expectations for local educational agencies, schools, and
subgroups as appropriate and to the extent practical
Provide a tool to complement planning and process monitoring and
technical assistance processes
Support analysis and feedback by facilitating deeper reflections of
data through customized narratives based on consideration of data
trends and relationships
Further develop the emerging accountability system by serving as a
resource for data analysis, reflection, and resource alignment inquiry
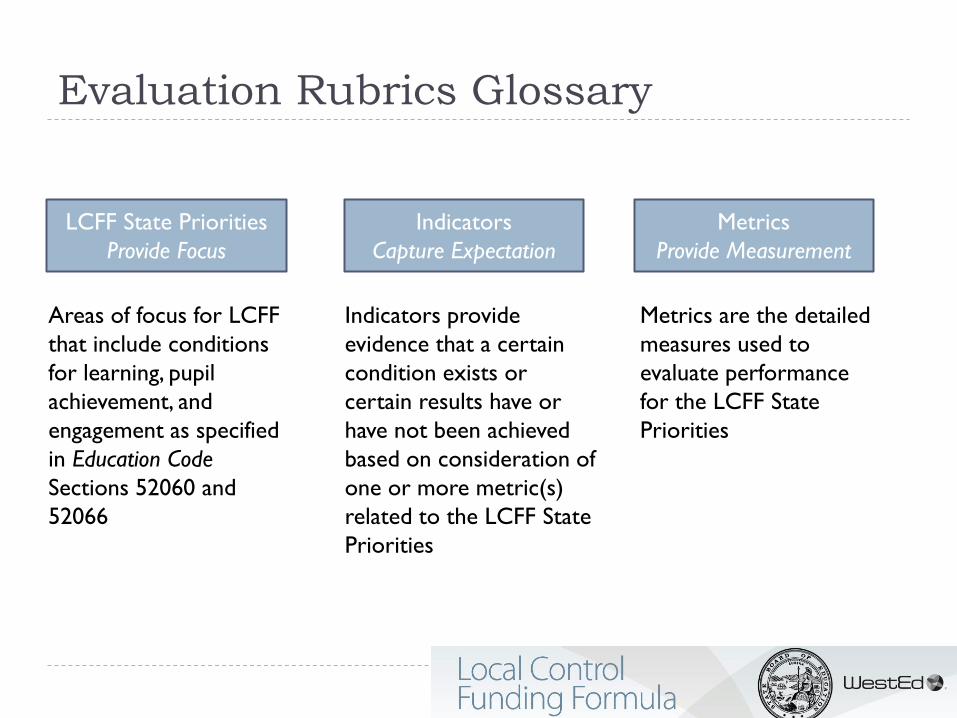
Evaluation Rubrics Glossary
LCFF State Priorities
Provide Focus
Areas of focus for LCFF
that include conditions
for learning, pupil
achievement, and
engagement as specified
in Education Code
Sections 52060 and
52066
Indicators
Capture Expectation
Indicators provide
evidence that a certain
condition exists or
certain results have or
have not been achieved
based on consideration of
one or more metric(s)
related to the LCFF State
Priorities
Metrics
Provide Measurement
Metrics are the detailed
measures used to
evaluate performance
for the LCFF State
Priorities
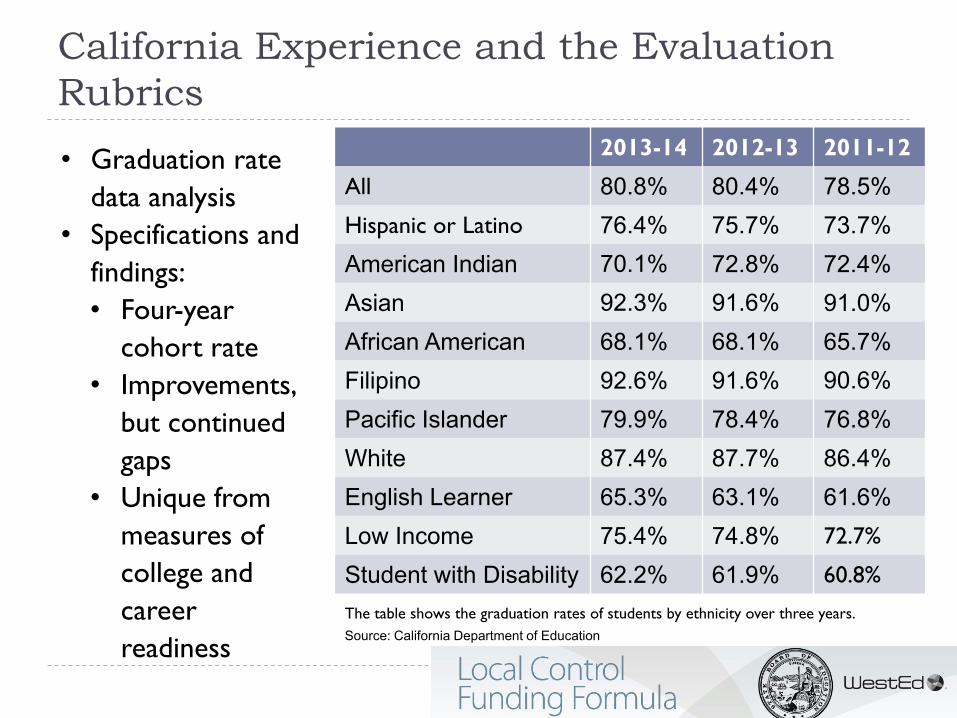
California Experience and the Evaluation
Rubrics
• Graduation rate
data analysis
• Specifications and
findings:
• Four-year
cohort rate
• Improvements,
but continued
gaps
• Unique from
measures of
college and
career
readiness
2013-14 2012-13 2011-12
All 80.8% 80.4% 78.5% Hispanic or Latino
American Indian 76.4% 70.1%
75.7% 72.8%
73.7% 72.4%
Asian 92.3% 91.6% 91.0% African American 68.1% 68.1% 65.7% Filipino Pacific Islander
92.6% 79.9%
91.6% 78.4%
90.6%
76.8% White 87.4% 87.7% 86.4% English Learner Low Income
65.3% 75.4%
63.1% 74.8%
61.6% 72.7%
Student with Disability 62.2% 61.9% 60.8%
The table shows the graduation rates of students by ethnicity over three years.
Source: California Department of Education
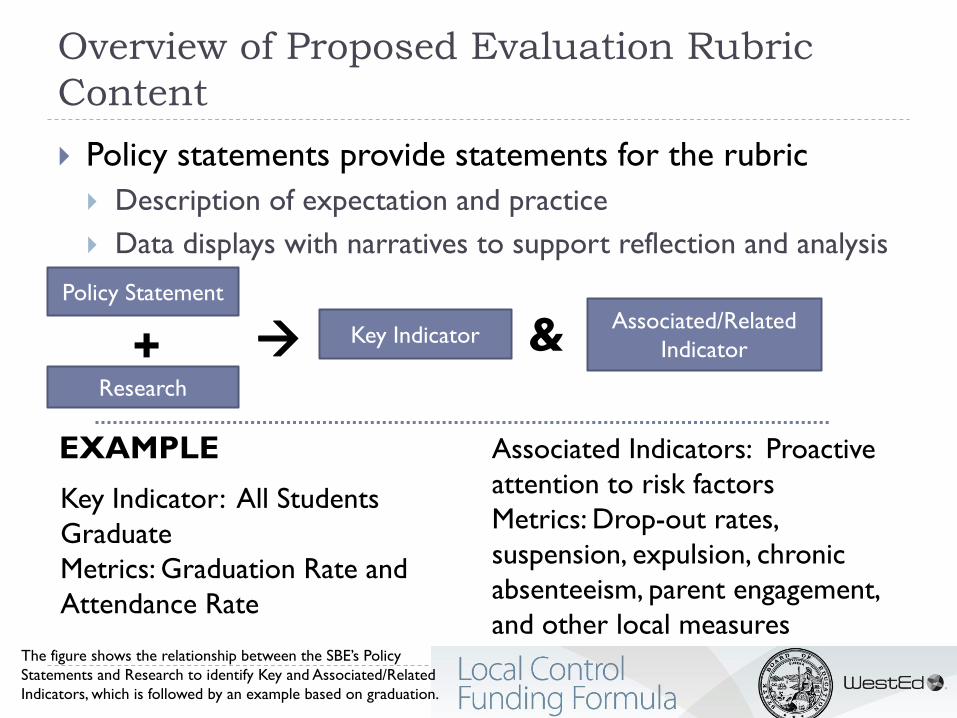
Overview of Proposed Evaluation Rubric
Content
Policy statements provide statements for the rubric
Description of expectation and practice
Data displays with narratives to support reflection and analysis
Policy Statement
Key Indicator Associated/Related
Indicator
Research
+ &
EXAMPLE
Key Indicator: All Students
Graduate
Metrics: Graduation Rate and
Attendance Rate
Associated Indicators: Proactive
attention to risk factors
Metrics: Drop-out rates,
suspension, expulsion, chronic
absenteeism, parent engagement,
and other local measures The figure shows the relationship between the SBE’s Policy
Statements and Research to identify Key and Associated/Related
Indicators, which is followed by an example based on graduation.
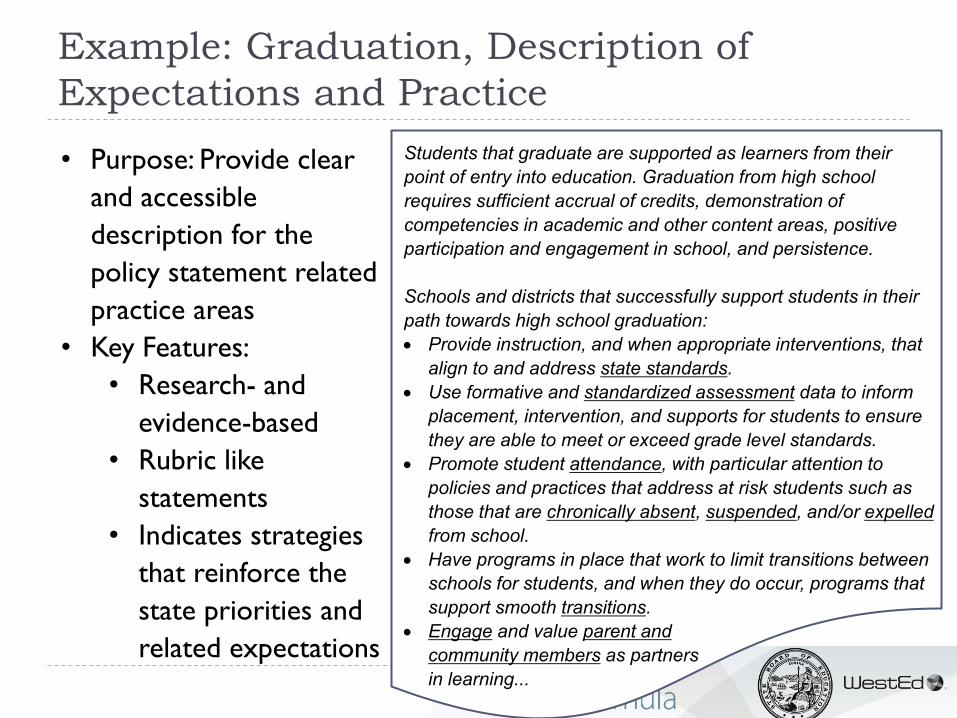
Example: Graduation, Description of
Expectations and Practice
• Purpose: Provide clear
and accessible
description for the
policy statement related
practice areas
• Key Features:
• Research- and
evidence-based
• Rubric like
statements
• Indicates strategies
that reinforce the
state priorities and
related expectations
Students that graduate are supported as learners from their point of entry into education. Graduation from high school requires sufficient accrual of credits, demonstration of competencies in academic and other content areas, positive participation and engagement in school, and persistence. Schools and districts that successfully support students in their path towards high school graduation: Provide instruction, and when appropriate interventions, that
align to and address state standards. Use formative and standardized assessment data to inform
placement, intervention, and supports for students to ensure they are able to meet or exceed grade level standards.
Promote student attendance, with particular attention to policies and practices that address at risk students such as those that are chronically absent, suspended, and/or expelledfrom school.
Have programs in place that work to limit transitions between schools for students, and when they do occur, programs that support smooth transitions.
Engage and value parent and community members as partners in learning...
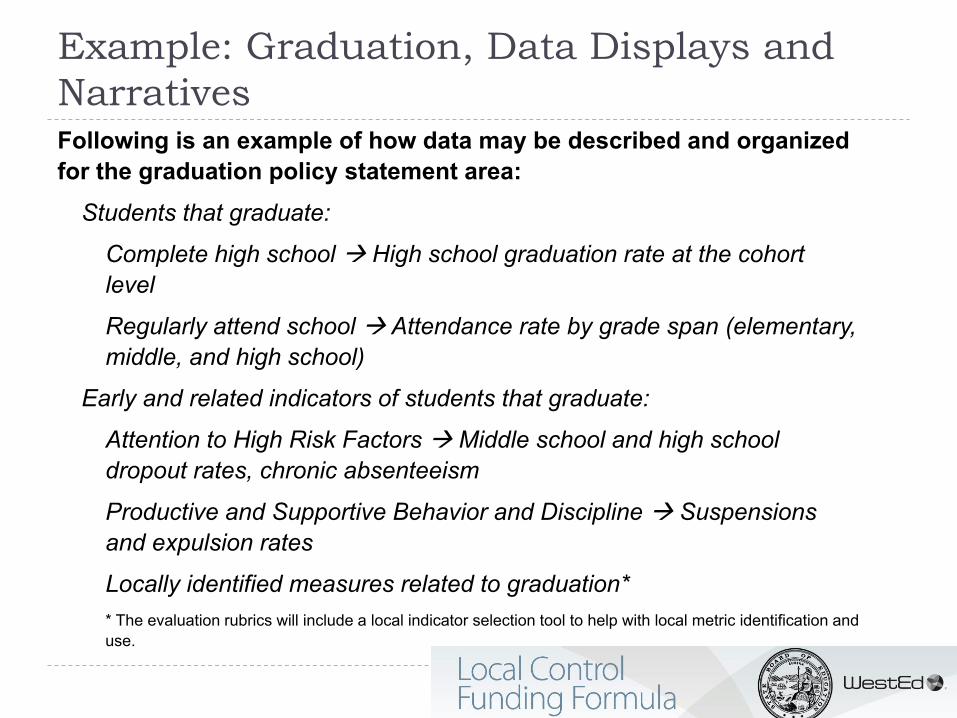
Example: Graduation, Data Displays and
Narratives Following is an example of how data may be described and organized for the graduation policy statement area:
Students that graduate:
Complete high school High school graduation rate at the cohort level
Regularly attend school Attendance rate by grade span (elementary, middle, and high school)
Early and related indicators of students that graduate:
Attention to High Risk Factors Middle school and high school dropout rates, chronic absenteeism
Productive and Supportive Behavior and Discipline Suspensions and expulsion rates
Locally identified measures related to graduation* * The evaluation rubrics will include a local indicator selection tool to help with local metric identification and use.
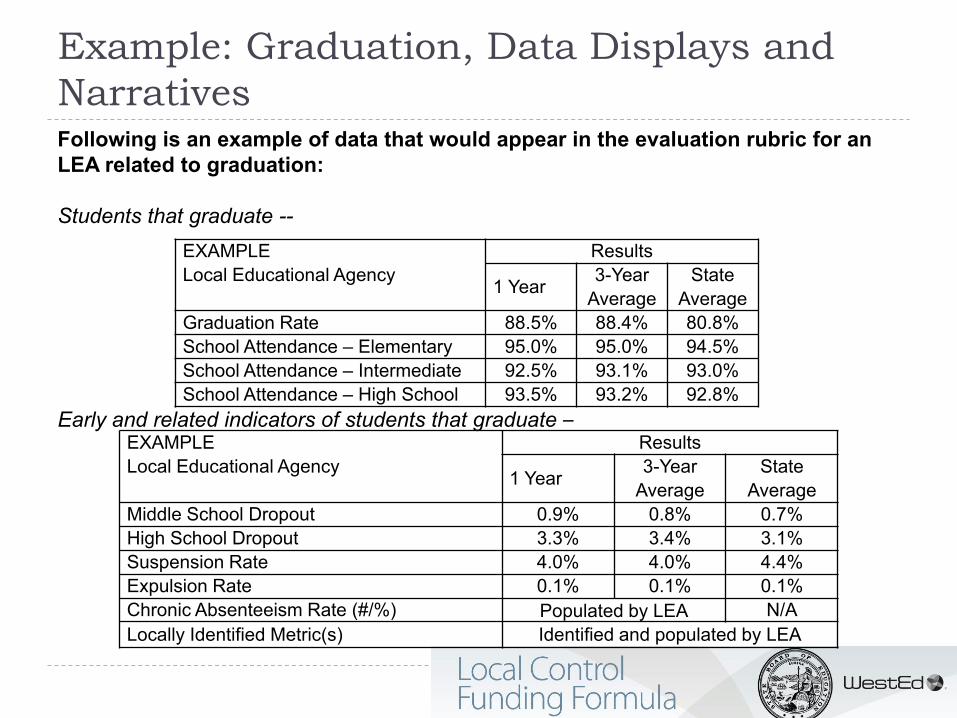
Example: Graduation, Data Displays and
Narratives Following is an example of data that would appear in the evaluation rubric for an LEA related to graduation:
Students that graduate --EXAMPLE Results
Local Educational Agency 1 Year 3-Year Average
State Average
Graduation Rate 88.5% 88.4% 80.8%
School Attendance – Elementary 95.0% 95.0% 94.5%
School Attendance – Intermediate 92.5% 93.1% 93.0%
School Attendance – High School 93.5% 93.2% 92.8%
Early and related indicators of students that graduate – EXAMPLE Results
Local Educational Agency 1 Year 3-Year Average
State Average
Middle School Dropout 0.9% 0.8% 0.7%
High School Dropout 3.3% 3.4% 3.1%
Suspension Rate 4.0% 4.0% 4.4%
Expulsion Rate 0.1% 0.1% 0.1%
Chronic Absenteeism Rate (#/%) Populated by LEA N/A Locally Identified Metric(s) Identified and populated by LEA
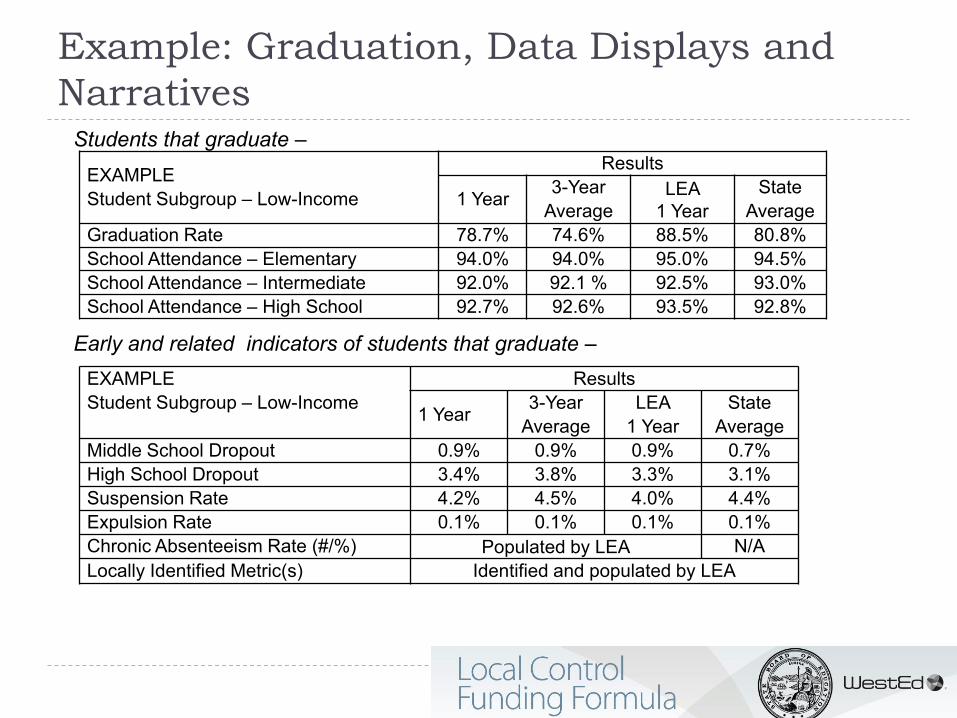
Example: Graduation, Data Displays and
Narratives Students that graduate –
EXAMPLE Student Subgroup – Low-Income
Results
1 Year 3-Year Average
LEA 1 Year
State Average
Graduation Rate 78.7% 74.6% 88.5% 80.8%
School Attendance – Elementary 94.0% 94.0% 95.0% 94.5%
School Attendance – Intermediate 92.0% 92.1 % 92.5% 93.0%
School Attendance – High School 92.7% 92.6% 93.5% 92.8% Early and related indicators of students that graduate –
EXAMPLE Student Subgroup – Low-Income
Results
1 Year 3-Year Average
LEA 1 Year
State Average
Middle School Dropout 0.9% 0.9% 0.9% 0.7%
High School Dropout 3.4% 3.8% 3.3% 3.1%
Suspension Rate 4.2% 4.5% 4.0% 4.4%
Expulsion Rate 0.1% 0.1% 0.1% 0.1%
Chronic Absenteeism Rate (#/%) Populated by LEA N/A Locally Identified Metric(s) Identified and populated by LEA
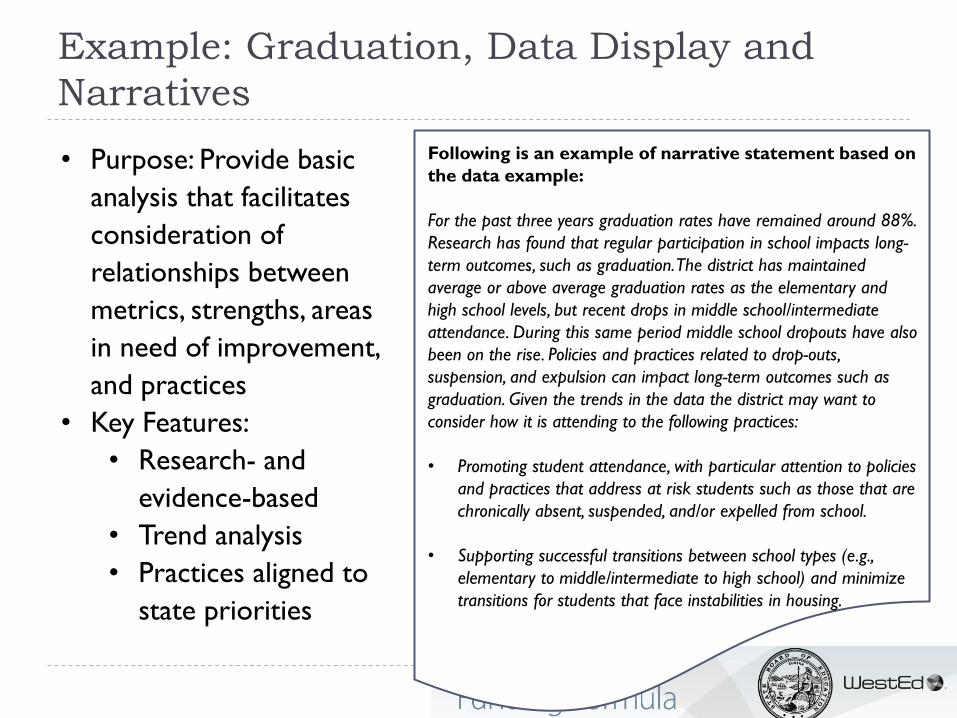
Example: Graduation, Data Display and
Narratives
• Purpose: Provide basic
analysis that facilitates
consideration of
relationships between
metrics, strengths, areas
in need of improvement,
and practices
• Key Features:
• Research- and
evidence-based
• Trend analysis
• Practices aligned to
state priorities
Following is an example of narrative statement based on
the data example:
For the past three years graduation rates have remained around 88%.
Research has found that regular participation in school impacts long-
term outcomes, such as graduation. The district has maintained
average or above average graduation rates as the elementary and
high school levels, but recent drops in middle school/intermediate
attendance. During this same period middle school dropouts have also
been on the rise. Policies and practices related to drop-outs,
suspension, and expulsion can impact long-term outcomes such as
graduation. Given the trends in the data the district may want to
consider how it is attending to the following practices:
• Promoting student attendance, with particular attention to policies
and practices that address at risk students such as those that are
chronically absent, suspended, and/or expelled from school.
• Supporting successful transitions between school types (e.g.,
elementary to middle/intermediate to high school) and minimize
transitions for students that face instabilities in housing.
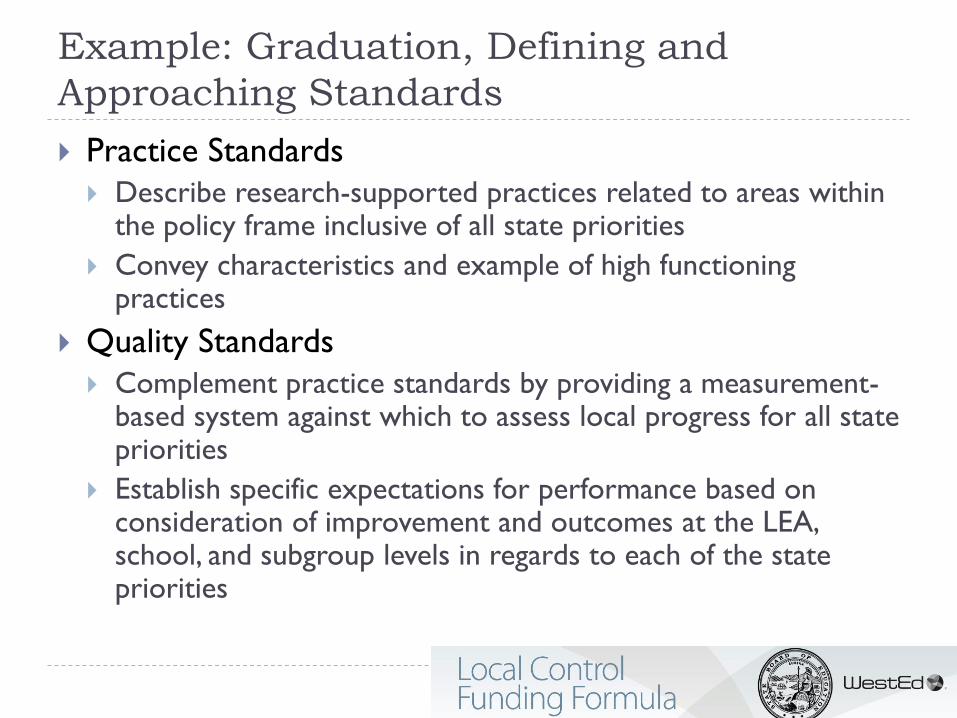
Example: Graduation, Defining and
Approaching Standards
Practice Standards
Describe research-supported practices related to areas within the policy frame inclusive of all state priorities
Convey characteristics and example of high functioning practices
Quality Standards
Complement practice standards by providing a measurement-based system against which to assess local progress for all state priorities
Establish specific expectations for performance based on consideration of improvement and outcomes at the LEA, school, and subgroup levels in regards to each of the state priorities
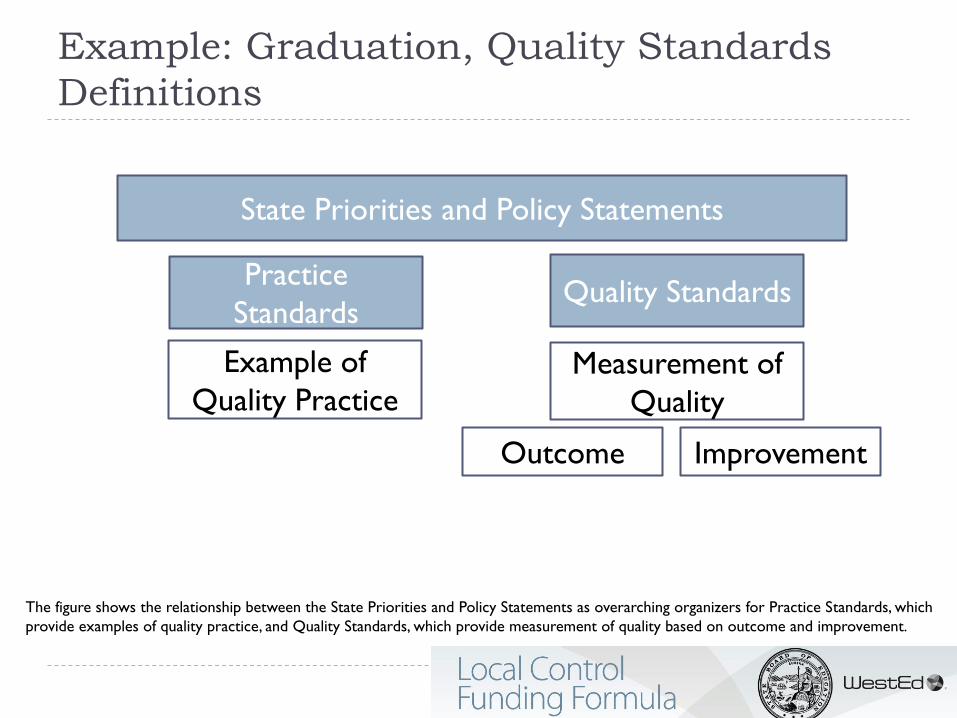
Example: Graduation, Quality Standards
Definitions
Practice
Standards Quality Standards
State Priorities and Policy Statements
Example of
Quality Practice
Measurement of
Quality
Outcome Improvement
The figure shows the relationship between the State Priorities and Policy Statements as overarching organizers for Practice Standards, which
provide examples of quality practice, and Quality Standards, which provide measurement of quality based on outcome and improvement.
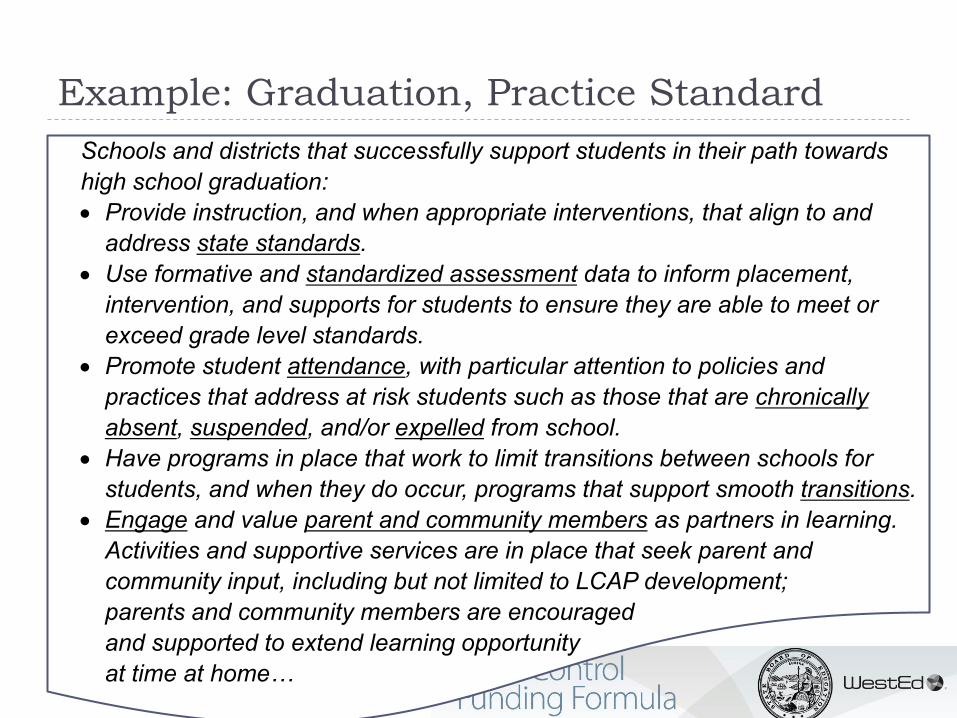
Example: Graduation, Practice Standard
Schools and districts that successfully support students in their path towards high school graduation: Provide instruction, and when appropriate interventions, that align to and
address state standards. Use formative and standardized assessment data to inform placement,
intervention, and supports for students to ensure they are able to meet or exceed grade level standards.
Promote student attendance, with particular attention to policies and practices that address at risk students such as those that are chronically absent, suspended, and/or expelled from school.
Have programs in place that work to limit transitions between schools for students, and when they do occur, programs that support smooth transitions.
Engage and value parent and community members as partners in learning. Activities and supportive services are in place that seek parent and community input, including but not limited to LCAP development; parents and community members are encouraged and supported to extend learning opportunity at time at home…
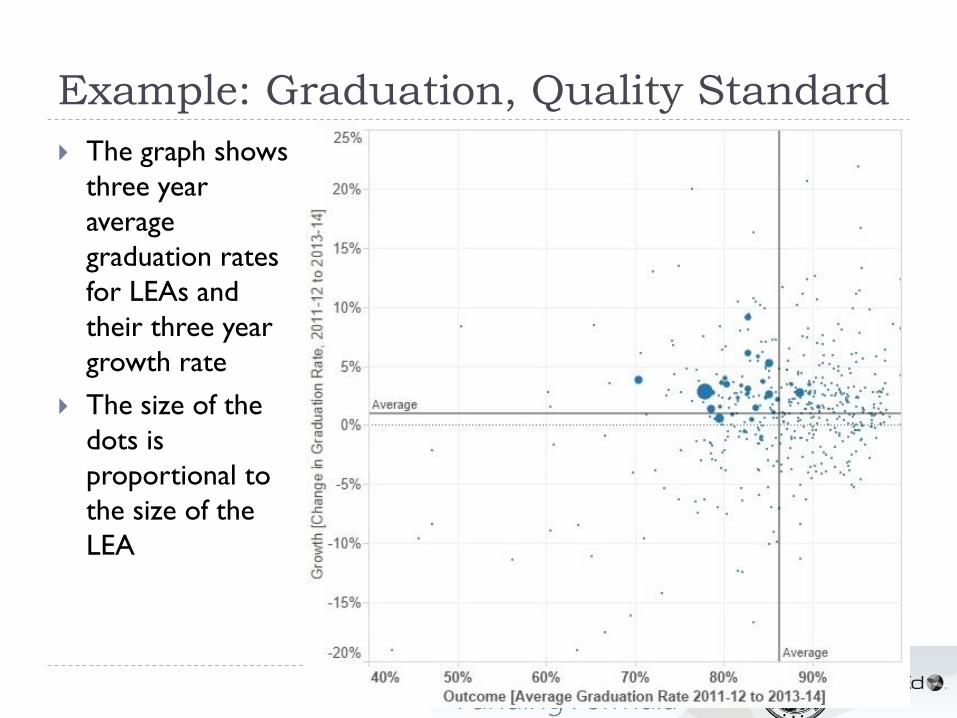
Example: Graduation, Quality Standard
The graph shows
three year
average
graduation rates
for LEAs and
their three year
growth rate
The size of the
dots is
proportional to
the size of the
LEA
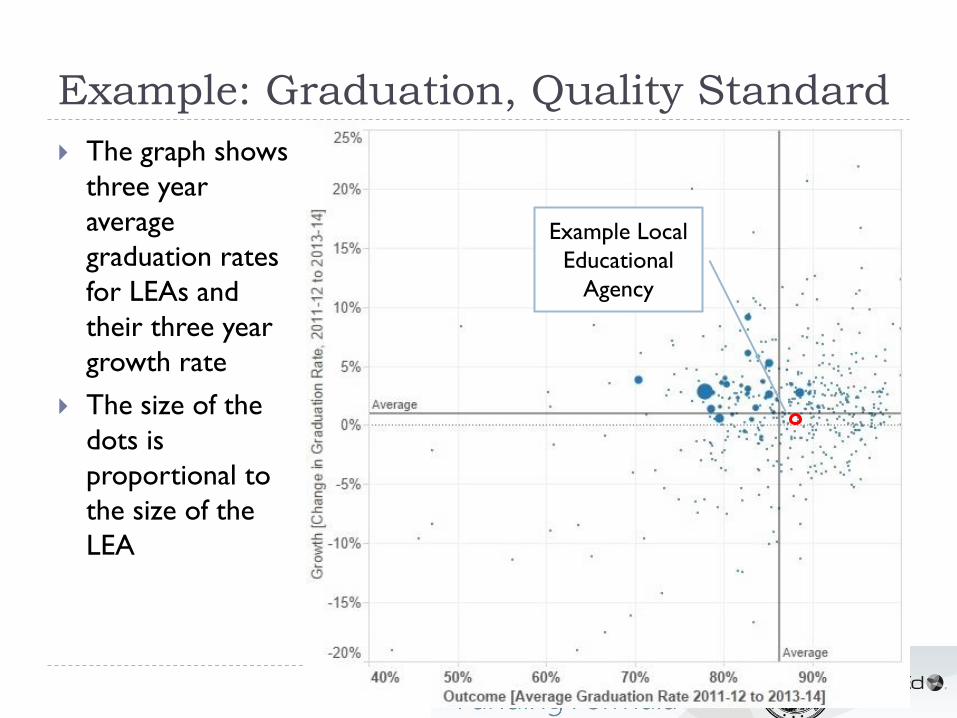
Example: Graduation, Quality Standard
The graph shows
three year
average
graduation rates
for LEAs and
their three year
growth rate
The size of the
dots is
proportional to
the size of the
LEA
Example Local
Educational
Agency
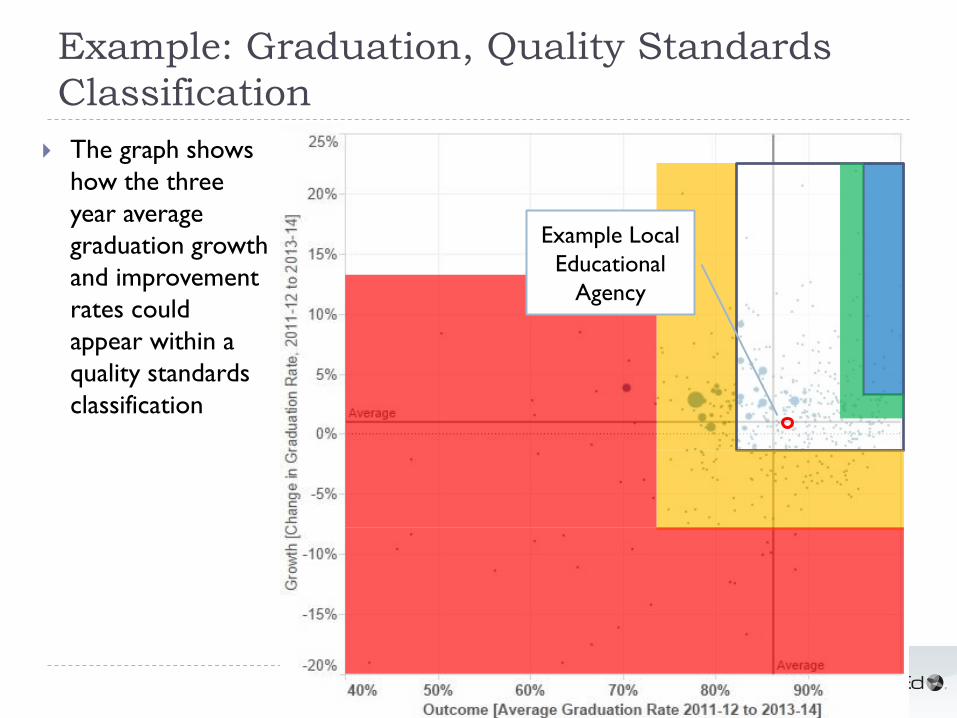
Example: Graduation, Quality Standards
Classification
The graph shows
how the three
year average
graduation growth
and improvement
rates could
appear within a
quality standards
classification
Example Local
Educational
Agency
Example: Graduation, Quality Standards
Classification
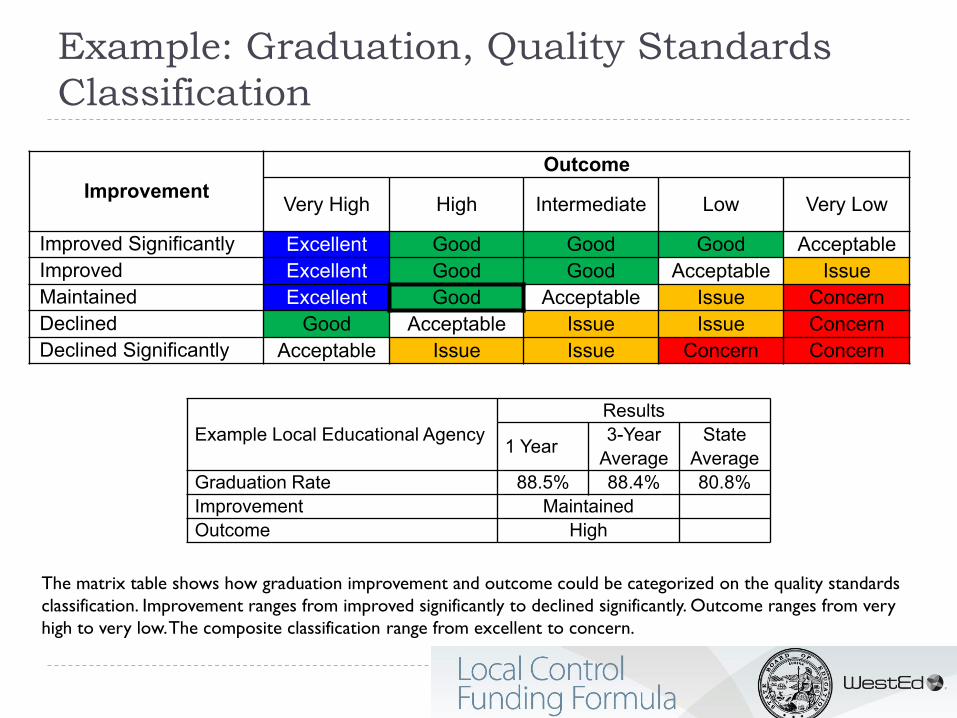
Improvement Outcome
Very High High Intermediate Low Very Low
Improved Significantly Excellent Good Good Good AcceptableImproved Excellent Good Good Acceptable IssueMaintained Excellent Good Acceptable Issue ConcernDeclined Good Acceptable Issue Issue ConcernDeclined Significantly Acceptable Issue Issue Concern Concern
ResultsExample Local Educational Agency 1 Year 3-Year
AverageState
AverageGraduation Rate 88.5% 88.4% 80.8% Improvement Maintained Outcome High
The matrix table shows how graduation improvement and outcome could be categorized on the quality standards
classification. Improvement ranges from improved significantly to declined significantly. Outcome ranges from very
high to very low. The composite classification range from excellent to concern.
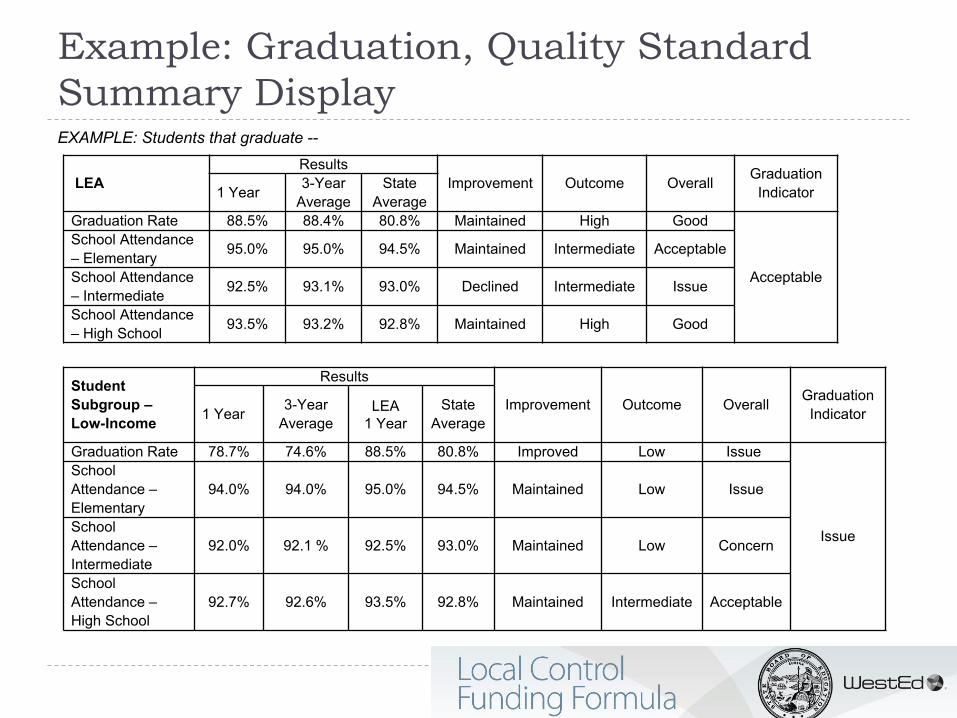
Example: Graduation, Quality Standard
Summary Display EXAMPLE: Students that graduate --
LEA
Results
Improvement Outcome Overall Graduation Indicator 1 Year 3-Year
Average
State Average
Graduation Rate 88.5% 88.4% 80.8% Maintained High Good
Acceptable
School Attendance – Elementary
95.0% 95.0% 94.5% Maintained Intermediate Acceptable
School Attendance – Intermediate
92.5% 93.1% 93.0% Declined Intermediate Issue
School Attendance – High School 93.5% 93.2% 92.8% Maintained High Good
Results Student Subgroup – Low-Income
Improvement Outcome Overall Graduation Indicator 1 Year 3-Year
Average LEA
1 Year State
Average
Graduation Rate 78.7% 74.6% 88.5% 80.8% Improved Low Issue School Attendance – 94.0% 94.0% 95.0% 94.5% Maintained Low Issue
Elementary
Issue School Attendance – 92.0% 92.1 % 92.5% 93.0% Maintained Low Concern
Intermediate
School Attendance – 92.7% 92.6% 93.5% 92.8% Maintained Intermediate Acceptable
High School
Next Steps
User Acceptance Testing
Develop and share prototype of evaluation rubrics content and
sample displays for feedback from users
Research and Analysis
Continue research to inform development of standards and
data use
Draft recommended practice standards
Engagement
Input sessions with policy stakeholders and others