Local Buckling and Resistance of Continuous Steel Beams ...
25
applied sciences Article Local Buckling and Resistance of Continuous Steel Beams with Thin-Walled I-Shaped Cross-Sections Andrzej Szychowski * and Karolina Brzezi ´ nska Faculty of Civil Engineering and Architecture, Kielce University of Technology, al. Tysi ˛ aclecia Pa ´ nstwa Polskiego 7, 25-314 Kielce, Poland; [email protected] * Correspondence: [email protected] Received: 8 April 2020; Accepted: 23 June 2020; Published: 28 June 2020 Featured Application: The research results included in the paper can be widely used in designing thin-walled steel elements for use in construction. The use of the presented calculation model for the calculation of continuous beams allows for more optimal and economical design of sections of this element class under resistance conditions. In this model, the real behavior of thin-walled beams under load was taken into account much more precisely in relation to the Eurocode. This made it possible to use the resistance reserves resulting from the effect of longitudinal stress variation and the elastic restraint of the thin-walled cross-section walls. Abstract: In modern steel construction, thin-walled elements with Class 4 cross-sections are commonly used. For the sake of the computation of such elements according to European Eurocode 3 (EC3), simplified computational models are applied. These models do not account for important parameters that affect the behavior of a structure susceptible to local stability loss. This study discussed the effect of local buckling on the design ultimate resistance of a continuous beam with a thin-walled Class 4 I-shaped cross-section. In the investigations, a more accurate computational model was employed. A new calculation model was proposed, based on the analysis of local buckling separately for the span segment and the support segment of the first span, which are characterized by different distributions of bending moments. Critical stress was determined using the critical plate method (CPM), taking into account the effect of the mutual elastic restraint of the cross-section walls. The stability analysis also accounted for the effect of longitudinal stress variation resulting from the varied distribution of bending moments along the continuous beam length. The results of the calculations were compared with the numerical simulations using the finite element method. The obtained results showed very good congruence. The phenomena mentioned above are not taken into consideration in the computational model provided in EC3. Based on the critical stress calculated as above, “local” critical moments were determined. These constitute a limit on the validity of the Vlasov theory of thin-walled bars. Design ultimate resistance of the I-shaped cross-section was determined from the plastic yield condition of the most compressed edge under the assumptions specified in the study. Detailed calculations were performed for I-sections welded from thin metal sheets, and for sections made from two cold-formed channels (2C). The impact of the following factors on the critical resistance and design ultimate resistance of the midspan and support cross-sections was analyzed: (1) longitudinal stress variation, (2) relative plate slenderness of the flange, and (3) span length of the continuous beam. The results were compared with the outcomes obtained for box sections with the same contour dimensions, and also with those produced acc. EC3. It was shown that compared with calculations acc. EC3, those performed in accordance with the CPM described much more accurately the behavior of the uniformly loaded continuous beam with a thin-walled section. This could lead to a more effective design of structures of this class. Appl. Sci. 2020, 10, 4461; doi:10.3390/app10134461 www.mdpi.com/journal/applsci
Transcript of Local Buckling and Resistance of Continuous Steel Beams ...
applied sciences
Article
Local Buckling and Resistance of Continuous SteelBeams with Thin-Walled I-Shaped Cross-Sections
Andrzej Szychowski * and Karolina Brzezinska
Faculty of Civil Engineering and Architecture, Kielce University of Technology, al. Tysiaclecia PanstwaPolskiego 7, 25-314 Kielce, Poland; [email protected]* Correspondence: [email protected]
Received: 8 April 2020; Accepted: 23 June 2020; Published: 28 June 2020�����������������
Featured Application: The research results included in the paper can be widely used in designingthin-walled steel elements for use in construction. The use of the presented calculation model forthe calculation of continuous beams allows for more optimal and economical design of sectionsof this element class under resistance conditions. In this model, the real behavior of thin-walledbeams under load was taken into account much more precisely in relation to the Eurocode.This made it possible to use the resistance reserves resulting from the effect of longitudinalstress variation and the elastic restraint of the thin-walled cross-section walls.
Abstract: In modern steel construction, thin-walled elements with Class 4 cross-sections are commonlyused. For the sake of the computation of such elements according to European Eurocode 3 (EC3),simplified computational models are applied. These models do not account for important parametersthat affect the behavior of a structure susceptible to local stability loss. This study discussed the effectof local buckling on the design ultimate resistance of a continuous beam with a thin-walled Class 4I-shaped cross-section. In the investigations, a more accurate computational model was employed.A new calculation model was proposed, based on the analysis of local buckling separately for the spansegment and the support segment of the first span, which are characterized by different distributionsof bending moments. Critical stress was determined using the critical plate method (CPM), takinginto account the effect of the mutual elastic restraint of the cross-section walls. The stability analysisalso accounted for the effect of longitudinal stress variation resulting from the varied distribution ofbending moments along the continuous beam length. The results of the calculations were comparedwith the numerical simulations using the finite element method. The obtained results showedvery good congruence. The phenomena mentioned above are not taken into consideration in thecomputational model provided in EC3. Based on the critical stress calculated as above, “local” criticalmoments were determined. These constitute a limit on the validity of the Vlasov theory of thin-walledbars. Design ultimate resistance of the I-shaped cross-section was determined from the plastic yieldcondition of the most compressed edge under the assumptions specified in the study. Detailedcalculations were performed for I-sections welded from thin metal sheets, and for sections made fromtwo cold-formed channels (2C). The impact of the following factors on the critical resistance anddesign ultimate resistance of the midspan and support cross-sections was analyzed: (1) longitudinalstress variation, (2) relative plate slenderness of the flange, and (3) span length of the continuousbeam. The results were compared with the outcomes obtained for box sections with the same contourdimensions, and also with those produced acc. EC3. It was shown that compared with calculationsacc. EC3, those performed in accordance with the CPM described much more accurately the behaviorof the uniformly loaded continuous beam with a thin-walled section. This could lead to a moreeffective design of structures of this class.
Appl. Sci. 2020, 10, 4461; doi:10.3390/app10134461 www.mdpi.com/journal/applsci

Appl. Sci. 2020, 10, 4461 2 of 25
Keywords: thin-walled I-section; continuous beam; local buckling; longitudinal stress variation;design ultimate resistance of the cross-section
1. Introduction
In modern metal construction, thin-walled lightweight components that are sensitive to localstability loss are increasingly being used. Local buckling of a thin-walled member causes lateral(in relation to the direction of compressive stress) displacement of the component walls of thecross-section. This reduces the load capacity of the critical cross-section, which reduces the resistanceof the entire structural member. In the European Eurocode 3 (EC3) [1–3] standards, cross-sectionsthat are subjected to local buckling (in the elastic range) are included in Class 4 cross-sections.The classification of a steel cross-section into Class 4 is based on a comparison of slenderness (b/t)of separated component walls of the section with the limit values for Class 3. In the event thelimits of at least one of the component walls being exceeded, the cross-section is qualified as Class4, which implies the need to include the effects of local buckling in the calculation model. However,an interest in thin-walled members is currently growing due to a significant reduction in the weight ofstructural steel cross-sections. For example, hot-formed bisymmetric sections (e.g., IPE, HEB), muchlighter cold-formed open sections (monosymmetric or compound cross-sections, e.g., two-branchcross-sections), or bisymmetrical box sections can be used for supporting elements of light halls, floorbeams, trusses, columns, or purlins. This approach reduces the weight of the structure. The use ofsteels with ever higher strength as well as modern automatic welding technologies also affects thedevelopment of thin-walled welded I-sections. Such Class 4 bisymmetrical and monosymmetricalwelded cross-sections are characterized by low weight, with an analogous degree of reliability of thestructural member in relation to hot-formed members.
From the point of view of the occurring instability phenomena, I-section beams may be subjectto local buckling and lateral torsional buckling, including flexural–torsional loss of stability with theso-called forced rotation axis (e.g., wind suction purlin or from gravity loads in the supporting segmentof continuous beams). This is due to the fact that thin-walled open cross-sections are characterizedby low wall stiffness to local buckling and low rigidity of the whole cross-section to torsion [4,5].However, a forced rotation axis at lateral–torsional buckling, e.g., with a suitably rigid cover, results ina significant increase in critical moment and, in many cases, the adverse effects of lateral–torsionalbuckling can be neglected.
Therefore, in the Class 4 thin-walled I-section beams, protected against lateral buckling, theinfluence of local stability loss remains, especially because thin-walled I-cross-sections are much lessresistant to local buckling than, for example, box cross-sections [6]. This results from the fact that insuch a cross-section there are cantilever walls, which are much less resistant to buckling in relationto internal walls [7,8] or cantilever walls with a stiffening bend [9]. However, the use of I-sections(in relation to box sections) allows for simpler shaping of connections and nodes due to free anddouble-sided access, e.g., to bolt joints. Moreover, continuous beam systems, due to the favourablelongitudinal distribution of bending moments, enable the effect of longitudinal stress variation to beused in local stability analysis [10].
The resistance of a thin-walled cross-section is determined using the effective width method [3].This method consists of determining the critical stresses of local buckling (σcr = kσE, where k is theplate buckling coefficient) for individual cross-section walls, assuming their hinged support andconstant distribution of stresses along the member length. On this basis, the relative plate slenderness(λp =
√fy/σcr, where fy is the yield strength of steel) and effective widths of individual walls (plates)
are determined be f f = ρ(λp
)b, where ρ is the reduction factor.
Reference [6] presents an analysis of the so-called “local” critical resistance (i.e., determined fromthe condition of the local buckling) and the design ultimate resistance of a continuous beam with a

Appl. Sci. 2020, 10, 4461 3 of 25
Class 4 thin-walled box section. It was shown that the resistance of a five-span beam can be determinedfrom the supporting segment of the first span. Calculations were made using the critical plate method(CPM) [10]. The following were analyzed with respect to their effect on the “local” critical and designultimate resistance of box cross-sections: (1) the relative plate slenderness of the flange, and (2) thespan length of the continuous beam.
In the case of transversely bent beams made of thin-walled I-sections, which are protected againstlateral–torsional buckling, the possibility of local buckling of the compression flange must be takeninto account along with, for adequately high cross-sections, the possibility of local buckling of thebending and shear web [11].
This study dealt with the determination of the resistance of a continuous beam (e.g., purlins) with athin-walled I-section (sheet-welded or composed of two cold-formed channel sections). The calculationsaccounted for (1) the effect of the elastic restraint of the weakest cross-section wall in the stiffeningwall, and (2) the effect of longitudinal stress variation caused by the variability of bending moments.
The analysis was based on the fixed I-section along the whole length of the beam (Figure 1). In thiscase, the resistance of the continuous beam is determined by the end span. The case where the first(extreme) span is additionally reinforced, and the resistance is determined by the intermediate spans,will be the subject of a separate work.
Appl. Sci. 2020, 10, x FOR PEER REVIEW 3 of 25
plate method (CPM) [10]. The following were analyzed with respect to their effect on the “local” critical and design ultimate resistance of box cross-sections: (1) the relative plate slenderness of the flange, and (2) the span length of the continuous beam.
In the case of transversely bent beams made of thin-walled I-sections, which are protected against lateral–torsional buckling, the possibility of local buckling of the compression flange must be taken into account along with, for adequately high cross-sections, the possibility of local buckling of the bending and shear web [11].
This study dealt with the determination of the resistance of a continuous beam (e.g., purlins) with a thin-walled I-section (sheet-welded or composed of two cold-formed channel sections). The calculations accounted for (1) the effect of the elastic restraint of the weakest cross-section wall in the stiffening wall, and (2) the effect of longitudinal stress variation caused by the variability of bending moments.
The analysis was based on the fixed I-section along the whole length of the beam (Figure 1). In this case, the resistance of the continuous beam is determined by the end span. The case where the first (extreme) span is additionally reinforced, and the resistance is determined by the intermediate spans, will be the subject of a separate work.
Figure 1. Static model of a continuous beam end span with thin-walled I-section.
2. Computational Model for Local Cross-Section Buckling
The Class 4 cross-section calculation model according to European standards EC3 [1–3] assumes that all component plates of athe cross-section are hinge-supported at their bonding edges. This means that the plates do not interact with each other, and the local buckling of the whole cross-section is determined by the weakest separated plate (cross-section wall).
However, in many technically important cases this model is too conservative, which has been confirmed by numerous experimental studies, e.g., References [5,12–14]; theoretical studies, e.g., References [4,7,15,16]; and numerical simulations, e.g., References [17–23]. This is due to the fact that in real thin-wall cross-sections, there is an effect of mutual, elastic interaction of component plates (walls).
Further, the standard computational model assumes that after determining the relative slenderness of the individual simply supported plates, their respective effective widths are determined, which determine the effective cross-section of the thin-walled member. In the calculation according to EC3, the effect of longitudinal stress variation, which often occurs in practice (e.g., in continuous beams), is also ignored.
In References [19,21], the effect of the mutual elastic restraint of thin-walled section walls was considered. Various load cases were taken into account, ranging from axial compression to pure bending relative to both axes of the section gravity, including interactive loads. Very large sets of simulation results were analyzed via the finite strip method using CUFSM software [18]. Calculations were made for many load cases and approximate analytical formulas were proposed for determining the plate buckling coefficient k [19] and the local buckling half-wavelengths [21] for various types of hot-rolled and welded sections. In Reference [22], in turn, approximation formulas
b
hMp
Ms
tf
tw
1
11-1
lp lsMp
b
hMs
tf
tw
2-2
2
2
L
Figure 1. Static model of a continuous beam end span with thin-walled I-section.
2. Computational Model for Local Cross-Section Buckling
The Class 4 cross-section calculation model according to European standards EC3 [1–3] assumesthat all component plates of athe cross-section are hinge-supported at their bonding edges. This meansthat the plates do not interact with each other, and the local buckling of the whole cross-section isdetermined by the weakest separated plate (cross-section wall).
However, in many technically important cases this model is too conservative, which has beenconfirmed by numerous experimental studies, e.g., References [5,12–14]; theoretical studies, e.g.,References [4,7,15,16]; and numerical simulations, e.g., References [17–23]. This is due to the fact that inreal thin-wall cross-sections, there is an effect of mutual, elastic interaction of component plates (walls).
Further, the standard computational model assumes that after determining the relative slendernessof the individual simply supported plates, their respective effective widths are determined, whichdetermine the effective cross-section of the thin-walled member. In the calculation according to EC3,the effect of longitudinal stress variation, which often occurs in practice (e.g., in continuous beams), isalso ignored.
In References [19,21], the effect of the mutual elastic restraint of thin-walled section walls wasconsidered. Various load cases were taken into account, ranging from axial compression to purebending relative to both axes of the section gravity, including interactive loads. Very large sets ofsimulation results were analyzed via the finite strip method using CUFSM software [18]. Calculations
Appl. Sci. 2020, 10, 4461 4 of 25
were made for many load cases and approximate analytical formulas were proposed for determiningthe plate buckling coefficient k [19] and the local buckling half-wavelengths [21] for various types ofhot-rolled and welded sections. In Reference [22], in turn, approximation formulas of the k coefficientfor hot-rolled sections under simple loads (axial compression, bending relative to the stronger andweaker axis of the cross-section) were given. However, the solutions obtained in References [19,21,22]relate only to constant stress distributions over the length of the structural member.
In References [7,24,25], the impact of longitudinal stress variation in the compressed cantileverplate (which is, for example, a component of an I-cross-section) was taken into account, but only forextreme support conditions (hinge or full restraint).
Meanwhile, in Reference [26], the approximation formulas of the plate buckling coefficient k foran axially compressed cantilever plate with any degree of elastic restraint of the supported edge andlongitudinal stress distribution according to the linear function and 2◦ parabola were derived. At thesame time, graphs of k coefficients were determined in References [27,28] for elastically restrainedand eccentrically compressed cantilever plates with longitudinal stress variation. Many technicallyimportant load cases have been considered.
Reference [10] presents a more accurate computational model of the effect of local buckling on theresistance of thin-walled cross-sections. The critical plate method (CPM) takes into account the effectof both the elastic restraint of the cross-section plates and that of longitudinal stress variation.
3. “Local” Critical Resistance and Design Ultimate Resistance of the Cross-Section
In Reference [10], the bending moment inducing local buckling of a thin-walled cross-section wascalled the “local” critical moment (ML
cr), which can be determined from the formula
MLcr = σL
crWel,y/γM0, (1)
where σLcr—critical buckling stress determined according to a more accurate computational model
(CPM) and related to the extreme edge of the cross-section,Wel,y = Iy/zc – elastic section modulus,γM0—partial factor for cross-section resistance.This moment is a limitation of the pre-buckling range of cross-section behavior and determines
the limit of validity of Vlasov’s thin-walled bar theory. On its basis, the critical resistance (critical load)of the structure can be determined from the condition of local stability loss of the weakest cross-section.
As regards the reliability of metal building structures, the designer’s interest lies in the so-calleddesign resistance [1], which can be determined from the formula
Me f f = We f f fy/γM0, (2)
where We f f = Ie f f /ze f f —effective section modulus.The “local” critical moment according to (1) can in practice be treated as the resistance of a
thin-walled section in the pre-buckling range, assuming unlimited material elasticity. Therefore, whereWelσ
Lcr > We f f fy, the design resistance of a Class 4 cross-section must necessarily be determined using
Equation (2).The so-called design ultimate cross-section resistance defined in References [6,10] (taking into
account a more accurate model of local buckling) is a lower (conservative) estimate of the failure loaddetermined for the mechanism of plastic hinge [29]. The resistance of a thin-walled cross-section,which is obtained during the failure phase, cannot be applied in the design of building structures.However, it can be applied, for example, in designing so-called mechanical energy absorbers [30].
4. The Idea of the Critical Plate Method (CPM)
The idea of the critical plate method [10] consists of determining the buckling stress of the weakestcomponent plate of the cross-section, taking into account its elastic restraint in adjacent plates (walls),

Appl. Sci. 2020, 10, 4461 5 of 25
for which the buckling stresses are higher. In addition, the method allows the effect of longitudinalstress variation to be taken into account. In this computational model, the so-called critical plate (CP)must be identified, which determines the local buckling of the section in a given loading condition.
The elastic restraint against longitudinal edge rotation of the CP results from the action of theadjacent restraining plate (RP). For example, for certain proportions of the bending I-section [10],the critical plate may be a compressed cantilever wall of the width bs as a outstanding part of the flangewidth b f = 2bs, and the restraining plate will be a web of height hw. The buckling stress for the CPso determined is higher than that determined under the assumption of its simple support. This isespecially true for cantilever plates, for which the elastic restraint against rotation of the longitudinalsupported edge significantly affects the buckling stress values. The difference in plate bucklingcoefficients for an uniform compressed cantilever plate between a hinged support (kσ = 0.43) [3] and afully restrained support (kσ = 1.25) [7,19] is almost threefold.
In References [19,21], attention was paid to the additional phenomenon of the so-called mutualconstraint of the component walls of the cross-section (affecting the increase of buckling stress), despitethe fact that the theoretical critical stresses of individual walls (determined under the assumptionof their hinged support) are equal. This was found to be due to the different buckling lengths ofthe internal and cantilever plates. Therefore, in Reference [21], approximation formulas for the localbuckling half-wavelengths of the full cross-section were derived. This length is between the bucklinglength for a separate, simply supported, and fully restrained plate, on which the critical resistance ofthe full cross-section depends. Knowledge of local buckling half-wavelengths is useful for the directdefinition of geometric imperfections in analytical and numerical models.
On the other hand, in Reference [10], it was assumed that in a thin-walled section wherethought-separated hinge-supported walls theoretically have the same buckling stresses, the effectof mutual constraint is insignificant (i.e., increases the buckling stress from 5 to 20%) and can beconservatively ignored. On this basis, so-called “zero” cross-sections were defined, in which thethought-separated hinge-supported plates have the same buckling stresses, and the resistance of suchcross-sections can be calculated according to the standard procedure [1,3].
The distinction between “zero” and “non-zero” cross-sections significantly simplifies theidentification of the critical plate in the latter and allows for a slightly conservative (safe) estimation ofthe buckling stress. Therefore, the elastic restraint coefficient of the CP in RP can be estimated usingEquation (3) [10]
κ = 1/(1 + 2Ds/bsCθ), (3)
where Cθrotational spring stiffness equal to the bending moment created during rotation by unit angle(Cθ = M/θ), bs—CP width, Ds—plate flexural rigidity according to the formula
Ds =Et3
s
12(1− ν2)(4)
where for E = 210 GPa and ν= 0.3, it can be approximately assumed that Ds = 19, 200t3s , ts—CP thickness.
The restraint coefficient according to Equation (3) varies from κ = 0 for simple support to κ = 1for full restraint.
When the above-mentioned effects are taken into consideration, it is possible to determine thecritical stress causing the cross-section local buckling in a more accurate way. Based on the criticalstress, the following can be determined: (1) the “local” critical resistance of the cross-section ML
cr, (2) theeffective width of the critical plate, and (3) the design ultimate resistance of the cross-section MCP
e f faccording to Reference [10].
5. Algorithm of the CPM Method for Thin-Walled I-Cross-Sections under Bending
For the transverse bending of I-beams of a Class 4 cross-section (Figure 2), their resistance isusually determined by local buckling of the compression flange (of width b f � 2bs and thickness t f ) or

Appl. Sci. 2020, 10, 4461 6 of 25
local buckling of the web (of height hw and thickness tw) under bending and shear interaction. Becauseof their geometric topology, those cross-sections were categorised in Reference [10] as part of the groupof so-called “simple” cross-sections.
The ultimate height h0 of the cross-sections at which the compression flange buckling and webin-plane bending with a slight impact of shear stresses (τ ≤ 0.25τcr) occur almost simultaneously canbe determined using Equation (5) [10]
h0 =
√√k0
w
k0f
·
(twbs
t f
)(5)
where k0i —basic buckling coefficient for the hinged supported i-th plate at given load distribution
(k0f = 0.43 for axial cantilever plate compression, k0
w = 23.9 for bending in the plane of the web plate).For h < h0, it is the compression flange that determines local buckling of the cross-section, whereas
for h > h0, the weakest wall is the web under in-plane bending.For the mean proportion of shear stresses (0.25τcr ≤ τ ≤ 0.5τcr) Equaiton (5) can be modified to
the form:
h0 =
√√k0
w
k0f
·
(twbs
t f
)[1−
(ττcr
)2]0.25
(6)
where: τcr—critical stress for the web plate in shear.However, if there is a large proportion of transverse forces in the slender webs (plates supported
at four edges) that are part of beam cross-sections, shear stresses τ may need to be considered moreclosely, as their contribution to local loss of web stability may be significant. Appropriate formulasfor elastic strain energy and work done by external forces allowing critical stresses to be determined(using the energy method) for internal plates loaded (within their plane) with bending with high shearwere derived in Reference [11].
For thin-walled I-sections, for which h < h0 according to Equation (6), the CPM assumptions areas follows: (1) the compression flange of the cross-section consists of two critical plates (CPs) whichwidth of bs ≤ b f /2 each, which are supported on a web plate of the height hw, (note: dimensions bs andhw can be determined based on the rules given in Reference [10]); (2) a single CP acts as a cantileverplate, with one side elastically restrained against rotation; (3) the CP to RP connection (i.e., the web) isrigid (i.e., on the longitudinal edge of their connection, the conditions of continuity of displacements(rotation angles) and forces (bending moments), are met); (4) the transverse edges of the plates (CP andRP) are simply supported on the segment ends; and (5) the thin-walled bar segment (with the length ls),as in Reference [6], is defined as follows: (a) for constant longitudinal stress distribution, as the distancebetween the so-called buckling nodal lines, (b) for longitudinal stress variation, as the distance betweentransverse stiffeners (diaphragms, ribs, or supports) that maintain a rigid cross-section contour, but notlonger than the range of the compression zone in the critical plate [26]. The conditions under whichAssumption 3 can be adopted were discussed in Reference [10].
The case of I-sections with high and slender webs (at h > h0 acc. to Equation (6)), where the“local” critical resistance is determined by the buckling of the bent and shear web, will be discussed ina separate study.

Appl. Sci. 2020, 10, 4461 7 of 25Appl. Sci. 2020, 10, x FOR PEER REVIEW 7 of 25
Figure 2. Division of I-cross-section into critical plate (CP) and restraining plate (RP) for ℎ < ℎ .
The calculation algorithm is as follows:
(1) Division of the cross-section into component plates according to Figure 2; (2) Identifying CP for a “simple” cross-section based on the condition = { , } (7)
, = , (8)
where , —Euler stress for the i-th plate according to the formula: , = 190,000( ⁄ ) . Note: for ℎ < ℎ acc. to Equation (6), the critical plate (CP) is the cantilever wall of the
compression flange and the rigid plate (RP) is the web;
(3) Adoption of the initial CP edge restraint coefficient value (for the so-called zero step), e.g., =0.4; (4) Estimation of the critical length ( ) for a single half-wave of CP buckling [26] according to the
formula
= 2.02 − 0.37. (9)
(5) Determination of the coefficient [31], depending on the static scheme and the way of forcing (loading) RP by buckling CP (Figure 2) for the critical length according to Equation (9) [10] = 33.4 + 50.7( ⁄ ) − 2.78 (10)
where —RP width;
(6) Determination of according to the formula = ∗ , (11)
where k*—buckling coefficient according to a more accurate calculation model. The k* coefficient can be determined on the basis of Reference [26] from the following formulas:
• for linear stress distribution (Figure 3a),
∗( , , ) = ( ) + 0.765 − 0.31 + 0.227 + (3.201 − 0.307 − 3.724 + 2.842 ) + (−3.887 − 9.205 + 21.528 − 12.306 ) + (−1.132 + 22.933 − 37.767 + 19.091 ) +
(12)
Mp
CP1
RP
CPκ
RP
m
k>0.43
EC-3
k=0.43
lcr=L lcr<L
CP2
s
L
Figure 2. Division of I-cross-section into critical plate (CP) and restraining plate (RP) for h < h0.
The calculation algorithm is as follows:
(1) Division of the cross-section into component plates according to Figure 2;(2) Identifying CP for a “simple” cross-section based on the condition
σ0cr = min
{σ0
cr,i
}(7)
σ0cr,i = k0
i σE,i (8)
where σE,i—Euler stress for the i-th plate according to the formula: σE,i = 190, 000(ti/bi)2. Note:
for h < h0 acc. to Equation (6), the critical plate (CP) is the cantilever wall of the compressionflange and the rigid plate (RP) is the web;
(3) Adoption of the initial CP edge restraint coefficient value (for the so-called zero step), e.g.,κ0 = 0.4;
(4) Estimation of the critical length (lcr) for a single half-wave of CP buckling [26] according tothe formula
lcr = bs
(2.02− 0.37κκ0.25
)(9)
(5) Determination of the coefficient η [31], depending on the static scheme and the way of forcing(loading) RP by buckling CP (Figure 2) for the critical length according to Equation (9) [10]
η =
√33.4 + 50.7(br/lcr)
2− 2.78 (10)
where br—RP width;(6) Determination of σL
cr according to the formula
σLcr = k∗σE,s (11)
where k*—buckling coefficient according to a more accurate calculation model. The k* coefficientcan be determined on the basis of Reference [26] from the following formulas:
• for linear stress distribution (Figure 3a),
k∗(κ, m,γ) = k∞(κ) +[0.765m− 0.31m2 + 0.227m3+(
3.201m− 0.307m2− 3.724m3 + 2.842m4
)κ2+(
−3.887m− 9.205m2 + 21.528m3− 12.306m4
)κ3+(
−1.132m + 22.933m2− 37.767m3 + 19.091m4
)κ4+(
2.559m− 14.341m2 + 20.975m3− 10.023m4
)κ5
]/γ(0.59+0.16m)
s
(12)

Appl. Sci. 2020, 10, 4461 8 of 25
• for non-linear stress distribution (according to 2◦ parabola, Figure 3b),
k∗(κ, m,γ) = k∞(κ) +[1.096m− 0.808m2 + 0.363m3+(
20.064m− 63.78m2 + 74.842m3− 30.565m4
)κ2+(
−58.826m + 195.88m2− 232.857m3 + 95.684m4
)κ3+(
61.802m− 211.851m2 + 254.031m3− 104.82m4
)κ4+(
−22.086m + 77.761m2− 93.977m3 + 38.925m4
)κ5]/γ(1.06+0.04m)
s
(13)
where m = 1 − σ1/σ0—longitudinal stress distribution coefficient (Figure 3), γs = ls/bs.The plate buckling coefficient k∞(κ) of an elastically restrained and infinitely long cantileverplate can be determined according to Reference [26], using the formula
k∞(κ) = 0.425 + 2.893κ− 19.433κ2 + 83.849κ3− 195.943κ4 + 250.971κ5
−165.321κ6 + 43.833κ7 (14)
On the other hand, Reference [28] presents a simplified formula for k∞(κ) within the range0.05 ≤ κ ≤ 1 in the form of
k∞(κ) = 0.49 + 0.974κ− 0.822κ2 + 0.632κ3 (15)
(7) Estimation of the critical stress σcr,r for a RP bent in its plane (width br) [32] for one half-wave ofCP buckling length lcr according to Point 4.
σcr,r =Et2
r
l2crb4r
(11.32l4cr + 1.97b4
r + 12.06l2crb2r
)(16)
(8) Determination of rotational spring stiffness Cθ according to Equation (17) and the restraintcoefficient κi+1 according to Equation (3) for the first (i = 1) and subsequent iteration steps.
Cθ =c jη jDr
br
(1−
σLcr
σcr,r
)(17)
where c j—parameter of geometrical configuration of plates in contact with the j-th edge (for awelded I-section c j = 1/2 [10]; note: for an I-section made up of two channel sections c j = 1, i.e.,one web with thickness tw stabilizes one CP of the flange on one edge), Dr = 19, 200t3
r RP flexuralrigidity, tr—RP thickness;
(9) Repetition of Steps (4) to (8) up to the moment when κi ≈ κi+1;(10) σL
cr(κi+1) according to Equation (11) is the sought buckling stress for CP;(11) Determination of the “local” critical resistance of the cross-section according to Equation (1);(12) Determination of the design ultimate resistance of the cross-section according to Equation (2) for
the We f f coefficient calculated with the following assumptions [10]:
(a) the slenderness of the critical plate (CP) shall be determined from the buckling stressdetermined by Step 10 (i.e., taking into account the elastic restraint effect of the cantileverplate and the effect of longitudinal stress variation);
(b) for the web (rigid plate RP), a simple support shall be provided at the same edge;(c) the boundary conditions at the other edge of the RP have a slight impact on the result of
the calculations (conservatively, simple support can also be assumed here),(d) the effect of possible longitudinal stress variation in RP is insignificant and can be ignored,

Appl. Sci. 2020, 10, 4461 9 of 25
(e) the effective widths so determined “shall be folded” into an effective cross-section, forwhich We f f is determined.
Appl. Sci. 2020, 10, x FOR PEER REVIEW 8 of 25 (2.559 − 14.341 + 20.975 − 10.023 ) ( . . )⁄
• for non-linear stress distribution (according to 2° parabola, Figure 3b),
∗( , , ) = ( ) + 1.096 − 0.808 + 0.363 + (20.064 − 63.78 + 74.842 − 30.565 ) + (−58.826 + 195.88 − 232.857 + 95.684 ) + (61.802 − 211.851 + 254.031 − 104.82 ) + (−22.086 + 77.761 − 93.977 + 38.925 ) / ( . . )
(13)
where = 1 − / —longitudinal stress distribution coefficient (Figure 3), = / . The plate buckling coefficient ( ) of an elastically restrained and infinitely long cantilever
plate can be determined according to Reference [26], using the formula ( ) = 0.425 + 2.893 − 19.433 + 83.849 − 195.943 + 250.971 −165.321 + 43.833 (14)
On the other hand, Reference [28] presents a simplified formula for ( ) within the range 0.05 ≤ ≤ 1 in the form of ( ) = 0.49 + 0.974 − 0.822 + 0.632 (15)
Figure 3. Longitudinal stress distribution in a cantilever plate: (a) linear, (b) non-linear according to 2° parabola.
(7) Estimation of the critical stress , for a RP bent in its plane (width ) [32] for one half-wave of CP buckling length according to Point 4.
, = (11.32 + 1.97 + 12.06 ) (16)
(8) Determination of rotational spring stiffness according to Equation (17) and the restraint coefficient according to Equation (3) for the first (i = 1) and subsequent iteration steps.
= 1 − , (17)
where —parameter of geometrical configuration of plates in contact with the j-th edge (for a welded I-section = 1 2⁄ [10]; note: for an I-section made up of two channel sections = 1, i.e., one web with thickness stabilizes one CP of the flange on one edge), = 19,200 —RP flexural rigidity, —RP thickness;
(9) Repetition of Steps (4) to (8) up to the moment when ;
κσ0
σcr
σ1
κσ0
σcr
σ1σ0
σ1
σ0
σ1
(a (b
ls lp
b s b s
Figure 3. Longitudinal stress distribution in a cantilever plate: (a) linear, (b) non-linear according to2◦ parabola.
The algorithm proposed above, compared to the classical version of the effective width method,allows for a more accurate consideration of the behavior of a thin-walled section, the resistance ofwhich is determined by the local buckling phenomenon. A more detailed comparative analysis on thisissue is presented in Reference [10].
6. Calculation Method for a Continuous I-Beam
In the case of a multi-span continuous uniformly loaded beam (Figure 4), a non-linear bendingmoment distribution My occurs in the first (end) span with maximum values (Mp and Ms). For therange (lp + c), the graph My is convex, while for the range ls the graph is concave. Such longitudinaldistributions of My cause non-linear (along the length of the beam) normal stress distributions σx,which may cause local loss of stability [6].
Appl. Sci. 2020, 10, x FOR PEER REVIEW 10 of 25
6. Calculation Method for a Continuous I-Beam
In the case of a multi-span continuous uniformly loaded beam (Figure 4), a non-linear bending moment distribution occurs in the first (end) span with maximum values ( and ). For the range ( + ), the graph is convex, while for the range the graph is concave. Such longitudinal distributions of cause non-linear (along the length of the beam) normal stress distributions , which may cause local loss of stability [6].
Figure 4. Static scheme of a beam: (a) load distribution, (b) moment diagram for the first (extreme) span, (c) welded I-section, (d) 2C compound I-section.
Reference [33] showed that in the case of non-linear stress distribution for the full span range = + (Figure 5), the k coefficient takes basically the same values as those determined for the reduced range (e.g., for ⁄ ≥ 4 differences not exceeding 2%). However, in Reference [26], it was shown that if the stress mark changes, the design segment length can be limited to the range of the compression zone. This is applicable to the support zone of a continuous beam. Therefore, similarly to Reference [6], in order to take into account the effect of longitudinal stress variation when determining the span cross-section resistance, it is sufficient to assume the segment length to be , and for the support cross-section to be a segment with the length of .
For the span segment, there is a non-linear (according to 2° parabola) stress distribution. For the support segment, however, the concave stress distribution can be conservatively approximated by the linear distribution.
Figure 5. Calculation model of the first (end) span of a uniformly loaded continuous beam.
q
q M(b)
Ms
Mp
(c)
M
(d)
(a)
M
L L L/2c
Llslp
s
bf
h
bs
h
bf
σs
σp
support zone
=
lp c
σp σcr,p
σs σcr,s
Lls
Figure 4. Static scheme of a beam: (a) load distribution, (b) moment diagram for the first (extreme)span, (c) welded I-section, (d) 2C compound I-section.
Reference [33] showed that in the case of non-linear stress distribution for the full span rangelk = lp + c (Figure 5), the k coefficient takes basically the same values as those determined for thereduced range lp (e.g., for lk/bs ≥ 4 differences not exceeding 2%). However, in Reference [26], it wasshown that if the stress mark changes, the design segment length can be limited to the range ofthe compression zone. This is applicable to the support zone ls of a continuous beam. Therefore,similarly to Reference [6], in order to take into account the effect of longitudinal stress variation when

Appl. Sci. 2020, 10, 4461 10 of 25
determining the span cross-section resistance, it is sufficient to assume the segment length to be lp, andfor the support cross-section to be a segment with the length of ls.
Appl. Sci. 2020, 10, x FOR PEER REVIEW 10 of 25
6. Calculation Method for a Continuous I-Beam
In the case of a multi-span continuous uniformly loaded beam (Figure 4), a non-linear bending moment distribution occurs in the first (end) span with maximum values ( and ). For the range ( + ), the graph is convex, while for the range the graph is concave. Such longitudinal distributions of cause non-linear (along the length of the beam) normal stress distributions , which may cause local loss of stability [6].
Figure 4. Static scheme of a beam: (a) load distribution, (b) moment diagram for the first (extreme) span, (c) welded I-section, (d) 2C compound I-section.
Reference [33] showed that in the case of non-linear stress distribution for the full span range = + (Figure 5), the k coefficient takes basically the same values as those determined for the reduced range (e.g., for ⁄ ≥ 4 differences not exceeding 2%). However, in Reference [26], it was shown that if the stress mark changes, the design segment length can be limited to the range of the compression zone. This is applicable to the support zone of a continuous beam. Therefore, similarly to Reference [6], in order to take into account the effect of longitudinal stress variation when determining the span cross-section resistance, it is sufficient to assume the segment length to be , and for the support cross-section to be a segment with the length of .
For the span segment, there is a non-linear (according to 2° parabola) stress distribution. For the support segment, however, the concave stress distribution can be conservatively approximated by the linear distribution.
Figure 5. Calculation model of the first (end) span of a uniformly loaded continuous beam.
q
q M(b)
Ms
Mp
(c)
M
(d)
(a)
M
L L L/2c
Llslp
s
bf
h
bs
h
bf
σs
σp
support zone
=
lp c
σp σcr,p
σs σcr,s
Lls
Figure 5. Calculation model of the first (end) span of a uniformly loaded continuous beam.
For the span segment, there is a non-linear (according to 2◦ parabola) stress distribution. For thesupport segment, however, the concave stress distribution can be conservatively approximated by thelinear distribution.
7. Example of Using CPM to Determine the Resistance of a Continuous I-Beam
7.1. Statics and Cross-Sectional Forces
The calculations were carried out, among others, for five-span continuous beams (e.g., purlins)(cf. Figure 4) with a constant span length L and thin-walled I-sections either (a) welded from thinsheets (I; Figure 4b,c) or (b) composed of two cold-formed channel sections (type 2C; Figure 4d). It wasassumed that the above-mentioned sections after welding (I) or cold-forming (2C) were subjected toappropriate heat treatment to reduce the impact of residual stresses. In References [23,34], the influenceof remaining welding stress on the behavior and resistance of welded I-sections was investigated.It was shown that this effect is greatest in the case of axial compression, but in some cases, bendingelements should also be considered. Therefore, the effect of residual stresses on the local buckling ofcontinuous beams with welded I-sections will be described in a separate study.
The beams were under continuous, uniformly distributed load. It was assumed that the elementswere structurally protected against lateral–torsional buckling. In this case, the resistance of the beamdepends on the resistance of the most stressed cross-section.
The relationship between Ms and Mp (Figure 4) in the first span was u = Ms/Mp = 1.351,irrespective of the type of cross-section and the span length. In the support cross-sections of the beam,two-sided stiffening ribs were used to transfer the support reactions without causing distortion of thethin-walled cross-section.
7.2. Welded Section
7.2.1. Calculation of Critical Resistance According to CPM
Detailed calculations were carried out for a five-span continuous beam with a span length L = 4 mand a thin-walled I-section welded from sheets of dimensions I-300×tw×250×tf (I-h×tw×b×tf) for t =
tf = tw = 5, 6, 7, and 8 mm made of S355-grade steel. It should be noted that in this case, adopting asmaller web thickness, i.e., tw < tf, led to a significant reduction in the elastic restraint of the compressedflange in the plate of the web. This resulted in a much greater reduction in the cross-sectional resistancethan that resulting from a reduction in the elastic section modulus caused solely by a reduction in thethickness of tw.
Table 1 shows the results of the calculation of “local” critical moments for the ruling cross-sections:span ML
cr,p, support MLcr,s, and the critical loads qcr determined from them. The symbol qCP
cr,s indicates

Appl. Sci. 2020, 10, 4461 11 of 25
the critical load value determined from the condition of reaching MLcr,s in the support cross-section, and
the symbol qCPcr,p indicates that determined from the condition of reaching ML
cr,p in the span cross-section.(Note: in Table 1, the values of the moments ML
cr,s and MLcr,p are given as absolute values). The critical
resistance of the beam is determined by the minimum load qCPcr,min = min
{qCP
cr,p, qCPcr,s
}.
Table 1. Summary of critical results according to critical plate method (CPM) and European Eurocode3 (EC3) for the I-300×t×250×t section and four wall thickness variants.
Wall Thickness (mm) t= 8 7 6 5
Slenderness λ=b/t= 15.63 17.86 20.83 25.00
Euler stress (N/mm2)Flange σE,i= 778.24 595.84 437.76 304.00
Web σE,i= 135.11 103.44 76.00 52.78
Buckling coefficient for lp: k*= 0.800 0.800 0.800 0.800for ls: k*= 0.950 0.950 0.950 0.950
Critical stress acc. CPM (N/mm2)for lp: σcr,p= 622.60 476.67 350.21 243.20for ls: σcr,s= 739.08 565.86 415.73 288.70
Critical stress acc. EC3 (N/mm2) σcr,0= 334.64 256.21 188.24 130.72
Local critical resistance (kNm)for lp: ML
cr,p= 448.36 300.35 189.13 109.45for ls: ML
cr,s= 532.24 356.54 224.52 129.93MEC3
cr = 240.99 161.44 101.66 58.83
Critical load acc. CPM (kN/m) for lp: qCPcr,p= 359.72 240.97 151.74 87.81
for ls: qCPcr,s= 316.02 211.70 133.31 77.14
Critical load acc. EC3 (kN/m) qEC3cr = 143.09 95.85 60.36 34.93
Percentage increase of resistance (%) qCPcr /qEC3
cr = 120.86 120.86 120.86 120.86
Furthermore, in Table 1, the symbol MEC3cr indicates the critical cross-sectional moment determined
according to σcr calculated according to EC3 [3], and the symbol qEC3cr,min stands for the minimum value
of critical load determined on the basis of MEC3cr . Due to the simplified calculation model used in the
standard, MEC3cr does not depend on the longitudinal stress distribution or on the degree of mutual
elastic restraint of the cross-section component walls. It therefore determines the critical resistance ofboth the span cross-section (p) and the support cross-section (s).
Note: in the example under consideration, determined on the basis of the qCPcr,min parameter h0
according to Equation (6), h0 = 880 mm and was almost three times greater than the cross-sectionheight h = 300 mm. Of course, the determination of the parameter h0 according to Equation (6) wasiterative because the shear stresses τ and τcr depend on the cross-section height, among other things.This check calculation allows the correct identification of the critical plate in a given cross-sectionloading condition to be confirmed.
A comparison of the results in Table 1 shows that MLcr,s was approx. 18.7% higher than ML
cr,p.This was due to different stress distributions and different reliable lengths of the span (lp) and support(ls) segments. Despite the fact that ML
cr,p < MLcr,s, the critical resistance of the beam was determined by
the support zone, because: u = 1.351 > MLcr,s/ML
cr,p = 1.187. The percentage increase of MLcr,s in relation
to MEC3cr was about 121%. The same relationship occurred for the corresponding critical loads qmin
cr .
7.2.2. Finite Element and Finite Strip Analysis
The critical stresses listed in Table 1 (σcr,s, σcr,p) were verified via the finite element method (FEM)using ABAQUS software [35], and the finite strip method (FSM) using CUFSM software [18].
The FEM enables the analysis of local buckling of the extreme span of a continuous beam bytaking into account both the effect of mutual elastic restraint of cross-section’s components plates, aswell as the effect of longitudinal stress variation. However, the commonly used finite strip method(FSM) allows the effect of mutual elastic restraint of cross-section’s component plates to be considered,but with the assumption of a constant stress distribution over the length of the member.

Appl. Sci. 2020, 10, 4461 12 of 25
For the numerical simulations in ABAQUS v. 6.12, the first (extreme) span of a continuous beamwas modeled. Due to the small wall thickness (compared to other dimensions), the cross-section’sgeometry was simplified to so-called centerline. S4R shell elements (four nodes with six degreesof freedom in the node) were used, and the dimensions of the finite element were assumed to be12.5 × 12.5 mm. Such division made it possible to obtain technically sufficient accuracy while reducingcalculation time. The transverse load was applied in the form of uniform pressure (p = 0.1 N/mm2) onthe upper flange with a width of b = 250 mm, which corresponded to a uniform load of q = 25 kN/m.Conversely, the loading with the “corresponding” support moment of the value of Ms = 0.105 × qL2 =
42 kNm (where 0.105 is the coefficient from Winkler’s tables) was performed by means of loading thesupport cross-section with a stress block. The boundary conditions in the support cross-sections wereassumed to be continuous constraints perpendicular to each of the component plate. An additionaltie securing the beam against displacement along the longitudinal axis was applied in the gravityaxis of one of the support sections. In Figure 6b, a general view of FEM model of the I-300×5×250×5cross-section in ABAQUS software is presented. Figure 6 shows the support ties used, and Figure 6cshows the method of loading with the support moment Ms. The critical load calculations wereperformed using the “buckling” procedure.Appl. Sci. 2020, 10, x FOR PEER REVIEW 13 of 25
Figure 6. Finite element method (FEM) model of the I-300×5×250×5 beam: (a) boundary conditions, (b) division into finite elements, (c) method of loading with the support moment.
Figure 7 shows the local buckling mode (axonometric view and side view) corresponding to the first (smallest) eigenvalue of the critical load multiplier (qcr,s =3.121×q = 78.02 kN/m). Maximum local deflections of the cross-section occurred in the support zone.
Figure 7. Local buckling of I-300×5×250×5 beams in the support zone.
Figure 8 shows the local buckling mode (axonometric view and side view) corresponding to the third (second positive) eigenvalue of the critical load multiplier (qcr,p = 3.568×q = 89.21 kN/m). In this case, the maximum local deflections of the cross-section occurred in the span zone.
Figure 6. Finite element method (FEM) model of the I-300×5×250×5 beam: (a) boundary conditions,(b) division into finite elements, (c) method of loading with the support moment.
Figure 7 shows the local buckling mode (axonometric view and side view) corresponding to thefirst (smallest) eigenvalue of the critical load multiplier (qcr,s = 3.121 × q = 78.02 kN/m). Maximumlocal deflections of the cross-section occurred in the support zone.

Appl. Sci. 2020, 10, 4461 13 of 25
Appl. Sci. 2020, 10, x FOR PEER REVIEW 13 of 25
Figure 6. Finite element method (FEM) model of the I-300×5×250×5 beam: (a) boundary conditions, (b) division into finite elements, (c) method of loading with the support moment.
Figure 7 shows the local buckling mode (axonometric view and side view) corresponding to the first (smallest) eigenvalue of the critical load multiplier (qcr,s =3.121×q = 78.02 kN/m). Maximum local deflections of the cross-section occurred in the support zone.
Figure 7. Local buckling of I-300×5×250×5 beams in the support zone.
Figure 8 shows the local buckling mode (axonometric view and side view) corresponding to the third (second positive) eigenvalue of the critical load multiplier (qcr,p = 3.568×q = 89.21 kN/m). In this case, the maximum local deflections of the cross-section occurred in the span zone.
Figure 7. Local buckling of I-300×5×250×5 beams in the support zone.
Figure 8 shows the local buckling mode (axonometric view and side view) corresponding to thethird (second positive) eigenvalue of the critical load multiplier (qcr,p = 3.568 × q = 89.21 kN/m). In thiscase, the maximum local deflections of the cross-section occurred in the span zone.Appl. Sci. 2020, 10, x FOR PEER REVIEW 14 of 25
Figure 8. Local buckling of I-300×5×250×5 beams in the span zone.
For numerical simulations in CUFSM v.5.04, the I-section was also simplified to centerline geometry, and then divided into 48 finite strips (16 per flange and 16 in the web). The load was applied in the form of a stress block, causing bending about the stronger axis of the cross-section.
7.2.3. Comparison of Critical Stress Results
Table 2 compares the values of critical stresses for supporting , and span , sections, determined according to: (1) ABAQUS, (2) CPM, (3) CUFSM, (4) Reference [19], (5) Reference [22], and (6) EC3. It should be emphasised that comparison of stresses determined according to Reference [22] was for reference only, because the formulas derived in Reference [22] apply only to hot-rolled sections, and not to the welded ones.
Table 2. Comparison of critical stresses determined by several methods for the I-300×t×250×t section and four wall thickness variants.
t s/p ABAQUS CPM CUFSM [19] [22] EC3 1 2 3 4 5 6 7
5 s 291.98 288.70 235.53 223.98 191.64 130.72 p 247.16 243.20
6 s 418.32 415.73 339.16 322.53 275.96 188.24 p 355.00 350.21
7 s 566.31 565.86 461.62 439.00 375.59 256.21 p 481.86 476.67
8 s 735.48 739.08 602.92 573.38 490.58 334.64 p 627.53 622.60
From the comparison of the values given in Table 2, it follows that the new calculation model adopted in this work using the critical plate method (CPM) gave very good congruence with the results obtained from the ABAQUS software, which were adopted as a reference. This applied to both the support section (first eigenvalue, compliance approx. 0.99) and the span section (second eigenvalue, congruence approx. 0.985). The calculations obtained from CUFSM also gave very good results in the span section (congruence approx. 0.96), while in the support section, where a large
Figure 8. Local buckling of I-300×5×250×5 beams in the span zone.
For numerical simulations in CUFSM v.5.04, the I-section was also simplified to centerline geometry,and then divided into 48 finite strips (16 per flange and 16 in the web). The load was applied in theform of a stress block, causing bending about the stronger axis of the cross-section.

Appl. Sci. 2020, 10, 4461 14 of 25
7.2.3. Comparison of Critical Stress Results
Table 2 compares the values of critical stresses for supporting σcr,s and span σcr,p sections,determined according to: (1) ABAQUS, (2) CPM, (3) CUFSM, (4) Reference [19], (5) Reference [22], and(6) EC3. It should be emphasised that comparison of stresses determined according to Reference [22]was for reference only, because the formulas derived in Reference [22] apply only to hot-rolled sections,and not to the welded ones.
Table 2. Comparison of critical stresses determined by several methods for the I-300×t×250×t sectionand four wall thickness variants.
t s/p ABAQUS CPM CUFSM [19] [22] EC3
1 2 3 4 5 6 7
5s 291.98 288.70
235.53 223.98 191.64 130.72p 247.16 243.20
6s 418.32 415.73
339.16 322.53 275.96 188.24p 355.00 350.21
7s 566.31 565.86
461.62 439.00 375.59 256.21p 481.86 476.67
8s 735.48 739.08
602.92 573.38 490.58 334.64p 627.53 622.60
From the comparison of the values given in Table 2, it follows that the new calculation modeladopted in this work using the critical plate method (CPM) gave very good congruence with theresults obtained from the ABAQUS software, which were adopted as a reference. This applied toboth the support section (first eigenvalue, compliance approx. 0.99) and the span section (secondeigenvalue, congruence approx. 0.985). The calculations obtained from CUFSM also gave very goodresults in the span section (congruence approx. 0.96), while in the support section, where a largestress gradient occurred, and on which the critical resistance of the beam depends, congruence wasaround 0.81. A similar situation occurred when comparing the results obtained from the formulasaccording to Reference [19] (span section about 0.91, support section about 0.77). However, a worsecongruence of the results obtained according to Reference [22] (span section about 0.78, support sectionabout 0.66) resulted from the different, in relation to hot-rolled sections, geometrical proportions of thesections considered in this study. The largest differences (span section about 0.53, support section about0.45) were obtained from calculations made according to EC3. The local buckling half-wavelengthsdetermined in this case were: (1) according to CPM, Equation (9) lcr = 307 mm; (2) according to CUFSM,lcr= 340 mm; and (3) according to Reference [21] lcr = 353 mm. It should be noted that in this case,the following rule applies: for higher critical stresses, there is a shorter local buckling half-wavelength.
The ompared computational methods showed that very good congruence of results in relationto finite element analysis (ABAQUS) was obtained by the critical plate method (CPM), which takesinto account both effects. Methods that consider the effect of mutual elastic restraint of cross-sectioncomponent plates give a good approximation of critical stresses in those beam zones where there isno significant variation of stresses in the longitudinal direction (e.g., span cross-section). In contrast,calculations according to EC3 are the most conservative, because they omit both effects.
7.2.4. Design Ultimate Resistance
Table 3 shows the design values of the ultimate resistance for the reliable cross-sections: spanMCP
e f f ,p, support MCPe f f ,s, and the design ultimate loads (qe f f ) determined from them according to CPM.
The symbol qCPe f f ,s indicates the ultimate load value determined from the condition of reaching MCP
e f f ,s
in the support cross-section, and the symbol qCPe f f ,p from the conditions needed to achieve MCP
e f f ,p in
the span cross-section. (Note: in Table 3, the values of the moments MCPe f f ,s and MCP
e f f ,p are given
Appl. Sci. 2020, 10, 4461 15 of 25
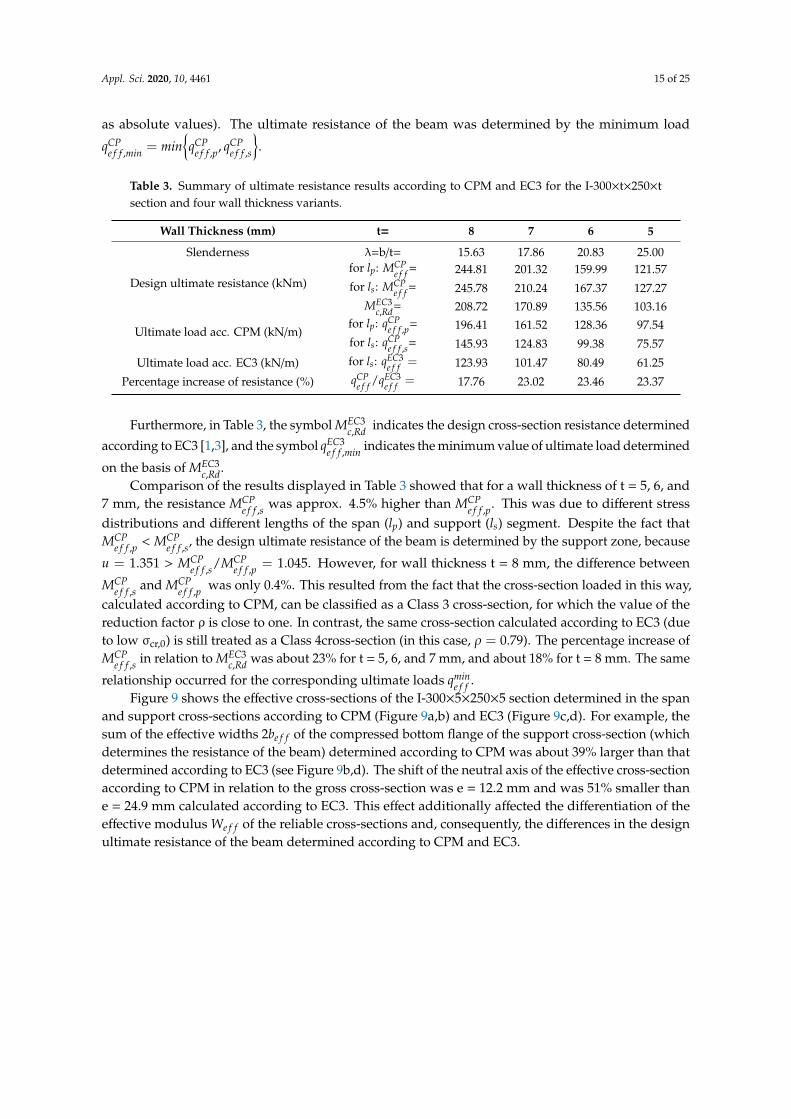
as absolute values). The ultimate resistance of the beam was determined by the minimum load
qCPe f f ,min = min
{qCP
e f f ,p, qCPe f f ,s
}.
Table 3. Summary of ultimate resistance results according to CPM and EC3 for the I-300×t×250×tsection and four wall thickness variants.
Wall Thickness (mm) t= 8 7 6 5
Slenderness λ=b/t= 15.63 17.86 20.83 25.00
Design ultimate resistance (kNm)for lp: MCP
e f f = 244.81 201.32 159.99 121.57for ls: MCP
e f f = 245.78 210.24 167.37 127.27MEC3
c,Rd= 208.72 170.89 135.56 103.16
Ultimate load acc. CPM (kN/m)for lp: qCP
e f f ,p= 196.41 161.52 128.36 97.54for ls: qCP
e f f ,s= 145.93 124.83 99.38 75.57
Ultimate load acc. EC3 (kN/m) for ls: qEC3e f f = 123.93 101.47 80.49 61.25
Percentage increase of resistance (%) qCPe f f /qEC3
e f f = 17.76 23.02 23.46 23.37
Furthermore, in Table 3, the symbol MEC3c,Rd indicates the design cross-section resistance determined
according to EC3 [1,3], and the symbol qEC3e f f ,min indicates the minimum value of ultimate load determined
on the basis of MEC3c,Rd.
Comparison of the results displayed in Table 3 showed that for a wall thickness of t = 5, 6, and7 mm, the resistance MCP
e f f ,s was approx. 4.5% higher than MCPe f f ,p. This was due to different stress
distributions and different lengths of the span (lp) and support (ls) segment. Despite the fact thatMCP
e f f ,p < MCPe f f ,s, the design ultimate resistance of the beam is determined by the support zone, because
u = 1.351 > MCPe f f ,s/MCP
e f f ,p = 1.045. However, for wall thickness t = 8 mm, the difference between
MCPe f f ,s and MCP
e f f ,p was only 0.4%. This resulted from the fact that the cross-section loaded in this way,calculated according to CPM, can be classified as a Class 3 cross-section, for which the value of thereduction factor ρ is close to one. In contrast, the same cross-section calculated according to EC3 (dueto low σcr,0) is still treated as a Class 4cross-section (in this case, ρ = 0.79). The percentage increase ofMCP
e f f ,s in relation to MEC3c,Rd was about 23% for t = 5, 6, and 7 mm, and about 18% for t = 8 mm. The same
relationship occurred for the corresponding ultimate loads qmine f f .
Figure 9 shows the effective cross-sections of the I-300×5×250×5 section determined in the spanand support cross-sections according to CPM (Figure 9a,b) and EC3 (Figure 9c,d). For example, thesum of the effective widths 2be f f of the compressed bottom flange of the support cross-section (whichdetermines the resistance of the beam) determined according to CPM was about 39% larger than thatdetermined according to EC3 (see Figure 9b,d). The shift of the neutral axis of the effective cross-sectionaccording to CPM in relation to the gross cross-section was e = 12.2 mm and was 51% smaller thane = 24.9 mm calculated according to EC3. This effect additionally affected the differentiation of theeffective modulus We f f of the reliable cross-sections and, consequently, the differences in the designultimate resistance of the beam determined according to CPM and EC3.

Appl. Sci. 2020, 10, 4461 16 of 25
Appl. Sci. 2020, 10, x FOR PEER REVIEW 16 of 25
value of the reduction factor ρ is close to one. In contrast, the same cross-section calculated according to EC3 (due to low σcr,0) is still treated as a Class 4cross-section (in this case, = 0.79). The percentage increase of , in relation to , was about 23% for t = 5, 6, and 7 mm, and about 18% for t = 8 mm. The same relationship occurred for the corresponding ultimate loads .
Figure 9 shows the effective cross-sections of the I-300×5×250×5 section determined in the span and support cross-sections according to CPM (Figure 9a,b) and EC3 (Figure 9c,d). For example, the sum of the effective widths 2 of the compressed bottom flange of the support cross-section (which determines the resistance of the beam) determined according to CPM was about 39% larger than that determined according to EC3 (see Figure 9b,d). The shift of the neutral axis of the effective cross-section according to CPM in relation to the gross cross-section was e = 12.2 mm and was 51% smaller than e = 24.9 mm calculated according to EC3. This effect additionally affected the differentiation of the effective modulus of the reliable cross-sections and, consequently, the differences in the design ultimate resistance of the beam determined according to CPM and EC3.
Figure 9. Effective cross-sections of the I-300×5×250×5 section according to CPM and EC3 methods. (a) span cross-section acc. CPM, (b) support cross-section acc. CPM, (c) span cross-section acc. EC3, (d) support cross-section acc. EC3.
7.3. I-Section Consisting of Two Cold-Formed Channel Sections (2C)
For compound sections (type 2C), detailed calculations were made for five-span beams with a constant span length for variants of L = 4, 5, 6, and 7 m made of S355-grade steel. For comparison purposes, the analyzed dimensions of 2C sections (Figure 10) with the contour of Sk250×250×t box sections (for t = 2, 3, 4, and 5 mm) presented in Reference [6] were used. In this case, the elastic gross section bending moduli for Sk and 2C sections were equal.
Figure 10. Compared cross-sections of continuous beams: (a) box cross-section according to Reference [6], (b) compound cross-section type 2C.
Table 4 presents the results of the analysis of the effect of the span length on the “local” critical moment value and the resistance calculated according to CPM and EC3 [1,3] for the 2C-250×250×4 (2C-h×b×t) section. For the support segment decisive of the beam resistance, the difference between the critical load value obtained according to CPM method in relation to EC3
Mpe1
= 1
6.8
CPM EC3
Ms
e1 =
13.
8
Mp
e1 =
27.
1
e1 =
27.
1
Ms
(a) (b) (c) (d)
2beff = 175.8
2beff = 188.5
2beff = 136.8
2beff = 136.8
bf=bs
(a)
bs
h
(b) bf
Figure 9. Effective cross-sections of the I-300×5×250×5 section according to CPM and EC3 methods.(a) span cross-section acc. CPM, (b) support cross-section acc. CPM, (c) span cross-section acc. EC3,(d) support cross-section acc. EC3.
7.3. I-Section Consisting of Two Cold-Formed Channel Sections (2C)
For compound sections (type 2C), detailed calculations were made for five-span beams with aconstant span length for variants of L = 4, 5, 6, and 7 m made of S355-grade steel. For comparisonpurposes, the analyzed dimensions of 2C sections (Figure 10) with the contour of Sk250×250×t boxsections (for t = 2, 3, 4, and 5 mm) presented in Reference [6] were used. In this case, the elastic grosssection bending moduli Wel for Sk and 2C sections were equal.
Appl. Sci. 2020, 10, x FOR PEER REVIEW 16 of 25
value of the reduction factor ρ is close to one. In contrast, the same cross-section calculated according to EC3 (due to low σcr,0) is still treated as a Class 4cross-section (in this case, = 0.79). The percentage increase of , in relation to , was about 23% for t = 5, 6, and 7 mm, and about 18% for t = 8 mm. The same relationship occurred for the corresponding ultimate loads .
Figure 9 shows the effective cross-sections of the I-300×5×250×5 section determined in the span and support cross-sections according to CPM (Figure 9a,b) and EC3 (Figure 9c,d). For example, the sum of the effective widths 2 of the compressed bottom flange of the support cross-section (which determines the resistance of the beam) determined according to CPM was about 39% larger than that determined according to EC3 (see Figure 9b,d). The shift of the neutral axis of the effective cross-section according to CPM in relation to the gross cross-section was e = 12.2 mm and was 51% smaller than e = 24.9 mm calculated according to EC3. This effect additionally affected the differentiation of the effective modulus of the reliable cross-sections and, consequently, the differences in the design ultimate resistance of the beam determined according to CPM and EC3.
Figure 9. Effective cross-sections of the I-300×5×250×5 section according to CPM and EC3 methods. (a) span cross-section acc. CPM, (b) support cross-section acc. CPM, (c) span cross-section acc. EC3, (d) support cross-section acc. EC3.
7.3. I-Section Consisting of Two Cold-Formed Channel Sections (2C)
For compound sections (type 2C), detailed calculations were made for five-span beams with a constant span length for variants of L = 4, 5, 6, and 7 m made of S355-grade steel. For comparison purposes, the analyzed dimensions of 2C sections (Figure 10) with the contour of Sk250×250×t box sections (for t = 2, 3, 4, and 5 mm) presented in Reference [6] were used. In this case, the elastic gross section bending moduli for Sk and 2C sections were equal.
Figure 10. Compared cross-sections of continuous beams: (a) box cross-section according to Reference [6], (b) compound cross-section type 2C.
Table 4 presents the results of the analysis of the effect of the span length on the “local” critical moment value and the resistance calculated according to CPM and EC3 [1,3] for the 2C-250×250×4 (2C-h×b×t) section. For the support segment decisive of the beam resistance, the difference between the critical load value obtained according to CPM method in relation to EC3
Mpe1
= 1
6.8
CPM EC3
Ms
e1 =
13.
8
Mp
e1 =
27.
1
e1 =
27.
1
Ms
(a) (b) (c) (d)
2beff = 175.8
2beff = 188.5
2beff = 136.8
2beff = 136.8
bf=bs
(a)
bs
h
(b) bf
Figure 10. Compared cross-sections of continuous beams: (a) box cross-section according toReference [6], (b) compound cross-section type 2C.
Table 4 presents the results of the analysis of the effect of the span length on the “local” criticalmoment value ML
cr and the resistance Me f f calculated according to CPM and EC3 [1,3] for the2C-250×250×4 (2C-h×b×t) section. For the support segment decisive of the beam resistance, thedifference between the critical load value qcr obtained according to CPM method in relation to EC3ranged from + 158% for L = 4 m up to + 141% for L = 7 m. The difference between the load ultimatevalue qe f f ranged from + 22% for L = 4 m up to +20% for L = 7 m.

Appl. Sci. 2020, 10, 4461 17 of 25
Table 4. Summary of results according to CPM and EC3 for the 2C-250×250×4 section and fourspan-length range variants.
Span Length (m) L = 4 5 6 7
Slenderness λ=b/t= 30.25
Euler stress (N/mm2)flange σE,i = 207.64web σE,i = 50.23
Length of ranges (m) lp= 1600 2000 2400 2800ls= 843 1050 1263 1474
Buckling coefficient for lp: k*= 0.94 0.93 0.92 0.92for ls: k*= 1.11 1.08 1.05 1.04
Critical stress acc. to CPM(N/mm2)
for lp: σcr,s= 195.42 193.34 191.98 191.03for ls: σcr,s= 230.47 223.70 218.80 215.20
Critical stress acc. to EC3(N/mm2) σcr,0= 89.28
“Local” critical resistance(kNm)
for lp: MLcr,p= 64.13 63.45 63.00 62.69
for ls: MLcr,s= 75.63 73.41 71.80 70.62
MEC3cr = 29.30
Critical load acc. to CPM(kN/m)
for lp: qCPcr,p= 51.45 32.58 22.47 16.42
for ls: qCPcr,s= 44.91 27.90 18.95 13.69
Critical load acc. to EC3(kN/m) qEC3
cr = 17.40 11.13 7.73 5.68
Percentage increment ofresistance (%) qCP
cr /qEC3cr = 158.13 150.54 145.06 141.03
Design ultimate resistance(kNm)
for lp: MCPe f f = 89.15 88.94 88.80 88.71
for ls: MCPe f f = 92.43 91.82 91.38 91.04
MEC3c,Rd = 75.77
Ultimate load acc. to CPM(kN/m)
for lp: qCPe f f ,p= 71.52 45.67 31.67 23.24
for ls: qCPe f f ,s= 54.88 34.89 24.11 17.65
Ultimate load acc. to EC3(kN/m)
for ls: qEC3e f f = 44.99 28.79 19.99 14.69
Percentage increase ofresistance (%)
qCPe f f /qEC3
e f f = 21.99 21.19 20.60 20.16
Note: for comparison, Table 4 also includes the values of qcr and qe f f determined according toCPM for the case where the resistance of the beam is decided by the span section. This would be thecase, for example, in protection against local buckling of the support segment.
Table 5 compares the “local” critical resistances (MLcr, qcr) of beams with box Sk250×250×4 sections
according to Reference [6] and 2C-250×250×4 compound I-sections depending on the span length ofthe continuous beam (L = 4, 5, 6, and 7 m).
Comparison of the values presented in Table 5 shows that for 2C sections, where critical resistanceis determined by cantilever walls, “local” critical moments ML
cr determined according to CPM werelower on average by about 25–26% in relation to corresponding box sections [6], and the reductionMEC3
cr was as much as 54%. The same relationship occurred when comparing the respective criticalloads qcr. Meanwhile, the relation qCP
cr /qEC3cr for 2C sections in relation to Sk sections increased by as
much as 62%. This effect resulted from a much larger reserve of the critical resistance of the elasticallyrestrained cantilever plate (which determines the resistance of the 2C section) in relation to the internalplate of the compression flange, which in turn determines the resistance of the box section. In fact, thisis the difference between the critical stresses for the plates (cantilever and internal) that are simplysupported in relation to the same plates that are elastically restrained at one or two edges, respectively.For comparison, the relation between the buckling coefficient for the compressed cantilever plate whenfully restrained (ku = 1.25 [7,19]) and simply supported (kp = 0.43 [3]) was ku/kp = 1.25/0.43 = 2.91.For an internal plate, on the other hand, the same relation was much smaller and was ku/kp= 6.97/4 =

Appl. Sci. 2020, 10, 4461 18 of 25
1.74. Of course, this does not change the fact that the critical and ultimate resistance of an internalplate is much higher than that of a cantilever plate with the same geometrical and material parameters.
Table 5. Comparison of “local” critical resistances of box sections (Sk) and compound I-sections (2C)depending on the span length.
L (m) MLcr,p ML
cr,s MEC3cr qCP
cr,s qEC3cr,s qCP
cr,s/qEC3cr
4SK 87.09 101.27 63.85 60.13 37.91 1.592C 64.13 75.63 29.30 44.91 17.40 2.58% −26.36 −25.32 −54.11 −25.32 −54.11 62.74
5SK 86.32 98.61 63.85 37.47 24.26 1.542C 63.45 73.41 29.30 27.90 11.13 2.51% −26.49 −25.55 −54.11 −25.55 −54.11 62.23
6SK 85.81 96.74 63.85 25.53 16.85 1.522C 63.00 71.80 29.30 18.95 7.73 2.45% −26.58 −25.78 −54.11 −25.78 −54.11 61.75
7SK 85.45 95.33 63.85 18.48 12.38 1.492C 62.69 70.62 29.30 13.69 5.68 2.41% −26.63 −25.92 −54.11 −25.92 −54.11 61.43
In turn, Table 6 compares the design ultimate resistances (MCPe f f , qCP
e f f ) of the same box sectionbeams [6] and 2C compound I-sections, also depending on the span length. For the 2C sections, thedesign ultimate resistances MCP
e f f determined according to CPM were on average 4–5% lower than the
corresponding box sections. The reduction, however, of MEC3e f f was nearly 14%. The same relationship
occurred when comparing the respective ultimate loads qe f f . In this case, the relation qCPe f f /qEC3
e f f for the2C sections in relation to Sk sections increased by 11%.
Table 6. Comparison of design ultimate resistances of box sections (Sk) and I-sections (2C) dependingon the span length.
L (m) MCPeff,p MCP
eff,s MEC3c,Rd
qCPeff,s qEC3
eff qCPeff,s/q
EC3eff
4SK 93.62 96.59 87.79 57.35 52.13 1.102C 89.15 92.43 75.77 54.88 44.99 1.22% −4.78 −4.31 −13.69 −4.31 −13.70 10.88
5SK 93.45 96.06 87.79 36.50 33.35 1.092C 88.94 91.82 75.77 34.89 28.79 1.21% −4.83 −4.41 −13.69 −4.41 −13.68 10.73
6SK 93.33 95.68 87.79 25.25 23.17 1.092C 88.80 91.38 75.77 24.11 19.99 1.21% −4.86 −4.50 −13.69 −4.50 −13.70 10.66
7SK 93.25 95.39 87.79 18.49 17.02 1.092C 88.71 91.04 75.77 17.65 14.69 1.20% −4.87 −4.56 −13.69 −4.56 −13.69 10.58
Table 7 presents the results of the analysis of the slenderness effect (bs/t) of the compressedcantilever wall of 2C section on the value of “local” critical moment ML
cr and the design ultimateresistance Me f f determined according to CPM and EC3. The calculations were made for a continuousbeam with a span length of L = 4 m. With the reduction of section wall thickness, the critical load qcr
decreased, whereby the difference between the results obtained according to CPM and EC3 was about+158% regardless of the slenderness of the critical plate. The reduction in thickness also reduced thedesign ultimate resistance Me f f and the ultimate load qe f f , whereby the difference between the resultsaccording to CPM and EC3 was about +23% for t = 5 mm and about +16% for t = 2 mm.

Appl. Sci. 2020, 10, 4461 19 of 25
Table 7. Summary of results according to CPM and EC3 for the 2C-250×250×t section and four wallthickness variants.
Wall Thickness (mm) t = 5 4 3 2
Slenderness λ=b/t= 24.00 30.25 40.67 61.50
Euler stress (N/mm2)plate σE,i= 329.86 207.64 114.89 50.23web σE,i= 79.13 50.23 28.03 12.36
Buckling coefficient for lp: k*= 0.94 0.94 0.94 0.94for ls: k*= 1.11 1.11 1.11 1.11
Critical stress acc. to CPM (N/mm2)for lp: σcr,s= 310.46 195.42 108.13 47.28for ls: σcr,s= 366.13 230.47 127.52 55.76
Critical stress acc. to EC3 (N/mm2) σcr,0= 141.84 89.28 49.40 21.60
“Local” critical resistance (kNm)for lp: ML
cr,p= 126.49 64.13 26.80 7.86for ls: ML
cr,s= 149.17 75.63 31.60 9.28MEC3
cr = 57.79 29.30 12.24 3.59
Critical load acc. to CPM (kN/m) for lp: qCPcr,p= 101.49 51.45 21.50 6.31
for ls: qCPcr,s= 88.57 44.91 18.76 5.51
Critical load acc. to EC3 (kN/m) qEC3cr = 34.31 17.40 7.27 2.13
Percentage increment of resistance (%) qCPcr /qEC3
cr = 158.13
Design ultimate resistance (kNm)for lp: MCP
e f f = 122.56 89.15 59.47 34.28for ls: MCP
e f f = 127.15 92.43 61.51 35.26MEC3
c,Rd = 103.28 75.77 51.38 30.43
Ultimate load acc. to CPM (kN/m)for lp: qCP
e f f ,p= 98.33 71.52 47.72 27.50for ls: qCP
e f f ,s= 75.50 54.88 36.52 20.94
Ultimate load acc. to EC3 (kN/m) for ls: qEC3e f f = 61.32 44.99 30.51 18.07
Percentage increment of resistance (%) qCPe f f /qEC3
e f f = 23.12 21.99 19.71 15.87
Note: for comparison, Table 7 also includes the values of qcr and qe f f determined according toCPM for the case where the resistance of the beam is decided by the span section. This would be thecase, for example, in protection against local buckling of the support segment.
Table 8 compares the “local” critical resistances (MLcr, qcr) of beams with box sections [6] and
compound I-sections (2C) depending on the wall thickness (t = 5, 4, 3, and 2 mm).
Table 8. Comparison of “local” critical resistances of box sections (Sk) and compound I-sections (2C)depending on the wall thickness.
t (mm) MLcr,p ML
cr,s MEC3cr qCP
cr,s qEC3cr,s qCP
cr,s/qEC3cr
5SK 169.45 197.05 124.23 117.00 73.76 1.592C 126.49 149.17 57.79 88.57 34.31 2.58% −25.35 −24.29 −53.48 −24.29 −53.48 62.74
4SK 87.09 101.27 63.85 60.13 37.91 1.592C 64.13 75.63 29.30 44.91 17.40 2.58% −26.36 −25.32 −54.11 −25.32 −54.11 62.74
3SK 36.88 42.89 27.04 25.46 16.05 1.592C 26.80 31.60 12.24 18.76 7.27 2.58% −27.34 −26.32 −54.72 −26.32 −54.72 62.74
2SK 10.97 12.76 8.04 7.57 4.78 1.592C 7.86 9.28 3.59 5.51 2.13 2.58% −28.31 −27.29 −55.32 −27.29 −55.32 62.74
Comparison of the values presented in Table 8 shows that for 2C sections, where critical resistanceis determined by cantilever walls, “local” critical moments ML
cr,s determined according to CPM werelower in relation to corresponding box sections by approx. 24.3% for t = 5 mm, up to 27.3% for t =
2 mm. For MLcr,p, the differences ranged from 25.4% for t = 5 mm to 28.3% for t = 2 mm. For MEC3
cr ,

Appl. Sci. 2020, 10, 4461 20 of 25
the reduction was 53.5% for t = 5 mm to 55.3% for t = 2 mm. The same relationship occurred whencomparing the respective critical loads qcr. In this case, the relation qCP
cr /qEC3cr for 2C sections in relation
to Sk box sections increased by 62.7%.In turn, Table 9 compares the design ultimate resistances (MCP
e f f , qCPe f f ) of the same beams with
box sections Sk according to Reference [6] and compound I-sections (2C), also depending on the wallthickness. For 2C sections, the design ultimate resistances MCP
e f f ,s determined according to CPM, inrelation to the corresponding box sections Sk, were reduced by 3.1% for t = 5 mm to 5% for t = 2mm. For MCP
e f f ,p the differences ranged from 3.8% for t = 5 mm to 5.1% for t = 2 mm. In contrast,
the reduction in MEC3e f f ranged from 13.6% for t = 5 mm to 11% for t = 2 mm. The same relationship
occurred when comparing the respective ultimate loads qe f f . In this case, the relation qCPcr /qEC3
cr for 2Csections in relation to Sk box sections increased from 6.9% for t = 2 mm to 12.2% for t = 5 mm
Table 9. Comparison of design ultimate resistances of box sections (Sk) and I-sections (2C) dependingon wall thickness.
t (mm) MCPeff,p MCP
eff,s MEC3c,Rd
qCPeff,s qEC3
eff qCPeff,s/q
EC3eff
5SK 127.41 131.27 119.58 77.94 71.00 1.102C 122.56 127.15 103.28 75.50 61.32 1.23% −3.80 −3.14 −13.64 −3.14 −13.64 12.16
4SK 93.62 96.59 87.79 57.35 52.12 1.102C 89.15 92.43 75.77 54.88 44.99 1.22% −4.78 −4.31 −13.69 −4.31 −13.69 10.87
3SK 62.80 64.75 59.05 38.45 35.06 1.102C 59.47 61.51 51.38 36.52 30.51 1.20% −5.29 −5.01 −12.98 −5.01 −12.98 9.16
2SK 36.12 37.11 34.24 22.04 20.33 1.082C 34.28 35.26 30.43 20.94 18.07 1.16% −5.10 −4.99 −11.12 −4.99 −11.13 6.91
Figure 11 shows the relation between the “local” critical moment Mcr,s (Figure 11a) and the designultimate resistance Me f f (Figure 11b) as a function of slenderness λCP = bs/t of the critical cantileverplate of a compound I-section (2C).
Comparison of the graphs shown in Figure 11a showed that the “local” critical resistance and thedesign ultimate resistance decreased non-linearly with increasing slenderness of the cross-section wall.The difference between the value Mcr,s determined by the CPM method and the standard approachaccording to EC3 was constant in each case of wall thickness and was +158.1%. In contrast, the decreaseof Me f f (Figure 11b) was mildly non-linear. The percentage increase of the ultimate resistance accordingto CPM in relation to EC3 was basically directly proportional to the increase of the cross-section wallthickness from about 16% for t = 2 mm (λCP = 61.5) to about 23% for t = 5 mm (λCP = 24).
The relation between the critical load qcr (Figure 12a) and the ultimate load qe f f (Figure 12b) as afunction of the span length is shown in Figure 12.

Appl. Sci. 2020, 10, 4461 21 of 25Appl. Sci. 2020, 10, x FOR PEER REVIEW 21 of 25
(a)
(b)
Figure 11. Graphs of (a) , and (b) as a function of slenderness .
(a)
0.000
20.000
40.000
60.000
80.000
100.000
120.000
140.000
24.00 30.25 40.67 61.50
Mcr
(kN
m)
λ
Mcr,L,s
Mcr,EC3
30.000
50.000
70.000
90.000
110.000
130.000
150.000
24.00 30.25 40.67 61.50
Mef
f (k
Nm)
λ
Meff,CP,s
Meff,EC3
4.000
9.000
14.000
19.000
24.000
29.000
34.000
39.000
44.000
49.000
4 5 6 7
qcr (
kN/m
)
L(m)
qcr,CP,s
qcr,EC3 s
Figure 11. Graphs of (a) Mcr,s and (b) Me f f as a function of slenderness λCP.
Comparison of the graphs shown in Figure 12 showed that an increase in the span length caused anon-linear decrease both in qcr,s and qe f f . Moreover, it can be stated that the shorter the span, the greaterthe percentage increase of the critical resistance determined according to CPM in relation to EC3 (from158% for short beams L = 4 m, to 141% for long beams L = 7 m). For ultimate resistance (Figure 12b),the differences in results ranged from 22% for L = 4 m to about 20% for L = 7 m, respectively).
Appl. Sci. 2020, 10, x FOR PEER REVIEW 21 of 25
(a)
(b)
Figure 11. Graphs of (a) , and (b) as a function of slenderness .
(a)
0.000
20.000
40.000
60.000
80.000
100.000
120.000
140.000
24.00 30.25 40.67 61.50
Mcr
(kN
m)
λ
Mcr,L,s
Mcr,EC3
30.000
50.000
70.000
90.000
110.000
130.000
150.000
24.00 30.25 40.67 61.50
Mef
f (k
Nm)
λ
Meff,CP,s
Meff,EC3
4.000
9.000
14.000
19.000
24.000
29.000
34.000
39.000
44.000
49.000
4 5 6 7
qcr (
kN/m
)
L(m)
qcr,CP,s
qcr,EC3 s
Figure 12. Cont.

Appl. Sci. 2020, 10, 4461 22 of 25Appl. Sci. 2020, 10, x FOR PEER REVIEW 22 of 25
(b)
Figure 12. Graphs of (a) , and (b) as a function of length .
Comparison of the graphs shown in Figure 12 showed that an increase in the span length caused a non-linear decrease both in , and . Moreover, it can be stated that the shorter the span, the greater the percentage increase of the critical resistance determined according to CPM in relation to EC3 (from 158% for short beams L = 4 m, to 141% for long beams L = 7 m). For ultimate resistance (Figure 12b), the differences in results ranged from 22% for L = 4 m to about 20% for L = 7 m, respectively).
8. Summary and Conclusions
The new calculation model presented in this paper for the local stability loss of the first continuous beam span, consisting of separate local buckling analysis for the span segment (loaded with a non-linear “convex” bending moment distribution) and the support segment (in which the "concave" moment distribution was approximated by a linear distribution) was successfully verified by numerical simulations using the finite element method.
To improve the accuracy of the calculation of the critical resistance of a continuous beam with a Class 4 cross-section (in which large stress gradients in the longitudinal direction are found), it was necessary to take into account both the effect of the mutual elastic restraint of the cross-section component plates, and the longitudinal stress variation.
The use of the critical plate method (CPM) according to Reference [10] to determine the “local” critical resistance and the design ultimate resistance of a thin-walled I-section led to a more optimal design of such elements. In this method, a more accurate calculation model is used, which takes into account both the effect of mutual elastic restraint of the cross-section component plates and the effect of longitudinal stress variation. The increase in the resistance that occurs in this case, compared to the EC3 calculation, results from a more faithful representation of the behavior of the thin-walled structural member in the engineering calculation model.
At the same time, it should be noted that taking into account the above effects has only a minor impact on the complexity of calculations, which can be easily algorithmized and presented as relatively simple spreadsheets. This is due, among other things, to the simplified identification of the so-called critical plate and the definition of the so-called “zero” cross-sections [10]. Such assumptions allow for a slightly conservative assessment of the cross-section resistance. In this sense, the CPM can be used both for preliminary design or verification of FEM calculations and, in many technically important cases, for basic design.
The “local” critical resistance defines the range of pre-critical behavior of a section and constitutes the limit of validity of the thin-walled bar theory with a rigid cross-section contour (the Vlasov theory), assuming unlimited elasticity of the material.
To determine the design ultimate resistance of a thin-walled cross-section, the effective width method applied to the individual plates can be used along with the additional assumptions
12.000
17.000
22.000
27.000
32.000
37.000
42.000
47.000
52.000
57.000
4 5 6 7
qeff
(kN/
m)
L(m)
qeff,CP,s
qeff,EC3 s
Figure 12. Graphs of (a) qcr,s and (b) qe f f as a function of length L.
8. Summary and Conclusions
The new calculation model presented in this paper for the local stability loss of the first continuousbeam span, consisting of separate local buckling analysis for the span segment (loaded with anon-linear “convex” bending moment distribution) and the support segment (in which the “concave”moment distribution was approximated by a linear distribution) was successfully verified by numericalsimulations using the finite element method.
To improve the accuracy of the calculation of the critical resistance of a continuous beam with aClass 4 cross-section (in which large stress gradients in the longitudinal direction are found), it wasnecessary to take into account both the effect of the mutual elastic restraint of the cross-sectioncomponent plates, and the longitudinal stress variation.
The use of the critical plate method (CPM) according to Reference [10] to determine the “local”critical resistance and the design ultimate resistance of a thin-walled I-section led to a more optimaldesign of such elements. In this method, a more accurate calculation model is used, which takes intoaccount both the effect of mutual elastic restraint of the cross-section component plates and the effectof longitudinal stress variation. The increase in the resistance that occurs in this case, compared tothe EC3 calculation, results from a more faithful representation of the behavior of the thin-walledstructural member in the engineering calculation model.
At the same time, it should be noted that taking into account the above effects has only a minorimpact on the complexity of calculations, which can be easily algorithmized and presented as relativelysimple spreadsheets. This is due, among other things, to the simplified identification of the so-calledcritical plate and the definition of the so-called “zero” cross-sections [10]. Such assumptions allow fora slightly conservative assessment of the cross-section resistance. In this sense, the CPM can be usedboth for preliminary design or verification of FEM calculations and, in many technically importantcases, for basic design.
The “local” critical resistance defines the range of pre-critical behavior of a section and constitutesthe limit of validity of the thin-walled bar theory with a rigid cross-section contour (the Vlasov theory),assuming unlimited elasticity of the material.
To determine the design ultimate resistance of a thin-walled cross-section, the effective widthmethod applied to the individual plates can be used along with the additional assumptions formulatedin Section 5, Step 12. The relative slenderness of the component plates is determined from the respectivecritical stresses. For CP, these are stresses determined by taking into account the restraint coefficientand longitudinal stress variation. For the RP, simple support and a constant stress distribution alongthe length can be assumed on the same edge. Such assumptions allow for a technically precise andsufficient calculation of the resistance of a thin-walled cross-section.
Appl. Sci. 2020, 10, 4461 23 of 25
In the case of a continuous beam under uniform load, the segment that determines the resistanceof the structure is the support segment (Ms) of the first span, where the “local” critical resistance is firstachieved, followed by the design ultimate resistance.
For the analyzed continuous beam made of a welded section I-300×5×250×5 and calculatedaccording to CPM (Section 7.2), a 121% increase in the critical resistance qcr was determined, whichtranslated into a 23% increase in the design ultimate resistance qe f f in relation to the calculations doneaccording to EC3.
In the case of the same continuous beam but made of a compound section 2C-250×250×4 andcalculated according to CPM, there was a 158% increase in the critical resistance qcr, which translatedinto a 22% increase in the design ultimate resistance qe f f in relation to the calculations done accordingto EC3.
The comparison of the resistance parameters of continuous beams with box sections Sk accordingto Reference [6] and the compound sections 2C compatible with them showed that in the calculationaccording to CPM, the percentage differences (to the disadvantage of open sections 2C) were as follows:(1) for critical resistance qcr from about 24% to 27% (more than 53% according to EC3), (2) for designultimate resistance qe f f only from 3 to 5%, but according to EC3, more than 13%. In this case, the use ofCPM gave greater possibility to use the resistance reserve of the so-called “non-zero” cross-sections, inwhich the effect of mutual elastic restraint of cross-section component plates can be applied.
The advantage of 2C sections over box sections (assuming that the beam is protected againstlateral buckling) is the greater ease of constructing joints and assembly nodes due to free and two-sidedaccess to mechanical connectors (e.g., bolts). In the case of beams sensitive to lateral buckling, on theother hand, the use of closed cross-sections is more optimal due to their much higher torsional stiffnesscompared to open cross-sections.
If there are significant residual stresses (compressive) in a thin-walled cross-section, the criticalstress of local buckling is reduced. This applies especially to axially compressed welded sections [34,35].Therefore, further testing of welded components with a high proportion of residual stresses must takeinto account their adverse effects on local buckling of the cross-sections.
In open cold-formed sections (produced without welding), however, the adverse effect of residualstresses caused by bending is usually insignificant [36] and can be omitted in most cases (this effect isfurther reduced by the beneficial effect of increasing the strength of steel in cold-formed corners).
Beams with thin-walled I-sections, for which the ultimate resistance is determined by localbuckling of the bent and shear web, and continuous beams with reinforced end spans will be subject tofurther study by the authors.
Author Contributions: Introduction was prepared by A.S. Mathematical description were written by A.S., K.B.Results were obtained by K.B., A.S. The analysis of the results and conclusions was written by A.S. All authorshave read and agreed to the published version of the manuscript.
Funding: This research received no external funding.
Conflicts of Interest: The authors declare no conflict of interest.
References
1. EN 1993-1-1, Eurocode 3: Design of Steel Structures—Part 1-1: General Rules and Rules for Buildings; EuropeanCommittee for Standardization: Brussels, Belgium, 2005.
2. EN 1993-1-3, Eurocode 3: Design of Steel Structures—Part 1-3: General rules—Supplementary Rules for Cold-FormedMembers and Sheeting; European Committee for Standardization: Brussels, Belgium, 2006.
3. EN 1993-1-5, Eurocode 3: Design of Steel Structures—Part 1-5: Plated Structural Elements; European Committeefor Standardization: Brussels, Belgium, 2006.
4. Szychowski, A. A theoretical analysis of the local buckling in thin-walled bars with open cross-sectionsubjected to warping torsion. Thin-Walled Struct. 2014, 76, 42–55. [CrossRef]
5. Kowal, Z.; Szychowski, A. Experimental determination of critical loads in thin-walled bars with Z-sectionsubjected to warping torsion. Thin-Walled Struct. 2014, 75, 87–102. [CrossRef]

Appl. Sci. 2020, 10, 4461 24 of 25
6. Brzezinska, K.; Szychowski, A. Stability and resistance of steel continuous beams with thin-walled boxsections. Arch. Civ. Eng. 2018, 64, 123–143. [CrossRef]
7. Bulson, P.S. The Stability of Flat Plates; Chatto and Windus: London, UK, 1970.8. Yu, C.; Schafer, B.W. Effect of longitudinal stress gradient on the ultimate strength of thin plates.
Thin-Walled Struct. 2006, 44, 787–799. [CrossRef]9. Hancock, G.J. Cold-formed steel structures. J. Constr. Steel Res. 2003, 58, 473–487. [CrossRef]10. Szychowski, A. Computation of thin-walled cross-section resistance to local buckling with the use of the
Critical Plate Method. Arch. Civ. Eng. 2016, 62, 229–264. [CrossRef]11. Jakubowski, S. The matrix analysis of stability and free vibrations of walls of thin-walled girders. Arch.
Budowy Masz. 1986, XXXIII, 357–376. (In Polish)12. Rusch, A.; Lindner, J. Load carrying capacity of thin-walled I-sections subjected to bending about the z-axis
(in German). Stahlbau 1999, 68, 457–467. [CrossRef]13. Beale, R.G.; Godley, M.H.R.; Enjily, V. A theoretical and experimental investigation into cold-formed channel
sections in bending with the unstiffened flanges in compression. Comput. Struct. 2001, 79, 2403–2411.[CrossRef]
14. Kotełko, M.; Lim, T.H.; Rhodes, J. Post—Failure behaviour of box section beams under pure bending (anexperimental study). Thin-Walled Struct. 2000, 38, 179–194.
15. Jakubowski, S. Buckling of thin-walled girders under compound load. Thin-Walled Struct. 1988, 6, 129–150.[CrossRef]
16. Nassar, G. Das Ausbeulen dünnwandiger Querschnitte unter einachsig aussermittiger Druckbeanspruchung.Der Stahlbau H 1965, 10, 311–316.
17. Papangelis, J.P.; Hancock, G.J. Computer analysis of thin-walled structural members. Comput. Struct. 1995,56, 157–176. [CrossRef]
18. Schafer, B.W.; Ádány, S. Buckling analysis of cold-formed steel members using CUFSM: Conventional andconstrained finite strip methods. In Proceedings of the Eighteenth International Specialty Conference onCold-Formed Steel Structures, Orlando, FL, USA, 26–27 October 2006.
19. Gardner, L.; Fieber, A.; Macorini, L. Formulae for calculating elastic local buckling stresses of full structuralcross-sections. Structures 2019, 17, 2–20. [CrossRef]
20. Ciesielczyk, K.; Rzeszut, K. Locla and distortional buckling of axially loaded cold rolled sigma profiles.Acta Mech. et Autom. 2016, 10, 218–222. [CrossRef]
21. Fieber, A.; Gardner, L.; Macorini, L. Formulae for determining elastic local buckling half-wavelengths ofstructural steel cross-sections. J. Constr. Steel Res. 2019, 159, 493–506. [CrossRef]
22. Seif, M.; Schafer, B.W. Local buckling of structural steel shapes. J. Constr. Steel Res. 2010, 66, 1232–1247.[CrossRef]
23. Couto, C.; Vila Real, P. Numerical investigation on the influence of imperfections in the local buckling ofthin-walled I-shaped sections. Thin-Walled Struct. 2019, 135, 89–108. [CrossRef]
24. Yu, C.; Schafer, B.W. Effect of longitudinal stress gradients on elastic buckling of thin plates. J. Eng. Mech. ASCE2007, 133, 452–463. [CrossRef]
25. Szychowski, A. The stability of eccentrically compressed thin plates with a longitudinal free edge and withstress variation in the longitudinal direction. Thin-Walled Struct. 2008, 46, 494–505. [CrossRef]
26. Szychowski, A. Stability of cantilever walls of steel thin-walled bars with open cross-section.Thin-Walled Struct. 2015, 94, 348–358. [CrossRef]
27. Szychowski, A. Local buckling of cantilever wall of thin-walled member with longitudinal and transversestress variation. Bud. i Archit. 2015, 14, 113–121. (In Polish) [CrossRef]
28. Szychowski, A. Stability of eccentrically compressed cantilever wall of a thin-walled member. JCEEA 2015,XXXII, 439–457. (In Polish) [CrossRef]
29. Kotełko, M. Thin-Walled Structures Resistance and Failure Mechanisms; Wydawnictwa Naukowo –Techniczne:Warsaw, Poland, 2011. (In Polish)
30. Kotełko, M. Thin-walled profiles with edge stiffeners as energy absorbers. Thin-Walled Struct. Elsevier 2007,45, 872–876.
31. Kalyanaraman, V. Local buckling of cold-formed steel members. J. Struct. Div. 1979, 105, 813–828.32. Li, L.-Y.; Chen, J.-K. An analytical model for analyzing distortional buckling of cold-formed steel sections.
Thin-Walled Struct. 2008, 46, 1430–1436. [CrossRef]

Appl. Sci. 2020, 10, 4461 25 of 25
33. Kowal, Z. The Stability of Compressed Flange of Plate Girder with a Box Cross-Section; Zeszyty NaukowePolitechniki Wrocławskiej: Budownictwo, Poland, 1965; pp. 73–85. (In Polish)
34. Rykaluk, K. Residual Welding Stresses in Chosen Ultimate Bearing Capacity; Scientific Papers of the Institute ofBuilding Engineering of Wroclaw Technical University, No 29, Series: Monographs No 11; Wroclaw TechnicalUniversity: Wroclaw, Poland, 1981. (In Polish)
35. Hibbitt, Karlsson & Sorensen Inc. 2000 ABAQUS/CAE User’s Manual; Hibbitt, Karlsson & Sorensen: Pawtucket,RI, USA, 2000.
36. Ignatowicz, R.L. The Theoretical and Experimental Analysis of Resistance of the Cold-Formed Steel Columnswith Box cross-Section. Ph.D. Thesis, Instytut Budownictwa Politechniki Wrocławskiej, Series PRE 52/99.Wrocław University of Science and Technology, Wroclaw, Poland, 1999. (In Polish).
© 2020 by the authors. Licensee MDPI, Basel, Switzerland. This article is an open accessarticle distributed under the terms and conditions of the Creative Commons Attribution(CC BY) license (http://creativecommons.org/licenses/by/4.0/).
![Sidesway Web Buckling of Steel Beams[1]](https://static.fdocuments.in/doc/165x107/55cf92b2550346f57b98d6e6/sidesway-web-buckling-of-steel-beams1.jpg)