
Local Alcohol Profiles for England (LAPE); methodological review … · Local Alcohol Profiles for...
47
Local Alcohol Profiles for England (LAPE); methodological review of the crime indicators
Transcript of Local Alcohol Profiles for England (LAPE); methodological review … · Local Alcohol Profiles for...

Local Alcohol Profiles for England (LAPE); methodological review of the crime indicators
Alcohol-related crime indicators
1
About Public Health England
Public Health England exists to protect and improve the nation’s health and wellbeing, and reduce health inequalities. We do this through world-class science, knowledge and intelligence, advocacy, partnerships and the delivery of specialist public health services. We are an executive agency of the Department of Health, and are a distinct delivery organisation with operational autonomy to advise and support government, local authorities and the NHS in a professionally independent manner. Public Health England Wellington House 133-155 Waterloo Road London SE1 8UG Tel: 020 7654 8000 www.gov.uk/phe Twitter: @PHE_uk Facebook: www.facebook.com/PublicHealthEngland Prepared by: Caryl Beynon and Kate Sweeney. For queries relating to this document, please contact: 0151 706 6205. © Crown copyright 2016 You may re-use this information (excluding logos) free of charge in any format or medium, under the terms of the Open Government Licence v3.0. To view this licence, visit OGL or email [email protected]. Where we have identified any third party copyright information you will need to obtain permission from the copyright holders concerned. Published October 2016 PHE publications gateway number: 2016382
Alcohol-related crime indicators
2
Contents
About Public Health England 1
Contents 2
Executive summary 3
1.0 Background and aim 5
2.0 Datasets available to generate alcohol-related crime indicators 7
3.0 Analysis of crime data 10
4.0 Calculating rates; the denominator 29
5.0 Summary 30
6.0 Options for calculating the alcohol-related crime indicators 33
7.0 Stakeholder consultation 36
8.0 Data user survey 39
9.0 Conclusions 42
10.0 References 43
11.0 Acknowledgements 44
Appendix; data user survey 45

Alcohol-related crime indicators
3
Executive summary
The Local Alcohol Profiles for England (LAPE) contain a set of indicators that are used by a range of organisations across England to monitor the impact of alcohol on local communities, and to assess the effectiveness of initiatives that are put in place in order to reduce alcohol-related harms. Over recent years, the profiles have included three alcohol-related crime indicators which are expressed as crude rates. The three indicators were based on a methodology that uses alcohol-attributable fractions. These fractions were derived over 15 years ago. This report describes a review of the methodology used to generate alcohol-related crime indicators and concludes with a recommendation for how these indicators should be generated from now on. Firstly, this review involved an investigation of the utility of two datasets to provide (numerator) data on the number of alcohol-related crimes committed in an area. These datasets were the Crime Survey for England and Wales (CSEW) and police recorded crime data. Both datasets have advantages and disadvantages in terms of generating alcohol-related crime indicators. Analysis of the data showed that the proportion of crimes that were reported as alcohol-related varied by crime category, local authority, time of day and day of the week. For example, crimes that occurred during the evening/night were four times more likely to be reported to be alcohol-related than those that occurred during the day. Crimes that occurred during the weekend were more than twice as likely to be reported to be alcohol-related than those that occurred during the week. A higher proportion of violence crimes were reported to be alcohol-related than other crime categories. Historically the denominator used to calculate the crude rates of alcohol-related crimes has been the resident population. A review of this denominator was also undertaken to investigate whether other denominators should be used instead. Following these investigations, a number of methodological options were presented at a stakeholder workshop on 28 April 2016. Following discussion, stakeholders proposed that the ‘alcohol marker’ (a variable that indicates that the crime is alcohol-related) in the police recorded crime dataset should be used to directly derive the number of alcohol-related crimes for an area. Historically it has not been possible to generate the alcohol-related crime indicators from the alcohol marker because not all police forces were collecting this data. Some police forces are collecting the alcohol marker during 2016/2017 and all forces are expected to do so by April 2017. No alternative denominator data was identified. Stakeholders proposed that crude rates should continue to use the resident population of an area as the denominator. The crude rates will reflect total alcohol-related crime in relation to the size of the resident population and, as such, the indicators will represent the impact of crime on the local community. Police recorded crime data underestimates total crime because not all crimes are reported to the police. The use of multipliers to account for this underestimation, derived from the CSEW, was discussed by stakeholders. Further investigation of multipliers showed that, while nationally accepted multipliers are available for some crimes, they

Alcohol-related crime indicators
4
are not available for all crimes included in the police recorded crime dataset. Applying multipliers to some, but not all, crimes would be confusing. Invitations were sent to users of LAPE data but none were able to attend the stakeholder workshop. The stakeholders that did attend felt it was essential to gain the views of data users on the proposed methodology. For this reason, an online survey was set up and invitations were extended to data users via a number of channels. The survey was open between 24 June and 19 July 2016 and 41 people participated. Questions were asked about the usefulness of the proposed methodology, the use of multipliers and the relative importance of different crime categories. In general, respondents were supportive of the proposed methodology. Two thirds said they felt it would provide useful data and a further quarter said that it might provide useful data. There was some support for the use of multipliers to account for under-reporting of crimes in police recorded crime data but this was not overwhelming. Only one third of respondents stated that the use of multipliers would definitely be useful. In light of survey results, future LAPE data will include the following crime-related indicators: • total crime • violence against the person • sexual offences • public order offences Conclusions
To conclude, this review culminates in the following: four alcohol-related crime indicators will be included in LAPE. These are total crime, violence against the person, sexual offences and public order offences. Indicators will be crime-based (not person-based). These indicators will be expressed as crude rates. The alcohol-marker in police recorded crime data will be used to generate numerator data on the number of crimes per area and the resident population will be used as the denominator. Each crime will only be counted once (where there are multiple offenders per crime) but a person committing two alcohol-related crimes within a year will be recorded twice. The proposed indicators will therefore account for repeat offending. The proposed indicators will be a measure of the impact of crime on the local community. Police recorded crime data for 2015/2016 is the first year of data that will be included in LAPE. Not all police forces were reporting the alcohol marker during 2015/2016 and crude rates will be estimated for local authorities whose data is not available. Reporting of the alcohol marker is expected to be mandatory from April 2017. Police reported crime data for 2015/2016 will not be available until July/August 2017. So it is not possible to include alcohol-related crime indicators in the LAPE dataset until this time. After this, the alcohol-related crime indicators will be updated annually.

Alcohol-related crime indicators
5
1.0 Background and aim
The Local Alcohol Profiles for England (LAPE) provide information for local government, health organisations, commissioners and other agencies to help monitor the impact of alcohol on local communities and to assess the impact of services and initiatives which are put in place to reduce alcohol-related harms. Three of the indicators are crime-related: • alcohol-related recorded crime • alcohol-related violent crime • alcohol-related sexual offences These indicators are derived by applying alcohol-attributable fractions to the latest police recorded crime data for an area and then dividing by the resident population in that area in order to calculate a crude rate. The attributable fractions came from the Home Office New English and Welsh Arrestee Drug Abuse Monitoring System arrestee survey (NEW-ADAM), which involved interviewing and collecting urine samples from arrestees held within custody suites in 15 locations in England and Wales between 1999 and 2001 (Cabinet Office 2003a). The attributable fractions were derived by identifying the proportion of arrestees whose urine tested positive for alcohol by offence type and are described in Table 1 (Cabinet Office 2003b). Table 1: NEW-ADAM Alcohol-Related Attributable Fractions Offence Attributable
fraction Criminal damage 0.47 Violence against the person 0.37 Other 0.29 Drug offences 0.19 Burglary 0.17 Fraud and forgery 0.16 Sexual offences 0.13 Theft and handling stolen goods 0.13 Robbery 0.12
These attributable fractions were generated over 15 years ago and it is not clear that they still accurately reflect the proportion of crimes that are alcohol-related. It is therefore not clear that the current methodology used to calculate the alcohol-related crime indicators represents the best methodology available. What is known is that the alcohol-related crime indicators are used by a range of organisations across England and Wales for monitoring and planning purposes.

Alcohol-related crime indicators
6
Aim
The aim of this project was to review the methodology used to generate the alcohol-related crime indicators included in LAPE and to make recommendations on how these indicators should be generated in the future. Objectives
1. To identify datasets that can be used to generate the alcohol-related crime indicators.
2. To analyse the data from these datasets in order to ascertain the proportion of crimes that are alcohol-related.
3. To analyse crime data and ascertain whether the contribution of alcohol to crime varies by factors such as the time of day or day of the week in order to identify whether fixed attributable fractions are appropriate.
4. To analyse crime data and ascertain whether people commit more than one alcohol-related crime in a year.
5. To investigate the use of the resident population as the most appropriate denominator when calculating alcohol-related crime rates.
6. To set up a stakeholder workshop and present and discuss options for calculating alcohol-related crime indicators.
7. To finalise the methodology for calculating alcohol-related crime indicators.

Alcohol-related crime indicators
7
2.0 Datasets available to generate alcohol-related crime indicators
2.1 Police recorded crime data1
Police recorded crime data consist of details of incidents that are reported to the police which the police decide are crimes. Ideally, recorded crime data would include a variable to indicate whether or not a crime was alcohol-related. This would negate the need to calculate alcohol-attributable crime fractions because each year the proportion of police recorded crimes that were alcohol-related could be calculated directly from this dataset. Unfortunately the police recorded crime dataset does not contain information on whether or not the crime was alcohol-related (Office for National Statistics 2015a). Some police forces are reporting an extended data set of recorded crime to the Home Office Data Hub and this record level data contains more detailed information about the crimes, including whether alcohol was an aggravating factor (called the ‘alcohol marker’ in this report). In 2015, 21 of the 43 police forces in England and Wales provided data on whether crimes were alcohol related (Office for National Statistics 2015a). However, there has been no standard definition of an ‘alcohol-related crime’. So it is likely that different police forces have been recording alcohol-related crime differently. Furthermore, it is not mandatory for details on aggravating factors to be recorded. So it is possible that forces have been recording alcohol in some, but not all, offences (Office for National Statistics 2015a). Of key importance in terms of the interpretation of data, the alcohol marker indicates that alcohol influenced the crime. It does not say if it was the offender who was drinking, or the victim or both. Analysts at Greater Manchester police force conducted a small scale test on one weeks’ worth of data comparing the alcohol marker against the Modus Operandi field in order to ascertain whether the two fields corroborated. Key words included in the comparison were alcohol, drunk, drinking, drink, intoxicated, inebriated and under the influence. In this one week, 193 crimes had the specified words in the Modus Operandi text; of these 104 (54%) also had the alcohol marker completed. The remaining 89 crimes were reviewed and in 46 (52%) of these the alcohol marker should have been completed to indicate the crime was alcohol-related (Phil Li, personal communication, 13 July 2015). The alcohol marker will be reported by forces to the Home Office Data Hub as part of the annual data requirement from April 2016. Reporting the alcohol marker will be voluntary in the first year with the aim to make it mandatory from April 2017 (Kevin Smith, personal communication, 7 January 2016). Police recorded crime data are categorised into crime categories which are subject to change over time. Table 2 describes the current police recorded crime groups and how these were mapped to the alcohol-related crime indicators included in LAPE. 1 Section 7.0 contains updated information about the reporting of alcohol in police recorded crime data.

Alcohol-related crime indicators
8
Table 2: Police recorded crime categories mapped to LAPE crime indicators Police recorded crime categories1
Alcohol-related crime indicators in the Local Alcohol Profiles for England
Recorded crime Violent crime Sexual offences Homicide ✓ ✓ x Violence with injury ✓ ✓ x Violence without injury ✓ ✓ x Rape ✓ x ✓ Other sexual offences ✓ x ✓ Robbery ✓ x x Domestic burglary ✓ x x Non-domestic burglary x x x Vehicle offences ✓ x x Theft from the person x x x Bicycle theft x x x Shoplifting x x x All other theft offences x x x Arson x x x Criminal damage x x x Trafficking of drugs x x x Possession of drugs x x x Possession of weapons offences
x x x
Public order offences x x x Miscellaneous crimes against society
x x x
✓ = included in the LAPE indicator and x = not included in the LAPE indicator. 1(Office for National Statistics 2015b). 2.2 Crime Survey for England and Wales data (CSEW)
To date, the crime-related alcohol attributable fractions have been applied to police recorded crime data in order to derive the indicators used in the LAPE. An alternative approach would be to use data from the Crime Survey for England and Wales (CSEW). The CSEW is good for monitoring long-term trends because it is unaffected by changes in levels of reporting to the police and/or police recording practices (Office for National Statistics 2015b). The CSEW is a face-to-face survey asking people resident in households about their experiences of a range of crimes which happened to them (personal crimes) and crimes against their household (household crimes) in the preceding 12 months. This includes crimes not reported to the police. In 2013/2014 43% of comparable crimes reported to the CSEW were included in the police recorded crime data (Office for National Statistics 2015b), which suggests that police recorded crime underestimates total crime. The CSEW excludes people living in institutions such as care homes and students living in halls of residence (Office for National Statistics 2015c). In relation to offence types, the CSEW covers a narrower range of crimes than police recorded crime (Office for

Alcohol-related crime indicators
9
National Statistics 2015c). Due to the small numbers, rape, attempted rape and indecent assault offences are not included in the overall count of personal crimes reported by the CSEW (Office for National Statistics 2015b). The CSEW dataset consists of two files: the victim form and the non-victim form. Each case on the non-victim form refers to an individual respondent. Each case on the victim form refers to an individual incident. A maximum of six victim forms are completed per person. A long version of the victim form is completed for incidents one to three and a shorter version for the fourth to sixth incident. The order in which the victim modules are asked depends upon the type of crime being reported. Less common crimes are prioritised so that more information about these rarer events is available. When multiple incidents occurred they are considered a ‘series’ and only one victim form is completed (Office for National Statistics n.d.a). The questions relating to whether a crime was alcohol-related are only included in the long version of the victim module (Office for National Statistics 2015b) and the data on alcohol use by the perpetrator will therefore only be available for the first three crimes reported.

Alcohol-related crime indicators
10
3.0 Analysis of crime data
3.1 Analysis of police recorded crime data
Anonymised police recorded crime data were received from Greater Manchester Police and Lancashire Police. Both datasets provided details of all crimes committed between 1 April 2014 and 31 March 2015. The two datasets adhered to the same specification so that data could be compared. However, the Greater Manchester dataset included the local authority while the Lancashire dataset included lower super output area and this was used to generate local authority. It was not possible to measure repeat offending using the Lancashire police recorded crime because there were no duplicate offender IDs within the dataset. Police recorded crime data are crime-based. This meant that there was double counting of crimes where there was more than one offender. All crimes had a crime ID but offender ID and offender details were not available for crimes where no offender had been identified. Police recorded crime data were aggregated by crime ID in order to remove double counting of crimes. An arbitrary decision was to select the first offender when the offender IDs were ordered numerically. The sex of the offender and local authority of residence of the offender could have been different if another offender had been selected. All other data would have been the same if another offender had been selected because all other data (including whether the crime was alcohol-related) were crime, rather than offender, based. The analysis of repeat offending (only possible for Greater Manchester) was person-based. Each offence record contained a crime identification code which was mapped to a Home Office crime category (using a coding framework provided by Greater Manchester police). Fraud and forgery are included because these crimes occurred within the police recorded crime datasets which were analysed as part of this report. However, the numbers of these crimes that appear in the police recorded crime dataset are no longer a clear reflection of the actual number of fraud and forgery offences because, since 1 April 2012, such crimes are referred to the National Fraud Investigation Bureau (Action Fraud; Phil Li, personal communication, 10 March 2016). The police recorded crime data includes four fields relating to when the crime occurred. ‘Date from’ and ‘date to’ indicate the earliest and latest possible date and ‘time from’ and ‘time to’ indicate the earliest and latest possible time of the day. For the purpose of this work, these fields are important in determining whether the contribution of alcohol to crime varied by day of the week and/or time of the day. The date/time of the crime is not always known. For Greater Manchester, for example, the exact day of the crime was unknown for 25% of crimes reported within 2014/2015. The ‘date from’, ‘time from’, ‘date to’ and ‘time to’ variables were used to generate the time of day and the day of the week the crime was committed. These were categorised into morning/afternoon (06:00 hours to 17:59 hours) and evening/night (18:00 hours to 05:59 hours) and week (Monday to Friday before 18:00) and weekend (Friday 18:00 to midnight on Sunday).

Alcohol-related crime indicators
11
Differences in proportions were tested using two-sided chi square. For two by two tables, the continuity correction was used and Fisher’s exact test was reported when one or more of the cells had an expected frequency of five or less. Multiple univariate analyses are likely to increase the possibility of a Type I error (Altman 1999). Care should be taken in interpreting the results of the analysis of police recorded crime data. Firstly, it is not possible to ascertain if a none-yes response for alcohol meant that the crime was not alcohol-related, that the involvement of alcohol was unknown or the police officer did not ask/record this information. Secondary, it is possible that attribution bias contributed to the differences in the proportion of crimes that were recorded as alcohol-related. It is possible that the police officer recording the crime might be more likely to consider the involvement of alcohol in certain crimes (for example violence), or certain times of the day or week (for example Saturday evening) and therefore more be likely to ask about this and record it. 3.1.1 Greater Manchester findings
The role of alcohol in police recorded crimes
The Greater Manchester dataset comprised of 209,945 records which were aggregated to 197,394 individual crimes. In total, alcohol was reported as a contributory factor in 17,259 (8.7%) crimes (Table 3). There was a significant difference across crime categories in the proportion of crimes that were recorded as alcohol-related from 25.4% for violence to 0% for fraud (χ2 = 24667.168, df = 9, p<0.001). The proportions of crimes that are recorded as alcohol-related is likely to be higher for crimes where the offender has had direct contact with the victim, because the victim can confirm whether or not the offender had been drinking (for instances where the alcohol marker reflects offender behaviour).

Alcohol-related crime indicators
12
Table 3: Alcohol-related crime, by crime category, Greater Manchester police recorded crime 2014/2015 Crime category Alcohol-related Total
Yes No/Unknown/Not asked N % N %
Violence 12,235 25.4 36,022 74.6 48,257 Sexual offences 567 16.6 2,856 83.4 3,423 Other crimes 668 15.1 3,745 84.9 4,413 Criminal damage 2,002 6.6 28,512 93.4 30,514 Drug offences 416 6.4 6,039 93.6 6,455 Robbery 127 3.6 3,393 96.4 3,520 Theft/handling stolen goods
1,101 1.5 71,713 98.5 72,814
Forgery 2 1.4 137 98.6 139 Burglary 141 0.5 27,717 99.5 27,858 Fraud 0 0.0 1 100.0 1 Total 17,259 8.7 180,135 91.3 197,394
Does the contribution of alcohol vary by local authority?
The data presented in Table 4 describes the proportion of crimes that were recorded as alcohol-related according to the local authority in which the crime occurred. The highest proportion of crimes recorded as alcohol-related was in Bolton local authority (10.3%) and the lowest was reported in Salford (7.4%). The difference across local authorities in the proportion of crimes that were recorded as alcohol-related was significant (χ2 = 182.942, df = 9, p<0.001). Table 4: Alcohol-related crime, by local authority, Greater Manchester police recorded crime 2014/2015 Local authority of the crime
Alcohol-related Total Yes No/Unknown/Not asked
N % N % Bolton 1,912 10.3 16,739 89.7 18,651 Rochdale 1,621 9.7 15,044 90.3 16,665 Wigan 1,772 9.5 16,951 90.5 18,723 Oldham 1,638 9.3 16,033 90.7 17,671 Bury 1,083 9.1 10,813 90.9 11,896 Tameside 1,478 9.0 14,984 91.0 16,462 Manchester 4,512 8.3 50,140 91.7 54,652 Stockport 1,236 7.8 14,525 92.2 15,761 Trafford 885 7.5 10,903 92.5 11,788 Salford 1,122 7.4 14,003 92.6 15,125

Alcohol-related crime indicators
13
Does the contribution of alcohol vary by the time of day?
The next analysis investigated if the proportion of crimes that were recorded as alcohol-related varied by time of day. The results of this investigation are presented in Table 5 Across all crimes, 4.8% of crimes that occurred during the morning or afternoon were recorded as alcohol-related compared to 17.9% that occurred during the evening or night (χ2 = 5977.924, df = 1, p<0.001). Table 5: Alcohol-related crime by time of day and crime category, Greater Manchester police recorded crime 2014/2015 Crime category Was the crime alcohol-
related? Time of the day1 P
value Morning/afternoon Evening/night N % N %
Burglary Yes 33 0.6 92 1.2 0.004 No/don’t know/not asked 5,151 99.4 7,875 98.8
Criminal damage Yes 348 5.2 1,542 13.0 <0.001 No/don’t know/not asked 6,354 94.8 10,284 87.0
Drug offences Yes 87 2.7 324 10.4 <0.001 No/don’t know/not asked 3,136 97.3 2,780 89.6
Forgery Yes 0 0 2 4.1 0.311 No/don’t know/not asked 73 100 47 95.9
Fraud Yes 0 0 0 0 - No/don’t know/not asked 0 0 0 0
Other crimes Yes 177 9.8 441 25.0 <0.001 No/don’t know/not asked 1,627 90.2 1,324 75.0
Robbery Yes 38 3.1 83 3.7 0.390 No/don’t know/not asked 1,183 96.9 2,136 96.3
Sexual offences Yes 79 9.0 311 26.3 <0.001 No/don’t know/not asked 796 91.0 871 73.7
Theft/handling stolen goods
Yes 429 1.4 550 2.9 <0.001 No/don’t know/not asked 30,106 98.6 18,666 97.1
Violence Yes 2063 10.9 9,369 39.9 <0.001 No/don’t know/not asked 16,822 89.1 14,135 60.1
Total Yes 3254 4.8 12,714 17.9 <0.001 No/don’t know/not asked 65,248 95.2 58,118 82.1
1 Morning/afternoon is 06:00 to 17:59 hours and evening/night is 18:00 to 05:59 hours. Does the contribution of alcohol vary by the day of the week?
Data on the involvement of alcohol by crime category and day of the week are presented in Table 6. Across crime categories, 15.0% of crimes that occurred during the

Alcohol-related crime indicators
14
weekend were recorded as alcohol-related compared to 6.6% that occurred during the week (χ2 = 3230.577, df = 1, p<0.001). Table 6: Alcohol-related crime by time of the week and crime category, Greater Manchester police recorded crime 2014/2015 Crime category Was the crime alcohol-
related? Time of the week P value
Week Weekend1 N % N %
Burglary Yes 79 0.5 56 0.9 0.002 No/don’t know/not asked 15,906 99.5 6,494 99.1
Criminal damage Yes 822 5.3 1,145 11.0 <0.001 No/don’t know/not asked 14,684 94.7 9,288 89.0
Drug offences Yes 204 4.6 210 10.7 <0.001 No/don’t know/not asked 4,193 95.4 1,761 89.3
Forgery Yes 1 1.1 1 2.6 0.499 No/don’t know/not asked 94 98.9 38 97.4
Fraud Yes 0 0 0 0 - No/don’t know/not asked 0 0 0 0
Other crimes Yes 317 12.2 326 26.3 <0.001 No/don’t know/not asked 2,278 87.8 914 73.7
Robbery Yes 76 3.4 49 3.8 0.590 No/don’t know/not asked 2,140 96.6 1,226 96.2
Sexual offences Yes 227 15.4 263 26.2 <0.001 No/don’t know/not asked 1,246 84.6 740 73.8
Theft/handling stolen goods
Yes 630 1.4 435 2.1 <0.001 No/don’t know/not asked 43,512 98.6 20,170 97.9
Violence Yes 5,048 19.6 6,784 36.2 <0.001 No/don’t know/not asked 20,642 80.4 11,945 63.8
Total Yes 7,404 6.6 9,269 15.0 <0.001 No/don’t know/not asked 104,695 93.4 52,576 85.0
1 Weekend is from 18:00 hours on Friday to 23:59 hours on Sunday. Does the contribution of alcohol vary by the sex of the offender?
Table 7 reports the differences in the proportions of crimes that were alcohol-related according to the sex of the offender (where this was known). The proportion of crimes reported to be alcohol-related is higher in this table than other tables. This is largely because knowing the sex of the offender increases the likelihood of knowing whether alcohol was involved. In total, the proportion of crimes that were alcohol-related did not differ significantly according to the sex of the offender. However, for theft/handling stolen goods, robbery and other crimes, whether the crime was recorded as alcohol-related did vary significantly by the sex of the offender.

Alcohol-related crime indicators
15
Table 7: Alcohol-related crime, by crime category and sex of the offender, Greater Manchester police recorded crime 2014/2015 Crime category Was the crime alcohol-
related? Sex of the offender P value
Male Female N % N %
Burglary Yes 114 3.8 10 5.2 0.446 No/don’t know/not asked 2,893 96.2 184 94.8
Criminal damage Yes 1,448 24.5 257 23.9 0.697 No/don’t know/not asked 4,469 75.5 820 76.1
Drug offences Yes 348 6.6 51 8.0 0.207 No/don’t know/not asked 4,949 93.4 588 92.0
Forgery Yes 0 0 0 0 - No/don’t know/not asked 58 100 16 100
Fraud Yes 0 0 0 0 - No/don’t know/not asked 0 0 0 0
Other crimes Yes 536 16.5 87 21.5 0.014 No/don’t know/not asked 2,708 83.5 317 78.5
Robbery Yes 65 7.0 11 14.7 0.030 No/don’t know/not asked 858 93.0 64 85.3
Sexual offences Yes 441 20.4 8 12.9 0.198 No/don’t know/not asked 1,722 79.6 54 87.1
Theft/handling stolen goods
Yes 658 5.8 142 3.9 <0.001 No/don’t know/not asked 10,729 94.2 3,521 96.1
Violence Yes 8,299 30.4 2,182 29.2 0.062 No/don’t know/not asked 19,030 69.6 5,280 70.8
Total Yes 11,909 20.1 2,748 20.2 0.715 No/don’t know/not asked 47,416 79.9 10,844 79.8
Location of crimes
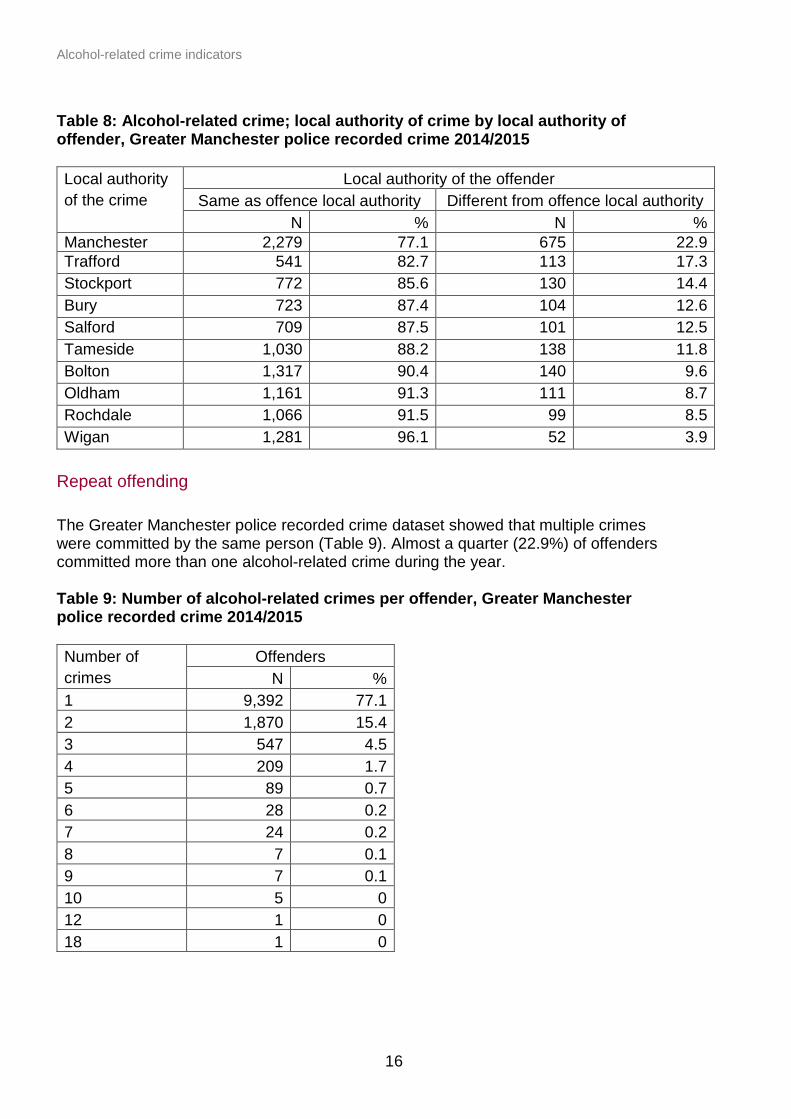
Table 8 reports the proportion of alcohol-related crimes that were committed by an offender who lived in the local authority in which the crime was committed. In many cases the local authority of the offender was not recorded. Only alcohol-related crimes with a local authority of offence and local authority of the offender were included. In general, offenders committed crimes in the same local authority in which they resided but this was not always the case. Almost a quarter (22.9%) of crimes committed in Manchester local authority were committed by people who lived in other local authorities.
Alcohol-related crime indicators
16
Table 8: Alcohol-related crime; local authority of crime by local authority of offender, Greater Manchester police recorded crime 2014/2015 Local authority of the crime
Local authority of the offender Same as offence local authority Different from offence local authority
N % N % Manchester 2,279 77.1 675 22.9 Trafford 541 82.7 113 17.3 Stockport 772 85.6 130 14.4 Bury 723 87.4 104 12.6 Salford 709 87.5 101 12.5 Tameside 1,030 88.2 138 11.8 Bolton 1,317 90.4 140 9.6 Oldham 1,161 91.3 111 8.7 Rochdale 1,066 91.5 99 8.5 Wigan 1,281 96.1 52 3.9
Repeat offending
The Greater Manchester police recorded crime dataset showed that multiple crimes were committed by the same person (Table 9). Almost a quarter (22.9%) of offenders committed more than one alcohol-related crime during the year. Table 9: Number of alcohol-related crimes per offender, Greater Manchester police recorded crime 2014/2015 Number of crimes
Offenders N %
1 9,392 77.1 2 1,870 15.4 3 547 4.5 4 209 1.7 5 89 0.7 6 28 0.2 7 24 0.2 8 7 0.1 9 7 0.1 10 5 0 12 1 0 18 1 0

Alcohol-related crime indicators
17
3.1.2 Lancashire findings
The role of alcohol in police recorded crimes
The Lancashire police recorded crime dataset contained 95,836 records. 86,679 had a valid local authority of the crime (ie within Lancashire) and a valid crime category and were used as the basis for subsequent analyses. These records aggregated to 84,387 individual crimes. There was a significant difference across crime categories in the proportion that were alcohol-related (χ2 = 9144.253, df = 8, p<0.001, Table 10). Just over a quarter (27.5%) of violence crimes were recorded as alcohol-related compared to just 1.5% of burglaries. Table 10: Alcohol-related crime, by crime category, Lancashire police recorded crime 2014/2015 Crime category Alcohol-related Total
Yes No/Unknown/Not asked N % N %
Violence 5,587 27.5 14,734 72.5 20,321 Sexual offences 245 18.7 1,067 81.3 1,312 Robbery 77 15.0 438 85.0 515 Other crimes 205 13.9 1,275 86.1 1,480 Criminal damage 1,290 8.6 13,772 91.4 15,062 Drug offences 180 6.4 2,625 93.6 2,805 Theft/handling stolen goods
1,085 3.5 29,997 96.5 31,082
Forgery 3 2.7 109 97.3 112 Burglary 170 1.5 11,528 98.5 11,698 Total 8,842 10.5 75,545 89.5 84,387
Does the contribution of alcohol vary by local authority?
The proportion of crimes that were recorded as alcohol-related varied significantly by the local authority in which the crime occurred (χ2 = 443.237, df = 13, p<0.001; Table 11). Blackpool had the highest proportion of crimes that were recorded as alcohol-related (14.9%) and the Ribble Valley had the lowest (7.4%).

Alcohol-related crime indicators
18
Table 11: Alcohol-related crime, by local authority, Lancashire police recorded crime 2014/2015 Local authority of the crime
Alcohol-related Total Yes No/Unknown/Not asked
N % N % Blackpool 2,128 14.9 12,195 85.1 14,323 Chorley 597 11.9 4,414 88.1 5,011 Wyre 537 11.6 4,074 88.4 4,611 Lancaster 759 10.5 6,485 89.5 7,244 Fylde 298 10.4 2,560 89.6 2,858 Burnley 774 9.6 7,318 90.4 8,092 West Lancashire
430 9.4 4,157 90.6 4,587
Blackburn with Darwen
916 9.2 9,008 90.8 9,924
Pendle 448 9.0 4,532 91.0 4,980 South Ribble 368 8.9 3,781 91.1 4,149 Preston 783 8.8 8,074 91.2 8,857 Hyndburn 446 8.7 4,669 91.3 5,115 Rossendale 232 7.9 2,710 92.1 2,942 Ribble Valley 126 7.4 1,568 92.6 1,694
Does the contribution of alcohol vary by the time of day?
The proportion of crimes recorded as alcohol-related varied significantly by the time of the day (Table 12). In total, 5.3% of crimes that occurred during the morning/afternoon were recorded as alcohol-related compared to 21.8% of crimes that occurred during the evening/night (χ2 = 2,505.604, df = 1, p<0.001).

Alcohol-related crime indicators
19
Table 12: Alcohol-related crime by time of day and crime category, Lancashire police recorded crime 2014/2015 Crime category Was the crime alcohol-
related? Time of the day1 P value
Morning/afternoon Evening/night N % N %
Burglary Yes 21 1.3 79 3.2 <0.001 No/don’t know/not asked 1,597 98.7 2,375 96.8
Criminal damage Yes 155 6.6 758 15.6 <0.001 No/don’t know/not asked 2,182 93.4 4,100 84.4
Drug offences Yes 18 2.2 113 11.8 <0.001 No/don’t know/not asked 783 97.8 846 88.2
Forgery Yes 1 1.9 0 0.0 1.000 No/don’t know/not asked 52 98.1 12 100
Other crimes Yes 44 11.1 107 27.6 <0.001 No/don’t know/not asked 351 88.9 280 72.4
Robbery Yes 13 8.2 50 18.9 0.004 No/don’t know/not asked 146 91.8 214 81.1
Sexual offences Yes 15 8.0 91 33.8 <0.001 No/don’t know/not asked 173 92.0 178 66.2
Theft/handling stolen goods
Yes 270 2.6 451 7.3 <0.001 No/don’t know/not asked 10,071 97.4 5,721 92.7
Violence Yes 591 11.0 3,338 44.5 <0.001 No/don’t know/not asked 4,758 89.0 4,170 55.5
Total Yes 1,128 5.3 4,987 21.8 <0.001 No/don’t know/not asked 20,113 94.7 17,896 78.2
1 Morning/afternoon is 06:00 to 17:59 hours and evening/night is 18:00 to 05:59 hours. Does the contribution of alcohol vary by the day of the week?
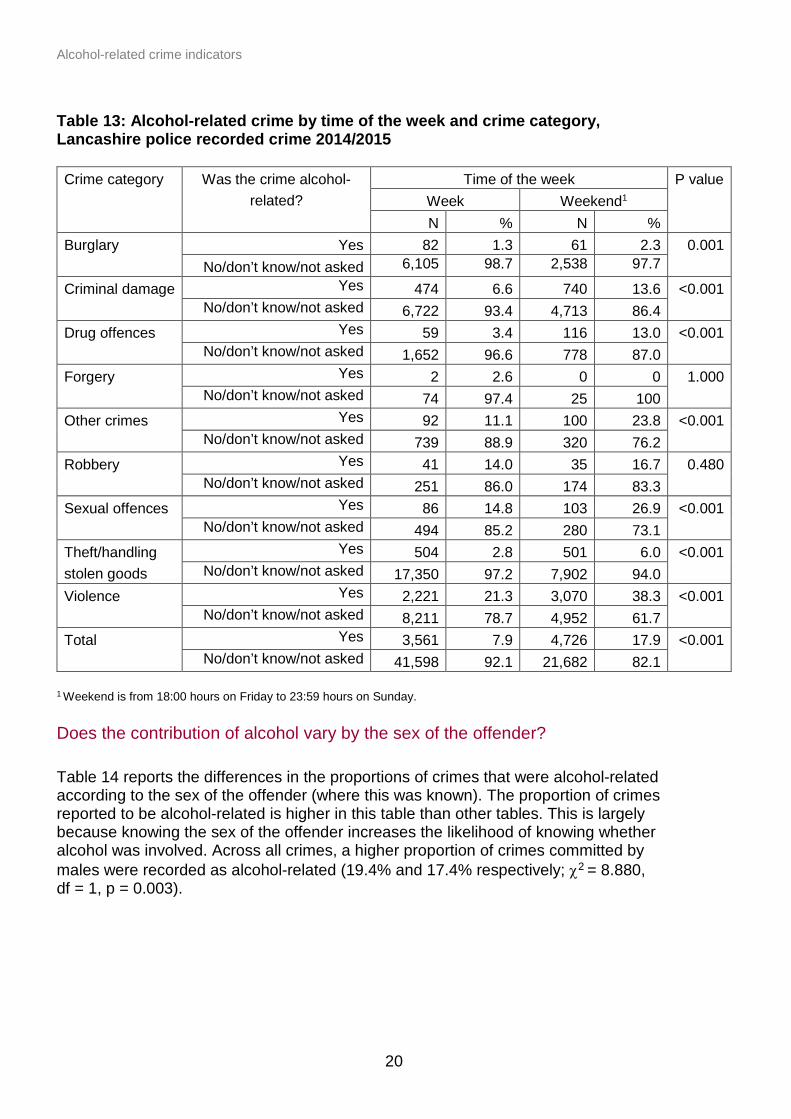
Data on the involvement of alcohol by crime category and time of the week are presented in Table 13. Across crime categories, 7.9% of crimes that occurred during the week were recorded as alcohol-related compared to 17.9% that occurred during the weekend (χ2 = 1,630.011, df = 1, p<0.001). For all crime categories other than forgery and robbery, the proportion of crimes recorded as alcohol-related was significantly higher during the weekend than during the week.
Alcohol-related crime indicators
20
Table 13: Alcohol-related crime by time of the week and crime category, Lancashire police recorded crime 2014/2015 Crime category Was the crime alcohol-
related? Time of the week P value
Week Weekend1 N % N %
Burglary Yes 82 1.3 61 2.3 0.001 No/don’t know/not asked 6,105 98.7 2,538 97.7
Criminal damage Yes 474 6.6 740 13.6 <0.001 No/don’t know/not asked 6,722 93.4 4,713 86.4
Drug offences Yes 59 3.4 116 13.0 <0.001 No/don’t know/not asked 1,652 96.6 778 87.0
Forgery Yes 2 2.6 0 0 1.000 No/don’t know/not asked 74 97.4 25 100
Other crimes Yes 92 11.1 100 23.8 <0.001 No/don’t know/not asked 739 88.9 320 76.2
Robbery Yes 41 14.0 35 16.7 0.480 No/don’t know/not asked 251 86.0 174 83.3
Sexual offences Yes 86 14.8 103 26.9 <0.001 No/don’t know/not asked 494 85.2 280 73.1
Theft/handling stolen goods
Yes 504 2.8 501 6.0 <0.001 No/don’t know/not asked 17,350 97.2 7,902 94.0
Violence Yes 2,221 21.3 3,070 38.3 <0.001 No/don’t know/not asked 8,211 78.7 4,952 61.7
Total Yes 3,561 7.9 4,726 17.9 <0.001 No/don’t know/not asked 41,598 92.1 21,682 82.1
1 Weekend is from 18:00 hours on Friday to 23:59 hours on Sunday.
Does the contribution of alcohol vary by the sex of the offender?
Table 14 reports the differences in the proportions of crimes that were alcohol-related according to the sex of the offender (where this was known). The proportion of crimes reported to be alcohol-related is higher in this table than other tables. This is largely because knowing the sex of the offender increases the likelihood of knowing whether alcohol was involved. Across all crimes, a higher proportion of crimes committed by males were recorded as alcohol-related (19.4% and 17.4% respectively; χ2 = 8.880, df = 1, p = 0.003).

Alcohol-related crime indicators
21
Table 14: Alcohol-related crime, by crime category and sex of the offender, Lancashire police recorded crime 2014/2015 Crime category Was the crime alcohol-
related? Sex of the offender P
value Male Female N % N %
Burglary Yes 67 5.0 7 12.7 0.023 No/don’t know/not
asked 1,269 95.0 48 87.3
Criminal damage
Yes 703 29.8 91 25.6 0.121 No/don’t know/not
asked 1,665 70.2 264 74.4
Drug offences Yes 140 6.4 20 7.9 0.447 No/don’t know/not
asked 2,037 93.6 233 92.1
Forgery Yes 3 16.7 0 0 1.000 No/don’t know/not
asked 15 83.3 1 100
Other crimes Yes 127 15.5 25 25.0 0.023 No/don’t know/not
asked 694 84.5 75 75.0
Robbery Yes 30 17.0 8 40.0 0.031 No/don’t know/not
asked 146 83.0 12 60.0
Sexual offences
Yes 48 17.5 0 0 0.221 No/don’t know/not
asked 227 82.5 11 100
Theft/handling stolen goods
Yes 371 7.8 84 5.2 0.001 No/don’t know/not
asked 4,400 92.2 1,527 94.8
Violence Yes 2,184 31.0 503 27.2 0.002 No/don’t know/not
asked 4,862 69.0 1,343 72.8
Total Yes 3,673 19.4 738 17.4 0.003 No/don’t know/not
asked 15,305 80.6 3,514 82.6
Table 15 compares the local authority in which the alcohol-related crime was committed and the local authority in which the offender resided. Acknowledging the small numbers, there were big differences across local authorities. 30.4% of crimes committed in Ribble Valley were committed by someone who lived in a different local authority compared to 1.3% of crimes committed in Lancaster being committed by a person who lived in a different local authority.

Alcohol-related crime indicators
22
Table 15: Alcohol-related crime; local authority of crime by local authority of offender, Lancashire police recorded crime 2014/2015 Local authority of the crime
Local authority of the offender Same as offence local authority Different from offence local authority
N % N % Ribble Valley 39 69.6 17 30.4 Fylde 101 74.8 34 25.5 South Ribble 145 80.6 35 19.4 Wyre 212 81.5 48 18.5 Hyndburn 154 84.6 28 15.4 Burnley 267 85.5 45 14.4 Preston 282 86.0 46 14.0 Rossendale 92 89.3 11 10.7 Chorley 229 90.9 23 9.1 Blackburn with Darwen
359 90.9 36 9.1
Blackpool 591 91.1 58 8.9 Pendle 184 93.4 13 6.6 West Lancashire
161 94.7 9 5.3
Lancaster 306 98.7 4 1.3

Alcohol-related crime indicators
23
3.2 Analysis of Crime Survey for England and Wales data
People completing the Crime Survey for England and Wales are asked about crimes that occurred in the previous 12 months. The 2013/2014 dataset contains 9,282 victim forms (personal or household incidents) but not all of these were included in the analysis. Firstly, a small proportion victim forms were excluded from the analyses because they were outside the reference period or because the person was not resident in England and Wales (Table 16). The variable ‘offence’ indicates the final offence attributed to each record after data checking within the Home Office. In total, 1,753 records had an offence which was not listed in the ‘total CSEW (not including rape, indecent assault)’ categorisation of offences (Office for National Statistics 2015b) and for a further 112 records, no offence was recorded (Table 16). These records were de-selected in the analyses. The variable ‘drinkin1’ relates to the following question: “As far as you know, at the time it happened was the person who did it under the influence of drink?” The equivalent variable/question where there were multiple perpetrators is ‘DRINKINF’ and: “As far as you know, at the time it happened were ANY of the people under the influence of drink?” The derived variable ‘drink’ amalgamates these two questions into an overarching variable: “was the person under the influence of alcohol?” [yes, no, don’t know (Office for National Statistics n.d.b)]. These questions do not ask specifically if alcohol was a causal factor and the data obtained from this question is therefore similar to the alcohol data obtained from NEW-ADAM. In order to identify the proportion of crimes that were alcohol-related, victim forms where the drink variable was ‘yes’ or ‘no’ were selected. Victim forms where the drink variable was ‘don’t know’ or ‘missing’ were deselected. Consequently 73.5% of victim forms were deselected (Table 16). The respondent is only asked the drink questions if they saw the offender(s) and in most incidents this is not the case. Furthermore, the drink questions are only asked on the long version of the victim form [so data are only available for the first three incidents (Office for National Statistics n.d.b) when a respondent reports more than three]. It is possible to analyse incidents by the time of the week using the variable ‘whenvic2’; responses are as follows: during the week, at the weekend – Friday evening, at the weekend – Saturday, at the weekend – Sunday, at the weekend – early Monday morning, at the weekend, can’t say when, refusal and don’t know (Office for National Statistics n.d.b). It is also possible to analyse the incidents by time of the day using the variable ‘timevic2’; response are as follows: during the morning (6am to noon), during the afternoon (noon to 6pm), morning/afternoon (can’t say which), during early evening (6pm to 10pm), during late evening (10pm to midnight), during the night (midnight to 6am), evening/night (can’t say which), refusal and don’t know (Office for National Statistics n.d.b). These temporal variables are only asked in the long version of the victim form (Office for National Statistics n.d.b). The total number of cases included in the final unweighted analyses was 1,567 or 16.9% of the original number of victim forms. For all analyses, data were weighted by ‘c11weighti’ which should be used for incident-based analysis when the intention is to make statements about characteristics of crimes (Office for National Statistics n.d.a).

Alcohol-related crime indicators
24
When the data were weighted, the number of records included in the analyses was 2,189,313. Table 16: Assessment of variables, CSEW 2013/2014, unweighted data Variable Variable description Deselected victim
forms Reason for deselection
N % Befor99 Indicates whether or not
record was within reference period
101 1.1 Outside the reference period
Offence Final offence code after Home Office checking
1,865 20.1 Crimes not included in the ‘total CSEW crime (not including rape, indecent assault1)’ categorisation (Office for National Statistics 2015b), duplicates, no offence identified, missing
Victarea and wherhapp
Victarea asks if the offence occurred within the area. If this is no, refused to answer or do not know, wherhapp asks if the offence occurred in England or Wales1
255 2.7 Outside England and Wales, refused to answer, do not know, missing
Drink Indicates whether or not the offender was under the influence of alcohol
6,824 73.5 Do not know, missing
1It is not possible to distinguish between residency in England and Wales in the main victim form. The same dataset with local authority codes is available from the virtual micro laboratory following an application for approved researcher status. These codes could be used to remove cases that occurred in Wales. Differences in proportions were tested using two-sided chi square. For two by two tables the continuity correction was reported and Fisher’s exact test when one or more of the cells had an expected frequency of five or less. Where data were weighted, statistical tests were undertaken on unweighted data. Multiple univariate analyses are likely to increase the possibility of a Type I error (Altman 1999). 3.2.1 Crime Survey for England and Wales; findings
The role of alcohol in crimes reported via the Crime Survey for England and Wales
Valid cases were assigned their crime category according to the Home Office coding rules (Office for National Statistics 2015b). Subsequent analyses were conducted according to these crime categories. Table 17 reports the number and proportion of different crime categories according to whether the survey respondent said that the offender(s) was under the influence of alcohol when they committed the crime. The proportion of offences in which the offender(s) was drinking varies by crime category from 20.3% for acquisitive crime against the individual to 58.5% for all violence (weighted data). The proportions of crimes that are recorded as alcohol-related is likely

Alcohol-related crime indicators
25
to be higher for crimes where the offender has had direct contact with the victim because the victim can confirm whether or not the offender had been drinking. Table 17: Drinking status of the offender(s) by crime category, CSEW 2013/2014 Crime category Unweighted
sample size Weighted1
Was offender under the influence of drink?
Yes No N % N %
All household offences 667 196,388 33.8 384,103 66.2 Acquisitive crime against the household
418 94,056 27.2 251,175 72.8
Domestic burglary 188 61,193 38.3 98,483 61.7 Criminal damage 249 102,331 43.5 132,928 56.5
All personal crimes2 900 774,266 48.1 834,556 51.9 All violence 620 685,924 58.5 486,852 41.5 Acquisitive crime against the individual
280 88,342 20.3 347,705 79.7
All theft 635 142,535 21.4 524,511 78.6
1By C11weighti. 2Not including rape and indecent assault. Does the contribution of alcohol vary by the time of day?
Table 18 reports whether the survey respondent felt the offender(s) was under the influence of alcohol according to time of the day, by crime category. The time of day significantly affected whether the survey respondent reported the offender to be under the influence of drink across all crime categories. The biggest difference was for all violence. The survey respondents reported the offender(s) to be under the influence of drink in 21.4% of offences that occurred during the morning/afternoon compared to 76.1% of offences that occurred during the evening/night (unweighted χ2 = 126.419, df = 1, p<0.001).

Alcohol-related crime indicators
26
Table 18: Drinking status of the offender(s) by time of day and crime category, CSEW 2013/2014, weighted data Crime category Was offender
under the influence of
drink?
Time of the day1 P value Morning/afternoon Evening/night
N % N %
All household offences Yes 27,994 12.5 155,107 47.8 <0.001 No 195,954 87.5 169,090 52.2
Acquisitive crime against the household
Yes 22,095 14.2 69,525 39.5 <0.001 No 133,115 85.8 106,297 60.5
Domestic burglary Yes 12,567 19.4 48,626 52.0 <0.001 No 52,376 80.6 44,862 48.0
Criminal damage Yes 5,900 8.6 85,582 57.7 <0.001 No 62,839 91.4 62,792 42.3
All personal crimes2 Yes 104,884 16.9 669,382 68.1 <0.001
No 514,762 83.1 313,728 31.9 All violence Yes 78,987 21.4 606,936 76.1 <0.001
No 290,641 78.6 190,145 23.9 Acquisitive crime against the individual
Yes 25,897 10.4 62,446 33.6 <0.001 No 224,121 89.6 123,584 66.4
All theft Yes 29,325 8.5 110,773 35.9 <0.001
No 314,934 91.5 197,814 64.1
1Morning/afternoon includes the following original categories; morning (6am-noon), afternoon (noon-6pm) and morning/afternoon. Evening/night includes the following original categories; early evening (6pm-10pm), late evening (10pm-midnight), during the night (midnight-6am) and evening/night. 2Not including rape and indecent assault. Does the contribution of alcohol vary by the day of the week?
Table 19 reports whether the offender(s) was under the influence of alcohol according to time of the week, by crime category. The time of the week in which the offence was committed significantly affects whether or not the offender(s) was reported as being under the influence of drink. The biggest difference was for all violence; survey respondents reported 39.5% of violent crimes which occurred during the week to have been committed while the offender(s) was under the influence of drink compared to 76.1% during the weekend (unweighted χ2 = 67.606, df = 1, p<0.001).

Alcohol-related crime indicators
27
Table 19: Drinking status of the offender(s) by time of week and crime category, CSEW 2013/2014, weighted data Crime category Was offender
under the influence of
drink?
Time of the week P value Week Weekend1 N % N %
All household offences Yes 72,076 21.5 109,363 51.0 <0.001 No 263,738 78.5 105,068 49.0
Acquisitive crime against the household
Yes 43,385 19.3 47,304 44.0 <0.001 No 181,660 80.7 60,188 56.0
Domestic burglary Yes 28,204 28.9 32,023 53.4 0.002 No 69,325 71.1 27,913 46.6
Criminal damage Yes 28,691 25.9 62,059 58.0 <0.001 No 82,078 74.1 44,880 42.0
All personal crimes2 Yes 258,529 31.9 506,445 65.2 <0.001
No 551,121 68.1 270,285 34.8 All violence Yes 215,657 39.5 464,013 76.1 <0.001
No 330,277 60.5 146,073 23.9 Acquisitive crime against the individual
Yes 42,872 16.3 42,432 25.5 0.039 No 220,844 83.7 124,212 74.5
All theft Yes 59,686 14.2 79,482 34.3 <0.001
No 360,010 85.8 152,525 65.7
1Weekend includes the following original categories: Friday evening, Saturday, Sunday, early Monday and weekend can’t say. 2Not including rape and indecent assault. Does the contribution of alcohol vary by the sex of the offender?
Table 20 reports whether the offender was under the influence of alcohol according to the sex of the offender(s), by crime category. Across all crime categories, the sex of the offender(s) did not affect whether or not the crime was reported as being alcohol-related.

Alcohol-related crime indicators
28
Table 20: Drinking status of the offender(s) by offender sex and crime category, CSEW 2013/2014, weighted data Crime category Was
offender under the influence of drink?
Sex of the offender(s) P value Male Female Both
N % N % N %
All household offences
Yes 150,129 34.4 24,638 32.5 21,621 32.9 0.829 No 286,414 65.6 51,112 67.5 44,002 67.1
Acquisitive crime against the household
Yes 75,706 27.7 14,491 31.4 3,860 16.6 0.983 No 197,827 72.3 31,699 68.6 19,408 83.4
Domestic burglary Yes 53,656 40.0 7,537 42.3 0 0 0.105 No 80,430 60.0 10,281 57.7 5,885 100
Criminal damage Yes 74,423 45.7 10,147 34.3 17,761 41.9 0.268 No 88,586 54.3 19,412 65.7 24,594 58.1
All personal crimes1
Yes 608,424 49.5 107,557 39.1 54,055 53.4 0.586 No 619,910 50.5 167,477 60.9 47,170 46.6
All violence Yes 537,075 60.2 96,773 46.8 52,076 71.1 0.417 No 355,739 39.8 109,940 53.2 21,173 28.9
Acquisitive crime against the individual
Yes 71349 21.3 10,784 15.8 1,979 7.1 0.299 No 264,171 78.7 57,537 84.2 25,996 92.9
All theft Yes 107,983 21.7 24,483 21.8 5,839 11.4 0.656
No 388,987 78.3 87,879 78.2 45,404 88.6
1Not including rape and indecent assault.

Alcohol-related crime indicators
29
4.0 Calculating rates; the denominator
The current methodology used to calculate the rates of alcohol-related crimes, uses the resident population as the denominator. Police recorded crime data show that people travel to another local authority to commit crime. People may also be likely to travel to socialise and drink alcohol. Table 8 shows that 22.9% of crimes committed within Manchester local authority were committed by people that lived in a different local authority. Table 15 shows that 30.4% of crimes committed in Ribble local authority were committed by someone that lived in a different local authority. This is potentially problematic if this migration is systematic. For example, people migrate from surrounding local authorities into large metropolitan local authorities in order to commit crime, because the rate of alcohol-related crime will be overestimated in the large metropolitan centre and underestimated in the surrounding local authorities. Therefore, as part of this review, the possibility of using other data sources as the denominator was investigated. More specifically, the availability of data sources that accounted for short-term migration patterns was investigated. This investigation failed to identify an alternative source for denominator. For the CSEW, the respondent answers on behalf of the household for household crimes (Office for National Statistics 2015b). Therefore, if household crimes are included in LAPE the number of households, rather than the population, should be used as the denominator. Household estimates are available from the Office for National Statistics.

Alcohol-related crime indicators
30
5.0 Summary
5.1 Summary of findings
• the data source has an impact on the proportion of crimes that are alcohol-related. Taking violence for example, the NEW-ADAM system reported that 37% of crimes were alcohol-related, Greater Manchester recorded crime data show that 25.4% were alcohol-related and the CSEW show that 58.5% are alcohol-related (Figure 1)
Figure 1: Percentage of violent crimes recorded as alcohol-related by data source • the contribution of alcohol to crime varies by crime category and local authority
5.2 Summary of restrictions and limitations
• historically, the alcohol marker which is included in police recorded crime data was currently not fit for this purpose. It was not mandatory to collect this information and not all forces were doing so. Other problems include: 1) it is not possible to ascertain if a none-yes response for alcohol meant that the crime was not alcohol-related, that the involvement of alcohol was unknown or the police officer did not ask/record this information; 2) there was no standard definition of an ‘alcohol-related’ crime so it is possible that different police forces were recording these crimes differently; 3) the alcohol marker indicated that alcohol influenced the crime but it does not say if it was the offender who was drinking, or the victim or both. However, during the production
0
10
20
30
40
50
60
70
NEW ADAM Police (GreaterManchester)
CSEW
Per
cent
age
Data source

Alcohol-related crime indicators
31
of this report, the Home Office produced a standard definition for ‘alcohol-related’ which all forces will be adopting2
• it is not appropriate to use fixed alcohol-attributable fractions because analyses of the CSEW and police recorded crime data show the proportion of crimes that are alcohol-related varies considerably by week/weekend and day/night. Alcohol-attributable fractions should take into account day of the week and time of the day
• in order to account for day of the week and time of the day, data on these variables need to be available. The police recorded crime data indicate the earliest possible date/time and the latest possible date/time the crime occurred. This information is not always known; for Greater Manchester, the exact day was unknown for 25% of crimes
• data are reported by the police to the Home Office in 2 ways: 1) record level data via the Data Hub or 2) in aggregated returns. Day/time specific alcohol-attributable fractions cannot be applied to data that are sent as aggregated data. All forces should provide data via the Data Hub by April 2016. Police forces sending data via the Data Hub are mandated to send the time and date fields. For some forces, work continues on the quality assurance of these data (Kevin Smith, personal communication, 7 January 2016)
• the CSEW is not sufficiently large to calculate direct estimates at the local authority level. The CSEW could be used to generate alcohol-attributable fractions which could be applied to police recorded crime data
• crime categories in the police recorded crime are not directly comparable to the crime categories in the CSEW. The Office for National Statistics produces a table of ‘comparable crimes’ which can be used to map crime categories from the CSEW to the police recorded crime for a small number of crime categories. However, this mapping is not always complete; the police recorded crime category of violence, for example, comprises many more offence subcategories than the CSEW category of violence
• there were 9,282 victim forms in the 2013/2014 CSEW dataset on which estimates would be based. However, many victims either did not have contact with the offender, or any information about them, or was unable to determine whether the perpetrator was under the influence of alcohol. In addition, a small number of victim forms could not be included in the analyses because they were cases outside the reference period, had no valid offence code, or did not occur in England or Wales. As a result, the number of victim forms is reduced to 1,567. If the data were further split by day/night/week/weekend for the comparable crime subset, the sample size on which the alcohol-attributable fractions are calculated would be small, even if multiple years were combined. The CSEW does have a three year dataset (2012/2013 to 2014/2015) which would facilitate more robust analyses than single year data
2 Section 7.0 contains updated information about the reporting of alcohol in police recorded crime data.

Alcohol-related crime indicators
32
• the current methodology used to calculate the rates of alcohol-related crimes uses the resident population as the denominator. This investigation shows that people migrate to commit crimes outside the local authority in which they live. If systematic (ie people migrate to large metropolitan local authorities to commit crime) this is problematic because the rate of crime will be overestimated in these metropolitan local authorities and underestimated in surrounding local authorities. This investigation failed to identify an alternative data source which could be used as the denominator which takes into account temporary migration
• analysis of the Greater Manchester police recorded crime data shows that offenders commit multiple alcohol-related crimes. If the indicators are expressed as person-specific (not crime-specific) rates, and the resident population is used as the denominator, a person should only be reported once in the numerator if using police recorded crime data

Alcohol-related crime indicators
33
6.0 Options for calculating the alcohol-related crime indicators
Findings from this investigation were presented to a stakeholder meeting held on 28 April 2016. This section describes the options for calculating the alcohol-related crime indicators included in LAPE that were discussed by the stakeholders at this meeting. Section 7.0 of this report details the outcome of this meeting.

Alcohol-related crime indicators
34
Option 1 Option 2 Option 3 Description Do not update the methodology and continue as before. Use the existing AAFs and apply these to police recorded crime data.
Description Use the alcohol marker in the police recorded crime data to directly calculate the proportion of crimes that are alcohol related and use the resident population as the denominator.
Description Calculate AAFs for each crime category using the CSEW (three year dataset: 2012/2013 to 2014/2015) for four combinations (day/night/week/weekend) and apply these to police recorded crime data and use the resident population as the denominator.
Requirements As before.
Requirements Requires all police forces collect data on alcohol and in a consistent manner. Requires the data to be made publically available at the necessary geographies or willingness from the Home Office to do the analysis for us. Crimes committed by more than one person need consideration because it would not be appropriate to double count the crime.
Requirements Requires the Home Office to apply the AAFs to the police recorded crime and calculate estimates for all the necessary geographies (they cannot release the raw data to us so that we can do this). The Home Office they say they would need a discussion about resources. Crimes committed by more than one person need consideration because it would not be appropriate to double count the crime.
Pros Consistency across a long time frame.
Pros This provides a direct assessment and does not rely on the application of AAFs. Can account for multiple crimes being committed by the same person. Can select whatever crime categories stakeholders want. The indicator is easy to interpret.
Pros We can do this now. Can account for multiple crimes being committed by the same person.
Contras The current AAFs are based upon data collected 15 years ago. Much has changed in the last 15 years in terms of alcohol licensing and alcohol guidelines. The current methodology is based upon fixed AAFs and therefore do not account for whether the crime occurred during the day/night and week/weekend.
Contras The alcohol marker is not currently fit for this purpose. The alcohol marker will be reported to the Data Hub from April 2016 but reporting is voluntary in the first year. The aim is to make it mandatory from April 2017. Calculating rates using the resident population assumes people commit crimes in the area in which they live.
Contras Police forces supply data to the Home Office in two ways: record level data to the Data Hub or as aggregated returns. Day/time specific AAFs could not be applied to forces that send aggregated returns. All forces are moving towards providing record level data to the Data Hub. Data sent to the Data Hub contain date and time of the offence. However, some forces provide data where the time field defaults to 00.00 for all crimes.

Alcohol-related crime indicators
35
Option 1 Option 2 Option 3 Calculating rates using the resident population assumes people commit crimes in the area in which they live. Does not account for multiple crimes being committed by the same person.
The date/time of the crime is not always known. Therefore, in a proportion of cases (25% for Greater Manchester), date/time specific AAFs could not be applied. The number of CSEW records used to calculate the AAFs (by offence category, day/night/week/weekend) will be small. AAFs could only be calculated for the following CSEW categories as these are comparable to police recorded crime categories: • violence • robbery • theft from a person • domestic burglary in a dwelling • vehicle-related thefts • bicycle theft • criminal damage to a vehicle Interpretation of the indicator is difficult for some crime categories. The police recorded crime category of violence, for example, comprises many more offence subcategories than the CSEW category of violence. Consequently, the AAFs can only be applied to a subset of police recorded crimes for violence. The violence indicator will therefore not reflect total violence. Relies on AAF rather than direct estimation. Calculating rates using the resident population assumes people commit crimes in the area in which they live. While variations in the contribution of alcohol to crimes by day/night and week/weekend can be taken into consideration other variations might exist which are not accounted for (for example differences by local authority).

Alcohol-related crime indicators
36
7.0 Stakeholder consultation
The findings of this methodological review and the options presented in section 6 of this report were presented to stakeholders on 28 April 2016. In order to ensure a range of stakeholders were included in the consultation, invitations were sent to a number of organisations but not all organisations were able to participate (see section 11.0 for a list of the stakeholders). 7.1 Data sources and methodological options
Stakeholders discussed the data sources and methodological options presented in the earlier sections of this report. Other data sources and methodological options were also discussed. A summary of information relating to the data sources and methodological options is presented here. New Arrestee Survey
Stakeholders asked whether it would be possible to calculate alcohol-related crimes using the existing methodology with more up to date alcohol-attributable fractions available from the latest Arrestee Survey. This suggestion was subsequently investigated and has the following limitations: the most recent survey was conducted in the year 2005/2006 and so the data is already dated; the data does not take into account the impact of time of day/day of the week on alcohol-related offending; and response bias is a significant issue. Only 23% of eligible respondents actually completed an interview in 2005/2006 and for those arrested for ‘drunk/disorderly and other alcohol’ offences the response rate was only 8% (Boreham, Cronberg et al. 2007). Modelling
Stakeholders discussed the possibility of developing a multivariate model to measure associations between alcohol-related crime and a number of explanatory variables using the full CSEW dataset. The modelled estimates could then be used to estimate alcohol-related crime at the local level. However, this option was rejected; modelled estimates would need to be updated each year, modelled estimates often produce wide confidence intervals and the number of victim forms available in the CSEW on which to derive the model is small (see section 3.2 and Table 16 for further details). Police recorded crime
Stakeholders from the Home Office were able to provide an update on police force reporting of the alcohol marker. In total, 28 police forces are already providing alcohol data and all forces are expected to do so from April 2017. The Home Office has introduced a definition for ‘alcohol-related’ which is as follows: any notifiable offence (crime) where it is perceived, by the victim or any other person, that the effect of alcohol consumption on the offender or victim was an aggravating factor. The qualifier should

Alcohol-related crime indicators
37
be used where the consumption of alcohol has been associated with the offence (Home Office 2016). From April 2016 it became mandatory for police forces to record the XY coordinates (eastings and northings) or the postcode of where a crime occurred so data on the location of the crime should be robust. While the police recorded crime data was deemed by the group as reliable, some concerns were expressed in relation to the fact that police recorded crime underestimates total crime [in 2013/2014 an investigation of this issue showed that only 43% of total comparable crimes reported in the CSEW were included in the police recorded crime data (Office for National Statistics 2015b)]. A suggestion was made to use a multiplier derived from the CSEW. This multiplier would be applied to the police recorded crime data in order to account for the underestimation in the total number of recorded crimes. A subsequent investigation of this suggestion identified a report which provided multipliers but these are not available for all police recorded crimes (Home Office 2011). A question on the use of multipliers was included in the survey of data users (see section 8.0). Stakeholders discussed the types of crimes that were included in police recorded crime and the implications of this on the data provided. For example, a public order offence such as a fight in a bar where the victim does not wish to take the matter further would not be included in police recorded crime. Stakeholders felt it was important to consult users of the data on this issue (see section 8.0). 7.2 Calculating rates of alcohol-related crimes
The possibility of using the ‘travel to work and other geographic analysis’ data, derived from census data, as the denominator to take into account temporary migration was discussed. However, the consensus was that the resident population should be used as the denominator. In terms of the numerator it was decided that crimes should be attributed to the location of the crime rather than the residence of the offender. It was also decided that a person who commits more than one alcohol-related offence within the relevant time period should be recorded twice. The rates will, therefore, reflect total alcohol-related crime in relation to the size of the resident population and, as such, will represent the impact of crime on the local community. 7.3 Proposed methodology
Stakeholders decided that the crime indicators should be derived from the alcohol marker in the police recorded crime. This approach directly measures alcohol-related crime and can take into account variations in the contribution of alcohol to crime (for example by local authority and when the crime occurred). It will not be possible to provide this data for all forces until July 2018. In the interim, the alcohol marker will be used to produce crime indicators for those forces that are already reporting this information. For those forces not currently reporting the alcohol marker, the indicators will be estimated until July 2018. Figures derived using the interim methodology would need to be treated with caution. Data showing increases in the contribution of alcohol to crime over the first few years of reporting might simply reflect better recording of alcohol data. However, the group felt that using this interim approach would be better than

Alcohol-related crime indicators
38
providing no data or using a totally different interim methodology which would only be operational for a couple of years. Ideally, multipliers derived from the CSEW should be applied to police recorded crime data in order to account for non-reporting of crimes to the police. However, it is not possible to apply multipliers to all crime categories included in the police recorded crime dataset. The desire to use multipliers was assessed in the data user survey (see section 8.0). Alcohol-related crimes will be expressed as rates. The numerator will be the number of alcohol-related crimes occurring in a local authority. The denominator will be the resident population for that area.

Alcohol-related crime indicators
39
8.0 Data user survey
8.1 Methodology
An online survey (see the appendix) was sent to LAPE data users through existing networks. These initial contacts were also asked to circulate the survey more widely. Paper copies of the survey were available on request. The survey was open between 24 June and 19 July 2016. 8.2 Results
A total of 41 people took part in the survey. The first questions asked about the usefulness of the proposed methodology and the usefulness of applying a multiplier to police recorded crime data in order to account for the fact that police recorded crime data underestimates total crime. Responses to these questions are described in Table 21. The majority of respondents stated that the proposed method would provide useful data but support for the use of multipliers was mixed. Table 21: Usefulness rating of the proposed methodology and multipliers; data user survey, 2016 Will the proposed method
provide useful data? Would applying a multiplier to
police recorded crime be useful?
N % N % Yes 27 65.9 14 35.0 Maybe 10 24.4 15 37.5 No 3 7.3 7 17.5 Do not know 1 2.4 4 10.0 Total 41 100 40 100
A number of participants also left free text comments about the usefulness of the proposed new methodology. The most frequently mentioned concern raised by participants was the robustness of police reporting. More specifically respondents were primarily concerned that forces were not recording the alcohol marker at all and that there were inconsistences across forces in what constituted an ‘alcohol-related’ crime. However, these concerns will be largely negated by the fact that forces are mandated to collect the alcohol marker from April 2017 and have been provided with a definition for what constitutes an alcohol-related crime. A third concern raised by respondents related to the fact that the police recorded crime data is affected by recording practices and policing policies. Recording practices should be the same across forces but do change over time, and pro-active policing in relation to alcohol (such as increasing the number of night time patrols) could over-inflate alcohol-related crime rates for an area. These issues and their potential impact on alcohol-related crime rates will be described in the metadata that accompany the

Alcohol-related crime indicators
40
indicators. Next, a number of participants requested the alcohol-related crime indicators to be provided at lower level geographies as this would support local decisions such as granting alcohol licences. Unfortunately, providing data at lower geographies is currently not possible within LAPE. Finally, in response to other comments: the indicators will be crime-based (and will therefore accommodate repeat offending); will not be presented by sex (the alcohol marker relates to an incident and not a specific person); will use the resident population as the denominator rather than the number of crimes; and the raw numbers for alcohol-related crimes will be available on the download pages in the LAPE tool. Comments about the use of multipliers were mostly favourable. However, some participants felt that the use of multipliers would cause confusion. Many participants stated that they would like to see the reported rates, in addition to the inflated rates, if multipliers were used. The final questions of the survey asked for feedback on the usefulness of crime categories. Responses are reported in Table 22. In line with these results, alcohol-related crime indicators included in LAPE in the future will be: total crime, violence against the person, sexual offences and public order offences. Table 22: Usefulness rating of crime categories; data user survey, 2016 Not at all
useful Slightly useful
Moderately useful
Very useful
Extremely useful
N % N % N % N % N % Violence against the person
0 0 0 0 3 7.9 6 15.8 29 76.3
Sexual offences 0 0 0 0 3 7.9 13 34.2 22 57.9 Robbery 0 0 6 16.7 12 33.3 9 25.0 9 25.0 Theft offences 0 0 5 13.5 10 27.0 12 32.4 10 27.0 Criminal damage and arson
0 0 2 5.4 8 21.6 14 37.8 13 35.1
Drug offences 0 0 1 2.7 13 35.1 7 18.9 16 43.2 Public order offences
0 0 1 2.9 5 14.3 9 25.7 20 57.1
‘Do not know’ responses and missing data are not reported in this table; valid percentages are presented. ‘Do not know’ responses were as follows: violence against the person (N=2), sexual offences (N=2), robbery (N=4), theft (N=3), criminal damage (N=3), drug offences (N=3) and public order offences (N=4). Some participants provided free text comments on the types of crimes they would like to see included in LAPE. Generally, participants asked for as many indicators as possible and/or greater granularity, with indicators presented by gender, at lower geographies, by victim/perpetrator, by whether the victim had consumed alcohol and by specific crimes rather than crime categories. Unfortunately, many of these requests cannot be accommodated. In some instances, the data will not support these requests (for example data on speed awareness courses or according to whether alcohol use was by the offender, victim or both). One respondent requested data on alcohol-related domestic violence. This was investigated and is unfortunately not possible because domestic violence data is not

Alcohol-related crime indicators
41
available at authority level. Other requests cannot be accommodated by the LAPE team because they would necessitate a significant increase in capacity. However, it is important to note that bespoke requests for data can be directed to Local Knowledge and Intelligence Service Teams. Other participants felt that focusing on the major crime categories (rather than lower level crimes) was best because these would be more likely to have a degree of stability over time and would therefore be more reliable.

Alcohol-related crime indicators
42
9.0 Conclusions
Following this methodological review, stakeholder workshop and data user survey, the alcohol-related crime indicators will be derived from the alcohol marker in the police recorded crime data. The indicators will be crime (not person) based. Crude rates will be calculated, with the resident population used as the denominator. Each crime will only be counted once (where there are multiple offenders per crime) but a person committing two alcohol-related crimes within a year will be recorded twice. The proposed indicator will therefore account for repeat offending. Alcohol-related crime indicators will be generated for the following: • total crime • violence against the person • sexual offences • public order offences Police recorded crime data for 2016/2017 is the first year of data that will be included in LAPE. Not all police forces are collecting the alcohol marker in 2016/2017, so crude rates will be estimated for some local authorities. Reporting of the alcohol marker is expected to become mandatory from April 2017. Police recorded crime data for 2016/2017 will not be available until July/August 2017, so it is not possible to include alcohol-related crime indicators in the LAPE dataset until this time. After this, the alcohol-related crime indicators will be updated annually.

Alcohol-related crime indicators
43
10.0 References
Altman, D. (1999). Practical statistics for medical research. Boca Raton, Chapman & Hall/CRC. Boreham, R., A. Cronberg, L. Dollin and S. Pudney (2007). The Arrestee Survey 2003 - 2006 (2nd edition). London, Home Office. Cabinet Office (2003a). Alcohol misuse: How much does it cost? London, Cabinet Office. Cabinet Office (2003b). Annexes. Alcohol misuse: How much does it cost? London, Cabinet Office. Home Office (2011). Revisions made to the multipliers and unit costs of crime used in the Integrated Offender Management Value for Money Toolkit. London, Home Office. Home Office (2016). 2016/17 annual data requirement for police forces in England and Wales. London, Home Office. Office for National Statistics (2015a). Chapter 5: Violent crime and sexual offences - alcohol-related violence. London, Office for National Statistics. Office for National Statistics (2015b). User guide to crime statistics for England and Wales. London, Office for National Statistics. Office for National Statistics (2015c). Chapter 1: An overview of violent crimes and sexual offences. London, Office for National Statistics. Office for National Statistics (n.d.a). Crime Survey for England and Wales (CSEW) dataset user guide: adults aged 16 and over, 2013/14. London, Office for National Statistics. Office for National Statistics (n.d.b). 2013-14 Crime Survey for England and Wales. Questionnaire (from October 2013). London, Office for National Statistics.

Alcohol-related crime indicators
44
11.0 Acknowledgements
The authors would like to thank the following people at Greater Manchester and Lancashire Police for facilitating data sharing of police data and answering questions in relation to the data: Philip Li, Natalie Dolan, Andrew Wright, Debbie Last and David Ottiwell. Sincere thanks go to all the stakeholders listed below for attending the workshop and/or their input into this report. Particular thanks to Kevin Smith. Kate Sweeney Public Health England Kevin Smith Home Office Joe Traynor Office for National Statistics Helen Tomkys Department of Health Sophie Riley Home Office Sacha Wyke Public Health England John Flatley Office for National Statistics Oliver Smith Public Health England Paul Duffy Public Health England North West Kulvir Randhawa Public Health England Sam Cox Public Health England Virginia Musto Public Health England Madeleine Rudolph Public Health England
Thanks to Oliver Smith, Mike Jecks, Simon Chamber and Emily South at Public Health England for quality assuring the analyses and/or reviewing the report. Thanks also to Clare Perkins, Public Health England, for her support throughout the project and her comments on the report. The Office for National Statistics provided the CSEW data. However, those that carried out the original collection and analysis of the data bear no responsibility for further analysis or interpretation.

Alcohol-related crime indicators
45
Appendix; data user survey
Introduction
Background to the new method: Police forces have recently started to collect data on whether or not a crime is alcohol-related. The Home Office has introduced a definition for ‘alcohol-related’ which is as follows: “any notifiable offence (crime) where it is perceived, by the victim or any other person, that the effects of alcohol consumption on the offender or victim were an aggravating factor. The qualifier should be used where the consumption of alcohol has been associated with the offence”. The proposed new methodology will use the alcohol marker in police recorded crime data to calculate the number of alcohol-related crimes in a local authority. Rates of alcohol-related crime will be produced using a local authority’s resident population as the denominator. Q1: Will this methodology provide data that you will find useful in terms of monitoring alcohol-related crime? Please select one response only. Yes No Maybe Do not know
Q2: If you have any comments on the proposed methodology please write them here: Q3: Police recorded crime data under-estimate total crime because not all crimes are reported to them. The Crime Survey for England and Wales has been used to evaluate this under-estimation for certain crimes. It is therefore possible to apply a ‘multiplier’ to the police recorded crime data in order to account for this underestimation. This is only possible for some crimes. Would applying a multiplier to police recorded crime be useful? Please select one response only. Yes No Maybe Do not know
Q4: If you have any comments on the use of multipliers please write them here:

Alcohol-related crime indicators
46
Q5: Police recorded crime data include many crimes which can be grouped into crime categories. We would like to know which crime categories you would like to see included in the alcohol profiles. Please rate how useful you would find each of these crime groups. Not at all
useful Slightly useful
Moderately useful
Very useful
Extremely useful
Do not know
Violence against the person
☐ ☐ ☐ ☐ ☐ ☐
Sexual offences ☐ ☐ ☐ ☐ ☐ ☐ Robbery (stealing with the use of force)
☐ ☐ ☐ ☐ ☐ ☐
Theft offences ☐ ☐ ☐ ☐ ☐ ☐ Criminal damage and arson
☐ ☐ ☐ ☐ ☐ ☐
Drug offences ☐ ☐ ☐ ☐ ☐ ☐ Public order offences ☐ ☐ ☐ ☐ ☐ ☐
Q6: If you have any comments on the types of crimes that you would like to see included in the alcohol profiles please write them here: