L’obesità nell’anziano - grg-bs.it · Obesità e sovrappeso sono fattori di rischio anche per...
78
L’OBESITÀ NELL’ANZIANO JOURNAL CLUB - 7 SETTEMBRE 2018 ANDREA CRUCITTI
Transcript of L’obesità nell’anziano - grg-bs.it · Obesità e sovrappeso sono fattori di rischio anche per...

L ’ O B E S I TÀ N E L L ’ A N Z I A N O
J O U R N A L C L U B - 7 S E T T E M B R E 2 0 1 8
A N D R E A C RU C I T T I

FOOD
INTAKE
ENERGY
EXPENDITURE
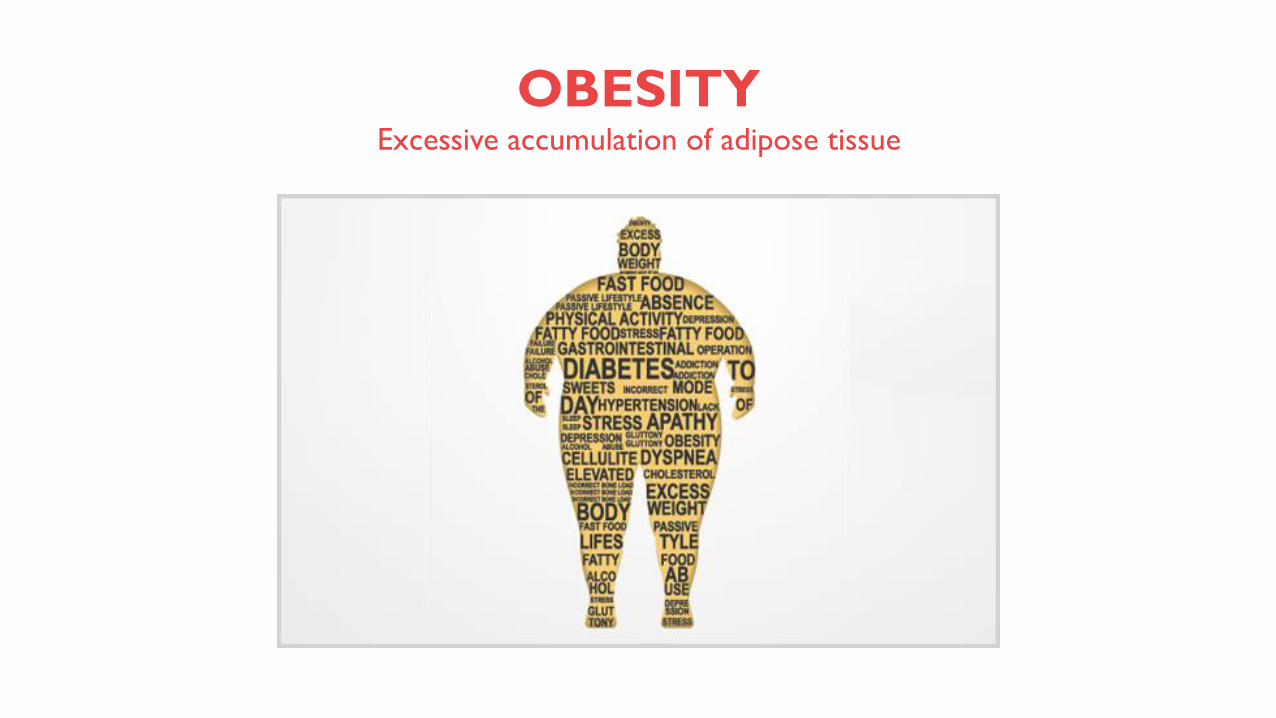
OBESITYExcessive accumulation of adipose tissue
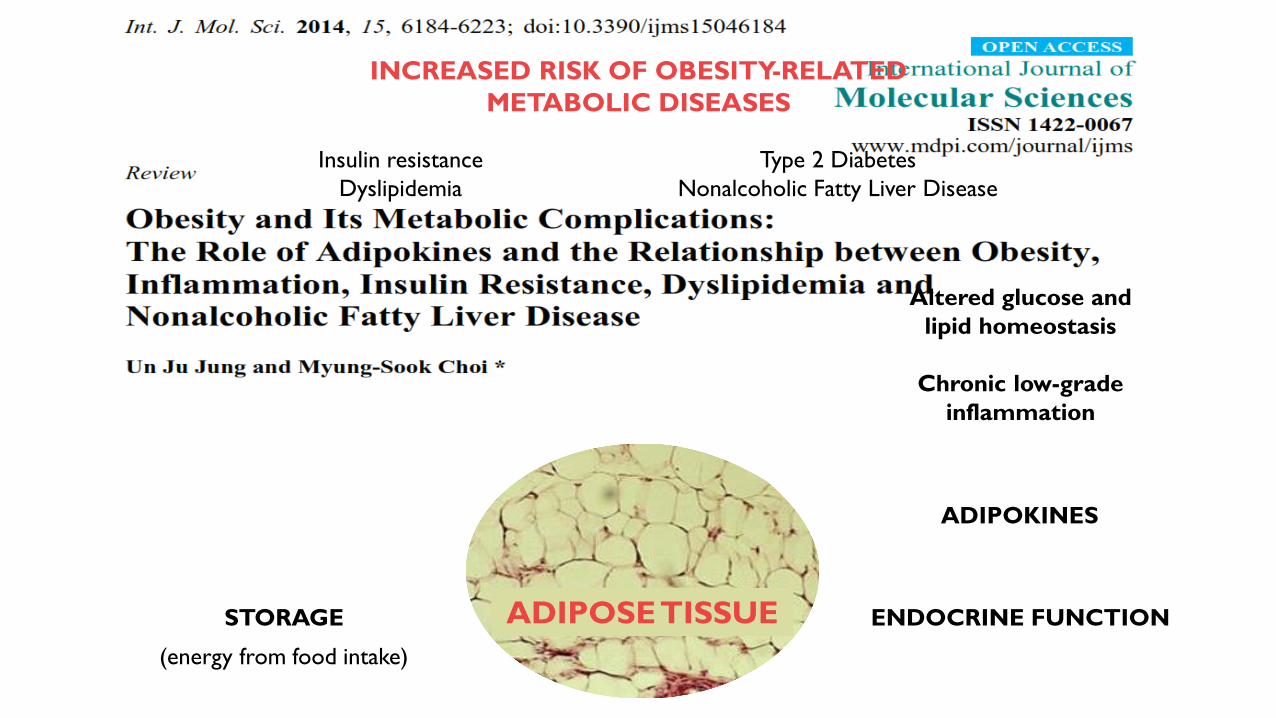
STORAGE ENDOCRINE FUNCTION
ADIPOKINES
Altered glucose and
lipid homeostasis
Chronic low-grade
inflammation
(energy from food intake)
ADIPOSE TISSUE
INCREASED RISK OF OBESITY-RELATED
METABOLIC DISEASES
Type 2 Diabetes
Nonalcoholic Fatty Liver Disease
Insulin resistance
Dyslipidemia
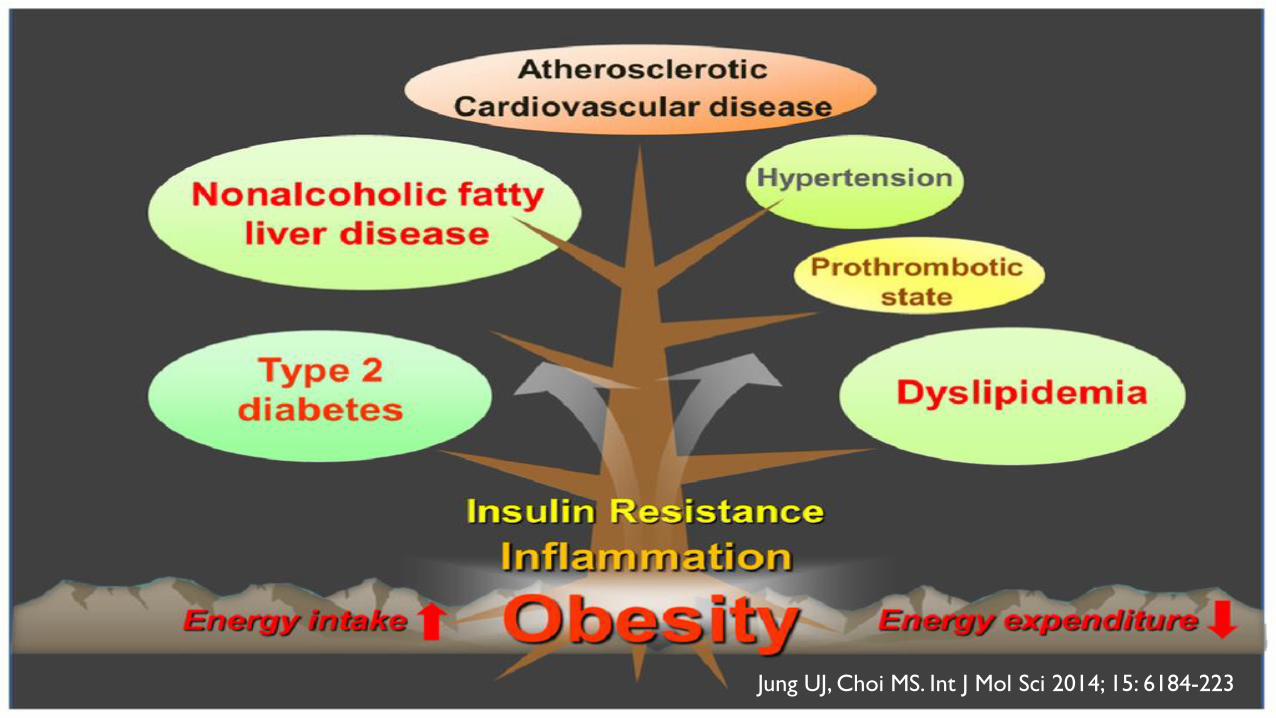
Jung UJ, Choi MS. Int J Mol Sci 2014; 15: 6184-223
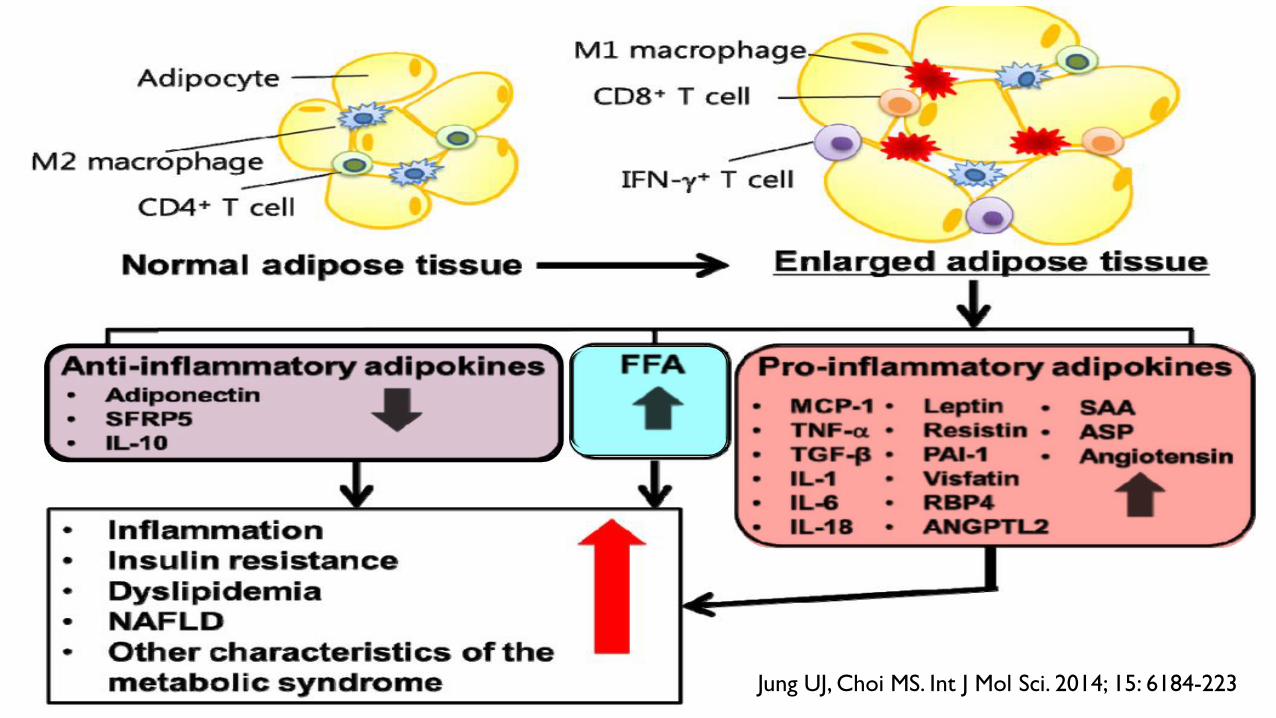
Jung UJ, Choi MS. Int J Mol Sci. 2014; 15: 6184-223
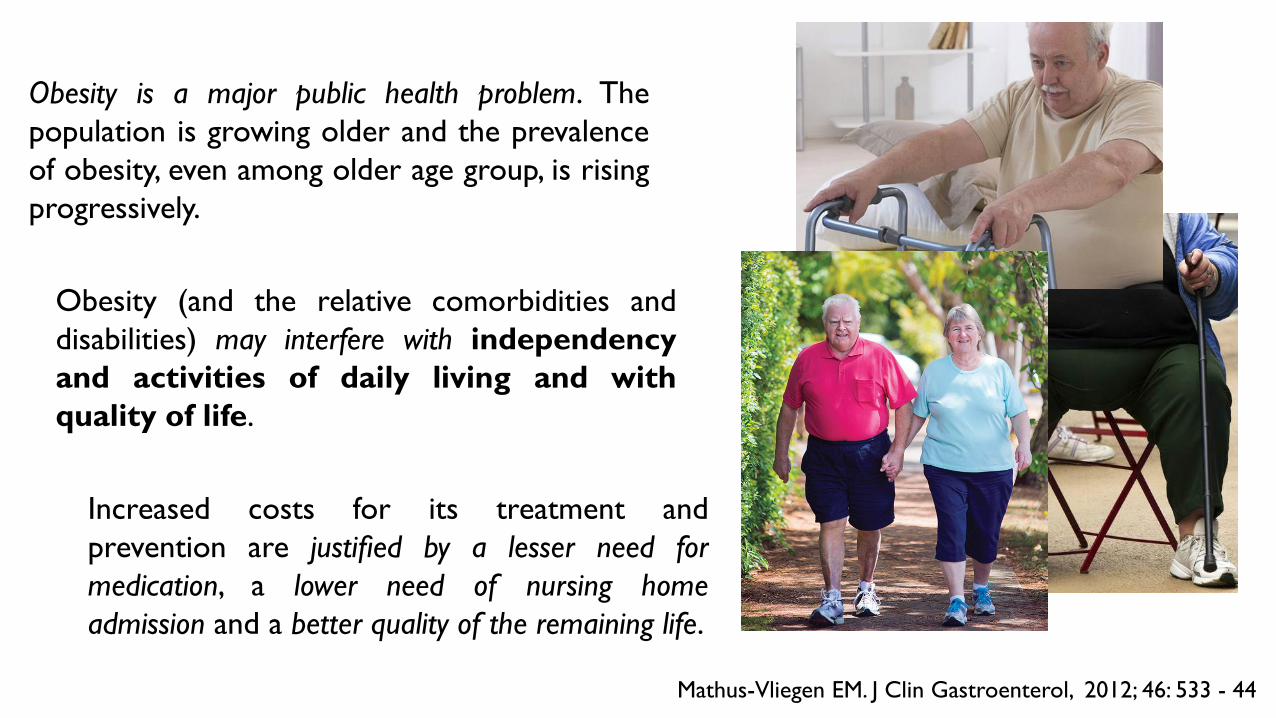
Obesity is a major public health problem. The
population is growing older and the prevalence
of obesity, even among older age group, is rising
progressively.
Mathus-Vliegen EM. J Clin Gastroenterol, 2012; 46: 533 - 44
Obesity (and the relative comorbidities and
disabilities) may interfere with independency
and activities of daily living and with
quality of life.
Increased costs for its treatment and
prevention are justified by a lesser need for
medication, a lower need of nursing home
admission and a better quality of the remaining life.
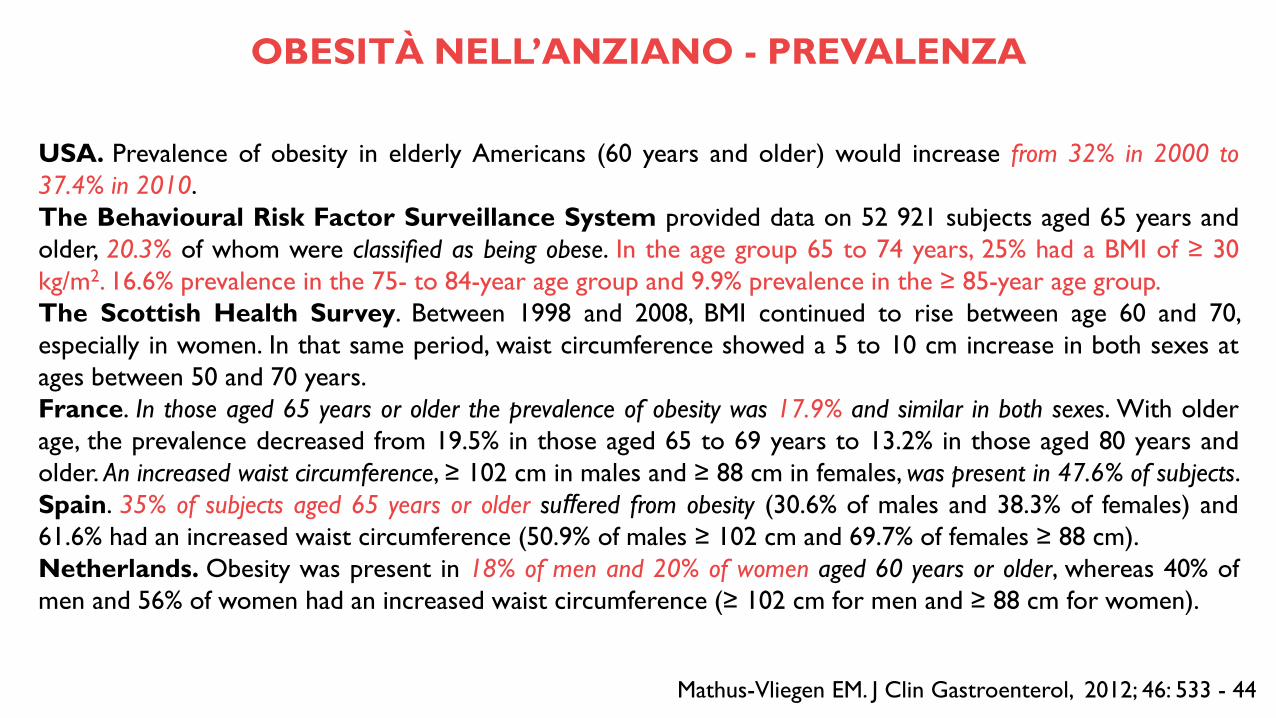
USA. Prevalence of obesity in elderly Americans (60 years and older) would increase from 32% in 2000 to
37.4% in 2010.
The Behavioural Risk Factor Surveillance System provided data on 52 921 subjects aged 65 years and
older, 20.3% of whom were classified as being obese. In the age group 65 to 74 years, 25% had a BMI of ≥ 30
kg/m2. 16.6% prevalence in the 75- to 84-year age group and 9.9% prevalence in the ≥ 85-year age group.
The Scottish Health Survey. Between 1998 and 2008, BMI continued to rise between age 60 and 70,
especially in women. In that same period, waist circumference showed a 5 to 10 cm increase in both sexes at
ages between 50 and 70 years.
France. In those aged 65 years or older the prevalence of obesity was 17.9% and similar in both sexes. With older
age, the prevalence decreased from 19.5% in those aged 65 to 69 years to 13.2% in those aged 80 years and
older. An increased waist circumference, ≥ 102 cm in males and ≥ 88 cm in females, was present in 47.6% of subjects.
Spain. 35% of subjects aged 65 years or older suffered from obesity (30.6% of males and 38.3% of females) and
61.6% had an increased waist circumference (50.9% of males ≥ 102 cm and 69.7% of females ≥ 88 cm).
Netherlands. Obesity was present in 18% of men and 20% of women aged 60 years or older, whereas 40% of
men and 56% of women had an increased waist circumference (≥ 102 cm for men and ≥ 88 cm for women).
Mathus-Vliegen EM. J Clin Gastroenterol, 2012; 46: 533 - 44
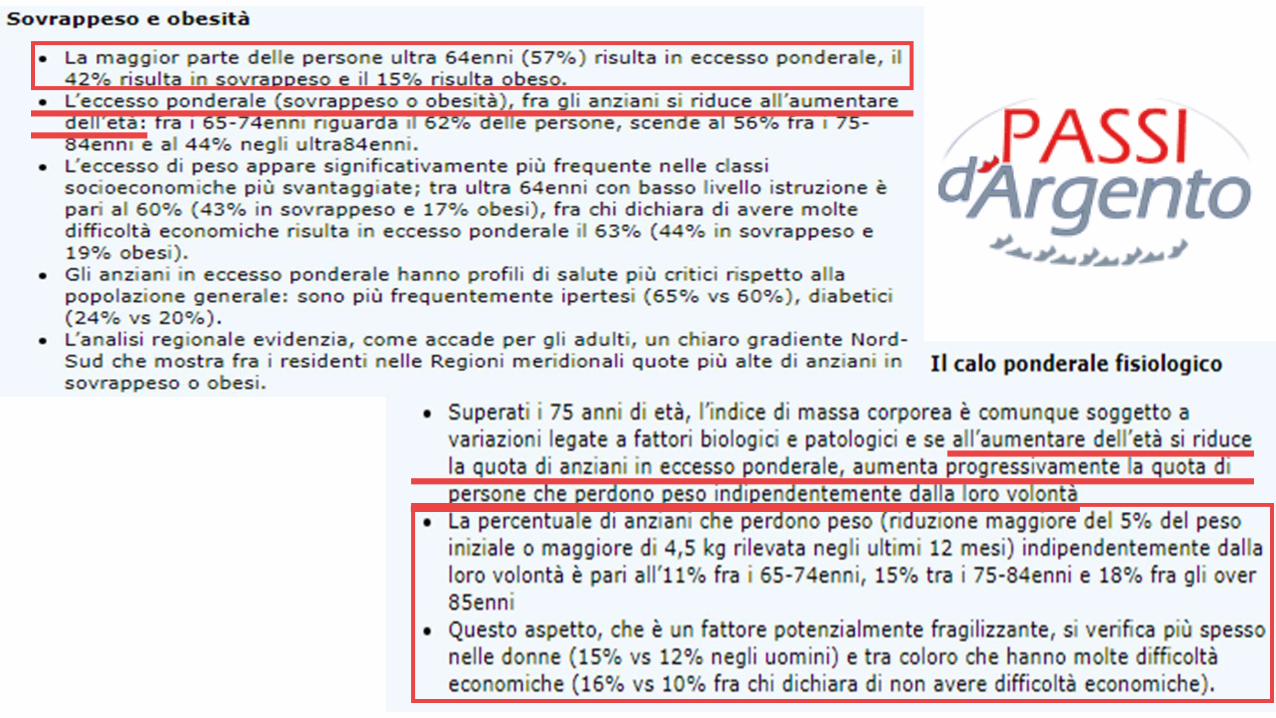
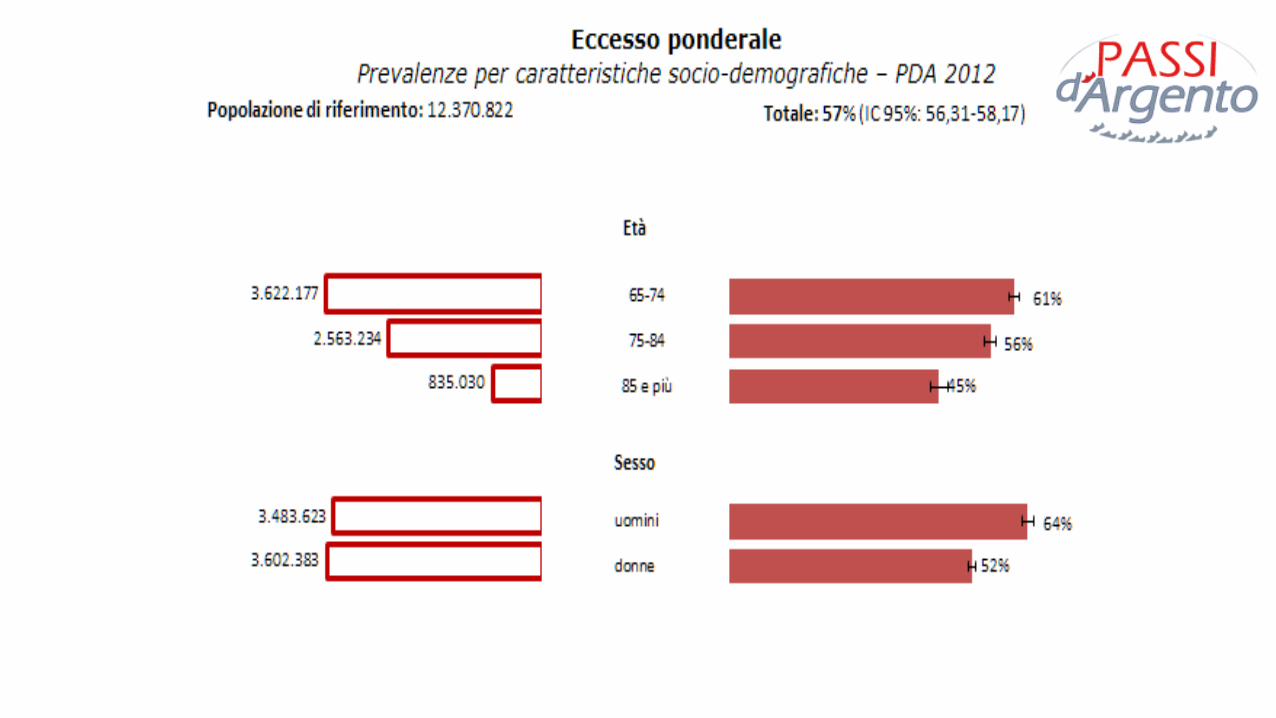
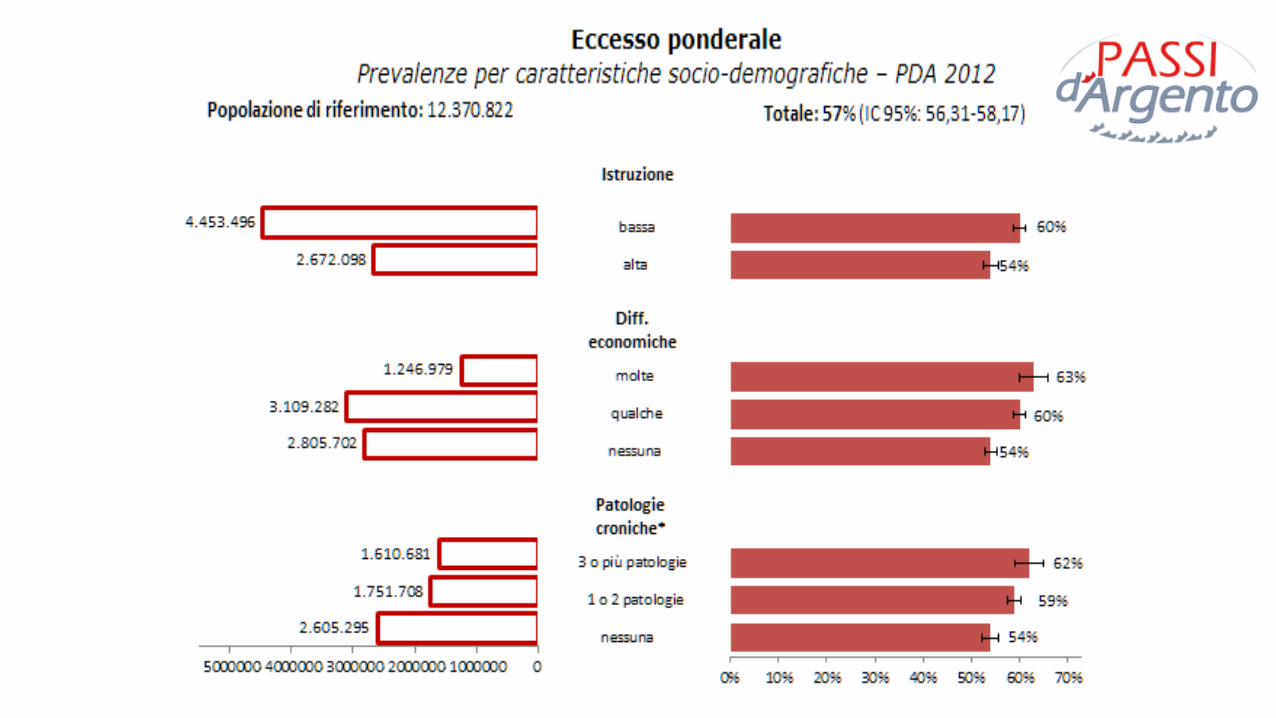
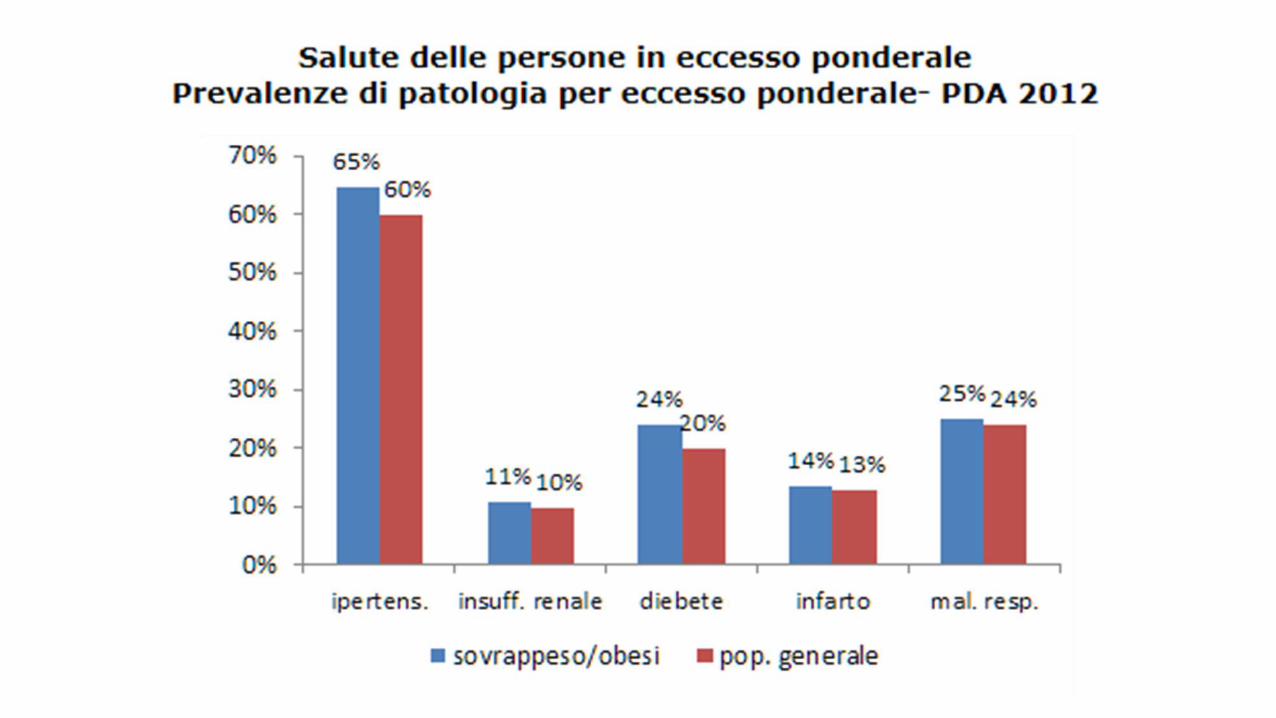
OBESITÀ NELL’ANZIANO - PREVALENZA
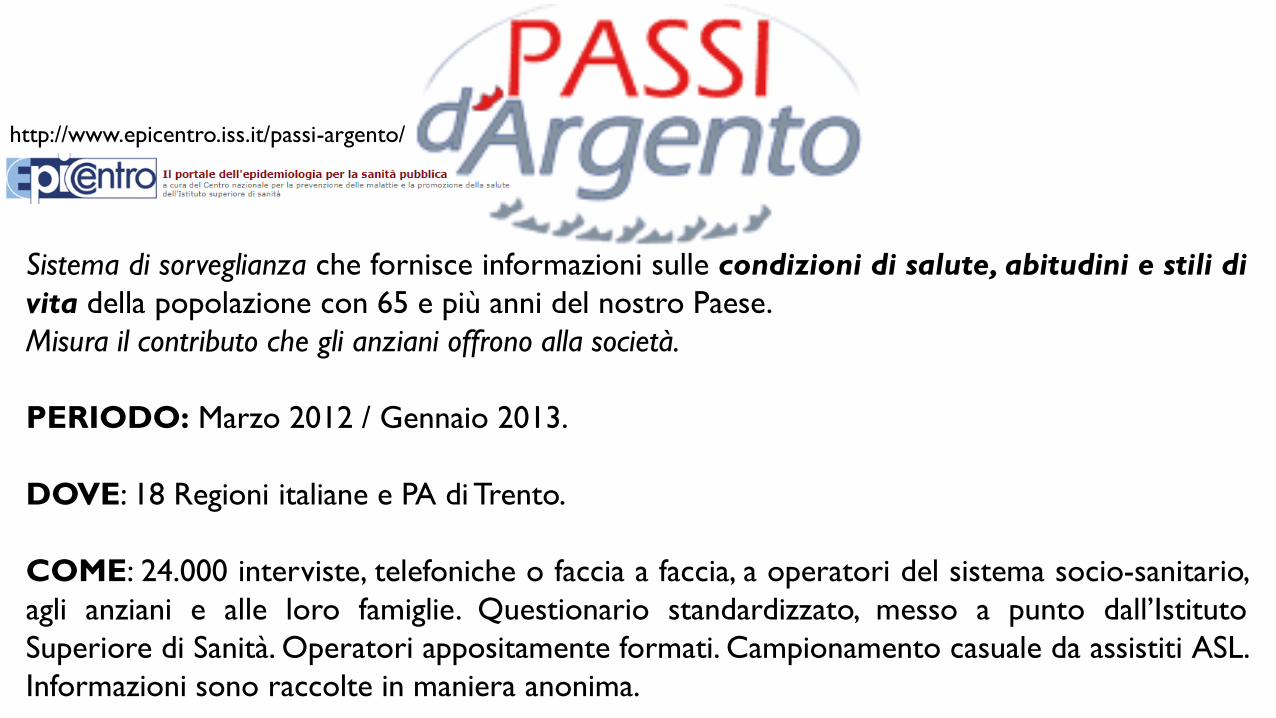
Sistema di sorveglianza che fornisce informazioni sulle condizioni di salute, abitudini e stili di
vita della popolazione con 65 e più anni del nostro Paese.
Misura il contributo che gli anziani offrono alla società.
PERIODO: Marzo 2012 / Gennaio 2013.
DOVE: 18 Regioni italiane e PA di Trento.
COME: 24.000 interviste, telefoniche o faccia a faccia, a operatori del sistema socio-sanitario,
agli anziani e alle loro famiglie. Questionario standardizzato, messo a punto dall’Istituto
Superiore di Sanità. Operatori appositamente formati. Campionamento casuale da assistiti ASL.
Informazioni sono raccolte in maniera anonima.
http://www.epicentro.iss.it/passi-argento/
Chiunque potrà conoscere, consultando il sito, le condizioni degli ultra65enni della Regione o
Azienda sanitaria partecipante.
Passi d’Argento seguirà nel tempo qualità di vita percepita, aspetti sociali, sanitari e ambientali.
Mettere a disposizione informazioni che possano promuovere le condizioni di vita.
Migliori condizioni di salute,↓ costi socio-sanitari,↑ risorse per famiglie e comunità.
Monitoraggio e valutazione piani sanitari e di prevenzione.
Raccolta dati periodica (ogni 1-2 anni). Possibile confronto ASL all’interno di una stessa
regione, ma anche stessa ASL nel tempo.
http://www.epicentro.iss.it/passi-argento/
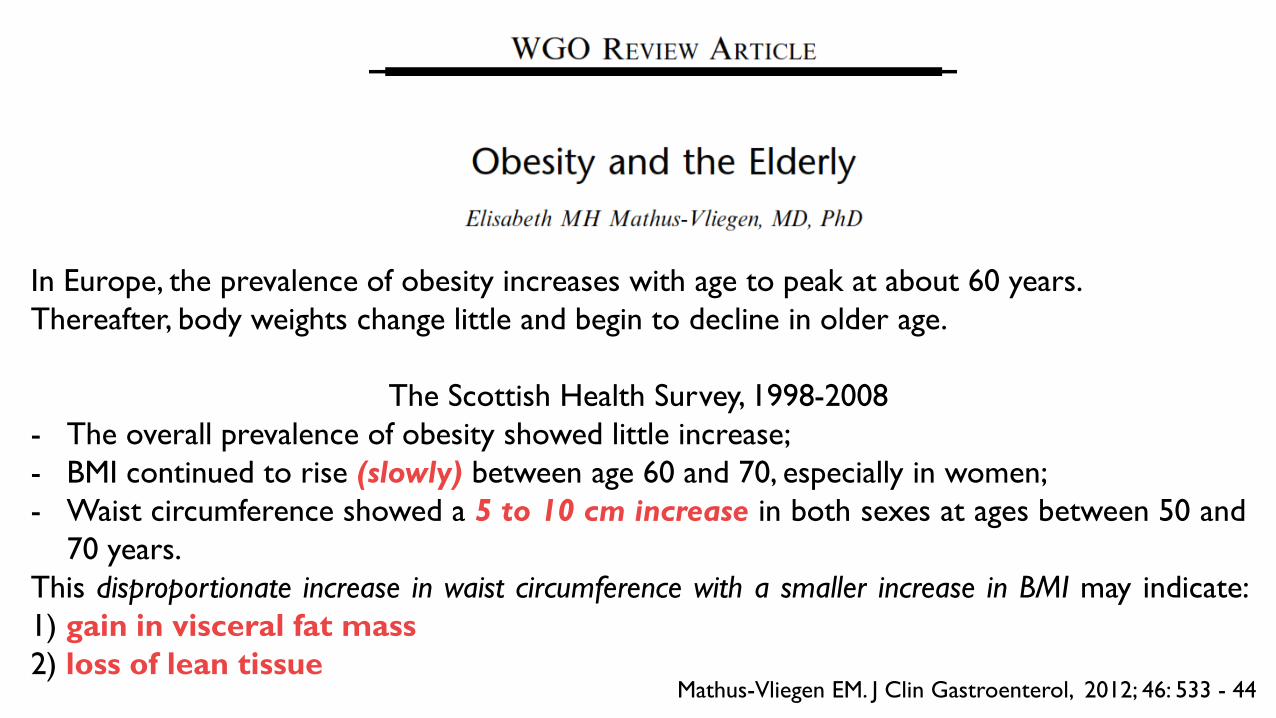
In Europe, the prevalence of obesity increases with age to peak at about 60 years.
Thereafter, body weights change little and begin to decline in older age.
The Scottish Health Survey, 1998-2008
- The overall prevalence of obesity showed little increase;
- BMI continued to rise (slowly) between age 60 and 70, especially in women;
- Waist circumference showed a 5 to 10 cm increase in both sexes at ages between 50 and
70 years.
This disproportionate increase in waist circumference with a smaller increase in BMI may indicate:
1) gain in visceral fat mass
2) loss of lean tissueMathus-Vliegen EM. J Clin Gastroenterol, 2012; 46: 533 - 44
Mathus-Vliegen EM. J Clin Gastroenterol, 2012; 46: 533 - 44
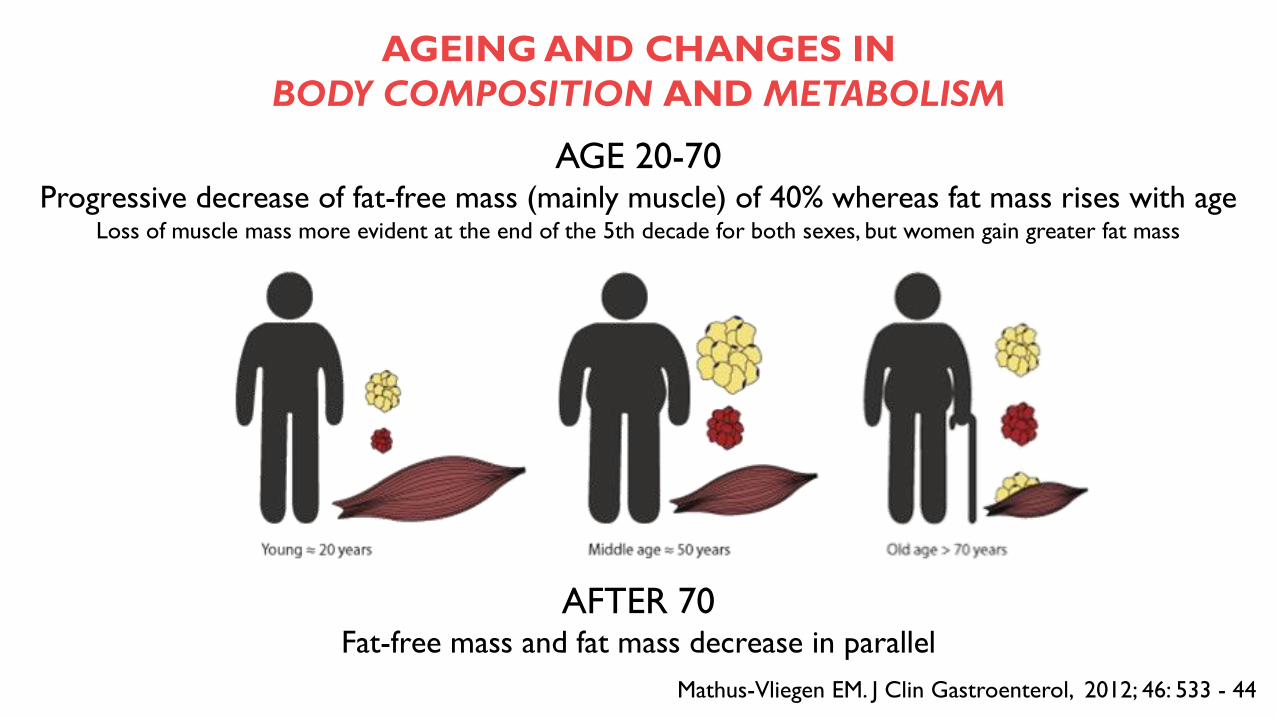
AGE 20-70Progressive decrease of fat-free mass (mainly muscle) of 40% whereas fat mass rises with age
Loss of muscle mass more evident at the end of the 5th decade for both sexes, but women gain greater fat mass
AFTER 70Fat-free mass and fat mass decrease in parallel
AGEING AND CHANGES IN
BODY COMPOSITION AND METABOLISM
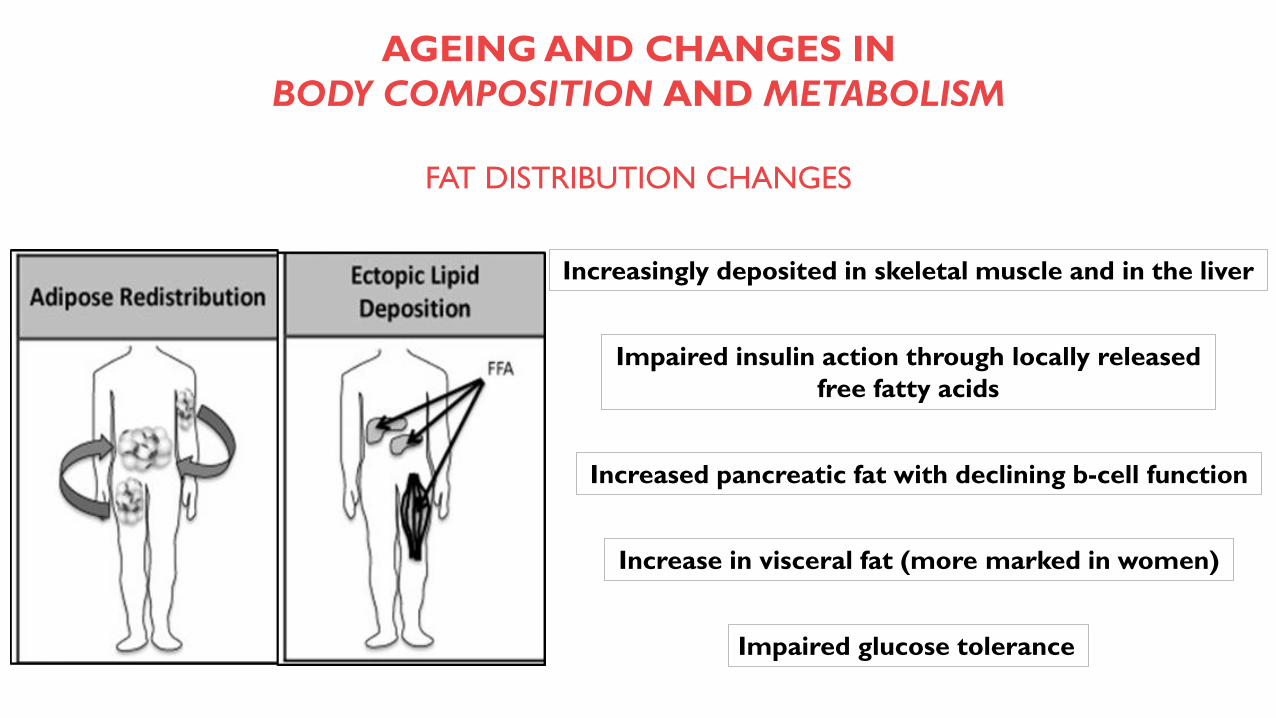
FAT DISTRIBUTION CHANGES
Increase in visceral fat (more marked in women)
Increasingly deposited in skeletal muscle and in the liver
Impaired insulin action through locally released
free fatty acids
Increased pancreatic fat with declining b-cell function
Impaired glucose tolerance
AGEING AND CHANGES IN
BODY COMPOSITION AND METABOLISM
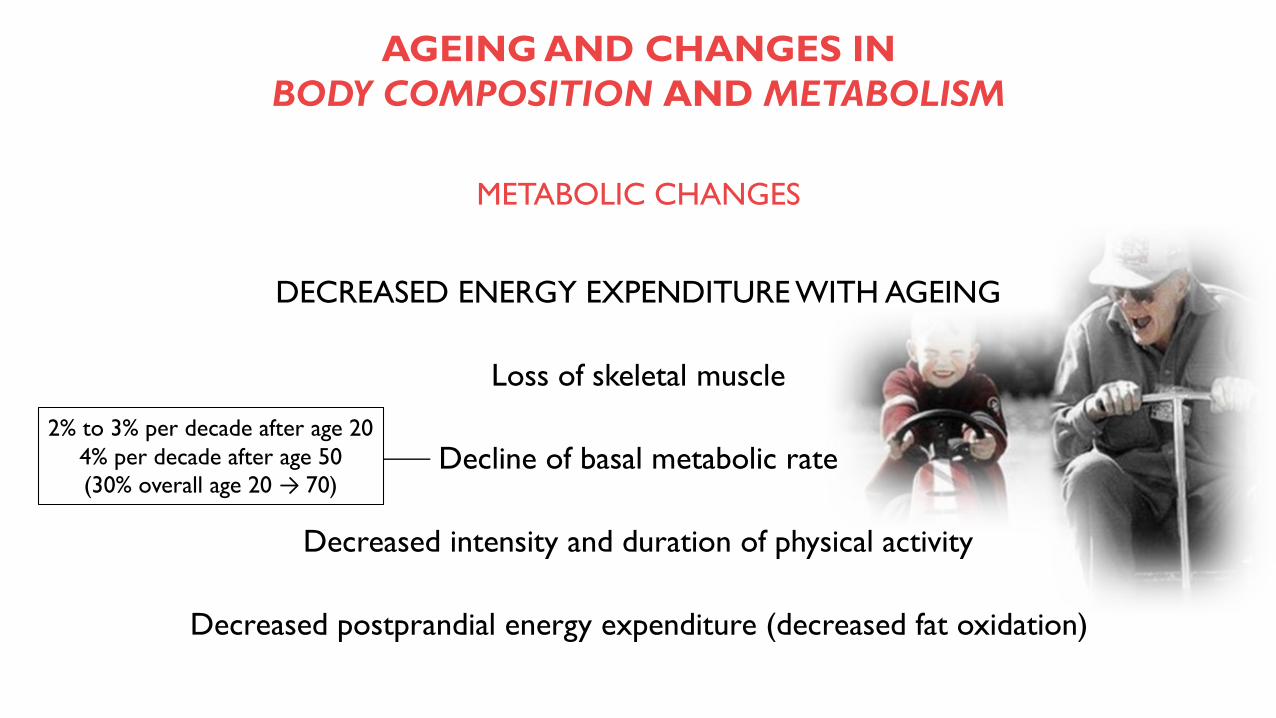
METABOLIC CHANGES
AGEING AND CHANGES IN
BODY COMPOSITION AND METABOLISM
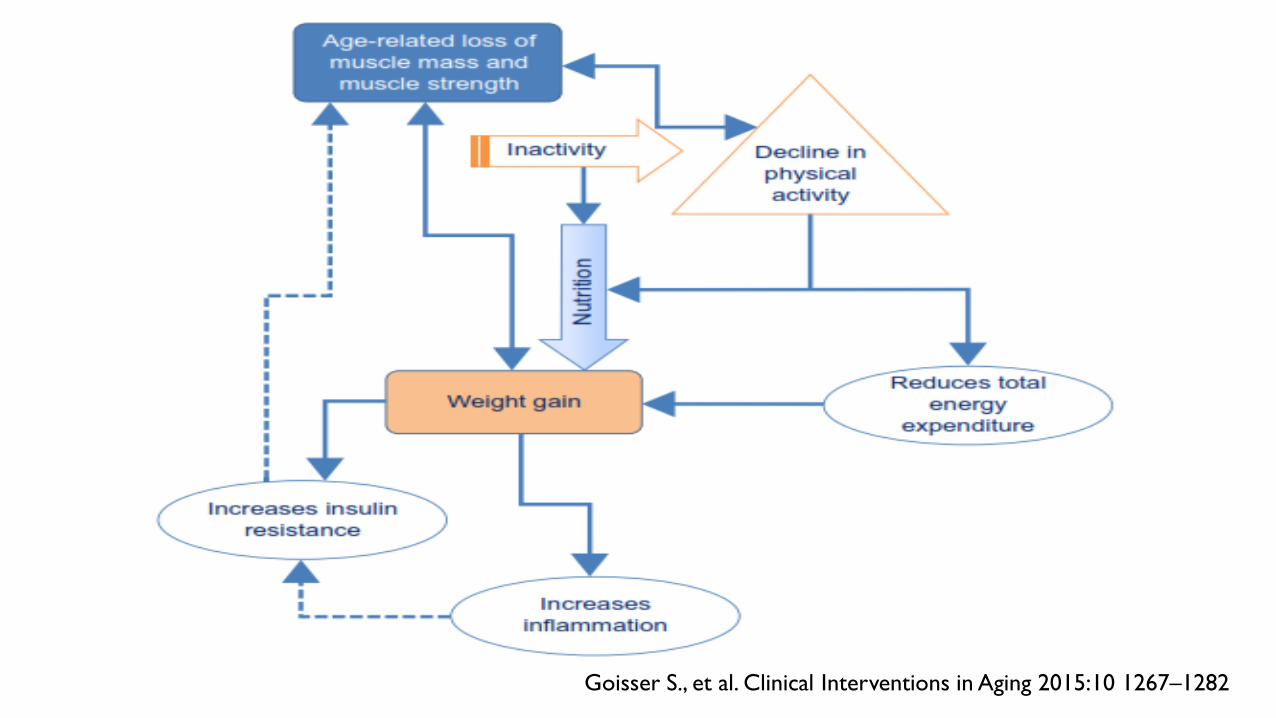
DECREASED ENERGY EXPENDITURE WITH AGEING
Loss of skeletal muscle
Decline of basal metabolic rate
Decreased intensity and duration of physical activity
Decreased postprandial energy expenditure (decreased fat oxidation)
2% to 3% per decade after age 20
4% per decade after age 50
(30% overall age 20 → 70)
Johannsen DL and Ravussin E. Aging health. 2010; 6: 159–167
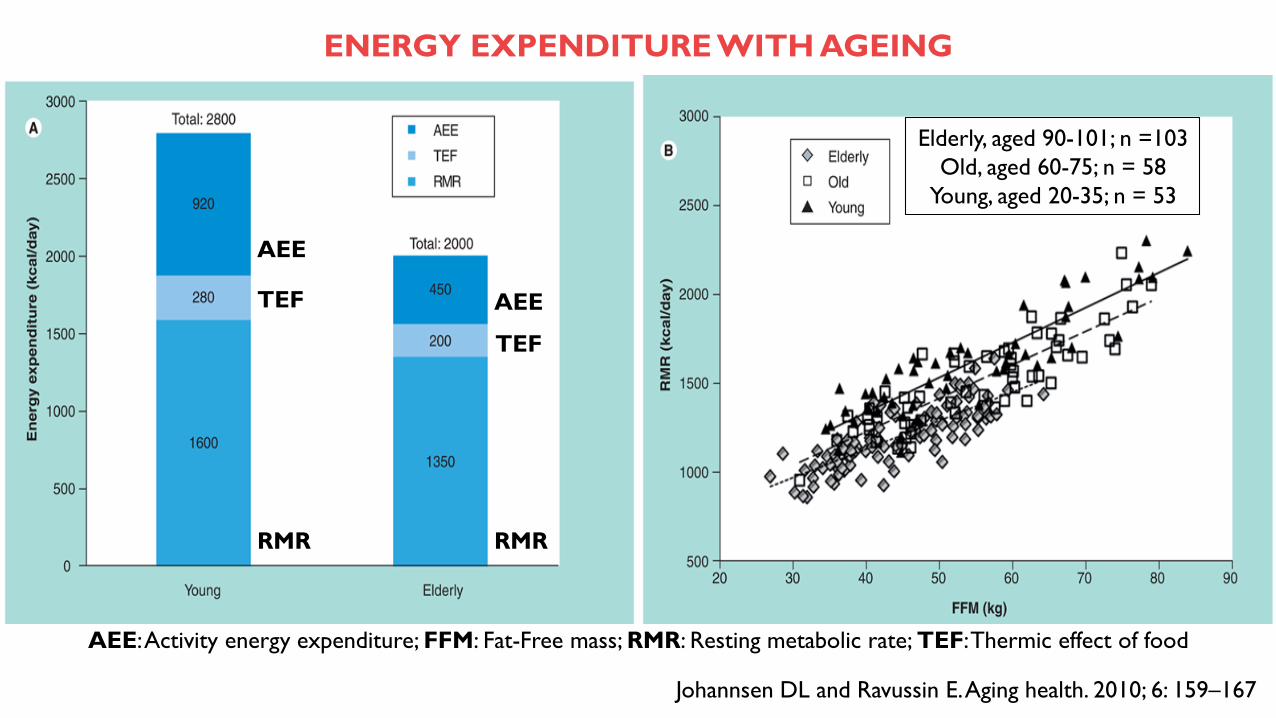
ENERGY EXPENDITURE WITH AGEING
AEE: Activity energy expenditure; FFM: Fat-Free mass; RMR: Resting metabolic rate; TEF: Thermic effect of food
Elderly, aged 90-101; n =103
Old, aged 60-75; n = 58
Young, aged 20-35; n = 53
AEE
AEE
RMR RMR
TEF
TEF

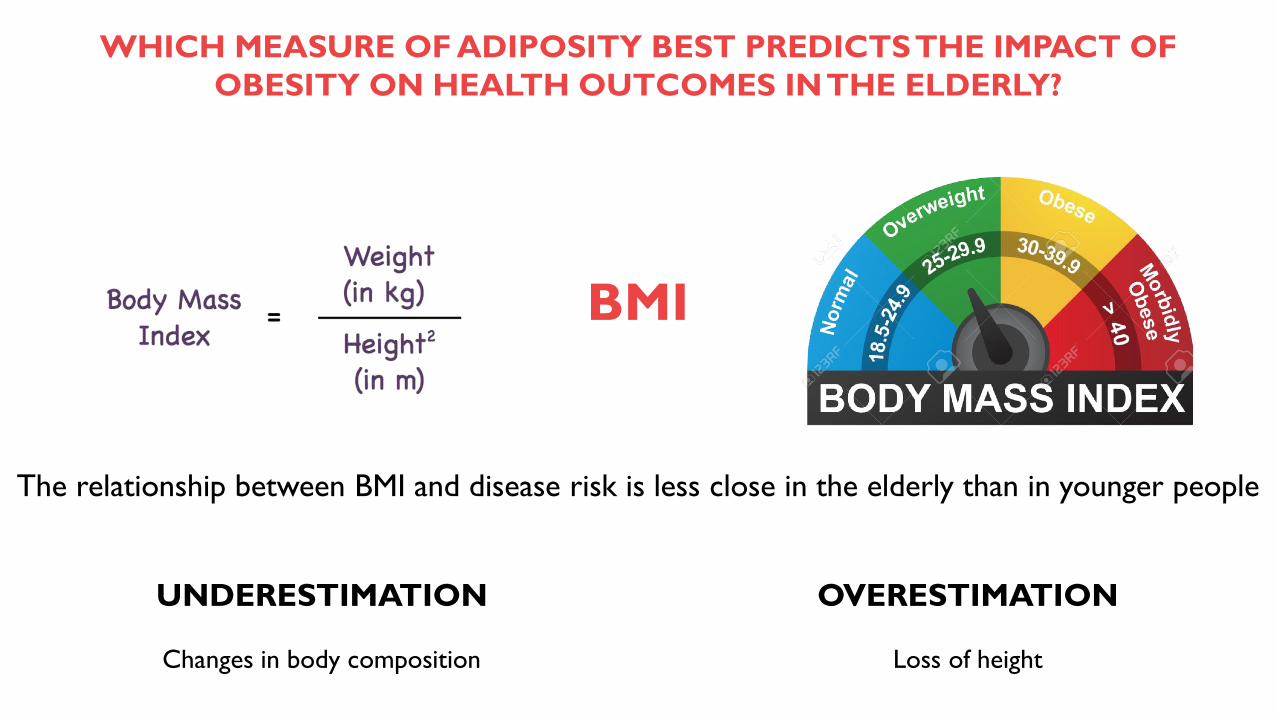
WHICH MEASURE OF ADIPOSITY BEST PREDICTS THE IMPACT OF
OBESITY ON HEALTH OUTCOMES IN THE ELDERLY?
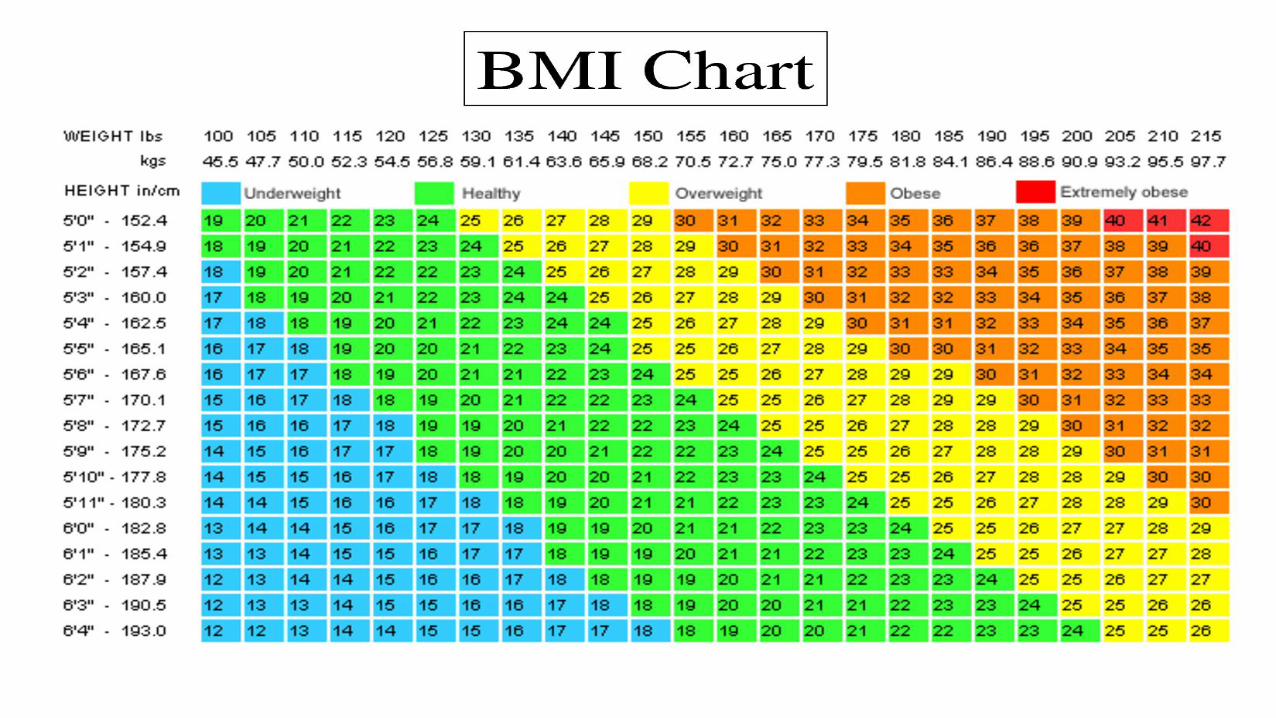
BMI
The relationship between BMI and disease risk is less close in the elderly than in younger people
UNDERESTIMATION
Changes in body composition Loss of height
OVERESTIMATION
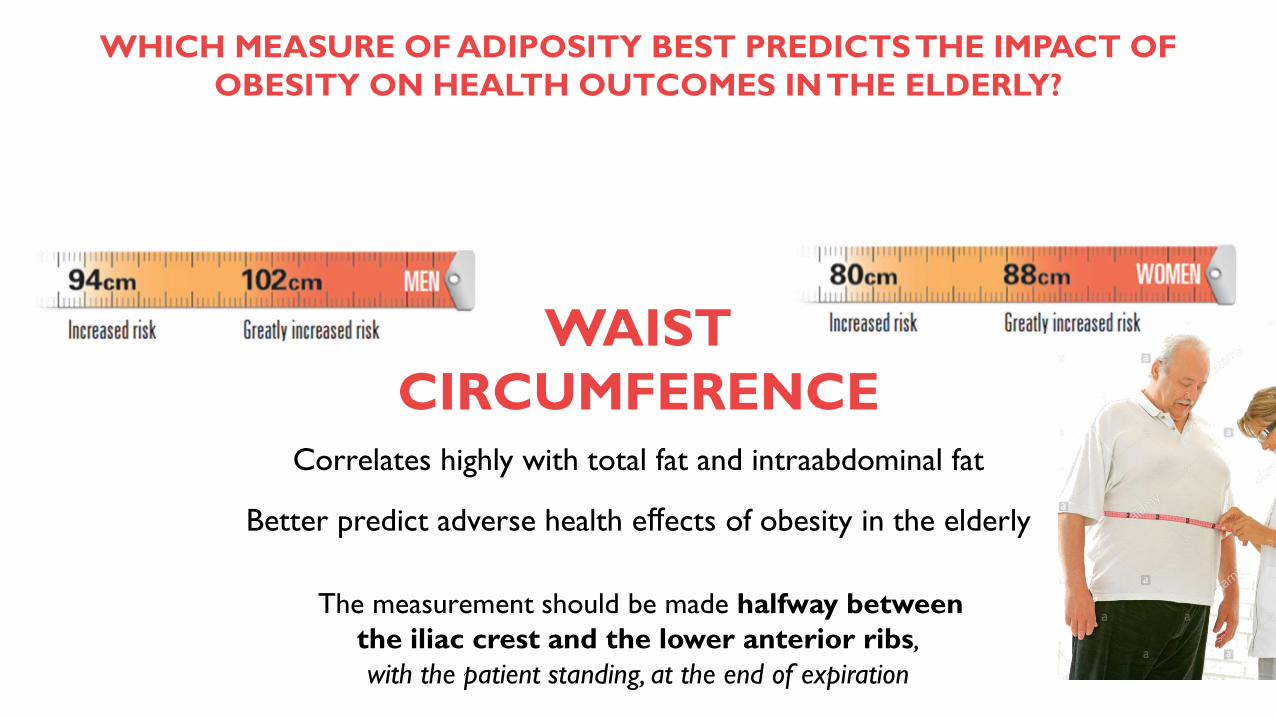
WAIST
CIRCUMFERENCE
WHICH MEASURE OF ADIPOSITY BEST PREDICTS THE IMPACT OF
OBESITY ON HEALTH OUTCOMES IN THE ELDERLY?
Correlates highly with total fat and intraabdominal fat
Better predict adverse health effects of obesity in the elderly
The measurement should be made halfway between
the iliac crest and the lower anterior ribs,
with the patient standing, at the end of expiration
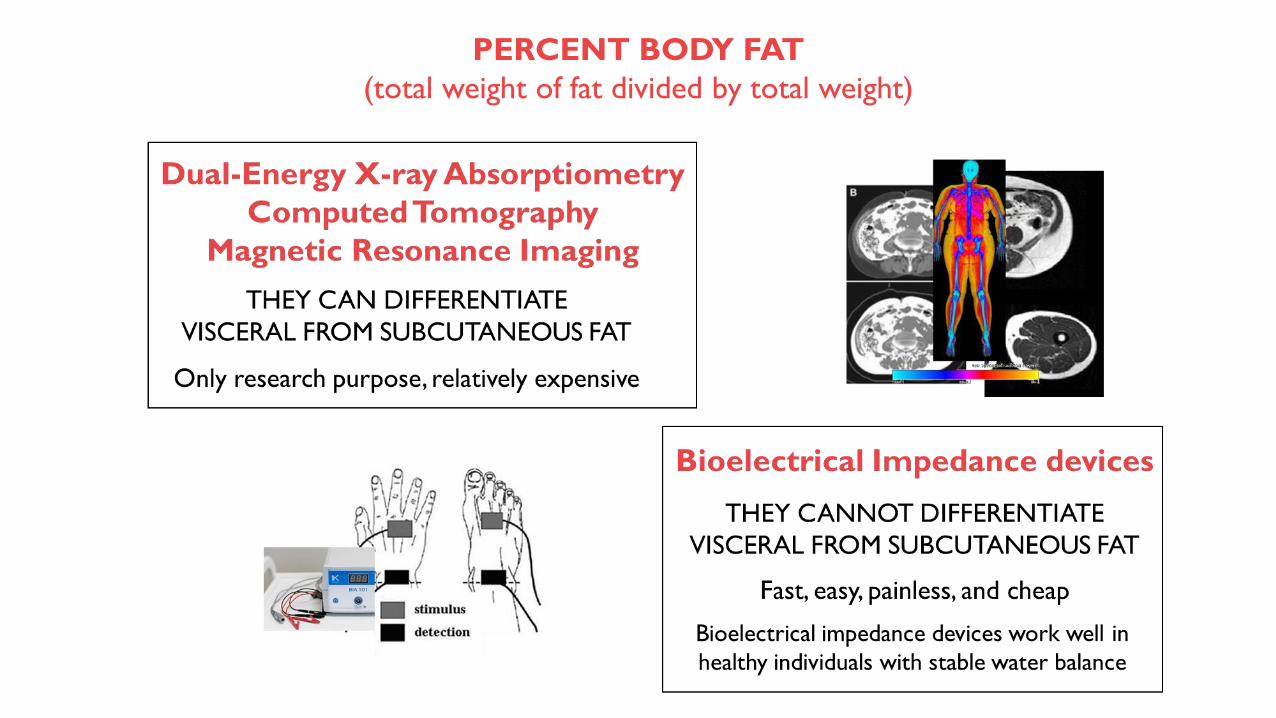
PERCENT BODY FAT
(total weight of fat divided by total weight)
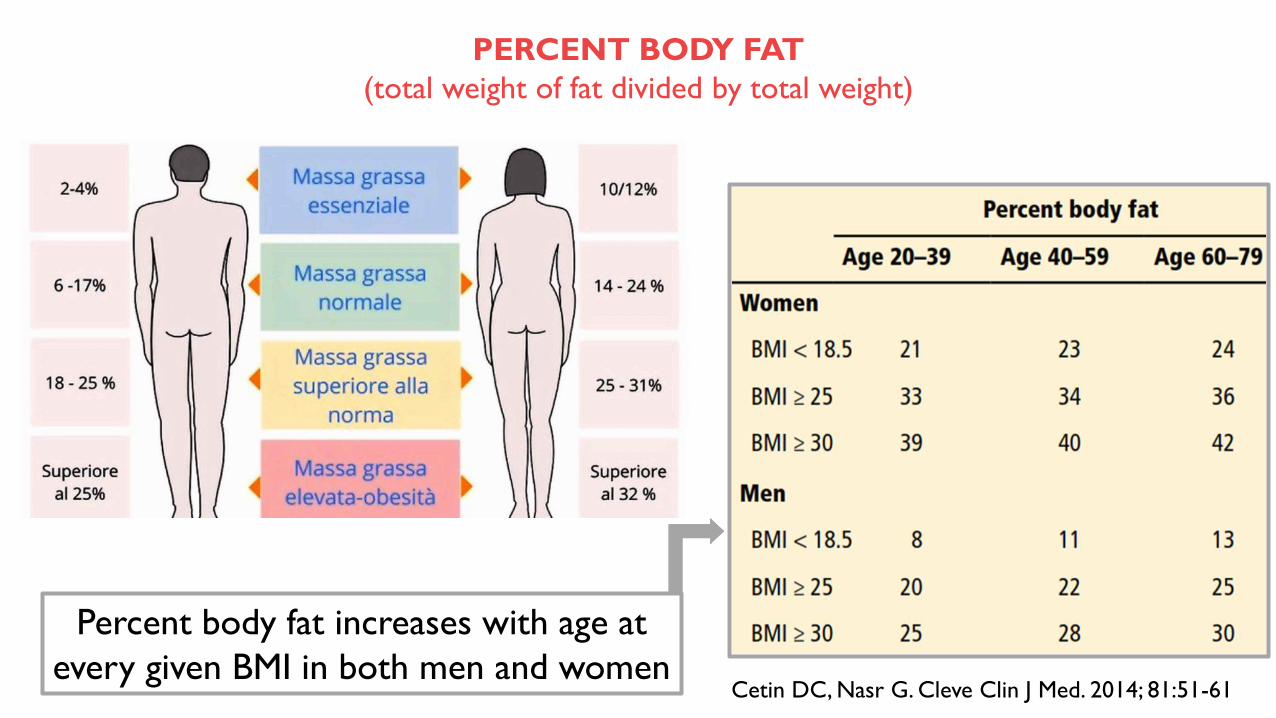
Percent body fat increases with age at
every given BMI in both men and women
PERCENT BODY FAT
(total weight of fat divided by total weight)
Cetin DC, Nasr G. Cleve Clin J Med. 2014; 81:51-61
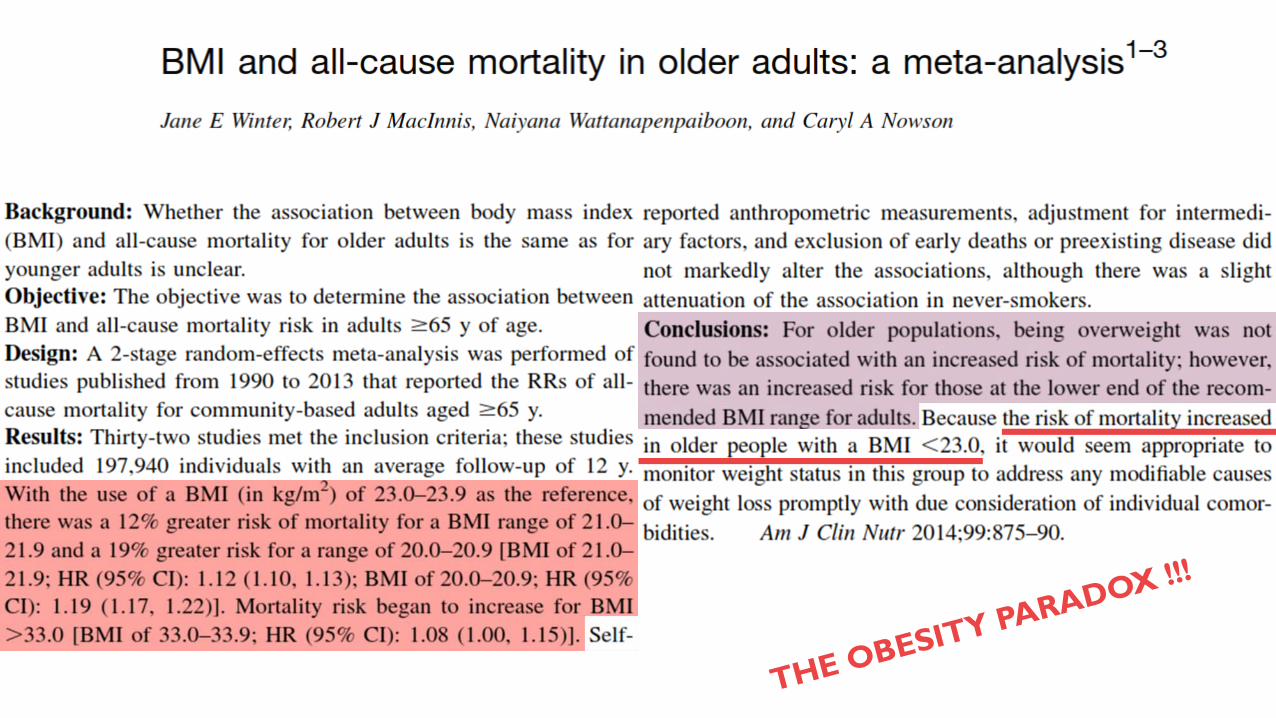
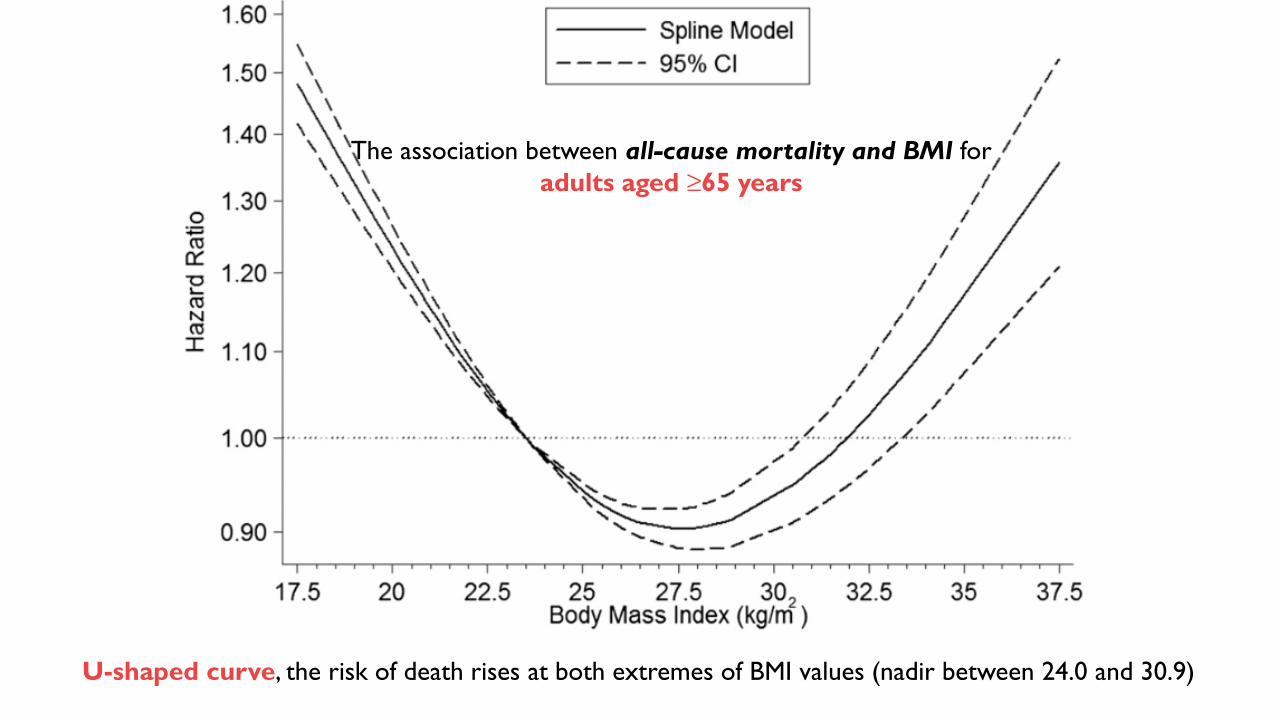
The association between all-cause mortality and BMI for
adults aged ≥65 years
U-shaped curve, the risk of death rises at both extremes of BMI values (nadir between 24.0 and 30.9)
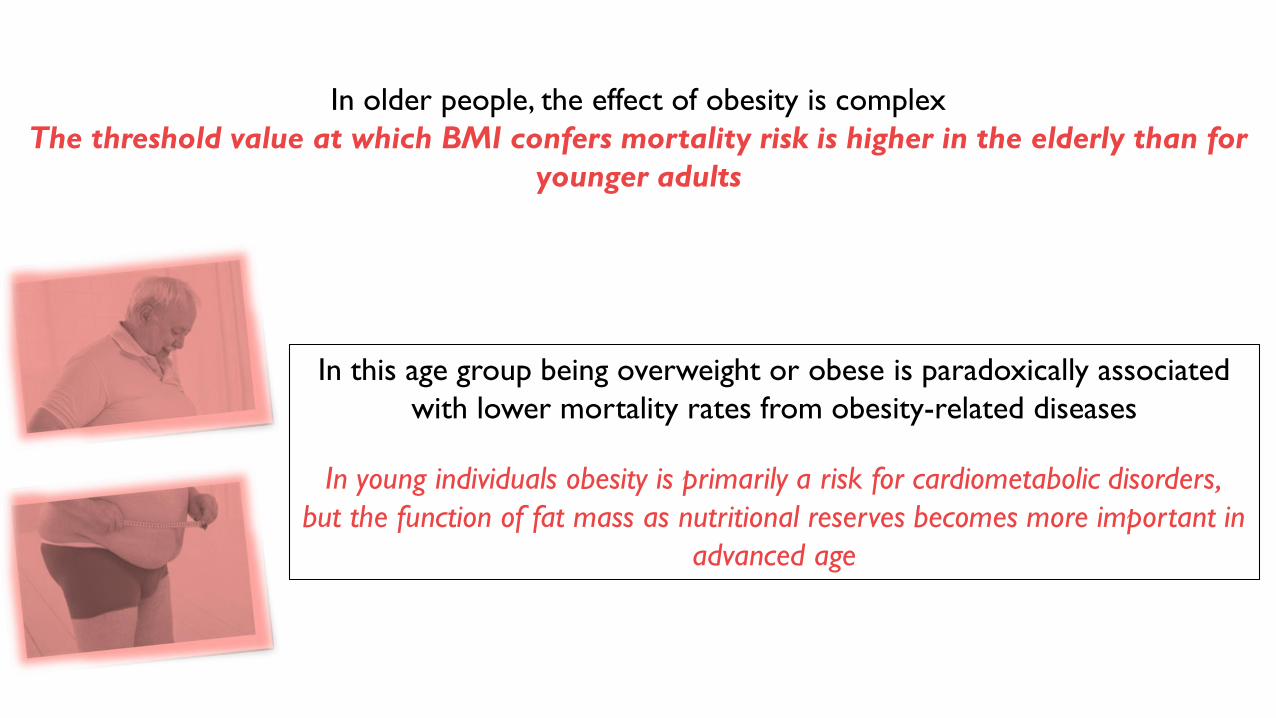
In older people, the effect of obesity is complex
The threshold value at which BMI confers mortality risk is higher in the elderly than for
younger adults
In this age group being overweight or obese is paradoxically associated
with lower mortality rates from obesity-related diseases
In young individuals obesity is primarily a risk for cardiometabolic disorders,
but the function of fat mass as nutritional reserves becomes more important in
advanced age
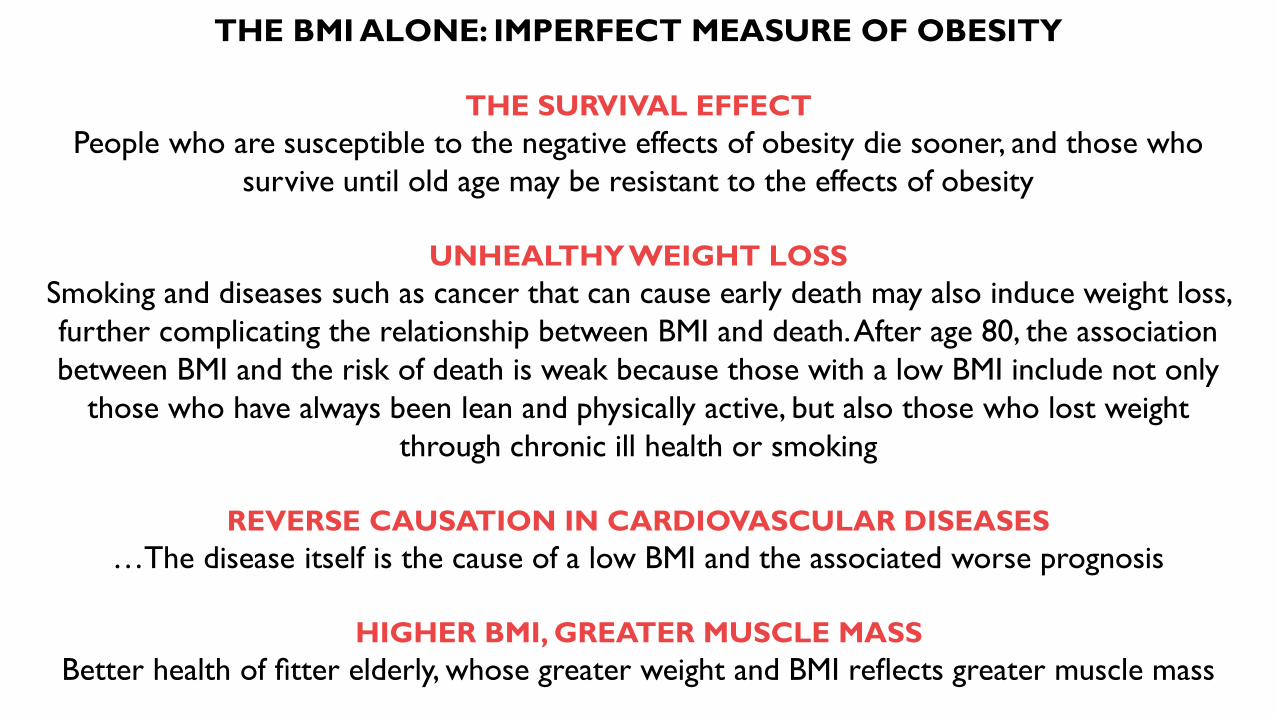
THE BMI ALONE: IMPERFECT MEASURE OF OBESITY
THE SURVIVAL EFFECT
People who are susceptible to the negative effects of obesity die sooner, and those who
survive until old age may be resistant to the effects of obesity
UNHEALTHY WEIGHT LOSS
Smoking and diseases such as cancer that can cause early death may also induce weight loss,
further complicating the relationship between BMI and death. After age 80, the association
between BMI and the risk of death is weak because those with a low BMI include not only
those who have always been lean and physically active, but also those who lost weight
through chronic ill health or smoking
REVERSE CAUSATION IN CARDIOVASCULAR DISEASES
…The disease itself is the cause of a low BMI and the associated worse prognosis
HIGHER BMI, GREATER MUSCLE MASS
Better health of fitter elderly, whose greater weight and BMI reflects greater muscle mass
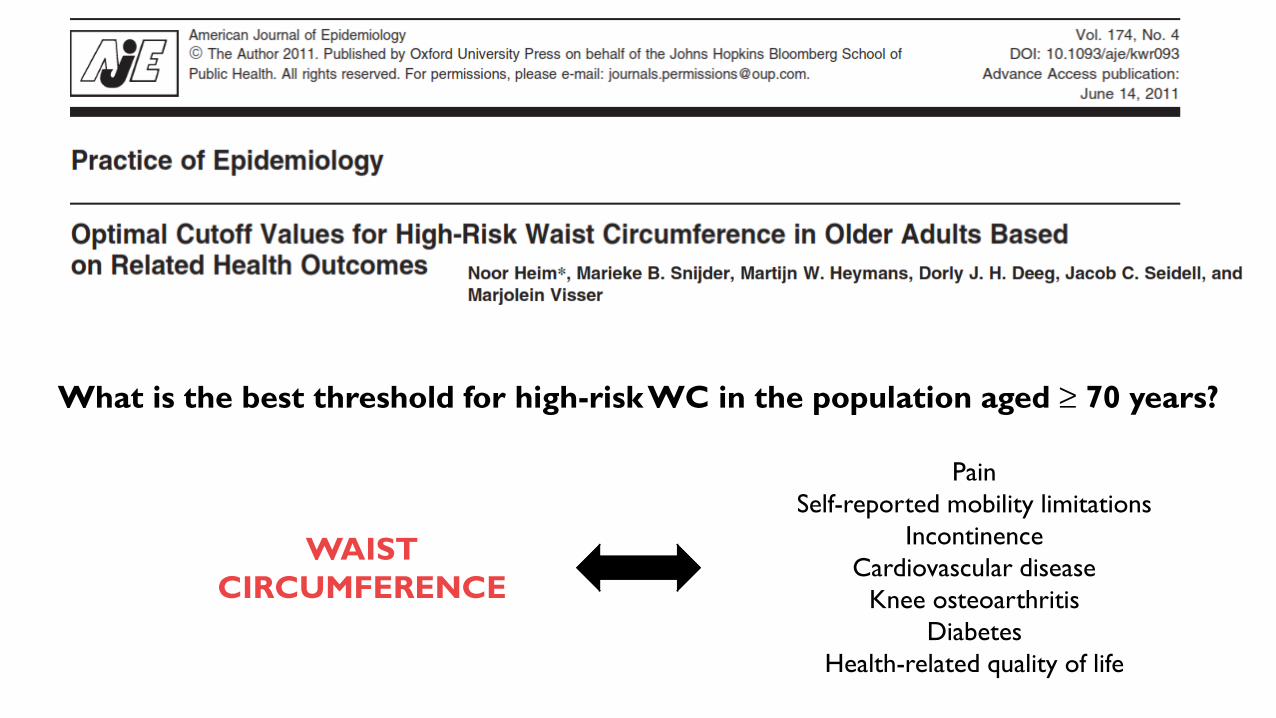
What is the best threshold for high-risk WC in the population aged ≥ 70 years?
Pain
Self-reported mobility limitations
Incontinence
Cardiovascular disease
Knee osteoarthritis
Diabetes
Health-related quality of life
WAIST
CIRCUMFERENCE
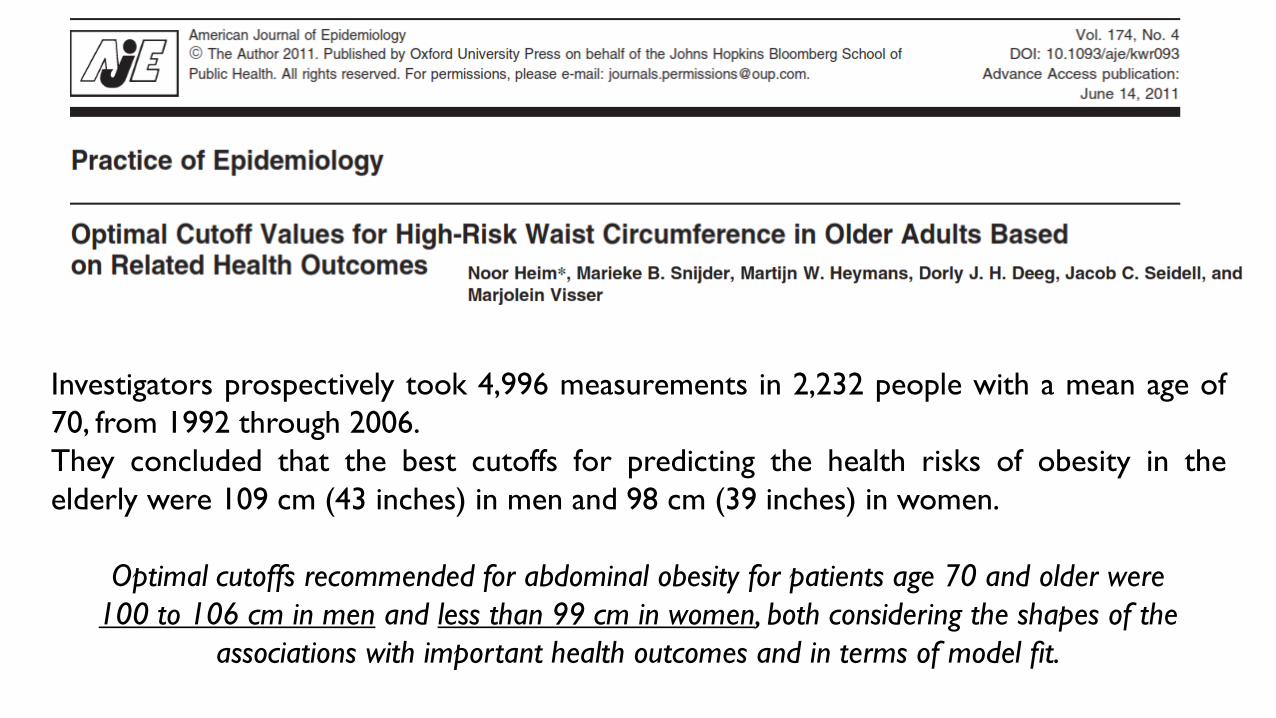
Investigators prospectively took 4,996 measurements in 2,232 people with a mean age of
70, from 1992 through 2006.
They concluded that the best cutoffs for predicting the health risks of obesity in the
elderly were 109 cm (43 inches) in men and 98 cm (39 inches) in women.
Optimal cutoffs recommended for abdominal obesity for patients age 70 and older were
100 to 106 cm in men and less than 99 cm in women, both considering the shapes of the
associations with important health outcomes and in terms of model fit.
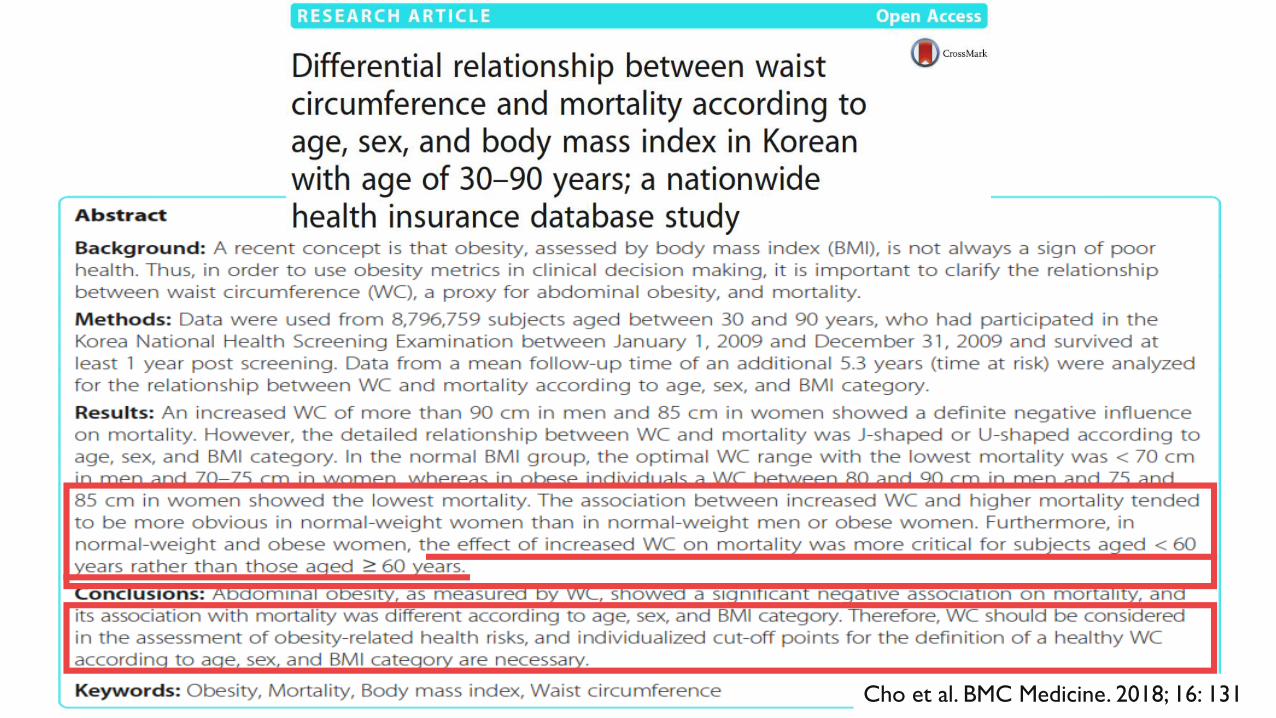
Cho et al. BMC Medicine. 2018; 16: 131
The obesity paradox is a very controversial concept, because it can lead people to disregard the
unhealthy metabolic consequences of excess adipose tissue.
The obesity paradox must not be confused with the limitation of BMI
vsGENERAL OBESITY
(BMI)
CENTRAL OBESITY
(WC)
WC in combination with BMI is a better predictor of mortality than BMI alone
It cannot fully reflect the risk of obesity-related
metabolic complications and death
Central obesity measured using WC was more
consistently related to higher mortality for
cardiometabolic disturbances and certain cancers
?

Obesità nell’anziano e
fragilità
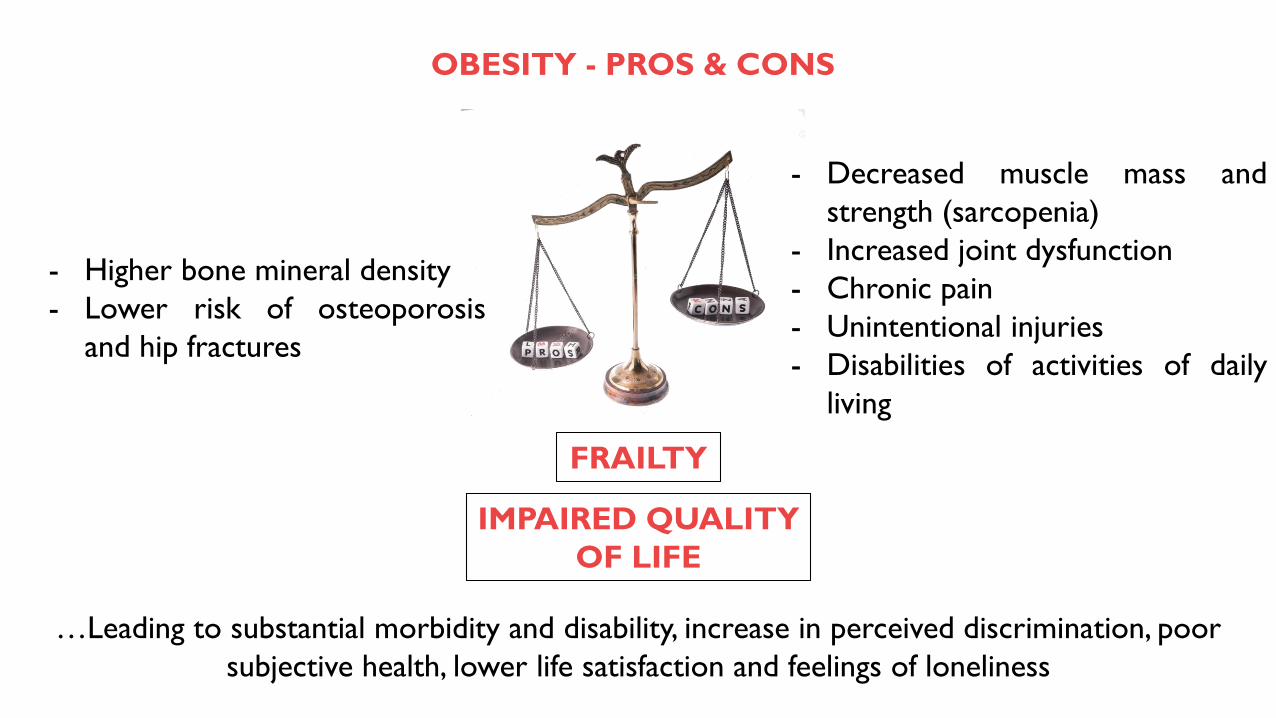
OBESITY - PROS & CONS
- Decreased muscle mass and
strength (sarcopenia)
- Increased joint dysfunction
- Chronic pain
- Unintentional injuries
- Disabilities of activities of daily
living
…Leading to substantial morbidity and disability, increase in perceived discrimination, poor
subjective health, lower life satisfaction and feelings of loneliness
- Higher bone mineral density
- Lower risk of osteoporosis
and hip fractures
FRAILTY
IMPAIRED QUALITY
OF LIFE
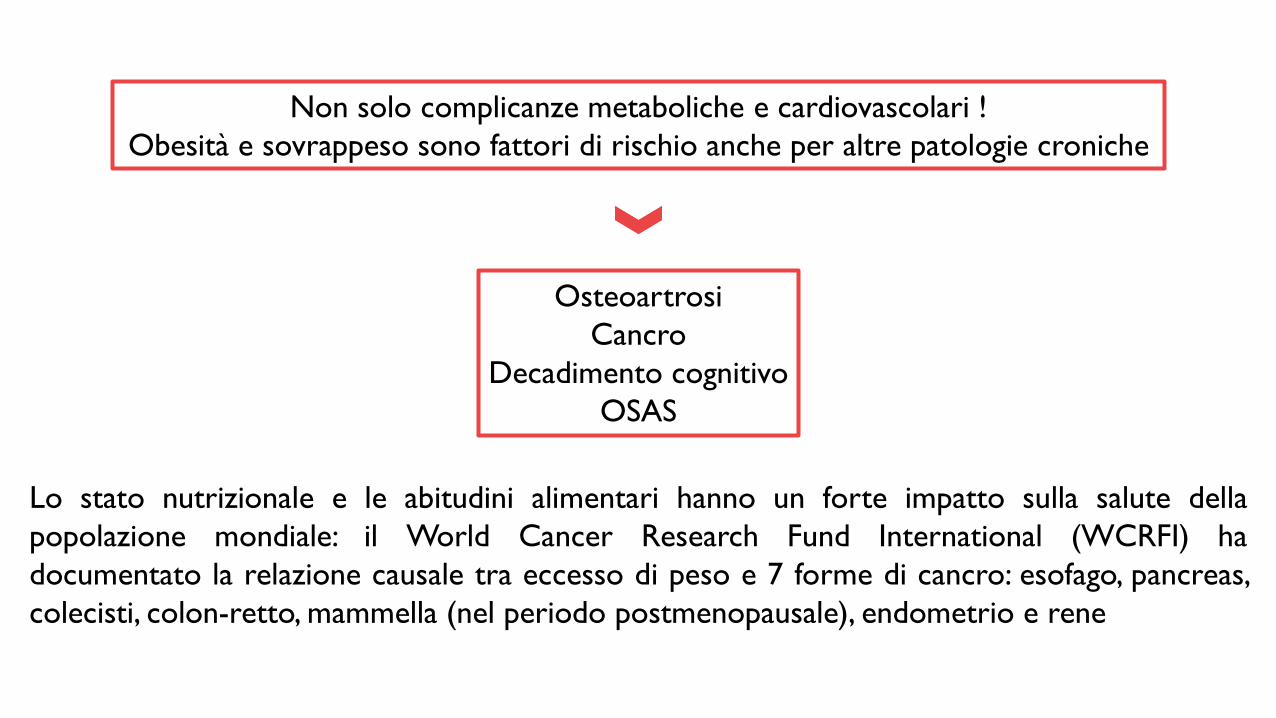
Non solo complicanze metaboliche e cardiovascolari !
Obesità e sovrappeso sono fattori di rischio anche per altre patologie croniche
Lo stato nutrizionale e le abitudini alimentari hanno un forte impatto sulla salute della
popolazione mondiale: il World Cancer Research Fund International (WCRFI) ha
documentato la relazione causale tra eccesso di peso e 7 forme di cancro: esofago, pancreas,
colecisti, colon-retto, mammella (nel periodo postmenopausale), endometrio e rene
Osteoartrosi
Cancro
Decadimento cognitivo
OSAS
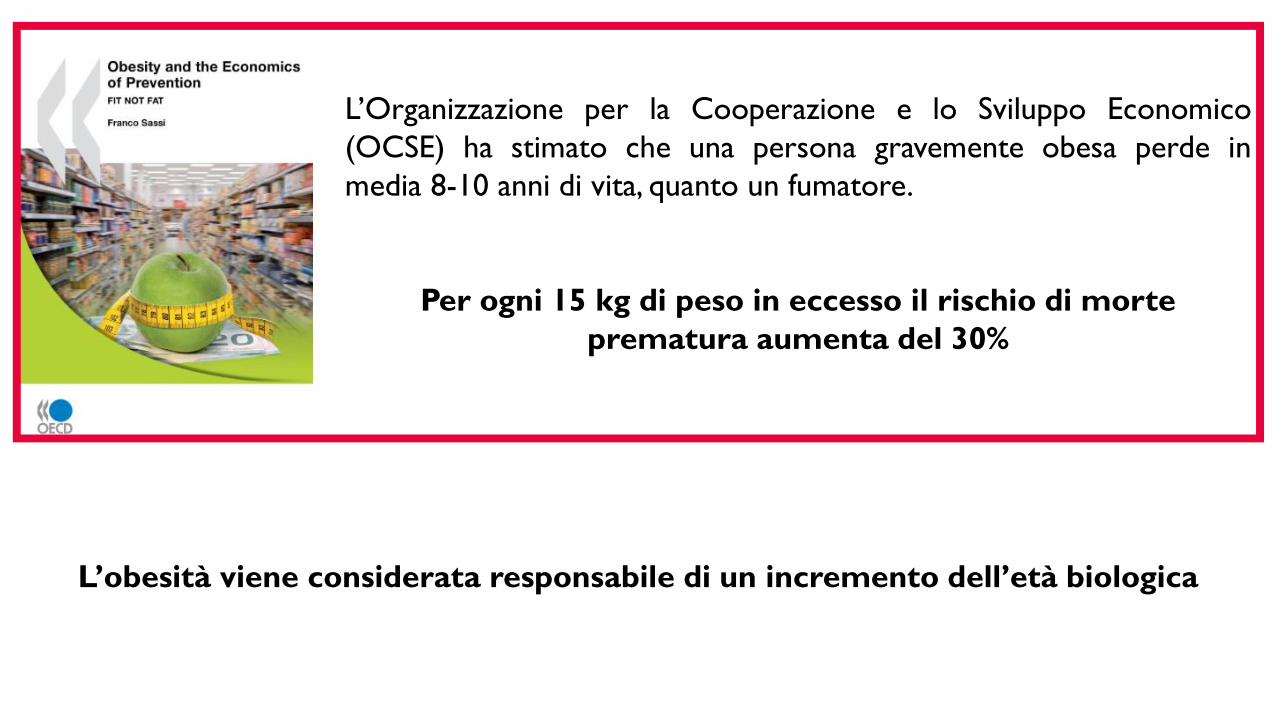
L’Organizzazione per la Cooperazione e lo Sviluppo Economico
(OCSE) ha stimato che una persona gravemente obesa perde in
media 8-10 anni di vita, quanto un fumatore.
Per ogni 15 kg di peso in eccesso il rischio di morte
prematura aumenta del 30%
L’obesità viene considerata responsabile di un incremento dell’età biologica
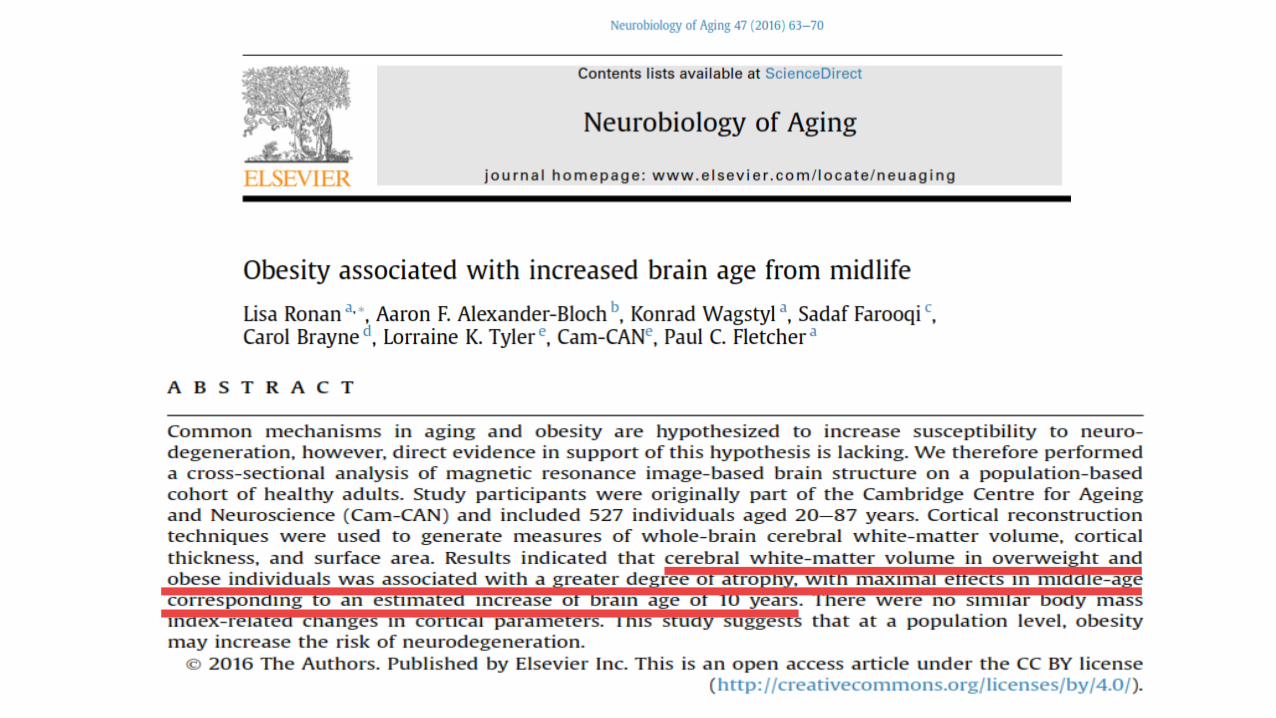
L. Ronan et al. Neurobiology of Aging. 2016; 47: 63e70
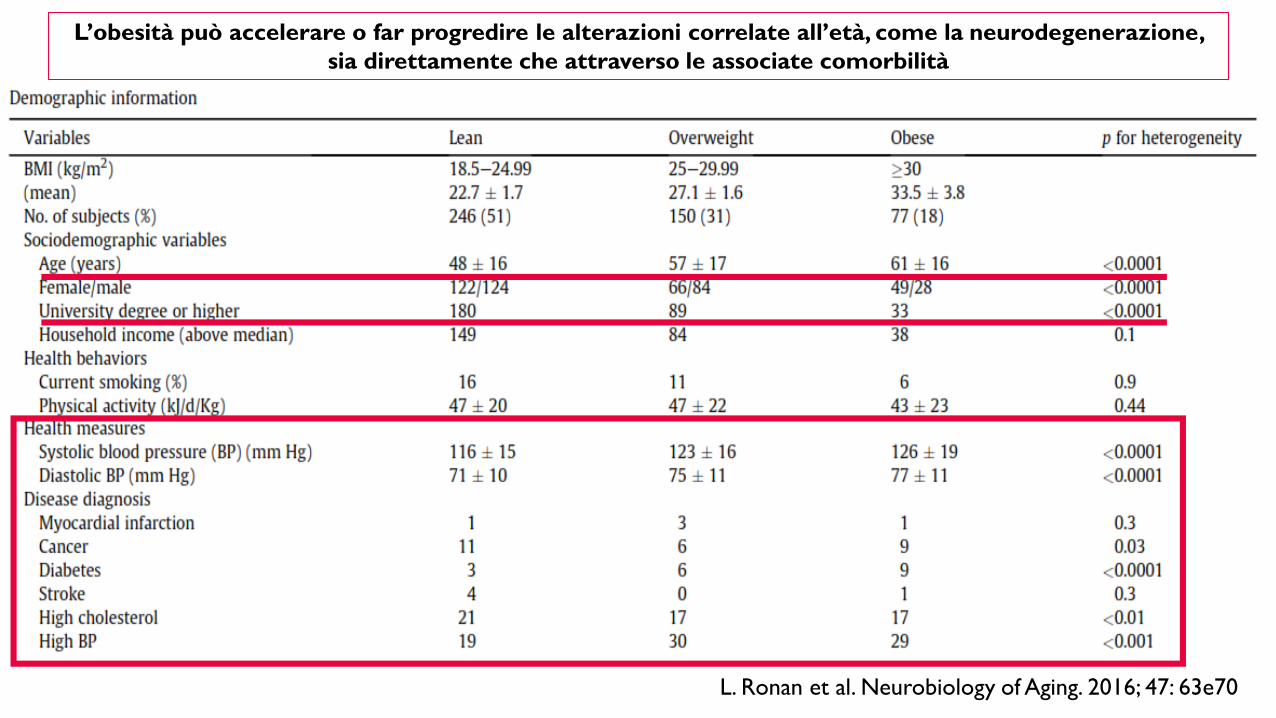
L’obesità può accelerare o far progredire le alterazioni correlate all’età, come la neurodegenerazione,
sia direttamente che attraverso le associate comorbilità
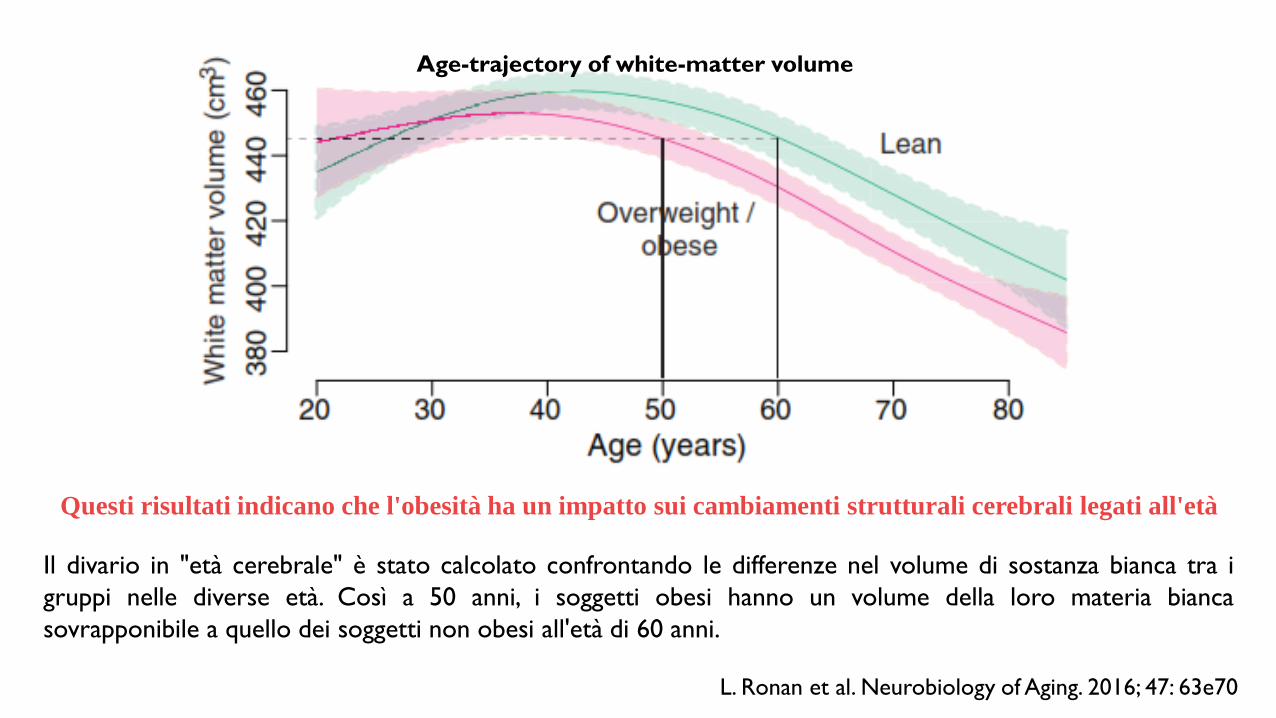
L. Ronan et al. Neurobiology of Aging. 2016; 47: 63e70
Age-trajectory of white-matter volume
Questi risultati indicano che l'obesità ha un impatto sui cambiamenti strutturali cerebrali legati all'età
Il divario in "età cerebrale" è stato calcolato confrontando le differenze nel volume di sostanza bianca tra i
gruppi nelle diverse età. Così a 50 anni, i soggetti obesi hanno un volume della loro materia bianca
sovrapponibile a quello dei soggetti non obesi all'età di 60 anni.
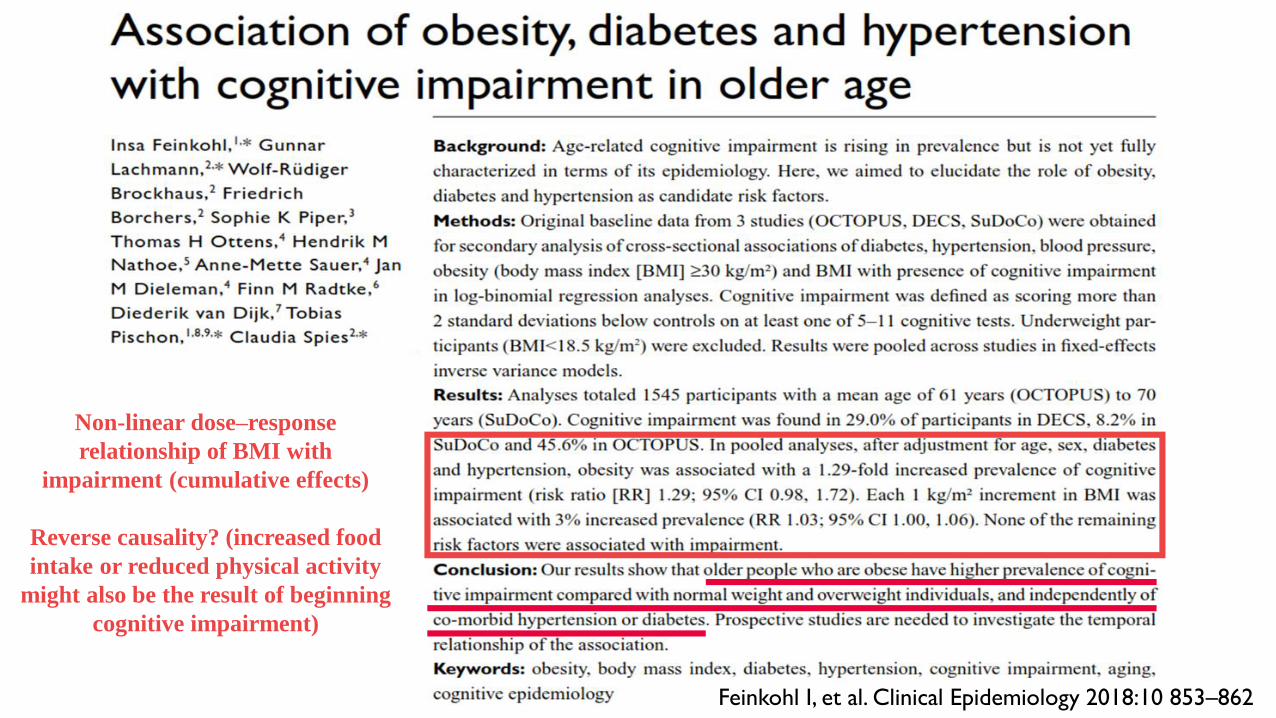
Non-linear dose–response
relationship of BMI with
impairment (cumulative effects)
Reverse causality? (increased food
intake or reduced physical activity
might also be the result of beginning
cognitive impairment)
Feinkohl I, et al. Clinical Epidemiology 2018:10 853–862
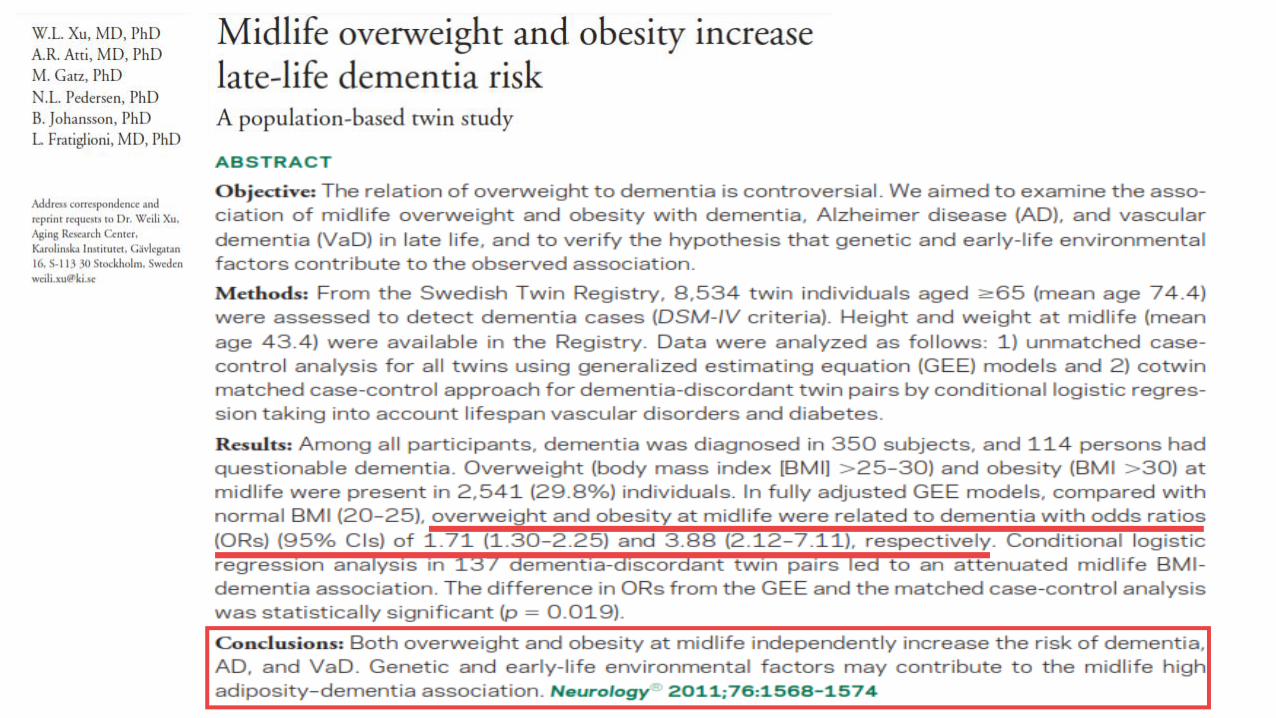
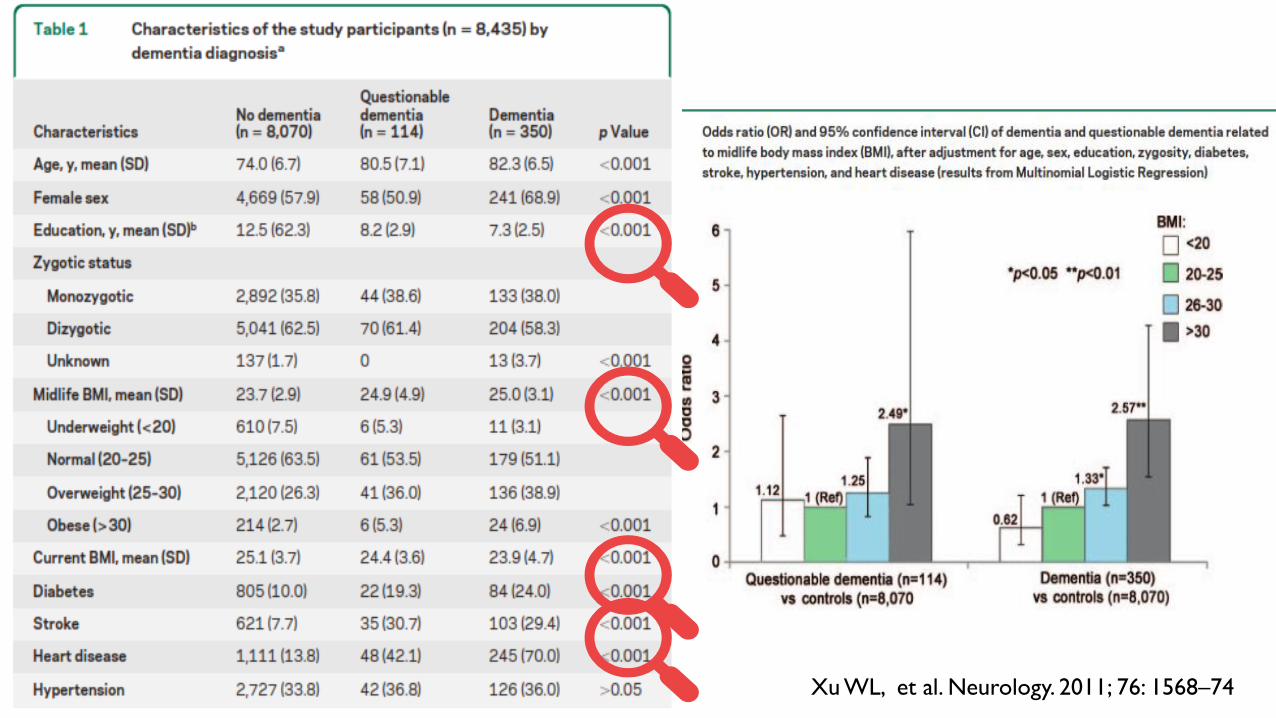
Xu WL, et al. Neurology. 2011; 76: 1568–74
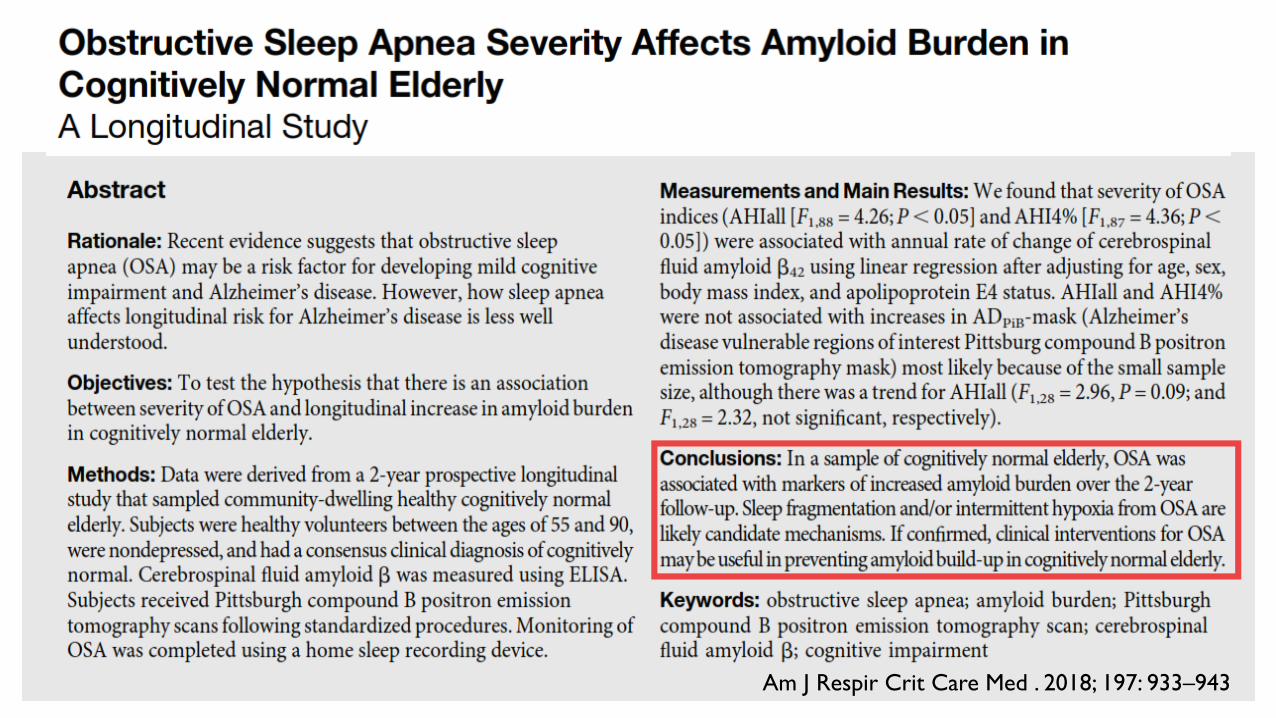
Am J Respir Crit Care Med . 2018; 197: 933–943
Goisser S., et al. Clinical Interventions in Aging 2015:10 1267–1282
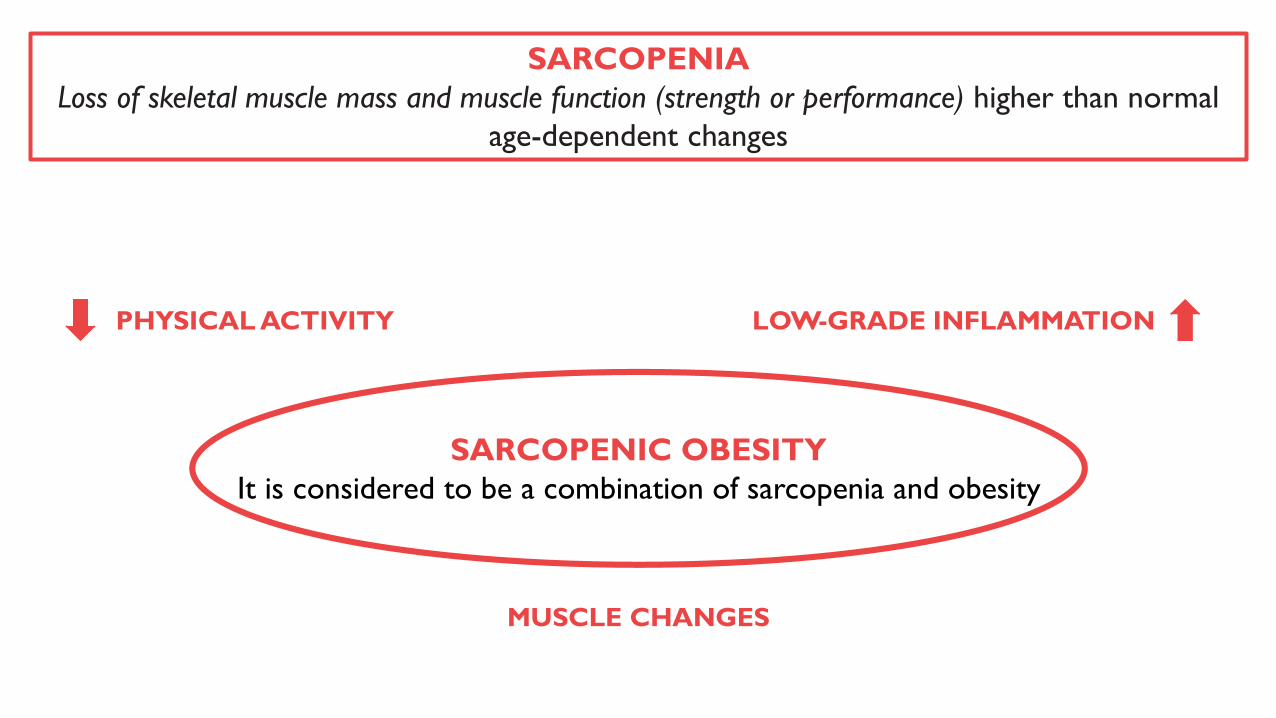
SARCOPENIA
Loss of skeletal muscle mass and muscle function (strength or performance) higher than normal
age-dependent changes
SARCOPENIC OBESITY
It is considered to be a combination of sarcopenia and obesity
PHYSICAL ACTIVITY LOW-GRADE INFLAMMATION
MUSCLE CHANGES
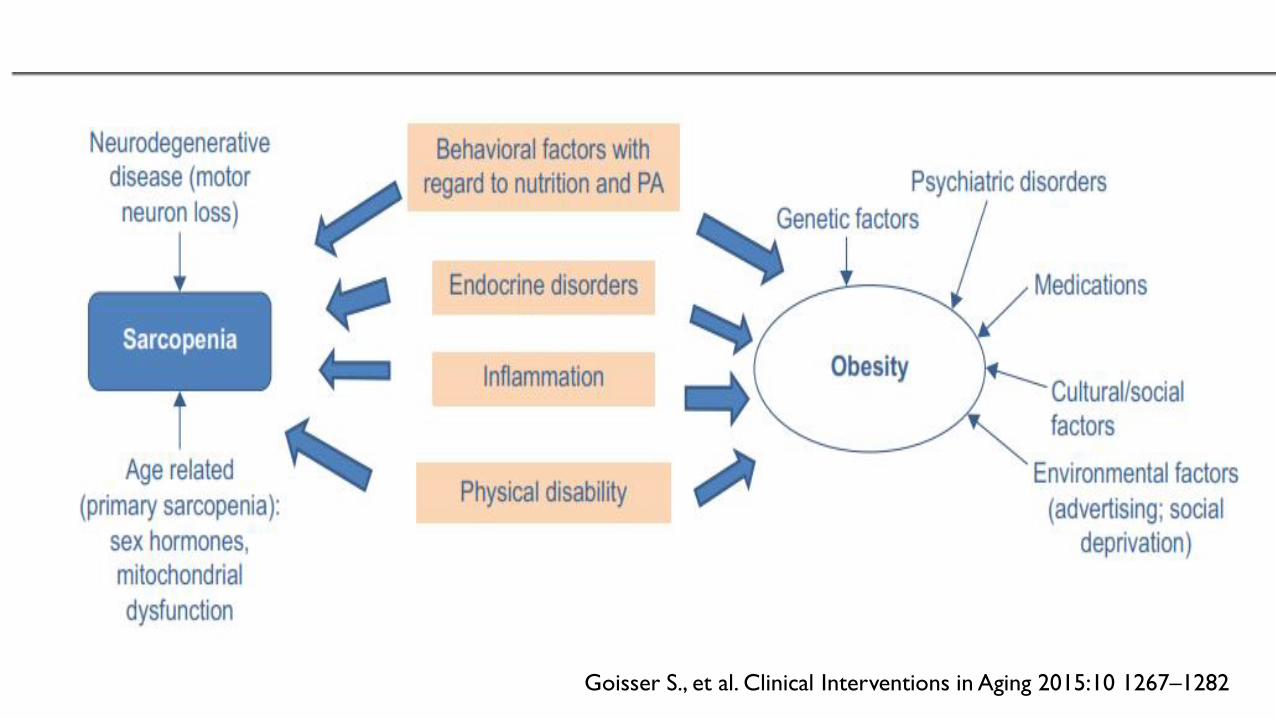
Goisser S., et al. Clinical Interventions in Aging 2015:10 1267–1282
Goisser S., et al. Clinical Interventions in Aging 2015:10 1267–1282
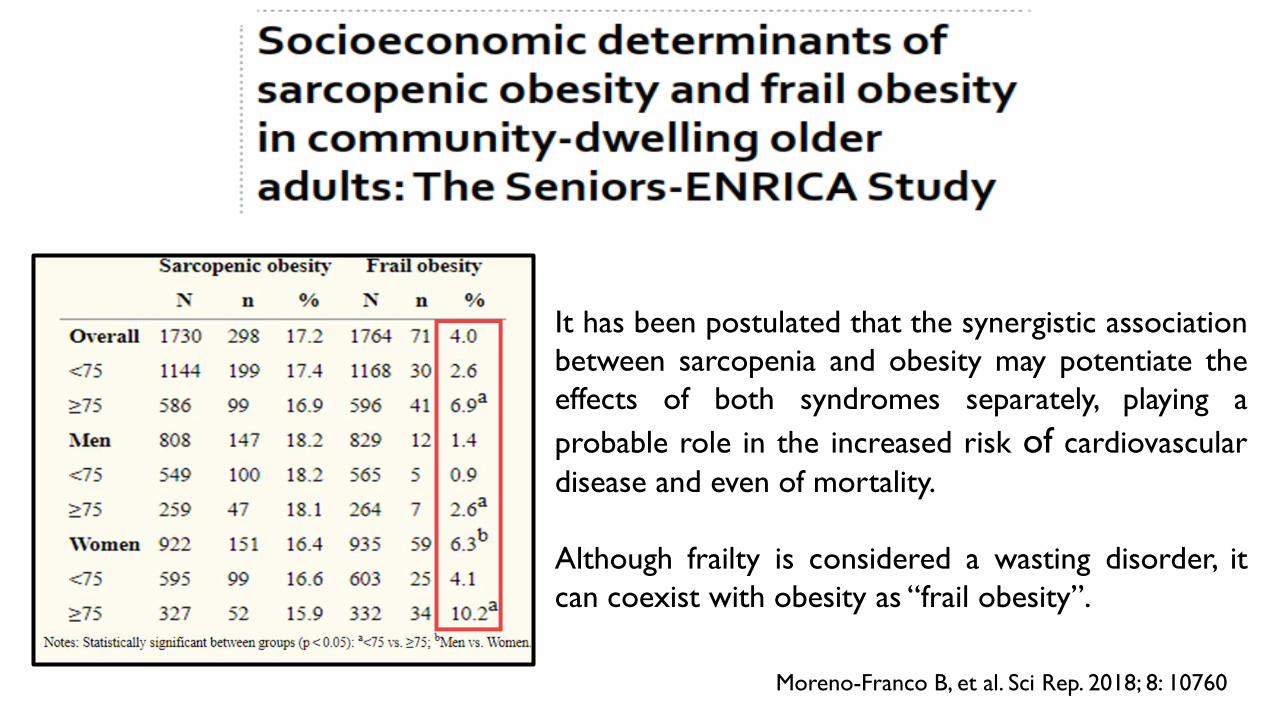
Moreno-Franco B, et al. Sci Rep. 2018; 8: 10760
It has been postulated that the synergistic association
between sarcopenia and obesity may potentiate the
effects of both syndromes separately, playing a
probable role in the increased risk of cardiovascular
disease and even of mortality.
Although frailty is considered a wasting disorder, it
can coexist with obesity as “frail obesity”.
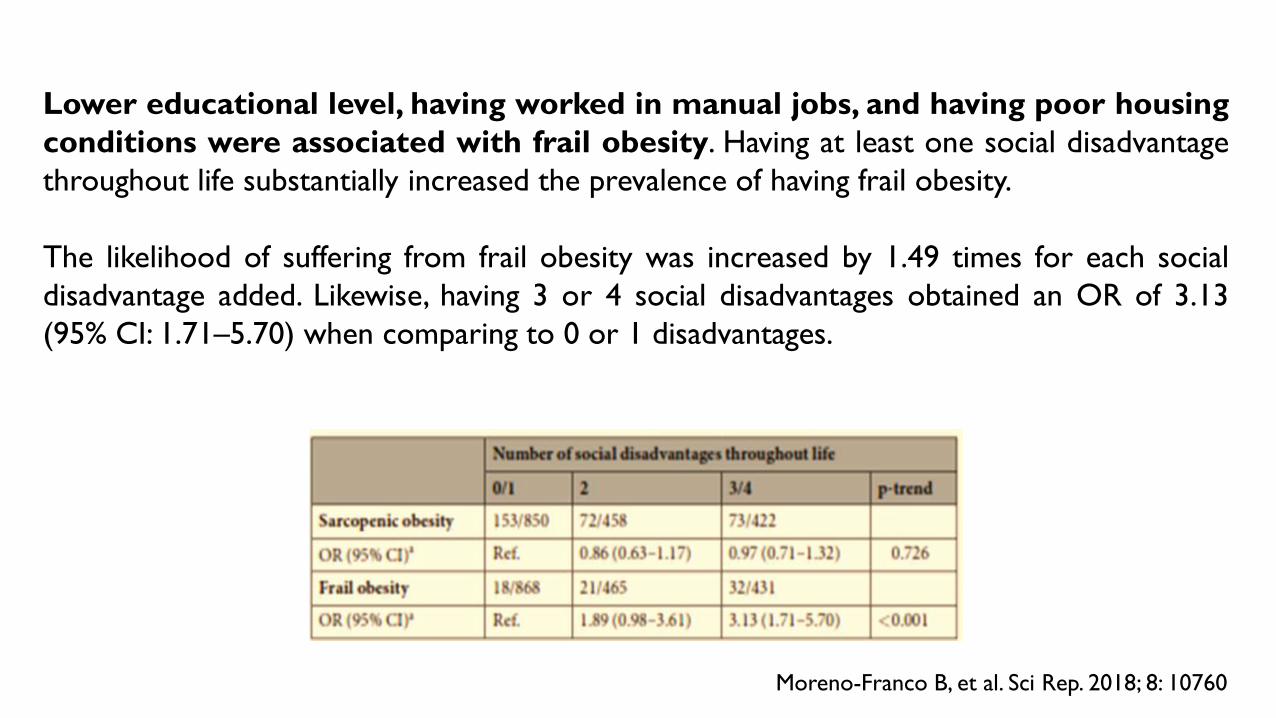
Moreno-Franco B, et al. Sci Rep. 2018; 8: 10760
Lower educational level, having worked in manual jobs, and having poor housing
conditions were associated with frail obesity. Having at least one social disadvantage
throughout life substantially increased the prevalence of having frail obesity.
The likelihood of suffering from frail obesity was increased by 1.49 times for each social
disadvantage added. Likewise, having 3 or 4 social disadvantages obtained an OR of 3.13
(95% CI: 1.71–5.70) when comparing to 0 or 1 disadvantages.
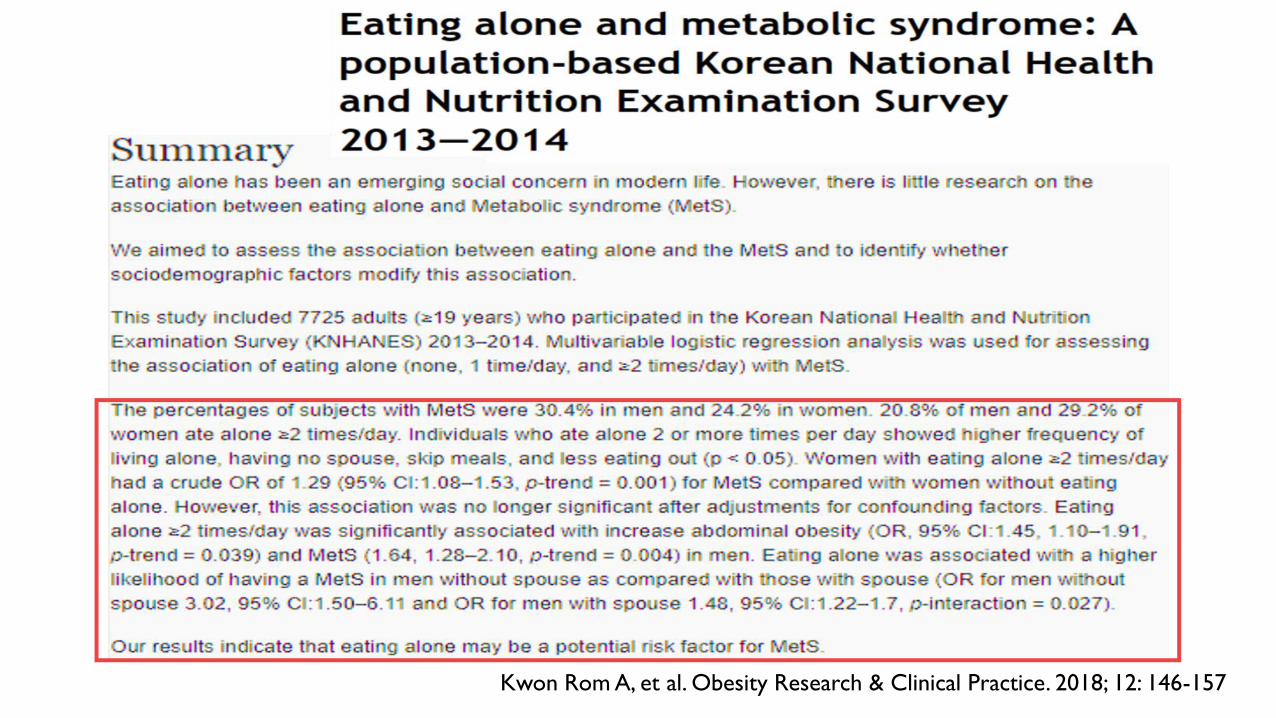
Kwon Rom A, et al. Obesity Research & Clinical Practice. 2018; 12: 146-157
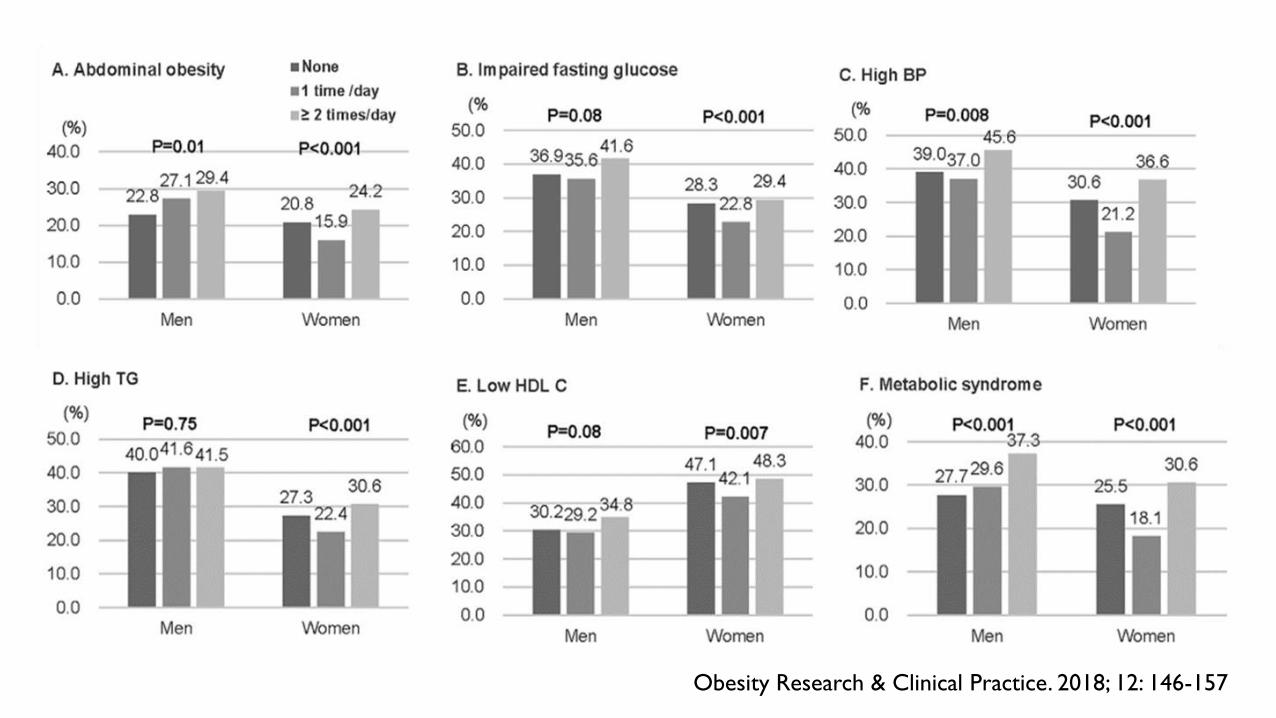
Obesity Research & Clinical Practice. 2018; 12: 146-157
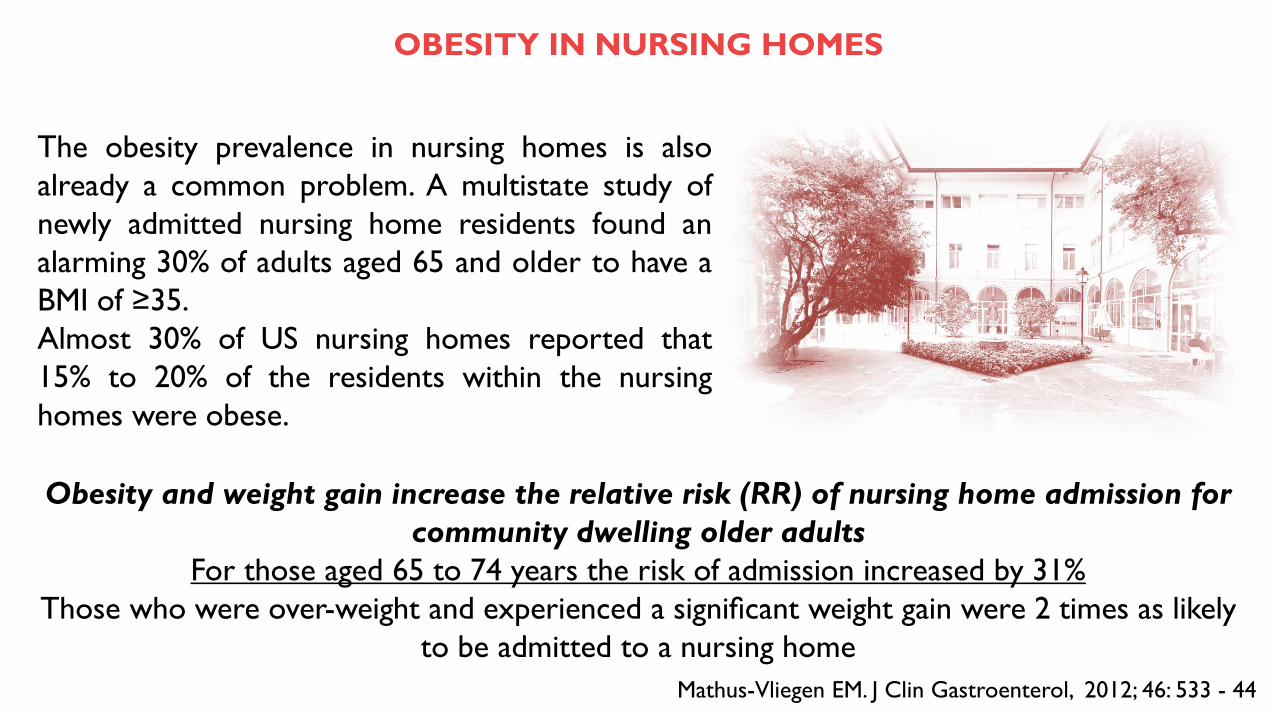
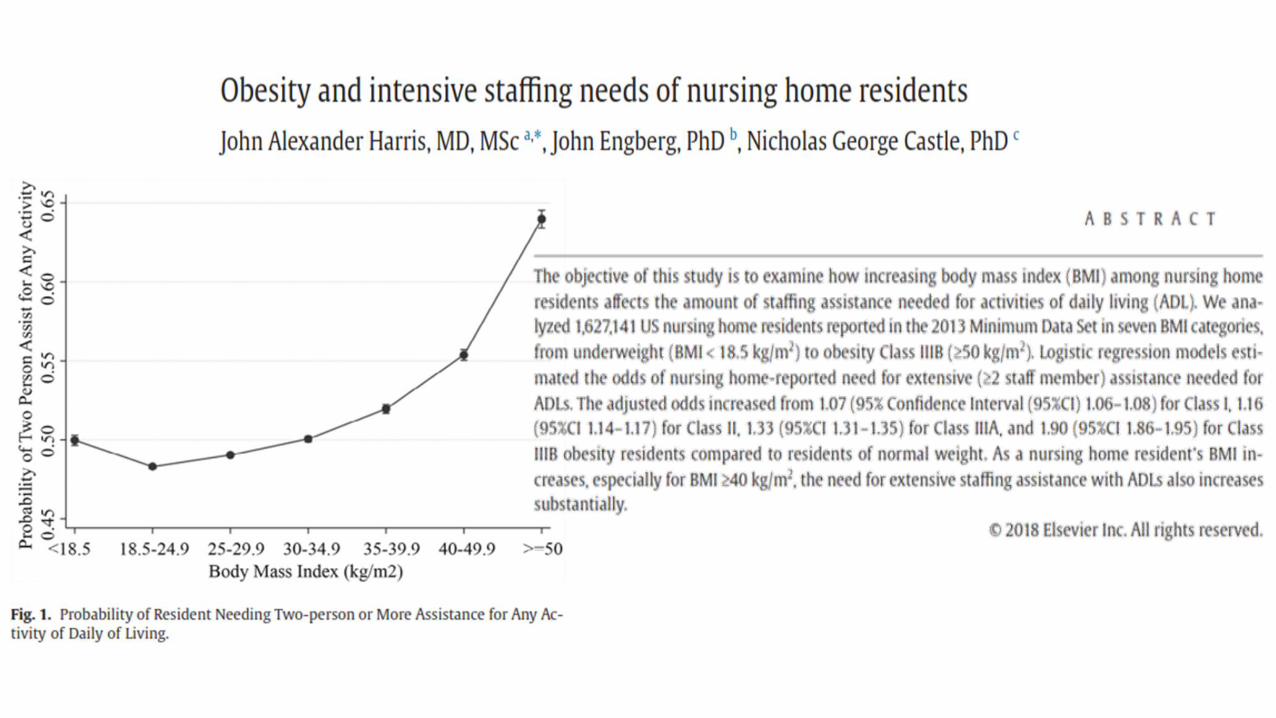
The obesity prevalence in nursing homes is also
already a common problem. A multistate study of
newly admitted nursing home residents found an
alarming 30% of adults aged 65 and older to have a
BMI of ≥35.
Almost 30% of US nursing homes reported that
15% to 20% of the residents within the nursing
homes were obese.
Mathus-Vliegen EM. J Clin Gastroenterol, 2012; 46: 533 - 44
OBESITY IN NURSING HOMES
Obesity and weight gain increase the relative risk (RR) of nursing home admission for
community dwelling older adults
For those aged 65 to 74 years the risk of admission increased by 31%
Those who were over-weight and experienced a significant weight gain were 2 times as likely
to be admitted to a nursing home

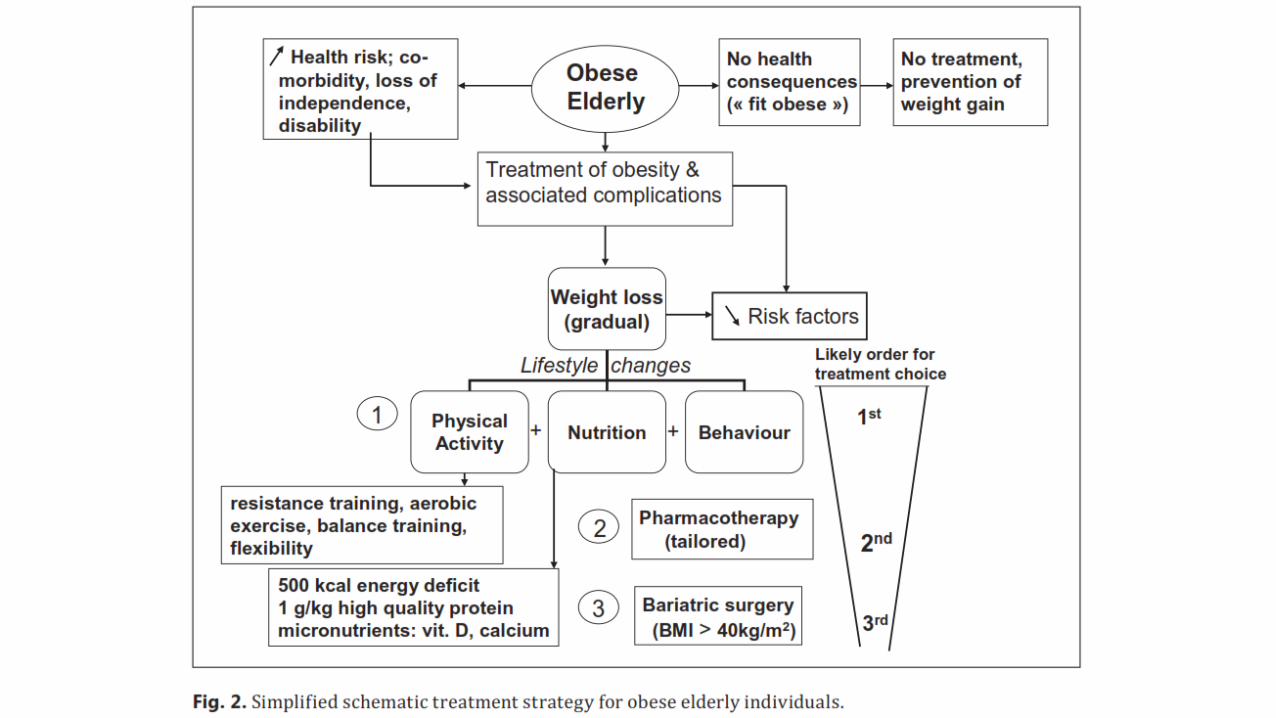
Quali interventi?
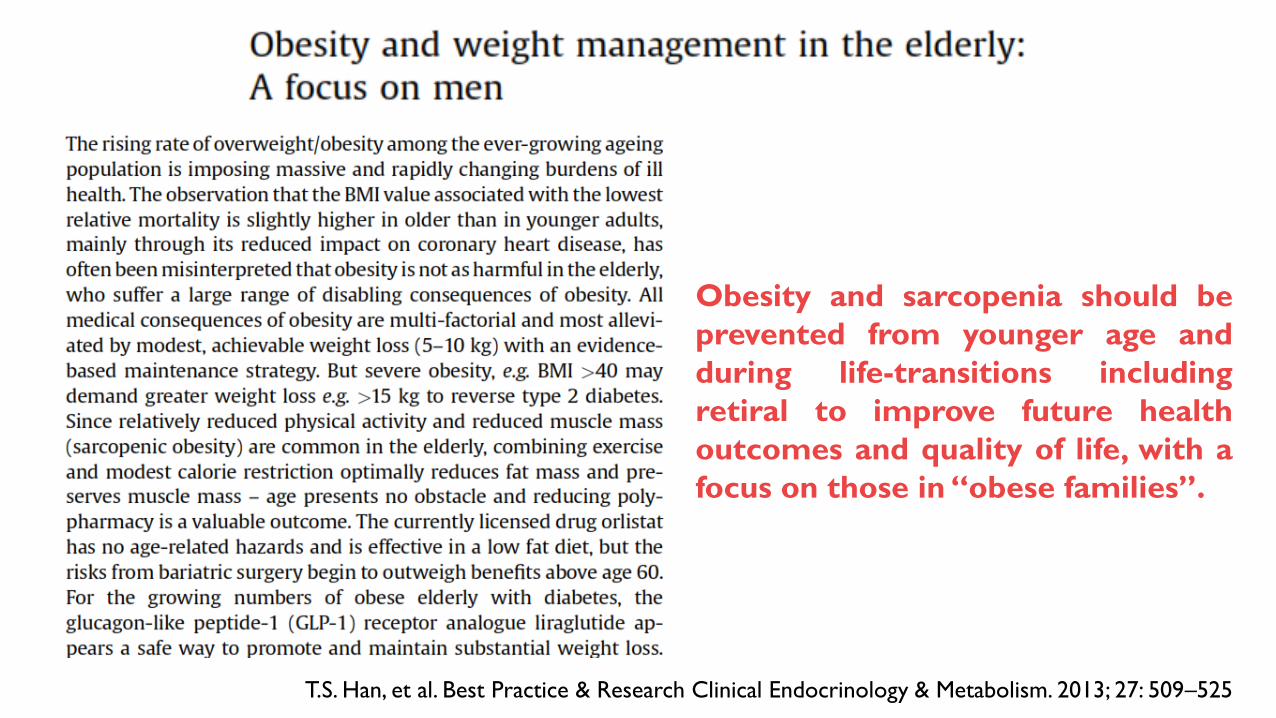
Obesity and sarcopenia should be
prevented from younger age and
during life-transitions including
retiral to improve future health
outcomes and quality of life, with a
focus on those in “obese families”.
T.S. Han, et al. Best Practice & Research Clinical Endocrinology & Metabolism. 2013; 27: 509–525
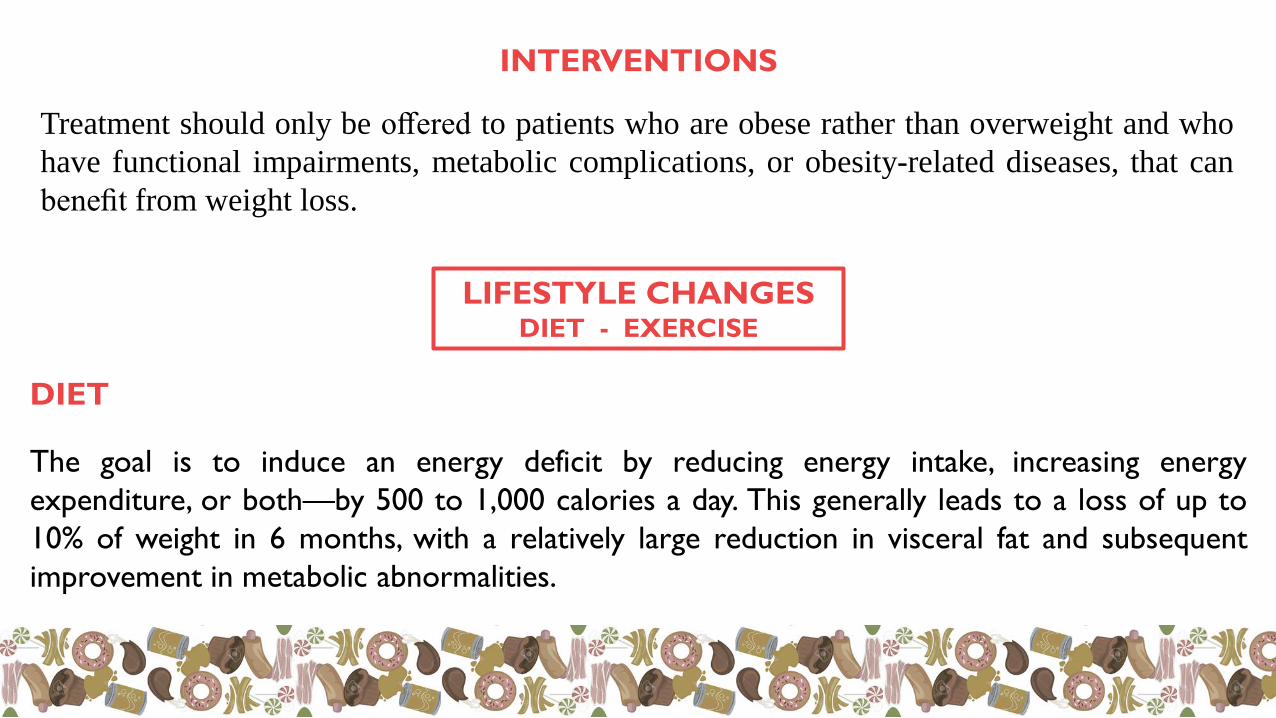
INTERVENTIONS
LIFESTYLE CHANGESDIET - EXERCISE
Treatment should only be offered to patients who are obese rather than overweight and who
have functional impairments, metabolic complications, or obesity-related diseases, that can
benefit from weight loss.
DIET
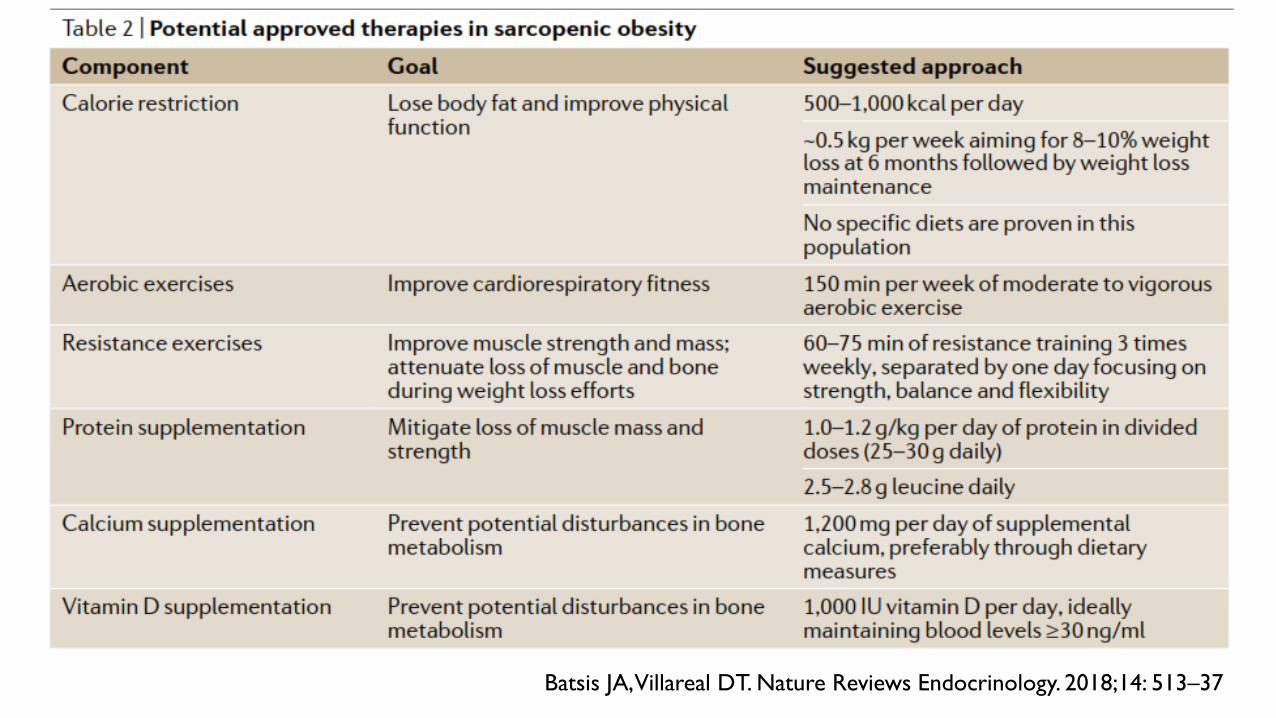
The goal is to induce an energy deficit by reducing energy intake, increasing energy
expenditure, or both—by 500 to 1,000 calories a day. This generally leads to a loss of up to
10% of weight in 6 months, with a relatively large reduction in visceral fat and subsequent
improvement in metabolic abnormalities.
INTERVENTIONS
DIET
Treatment differs from that in the younger population primarily because of the importance of
preventing loss of muscle and bone mass with intentional weight loss. People of all ages who lose
weight intentionally lose fat and, to a lesser extent, skeletal muscle. Older patients have
already lost muscle mass, but further changes in body composition, especially a further
reduction in muscle mass, can be limited by consuming about 1.0 g/kg of high-quality protein in the
diet and by engaging in resistance training and weight training.
Very important is also an adequate intake of calcium and vitamin D.
In those who have survived into old age with good health and an intact functional status,
significant caloric restriction should not be recommended. The goal is often to maintain
weight and incorporate a daily exercise program rather than to aggressively lose
weight. Weight regain is frequent, and this may be a disproportionate rise in body fat without
restoring muscle or bone mass.
INTERVENTIONS
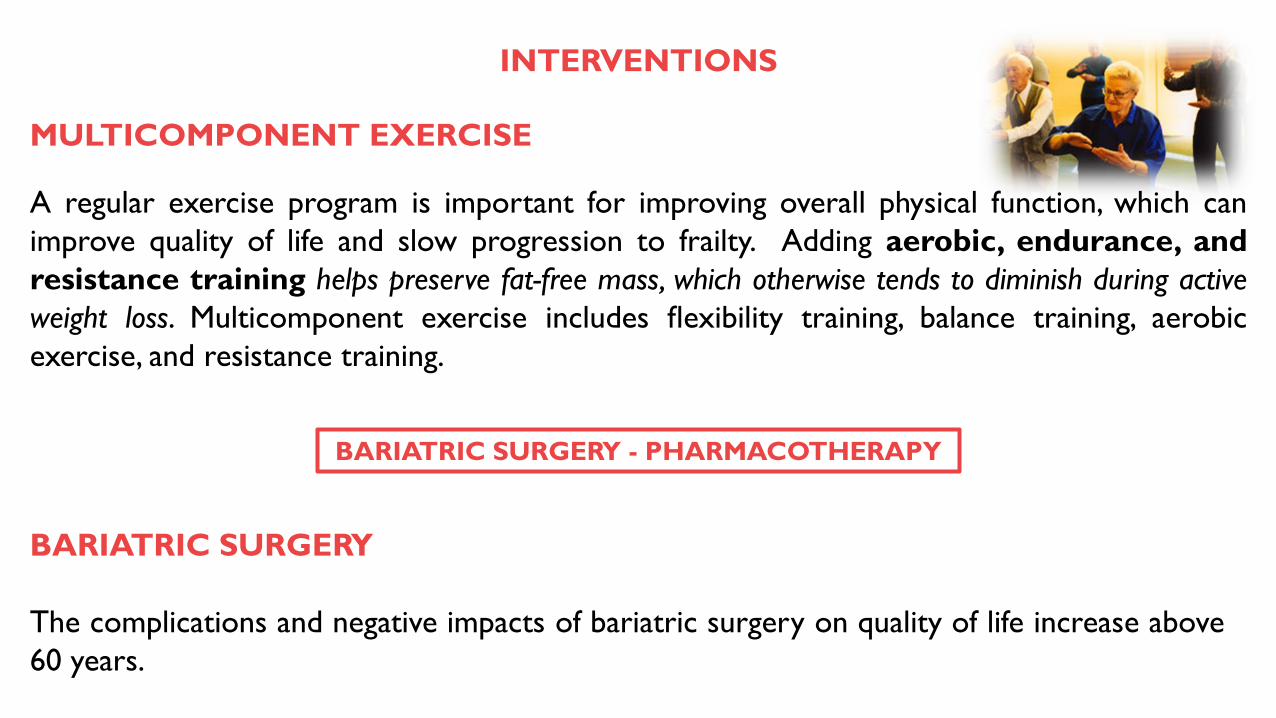
MULTICOMPONENT EXERCISE
A regular exercise program is important for improving overall physical function, which can
improve quality of life and slow progression to frailty. Adding aerobic, endurance, and
resistance training helps preserve fat-free mass, which otherwise tends to diminish during active
weight loss. Multicomponent exercise includes flexibility training, balance training, aerobic
exercise, and resistance training.
BARIATRIC SURGERY - PHARMACOTHERAPY
BARIATRIC SURGERY
The complications and negative impacts of bariatric surgery on quality of life increase above
60 years.
Batsis JA, Villareal DT. Nature Reviews Endocrinology. 2018;14: 513–37
INTERVENTIONS
DRUGS
Orlistat (Xenical) is the only evidence-based and licensed anti-obesity medication. It is a
saturated derivative of lipostatin which acts by binding to intestinal lipases to prevent
dietary fat absorption. There is no evidence to suppose that its effectiveness or safety would
be any different in elderly patients, as it is not absorbed by the gastrointestinal tract. About
10% weight loss after one year may be achieved. Steatorrhoea is the main adverse effect
(more troublesome in the elderly who may already suffer from faecal incontinence). Fat
soluble vitamins, especially vitamin D, may be reduced substantially by orlistat.
Sibutramine (Reductil) is a centrally acting, monoamine reuptake inhibitor, blocking the
reuptake of both serotonin and noradrenaline leading to increased satiation. It has recently
been withdrawn in most countries.
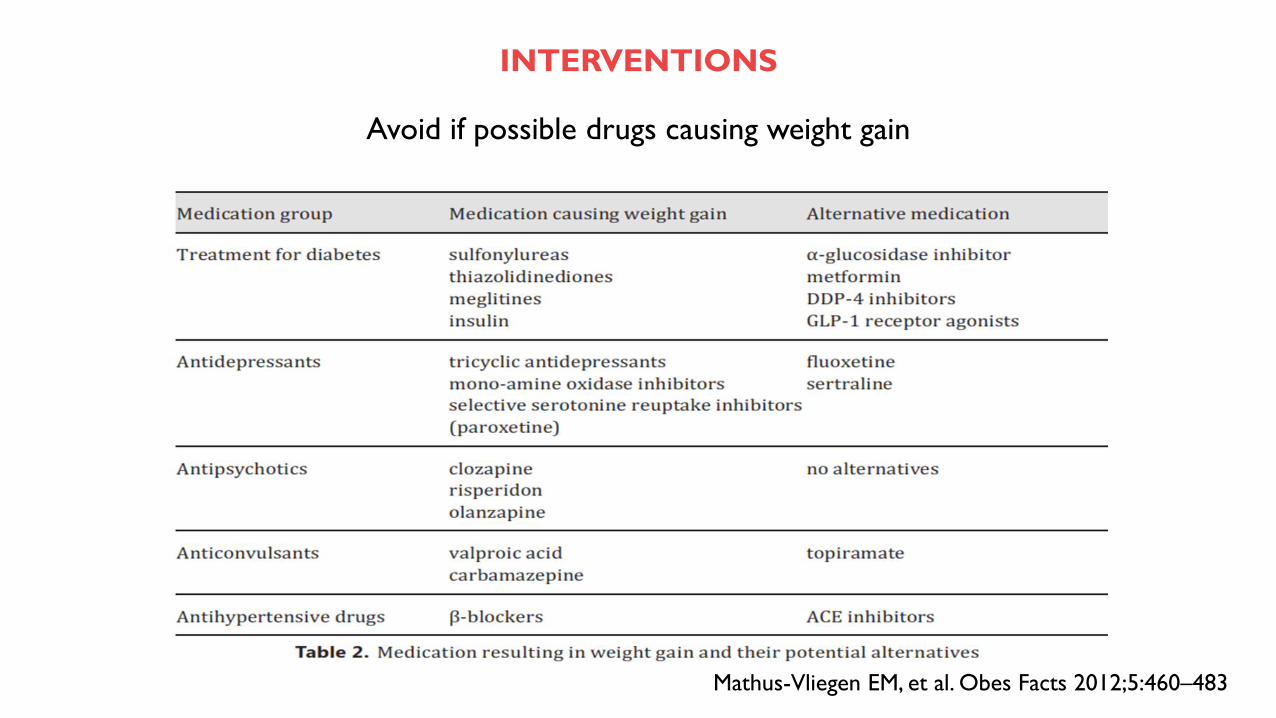
INTERVENTIONS
Avoid if possible drugs causing weight gain
Mathus-Vliegen EM, et al. Obes Facts 2012;5:460–483
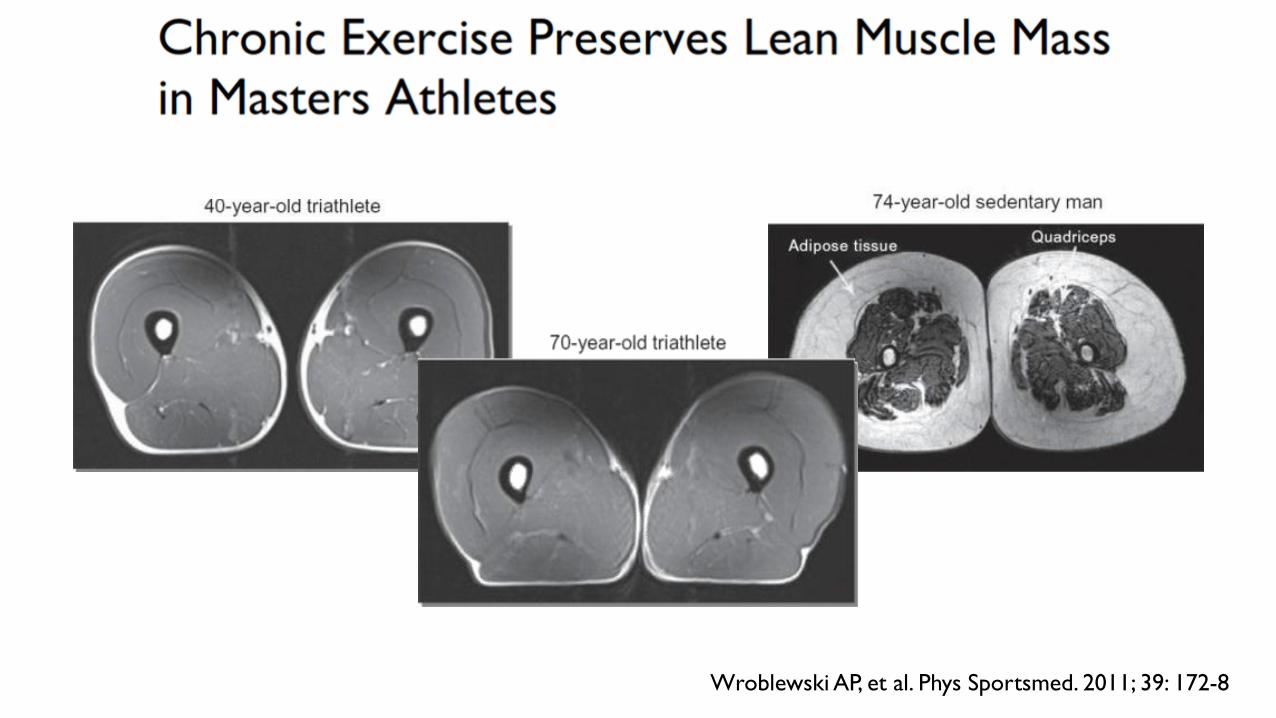
Wroblewski AP, et al. Phys Sportsmed. 2011; 39: 172-8
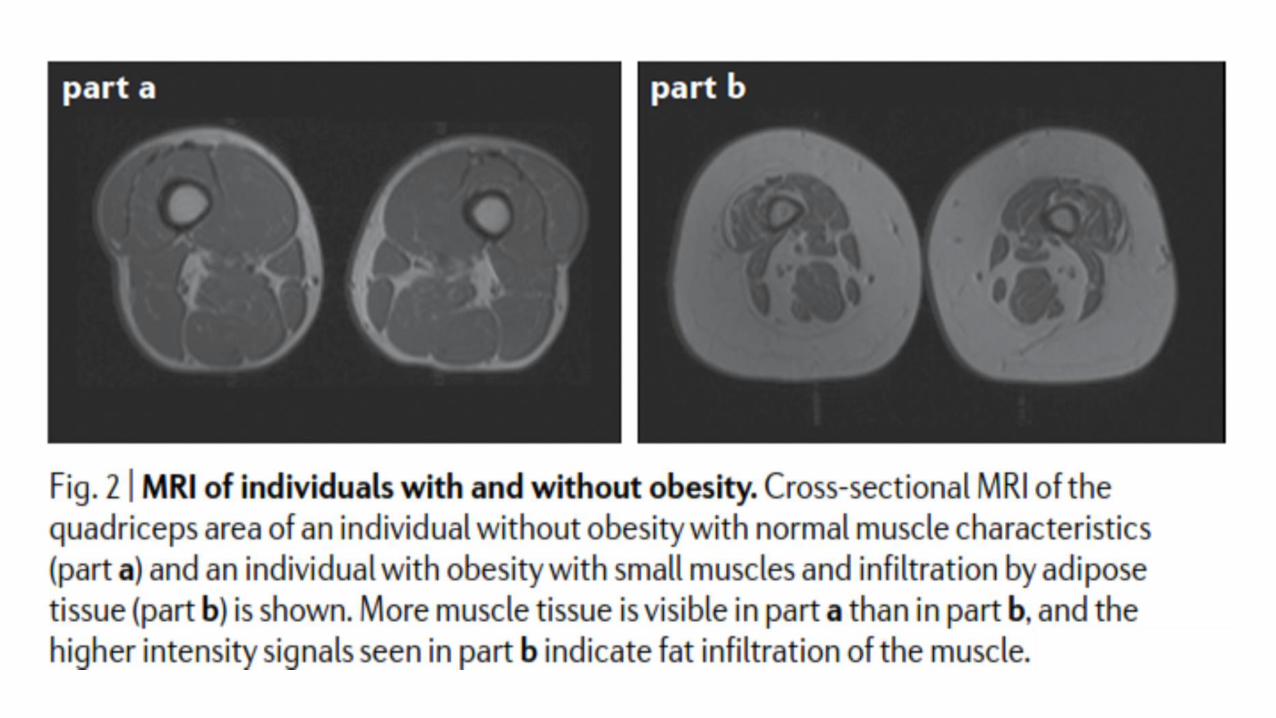
…This study evaluated whether high levels of chronic exercise prevents the loss of lean muscle mass and
strength experienced in sedentary aging adults.
A cross-section of 40 high-level recreational athletes (“masters athletes”) who were aged 40 to 81 years and trained 4 to 5
times per week underwent tests of health/activity, body composition, quadriceps peak torque (PT), and magnetic resonance
imaging of bilateral quadriceps. Mid-thigh muscle area, quadriceps area (QA), subcutaneous adipose tissue, and intramuscular
adipose tissue were quantified in magnetic resonance imaging using medical image processing, analysis, and visualization
software. One-way analysis of variance was used to examine age group differences. Relationships were evaluated using
Spearman correlations. Mid-thigh muscle area (P = 0.31) and lean mass (P = 0.15) did not increase with age and were
significantly related to retention of mid-thigh muscle area (P < 0.0001). This occurred despite an increase in total body fat
percentage (P = 0.003) with age. Mid-thigh muscle area (P = 0.12), QA (P = 0.17), and quadriceps PT did not decline with
age. Specific strength (strength per QA) did not decline significantly with age (P = 0.06). As muscle area increased, PT
increased significantly (P = 0.008). There was not a significant relationship between intramuscular adipose tissue (P = 0.71)
or lean mass (P = 0.4) and PT. This study contradicts the common observation that muscle mass and strength
decline as a function of aging alone. Instead, these declines may signal the effect of chronic disuse rather
than muscle aging. Evaluation of masters athletes removes disuse as a confounding variable in the study of lower-
extremity function and loss of lean muscle mass. This maintenance of muscle mass and strength may decrease or
eliminate the falls, functional decline, and loss of independence that are commonly seen in aging adults.
Wroblewski AP, et al. Phys Sportsmed. 2011; 39: 172-8