Loading of total hip joint replacements - TU Berlin · „Loading of total hip joint replacements...
127
„Loading of total hip joint replacements – In vivo measurements with instrumented hip implants“ vorgelegt von Dipl.-Ing. Philipp Damm geb. in Zschopau von der Technischen Universität Berlin Fakultät V – Verkehrs- und Maschinensysteme zur Erlangung des akademischen Grades Doktor der Ingenieurwissenschaften Dr.-Ing. genehmigte Dissertation Promotionsausschuss: Vorsitzender: Prof. Dr.-Ing. Jörg Krüger Gutachter: Prof. Dr.-Ing. Marc Kraft Gutachter: Prof. Dr.-Ing. Georg Bergmann Tag der wissenschaftlichen Aussprache: 08. September 2014 Berlin 2014 D 83
Transcript of Loading of total hip joint replacements - TU Berlin · „Loading of total hip joint replacements...

„Loading of total hip joint replacements –
In vivo measurements with instrumented hip implants“
vorgelegt von Dipl.-Ing. Philipp Damm
geb. in Zschopau
von der Technischen Universität Berlin Fakultät V – Verkehrs- und Maschinensysteme
zur Erlangung des akademischen Grades
Doktor der Ingenieurwissenschaften Dr.-Ing.
genehmigte Dissertation
Promotionsausschuss:
Vorsitzender: Prof. Dr.-Ing. Jörg Krüger
Gutachter: Prof. Dr.-Ing. Marc Kraft
Gutachter: Prof. Dr.-Ing. Georg Bergmann
Tag der wissenschaftlichen Aussprache: 08. September 2014
Berlin 2014 D 83

II

II
Acknowledgments
First and foremost I would like to sincerely thank everyone who supported me
throughout the implementation and evaluation of the very extensive in vivo
measurements. It has given me great pleasure to work in this unique scientific
environment with the opportunity to get a doctorate.
A very special thank you goes out to the patients who volunteered their time and
effort to take part in the study. Their enthusiasm and focus during the extensive
measurements are greatly appreciated.
This work would not have been possible without the extensive support from
Prof. Dr. -Ing. Georg Bergmann who, with his constructive criticism and advice, has
been a great mentor throughout my dissertation. I would like to thank him for letting
me draw from his profound scientific experience, valuable discussions and
encouraging my independent scientific work.
Furthermore, special thanks goes to the entire team of "Instrumented Implants" at the
Julius Wolff Institute. It was fantastic to work with you, you have been a great source
of collaboration and advice. I would also like to thank all the students who helped
evaluating the measurement data.
I am indebted to Dipl.-Ing. Jörn Dymke for his great support during the
measurements and Dr.-Ing. Friedmar Graichen for his help with implant fabrication
and moral support. I would like to acknowledge Barbara Schiller for her great
administrative assistance. A special thanks to Dr.-Ing. Alwina Bender for her
assistance with mathematical problems and the needed software support. I would like
to thank Dipl.-Sportw. Verena Schwachmeyer for her support and scientific
discussions. My personal thanks go to Dr. rer. medic Ines Kutzner; it was fantastic to
work with you each day. I want to thank Prof. Dr. Andreas Haider and Dr. Alexander
Beier from the Sana Kliniken Sommerfeld for the time-consuming search for study
participants and clinical support. Thank you to my sister Sophie Damm for proof-
reading the manuscript.
Last but not least I would like to thank my parents who raised me with a love for
science and supported me in all my pursuits. Their unconditional encouragement and
support have in no small way contributed to who I am today.
III
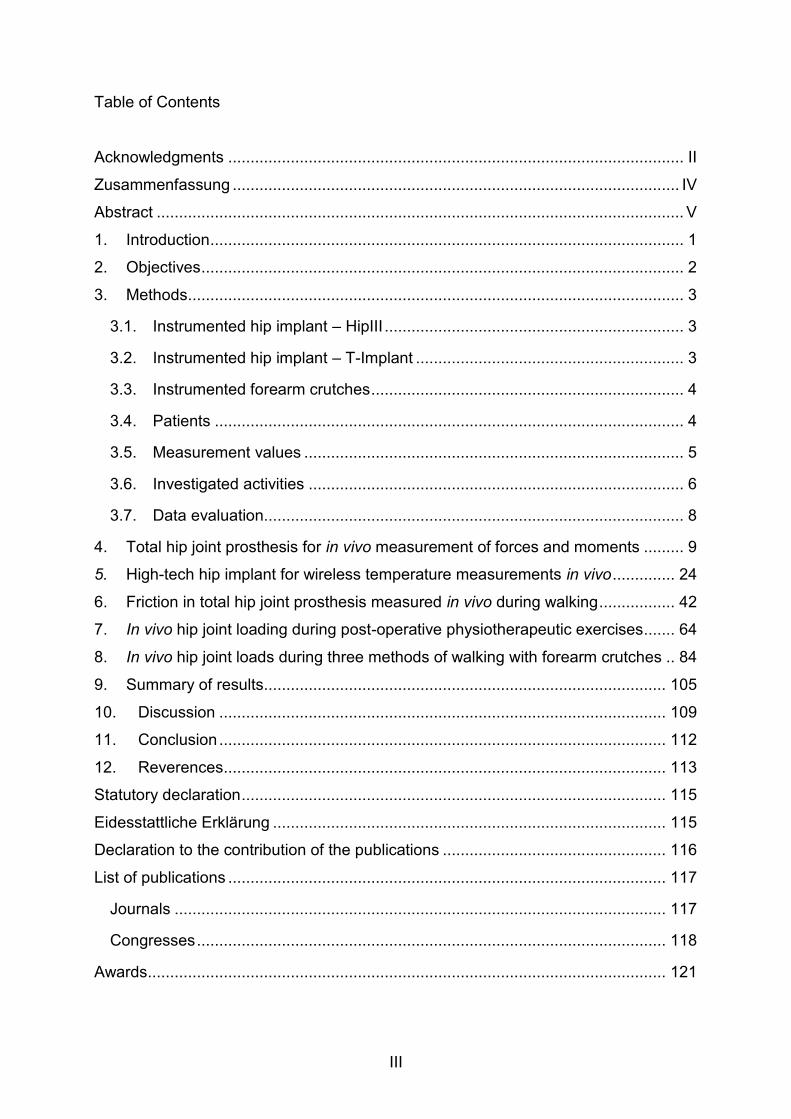
Table of Contents
Acknowledgments ...................................................................................................... II
Zusammenfassung .................................................................................................... IV
Abstract ...................................................................................................................... V
1. Introduction .......................................................................................................... 1
2. Objectives ............................................................................................................ 2
3. Methods ............................................................................................................... 3
3.1. Instrumented hip implant – HipIII ................................................................... 3
3.2. Instrumented hip implant – T-Implant ............................................................ 3
3.3. Instrumented forearm crutches ...................................................................... 4
3.4. Patients ......................................................................................................... 4
3.5. Measurement values ..................................................................................... 5
3.6. Investigated activities .................................................................................... 6
3.7. Data evaluation.............................................................................................. 8
4. Total hip joint prosthesis for in vivo measurement of forces and moments ......... 9
5. High-tech hip implant for wireless temperature measurements in vivo .............. 24
6. Friction in total hip joint prosthesis measured in vivo during walking ................. 42
7. In vivo hip joint loading during post-operative physiotherapeutic exercises ....... 64
8. In vivo hip joint loads during three methods of walking with forearm crutches .. 84
9. Summary of results .......................................................................................... 105
10. Discussion .................................................................................................... 109
11. Conclusion .................................................................................................... 112
12. Reverences ................................................................................................... 113
Statutory declaration ............................................................................................... 115
Eidesstattliche Erklärung ........................................................................................ 115
Declaration to the contribution of the publications .................................................. 116
List of publications .................................................................................................. 117
Journals .............................................................................................................. 117
Congresses ......................................................................................................... 118
Awards .................................................................................................................... 121

IV
„Die Belastung des Hüftgelenkes –
In vivo Messungen mit instrumentierten Hüftendoprothesen“
von Dipl.-Ing. Philipp Damm
Zusammenfassung
Der totale Hüftgelenkersatz zählt zu den erfolgreichsten Operationen in der
Endoprothetik. Jedoch ist das Patientenspektrum in den letzten Jahren immer jünger
und aktiver geworden. Dadurch ist der Anspruch im Hinblick auf die Belastbarkeit und
Lebensdauer dieser Implantate gestiegen. Bezüglich dieser erhöhten
Beanspruchung der Implantate stellt insbesondere der reibungsinduzierte Abrieb der
Gelenkpartner noch ein Problem dar. Für die Optimierung der Gleitpartner werden
Daten über die in vivo wirkenden Reibparameter benötigt, um den Gelenkverschleiß,
große Reibmomente an der Pfanne und daraus folgende Lockerungen der Prothesen
zu minimieren. Ebenso sind realistische Daten über die auftretenden
Gelenkbelastungen während der Rehabilitation bzw. im Alltag erforderlich, um Ärzten
und Patienten Hinweise für eine optimale postoperative Nachbehandlung geben zu
können.
Eine im Rahmen dieser Arbeit entwickelte instrumentierte Hüftendoprothese mit einer
Keramik-Polyethylen Paarung ermöglicht es erstmalig, die Kontaktkräfte und
Reibmomente in vivo zu messen. 10 Coxarthrose-Patienten wurden mit einem
solchen instrumentierten Implantat versorgt.
Beim Gehen wird das Gelenk im Mittel mit einer Kontaktkraft von 248%BW belastet.
Durch Unterarmgehstützen war es möglich, die Kontaktkraft um 17% (3-Punkt),
12% (4-Punkt) bzw. 13% beim 2-Punkt Gang zu reduzieren.
Erstmalige in vivo Messungen zeigten, dass das Reibmoment beim Gehen während
der gesamten Standphase kontinuierlich ansteigt, mit einem mittleren Maximum von
0,22%BWm. Jedoch traten große inter-individuelle Unterschiede auf. Der sich
während jedem Schritt ändernde Reibungskoeffizient deutet darauf hin, dass sich die
Schmierbedingungen im Gelenkspalt von Mischreibung nach dem Auftreten zu
Trockenreibung während der Schwungphase ändern. Die großen individuellen
Unterschiede der wirkenden Reibung werden evtl. durch die individuellen
Schmiereigenschaften der Synovia verursacht.
V
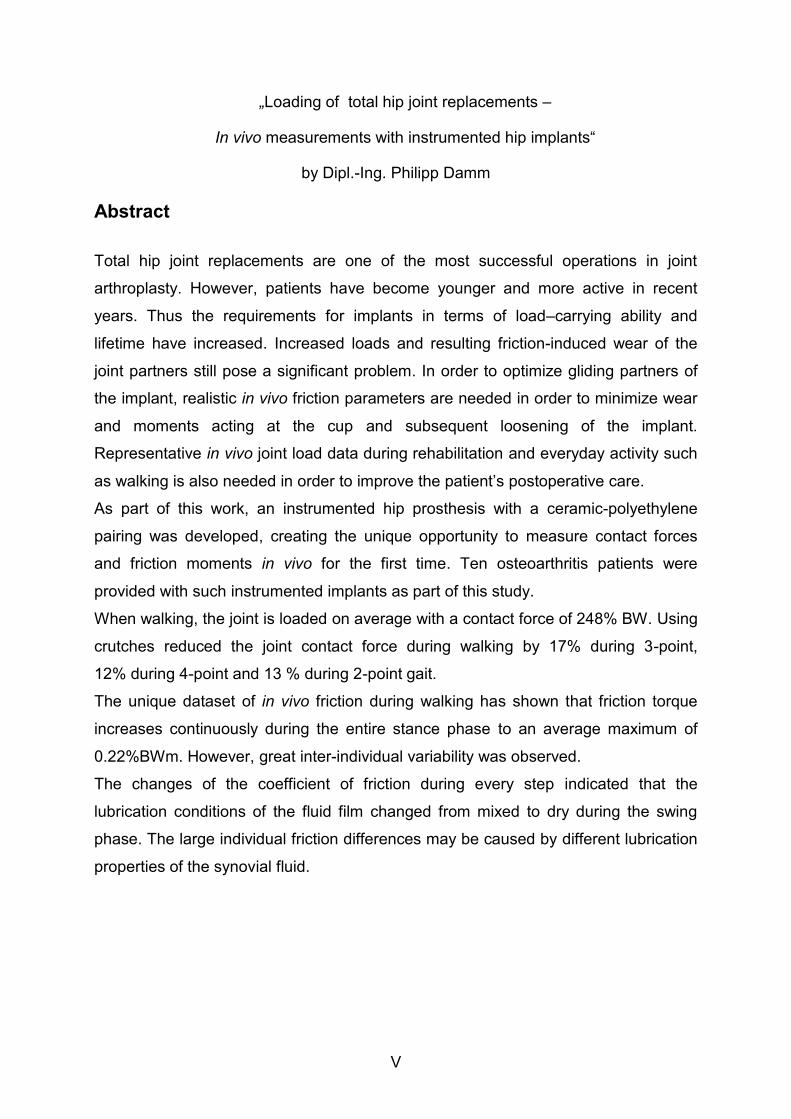
„Loading of total hip joint replacements –
In vivo measurements with instrumented hip implants“
by Dipl.-Ing. Philipp Damm
Abstract
Total hip joint replacements are one of the most successful operations in joint
arthroplasty. However, patients have become younger and more active in recent
years. Thus the requirements for implants in terms of load–carrying ability and
lifetime have increased. Increased loads and resulting friction-induced wear of the
joint partners still pose a significant problem. In order to optimize gliding partners of
the implant, realistic in vivo friction parameters are needed in order to minimize wear
and moments acting at the cup and subsequent loosening of the implant.
Representative in vivo joint load data during rehabilitation and everyday activity such
as walking is also needed in order to improve the patient’s postoperative care.
As part of this work, an instrumented hip prosthesis with a ceramic-polyethylene
pairing was developed, creating the unique opportunity to measure contact forces
and friction moments in vivo for the first time. Ten osteoarthritis patients were
provided with such instrumented implants as part of this study.
When walking, the joint is loaded on average with a contact force of 248% BW. Using
crutches reduced the joint contact force during walking by 17% during 3-point,
12% during 4-point and 13 % during 2-point gait.
The unique dataset of in vivo friction during walking has shown that friction torque
increases continuously during the entire stance phase to an average maximum of
0.22%BWm. However, great inter-individual variability was observed.
The changes of the coefficient of friction during every step indicated that the
lubrication conditions of the fluid film changed from mixed to dry during the swing
phase. The large individual friction differences may be caused by different lubrication
properties of the synovial fluid.

1
1. Introduction
Total hip joint replacements are one of the most successful procedures in joint
arthroplasty. However, in recent years, candidates for such a joint replacement have
been getting younger and more athletic [1-2]. Thus, the requirements of implants in
terms of stability and lifetime have increased. This leads to increased friction-induced
wear, higher moments at the cup and subsequently to higher loosening risks [3]. In
order to extend implant life spans, knowledge of realistic in vivo joint loads and
friction conditions is essential for preclinical testing and optimization of hip implants.
Such in vivo data on friction and load magnitudes can provide more realistic
parameters for implant testing. The in vivo measured torsion moment around the
femoral shaft can be used to optimize fixation of the implant stem. Data on the
bending moments in the femoral neck may feasible more stable implants used for
fractures of the femoral neck. Data on the joint loads acting during different activities
will allow to improve the physiotherapy following joint replacement and give advice to
patients with Osteoarthritis.
Davy et al., Kotzar et al. and Bergmann et al. [5-7] report in vivo load measurements
in total hip joint replacements. However, contact forces were measured only in a
group of very old and inactive patients. Furthermore they were not able to measure
the in vivo friction in the joint.
The main scope of this work was to access for the first time ever the in vivo hip joint
loads in a group of relatively young and athletic patients by measuring joint contact
forces and friction using instrumented implants.

2
2. Objectives
The first objective of this work was to develop an instrumented hip implant to
simultaneously measure the in vivo acting friction moment and the contact forces at
the hip joint. As part of a clinical study, the newly developed instrumented prostheses
were implanted in ten active osteoarthritis hip patients to help answer the following
questions:
How is the hip joint loaded during postoperative physiotherapy?
How effective are forearm crutches to reduce hip joint loading?
What are the in vivo friction conditions in artificial hip joints during walking?
The second objective of the study was to develop a hip implant capable of measuring
in vivo the friction-induced joint temperatures. Using such implants, it is planned to
record the temperatures during long lasting activities in patient with implants which
have different material combinations of head and cup.

3
3. Methods
3.1. Instrumented hip implant – HipIII
In order to simultaneously measure in vivo contact forces and friction moments in the
hip joint an instrumented hip implant with inductive power supply was developed [8].
Measurement signals were transmitted at radio frequency to an external device and
processed in a computer. Following extensive mechanical and biological testing, the
implant was certified and approved for clinical trials in compliance with the
“Medizinproduktegesetz” (MPG) and “Richtlinie 90/385/EWC”.
Ten instrumented implants with the stem size 10 and 12 were manufactured and
combined with an Al2O3 ceramic head. Each implant was individually calibrated [9]
and a measurement accuracy of 2% for the contact forces and 1.5% for the moments
was ascertained.
See also publication: Total hip joint prosthesis for in vivo measurement of forces
and moments DOI: 10.1016/j.medengphy.2009.10.003
3.2. Instrumented hip implant – T-Implant
In vivo friction in the hip implant depends on both the gliding motion and lubricant
conditions. We hypothesized that high friction can result in increased joint
temperatures and possibly in implant loosening. In order to measure the joint
temperatures, a second instrumented implant was developed. Five prototypes were
manufactured with a measurement accuracy of 0.01°C. The power supply and data
transmission are inductive and the implant can be combined with all common
head/cup pairings. The instrumented implant was certified in compliance with the
“Medizinproduktegesetz” (MPG) and “Richtlinie 90/385/EWC” and approved for a
clinical trial.
See also publication: High-tech hip implant for wireless temperature
measurements in vivo DOI:10.1371/journal.pone.0043489

4
3.3. Instrumented forearm crutches
Two instrumented forearm crutches were manufactured to measure the longitudinal
crutch force synchronously to the in vivo joint load, depending on the type of crutch
support. Two load transducers (KM30z-2kN, ME-Meßsystem GmbH, Germany) were
integrated in the lower part of the crutches. The transducers were connected to the
external equipment by cables. A physiotherapist adjusted the crutch lengths
according to the patients needs.
3.4. Patients
Ten patients were selected to take part in the clinical trial; study scope, risk and
procedures were explained and written consent was obtained from all patients to take
part in the clinical trial (Table 1). Implantations of the instrumented implants (HipIII)
were performed at the „Klinik für Endoprothetik“ of the “Sana Kliniken” in
Sommerfeld/Kremmen, Germany.
Table1: Patients of the clinical trial
Patient
Age
at implantation
[years]
Sex
[m/f] Implantation
Bodyweight
[kg]
Body height
[cm]
H1L 55 m Apr. 2010 73 178
H2R 62 m Aug. 2010 75 172
H3L 59 m Nov. 2010 92 168
H4L 51 m Jan. 2011 83 178
H5L 62 f Apr. 2011 87 168
H6R 67 m Nov. 2011 85 176
H7R 52 m Nov. 2011 90 179
H8L 55 m Apr. 2012 90 178
H9L 54 m Sep. 2012 118 181
H10R 53 f Jan. 2013 100 164
5
3.5. Measurement values
Contact forces and friction moments
The 3D joint contact forces and friction moments were measured in a implant-based
coordinate system, which is located at the center of the implant head. These loads
were converted into the femur-based coordinate system with its origin at the center of
the femoral head [10]. The fixed reference points for the x/y/z coordinate system are
lateral/anterior/superior. The resultant contact force (Fres) acting onto the joint center
is calculated from its three components. Similar to the contact force the friction
moments were measured around the x/y/z axes of the femur based coordinate
system (flexion-extension/abduction-adduction/internal-external rotation) and the
resultant friction moment (Mres) was calculated there from the three components.
See also publication: Friction in Total Hip Joint Prosthesis Measured In Vivo
during Walking DOI:10.1371/journal.pone.0078373
In vivo hip joint loads during three methods of walking
with forearm crutches DOI: 10.1016/j.clinbiomech.2012.12.003
In vivo hip joint loading during post-operative
physiotherapeutic exercises DOI:10.1371/journal.pone.0077807
Torsion and bending moments
In addition to the acting forces and moments at the joint, the torque Mtors around the
bone/shaft interface can have a significant influence on the primary stability of the
joint replacement. Mtors depends on the joint contact forces, the individual implant
geometry and the implant position in the femur.
After femoral neck fractures the bending moment Mbend in the neck can be a critical
factor for the healing process. Mbend is determined by the contact forces acting onto
the joint and its 3D lever arm relative to the fracture.
See also publication: In vivo hip joint loading during post-operative
physiotherapeutic exercises DOI:10.1371/journal.pone.0077807
In vivo hip joint loads during three methods of walking with
forearm crutches DOI: 10.1016/j.clinbiomech.2012.12.003

6
Coefficient of friction and friction-induced power
Friction in total hip joint replacements mainly depends on the lubrication properties of
the synovia, the materials of the gliding partners and their surface roughness, and on
the gliding speed. To characterize the friction coefficient µ in vivo and compare it with
data from in vitro simulator studies, the Coulomb friction model was used. During
walking, the hip joint rotates around all three axes of movement. Thus the model of
Coloumb was transformed into a three-dimensional approach. With the input of Fres
and Mres the coefficient µ was then calculated the first time ever in vivo over the entire
gait cycle of walking.
Friction results in a temperature increase in the implant, which is proportional to the
friction-induced power loss in the joint. This power is determined by the product of the
friction force between the gliding surfaces and the gliding speed. Average values of
this power loss were calculated during the walking cycle, for extension and flexion
separately.
See also publication: Friction in Total Hip Joint Prosthesis Measured In Vivo
during Walking DOI:10.1371/journal.pone.0078373
3.6. Investigated activities
Hip joint loads during level walking
Level walking is one of the activities that every patient should be able to perform
even shortly after total hip joint replacement surgery. However, up to now there was
no data available about the friction during this activity.
The in vivo measurements were performed three months post surgery during level
walking. The patients were asked to walk several times on level ground over a
distance of 10m at a self-selected speed. The in vivo hip joint contact forces and
friction moments were measured and analysed.
See also publication: Friction in Total Hip Joint Prosthesis Measured In Vivo
during Walking DOI:10.1371/journal.pone.0078373

7
Hip joint loads during physiotherapeutic exercises
Following total joint arthroplasty, physiotherapeutic exercises are the first kind of
activities the patient has to perform post surgery. However, during the first weeks
after joint replacement bone ingrowths at the implant interface is still susceptible to
micro movement which can jeopardise the implant stability. Therefore protecting the
implant from high forces and high torque around the implant stem is crucial during the
early stages after surgery.
However, up to today there exists no realistic data on in vivo hip joint loading during
post-operative physiotherapy. As part of this study, in vivo hip joint loads were
therefore measured during 13 typical physiotherapeutic exercises.
See publication: In vivo hip joint loading during post-operative physiotherapeutic
exercises DOI:10.1371/journal.pone.0077807
Hip joint loading during walking with crutches
Patients with osteoarthritis, with joint implants or osteosynthesis use crutches in order
to reduce lower limb loading. However, insufficient information exists about the really
achieved reductions. In this study, the load reduction in the hip joint while walking
with crutches was investigated in vivo during 3-, 4- and 2-point gait. Furthermore,
synchronously to the in vivo joint loads, the crutch loads were measured using
instrumented crutches.
The first part of the study compared the joint loads while walking with crutches to the
joint loads without crutches. These measurements were taken three months after
implantation. The second part of the study looks at the postoperative changes of the
joint load reductions during 4-point gait.
See publication: In vivo hip joint loads during three methods of walking with
forearm crutches DOI: 10.1016/j.clinbiomech.2012.12.003

8
3.7. Data evaluation
Each patient was requested to repeat each activity at least six times in order to
access the intra-individual variability of the joint loads. The patient’s activities were
measured and recorded continuously; load data and patient movements were
simultaneously videotaped. All forces are reported in percent of the bodyweight
(%BW) and the moments in %BWm. The load-time patterns during single trials were
individually averaged by using a ‘time warping’ method [11]. The average load
patterns of all investigated patients were combined by the same method. They
represent the joint loads of an average subject.
“First the period times of all included load cycles are normalized. The single time
scales were then distorted in such a way that the squared differences between all
deformed curves, summed over the whole cycle time, were smallest. Finally, an
arithmetically averaged load-time pattern was calculated from all the deformed
curves. Using these algorithms, an average time course was first calculated from the
time patterns of the resultant joint forces. The obtained time deformations of the
single trials were then transferred to the corresponding force and moment
components before averaging them, too.” [12]
Peak values of the load cycles were additionally numerically averaged. Changes of
the peak values as a function of post operatively time or differences between the
investigated activities were determined statistically for the individual patients
separately by using ‘Man-Whitney-U Test’ and changes for the average subject by
using the ‘Wilcoxon Test’.

9
Published in Medical Engineering & Physics 32; 2010: p. 95-100;
DOI: 10.1016/j.medengphy.2009.10.003
4. Total hip joint prosthesis for in vivo measurement of forces and
moments
P. Damm, F. Graichen, A. Rohlmann, A. Bender, G. Bergmann
Abstract
A new instrumented hip joint prosthesis was developed which allows the in vivo
measurement of the complete contact loads in the joint, i.e. 3 force and 3 moment
components. A clinically proven standard implant was modified. Inside the hollow
neck, 6 semiconductor strain gauges are applied to measure the deformation of the
neck. Also integrated are a small coil for the inductive power supply and a 9-channel
telemetry transmitter. The neck cavity is closed by a titanium plate and hermetically
sealed by electron beam welding. The sensor signals are pulse interval modulated
(PIM) with a sampling rate of about 120 Hz. The pulses are transmitted at radio
frequencies via a small antenna loop inside the ceramic head, which is connected to
the electronic circuit by a two pin feed through. Inductive power supply, calculation of
the loads from the measured deformations and real time load display are carried out
by the external equipment. The maximum error of the load components is 2%
including cross talk. The instrumented hip joint prostheses are to be implanted into 10
young and sportive patients.

10
Introduction
Knowledge of the forces and moments acting in vivo in total hip joint prostheses is
necessary in order to develop and test new implants, especially for optimizing their
friction properties [1, 2, 3]. It is also essential to optimize postoperative rehabilitation,
assess the severity of load conditions during sportive activities, and optimize
musculoskeletal models used in combination with gait analyses to calculate the
internal joint loads [4, 5, 6, 7]. Especially the effect of muscular co-contractions on the
joint loads can accurately be accessed by direct measurements only.
Research work has previously been performed on the contact forces acting in total
hip joint prostheses during walking, stair climbing and additional activities, both by
other authors [8, 9, 10, 11, 12] and by our group [13, 14, 15, 16]. However, the
patients were between 60 to 80 years old. With 26% and 48% of all cases, friction-
induced polyethylene wear and wear-related aseptic loosening are the most frequent
reason for revisions of hip joint prostheses [17]. Other bearing combinations as
metal–metal or ceramic–ceramic have much lower wear rates but still retain the
problem of aseptic loosening [18, 19, 20, 21, 22]. The friction in the joint and thus the
wear of the implants can be determined from measured joint contact forces and
moments, but this has, to our knowledge, never been undertaken before. Patients
with total hip replacement become younger, more active and sportive [23, 24, 25, 26].
It is expected that their increased physical activities result in higher loads acting on
the total hip joint.
The aim of the study was to design and calibrate a non-cemented, instrumented hip
joint prosthesis which could be used to measure the 3 force components plus the 3
moment components acting between head and cup in vivo. Measured load data will
offer realistic test conditions for friction and wear and serve as a ‘gold standard’ for
optimizing analytical models.

11
Material and methods
Requirements for implant instrumentation
Instrumented hip joint prostheses must meet the following clinical and technical
requirements:
- All materials in direct body contact must be biocompatible.
- All electronics inside the implant must be hermetically sealed.
- The power supply must allow long term measurements.
- The implant must have sufficient mechanical strength.
- A clinically proven type of prosthesis should be the basis of the instrumented
implant, and its clinical function and fixation must remain unchanged.
Design
The ‘Cementless Tapered Wedge’ (CTW) prosthesis (Merete Medical GmbH, Berlin,
Germany) was chosen as a basis for the instrumented implant. Its design is similar to
the ‘Spotorno’ prosthesis, which is one of the clinically most successful types.
Prosthesis stem and neck are made out of a titanium alloy and are combined with a
ceramic head. The standard prostheses have a 12/14 mm conus. To provide enough
space for the internal electronics (Figure 1), neck and conus diameters were both
increased by 2 mm. The changed dimensions match the clinically successful
standard used until some years ago.
The electronic components are arranged inside the implant neck, which is
hermetically sealed with an electron beam-welded titanium plate. Integrated into this
plate is a 2-pin feedthrough adapted from a pacemaker (Biotronik GmbH, Berlin,
Germany). An antenna loop is formed by a niobium wire (NbZr1) and is laser-welded
onto the feedthrough. This antenna is located inside the cavity of the 32 mm standard
ceramic head, which protects antenna and feedthrough against mechanical damage.
In addition, the antenna is isolated by medical-grade polysiloxane (Polytec PT GmbH,
Waldbronn, Germany) against synovial fluid which could possibly infiltrate between
implant neck and head. The instrumented prosthesis can be combined with standard
polyethylene or ceramic sockets, with or without metal backing.

12
Figure 1: Cut-model of the modified CTW prosthesis with internal electrical
components
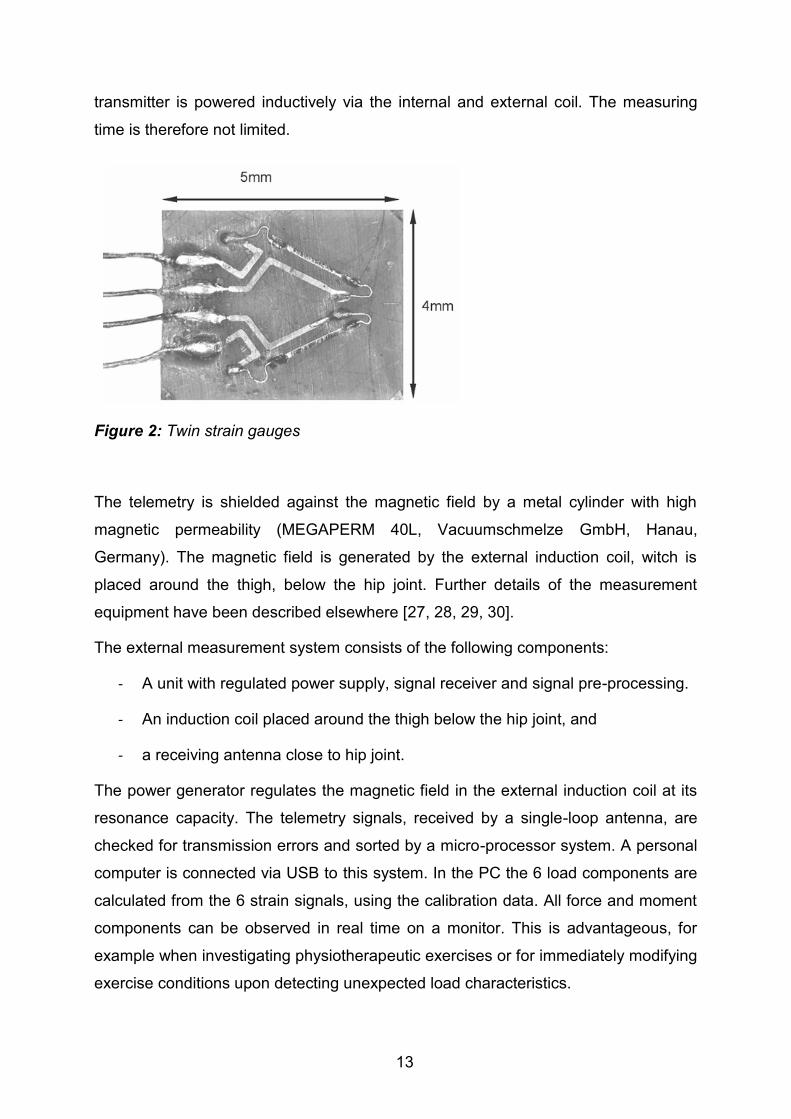
Instrumentation
Three custom-made twin semiconductor strain gauges (ACAM Instrumentation Ltd.,
Northampton, UK) inside the hollow neck serve as sensors for measuring the 6
deformations required for calculating 6 load components (Figure 2). Each twin strain
gauge is 5 by 4 mm in size and the 2 sensor elements are arranged at an angle of
45°. An NTC resistor on the telemetry circuit allows measurement of the implant
temperature, which is used to compensate thermal influences. The internal induction
coil delivers the power of 5 mW, required by the 9-channel telemetry circuit [27]. This
is the only active element on the 9-channel telemetry transmitter (2.0 x 2.6 mm)
custom-made chip. Strain gauges and the induction coil are connected to the
telemetry. All signals are sampled at a rate of approximately 120Hz. They are
multiplexed, converted to pulse interval modulated signals and transferred at a
frequency of about 120 MHz. The transmission range is up to 50 cm. The telemetry
13
transmitter is powered inductively via the internal and external coil. The measuring
time is therefore not limited.
Figure 2: Twin strain gauges
The telemetry is shielded against the magnetic field by a metal cylinder with high
magnetic permeability (MEGAPERM 40L, Vacuumschmelze GmbH, Hanau,
Germany). The magnetic field is generated by the external induction coil, witch is
placed around the thigh, below the hip joint. Further details of the measurement
equipment have been described elsewhere [27, 28, 29, 30].
The external measurement system consists of the following components:
- A unit with regulated power supply, signal receiver and signal pre-processing.
- An induction coil placed around the thigh below the hip joint, and
- a receiving antenna close to hip joint.
The power generator regulates the magnetic field in the external induction coil at its
resonance capacity. The telemetry signals, received by a single-loop antenna, are
checked for transmission errors and sorted by a micro-processor system. A personal
computer is connected via USB to this system. In the PC the 6 load components are
calculated from the 6 strain signals, using the calibration data. All force and moment
components can be observed in real time on a monitor. This is advantageous, for
example when investigating physiotherapeutic exercises or for immediately modifying
exercise conditions upon detecting unexpected load characteristics.

14
During the in vivo load measurements, the activities of the patients are to be
recorded on a digital video tape. The video signal and the received signals from the
implant are recorded synchronously on the same video tape. All data can be
analysed in detail after the measurements have been taken. Further details of the
measurement equipment are described elsewhere [27].
Calibration
During calibration the coordinate system of the instrumented implant is fixed in the
middle of the implant neck. The X-axis points in the medial direction, the Y-axis
posteriorly for a right implant and the Z-axis is aligned along the neck axis (Figure 3).
Figure 3: Coordinate system during calibration
The instrumented implant is calibrated using the matrix method [31, 32]. Details of
the test setup can be found in reference [33]. Load application during calibration is
performed in a custom-built uniaxial test rig. The calibration force is measured with
an accuracy of 0.1% by an uniaxial force transducer (U2B, HBM, Germany).

15
Figure 4: Calibration setup; uniaxial force are applied at 21 different locations
During calibration, the implant stem is fixed with bone cement in an aluminium
carrier, and a calibration block is mounted on top of the implant (Figure 4). Twenty-
one steel balls at the top and all side walls of this block serve as points of load
application, with known xyz lever arms relative to the origin of the coordinate system.
Load components –Fz, Mx and My are generated if the calibration force is acting on
a top loading point, the other components produced if it is applied to a lateral point.
When loading one of these points, a combination of up to 3 force and moment
components acts simultaneously. This can be regarded as a load vector L with 6
components, of which 1 to 3 exist for the different loading points. The chosen
calibration ranges of all 6 components are given in Table 1.

16
Table 1: External loads and the measured errors of forces and moments
The calibration force is increased from zero to its maximum and back while 10,000
readings from the 6 strain gauges are taken. Any set of 6 signals can be regarded as
a signal vector S. Data from all 21 calibration points are used to calculate 36
components of the 6 x 6 calibration matrix C from the values of L and S, as indicated
by the following equation
S = C * L.
The measuring matrix M is the inverse calibration matrix (M = C-1) whereby
L = M * S.
This is used to calculate the load vector L from the signal vector S during the
measurements.
The implant temperature is measured by an NTC resistor inside the prostheses neck.
To compensate the temperature sensitivity of the strain gauges, the implant is
calibrated at three different temperatures (39°C ± 3°C).
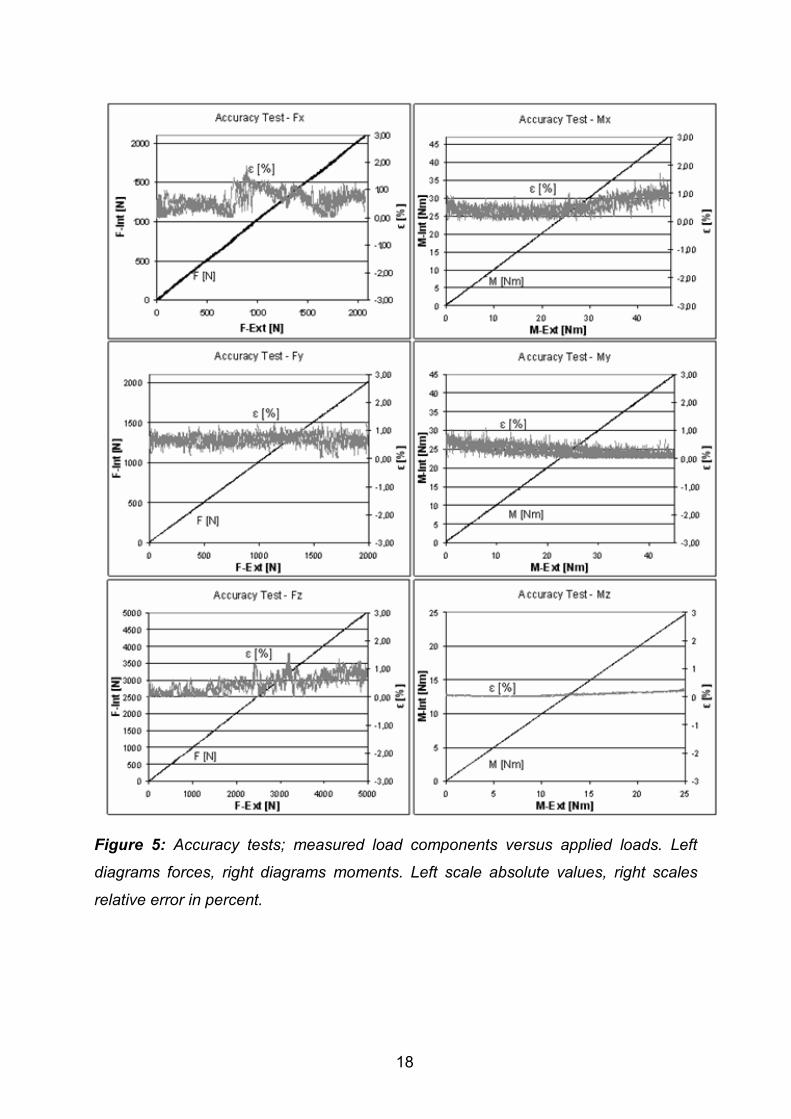
Results
Accuracy
To examine the accuracies of measurements taken with the prostheses, defined
forces and moments are applied consecutively at each of the calibration points and
are compared to the measured load components. Measuring errors are calculated as
percentages of the different calibration ranges of the 6 components and include the
crosstalk between all components. Examples of the achieved accuracies of the 6

17
load components are shown in Figure 5. The applied loads versus measured loads
are shown in the 6 different diagrams.
To check the accuracies of the load components, the relation between the applied
and the measured load was calculated. The highest and average errors are given in
Table 1. The maximum force error is 1.9 % for Fy. The average absolute error of all
force components is 0.7 %. The highest error of the moments occurs for Mz and is
1.5 %, while the average error of all moments is 0.5 %. All these values included
crosstalk between the components of the first prototype.
Implant safety and pre-clinical testing
The instrumented hip joint prostheses must fulfil the same safety criteria as a
standard implant. The welds were checked for thickness and voids, using test
specimens which were welded in the same way and at the same time as the
implants. The welds of each implant were inspected in vacuum for the absence of
leaks. The strengths of the implant stem and neck were tested according to the test
standard for hip implants (ISO 7206 Part 4/6/8) at a certificated testing laboratory
(EndoLab, Germany). Five million cycles with a maximum load of 2.3 kN were
applied at the head to test the shaft and 10 million cycles with a maximum load of 5.4
kN were used to check the dynamic stability of the implant neck. After that the neck
was additionally tested in-house under even more severe conditions, with loads
increasing from 5.8 kN to 7.8 kN within 5 million cycles. Finally a static force of 14 kN
was applied without implant failure. The safety of the implant and the external
equipment was audited (90/385/EWG, §20 MPG) at BerlinCERT GmbH (Berlin,
Germany). The instrumented implants are now approved by the ethical committee of
our university.
18
Figure 5: Accuracy tests; measured load components versus applied loads. Left
diagrams forces, right diagrams moments. Left scale absolute values, right scales
relative error in percent.

19
Discussion
One of the main reasons for revisions of total hip joint prostheses is wear rate [17,
18, 19]. Except for the mechanical risk of worn-out cups [34, 35], the frequent
biological consequence of wear particles is aseptic loosening of stem or cup fixation
[18, 19, 20]. Optimization of the bearing materials is therefore still required to improve
the endurance of total hip joint prostheses.
At the moment, a great amount of literature exists concerning friction and wear of hip
implants, tested in joint simulators [36, 37, 38, 39, 40, 41]. As the data of Bergmann
et al. [42, 43] suggest, friction in vivo probably depends much on the individually
strongly varying lubrication properties of the synovial fluid. This means that laboratory
tests on the wear of hip implants were, until now, not performed under the worst
conditions encountered in patients. This underlines the importance of measuring the
real moments acting in vivo, which is now possible with the instrumented hip implant
described. The measuring accuracy of 1.5 % for moments respectively 1.9 % for
forces is in the same range as that of technical transducers of much more complex
design, larger dimensions and with direct signal transmission.
Another important reason to measure the acting forces and moments in vivo is the
decreasing age and increasing activity levels of patients. This not only requires an
prolongation of implant lifetime by reducing wear but may also necessitate a rising of
the loads applied in fatigue tests above the current level as given by ISO standards.
Even the contact forces measured in elderly patients often exceed the current ISO
limits [44, 45].
The described implant, with its ability to accurately measure forces and moments
acting in the joint, will allow adapt the test conditions to the real situation when testing
new implants. It will furthermore allow us to advise more sportive younger patients
and their physiotherapists and orthopaedists as to which activities are preferable for
condition training without endangering the implant stability.
Acknowledgements
This project was supported by the German Research Society (SFB760-C6). The
modified implants were provided by Merete Medical GmbH, Berlin, Germany.

20
References
1. Maloney WJ, Galante JO, Anderson M, Goldberg V, Harris WH, Jacobs J,
Kraay M, Lachiewicz P, Rubash HE, et al. Fixation, polyethylene wear, and
pelvic osteolysis in primary total hip replacement. Clin Orthop Relat Res 1999:
157-64
2. Harris WH. Wear and periprosthetic osteolysis: the problem. Clin Orthop Relat
Res 2001: 66-70
3. Schmalzried TP, Jasty M, Harris WH. Periprosthetic bone loss in total hip
arthroplasty. Polyethylene wear debris and the concept of the effective joint
space. J Bone Joint Surg Am 1992;74: 849-63
4. Heller MO, Bergmann G, Deuretzbacher G, Durselen L, Pohl M, Claes L, Haas
NP, Duda GN. Musculo-skeletal loading conditions at the hip during walking
and stair climbing. J Biomech 2001;34: 883-93
5. Heller MO, Bergmann G, Deuretzbacher G, Claes L, Haas NP, Duda GN.
Influence of femoral anteversion on proximal femoral loading: measurement
and simulation in four patients. Clin Biomech (Bristol, Avon) 2001;16: 644-9
6. Brand RA, Pedersen DR, Davy DT, Kotzar GM, Heiple KG, Goldberg VM.
Comparison of hip force calculations and measurements in the same patient. J
Arthroplasty 1994; 9: 45-51
7. Stansfield BW, Nicol AC, Paul JP, Kelly IG, Graichen F, Bergmann G. Direct
comparison of calculated hip joint contact forces with those measured using
instrumented implants. An evaluation of a three-dimensional mathematical
model of the lower limb. J Biomech 2003; 36: 929-36
8. English TA, Kilvington M. In vivo records of hip loads using a femoral implant
with telemetric output (a preliminary report). J Biomed Eng 1979; 1: 111-5
9. Hodge WA, Fijan RS, Carlson KL, Burgess RG, Harris WH, Mann RW.
Contact pressures in the human hip joint measured in vivo. Proc Natl Acad Sci
U S A 1986; 83: 2879-83
10. Davy DT, Kotzar GM, Brown RH, Heiple KG, Goldberg VM, Heiple KG, Jr.,
Berilla J, Burstein AH. Telemetric force measurements across the hip after
total arthroplasty. J Bone Joint Surg Am 1988; 70: 45-50
11. Kotzar GM, Davy DT, Goldberg VM, Heiple KG, Berilla J, Heiple KG, Jr.,
Brown RH, Burstein AH. Telemeterized in vivo hip joint force data: a report on
two patients after total hip surgery. J Orthop Res 1991; 9: 621-33

21
12. Taylor SJ, Perry JS, Meswania JM, Donaldson N, Walker PS, Cannon SR.
Telemetry of forces from proximal femoral replacements and relevance to
fixation. J Biomech 1997; 30: 225-34
13. Bergmann G, Graichen F, Rohlmann A. Hip joint contact forces during
stumbling. Langenbecks Arch Surg 2004; 389: 53-9
14. Bergmann G, Deuretzbacher G, Heller M, Graichen F, Rohlmann A, Strauss J,
Duda GN. Hip contact forces and gait patterns from routine activities. J
Biomech 2001; 34: 859-71
15. Bergmann G, Graichen F, Rohlmann A. Is staircase walking a risk for the
fixation of hip implants? J Biomech 1995; 28: 535-53
16. Bergmann G, Graichen F, Rohlmann A. Hip joint loading during walking and
running, measured in two patients. J Biomech 1993; 26: 969-90
17. CJRR. 2007 CJRR Report: Total Hip and Total Knee Replacements in
Canada: Canadian Institut for Healt Information, 2008
18. Heisel C, Silva M, Schmalzried TP. Bearing surface options for total hip
replacement in young patients. Instr Course Lect 2004; 53: 49-65
19. Schmalzried TP, Callaghan JJ. Wear in total hip and knee replacements. J
Bone Joint Surg Am 1999; 81: 115-36
20. Buechel FF, Drucker D, Jasty M, Jiranek W, Harris WH. Osteolysis around
uncemented acetabular components of cobalt-chrome surface replacement
hip arthroplasty. Clin Orthop Relat Res 1994: 202-11
21. Stewart TD, Tipper JL, Insley G, Streicher RM, Ingham E, Fisher J. Long-term
wear of ceramic matrix composite materials for hip prostheses under severe
swing phase microseparation. J Biomed Mater Res B Appl Biomater 2003; 66:
567-73
22. Santavirta S, Bohler M, Harris WH, Konttinen YT, Lappalainen R, Muratoglu
O, Rieker C, Salzer M. Alternative materials to improve total hip replacement
tribology. Acta Orthop Scand 2003; 74: 380-8
23. Chatterji U, Ashworth MJ, Lewis PL, Dobson PJ. Effect of total hip arthroplasty
on recreational and sporting activity. ANZ J Surg 2004; 74: 446-9
24. Huch K, Muller KA, Sturmer T, Brenner H, Puhl W, Gunther KP. Sports
activities 5 years after total knee or hip arthroplasty: the Ulm Osteoarthritis
Study. Ann Rheum Dis 2005; 64: 1715-20

22
25. Naal FD, Maffiuletti NA, Munzinger U, Hersche O. Sports after hip resurfacing
arthroplasty. Am J Sports Med 2007; 35: 705-11
26. Flugsrud GB, Nordsletten L, Espehaug B, Havelin LI, Meyer HE. The effect of
middle-age body weight and physical activity on the risk of early revision hip
arthroplasty: a cohort study of 1,535 individuals. Acta Orthop 2007; 78: 99-107
27. Graichen F, Arnold R, Rohlmann A, Bergmann G. Implantable 9-channel
telemetry system for in vivo load measurements with orthopedic implants.
IEEE Trans Biomed Eng 2007; 54: 253-61
28. Graichen F, Bergmann G. Four-channel telemetry system for in vivo
measurement of hip joint forces. J Biomed Eng 1991; 13: 370-4
29. Graichen F, Bergmann G, Rohlmann A. [Telemetric transmission system for in
vivo measurement of the stress load of an internal spinal fixator]. Biomed Tech
(Berl) 1994; 39: 251-8
30. Bergmann G, Rohlmann A, Graichen F. Instrumentation of a hip joint
prosthesis. Implantable telemetry in orthopaedics 1990: 35-60
31. Bergmann G, Siraky J, Rohlmann A, Koelbel R. Measurement of spatial forces
by the "Matrix"-Method. Proc. V/VI 9th World Congr. IMEKO 1982: 395-404
32. Bergmann G, Graichen F, Siraky J, Jendrzynski H, Rohlmann A. Multichannel
strain gauge telemetry for orthopaedic implants. J Biomech 1988; 21: 169-76
33. Bergmann G, Graichen F, Rohlmann A, Westerhoff P, Heinlein B, Bender A,
Ehrig R. Design and calibration of load sensing orthopaedic implants. J
Biomech Eng 2008; 130: 021009
34. Dowling JM, Atkinson JR, Dowson D, Charnley J. The characteristics of
acetabular cups worn in the human body. J Bone Joint Surg Br 1978; 60-B:
375-82
35. Catelas I, Campbell PA, Bobyn JD, Medley JB, Huk OL. Wear particles from
metal-on-metal total hip replacements: effects of implant design and
implantation time. Proc Inst Mech Eng [H] 2006; 220: 195-208
36. McKellop HA, D'Lima D. How have wear testing and joint simulator studies
helped to discriminate among materials and designs? J Am Acad Orthop Surg
2008; 16 Suppl 1: S111-9
37. Fialho JC, Fernandes PR, Eca L, Folgado J. Computational hip joint simulator
for wear and heat generation. J Biomech 2007; 40: 2358-66
23
38. Estok DM, 2nd, Burroughs BR, Muratoglu OK, Harris WH. Comparison of hip
simulator wear of 2 different highly cross-linked ultra high molecular weight
polyethylene acetabular components using both 32- and 38-mm femoral
heads. J Arthroplasty 2007; 22: 581-9
39. Affatato S, Spinelli M, Zavalloni M, Mazzega-Fabbro C, Viceconti M. Tribology
and total hip joint replacement: current concepts in mechanical simulation.
Med Eng Phys 2008; 30: 1305-17
40. Muller LP, Degreif J, Rudig L, Mehler D, Hely H, Rommens PM. Friction of
ceramic and metal hip hemi-endoprostheses against cadaveric acetabula.
Arch Orthop Trauma Surg 2004; 124: 681-7
41. Fruh HJ, Willmann G. Tribological investigations of the wear couple alumina-
CFRP for total hip replacement. Biomaterials 1998; 19: 1145-50
42. Bergmann G, Graichen F, Rohlmann A, Verdonschot N, van Lenthe GH.
Frictional heating of total hip implants. Part 2: finite element study. J Biomech
2001; 34: 429-35
43. Bergmann G, Graichen F, Rohlmann A, Verdonschot N, van Lenthe GH.
Frictional heating of total hip implants. Part 1: measurements in patients. J
Biomech 2001; 34: 421-8
44. Baleani M, Cristofolini L, Viceconti M. Endurance testing of hip prostheses: a
comparison between the load fixed in ISO 7206 standard and the
physiological loads. Clin Biomech (Bristol, Avon) 1999; 14: 339-45
45. Bergmann G. Realistic loads for testing hip implants. article in press 2009

24
Published in: PLoS ONE 7(8): e43489.
DOI:10.1371/journal.pone.0043489
5. High-tech hip implant for wireless temperature measurements in
vivo
G. Bergmann, F. Graichen, J. Dymke, A. Rohlmann, G. N. Duda, P. Damm
Abstract
When walking long distances, hip prostheses heat up due to friction. The influence of
articulating materials and lubricating properties of synovia on the final temperatures,
as well as any potential biological consequences, are unknown. Such knowledge is
essential for optimizing implant materials, identifying patients who are possibly at risk
of implant loosening, and proving the concepts of current joint simulators. An
instrumented hip implant with telemetric data transfer was developed to measure the
implant temperatures in vivo. A clinical study with 100 patients is planned to measure
the implant temperatures for different combinations of head and cup materials during
walking. This study will answer the question of whether patients with synovia with
poor lubricating properties may be at risk for thermally induced bone necrosis and
subsequent implant failure. The study will also deliver the different friction properties
of various implant materials and prove the significance of wear simulator tests.
A clinically successful titanium hip endoprosthesis was modified to house the
electronics inside its hollow neck. The electronics are powered by an external
induction coil fixed around the joint. A temperature sensor inside the implant triggers
a timer circuit, which produces an inductive pulse train with temperature-dependent
intervals. This signal is detected by a giant magnetoresistive sensor fixed near the
external energy coil. The implant temperature is measured with an accuracy of 0.1°C
in a range between 20°C and 58°C and at a sampling rate of 2 - 10 Hz. This rate
could be considerably increased for measuring other data, such as implant strain or
vibration. The employed technique of transmitting data from inside of a closed
titanium implant by low frequency magnetic pulses eliminates the need to use an
electrical feedthrough and an antenna outside of the implant. It enables the design of
mechanically safe and simple instrumented implants.

25
Introduction
Friction of implant materials
High friction in joint implants and subsequent temperature rise during continuous
activities, such as walking, may cause increased polyethylene wear, decreased
polyethylene strength, or loosening of the cup in hip implants due to high frictional
torque [1]. The natural cartilage has a coefficient of friction of 0.02 to 0.04 [2].
Articulating materials used for total joint replacement have higher friction. Coefficients
reported in the literature are as follows: 0.04 to 0.05 for the combination Al2O3 -
Al2O3, 0.05 to 0.055 for Al2O3 - UHMWPE, 0.06 to 0.07 for CoCrMo - UHMWPE, and
0.10 to 0.20 for CoCrMo - CoCrMo [3,4,5]. Moreover, a strong influence of the protein
concentration in the synovia on friction was reported [5], especially for CoCrMo -
CoCrMo.
Synovia properties
After joint replacement, a pseudo-synovial membrane is formed, which produces
hyaluronic acid (HA), similar to the natural membrane. The synovia volume is small.
In the hip joint, volumes of 2.7 ml in asymptomatic hips and 6.1 ml in fractured hips
were reported [6].
The properties of synovia vary considerably, and synovia can lose its lubricating
properties at high temperatures [7]. Synovia viscosity in natural joints depends on the
type of joint disease [8]. Differences of at least a factor of 10 were determined
between subjects and between healthy and osteoarthritic joints [9]. The most decisive
factor for lubrication is the protein content in the synovia [10]. The lubrication ability of
synovia from degenerative knee joints was worse than that of bovine serum [11],
which may indicate that joint simulators do not actually mimic the real situation in hip
or knee implants if a ‘standardized’ bovine serum is used [12,13], especially if the
temperature is kept constant at 37°C.
The cited literature indicates that individually varying synovia properties may strongly
influence wear and temperature increases in replaced hip and knee joints during
long-lasting activities, such as walking.

26
Temperature in hip and knee joints
In vitro temperature measurements on two intact human hip joints delivered a
temperature increase of 2.5 °C during simulated walking [14]. In vivo measurements
of temperatures in the natural knee joint showed a 1°C increase in temperature after
20 minutes and 2°C after 40 minutes of walking [15]. Depending on the implant type
and articulating materials, this increase was observed up to 7°C for a rotating hinge
implant (CoCrMo - UHMWPE). In an analytical study, validated by simulator data,
temperatures up to 51°C were found in CoCrMo - UHMWPE hip implants [16].
With instrumented implants, the forces and temperatures in Al2O3 - UHMWPE hip
joints were measured in 5 subjects during 45 to 60 minutes of walking and bicycling
[17]. After walking, the temperature rose up to 43.1°C in the patient with the lowest
body weight. Another patient with a much higher body weight reached a joint
temperature of only 40.0°C. In the only patient with bi-lateral implants, the
temperature was 0.9°C lower with an Al2O3 cup than with a UHMWPE cup. After
cycling, which caused 55% lower joint forces than walking, the temperatures were
1.5°C lower. We assume that the steady-state temperature after walking is closely
correlated to the friction coefficient.
In a simulator, the surface temperature directly between a UHMWPE cup and an
Al2O3 head was 45°C, but was 60°C with a CoCrMo head and 99°C with a zirconia
ceramic [18]. These are temperatures at which synovia precipitates and loses its
lubricating properties.
Bone necrosis
After heating rabbit thighs up to 42.5°C to 44.0°C using microwaves, strongly
increased bone formation was observed [19]. After 4 minutes at 50°C, osteocytes
were found to be irreversibly damaged [20]. Approximately 15 - 20% of the
osteoblasts became necrotic after being exposed to 48°C for 10 minutes, while they
withstood 45°C without damage [21]. After heating the superficial skull of rats to 48°C
for 15 minutes, dead osteocyte areas were found, and the formation of new bone
was delayed [22]. From the available literature on bone reactions to increases in
temperature during drilling and sawing, it was concluded that 47°C is a critical
temperature [23]. All of these studies investigated only the effect of non-recurrent
27
high temperatures. Repeatedly acting heat may even cause cell damage at lower
temperatures.
Concepts of instrumented implants
Electronic components used for measurements with permanent implants, such as
joint replacements, must be hermetically encapsulated. The optimal solution would
be a complete enclosure by a metal [24] or ceramic [25] material. If an antenna or
induction coil is placed outside the implant, only biocompatible materials are
permitted [26,27]. Certified pacemaker feedthroughs are then favorably used for
connections to the implant electronics. Our force measuring hip implants employed
an internal power coil and an external niobium antenna [28,29,30,31]. Solutions using
plastic-encapsulation for non-biocompatible electronic components [32,33,34] should
only be used for non-permanent implants.
Power and signals could respectively be transferred to and from the implant by
electro-magnetic fields. These fields are partly absorbed by a metal implant with the
loss dependent on the alloy and frequency. Pure Ti, Al and V are paramagnetic with
a relative magnetic permeability slightly greater than one. Implants made from such
alloys only moderately weaken magnetic fields of low frequencies. However,
ferromagnetic materials, such as Co or Ni, with a relative magnetic permeability of 80
to 600 almost completely shield the interior of an implant.
The loss caused by encapsulations made from Ti alloys is strongly frequency-
dependent. A closed TiAl6V4 housing with a 2-mm wall thickness shields 23% of a
magnetic field at 4 kHz but 53% at 10 kHz [30]. Any energy loss is accompanied by a
temperature increase of the implant. Both the power consumption and the shielding
loss must therefore be kept low. A titanium implant with an internal secondary power
coil and transmitting antenna should use frequencies below 10 kHz for power as well
as signal transfer. All transponder systems work at higher frequencies up to the GHz
range and can therefore not be used inside a metallic implant. Locating transponder
systems at the surface of a metallic implant [35] may cause problems for signal and
energy transfer.

28
Goals of this work
The reported strong differences of friction coefficients, the individual variations of
synovia properties, and the question of how well joint simulators mimic the in vivo
loading conditions demonstrate the need to obtain in vivo information on the friction-
induced temperature rise in joint implants.
The aim of the study was to design a temperature measuring hip implant with
telemetric data transfer, which is completely safe for patients and can be used in a
clinical study with a large number of patients. Furthermore, the technique described
should be applicable for the instrumentation of other kinds of implants.
The following features were included: inductive power supply, inductive data transfer
through the wall of the hermetically closed metallic implant, power consumption
below 10 mW, measuring accuracy of 0.2°C, design based on a clinically well-proven
implant type, and no requirement to change the surgical procedure.
Methods
Mechanical design
The non-cemented CTW™ Classic hip implant with a 12/14-mm cone (Merete
Medical, Berlin, Germany) was used for instrumentation. It closely resembles
implants of other manufacturers with very good clinical results [36]. The implant
shape was only slightly modified between the neck and shaft to further increase its
stability (Figure 1). A 6.2-mm-wide by 50-mm-long bore in the neck houses the
temperature telemetry. At its top, a 5-mm-thick plate was welded using an electron
beam (ENG Produktions-GmbH, Berlin, Germany) with a weld depth of 2.5 mm. The
low required welding energy and the clamping of a massive copper block around the
welding area facilitated temperature retention at the outside of the implant neck, at
half of its length, below 80°C. The weld quality was checked for each produced batch
by cutting samples, and the density of the welds was determined in a vacuum
chamber. Fatigue strength of the implant stem and neck were tested according to
[37, 38, 39] but with double the force levels in the neck test.

29
Figure 1: Cross-section of a model of the modified hip implant with a metal head;
The temperature telemetry with thermistor, electronic circuit and power/data coil are
placed inside the neck of the implant.
Telemetry
The telemetry (Figure 2) is powered inductively at 4 kHz, as in our previous implants
[29]. The internal coil L consists of 2700 loops on a core of PERMENORM 5000 H2
(µr > 12000, Vacuumschmelze). The induced voltage UL is limited to 12.3 V by the
Zener diode ZD, rectified by D3 and regulated to 5 V DC (Max 8881, Maxim).
A NTC thermistor (Epcos) serves as a temperature sensor. The ceramic capacitor Ct
(Kemet) with COG/NPO parameters has a high Q, low K, a temperature-
compensated dielectric, and stable electrical properties at varying voltage,
temperature, frequency and time. Together NTC and Ct set a time constant tT, which
triggers a timer (ICM 7242, Intersil). This timer produces the output signal S, a pulse
train with temperature-dependent pulse intervals. The sampling rate is approximately
10 Hz at 60°C, 5 Hz at 37°C, and 2.1 Hz at 20°C.
Coil L is used not only for power transfer but also for signal transmission by
superimposed magnetic pulses. The tantalum chip capacitor C is charged by L and
the Schottky diodes D1, D2 to a maximum of UC = 11.7 V DC. The electrical pulses

30
of signal S close the digital FET switches S1 and S2 (FDC 6303N, Fairchild
Semiconductor). C is then discharged over L resulting in magnetic pulses. After each
pulse, both FET open and C is charged again. The transmitted pulses have a
duration of 3 ms, and this telemetry circuit has a power consumption of 7 mW.
Figure 2: Principle of the temperature telemetry; Energy and temperature data are
transferred through the titanium implant by induction.
All active and passive components are surface mount devices on both sides of an 18
x 5 mm wide substrate (Figure 1). The NTC is positioned near the center of the
prosthetic head. To shield the electronic components against the magnetic field, a
tube of PERMENORM 5000 H2 with a wall thickness of 0.25 mm is slipped over the
whole circuit and fixed with epoxy structural adhesive DP190 (3M Scotch-Weld). The
telemetry (40 mm long, 6.1 mm Ø) is fixed inside the prosthetic neck with DP190.
External measuring system
The specially developed unit ‘TELETEMP’ contains a power oscillator, amplifier and
microcontroller (AVR-ATmega128, Atmel) with a USB interface and display. Because
the transmitted magnetic pulses are low in power, a very sensitive sensor had to be
chosen. This giant magnetoresistive (GMR) field sensor (AA002-02, NVE-
Corporation) consists of a Wheatstone bridge and has an on-chip flux concentrator to
increase its sensitivity along a specified axis.

31
Because the external powering field is much stronger than the field produced by the
signal pulses, care must be taken that the GMR sensor measures as little as possible
of the 4-kHz powering field. The spatial positions of GMR sensor and external
induction coil (n = 210, D = 25 cm, L = 7.85 mH, C = 0.22 µF) are therefore fixed by a
common, massive plastic housing (Figure 3). Within 5 cm from this housing the coil
windings are furthermore inflexible. The sensor position is finally optimized by
precisely adjusting the sensor board inside the housing.
The sensor signal is first high-pass-filtered (fc = 109 Hz, first-order) to remove the 50-
Hz content. After a first amplification (AD8230, Analog Devices) a low-pass filter (1
kHz, 10th order, LTC1569-6, Linear Technology Corp.) eliminates the remaining
influence of the 4-kHz powering field. The gain of a second amplifier (AD8042,
Analog Devices) can be set by a digital potentiometer (AD5282, Analog Devices).
The pulses are converted to 12-bit digital values (MAX197, Maxim Integrated
Products). The microcontroller checks the received signals S for missing pulses,
amplifies their peak values to 3 ± 1 V, counts their temperature-dependent time
intervals tT and sends S and tT to a Windows PC.
Power supply
During the measurements the power coil is placed around the hip joint (Figure 3).
The power oscillator generates a sinusoidal output voltage at 4 ± 0.5 kHz. This
frequency is permanently adapted to the resonance frequency of the coil. The
oscillator output voltage and, thus, the magnetic field strength are controlled by the
microcontroller. Primary and secondary power coils are fixed to the thigh and the
femur, respectively. Except from soft tissue deformations they therefore move in the
same way during walking and the induced supply voltage varies by not more than
5%. Using an induction frequency of 4 kHz with loose air-coupled coils a shift of the
titanium implant is not detectable by the primary power coil.

32
Figure 3: External equipment; The power coil with GMR sensor are fixed near the
patient’s hip and connected to the external device TELETEMP.
The voltage UC and, thus, the strength of the transmitted signal pulse directly depend
on the magnetic field strength. For UC below 5 V, the circuit is unstable, and the
pulses cease. Levels above 11.7 V are prevented using Zener diodes. The range of
the internal voltage UC is controlled by analyzing the amplitude of the received
pulses. Beginning with a high amplification, the magnetic field strength is reduced
until the pulse height begins to decrease; UC is then at its upper limit of 11.7 V. When
the pulses vanish, UC has reached its lower limit of 5 V. Based on these two values,
UC is set to 7.5 V. The operating range of 6 V to 9 V is a compromise between
sufficient signal strength and the minimal power dissipation. This range allows
position changes between the signal source inside the implant and the power coil
around the leg without endangering the power supply. If UC nevertheless exceeds
one of its borders, UC is automatically re-adjusted.

33
Data processing
The evaluation program is written in Visual Basic (Figure 4). Signal S is displayed,
and its peak values are marked as well as the times used for counting tT. The
temperature is calculated from previously obtained calibration data and charted for
visual control.
Figure 4: Measuring program; Screen shot from test measurements.Left: pulse
signal from implant. Marked peak values and time points for counting temperature
dependent pulse intervals. Right: sudden temperature increase in a water bath.
34
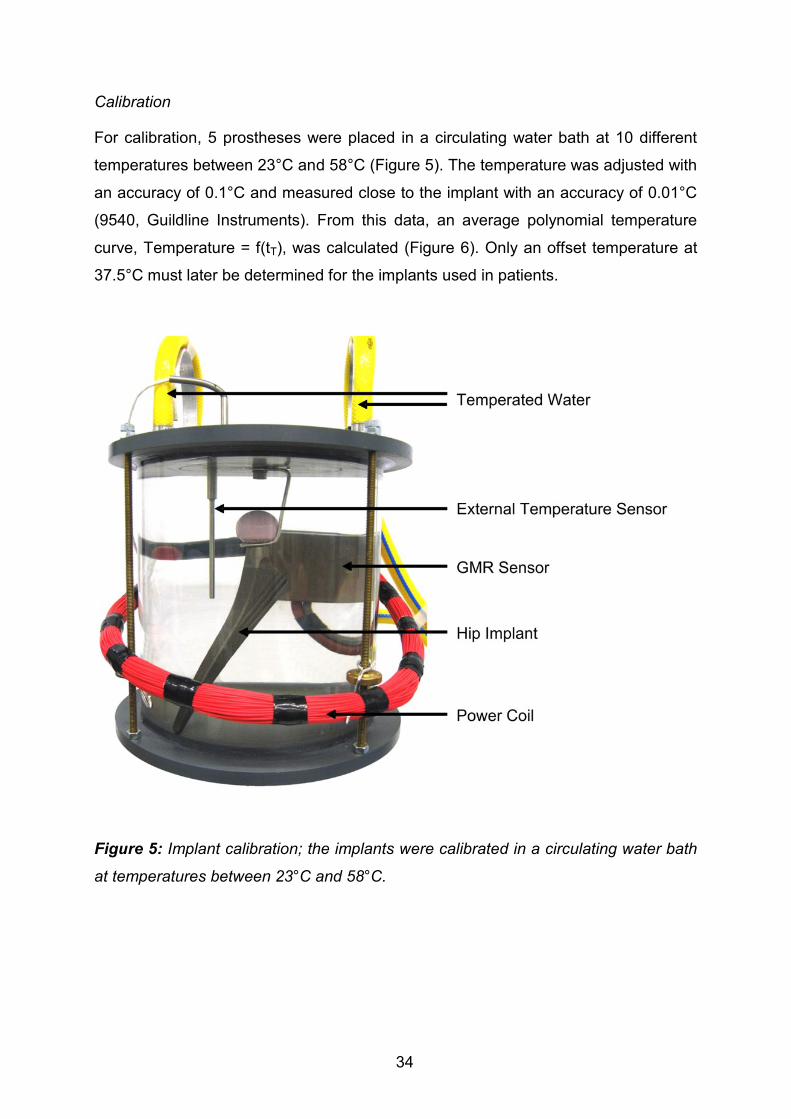
Calibration
For calibration, 5 prostheses were placed in a circulating water bath at 10 different
temperatures between 23°C and 58°C (Figure 5). The temperature was adjusted with
an accuracy of 0.1°C and measured close to the implant with an accuracy of 0.01°C
(9540, Guildline Instruments). From this data, an average polynomial temperature
curve, Temperature = f(tT), was calculated (Figure 6). Only an offset temperature at
37.5°C must later be determined for the implants used in patients.
Figure 5: Implant calibration; the implants were calibrated in a circulating water bath
at temperatures between 23°C and 58°C.

35
Figure 6: Standard temperature curve; The temperature-dependent signals of 5
implants are plotted.
Results
Implant safety
Only prostheses with neck lengths XS (extra-small), S (small), M (medium) and L
(large) will be implanted. For fatigue tests, a longer neck length of XL (extra-large)
was used. Under this more severe condition, the implant stem passed the fatigue
tests [37]. Then, the neck was tested with a maximum load of 5.3 kN during 10 million
cycles [38]. This load was further increased every 1 million cycles in steps of 1 kN,
without failure, up to 13 kN. This load was more than 2 times higher than the
standard force for testing implant necks. The mechanical tests were performed by
EndoLab GmbH (Rosenheim, Germany), and the sterilization process was certified
by Vanguard AG (Berlin, Germany).
The telemetry system described was approved by BerlinCERT (Berlin, Germany)
using standards of both EU Directive 90/385/EWG (AIMDD, Active Implantable
Medical Device Directive) and EU Directive 93/42/EWG (MDD, Medical Device
Directive).

36
A planned clinical study with 100 patients will begin after receiving approval from our
Ethics Committee.
Measuring accuracy
The measuring accuracies were determined at 37.5°C, 43°C, and 50°C. The
measured temperatures were compared with readings from a thermometer with an
accuracy of 0.01°C. The error of the calibrated implants was always below 0.1°C.
To determine how fast the instrumented implants are able to detect temperature
changes, a prototype was placed in cold circulating water. Then, boiling water was
quickly added such that the temperature rose from 23°C to approximately 51°C. This
temperature increase was recorded by the implant within 70 s (Figure 4).
Discussion
The clinical study on temperature rise in hip implants is planned with 100 patients.
The shape of the original implant was unchanged by the instrumentation, and thus,
current surgical procedures can be used. Therefore, the same good clinical success,
such as with other Spotorno-like implants, can be expected.
Investigations will be performed with 4 different combinations of head and cup
materials and 2 different head sizes. This data will allow us to answer the following
questions: a) Are certain material combinations producing such high temperatures
that implant fixation of patients with badly lubricating synovia is endangered? b) How
much do the lubrication properties of synovia differ individually? c) Can patients at
risk be identified by intra-operative synovia tests? d) Do joint simulators deliver
realistic results for friction and wear?
Our previous instrumented joint implants (www.OrthoLoad.com), with multi-channel
telemetries for load measurements, required higher sampling rates and a signal
transmission by radiofrequency. Because such signals are shielded by the metallic
implant, electrical feedthroughs and an antenna outside of the implant were needed,
which had to be biocompatible and protected mechanically. The low frequency
magnetic pulses, now used for data transfer, are only marginally weakened by
titanium implants and can therefore be transmitted through the metallic wall. This
enables the design of mechanically safe and simple instrumented orthopedic

37
implants. In addition, the described technique is also well suited for measuring strains
or detecting implant loosening by frequency analyses.
The low power consumption of 7 mW prevents a temperature increase by the
inductive power supply. The transmission rate of 5 Hz is sufficiently high for
measuring temperatures, and the measuring error of 0.1°C is lower than expected.
The transmission rate can be increased, for example, up to 50 Hz, with good
accuracy. For measuring fast changing signals this rate may still be too low.
Sampling can be accelerated, however, if the signals are not transmitted in real-time.
Instead, they can be measured at a high rate, stored temporarily in the memory of a
microcontroller and transmitted at a lower rate directly after the measurement.
Transmitting signals at a rate that is ten times lower would allow sampling of 1 signal
of at least 500 Hz or of several signals at a lower rate.
As described, the GMR sensor has to be adjusted carefully, and its signal is filtered
not to measure the 4-kHz powering field but to measure only the magnetic pulses
produced by the implant. Currently the signal-receiving circuit is changed such that
the signal will only be received at time points when the powering field is close to the
zero crossing, which will ensure that the quality of the signals is significantly less
dependent on the exact adjustment of the power coil and the GMR sensor.

38
References
1. Streicher RM, Semlitsch M, Schon R, Weber H, Rieker C (1996) Metal-on-metal
articulation for artificial hip joints: laboratory study and clinical results. Proc Inst
Mech Eng H 210: 223-232.
2. Drewniak EI, Jay GD, Fleming BC, Crisco JJ (2009) Comparison of two methods
for calculating the frictional properties of articular cartilage using a simple
pendulum and intact mouse knee joints. J Biomech 42: 1996-1999.
3. Bergmann G, Graichen F, Rohlmann A, Verdonschot N, van Lenthe GH (2001)
Frictional heating of total hip implants. Part 1: measurements in patients. J
Biomech 34: 421-428.
4. Fialho JC, Fernandes PR, Eca L, Folgado J (2007) Computational hip joint
simulator for wear and heat generation. J Biomech 40: 2358-2366.
5. Brockett C, Williams S, Jin Z, Isaac G, Fisher J (2007) Friction of total hip
replacements with different bearings and loading conditions. J Biomed Mater
Res B Appl Biomater 81: 508-515.
6. Moss SG, Schweitzer ME, Jacobson JA, Brossmann J, Lombardi JV, et al. (1998)
Hip joint fluid: detection and distribution at MR imaging and US with cadaveric
correlation. Radiology 208: 43-48.
7. Liao YS, Benya PD, McKellop HA (1999) Effect of protein lubrication on the wear
properties of materials for prosthetic joints. J Biomed Mater Res 48: 465-473.
8. Rainer F, Ribitsch V, Ulreich A (1980) Viscosity of synovial fluid and possible
artificial lubricants (author's transl). Acta Med Austriaca 7: 92-95.
9. Fam H, Bryant JT, Kontopoulou M (2007) Rheological properties of synovial fluids.
Biorheology 44: 59-74.
10. Chikama H (1985) [The role of protein and hyaluronic acid in the synovial fluid in
animal joint lubrication]. Nippon Seikeigeka Gakkai Zasshi 59: 559-572.
11. Swann DA, Bloch KJ, Swindell D, Shore E (1984) The lubricating activity of
human synovial fluids. Arthritis Rheum 27: 552-556.
12. Williams S, Leslie I, Isaac G, Jin Z, Ingham E, et al. (2008) Tribology and wear of
metal-on-metal hip prostheses: influence of cup angle and head position. J
Bone Joint Surg Am 90 Suppl 3: 111-117.
13. Smith SL, Unsworth A (2001) A five-station hip joint simulator. Proc Inst Mech
Eng H 215: 61-64.
39
14. Tepic S, Macirowski T, Mann RW (1985) Experimental temperature rise in human
hip joint in vitro in simulated walking. Journal of Orthopaedic Research 3: 516-
520.
15. Pritchett JW (2006) Heat generated by knee prostheses. Clin Orthop Relat Res
442: 195-198.
16. Rocchi M, Affatato S, Falasca G, Viceconti M (2007) Thermomechanical analysis
of ultra-high molecular weight polyethylene-metal hip prostheses. Proc Inst
Mech Eng H 221: 561-568.
17. Bergmann G, Graichen F, Rohlmann A, Verdonschot N, van Lenthe GH (2001)
Frictional heating of total hip implants. Part 2: finite element study. J Biomech
34: 429-435.
18. Lu Z, McKellop H (1997) Frictional heating of bearing materials tested in a hip
joint wear simulator. Proc Inst Mech Eng H 211: 101-108.
19. Leon SA, Asbell SO, Arastu HH, Edelstein G, Packel AJ, et al. (1993) Effects of
hyperthermia on bone. II. Heating of bone in vivo and stimulation of bone
growth. Int J Hyperthermia 9: 77-87.
20. Moritz AR, Henriques FC (1947) Studies of Thermal Injury: II. The Relative
Importance of Time and Surface Temperature in the Causation of Cutaneous
Burns. Am J Pathol 23: 695-720.
21. Li S, Chien S, Branemark PI (1999) Heat shock-induced necrosis and apoptosis
in osteoblasts. J Orthop Res 17: 891-899.
22. Yoshida K, Uoshima K, Oda K, Maeda T (2009) Influence of heat stress to matrix
on bone formation. Clin Oral Implants Res 20: 782-790.
23. Gronkiewicz K, Majewski P, Wisniewska G, Pihut M, Loster BW, et al. (2009)
Experimental research on the possibilities of maintaining thermal conditions
within the limits of the physiological conditions during intraoral preparation of
dental implants. J Physiol Pharmacol 60 Suppl 8: 123-127.
24. Schneider E, Michel MC, Genge M, Zuber K, Ganz R, et al. (2001) Loads acting
in an intramedullary nail during fracture healing in the human femur. J
Biomech 34: 849-857.
25. Holland HJ, Grätz H, Braunschweig M, Kuntz M (2012) INHUEPRO:
sensorsystem for use in implants. Proc MikroSytemTechnik Kongress 2011
Darmstadt, VDE-Verlag: 437-440.

40
26. Taylor SJ, Perry JS, Meswania JM, Donaldson N, Walker PS, et al. (1997)
Telemetry of forces from proximal femoral replacements and relevance to
fixation. J Biomech 30: 225-234.
27. Puers R, Catrysse M, Vandevoorde G, Collier RJ, Louridas E, et al. (2000) A
telemetry system for the detection of hip prosthesis loosening by vibration
analysis. Sensors and Actuators A 85: 42-47.
28. Bergmann G, Graichen F, Siraky J, Jendrzynski H, Rohlmann A (1988)
Multichannel strain gauge telemetry for orthopaedic implants. J Biomech 21:
169-176.
29. Graichen F, Arnold R, Rohlmann A, Bergmann G (2007) Implantable 9-channel
telemetry system for in vivo load measurements with orthopedic implants.
IEEE Trans Biomed Eng 54: 253-261.
30. Graichen F, Bergmann G (1991) Four-channel telemetry system for in vivo
measurement of hip joint forces. J Biomed Eng 13: 370-374.
31. Graichen F, Bergmann G, Rohlmann A (1999) Hip endoprosthesis for in vivo
measurement of joint force and temperature. J Biomech 32: 1113-1117.
32. Moss C, Weinrich N, Sass W, Mueller J (2010) Integration of a telemetric system
within an intramedullary nail for monitoring of the fracture healing progress.
Proc 3rd Int Symp on Applied Sciences in Biomedical and Communication
Technologies: 1-5
33. Marschner U, Grätz H, Jettkan B, Ruwisch D, Woldt G, et al. (2009) Integration of
a wireless lock-in measurement of hip prosthesis vibrations for loosening
detection. Sensors and Actuators A 156 145–154.
34. Moss Ch, Sass W, Weinrich N, Seide K, Müller J (2009) Low Frequency RFID –
Strain Measurement on Passive Implants. Proc SOMSED ‘09 1: 97-100.
35. Brown RH, Burstein AH, Frankel VH (1982) Telemetering in vivo loads from nail
plate implants. J Biomech 15: 815-823.
36. Karrholm J (2010) The Swedish Hip Arthroplasty Register (www.shpr.se). Acta
Orthop 81: 3-4.
37. ISO7206-4 (2010) Implants for surgery -- Partial and total hip joint prostheses --
Part 4: Determination of endurance properties and performance of stemmed
femoral components.

41
38. ISO7206-6 (1992) Implants for surgery -- Partial and total hip joint prostheses --
Part 6: Determination of endurance properties of head and neck region of
stemmed femoral components.
39. ISO7206-8 (1995) Implants for surgery -- Partial and total hip joint prostheses --
Part 8: Endurance performance of stemmed femoral components with
application of torsion.

42
Published in: PLoS ONE 8(11): e78373.
DOI:10.1371/journal.pone.0078373
6. Friction in total hip joint prosthesis measured in vivo during
walking
P. Damm, J. Dymke, R. Ackermann, A. Bender, F. Graichen, A. Halder, A. Beier, G.
Bergmann
Abstract
Friction-induced moments and subsequent cup loosening can be the reason for total
hip joint replacement failure. The aim of this study was to measure the in vivo contact
forces and friction moments during walking. Instrumented hip implants with Al2O3
ceramic head and an XPE inlay were used. In vivo measurements were taken 3
months post operatively in 8 subjects. The coefficient of friction was calculated in 3D
throughout the whole gait cycle, and average values of the friction-induced power
dissipation in the joint were determined.
On average, peak contact forces of 248% of the bodyweight and peak friction
moments of 0.26% bodyweight times meter were determined. However, contact
forces and friction moments varied greatly between individuals. The friction moment
increased during the extension phase of the joint. The average coefficient of friction
also increased during this period, from 0.04 (0.03 to 0.06) at contralateral toe off to
0.06 (0.04 to 0.08) at contralateral heel strike. During the flexion phase, the
coefficient of friction increased further to 0.14 (0.09 to 0.23) at toe off. The average
friction-induced power throughout the whole gait cycle was 2.3 W (1.4 W to 3.8 W).
Although more parameters than only the synovia determine the friction, the wide
ranges of friction coefficients and power dissipation indicate that the lubricating
properties of synovia are individually very different. However, such differences may
also exist in natural joints and may influence the progression of arthrosis.
Furthermore, subjects with very high power dissipation may be at risk of thermally
induced implant loosening. The large increase of the friction coefficient during each
step could be caused by the synovia being squeezed out under load.

43
Introduction
In 20% to 40% of all cases [1], polyethylene wear and aseptic loosening are the most
frequent reasons for revisions of total hip joint replacements (THR). Both factors are
related to friction in the joint. Cup loosening has been reported to be the only cause
in 30% to 62% of revisions [2, 3]. Subjects, who obtained a THR are becoming
increasingly younger and are, therefore, more active and athletic [4, 5]. However,
higher activity levels produce more wear and more strenuous activities cause higher
friction moments. This will increase the risk of implant loosening [6,7]. These facts
indicate that reduction of friction between head and cup is critical for further
improvement of THR.
Several in vivo studies have been performed to investigate the loads acting in hip
implants during different activities [8, 9]. These studies have shown that the contact
force during normal walking falls in a range between 240 and 480% of the
bodyweight (BW). However, in vivo measurements of friction in hip endoprostheses
have not been reported previously.
One in vivo study indirectly assessed friction in the joint by measuring the implant
temperature during an hour of walking [10,11]. Its increase is mainly related to the
friction-induced power generated in the implant. A peak temperature of 43.1°C was
measured in 1 subject, a level at which bone tissue may already be impaired [12],
especially when this temperature occurs repeatedly. Therefore, it cannot be excluded
that friction and increased implant temperatures may be underestimated risk factors
for the long-term stability of THR.
To determine the friction in total hip joint prosthesis, in vitro simulator studies were
performed [13, 14]. To evaluate the friction between two sliding partners, the
coefficient of friction µ was used. For the tribological pairing Al2O3/UHMWPE µ
ranges depended on the lubricant [13], ranging from 0.044 (distilled water), to 0.054
(bovine serum), and 0.089 (saline). The coefficient increased dramatically up to
values of 0.14 when the conditions changed from lubricated to dry [15].
However, most of the simulator tests load the joint only in the flexion-extension plane
and use load patterns which may not be realistic [16]. Newer studies investigated
friction under more realistic conditions, simulating in vivo measured gait data [17].
Varying parameters for friction were investigated, for example, different material
combinations for implant head and cup [18], and various lubricant regimes [17, 19–
44
22]. These simulator studies were performed under very different test conditions,
such as deviating patterns of joint loading and movement or by using different
lubricants. Nevertheless, it was shown that friction in THR is mainly influenced by the
material of the sliding partners and the lubrication regime.
The aim of our study was to determine the in vivo contact forces in hip implants
during walking, plus the moments caused by friction, and derive the coefficient of
friction from these data. These data will help to understand the in vivo lubrication
conditions and allow validating, potentially improving the conditions applied in joint
simulators.
Methods
Ethic statement
The study was approved by the Charité Ethics committee (EA2/057/09) and
registered at the ‘German Clinical Trials Register’ (DRKS00000563). All patients
gave written informed consent prior to participating in this study.
Subjects and measurements
Eight subjects with instrumented hip joint prostheses (Table 1) participate in this
study. Measurements were taken 3 months postoperatively (pOP) during level
walking at a self-selected walking speed. Selected trials of each investigated subject
are also shown and can be downloaded at the public data base
www.OrthoLoad.com.

45
Table 1: Patients investigated
Measuring equipment
Joint forces and friction moments were measured in vivo with instrumented hip
implants. The prosthesis (CTW, Merete Medical, Berlin, Germany) has a titanium
stem, a 32 mm Al2O3 ceramic head (BIOLOX forte, CeramTec GmbH, Plochingen,
Germany) and an XPE inlay (Durasul, Zimmer GmbH, Winterthur, Switzerland). A
telemetry circuit, 6 strain gauges, and a secondary induction coil are placed in the
hollow neck, which is closed by welding. A detailed description of the instrumented
implant was published previously [23]. A coil around the hip joint inductively powers
the inner electronics. The strain gauge signals are transferred via an antenna in the
implant head to the external receiver. These signals and the subject’s movements
are recorded simultaneously on videotape. The external measurement system has
previously been described in detail [24, 25].
From the 6 strain gauge signals, the 3 force and 3 moment components acting on the
implant head are calculated [26] with an accuracy of 1-2%. The femur-based
Body Gait Mean Gliding Speed
Patient Age Gender weight Velocity Extension | Flexion
[years] [N] [m/s] [m/s]
H1 56 m 754 1.0 0.02 | 0.04
H2 62 m 755 1.0 0.03 | 0.05
H3 60 m 880 0.8 0.02 | 0.06
H4 50 m 783 1.0 0.03 | 0.06
H5 62 f 853 0.9 0.02 | 0.08
H6 69 m 832 1.1 0.03 | 0.05
H7 53 m 899 1.1 0.03 | 0.06
H8 56 m 779 1.1 0.03 | 0.06
Average 59 - 821 1.0 0.03 | 0.06
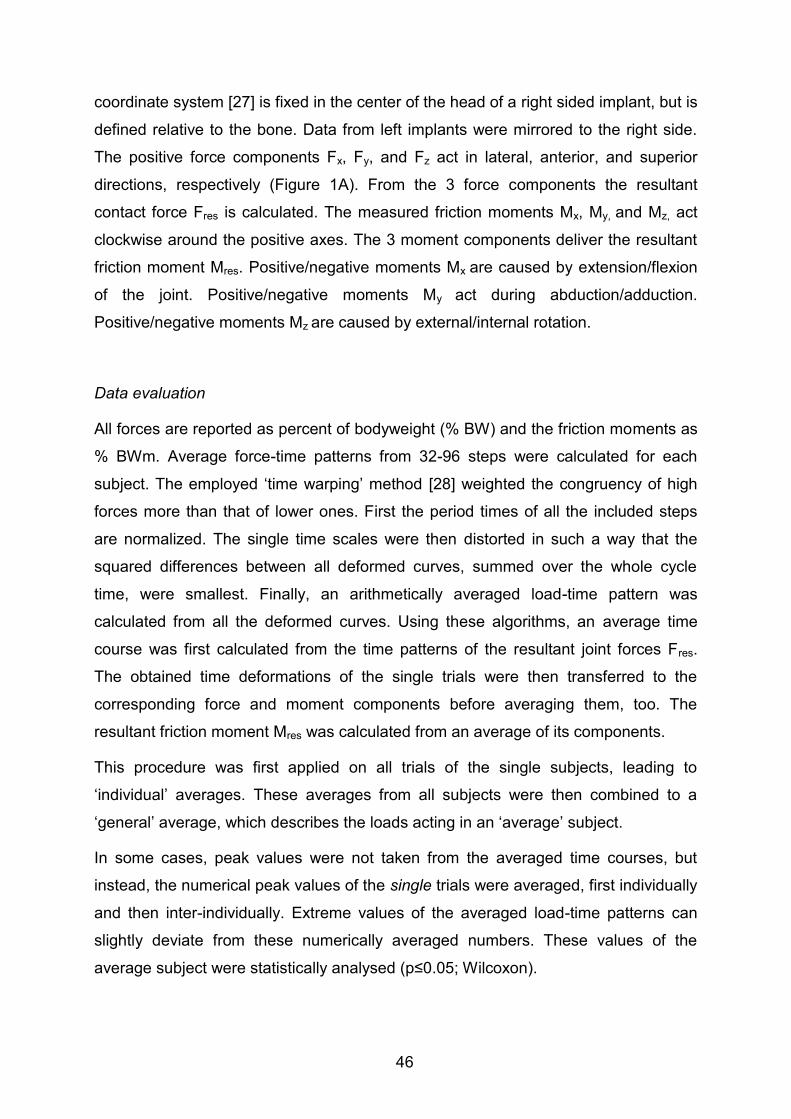
46
coordinate system [27] is fixed in the center of the head of a right sided implant, but is
defined relative to the bone. Data from left implants were mirrored to the right side.
The positive force components Fx, Fy, and Fz act in lateral, anterior, and superior
directions, respectively (Figure 1A). From the 3 force components the resultant
contact force Fres is calculated. The measured friction moments Mx, My, and Mz, act
clockwise around the positive axes. The 3 moment components deliver the resultant
friction moment Mres. Positive/negative moments Mx are caused by extension/flexion
of the joint. Positive/negative moments My act during abduction/adduction.
Positive/negative moments Mz are caused by external/internal rotation.
Data evaluation
All forces are reported as percent of bodyweight (% BW) and the friction moments as
% BWm. Average force-time patterns from 32-96 steps were calculated for each
subject. The employed ‘time warping’ method [28] weighted the congruency of high
forces more than that of lower ones. First the period times of all the included steps
are normalized. The single time scales were then distorted in such a way that the
squared differences between all deformed curves, summed over the whole cycle
time, were smallest. Finally, an arithmetically averaged load-time pattern was
calculated from all the deformed curves. Using these algorithms, an average time
course was first calculated from the time patterns of the resultant joint forces Fres.
The obtained time deformations of the single trials were then transferred to the
corresponding force and moment components before averaging them, too. The
resultant friction moment Mres was calculated from an average of its components.
This procedure was first applied on all trials of the single subjects, leading to
‘individual’ averages. These averages from all subjects were then combined to a
‘general’ average, which describes the loads acting in an ‘average’ subject.
In some cases, peak values were not taken from the averaged time courses, but
instead, the numerical peak values of the single trials were averaged, first individually
and then inter-individually. Extreme values of the averaged load-time patterns can
slightly deviate from these numerically averaged numbers. These values of the
average subject were statistically analysed (p≤0.05; Wilcoxon).

47
Coefficient of friction
The coefficient of friction µ between the head and the cup was calculated by a 3D
approach (Figure 1B). Joint movement takes place in a plane perpendicular to the
axis of the vector Mres. This axis is not perpendicular to the axis of vector Fres. The
vector of the friction force Ffriction acts perpendicular to Fres at point P on the head. H is
the vector of the lever arm between FFriction and the axis of Mres and is perpendicular
to both. D is a vector in direction of Mres. R = 16 mm is the radius vector to point P.
Figure 1: Coordinate system and vectors for calculation of the coefficient of friction µ;
Right joint, posterior view.
Assuming a Coulomb friction between the head and the cup, the friction force acting
on the head is
(1)
The moment determined by the force Ffriction and its lever arm H has to counteract
Mres. Because Ffriction and H are perpendicular to each other, this delivers the scalar
equation
(2)
From the combination of (1) and (2), the following equation can be derived:
(3)
friction resF µ*F
friction resH*F =M
res resµ M / (H*F )

48
R is the radius of the head. R points to P and has the direction opposite to Fres:
H can be substituted by
(5)
With D being the orthogonal projection of R on Mres:
(6)
The angle between R and Mres can be derived from their scalar product:
(7)
Applying (4), (6), (7), equation (5) becomes
(8)
The friction coefficient µ is determined from (3), using the measured load vectors Fres
and Mres, the known head radius R, and the lever arm H, which is calculated by (8).
Due to measuring errors, µ will be inaccurate if Fres or Mres is very small. Therefore, µ
was only determined for Fres ≥ 20% BW and Mres≥ 0.02% BWm.
In previous simulator tests, µ has mostly been determined in the sagittal plane. To
compare our 3D-derived values with this data, we additionally calculated µ from the
forces and moments measured in the sagittal, frontal, and horizontal planes as
follows:
(9a)
(9b)
(9c)
Fyz, Fxz and Fxy are the forces in the sagittal, frontal, and horizontal planes,
respectively.
Friction-induced power
In addition to the measured joint loads and the calculated friction coefficient µ, we
determined the friction-induced power Q in the joint, which is caused by the friction
resresR R *F / F
H R D
resres resD R * cos(R,M ) *M / M
resres rescos(R,M ) (R *M ) / (R *M )
2res resres resH R * (F / F ) * [(M / M ) 1]
x x yzµ M / (F *R)
y y xzµ M / (F *R)
z z xyµ M / (F *R)

49
force Ffriction. With v being the gliding speed between head and cup, Q is given by the
simplified equation
(10)
Average values of Q were calculated separately for the extension and flexion phases
of the gait cycle:
(11a)
(11b)
The average power Qaver over the whole gait cycle was then determined from
(11c)
Calculations were based on the intra-individually averaged load-time patterns of the
single subjects. Before Fext, µext, Fflex, and µflex were inserted in (11a, b), their time-
dependent values were averaged arithmetically over the corresponding time periods
Text and Tflex. The speed v was determined from the flexion/extension range of the
shank in the sagittal plane, the times of flexion and extension, and the radius of the
prosthetic head. The data of 4-7 steps per subject were averaged. Because no gait
analyses had been performed, the shank movement had to be determined from the
patient videos. The Intra-observer variation of v and therefore Q was on average 1%,
the inter-observer variability of four investigators was on average 2%.
friction resQ F * v F *µ* v
ext ext ext extQ F *µ * v
flex flex flex flexQ F *µ * v
aver ext ext flex flex ext flex)Q (Q * T Q * T ) / (T T

50
Results
Unless stated otherwise, the values reported here were taken from the time patterns
of the average subject. The notation “X|Y” indicates a value of X at the instant of the
first peak Fres1 of the resultant force and a value of Y at the second peak Fres2.
Joint contact forces
Figure 2A shows the time patterns of Fres and its components for the average subject
during one walking cycle. Fres was nearly identical with -Fz; the latter acts distally
along the z-axis of the femur and compresses the hip joint. Fres had 2 peak values
Fres1|Fres2. Fres1 acted at about the time of contralateral toe off (CTO) and Fres2 close
to contralateral heel strike (CHS).
Figure 3A contains individual numerical averages of the 8 subjects. For Fres1|Fres2
peak values of 248|233% BW at 31|57% of the gait cycle were determined. However,
these peak forces varied widely inter-individually. Fres1 ranged from 210% BW
(subject H3) to 301% BW (H8), and Fres2 from 218% BW (H3) to 287% BW (H8). In 6
subjects Fres1 was higher than Fres2, but in H2 and H3 Fres1 was lower than Fres2. The
peak forces during the repeated trials of the same subject had standard deviations in
the ranges of 7-14%BW (Fres1) and 5-14%BW (Fres2).

51
Figure 2: Time courses of contact force, friction moment, and coefficient of friction;
Top: contact force Fres and its components. Middle: friction moment Mres and its
components. Bottom: coefficients of friction.µ from 3D calculation; µx (sagittal plane),
µy (frontal plane), and µz (horizontal plane) from simplified 2D calculations. The data
presented are for an average subject during level walking at approximately 1 m/s.
Vertical lines: borders of the flexion phase. The diagram starts before heel strike.

52
Figure 3: Peak values of contact force, friction moment and coefficient of friction; A:
contact force Fres, B: friction moment Mres, C: coefficient of friction µ. Individual
numerical mean values and ranges from 8 subjects. Mres1|Mres2, µ1|µ2 = values at the
instant of the force maxima Fres1|Fres2 (see Figure 2). Mmax, µmax = absolute maxima
during a whole walking cycle.
Friction moments
Figure 2B shows the time courses of Mres and its components. Mres increased from
heel strike (HS) to CHS and reached values of Mres1|Mres2 = 0.16|0.21% BWm. The
maximum Mmax = 0.22% BWm acted slightly later than the force maximum Fres2. Mres
climbed to a second, smaller peak of 0.19% BWm, which acted 15% of the cycle time
after CHS, but before toe off of the ipsilateral leg (TO). During the intermediate
minimum between CHS and TO, the joint rotation changed from extension to flexion.
From HS to CHS, Mres was predominantly determined by component Mx, which acts
in the sagittal plane of movement. After that and until the end of the stance phase the
absolute values of My in the frontal plane exceeded those of Mx.
The patterns and magnitudes of Mx were relatively uniform for all 8 subjects (Figure
4A). On average the maximum of My had nearly the same magnitude as that of Mx
(Figure 4B). The individual maxima of My (second peak value in subject H7) acted at
very similar times. However, the variation of the individual maxima was much larger
compared to Mx. Especially during the first half of the stance phase the time courses
of My individually varied greatly. On average the peak value of the moment Mz was

53
about ¼ of that of Mx or My (Figure 4C). The individual time courses of Mz were
similar, but the magnitudes varied considerably.
Figure 3B shows the averages and ranges of the peak values of Mres at the times of
Fres1|Fres2. Mres1|Mres2 individually varied extremely with inter-trial standard deviations
of 0.01 to 0.03%BW for both peak moments Mres1 and Mres2. Mres1 ranged from 0.12%
BWm (H2) to 0.23% BWm (H1), while Mres2 lay between 0.15% BWm (H3) and
0.29% BWm (H7). In 7 subjects Mres increased between the times of Fres1 and Fres2
(Figure 4D), with peak values of Mmax between 0.2% BWm (H8) and 0.32% BWm
(H4); it decreased only in H3, but increased again after the time of Fres2. In 5 subjects
Mmax occurred with a time delay after Fres2 between 6% (H4) and 16% (H2) of the gait
cycle; in 1 patient Mmax occurred 2% before Fres2 (H7), and in 2 subjects, no time
delay was observed (H5 and H8). The individual inter-trial standard deviations of
Mmax lay between 0.01 and 0.03%BWm.
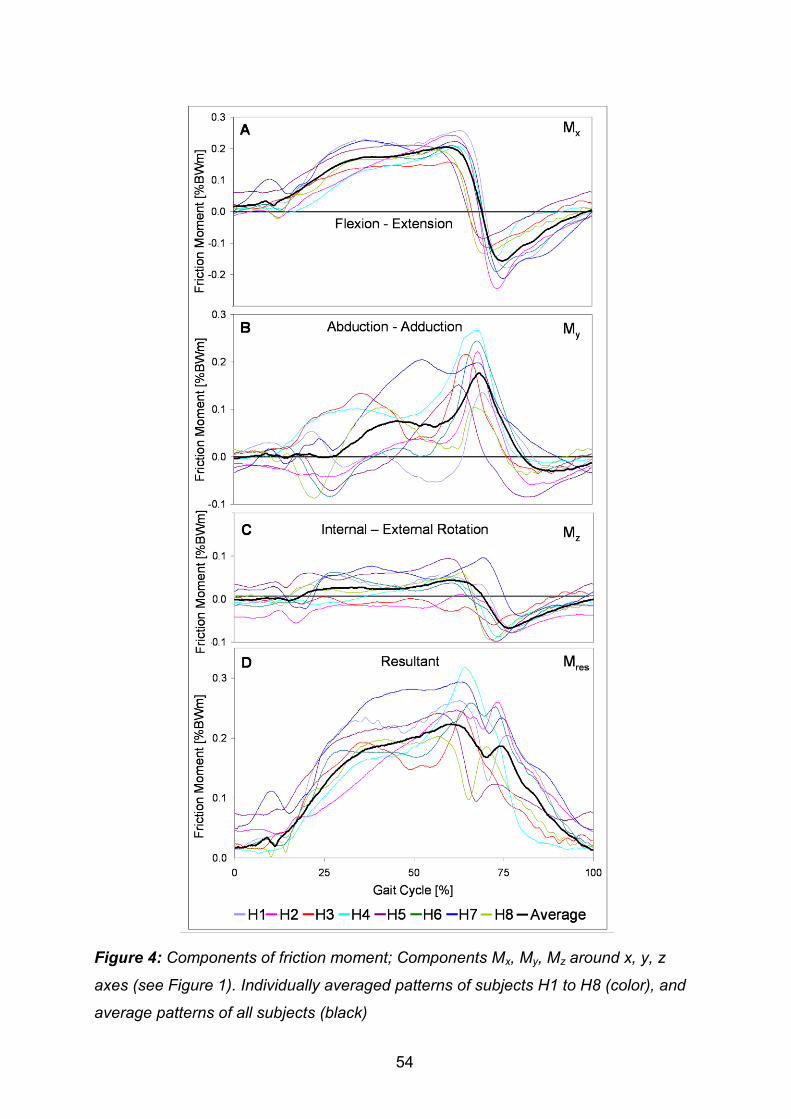
54
Figure 4: Components of friction moment; Components Mx, My, Mz around x, y, z
axes (see Figure 1). Individually averaged patterns of subjects H1 to H8 (color), and
average patterns of all subjects (black)

55
Friction coefficients
At HS µ was the lowest with an average value of µ = 0.02 (Figure 2C) and then
increased nearly linearly. The values at the times of Fres1|Fres2 were µ1|µ2 = 0.04|0.06.
After the instant when the joint rotation changed from extension to flexion, µ rose
dramatically and reached its maximum µmax = 0.14, shortly before TO.
The individual numerical values of µ at the instants of Fres1|Fres2 varied by a factor of 2
(Figure 3B); µ1 had values between 0.03 (lowest in H2, H4, H8) and 0.06 (highest in
H3); µ2 varied between 0.04 (H3, H8) and 0.08 (H7). The maxima µmax, which
occurred shortly before TO, varied more, with values between 0.09 (H8) and 0.23
(H2).
The average patterns of the coefficients µx, µy, µz, calculated by the two-dimensional
approaches, changed throughout the whole gait cycle (Figure 2C). µx in the main
plane of movement corresponded well to µ (3D) throughout most of the loading cycle.
However, shortly before and after joint rotation changed from extension to flexion, µx
fell to zero. During the flexion phase, especially at its end, µx also deviated from µ. A
temporary decline similar to µx was also observed for µz in the plane of femur
rotation, when joint movement changed from extension to flexion. At the same time
µy in the abduction-adduction plane reached a maximum.
Friction-induced power
With Qflex = 5.0 W, the highest friction-induced power was observed in subjects H5
and H7 during the flexion phase (Figure 5), although Fres and Mres were very small
(Figure 2A) during most of this period. In 7 of the 8 subjects, Qflex was higher than
Qext, which was mainly due to the higher values of µ and v during flexion (equation
11a, b). The individual differences between Qflex and Qext varied considerably (Figure
5). The greatest difference was calculated for H5, in which QFlex was 2.9 times higher
than Qext. The smallest difference was 4%, observed in H4. In H8, Qflex was 21%
lower than Qext. The inter-individual average power throughout the whole cycle was
Qaver = 2.3 W, with a range between 1.4 W (H1) and 3.8 W (H7). The average sliding
speed during flexion was 2.2 times higher than during extension (Table 1), with
individual values between 1.5 (H8) and 4.5 (H5).

56
Figure 5: Average friction-induced power Q during flexion and extension phases and
whole walking cycle; Qext = Q during extension phase; Qflex = Q during flexion phase;
Qaver = Q during whole step; Individual values of subjects H1 to H8 and averages
(right columns)
Discussion
This study reports for the first time on the assessment of in vivo friction in artificial hip
joints during walking. The in vivo measured friction moment, at 3 month post-
operative, increased during every gait cycle and as a consequence the coefficient of
friction.
Forces and friction moments
Different in vitro test conditions were applied by others when investigating friction in
hip joint prostheses. Several studies investigated friction by moving the joint in one
plane like a pendulum [18, 19, 29, 30], simulating flexion/extension, and neglected
movement around the other 2 axes. Our results show that these test conditions may
be much too simplified. In reality the abduction-adduction moment My rises to nearly
the same peak value (0.18% BWm) as the flexion-extension moment Mx (0.2%
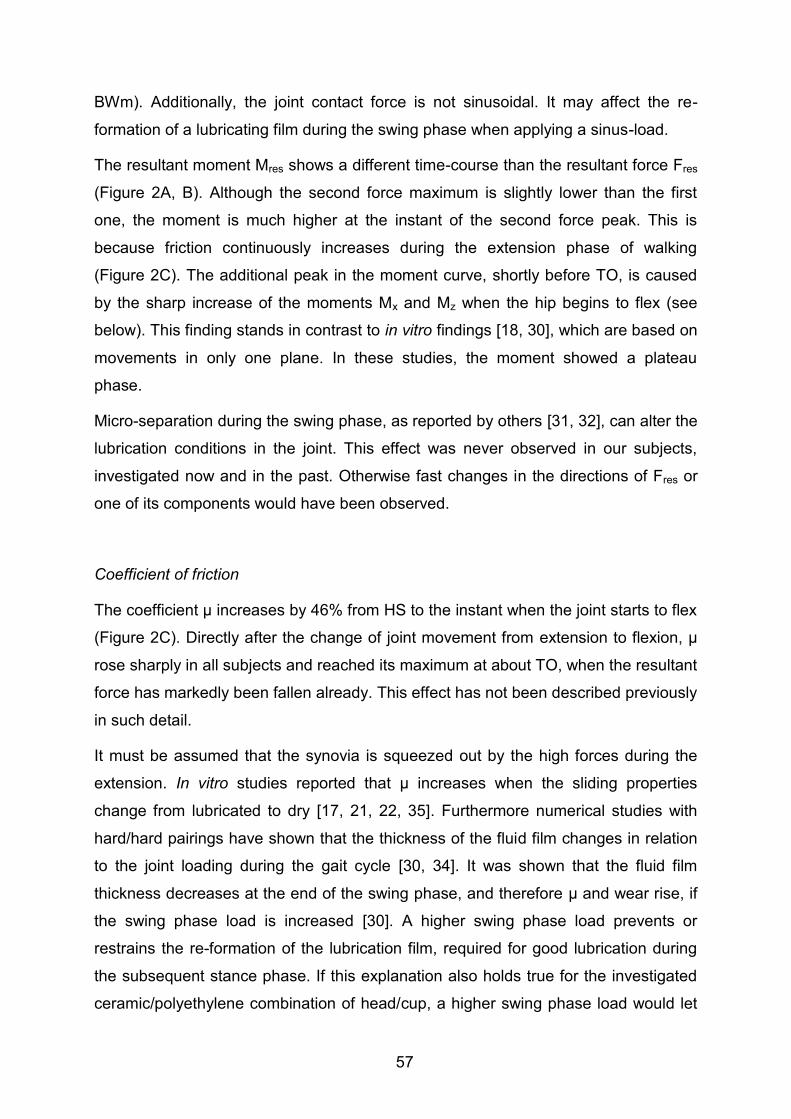
57
BWm). Additionally, the joint contact force is not sinusoidal. It may affect the re-
formation of a lubricating film during the swing phase when applying a sinus-load.
The resultant moment Mres shows a different time-course than the resultant force Fres
(Figure 2A, B). Although the second force maximum is slightly lower than the first
one, the moment is much higher at the instant of the second force peak. This is
because friction continuously increases during the extension phase of walking
(Figure 2C). The additional peak in the moment curve, shortly before TO, is caused
by the sharp increase of the moments Mx and Mz when the hip begins to flex (see
below). This finding stands in contrast to in vitro findings [18, 30], which are based on
movements in only one plane. In these studies, the moment showed a plateau
phase.
Micro-separation during the swing phase, as reported by others [31, 32], can alter the
lubrication conditions in the joint. This effect was never observed in our subjects,
investigated now and in the past. Otherwise fast changes in the directions of Fres or
one of its components would have been observed.
Coefficient of friction
The coefficient µ increases by 46% from HS to the instant when the joint starts to flex
(Figure 2C). Directly after the change of joint movement from extension to flexion, µ
rose sharply in all subjects and reached its maximum at about TO, when the resultant
force has markedly been fallen already. This effect has not been described previously
in such detail.
It must be assumed that the synovia is squeezed out by the high forces during the
extension. In vitro studies reported that µ increases when the sliding properties
change from lubricated to dry [17, 21, 22, 35]. Furthermore numerical studies with
hard/hard pairings have shown that the thickness of the fluid film changes in relation
to the joint loading during the gait cycle [30, 34]. It was shown that the fluid film
thickness decreases at the end of the swing phase, and therefore µ and wear rise, if
the swing phase load is increased [30]. A higher swing phase load prevents or
restrains the re-formation of the lubrication film, required for good lubrication during
the subsequent stance phase. If this explanation also holds true for the investigated
ceramic/polyethylene combination of head/cup, a higher swing phase load would let

58
µ decrease less sharply after TO and thus raise the level at which µ starts at the next
HS.
Moreover, the strong increase of µ when the joint starts to flex could possibly be
caused by a breakdown of the fluid film at the temporary stop of the relative joint
movement, similar to the in vitro observation during the first step after a rest [33].
Another factor influencing the time pattern of µ may be a changing size of the load
bearing area between head and cup, perpendicular to the resultant force vector. This
could be especially true if µ were dependent on the pressure magnitude. Both factors
could not be investigated in this study.
In contrast to previous in vitro studies, the in vivo coefficient of friction was now
determined for the 3D case. The obtained pattern of µ differs from the pattern of µx in
the main movement plane of the femur. Both coefficients are nearly identical from HS
to CHS and deviate by no more than 5%. However, during the flexion phase, the
difference between both coefficients increased up to 9% at TO.
Studies with a simple pendulum test determined values of µx between 0.04 and 0.09
for a lubricated regime [18,36,37]. This compares well with our finding of µ1=0.04 and
µ2=0.06 during the extension phase. However, µmax = 0.14 at the instant of toe off
was much higher in our study.
The peak values of Fres individually varied by 39%, but the peak values of µ differed
by 246% (Figure 3C). The variance of µ is most likely due to individually different
lubrication properties of the synovia fluid.
Friction-induced power
The friction-induced temperature rise in ceramic/PE implants has been measured in
vivo previously [10]. An estimated average friction-induced power of 0.79 W during
walking was reported, which is much less than the average of 2.3 W determined in
the current study. It may be that heat convection by the blood flow has been
underestimated in the previous study. Other reasons for this discrepancy may be
differences between the subjects investigated, and the small sizes of both cohorts.
This assumption is supported by another result of the cited study, namely that the
temperature increase, measured after 1 hour of walking, individually varied by a
factor of nearly 3 after the body weight of all subjects had been standardized. A

59
similarly large factor of 2.7 was observed for the friction-induced power Qaver, which
decreased to 2.3 after normalizing the body weight.
The large individual differences of Qaver are most likely caused by varying synovia
properties, as already indicated by the variations of µ. Additionally, different running-
in effects of the gliding partners may affect the friction-induced power. This running-in
effect and the expected decrease of µ and Qaver with increased postoperative time
will be investigated in a future study.
In conclusion it was shown: The friction moment in the hip joint mainly occurred in the
frontal and sagittal plane during walking. The resultant coefficient of friction increased
nearly linearly during extension and increased drastically in the beginning of flexion
with the maximum value approximately the ipsilateral toe off. This suggests that the
synovia is squeezed out of the intra-articular joint space. Furthermore, the peak
values of the coefficient of friction were always determined during the flexion phase.
This indicates that the lubrication regime certainly changed into a dry phase at every
step.
Limitations of the study
There are some limitations to this study: the number of investigated subjects was
small; they were younger than the majority of hip-replacement patients; and only one
implant type was investigated at only one speed of walking and one time after
implantation. However, the large individual variations of friction coefficient and
generated power, as well as the changes of the friction coefficient throughout the gait
cycle will probably not be much influenced qualitatively by age or materials. The
effects of walking speed and postoperative time is currently investigated an additional
study.
Acknowledgements
The authors gratefully acknowledge the voluntary collaboration of all subjects.

60
References
1. CJRR (2013) CJRR annual report: Hip and knee replacements in Canada.
Canadian Institute for Health Information.
2. Havelin LI, Fenstad AM, Salomonsson R, Mehnert F, Furnes O, et al. (2009)
The Nordic Arthroplasty Register Association: a unique collaboration between
3 national hip arthroplasty registries with 280,201 THRs. Acta orthopaedica 80:
393–401. doi:10.3109/17453670903039544.
3. AOA (2007) Australian Orthopaedic Association National Joint Replacement
Registry. Annual Report 2007.
4. Huch K, Müller KAC, Stürmer T, Brenner H, Puhl W, et al. (2005) Sports
activities 5 years after total knee or hip arthroplasty: the Ulm Osteoarthritis
Study. Annals of the Rheumatic Diseases 64: 1715–1720.
doi:10.1136/ard.2004.033266.
5. Chatterji U, Ashworth MJ, Lewis PL, Dobson PJ (2004) Effect of total hip
arthroplasty on recreational and sporting activity. ANZ journal of surgery 74:
446–449.
6. Flugsrud GB, Nordsletten L, Espehaug B, Havelin LI, Meyer HE (2007) The
effect of middle-age body weight and physical activity on the risk of early
revision hip arthroplasty. Acta Orthopaedica 78: 99–107.
doi:10.1080/17453670610013493.
7. Malchau H, Herberts P, Söderman P, Odén A (2000) Prognosis of Total Hip
Replacement. The swedish national hip arthroplasty registry.
8. Bergmann G, Deuretzbacher G, Heller M, Graichen F, Rohlmann A, et al.
(2001) Hip contact forces and gait patterns from routine activities. Journal of
biomechanics 34: 859–871.
9. Bergmann G, Graichen F, Rohlmann A (1993) Hip joint loading during walking
and running, measured in two patients. Journal of biomechanics 26: 969–990.
10. Bergmann G, Graichen F, Rohlmann A, Verdonschot N, Van Lenthe GH (2001)
Frictional heating of total hip implants. Part 2: finite element study. Journal of
biomechanics 34: 429–435.
11. Bergmann G, Graichen F, Rohlmann A, Verdonschot N, Van Lenthe GH (2001)
Frictional heating of total hip implants. Part 2: finite element study. Journal of
biomechanics 34: 429–435.

61
12. Li S, Chien S, Branemark P-I (1999) Heat shock-induced necrosis and
apoptosis in osteoblasts. Journal of orthopaedic research 17: 891–899.
doi:10.1002/jor.1100170614.
13. Hall RM, Unsworth A (1997) Review Friction in hip prostheses. Biomaterials 18:
1017–1026.
14. Mattei L, Di Puccio F, Piccigallo B, Ciulli E (2011) Lubrication and wear
modelling of artificial hip joints: A review. Tribology International 44: 532–549.
doi:10.1016/j.triboint.2010.06.010.
15. Xiong D, Ge S (2001) Friction and wear properties of UHMWPE/Al2O3 ceramic
under different lubricating conditions. 250: 242–245.
16. Bergmann G, Graichen F, Rohlmann A, Bender A, Heinlein B, et al. (2010)
Realistic loads for testing hip implants. Bio-medical materials and engineering
20: 65–75. doi:10.3233/BME-2010-0616.
17. Bishop NE, Hothan A, Morlock MM (2012) High Friction Moments in Large
Hard-on-Hard Hip Replacement Bearings in Conditions of Poor Lubrication.
Journal of Orthopaedic Research: 1–7. doi:10.1002/jor.22255.
18. Brockett C, Williams S, Jin Z, Isaac G, Fisher J (2006) Friction of Total Hip
Replacements With Different Bearings and Loading Conditions. Journal of
Biomedical Materials Research: 508–515. doi:10.1002/jbmb.
19. Scholes SC, Unsworth A, Goldsmith AAJ (2000) A frictional study of total hip
joint replacements. Physics in medicine and biology 45: 3721–3735.
20. Scholes SC, Unsworth A, Hall RM, Scott R (2000) The effects of material
combination and lubricant on the friction of total hip prostheses. Wear 241:
209–213. doi:10.1016/S0043-1648(00)00377-X.
21. Unsworth A (1978) The effects of lubrication in hip joint prostheses. Physics in
medicine and biology 23: 253–268.
22. Scholes SC, Unsworth A (2000) Comparison of friction and lubrication of
different hip prostheses. Proceedings of the Institution of Mechanical Engineers
Part H Journal of engineering in medicine 214: 49–57.
23. Damm P, Graichen F, Rohlmann, Bender A, Bergmann G (2010) Total hip joint
prosthesis for in vivo measurement of forces and moments. Medical
Engineering & Physics 32: 95–100.
24. Graichen F, Arnold R, Rohlmann, Bergmann G (2007) Implantable 9-channel
telemetry system for in vivo load measurements with orthopedic implants. IEEE

62
transactions on bio-medical engineering 54: 253–261.
doi:10.1109/TBME.2006.886857.
25. Graichen F, Bergmann G, Rohlmann (1994) Telemetric transmission system
for in vivo measurement of the stress load of an internal spinal fixator.
Biomedizinische Technik Biomedical engineering 39: 251–258.
26. Bergmann G, Graichen F, Rohlmann A, Westerhoff P, Heinlein B, et al. (2008)
Design and calibration of load sensing orthopaedic implants. Journal of
biomechanical engineering 130: 021009. doi:10.1115/1.2898831.
27. Wu G, Siegler S, Allard P, Kirtley C, Leardini A, et al. (2002) ISB
recommendation on definitions of joint coordinate system of various joints for
the reporting of human motion - part I: ankle, hip, and spine. Journal of
Biomechanics 35: 543–548. doi:10.1016/j.pathophys.2011.08.001.
28. Bender A, Bergmann G (2011) Determination of Typical Patterns from Strongly
Varying Signals. Computer Methods in Biomechanics and Biomedical
Engineering iFirst: 1–9. doi:10.1080/10255842.2011.560841.
29. Saikko V (1992) A simulator study of friction in total replacement hip joints.
Proceedings of the Institution of Mechanical Engineers Part H Journal of
engineering in medicine 206: 201–211.
30. Williams S, Jalali-Vahid D, Brockett C, Jin Z, Stone MH, et al. (2006) Effect of
swing phase load on metal-on-metal hip lubrication, friction and wear. Journal
of biomechanics 39: 2274–2281. doi:10.1016/j.jbiomech.2005.07.011.
31. Blumenfeld TJ, Glaser DA, Bargar WL, Langston GD, Mahfouz MR, et al.
(2011) In vivo assessment of total hip femoral head seperation from the
acetabular cup during 4 common daily activities. Orthopedics 34: e127–e132.
doi:10.3928/014774477-20110427-06.
32. Dennis D a, Komistek RD, Northcut EJ, Ochoa J a, Ritchie A (2001) In vivo
determination of hip joint separation and the forces generated due to impact
loading conditions. Journal of biomechanics 34: 623–629.
33. Morlock M, Nassutt R, Wimmer M, Schneider E (2000) Influence of Resting
Periods on Friction in Artificial Hip Joint Articulations. Bone: 6–16.
34. Meyer DM, Tichy JA (2003) 3-D Model of a Total Hip Replacement In Vivo
Providing Hydrodynamic Pressure and Film Thickness for Walking and
Bicycling. Journal of Biomechanical Engineering 125: 777.
doi:10.1115/1.1631585.

63
35. Hall RM, Unsworth A, Wroblewski BM, Siney P, Powell NJ (1997) The friction
of explanted hip prostheses. British journal of rheumatology 36: 20–26.
36. Hall RM, Unsworth A (1997) Friction in hip prostheses. Biomaterials 18: 1017–
1026.
37. Jin Z, Stone M, Ingham E, Fisher J (2006) (v) Biotribology. Current
Orthopaedics 20: 32–40. doi:10.1016/j.cuor.2005.09.005.

64
Published in: PLoS ONE 8(10): e77807.
DOI:10.1371/journal.pone.0077807
7. In vivo hip joint loading during post-operative physiotherapeutic
exercises
V. Schwachmeyer, P. Damm, A. Bender, J. Dymke, F. Graichen, G. Bergmann
Abstract
Introduction
After hip surgery, it is the orthopedist’s decision to allow full weight bearing to prevent
complications or to prescribe partial weight bearing for bone ingrowth or fracture
consolidation. While most loading conditions in the hip joint during activities of daily
living are known, it remains unclear how demanding physiotherapeutic exercises are.
Recommendations for clinical rehabilitation have been established, but these
guidelines vary and have not been scientifically confirmed. The aim of this study was
to provide a basis for practical recommendations by determining the hip joint contact
forces and moments that act during physiotherapeutic activities.
Methods: Joint contact loads were telemetrically measured in 6 patients using
instrumented hip endoprostheses. The resultant hip contact force, the torque around
the implant stem, and the bending moment in the neck were determined for 13
common physiotherapeutic exercises, classified as weight bearing, isometric, long
lever arm, or dynamic exercises, and compared to the loads during walking.
Results: With peak values up to 441%BW, weight bearing exercises caused the
highest forces among all exercises; in some patients they exceeded those during
walking. During voluntary isometric contractions, the peak loads ranged widely and
potentially reached high levels, depending on the intensity of the contraction. Long
lever arms and dynamic exercises caused loads that were distributed around 50% of
those during walking.
Conclusion: Weight bearing exercises should be avoided or handled cautiously within
the early post-operative period. The hip joint loads during isometric exercises depend
strongly on the contraction intensity. Nonetheless, most physiotherapeutic exercises
seem to be non-hazardous when considering the load magnitudes, even though the
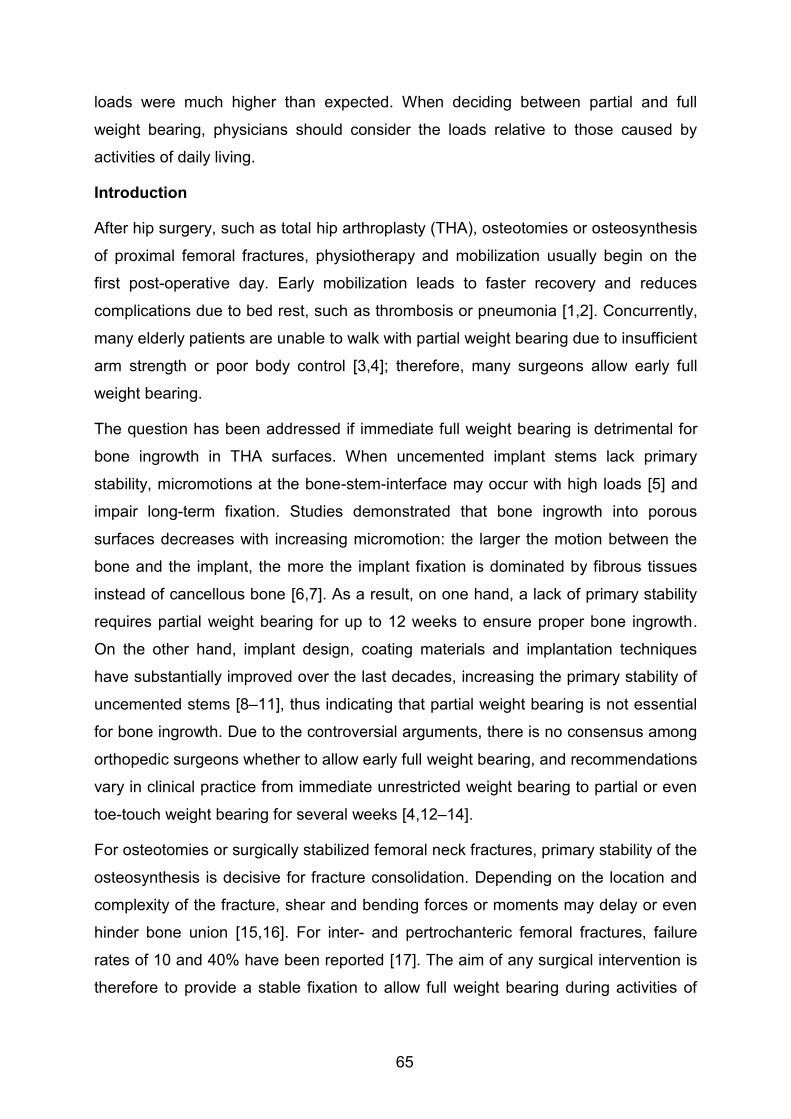
65
loads were much higher than expected. When deciding between partial and full
weight bearing, physicians should consider the loads relative to those caused by
activities of daily living.
Introduction
After hip surgery, such as total hip arthroplasty (THA), osteotomies or osteosynthesis
of proximal femoral fractures, physiotherapy and mobilization usually begin on the
first post-operative day. Early mobilization leads to faster recovery and reduces
complications due to bed rest, such as thrombosis or pneumonia [1,2]. Concurrently,
many elderly patients are unable to walk with partial weight bearing due to insufficient
arm strength or poor body control [3,4]; therefore, many surgeons allow early full
weight bearing.
The question has been addressed if immediate full weight bearing is detrimental for
bone ingrowth in THA surfaces. When uncemented implant stems lack primary
stability, micromotions at the bone-stem-interface may occur with high loads [5] and
impair long-term fixation. Studies demonstrated that bone ingrowth into porous
surfaces decreases with increasing micromotion: the larger the motion between the
bone and the implant, the more the implant fixation is dominated by fibrous tissues
instead of cancellous bone [6,7]. As a result, on one hand, a lack of primary stability
requires partial weight bearing for up to 12 weeks to ensure proper bone ingrowth.
On the other hand, implant design, coating materials and implantation techniques
have substantially improved over the last decades, increasing the primary stability of
uncemented stems [8–11], thus indicating that partial weight bearing is not essential
for bone ingrowth. Due to the controversial arguments, there is no consensus among
orthopedic surgeons whether to allow early full weight bearing, and recommendations
vary in clinical practice from immediate unrestricted weight bearing to partial or even
toe-touch weight bearing for several weeks [4,12–14].
For osteotomies or surgically stabilized femoral neck fractures, primary stability of the
osteosynthesis is decisive for fracture consolidation. Depending on the location and
complexity of the fracture, shear and bending forces or moments may delay or even
hinder bone union [15,16]. For inter- and pertrochanteric femoral fractures, failure
rates of 10 and 40% have been reported [17]. The aim of any surgical intervention is
therefore to provide a stable fixation to allow full weight bearing during activities of
66
daily living. In some cases, this cannot be achieved or the weight bearing capacity of
the fixation is questionable.
However, avoiding high loads at the fracture site or bone-stem-interface throughout
the first post-operative weeks appears to be beneficial for optimal bone healing. A
justified classification for ‘high’ or ‘low’ load levels depends on the investigated
implant, the fracture situation, the disease, and several other factors; therefore it
cannot be generalized. However, it is impossible to provide general exact thresholds
for forces or moments which are detrimental for osteoarthritis or the outcome of
surgical interventions. Most studies that tested the primary stability of implants used
force magnitudes based on Bergmann’s findings [18,19]. As the primary stability
depends on several factors, the tolerable load levels would have to be individually
defined. Here, high loads are considered those that overload the surrounding
musculoskeletal structures and thereby result in possible damage. Particularly during
the most frequent activities of daily living (ADL), which include walking, standing and
going up or down stairs, cyclic or permanent high loads may be detrimental. Previous
in vivo investigations have measured peak hip contact forces of approximately 250%
of the patient’s bodyweight (BW) during level walking and torsional moments of
1.6%BWm around the implant axis [18]. During stumbling, forces of nearly 900%BW
were measured [20]. Whereas the loading conditions during most ADL are known, it
remains unclear how demanding physiotherapeutic exercises are. Only one study
investigated the hip contact forces during physiotherapy [21], which were measured
telemetrically using an instrumented joint implant. The data were collected in only
one patient and the loading situations were not precisely defined.
The aim of this study was to augment this knowledge by systematically measuring
the hip contact loads during physiotherapeutic exercises in vivo in a cohort of 6
patients. This study focuses on the resultant joint contact force, the bending moments
in the femoral neck and the torque around the implant stem axis, as these are the
three most important mechanical factors for THA, osteotomies, femoral neck
fractures, and coxarthrosis [19].

67
Materials and Methods
Subjects
Six patients (5 male, 1 female, mean age 58±7 years, body mass 86±6 kg, height
174±5 cm) with instrumented hip endoprostheses were investigated. In every patient,
advanced hip osteoarthritis was confirmed and indications for total hip replacement
were given. The study was approved by the Charité Ethics committee under the
registry number EA2/057/09 and registered with the ‘German Clinical Trials Register’
(DRKS00000563). All patients gave written informed consent prior to participating in
this study.
Physiotherapeutic exercises
Prior to the evaluations conducted for this study, we repeatedly measured peak
forces during the exercises within the first post-operative year to investigate possible
changes over time. Such changes were not observed, as shown by sample
measurements provided in the data base www.OrthoLoad.com. Therefore, we
present data from time points when the patients were able to perform the exercises
without pain. Subject #4 reported pain in the contralateral hip during exercise #4; it
was therefore excluded from the analysis for this patient. The finally selected and
evaluated measurements were taken between the 5th and 12th post-operative month,
except from exercise #11 with data taken from the 4th postoperative week.
All patients followed an investigation protocol that included 13 common
physiotherapeutic exercises (Table 1) which were performed on a therapy table. The
selection included weight bearing exercises with closed kinetic chains (exercises #1-
#4), isometric exercises in which the patient was instructed to actively contract
his/her muscles (#5 - #7), exercises with the force acting at a long lever arm (#8, #9),
and simple dynamic exercises in the supine position (#10 - #13). Instructions were
given by an experienced physiotherapist who also ensured that all exercises were
performed correctly without compensational movements that could influence the
acting loads.
Every patient repeated the physiotherapeutic exercises 8 times. The first and last
repetitions were excluded from the evaluation; the first one because verbal
instructions slowed the movement down and the last one because the patients

68
tended to perform it faster. As a result, 6 repetitions were included in the analysis.
Each subject additionally walked 5 times along a 10 m walkway on level ground and
the data from 10 walking cycles were analyzed.
Table 1: Description of 13 physiotherapeutic exercises Number Exercise Description
1 Lifting pelvis (Bridging) maximally Supine position: knees flexed, feet standing on therapy table, arms at rest on table surface beside trunk. Pelvis lifted maximally.
2 Lifting pelvis (Bridging) slightly Supine position: knees flexed, feet standing on therapy table, arms at rest on table surface beside trunk. Pelvis lifted slightly.
3 Lifting pelvis (Bridging) one legged standing on ipsilateral leg
Supine position: knees flexed, feet standing on therapy table, arms rest on table surface beside trunk. Pelvis and the contralateral leg lifted.
4 Lifting pelvis (Bridging) one legged standing on contralateral leg
Supine position: knees flexed, feet standing on therapy table, arms rest on table surface beside trunk. Pelvis and the ipsilateral leg lifted.
5 Isometric contraction; flexed knees Supine position: feet standing on surface. Dorsiflexion, heels push into surface, gluteus maximus contracted, pelvis tilted posteriorly.
6 Isometric contraction; straight knees
Supine position: dorsiflexion, knee hollows push onto the therapy table surface (active knee extension), gluteus maximus contracted.
7 Isometric hip abduction
Supine position: Straight leg, patient pushes isometrically against external force transducer as strong as possible without pain.
8 Hip abduction with straight knee
Lateral position: hip abduction with dorsiflexion, extended knee, slight hip internal rotation. Strict supervision to prevent abdominal musculature, hip flexors or quadratus lumborum muscle being used for compensating possible weakness of abductor muscles.
9 Hip flexion with straight knee Supine position: straight leg, hip flexed to about 30° and held for 4 seconds.
10 Dynamic hip abduction
Supine position: leg abducted and adducted dynamically back to original position while heel drags over surface, limb is only slightly lifted.
11 Hip and knee flexion/extension; heel on bench
Supine position: hip and knee flexed, heel drags over surface, limb is not lifted entirely.
12 Pelvis tilt Supine position: feet standing on surface, pelvis tilted anteriorly (Hyperlordosis).
13 Pelvis tilt Supine position: feet standing on surface, pelvis tilted posteriorly (Hypolordosis).

69
Instrumented implants
The in vivo forces and moments were measured using instrumented hip implants with
an inductive power supply and telemetric data transmission. Clinically proven,
standard implants (type CTW, Merete Medical GmbH, Berlin, Germany) with a
titanium stem and 32-mm Al2O3 ceramic head were equipped with 6 internal strain
gauges to measure the deformations in the implant neck. By applying complex
calibration loads and procedures, 3 force and 3 moment components were calculated
from the deformations with an accuracy of 1-2%. All forces and moments were
normalized to the patient’s body weight and are reported as %BW and %BM*m,
respectively. The data from implants on the left side were mirrored to the right side.
Further details have been described previously [22].
Coordinate systems
The forces and moments were measured in the implant system x’, y’, z’, centered in
the middle of the head (Figure 1). The plane x’/z’ is formed by the implant neck and
the long axis of the femur. The force component Fx’ acts laterally, Fy’ anteriorly, and
–Fz’ distally along the femur axis. Fres is the resultant force, consisting of all 3
components. The moment components Mx’, My’, and Mz’ turn right around the x’, y’,
and z’ axes.
Figure 1: Resultant force, torsional moment around the implant stem and bending
moment in the femoral neck; View from posterior. The torsional moment Mtors rotates
the implant backwards around its stem axis. The bending moment Mbend acts in the
middle of the femoral neck. = CCD angle.

70
Evaluated loads
Three types of loads were evaluated (Figure 1):
1. The resultant contact force Fres consists of its 3 components:
(Equ. 1)
2. The torsional moment Mtors acts around the implant’s stem axis and rotates the
implant inwards when positive. With = 45° being the angle between the
implant’s stem and neck axes, and L being the length of the implant neck,
given by the distance between the center of the implant head and the point of
intersection of the neck axis and the implant shaft axis, Mtors is calculated by
the following equation:
(Equ. 2)
3. The bending moment Mbend acts in the middle of the femoral neck,
perpendicular to the neck axis:
(Equ. 3)
with
N is the distance between the head center and the middle of the femoral neck and
equals L/2. The direction of Mbend is not reported here.
Analysis of time-load patterns
The time-load patterns of Fres, Mtors and Mbend were averaged throughout the entire
exercise. A dynamic time warping algorithm [23] was used to deform the time scales
of the 6 repetitions, so that the summed squared errors between the 6 Fres patterns
became a minimum. These time-deformed forces were then averaged arithmetically
and delivered the ‘patient-specific’ time course of Fres for this exercise. The ‘patient-
specific’ curves from all 6 patients were averaged again, using the same algorithms,
which finally delivered the ‘activity-specific’ time pattern of Fres. The time
deformations obtained when averaging Fres were then applied to the Mtors and Mbend
patterns before averaging their time patterns, too.
)(222
zyxres FFFF
sin LFMM yztors
2
2
2
1 bendbendbend MMM
NFMMM yzxbend sincos1
yzxbend MinsNFNFM cos2
71
Analysis of load maxima
The absolute maxima of Fres, Mtors and Mbend, acting within each single trial, were
determined for the 6 repetitions of each of the 6 patients, resulting in 36 peak values
for every exercise (30 for #4). An exploratory data analysis was performed on the 3
load maxima and depicted as box plots in Figure 2. The same procedure was
performed for the 10 walking cycles of each patient.
For defining high and low loads and enabling an interpretation of the measured data,
we used the peak load values during walking as references. The median peaks of
Fres, Mtors and Mbend during walking with full weight bearing were set to 100% and
exercise loads higher than these limits were classified to be ‘high’. Loads were
named ‘medium’ if their peak values lay between 50% and 100% of these limits, and
‘low’ if they were lower than 50%. These classifications are based on clinical
considerations: If a surgeon allows the patient to walk without support,
physiotherapeutic exercised causing medium and even high loads should also be
tolerated. If only walking with half body weight is permitted, physiotherapeutic
exercises which cause medium or even high loads should consequently be avoided.
Separately for each exercise, the individual median peak values of Fres, Mtors and
Mbend were compared to the 100% and 50% levels of the same subject, using a
Student’s-t-Test for unpaired samples with a significance level of p = 0.05. The
numbers of patients having high and medium loads were indicated in Figure 2.
Analysis of load dependency on muscular strength
Due to observations from previous measurements and theoretical considerations, we
expected that the patient’s muscular strength influences the maximum loads during
the exercises, assuming that strong patients would produce high loads during
isometric exercises (#5, 6, and 7). When exercising against gravity (e.g. #8, 9),
however, the loads were expected to remain at the lowest possible limits, determined
by the patient’s anthropometric data as segment masses and lever arms of masses
and muscles.
Patients were grouped into those being physically active or passive. The ‘active’
group consisted of patients 1, 3, and 5, who frequently practiced sports like biking,
hiking, or swimming. Patients 2, 4, and 6, who didn’t practice any sports, were

72
assigned to the ‘passive’ group. The forces during exercises # 5, 6, 7, 8, and 9 were
analyzed and compared between groups using a Student’s-t-test to test the
assumptions.
Results
Time-load patterns
Figure 3 shows the activity-specific time-load patterns for each exercise. The pattern
of level walking showed two peaks for Fres, Mtors, as well as Mbend: the first peaks
were Fres = 263%BW, Mtors = 2.2%BWm, and Mbend = 3.9%BWm on average. The
second peaks were lower with Fres = 242%BW, Mtors = 0.8%BWm and Mbend =
3.7%BWm. The average loads during the two-legged stance were Fres = 93%BW,
Mtors = 0.2%BWm, and Mbend = 1.3%BWm.
Throughout all activities, the time-load patterns of Mbend closely resembled those of
Fres. The same was found for Mtors with the exception of exercises #1 (lifting pelvis
maximally), #2 (lifting pelvis slightly), #8 (hip abduction lateral position), and #13
(tilting the pelvis posteriorly), in which the activity-specific Mtors moment remained
close to zero.

73
Figure 2: Median peak loads; Median Peak values of Fres (A), Mtors (B), and Mbend (C)
and their ranges for the reference activities Level Walking (LW) with full (=100%) and
half (=50%) weight bearing as well as the 13 physiotherapeutic exercises. Horizontal
lines mark the activity-specific median peak value from walking. See Table 1 for
exercise numbers descriptions. Walking at 100% level (with full weight bearing) and
50% level serve as reference for comparison. The numbers in the upper triangles
indicate the number of patients having high loads, the number in the triangles below
indicate the number of patient, in which medium loads were found.

74
Figure 3: Hip joint loading during reference activities and exercises 1 – 13; Resultant
contact force Fres (black line, left axis), torque Mtors around implant shaft (dotted blue
line, right axis) and bending moment Mbend in femoral neck (dashed red line, right
axis). The x-axis indicates the loading time.
75
Load maxima
Figures 2A - C depict the numerically determined medians and ranges of the peak
values for Fres, Mtors and Mbend, obtained from the 36 trials (30 for exercise #4) of all
subjects. Level walking at 100% (full weight bearing) and 50% (half body weight =
partial weight bearing) served as individual references. The median 50% levels of all
3 evaluated loads from all subjects were with 130%BW lightly higher than the median
levels during a one-legged stance (approximately 100%BW). The numbers in the
upper triangles indicate the number of subjects for which an exercise caused
individual median peak loads which were significantly higher than the individual
median peak loads during walking (‘high loads’). The lower triangles indicate the
number of patients whose loads were significantly higher than the individual 50%
levels but lower than the 100% levels and therefore graded as ‘medium’ loads.
Resultant force Fres: The median peak value of Fres during walking, i.e. the 100%
level, was 266%BW. The weight bearing exercise #3 (one-legged bridging, standing
on the operated leg) was the only exercise for which the median peak force of all
subjects exceeded 100%, i. e. the reference during walking (median 303 %BW,
range 225-441 %BW). Although the median peaks of exercises #1, #5, #6, and #7
(weight bearing or isometric exercises) were lower than during walking, the 99th
percentiles exceeded the 100% level or came close to it. Only during exercise #1 did
3 patients have high loads. In the remaining exercises, the 99th percentiles were
lower than the 1st percentile for level walking and in none of the patients high forces
were found.
Torsional moment Mtors: The median peak value during walking was 2.2%BWm.
Similarly to the observations for the force, the median peak torque during weight
bearing exercise #3 was close to 100% (2.0 %BWm, 1.0 to 3.6 %BWm). In three of
the subjects, high moments were found. The 99th percentiles of exercises #4, #5, and
#7 (weight bearing or isometric exercises) exceeded the 100% level. During exercise
#4, one patient had high values of Mtors and 2 patients during exercise #7. The 99th
percentiles of exercises #6, #9, #11, and #13 did not reach 100%, but approached it
closely, with one patient having high values. For exercises #1, 2, 8, and 13, the peak
values ranged from negative values of -0.7%BWm to positive 1.5%BWm, i.e., the
medians were distributed around zero.
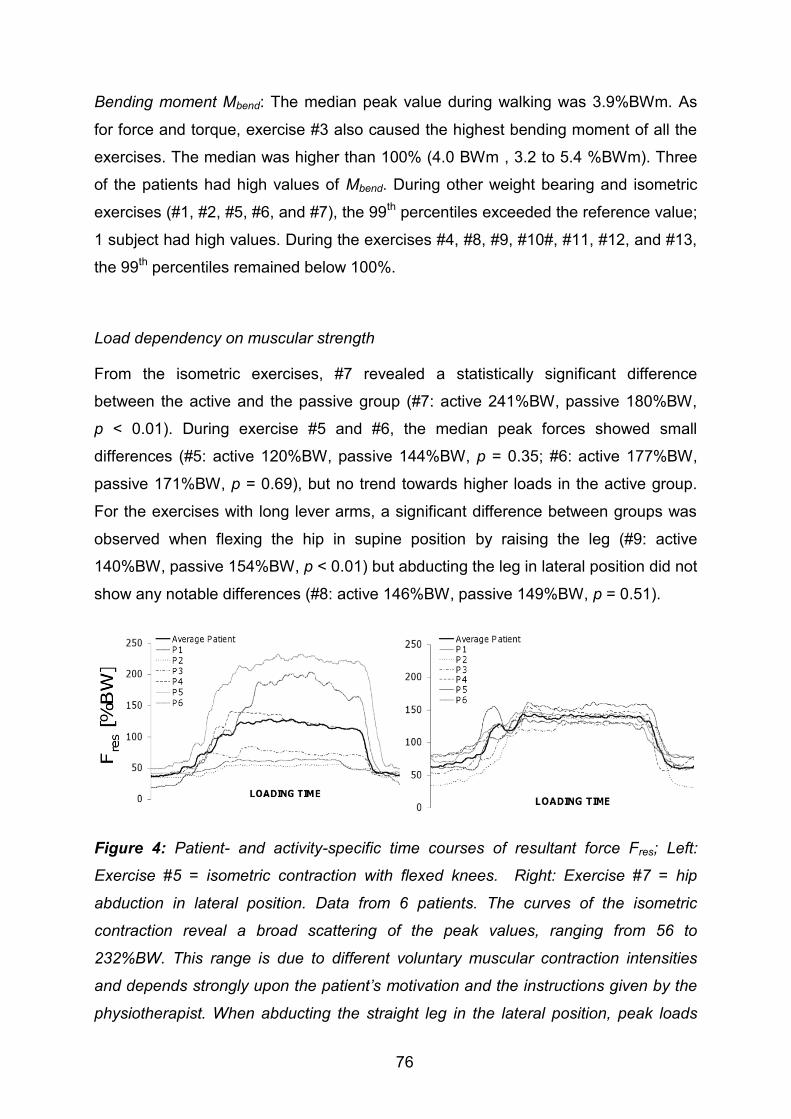
76
Bending moment Mbend: The median peak value during walking was 3.9%BWm. As
for force and torque, exercise #3 also caused the highest bending moment of all the
exercises. The median was higher than 100% (4.0 BWm , 3.2 to 5.4 %BWm). Three
of the patients had high values of Mbend. During other weight bearing and isometric
exercises (#1, #2, #5, #6, and #7), the 99th percentiles exceeded the reference value;
1 subject had high values. During the exercises #4, #8, #9, #10#, #11, #12, and #13,
the 99th percentiles remained below 100%.
Load dependency on muscular strength
From the isometric exercises, #7 revealed a statistically significant difference
between the active and the passive group (#7: active 241%BW, passive 180%BW,
p < 0.01). During exercise #5 and #6, the median peak forces showed small
differences (#5: active 120%BW, passive 144%BW, p = 0.35; #6: active 177%BW,
passive 171%BW, p = 0.69), but no trend towards higher loads in the active group.
For the exercises with long lever arms, a significant difference between groups was
observed when flexing the hip in supine position by raising the leg (#9: active
140%BW, passive 154%BW, p < 0.01) but abducting the leg in lateral position did not
show any notable differences (#8: active 146%BW, passive 149%BW, p = 0.51).
Figure 4: Patient- and activity-specific time courses of resultant force Fres; Left:
Exercise #5 = isometric contraction with flexed knees. Right: Exercise #7 = hip
abduction in lateral position. Data from 6 patients. The curves of the isometric
contraction reveal a broad scattering of the peak values, ranging from 56 to
232%BW. This range is due to different voluntary muscular contraction intensities
and depends strongly upon the patient’s motivation and the instructions given by the
physiotherapist. When abducting the straight leg in the lateral position, peak loads

77
range only slightly between 130 and 162%BW. This is a result of biomechanical
factors such as similar leg lengths, segment masses and lever arms of the gluteal
musculature.
Discussion
This study addressed the question of how demanding post-operative
physiotherapeutic hip exercises are by determining the acting hip joint forces and
moments with instrumented implants.
After hip surgery, physiotherapy is important to mobilize the patient and restore his
function. The physiotherapist’s aim is thereby to increase muscle strength, improve
joint mobility and train activities, enabling the patient to live as independently as
possible. To ensure optimal initial bone ingrowth around the implant, load-dependent
micromotions at the bone-stem-interface must be minimized as they may otherwise
prevent implant stabilization and cause loosening. Similarly, high loads acting at
fracture implants may cause non-union or pseudarthrosis. Orthopedic surgeons are
confronted with the conflict between permitting unrestricted weight bearing for fast
recovery and avoiding high mechanical loading that may cause complications and
hinder fracture consolidation. Additionally, walking with partial weight bearing or only
floor contact requires a considerable amount of muscle strength in the upper
extremities and trunk, so it is hardly achievable for many elderly patients [3,4]. These
may be reasons why rehabilitation protocols vary between clinics. One study found
large diversity in rehabilitation protocols [12]: out of 53 surveyed surgeons, 38
allowed full weight bearing for uncemented implants, yet 10 prescribed partial weight
bearing with half body weight and 3 allowed only toe-touch weight bearing. Only 9
surgeons reported that their protocols were evidenced-based, but no detailed
information was provided.
Among all exercises, the highest median peak loads were observed for the Lifting
Pelvis weight bearing exercises (#1-4). When Lifting Pelvis was performed with
support only by the operated leg (#3), the median peak forces and moments
exceeded 100%, i.e. the values during walking, in 3 to 4 patients. In one trial, Fres
rose up to even 441%BW equaling 166% of walking with full weight bearing. When
the pelvis was lifted only slightly (#2), the median peak of Fres reached 82% and were
therefore in the medium range. Some physicians disapprove Lifting Pelvis as a bed

78
exercise in the early post-operative period, but it should be taken into account that
the same activity is necessary when using a bedpan. Fleischhauer (2006)
recommends exercise #4 (Lifting Pelvis standing only on the contralateral leg while
the operated leg is lifted with extended knee) to be practiced directly after pelvic
osteotomies [24] because it is commonly believed that a non-weight bearing joint is
unloaded. In our study, this exercise caused a medium hip contact force above 50%.
The torsional moment reached values close to 100% in some trials. Such load levels
in a non-weight bearing joint can be explained by co-contraction of the muscles
crossing the hip joint as any muscular co-contraction unavoidably increases the joint
contact force.
The force-increasing effect of co-contractions can also be observed during isometric
exercises. Fundamental biomechanical reasons suggest that the theoretically
achievable ultimate levels depend on the intensity of the muscle contraction and
therefore on the muscle strength. We did not find notable differences between active
and passive patients. The assignment to the two cohorts was based on subjective
observations, however, and the maximum voluntary muscle strength had not been
quantified. Nevertheless, our data suggest that the contraction intensity depends on
multiple factors such as the patient’s motivation and/or the instructions given by the
physiotherapist rather than the maximum strength. Still, according to our
observations, high intensive contractions may lead to high joint loads during isometric
exercises. If fractures with uncertain stability prohibit high loads at the fracture site,
the physiotherapist should therefore avoid high intensity muscle contractions by
checking the contraction by palpation and controlling it by verbal instructions.
In contrast to the widely varying forces during isometric co-contractions, the loads
when exercising against gravity can be predicted relatively precisely from our data
(Figure 4). The individual forces during flexion or abduction of the straight leg, for
example, remained in a close range between 49 and 68%BW for #8 and 50 and
69%BW for #9. The individual bending moments were also similar during flexion and
abduction. The torsional moment, however, was 7-times higher during flexion than
during abduction. This is due to the high anteroposterior force component Fy’ when
flexing the hip joint. During exercises #1, #2, #8, and #13 Mtors was distributed around
zero when the data from all subjects were averaged, which was a result of
individually different signs of Fy’ and therefore of Mtors. These varying force directions
may be a result of different hip joint anatomy, particularly the implant anteversion.

79
When the pelvis was tilted anteriorly and posteriorly (#12 & 13), Mtors even changed
its sign within the movement in 4 patients, a factor that may increase the risk of
delayed bone formation at the implant’s interface.
Dynamic exercises with an open kinetic chain (non-weight bearing conditions) and
short lever arms (#10-13) caused low peak forces of approximately 38%, torque
between 23% and 45% and bending moments between 13% and 26%. These are
values classified as low, but even much lower loads had been expected, because the
moved body parts were supported by the therapy table and had therefore not to be
lifted against gravity. This again demonstrates the decisive impact of the muscles on
the internal loads.
It remains unclear whether the load magnitudes during walking (= 100%) are the
critical upper loading limits. Furthermore, the primary stability varies from case to
case and was not focus of this study so that statements about primary stability cannot
be given. However, orthopedic surgeons should take the following into account when
deciding on partial (or even toe-touch) weight bearing: unavoidable activities such as
using a bed pan and even some bed exercises cause medium to high loads. If
reduced weight bearing is nevertheless demanded by the surgeon, the
physiotherapeutic exercises shown here to produce medium or high loads should
consequently be omitted from physiotherapeutic treatment. Vice versa, the patient
should be allowed to walk with full weight bearing if these exercises are thought to be
tolerable. As muscle strengthening is a major aim of physiotherapeutic treatment and
necessary for recovery, it should be discussed whether strengthening exercises with
intensive muscle contraction shall be avoided.
This study has some limitations. We investigated only 6 subjects so that reliable and
generally representative conclusions are difficult to be drawn. Additionally, the
assignment to the active and passive group was only based on the sports activities
reported by the patients. The muscular strength had not been quantified.
Furthermore, position changes between the single physiotherapeutic exercises could
possibly lead to high loads. We did not evaluate these movements but instead
collected the exercise data in a systematic manner for best averaging accuracy and
intra-individual comparison. This method enabled us to note tendencies and provide
unique data that have not been previously obtained. The findings of this study give
important scientific information about in vivo loading during physiotherapeutic

80
exercises and will support orthopedic surgeons, therapists and patients in their
decision making and help to develop effective and individual rehabilitation protocols.
Conclusions
Weight bearing activities caused the highest loads among all exercises. Movements
against resistance or loads acting at long lever arms seem to be non-hazardous
regarding the force magnitudes, but may cause high torsional moments. The forces
during isometric contractions depend on the contraction intensity which is rather
influenced by the motivation than by the maximal muscle strength. Generally, the
joint contact forces are increased by muscle co-contractions, which press the joint
partners against each other, an effect that is observed when exercising the
contralateral limb while the ipsilateral limb is passive. When deciding between partial
and full weight bearing, physicians should consider the loads relative to those
observed during walking.
Acknowledgements
The authors would like to thank Prof. Dr. Andreas M. Halder and Dr. Alexander Beier
from the Hellmuth-Ulrici-Klinik Sommerfeld and the patients for their engaged
cooperation.

81
References
1. Kamel HK, Iqbal MA, Mogallapu R, Maas D, Hoffmann RG (2003) Time to
Ambulation After Hip Fracture Surgery: Relation to Hospitalization Outcomes.
The Journals of Gerontology Series A: Biological Sciences and Medical
Sciences 58: M1042–M1045.
2. Oldmeadow LB, Edwards ER, Kimmel LA, Kipen E, Robertson VJ, et al. (2006)
No rest for the wounded: early ambulation after hip surgery accelerates
recovery. ANZ Journal of Surgery 76: 607–611.
3. Vasarhelyi A, Baumert T, Fritsch C, Hopfenmüller W, Gradl G, et al. (2006)
Partial weight bearing after surgery for fractures of the lower extremity--is it
achievable? Gait & Posture 23: 99–105.
4. Jöllenbeck T (2005) Die Teilbelastung nach Knie- und Hüft-
Totalendoprothesen: Unmöglichkeit ihrer Einhaltung, ihre Ursachen und
Abhilfen. Z Orthop Ihre Grenzgeb 143: 124–128.
5. Burke DW, O’Connor DO, Zalenski EB, Jasty M, Harris WH (1991) Micromotion
of cemented and uncemented femoral components. The Journal of Bone and
Joint Surgery British Volume 73: 33–37.
6. Piliar R (1986) Observation on the Effect of Movement on Bone Ingrowth into
Porous-Surfaced Implants. Clin Orthop Relat Res 208: 108–113.
7. Bragdon CR, Burke D, Lowenstein JD, Connor DOO, Ramamurti B, et al.
(1996) Differences in Stiffness Between a Cementless and Cancellous Bone
into Varying Amounts of of the Interface Porous Implant vivo in Dogs Due
Implant Motion. Clin Orthop 11: 945–951.
8. Claes L, Fiedler S, Ohnmacht M, Duda GN (2000) Initial stability of fully and
partially cemented femoral stems. Clinical Biomechanics (Bristol, Avon) 15:
750–755.
9. Bieger R, Ignatius A, Decking R, Claes L, Reichel H, et al. (2011) Primary
stability and strain distribution of cementless hip stems as a function of implant
design. Clinical Biomechanics 27: 158–164.
10. Heller M, Kassi J-P, Perka C, Duda G (2005) Cementless stem fixation and
primary stability under physiological-like loads in vitro. Biomed Tech (Berl) 50:
394–399.

82
11. Zwartelé RE, Witjes S, Doets HC, Stijnen T, Pöll RG (2012) Cementless total
hip arthroplasty in rheumatoid arthritis: a systematic review of the literature.
Archives of Orthopaedic and Trauma Surgery 132: 535–546.
12. Hol A, Van Grinsven S, Rijnberg Wj, Susante J, Van Loon C (2006) Varatie in
nabehandeling can de primaire totaleheupprothese via de posterolaterale
benadering. Nederlands Tijschrift voor Orthopaedie 13e: 105–113.
13. Thomas S, Mackintosh S, Halbert J (2011) Determining current physical
management of hip fractrue in acute care hospital and physical therapists’
rationale for this management. Phys Ther 91: 1490–1502.
14. Yang H, Zhou F, Tian Y, Ji H, Zhang Z (2011) Analysis of the failure reason of
internal fixation in periptrochanteric fractures. Journal of Peking Inversity
(Helath Sciences) 43: 699–702.
15. Lorich DG, Geller DS, Nielson JH (2004) Osteoporotic Pertrochanteric Hip
Fractures. Management and Current Controversies. The Journal of Bone and
Joint Surgery 86-A: 398–410.
16. Van Vugt AB (2007) Femoral neck non-unions: How do I do it? Injury, Int J
Care Injured 38S: 51–54.
17. Knobe M, Münker R, Sellei R, Schmidt-Rohlfing B, Erli H, et al. (2009) Die
instabile pertrochantäre Femurfraktur. Komplikationen, Fraktursinterung und
Funktion nach extra- und intramedullärer Versorgung (PCCPTM, DHS und
PFN). Zeitschrift für Orthopädie und Unfallchirurgie 147: 306–313.
18. Bergmann G, Deuretzbacher G, Heller M, Graichen F, Rohlmann A, et al.
(2001) Hip contact forces and gait patterns from routine activities. Journal of
Biomechanics 34: 859–871.
19. Bergmann G, Graichen F, Rohlmann A (1995) Is staircase walking a risk for the
fixation of hip implants? Journal of Biomechanics 28: 535–553.
20. Bergmann G, Graichen F, Rohlmann A (2004) Hip joint contact forces during
stumbling. Langenbeck’s Archives of Surgery / Deutsche Gesellschaft für
Chirurgie 389: 53–59.
21. Bergmann G, Rohlmann A, Graichen F (1989) In vivo Messung der
Hüftgelenkbelastung 1. Teil: Krankengymnastik. Z Orthop 127: 672–679.
22. Damm P, Graichen F, Rohlmann A, Bender A, Bergmann G (2010) Total hip
joint prosthesis for in vivo measurement of forces and moments. Medical
Engineering & Physics 32: 95–100.

83
23. Bender A, Bergmann G (2011) Determination of typical patterns from strongly
varying signals. Computer Methods in Biomechanics and Biomedical
Engineering: 37–41.
24. Fleischhauer M (2006) Leitfaden Physiotherapie in der Orthopädie und
Traumatologie. 2. ed. Fleischhauer M, Heimann D, Hinkelmann U, editors
Urban & Fischer München.

84
Published in Clinical Biomechanics 28; 2013; 530-535
DOI: 10.1016/j.clinbiomech.2012.12.003
8. In vivo hip joint loads during three methods of walking with
forearm crutches
P. Damm, V. Schwachmeyer, J. Dymke, A. Bender, G. Bergmann
Abstract
Background
Patients with osteoarthritis, joint implants or fractures use crutches in order to reduce
lower limb loading. However, insufficient information exists on how much the loading
is then in fact reduced. This situation was studied by using seven patients who had
instrumented hip implants.
Methods
Part I: To investigate the effectiveness of forearm crutches, crutch and hip joint
contact forces were measured in seven patients with instrumented hip prostheses.
Additionally, the bending moments in the implant neck and torsion around its stem
were determined. Reductions of peak loads during 3, 4, and 2-point gaits were
compared to loads present when walking without crutches.
Part II: This examines joint load reduction during a 4-point gait from one to 12 weeks
post-operatively.
Findings
Part I: During a 3, 4, and 2-point gait, the joint force was 17, 12, and 13% lower than
it was while walking without crutches. The corresponding reductions of the bending
moment were 16, 11, and 12%, while the maximum torque decreased by 19, 21, and
10%.
Part II: The reductions of contact forces in comparison to walking without crutches
were highest during the first 4 weeks after surgery. One and 4 weeks post-
operatively, the force maximum was 21 and 8% lower than it was after three months.

85
When compared to the initial values of the 1st week, crutch forces decreased by 28%
in the 4th week and by 38% in the 3rd month.
Interpretation
Average reductions of the joint load by more than 20% are only achieved during the
first 4 post-operative weeks. Because fractures are in most cases relatively stable
after 6 weeks, and bone ingrowth into implant interfaces is nearly finished after this
time, a single crutch and a 2-point gait can be prescribed during the 5th and 6th post-
operative week.
Introduction
Reduction of hip joint loading is of special interest in many clinical situations. Here
are three important examples:
A) In the case of coxarthrosis, the resultant joint force Fres determines, in addition to
the joint contact area, cartilage pressure and progress of the disease (Carter et al.
2004; Recnik et al. 2007). The pressure is also decisive in cases of cartilage
repair and for determining the wear in total hip replacements (THRs) (Buford &
Goswami 2004; Barbour et al. 1995).
B) For stable fixation of an uncemented THR, bony ingrowth at the stem interface
and thus the torque Mstem around the implant stem is important. During the first
weeks post-operatively (pOP), the torque can be critical (Mjöberg et al. 1984;
Nunn et al. 1989).
C) Healing of femoral neck fractures often fails, especially in elderly patients (Iorio et
al. 2004; Roberts & Goldacre 2003; Moran et al. 2005). One reason can be due to
the high loads present during the first 6 to 12 weeks. Frequent consequences are
non-union, avascular necrosis or even death (Grace et al. 1994). Most decisive
for loading of the neck is the bending moment Mneck acting there.
Canes and crutches are frequently used to reduce the resultant hip contact force
(Fres), the torque around the implant stem (Mstem) and the bending moment in the
femoral neck (Mneck). After THR or femoral neck fractures, patients are often advised
to use crutches for up to 3 months pOP. Commonly, it is recommended to start
walking with a 3-point gait, when both crutches are moved parallel to the affected leg.
After approximately 2 weeks, the crutches are in most cases used during an
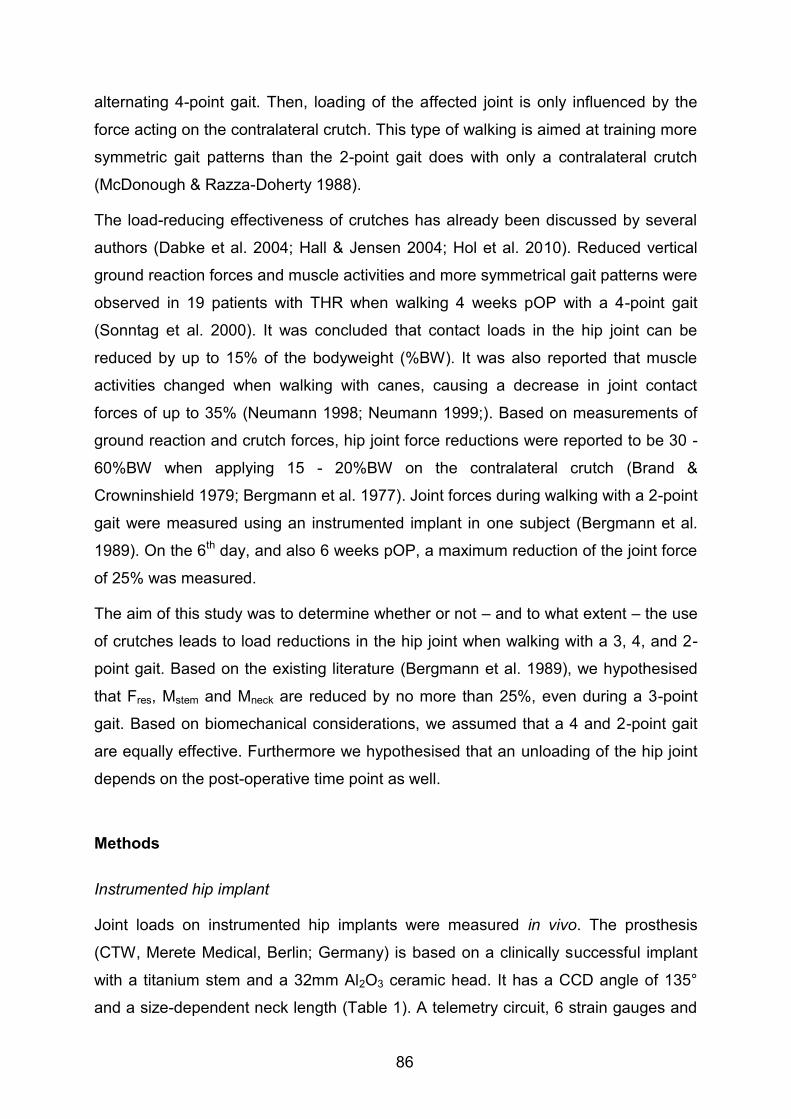
86
alternating 4-point gait. Then, loading of the affected joint is only influenced by the
force acting on the contralateral crutch. This type of walking is aimed at training more
symmetric gait patterns than the 2-point gait does with only a contralateral crutch
(McDonough & Razza-Doherty 1988).
The load-reducing effectiveness of crutches has already been discussed by several
authors (Dabke et al. 2004; Hall & Jensen 2004; Hol et al. 2010). Reduced vertical
ground reaction forces and muscle activities and more symmetrical gait patterns were
observed in 19 patients with THR when walking 4 weeks pOP with a 4-point gait
(Sonntag et al. 2000). It was concluded that contact loads in the hip joint can be
reduced by up to 15% of the bodyweight (%BW). It was also reported that muscle
activities changed when walking with canes, causing a decrease in joint contact
forces of up to 35% (Neumann 1998; Neumann 1999;). Based on measurements of
ground reaction and crutch forces, hip joint force reductions were reported to be 30 -
60%BW when applying 15 - 20%BW on the contralateral crutch (Brand &
Crowninshield 1979; Bergmann et al. 1977). Joint forces during walking with a 2-point
gait were measured using an instrumented implant in one subject (Bergmann et al.
1989). On the 6th day, and also 6 weeks pOP, a maximum reduction of the joint force
of 25% was measured.
The aim of this study was to determine whether or not – and to what extent – the use
of crutches leads to load reductions in the hip joint when walking with a 3, 4, and 2-
point gait. Based on the existing literature (Bergmann et al. 1989), we hypothesised
that Fres, Mstem and Mneck are reduced by no more than 25%, even during a 3-point
gait. Based on biomechanical considerations, we assumed that a 4 and 2-point gait
are equally effective. Furthermore we hypothesised that an unloading of the hip joint
depends on the post-operative time point as well.
Methods
Instrumented hip implant
Joint loads on instrumented hip implants were measured in vivo. The prosthesis
(CTW, Merete Medical, Berlin; Germany) is based on a clinically successful implant
with a titanium stem and a 32mm Al2O3 ceramic head. It has a CCD angle of 135°
and a size-dependent neck length (Table 1). A telemetry circuit, 6 strain gauges and
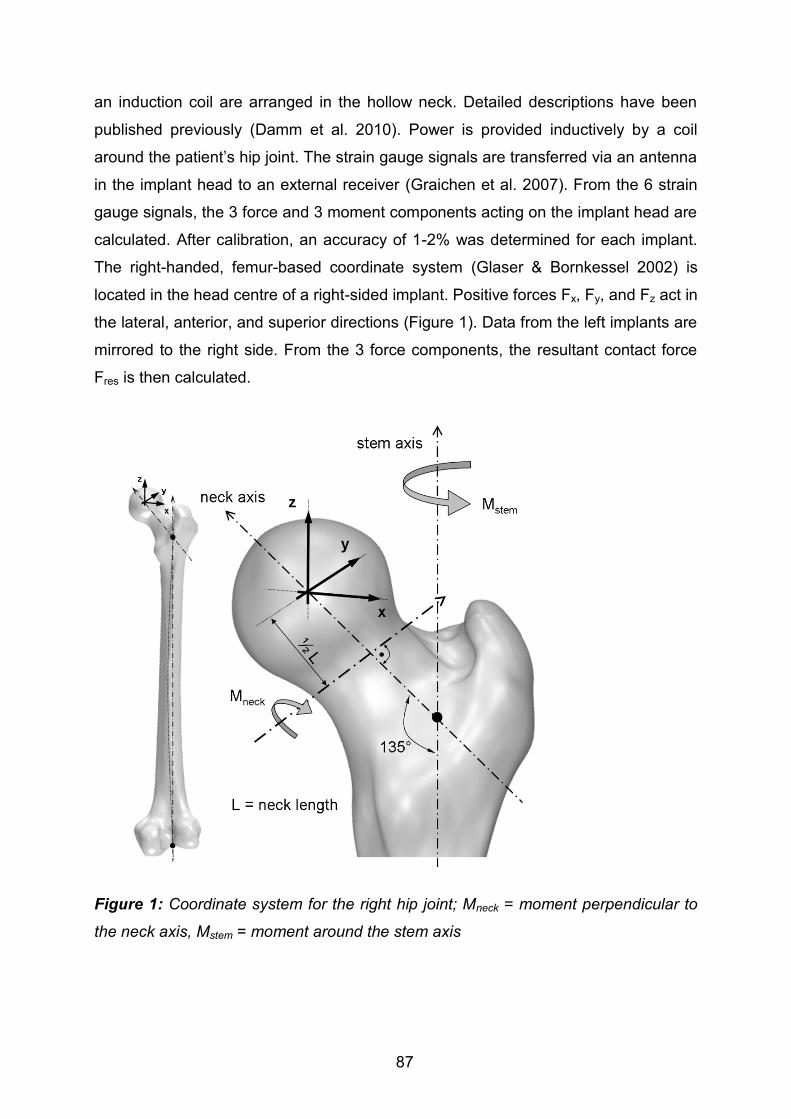
87
an induction coil are arranged in the hollow neck. Detailed descriptions have been
published previously (Damm et al. 2010). Power is provided inductively by a coil
around the patient’s hip joint. The strain gauge signals are transferred via an antenna
in the implant head to an external receiver (Graichen et al. 2007). From the 6 strain
gauge signals, the 3 force and 3 moment components acting on the implant head are
calculated. After calibration, an accuracy of 1-2% was determined for each implant.
The right-handed, femur-based coordinate system (Glaser & Bornkessel 2002) is
located in the head centre of a right-sided implant. Positive forces Fx, Fy, and Fz act in
the lateral, anterior, and superior directions (Figure 1). Data from the left implants are
mirrored to the right side. From the 3 force components, the resultant contact force
Fres is then calculated.
Figure 1: Coordinate system for the right hip joint; Mneck = moment perpendicular to
the neck axis, Mstem = moment around the stem axis

88
External measurement system
The external measurement system has already been described (Graichen et al.
2007; Graichen et al. 1994). Patients are videotaped during the measurements. The
telemetric load signals and the crutch forces are recorded simultaneously on video.
Load transducers (KM30z-2kN, ME-Meßsystem GmbH, Germany) were integrated
into forearm crutches to measure the longitudinal force Fcrutch in 1 or 2 crutches,
depending on the type of crutch support. The transducers were connected to the
external equipment by cables. The crutch length was adjusted to the patients by a
physiotherapist.
Patients and measurements
The study was approved by the ethics committee (EA2/057/09) and registered at the
‘German Clinical Trials Register’ (DRKS00000563). Seven patients with hip
osteoarthritis participated in the study (Table 1). They all gave informed written
consent to participate in this study and have their images published. Selected trials of
all patients are shown and can be downloaded at www.OrthoLaod.com. During
rehabilitation, the patients had not been instructed to load the crutches in any given
way. This was regarded as ineffective, because it had been shown that patients are
unable to limit the ground reaction force at a given level, even after training on a
bathroom scale (Bergmann et al. 1979). For the actual study we measured the acting
crutch forces and the in vivo joint loads during a 4 point gait from one to 12 weeks
pOP and further at 12 weeks pOP during a 3 and 2-point gait.
Part I of this study compares 3 types of walking with crutches in regard to the load
reduction achieved in the joint. It comprises measurements taken 10 months pOP in
patient H1L, 6 months pOP in H2R and 3 months pOP in the remaining 5 patients.
The patients walked several times without crutches and with a 3, 4, and 2-point gait
(except for H1L) at a self-selected speed over a distance of 10 m. They were
instructed to load the crutches as they had done during their rehabilitation to observe
typical loads under normal daily circumstances. The forces during walking with
crutches were normalized to the joint forces during walking without crutches, as
observed on the same day.

89
Table 1: Patients investigated
Part II reports on the changes in hip contact forces during a 4-point gait from the first
week to the third month pOP. The joint loads were measured in 7 patients once a
week during the first pOP month, and then monthly. Synchronously the crutch forces
were measured. During the first four weeks, measurements were undertaken under
the guidance of a physiotherapist.
Data evaluation
All forces were normalised and are given as a percent value of the patients’
bodyweight (%BW). From the 3 force components, the torque Mstem around the stem
axis, and the resultant bending moment Mneck in the middle of the femoral neck were
calculated in % of the patients’ body weight times meter (%BWm). The direction of
Mneck is not reported here. Relative changes of Mneck in the middle of the neck are the
same as the relative changes at other locations of the neck.
During all types of gait, Fres had 2 peak values (Fig. 2); labelled Fres1|Fres2 (notation
“X|Y” generally indicates values at the instants of Fres1 and Fres2). Fres1 acted
approximately at the instant of contralateral toe off (CTO), Fres2 at contralateral heel
strike (CHS). The loads Mstem1|Mstem2, Mneck1|Mneck2 and Fcrutch1|Fcrutch2 were
determined at the instants of Fres1| Fres2.
In Part I, median values and standard deviations of the peak values from 20 – 70
steps were analysed from every subject for each kind of crutch use. The reductions
Patient Age
[years] Sex
Body weight
[N]
Neck Length
[mm]
H1L 56 male 754 55.6
H2R 62 male 755 59.3
H3L 60 male 880 55.6
H4L 50 male 814 63.3
H5L 62 female 853 55.6
H6R 69 male 832 63.3
H7R 53 male 899 59.3

90
of these peak values, caused by the crutches, are stated in percent of the levels
when walking without crutches. Separately and for each patient it was determined
statistically whether Fres was significantly lower when walking with crutches than it
was without crutches (Man-Whitney-U; p<0.01).
In addition, average force-time patterns from the 20 – 70 steps were calculated for
Fres, Mneck, Mstem and Fcrutch separately for each subject and kind of crutch use. The
employed ‘time-warping’ method (Bender & Bergmann 2011) first normalises the
period times of all included steps. Then, the single time scales are distorted in such a
way that the squared differences between all deformed curves, summed over the
period time, are minimised. Finally an arithmetic average curve is calculated from all
deformed curves. This average curve was first calculated from the time patterns of
Fres, and the time deformations obtained from the single trials were then transferred
to Mneck, Mstem and Fcrutch before these loads were averaged.
The averaging procedure was first performed on the data of the single subjects.
Using the same method, the average force patterns of all 7 patients were combined.
If not stated otherwise, all data presented refer to the obtained ‘average’ patient.
Because the errors between the single trials were minimised over all loading cycles,
the peak values of the average curves can deviate slightly from the averaged
numerical values at the 1st and 2nd peak.
In Part II, the changes of Fres1|Fres2 in the ‘average’ patient and the additional average
crutch forces were evaluated throughout the first 3 months pOP during a 4-point gait.
The crutch-dependent reductions were related to the corresponding values 3 months
pOP.

91
Results
Resultant joint force Fres
Figure 2 shows the average patterns of Fres during free walking without crutches and
the 3 types of crutch use. Without crutches, Fres1|Fres2 were 240|237 %BW. During a
3-point gait, they changed by -17|-30%. During a 4-point gait, the changes were
-12|-15%, which was the nearly the same as it was during a 2-point gait with
-13|-14%.
The reductions of Fres1|Fres2 by crutches inter-individually varied considerably (Figure
3). During a 3-point gait, the changes of Fres1 were in the range of +5% to -29%. In
H1L, Fres1 even increased. Fres2 changed by -11% to -53%. When walking with a
4-point gait, Fres1 changed from +11% to -21%, and Fres2 changed from -2% to -25%.
Again, Fres1 increased in H1L, and in H7L Fres2 remained unchanged. During a 2-point
gait, Fres1 changed by -13% to -20%, and Fres2 changed by -4% to -38%.
In 5 patients, Fres2 always decreased more than Fres1 did. Only in H5L and H7R did
the crutches reduce Fres1 more than Fres2. In H3L, H4L, H5L and H7R, the reductions
of Fres1 and Fres2 were similar during a 4 and 2-point gait. In H2R and H6R, walking
with a 2-point gait was much more effective than walking with 4-point gait was.
The influence of the walking speed (Table 2) on the measured load reduction at
Fres1|Fres2 was determined. The linear coefficients of determination (R²) calculated
were 0.18|0.52 for a 3-point gait, 0.51|0.01 for a 4-point gait and 0.04|0.17 for a
2-point gait.

92
Figure 2: Average changes of forces and moments during one load cycle; Walking
without (w/o) and with crutches with a 3, 4, and 2-point gait. Averages of 7(6)
subjects and 20 to 70 loading cycles per subject; Upper diagram: resultant joint
contact force Fres and crutch forces Fcrutch. Lower diagram: bending moment Mneck
and torque Mstem; CTO = contralateral toe off, CHS = contralateral heel strike.

93
Figure 3: Individual changes of peak force Fres; Walking without (w/o) and with
crutches with a 3, 4 and 2-point gait. Changes in 7 subjects in percent of forces
during free walking; Data from 20 to 70 loading cycles per subject, 3 to 10 months
after THR; Left: peak value Fres1. Right: peak value Fres2. Asterisks *: Significant
changes relative to free walking.
Bending moment Mneck in the femoral neck
The 2 peak values Mneck1|Mneck2 acted at nearly the same times as did the peak
forces Fres1|Fres2 (Figure 2). During free walking, Mneck1|Mneck2 values had the same
average height of 3.5|3.5 %BWm. The following load changes were measured when
walking with crutches: -16|-33% during a 3-point gait, -11|-14% during a 4-point gait,
and -12|-14% during a 2-point gait. The reductions of Mneck during all types of crutch
usage among the participants differed considerably (Table 2).

94
Torque Mstem around the stem axis
Mstem2 was lower than Mstem1 during free walking and all types of crutch-supported
walking. When walking without crutches, Mstem1|Mstem2 had values of 1.7|0.5 %BWm
(Figure 2). During a 3-point gait, changes of -19|-35% were observed. During a 4-
point gait, Mstem1|Mstem2 changed by -21|0%. In a 2-point gait, the changes were -
10|+15%. The changes of Mstem were also extremely dependent on the investigated
subject for all types of crutch use (Table 2).
Crutch forces Fcrutch
When walking with a 3-point gait, both average crutch forces reached their maxima at
times between the peak forces Fres1 and Fres2 (Figure 2). Throughout the whole
walking cycle, the average contralateral crutch force was higher than the ipsilateral
force. On the average, the absolute maximum of Fcrutch in the contralateral crutch was
highest during a 3-point gait, followed by a 2 and a 4-point gait.
Fres1|Fres2 were both linearly dependent on the synchronous contralateral crutch force
Fcrutch. Coefficients of determination (R²) of 0.65 | 0.75 were calculated for a 3-point
gait, 0.74 | 0.62 for a 4-point gait and 0.84 | 0.75 for a 2-point gait. The regression
lines revealed that Fres1 was reduced by 6|9|13%BW during 3-|4-|2-point gait if the
contralateral force Fcrutch increased by 1%BW. For the 2nd peak of Fres, the reductions
for each 1%BW of the crutch force were 6|11|12%BW.

95
Table 2: Average gait velocity v, crutch forces Fcrutch at the instants of the 2 peak forces Fres and changes of the bending moment
Mneck and the torque Mstem; 7 subjects, 3 methods of crutch walking, 3 to 10 months after THR; arithmetic mean values (SD),
contra = contralateral crutch, ipsilat. = ipsilateral crutch; changes in % of values during free walking
Patient H1L H2R H3L H4L H5L H6R H7R
[m/s] v v v v v v v
w/o 1.0 1.0 0.8 1.0 0.9 1.1 1.1
3-point gait 0.8 0.6 0.6 0.7 0.9 1.0 0.7
4-point gait 0.7 0.8 0.7 0.8 0.9 1.0 0.8
2-point gait - 0.7 0.8 0.8 1.0 1.0 0.9
[%BW] Fcrutch1 Fcrutch2 Fcrutch1 Fcrutch2 Fcrutch1 Fcrutch2 Fcrutch1 Fcrutch2 Fcrutch1 Fcrutch2 Fcrutch1 Fcrutch2 Fcrutch1 Fcrutch2
3-point, contra 4 (1) 7 (3) 16 (5) 22 (4) 13 (2) 14 (2) 12 (4) 19 (5) 9 (3) 6 (2) 2 (1) 12 (2) 10 (5) 19 (2) 3-point, ipsilat. 2 (2) 5 (3) 14 (5) 18 (4) 5 (1) 7 (1) 6 (2) 12 (5) 5 (2) 6 (3) 2 (1) 10 (2) 6 (4) 18 (3) 4-point, contra 3 (2) 6 (3) 6 (3) 5 (2) 14 (2) 11 (2) 10 (3) 11 (3) 6 (2) 4 (1) 4 (1) 5 (2) 5 (2) 7 (4) 2-point, contra --- --- 12 (5) 18 (5) 12 (2) 11 (2) 7 (3) 10 (3) 6 (1) 4 (1) 8 (1) 9 (2) 5 (3) 8 (2)
Δ [%] Mneck1 Mneck2 Mneck1 Mneck2 Mneck1 Mneck2 Mneck1 Mneck2 Mneck1 Mneck2 Mneck1 Mneck2 Mneck1 Mneck2
3-point gait 3 - 20 - 28 - 59 - 17 - 28 - 18 - 40 - 16 - 10 -8 -41 -19 -2 4-point gait - 4 - 22 - 8 - 3 - 20 - 25 - 8 - 20 - 12 0 -12 -21 -9 -6 2-point gait --- --- - 11 - 11 - 20 - 27 - 15 - 23 - 12 - 7 -22 -36 -9 -11
Δ [%] Mstem1 Mstem2 Mstem1 Mstem2 Mstem1 Mstem2 Mstem1 Mstem2 Mstem1 Mstem2 Mstem1 Mstem2 Mstem1 Mstem2
3-point gait 46 70 - 51 - 68 - 12 - 20 - 27 33 - 6 40 -14 -58 -26 67 4-point gait - 36 0 - 19 22 - 15 - 21 - 19 66 - 19 40 -26 0 -18 189 2-point gait --- --- - 13 29 - 9 - 29 - 23 66 - 6 0 -37 -32 -14 104
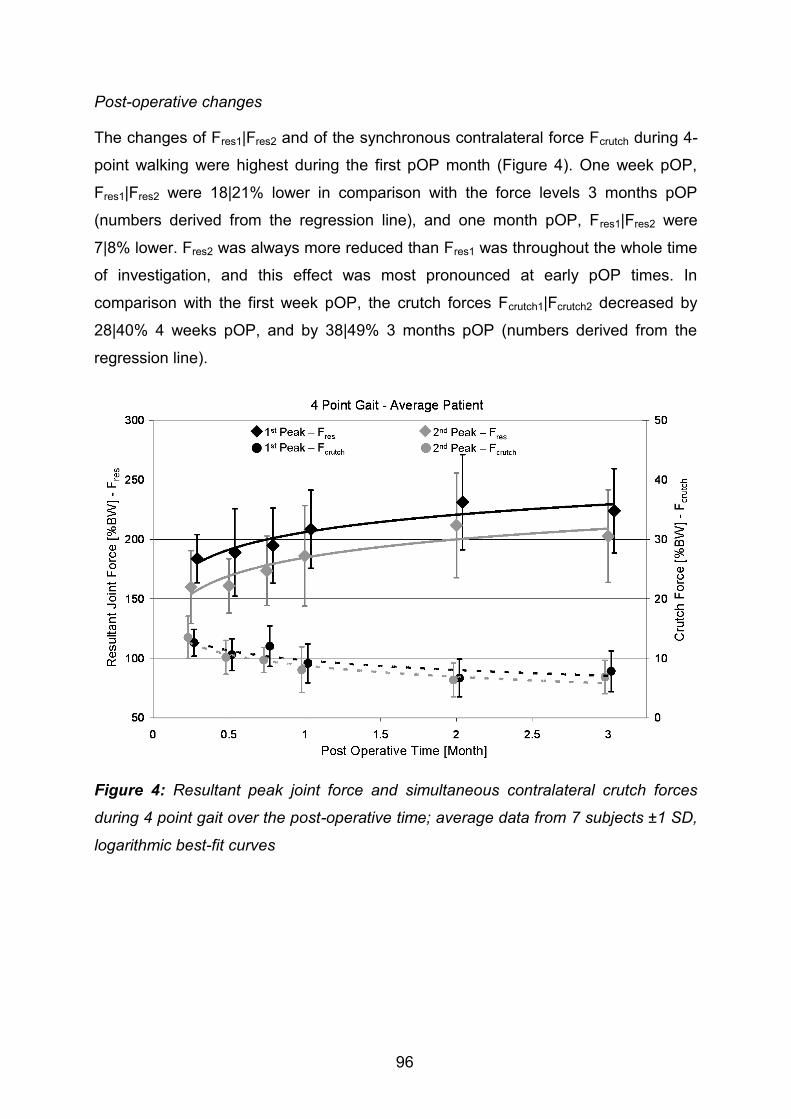
96
Post-operative changes
The changes of Fres1|Fres2 and of the synchronous contralateral force Fcrutch during 4-
point walking were highest during the first pOP month (Figure 4). One week pOP,
Fres1|Fres2 were 18|21% lower in comparison with the force levels 3 months pOP
(numbers derived from the regression line), and one month pOP, Fres1|Fres2 were
7|8% lower. Fres2 was always more reduced than Fres1 was throughout the whole time
of investigation, and this effect was most pronounced at early pOP times. In
comparison with the first week pOP, the crutch forces Fcrutch1|Fcrutch2 decreased by
28|40% 4 weeks pOP, and by 38|49% 3 months pOP (numbers derived from the
regression line).
Figure 4: Resultant peak joint force and simultaneous contralateral crutch forces
during 4 point gait over the post-operative time; average data from 7 subjects ±1 SD,
logarithmic best-fit curves

97
Discussion
To the best of our knowledge, this is the first study reporting in vivo-measured hip
contact forces, bending moments in the neck, torque around the stem axis, and
synchronously acting crutch forces from a group of subjects. Special consideration
was made to provide realistic measurement conditions. The patients were advised to
load their crutches in the same way as they had done during their rehabilitation
period. The aim of this study was to determine the joint load reduction during walking
with crutches using a 3, 4, and 2-point gait. Based on previous literature and
biomechanical considerations, three hypotheses were set forward:
I. Fres, Mstem and Mneck are reduced by no more than 25% for any kind of
crutch use.
II. 4-point and 2-point gaits have a similar load-reducing effect.
III. The reduction of the hip contact force during walking with crutches
depends on the post-operative time.
The first hypothesis could not be confirmed. Although the subjects reduced Fres by
17% on the average during a 3-point gait, by 12% during a 4-point, and by 13%
during a 2-point gait (Figure 2), Fres reductions during a 3-point gait of up to 53%
were observed in some patients (Figure 3). In a similar way, MStem was reduced by up
to 19% on the average during a 3-point gait, and the bending moment Mneck by up to
16% (Figure 2). However, some patients achieved load reductions of up to 59% for
Mneck and 68% for MStem (Table 2).
The second hypothesis could not be confirmed, either. The reduction of Fres was
similar for both kinds of crutch walking (Figure 2). However, the average reduction of
MStem was much larger during a 4-point than it was during a 2-point gait. Furthermore
the intra-individual reductions of MStem and Mneck were very different between these
two kinds of walking.
The third hypothesis could however be confirmed; the highest crutch forces and
highest load reduction on the hip joint during walking with crutches was measured
during the first four weeks pOP.

98
In the following, the most important findings of this study are summarized:
a) The 2nd force peak is more effectively decreased by crutches than the 1st peak is.
b) In a 3-point gait, the 2nd peak of Fres is reduced by approximately 50% more than
it is in a 4-point or 2-point gait.
c) The reduction of Fres during a 2-point gait is just as effective as it is during a 4-
point gait; Mstem is, however, best reduced by 4-point gait.
d) Average reductions of Fres in a 4-point gait of more than 20% are only achieved
during the first 4 pOP weeks.
e) The 1st torque maximum Mstem1 around the stem axis is much higher than the 2nd
one is. In contrast to the reduction of Fres1 and Fres2 by crutches, only Mstem1 was
clearly reduced.
Based on these observations and other literature data, several conclusions can be
drawn and clinical suggestions offered:
1) It could be shown that the load reduction at the first peak during a 3-point gait was
similar to the load reduction during a 4-point gait (shown in Figure 2). A previous
study has shown that patients typically load the affected leg during walking with
crutches more than that expected by many physiotherapists and orthopaedic
surgeons (Bergmann et al. 1978; Bergmann et al. 1979). Among the findings of
the previous studies and our own measurement data we conclude that – as long
as the patients themselves feel safe – they can walk just as well with a 4-point
gait.
2) If the use of crutches after THR is ever advised after the 4th week, the patients
should walk with a 2-point gait but only with 1 crutch. This handicaps them less
than using 2 crutches and it was shown in Figure 2 and Figure 4 that force
reduction during a 2 point gait is just as effective as it is during a 4 point gait.
However if coordination is most important, a 4 point gait should be chosen to
regain symmetric movement patterns (McDonough & Razza-Doherty 1988; Hesse
et al. 1999). Otherwise the patients can walk with a 2-point gait with the crutch on
the contralateral side.

99
3) In regard to the limited load reductions now observed, we assume that the use of
crutches is more important in order to prevent extremely high loads than it is to
reduce the peak forces during regular gait cycles. This is explained by the
following three examples:
a) After cementless implantation of hip prostheses, the bone needs several weeks
to grow into the porous interface around the implant (Jasty et al. 1993). It is
known that this can only proceed if the micro movement in the interface remains
below a value of 20 to 40 µm (Bragdon et al. 1996; Pilliar et al. 1986). The
maximum movement can rise with the maximum joint contact force and the torque
around the stem axis. However a combination of low contact force and a high
torsion moment can also be critical for the fixation, because of the reduced wedge
stabilisation.
b) Fresh fractures of the proximal femur or its neck, stabilised by implants, often
cannot bear one’s own normal body weight (Brumback et al. 1999). This is
apparent because the risk of a non-union of the fracture depends not only on the
high number of loading cycles with the average load, but also on the presence of
extreme loads.
c) Unsafe walking as a result of pain and stumbling can cause extremely high hip
contact forces (Bergmann et al. 2004). Up to 870%BW were observed, and even
higher levels must be expected in younger subjects. In contrast, occasional
observations during everyday life and in rehabilitation clinics show that when
walking with 2 crutches, patients often step fully with the affected leg, for example,
when opening doors. The current study also indicates that joint forces having an
average size or greater can act even when walking with crutches, especially in a
4-point or a 2-point gait. Based on these reports and observations, we assume
that the main function of crutches and canes used after the fourth or sixth post-
operative week is to remind the patients to walk cautiously and thus prevent
potential injuries.
4) In some patients the hip joint load increased if they used the crutches in an
incorrect manner (for an example, see www.OrthoLoad.com -
H3L_140311_1_144). This underlines the importance of taking part in an initial
training of crutch walking.

100
In contrast to the reduction of Fres and Mneck while walking with crutches, only the first
peak of Mstem was clearly seen to be changed. This peak Mstem1 was on the average
decreased by up to 19% during a 3-point, 21% during a 4-point, and 10% during a 2-
point gait. This torque is one of the most decisive factors for a stable implant fixation
(Bergmann et al. 1995; Heller et al. 2001; McKellop et al. 1991; Nunn et al. 1989;
Phillips et al. 1991). Fractures are in most cases stable after 6 weeks (Wehner et al.
2010), and bone ingrowth into implant interfaces is nearly complete after this time
(Jasty et al. 1993). Furthermore the regression line in Figure 4 shows that the joint
force reduction in the sixth week is only about 3% higher than it is in the eighth week.
Thus a single crutch and 2-point gait can, according to our observations, be
prescribed from the 5th and 6th pOP week on.
Limitations
The study was performed in order to measure the in vivo joint load reduction by using
instrumented forearm crutches under realistic measurement conditions. The small
number of investigated subjects and the large number of individual differences in joint
force reductions achieved by crutches do not support any generalisation of the
results. All patients were in good physical shape and younger than typical subjects
after hip replacement. It cannot be excluded that patients who are older or weaker
will load their crutches less than the subjects here did. No additional measurements
were made, such as changes of muscle activities or ground reaction forces.
Acknowledgments
The authors gratefully acknowledge the voluntary collaboration of all subjects. The
study was supported by the German Research Society (DFG - SFB 760, Be 804/19-
1) and by Deutsche Arthrose-Hilfe e.V.

101
References
Barbour, P.S.M., Barton, D.C. & Fisher, J., 1995. The incluence of contact stress on
the wear of UHMWPE for total replacement hip prostheses. Methods, 181-183,
pp.250-257.
Bender, A. & Bergmann, G., 2011. Determination of Typical Patterns from Strongly
Varying Signals. Computer Methods in Biomechanics and Biomedical
Engineering, iFirst, pp.1-9.
Bergmann, G., Graichen, F. & Rohlmann, 2004. Hip joint contact forces during
stumbling. Langenbeck’s archives of surgery, 389(1), pp.53-59.
Bergmann, G., Graichen, F. & Rohlmann, 1995. Is staircase walking a risk for the
fixation of hip implants? Journal of biomechanics, 28(5), pp.535-53.
Bergmann, G. et al., 1978. Das Gehen mit Stockstützen - II. Beinbelastung und
Stützenkräfte bei Verwendung von zwei Unterarmgehstützen. Zeitschrift für
Orthopädie und ihre Grenzgebiete, 116, pp.106-113.
Bergmann, G. et al., 1977. Walking with canes and forearm-crutches. I. Reduction of
loads at the hip and proximal end of the femur by one sided use of cane/crutch
(author’s transl). Zeitschrift fur Orthopadie und ihre Grenzgebiete, 115(2),
pp.174-182.
Bergmann, G. et al., 1979. Das Gehen mit Stockstütze - III. Kontrolle und Training
der maximalen Auftrittskräfte mit einer instrumentierten Stütze. Zeitschrift fur
Orthopadie und ihre Grenzgebiete, 118, pp.293-300.
Bergmann, G., Rohlmann & Graichen, F., 1989. In vivo Messung der
Hüftgelenkbelastung 1. Teil: Krankengymnastik. Z. Orthop., 127, pp.672-679.
Bragdon, C.R. et al., 1996. Differences in stiffness of the interface between a
cementless porous implant and cancellous bone in vivo in dogs due to varying
amounts of implant motion. The Journal of arthroplasty, 11(8), pp.945-951.
Brand, R.A. & Crowninshield, R.D., 1979. The effect of cane use on hip contact force.
Clinical Orthopaedics and Related Research, (147), pp.181-184.
Brumback, R.J. et al., 1999. Immediate Weight-Bearing After Treatment of a
Comminuted Fracture of the Femoral Shaft with a Statically Locked
Intramedullary Nail. The Journal of Bone and Joint Surgery, 81(11), pp.1538-
1544.
Buford, A. & Goswami, T., 2004. Review of wear mechanisms in hip implants: Paper I
– General. Materials & Design, 25(5), pp.385-393.
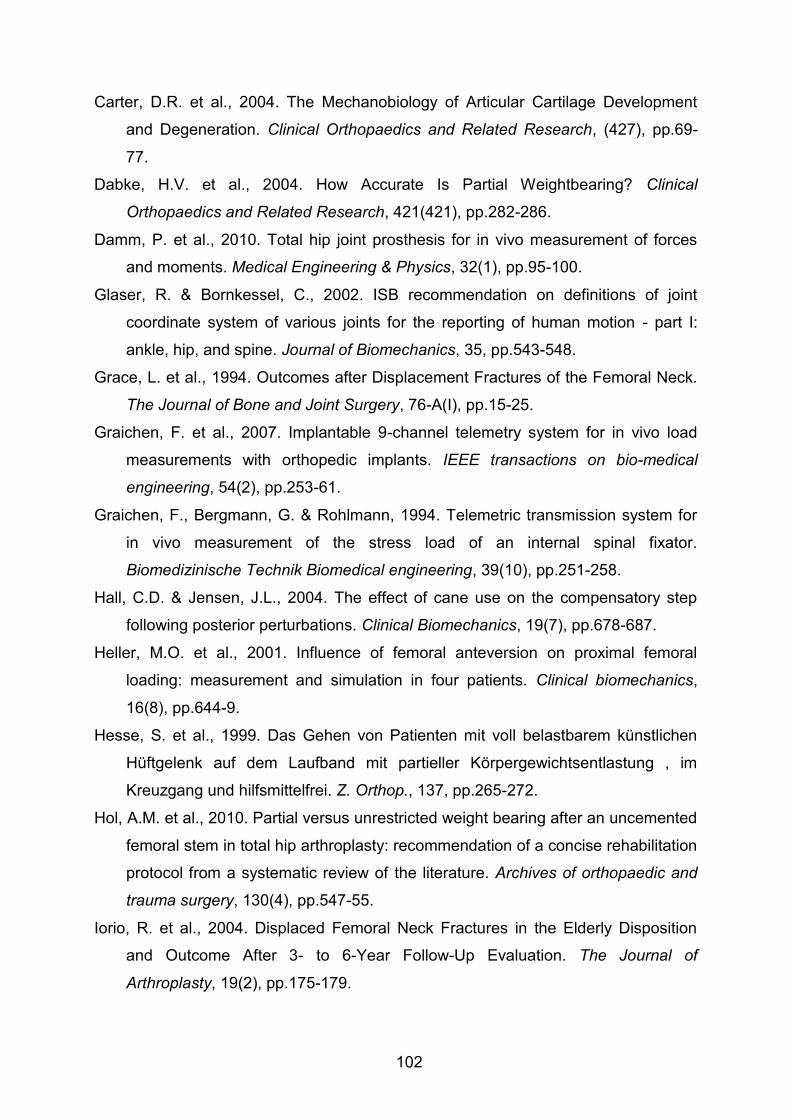
102
Carter, D.R. et al., 2004. The Mechanobiology of Articular Cartilage Development
and Degeneration. Clinical Orthopaedics and Related Research, (427), pp.69-
77.
Dabke, H.V. et al., 2004. How Accurate Is Partial Weightbearing? Clinical
Orthopaedics and Related Research, 421(421), pp.282-286.
Damm, P. et al., 2010. Total hip joint prosthesis for in vivo measurement of forces
and moments. Medical Engineering & Physics, 32(1), pp.95-100.
Glaser, R. & Bornkessel, C., 2002. ISB recommendation on definitions of joint
coordinate system of various joints for the reporting of human motion - part I:
ankle, hip, and spine. Journal of Biomechanics, 35, pp.543-548.
Grace, L. et al., 1994. Outcomes after Displacement Fractures of the Femoral Neck.
The Journal of Bone and Joint Surgery, 76-A(I), pp.15-25.
Graichen, F. et al., 2007. Implantable 9-channel telemetry system for in vivo load
measurements with orthopedic implants. IEEE transactions on bio-medical
engineering, 54(2), pp.253-61.
Graichen, F., Bergmann, G. & Rohlmann, 1994. Telemetric transmission system for
in vivo measurement of the stress load of an internal spinal fixator.
Biomedizinische Technik Biomedical engineering, 39(10), pp.251-258.
Hall, C.D. & Jensen, J.L., 2004. The effect of cane use on the compensatory step
following posterior perturbations. Clinical Biomechanics, 19(7), pp.678-687.
Heller, M.O. et al., 2001. Influence of femoral anteversion on proximal femoral
loading: measurement and simulation in four patients. Clinical biomechanics,
16(8), pp.644-9.
Hesse, S. et al., 1999. Das Gehen von Patienten mit voll belastbarem künstlichen
Hüftgelenk auf dem Laufband mit partieller Körpergewichtsentlastung , im
Kreuzgang und hilfsmittelfrei. Z. Orthop., 137, pp.265-272.
Hol, A.M. et al., 2010. Partial versus unrestricted weight bearing after an uncemented
femoral stem in total hip arthroplasty: recommendation of a concise rehabilitation
protocol from a systematic review of the literature. Archives of orthopaedic and
trauma surgery, 130(4), pp.547-55.
Iorio, R. et al., 2004. Displaced Femoral Neck Fractures in the Elderly Disposition
and Outcome After 3- to 6-Year Follow-Up Evaluation. The Journal of
Arthroplasty, 19(2), pp.175-179.

103
Jasty, M. et al., 1993. Comparison of bone ingrowth into cobalt chrome sphere and
titanium fiber mesh porous coated cementless canine acetabular components.
Journal of Biomedical Materials Research, 27, pp.639-644.
McDonough, A.L. & Razza-Doherty, M., 1988. Some biomechanical aspects of crutch
and cane walking: the relationship between forward rate of progression,
symmetry, and efficiency--a case report. Clinics in Podiatric Medicine and
Surgery, 5(3), pp.677-693.
McKellop, H. et al., 1991. Comparison of the stability of press-fit hip prosthesis
femoral stems using a synthetic model femur. Journal of Orthopaedic Research,
9, pp.297-305.
Mjöberg, B., Hansson, L.I. & Selvik, G., 1984. Instability of total hip prostheses at
rotational stress. Acta Orthop Scand, 55, pp.504-506.
Moran, C.G. et al., 2005. Early mortality after hip fracture: is delay before surgery
important? The Journal of bone and joint surgery., 87(3), pp.483-9. Available at:
http://www.ncbi.nlm.nih.gov/pubmed/15741611.
Neumann, D., 1999. An electromyographic study of the hip abductor muscles as
subjects with a hip prosthesis walked with different methods of using a cane and
carrying a load. Physical therapy, 79(12), pp.1163-76.
Neumann, D., 1998. Hip abductor muscle activity as subjects with hip prostheses
walk with different methods of using a cane. Physical Therapy, 78(5), pp.490-
501.
Nunn, D. et al., 1989. Torsional Stability of the Femoral Component of Hip
Arthroplasty. The Journal of Bone and Joint Surgery, 71B(3), pp.452-455.
Phillips, T.W., Nguyen, L.T. & Munro, S.D., 1991. Loosening of cementless femoral
stems: a biomechanical analysis of immediate fixation with loading vertical,
femur horizontal. Journal of Biomechanics, 24(1), pp.37-48.
Pilliar, R.M., Lee, J.M. & Maniatopoulos, C., 1986. Observations on the effect of
movement on bone ingrowth into porous-surfaced implants. Clinical
Orthopaedics and Related Research, 208(208), pp.108-113.
Recnik, G. et al., 2007. Higher peak contact hip stress predetermines the side of hip
involved in idiopathic osteoarthritis. Clinical Biomechanics, 22(10), pp.1119-24.
Roberts, S.E. & Goldacre, M.J., 2003. Time trends and demorgaphy of mortality after
fractured neck of femur in an English population , 1968-98: database study.
British Medical Journal, 327, pp.771-4.

104
Sonntag, D. et al., 2000. Gait with and without forearm crutches in patients with total
hip arthroplasty. International journal of rehabilitation research, 23(3), pp.233-
243.
Wehner, T. et al., 2010. Clinical Biomechanics Influence of the fixation stability on the
healing time — A numerical study of a patient-specific fracture healing process.
Clinical Biomechanics, 25, pp.606-612.

105
9. Summary of results
During walking the resultant contact force Fres had two peak values in all patients.
The first one occurs at the instant of contralateral toe off (CTO) and has a value of
248%BW on average. With 240%BW the second peak was slightly lower and
occurred at the contralateral heel strike (CHS). Fres was always higher than 35%BW
during the swing phase of the leg (Figure 1). In contrast to Fres, the measured friction
moment Mres increased nearly linearly during the whole extension phase, with the
minimum value at the ipsilateral heel strike (HS) and an average maximum of
0.26%BWm shortly after the contralateral heel strike (CHS) at (Figure 9.1).
Figure 9.1: Fres, Mres and µ during walking; average subject, 3 month pOP
The three-dimensional coefficient of friction µ also increased during the extension
phase, from 0.04 at CTO to 0.06 at CHS on average. During the flexion phase µ
further increased to a maximum of 0.14 at toe off (TO) of the ipsilateral leg. The
average friction-induced power throughout the whole gait cycle was 2.3W on
average.
However, the contact forces and friction moments varied greatly between individuals.
As a consequence, µ ranged from 0.03 to 0.06 at CTO and from 0.04 to 0.08 at CHS.
The absolute peak values of µ lay between 0.09 and 0.23. Similarly to µ, the peak
values of the friction-induced power varied between 1.4 W and 3.8 W. In seven out of

106
eight patients, the friction-induced power was greater during joint flexion than during
joint extension, between 4% and 290%. Only one patient returned a lower value for
friction-induced power during extension compared to joint flexion, with 21%.
See also publication: Friction in Total Hip Joint Prosthesis Measured In Vivo
during Walking DOI:10.1371/journal.pone.0078373
The pattern of the bending moment Mneck at the femur neck during walking was
nearly similar to that of the joint contact force, with two typical peak values. These
peak values had the same average height of 3.5%BWm and acted at nearly the
same times as those of Fres. The corresponding peak values of the torque Mstem
around the stem axis were on average 1.7%BWm at CTO and 0.5%BWm at CHS.
The second peak of Mstem was in all patients lower than the first one.
During walking with crutches the 2 peak values of Fres were reduced on average by
-16|-33% during 3-point gait, -11|-14% during 4-point gait, and -12|-14% during 2-
point gait. Related to joint contact force the bending moments in the implant neck at
the instants of the two force peaks were also reduced by crutches. The average
reductions were -19|-35% during a 3-point gait, -21|0% during 4-point gait, and -
10|+15% during 2-point gait. The corresponding reductions of the torque were 16%,
11%, and 12%, while the maximum torque decreased by 19%, 21%, and 10% on
average. However, the changes of torque and bending moments greatly depended
on the investigated subject as well as on the method of crutch use.
The reduction of the 2 maxima of Fres linearly depended on the synchronous
contralateral crutch force. Coefficients of determination (R²) of 0.65|0.75 were
calculated for 3-point gait, 0.74|0.62 for 4-point gait and 0.84|0.75 for 2-point gait.
The regression lines revealed that the first force peak was reduced by 6|9|13%BW
during 3-|4-|2-point gait if the contralateral force Fcrutch increased by 1%BW. For the
second peak of Fres, the reductions for each 1%BW of the crutch force increase were
6|11|12%BW.
The reductions of joint contact forces in comparison to walking without crutches were
highest during the first four weeks after surgery (Figure 9.2). One and four weeks
post surgery, respectively, the force maximum was 21% and 8% lower than it was
after three months. When compared to the initial values of the first week, crutch
forces decreased by 28% in the fourth week and by 38% in the third month. Average

107
reductions of the joint load by more than 20% are only achieved during the first four
weeks following surgery.
Figure 9.2: Resultant peak joint force and simultaneous contralateral crutch force
during 4-point gait over the post-operative time; average data from 7 subjects ±1 SD,
logarithmic regression curves (from publication “In vivo hip joint loads during three
methods of walking with forearm crutches”)
See also publication: In vivo hip joint loads during three methods of walking with
forearm crutches DOI: 10.1016/j.clinbiomech.2012.12.003
The measurements during different physiotherapeutic exercises have shown that the
joint contact forces Fres in all investigated patients were always lower than during
walking, except during pelvis lifting with support only by ipsilateral leg. During this
exercise the joint contact force was on average by up to 10% higher compared to
walking. The bending moment Mbend in the femoral neck also increased by about 10%
during this exercise. However, the peak torque value Mtorsin the implant-bone-
interface was comparable to the values during walking. Nevertheless, it was
observed that weight-bearing exercises caused the highest joint contact forces

108
among all exercises with peak values of up to 441%BW. During voluntary isometric
contractions, the peak loads ranged widely and potentially reached high levels,
depending on the intensity of the contraction. Furthermore, exercises with long lever
arms and dynamic exercises are able to cause hip joint loads with values up to 50%
higher than those during walking.
See also publication: In vivo hip joint loading during post-operative
physiotherapeutic exercises DOI:10.1371/journal.pone.0077807
109
10. Discussion
A previous study with only two patients [5] reported average hip contact forces during
walking which were up to 20% lower than observed now. In the previous study the
patients walked on a treadmill at 4 km/h, now they walked at 3.6 km/h on level
ground. Another previous study [13] also investigated hip joint loads during free
walking at velocities selected by the patient. In comparison to these in vivo
measurements the differences of hip joint peak loads were only 5% lower.
Throughout the swing phase of walking the lowest values of Fres lay between 35%BW
and 40%BW. This finding conflicts with a fluoroscopic study [14], which investigated
the separation of the hip joint surfaces in vivo. It was reported that the joint surfaces
of the unloaded leg separated with a displacement of 3.3mm on average during one-
legged stance. However, a separation involves a total unloading of the hip joint, an
effect which has never been observed in any of our patients. Because if this would
have happened, fast changes in the directions of the resultant contact force or one of
its components would have been observed during walking.
As part of our work the unloading effect of forearm crutches during three different
types of crutch use was investigated. Previous research on the possibility to reduce
hip joint loading by crutches was performed analytical methods. However, these
studies have shown large differences between the calculated load reductions.
Sonntag et al. reported a joint load reduction up to 15% [15]. In contrast to that, other
studies have postulated quite higher load reductions at the hip joint of up to 35% [16],
15-20% [17] and 30-40% [18]. Unfortunately, all studies calculated the unloading of
the hip joint only by indirect methods. In our study the hip joint load was measured in
vivo during walking with different methods of crutch use. During walking with 4-point
gait a maximum load reduction of 12% was measured. During 3-point gait the load
reduction joint was only 5% better. It was shown that during walking with only one
crutch used at the contralateral side (2-point gait), the load reduction of the hip joint
was similar to 4-point gait (12% vs 13%). These results indicate that the possibility of
forearm crutches to reduce hip joint loading is mostly overestimated.
For the physiotherapeutic exercises it was shown that weight-bearing activities
caused the highest loads. Furthermore, movements against resistance or loads
acting at long lever arms caused high torsional moments. The forces during isometric
contractions depend on the contraction intensity, which is rather influenced by the
110
personal motivation than by the maximal muscle strength. Certainly joint contact
forces during physiotherapeutic exercises can be increased by unexpected muscle
co-contractions. We conclude that when deciding between partial and full weight-
bearing exercises, physicians should consider the loads relative to those observed
during walking. The data presented here should be used to optimise physiotherapy
and post-operative treatment in order to enhance rehabilitation progress and
minimise critical loads onto the implant or the femoral neck.
The in vivo friction in artificial hip joints was now measured for the first time ever. It
could be shown that current state of the art hip simulators mimic the in vivo friction
conditions insufficiently. In many simulator studies the implants only moved in the
flexion-extension plane. It was now shown that the hip joint rotates around all axes
during walking. Therefore abduction and adduction of the joint also have a significant
influence on the friction conditions. Additionally, most in vitro friction studies applied a
sinusoidal contact force, which not represents the physiological loading conditions
with its two load peaks during walking.
Beside the possibility to measure friction in vivo in total hip joint replacements, it was
also possible for the first time to calculate the in vivo coefficient of friction during the
entire gait cycle. Because the hip joint moves around three axes during walking, the
coefficient of friction was calculated using a three-dimensional approach. For this, the
two-dimensional approach of Coulomb was used and transformed into a three-
dimensional approach. It could be ascertained that the coefficient of friction was not
constant during joint movement but almost linearly increased during walking from
heel strike to contralateral heel strike. During the extension phase the determined in
vivo coefficient of friction was nearly similar to the coefficients reported in previous
studies (0.02-0.06). This indicates that in vitro simulator studies provide realistic test
conditions during joint extension. However, when the joint movement changed from
extension into flexion, the in vivo coefficient of friction increased drastically with an
average peak of 0.14 around the instant of ipsilateral toe off. In previous studies,
similar high coefficients were only obtained for dry condition [19] with
ceramic/polyethylene as gliding partners. This let us assume that the lubrication of
artificial hip joints with ceramic/polyethylene changes in vivo from mixed to dry friction
condition. However, this effect has not been described in the literature to date. Thus,
it can be concluded that typical in vitro simulator studies are not able to confidently
describe the in vivo acting conditions during the flexion phase.

111
By using individual in vivo measured friction moments and corresponding coefficients
of friction, the friction-induced power caused by the friction force was determined for
each patient. This power heats up the implant. This temperature increase is
transferred to the surrounding tissue and may cause tissue damage, depending on
the final temperature. Potentially, loosening of the implant may be triggered. High
temperatures may also destroy the macromolecules of the synovia, resulting in a
further increase of joint friction.
The friction-induced power has shown a great variability between individuals.
Similarly inter-individual differences were observed in another study [20]. In these
study the friction induced heating of the total hip joint replacement was measured in
vivo during walking. Thus we hypothesize that the large variance of the friction-
induced power between the patients are eventually indicated by the individual
synovial properties. However, the running-in effects of the gliding partner may
depend on the individual physical activity levels of the patients and also attribute to
these differences. The running-in effects and the expected decrease of friction in the
joint over time following surgery will be part of a future study using the instrumented
“T-Implant” (see publication: “High-tech hip implant for wireless temperature
measurements in vivo” DOI:10.1371/journal.pone.0043489).

112
11. Conclusion
As part of the presented studies, in vivo joint loads and joint friction were measured
simultaneously for the first time worldwide. Despite the small number of subjects and
only one tribological pairing, this dataset presents an important scientific contribution
to the understanding of in vivo loading of artificial hip joints. This exceptional insight
into in vivo friction parameters of artificial hip joints will contribute to designing
realistic parameters for in vitro implant testing.
Friction variability between individuals will require further in vivo measurements within
a larger patient group as well as with different pairings. It is suggested to perform
such investigations with the presented ‘Hip Implant for Wireless Temperature
Measurements’ (see publication: "High-tech hip implant for wireless temperature
measurements in vivo" DOI:10.1371/journal.pone.0043489).

113
12. Reverences
[1] Huch K., Müller K. A. C., Stürmer T., Brenner H., Puhl W. et al.; „Sports
activities 5 years after total knee or hip arthroplasty: the Ulm Osteoarthritis
Study.”; Annals of the Rheumatic Diseases 64: 1715–1720; 2005
[2] Chatterji U., Ashworth M.J., Lewis P. L., Dobson P.J.; “Effect of total hip
arthroplasty on recreational and sporting activity”; ANZ journal of surgery 74:
446–449; 2004
[3] CJRR; “CJRR report: Total hip and total knee replacements in Canada”;
Canadian Institute for Health Information; 2008
[4] Paul J. P.; “The Biomechanics of the Hip-Joint and its Clinical Relevance”;
Proceedings of the Royal Society of Medicine, vol. 59, 943-48; 1966
[5] Bergmann G., Graichen F., and Rohlmann A.; “Hip joint loading during walking
and running, measured in two patients.”; Journal of Biomechanics, vol. 26, no.
8, 969–90; 1993
[6] Davy D. T., Kotzar G. M., Brown R. H., Heiple K. G., Goldberg V. M., Berilla J.,
and Burstein A. H.; “Telemetric force measurements across the hip after total
arthroplasty.”; The Journal of Bone and Joint Surgery, vol. 70, no. 1, 45–50;
1988
[7] Kotzar G. M., Davy D. T., Goldberg V. M., Heiple K. G., Berilla J., Heiple K. G.,
Brown R. H., and Burstein A. H.; “Telemeterized In Vivo Hip Joint Force Data -
A Report on Two Patients After Total Hip Surgery”; Journal of Orthopaedic
Research no. 21, 621-33; 1991
[8] Damm P., Graichen F., Rohlmann A., Bender A., Bergmann G.; "Total hip joint
prosthesis for in vivo measurement of forces and moments"; Medical
Engineering & Physics 32: 95–100; 2010
[9] Bergmann G., Graichen F., Rohlmann A., Westerhoff P., Heinlein B., et al.;
"Design and calibration of load sensing orthopaedic implants."; Journal of
Biomechanical Engineering 130; 2008
[10] Wu G., Siegler S., Allard P., Kirtley C., Leardini A., et al.; “ISB
recommendation on definitions of joint coordinate system of various joints for
the reporting of human motion - part I: ankle, hip, and spine.”; Journal of
Biomechanics 35: 543–548; 2002

114
[11] Bender A. and Bergmann G.; “Determination of typical patterns from strongly
varying signals.”; Computer Methods in Biomechanics and Biomedical
Engineering, vol. 15, no. 7, 761–9; 2012
[12] Damm P., Dymke J., Ackermann R., Bender A., Graichen F., Halder A., Beier
A,, Bergmann G.; “Friction in total hip joint prosthesis measured in vivo during
walking”, PLoS ONE 8(11): e78373. doi:10.1371/journal.pone.0078373
[13] Bergmann G., Deuretzbacher G., Heller M., Graichen F., Rohlmann A.,
Strauss J., and Duda G.; “Hip contact forces and gait patterns from routine
activities.”; Journal of Biomechanics, vol. 34, no. 7, 859–71; 2001
[14] Dennis D., Komistek R. D., Northcut E. J., Ochoa J., and Ritchie A.; “In vivo
determination of hip joint separation and the forces generated due to impact
loading conditions.”; Journal of Biomechanics, vol. 34, no. 5, 623–9; 2001
[15] Sonntag D., Uhlenbrock D., Bardeleben A., Kading M., and Hesse S.; “Gait
with and without forearm crutches in patients with total hip arthroplasty.”;
International Journal of Rehabilitation Research, vol. 23, no. 3, pp. 233–243;
2000
[16] Neumann D.; “An electromyographic study of the hip abductor muscles as
subjects with a hip prosthesis walked with different methods of using a cane
and carrying a load”; Physical Therapy, vol. 79, no. 12, 1163–76; 1999
[17] Bergmann G., Kölbel R., Rauschenbach N., and Rohlmann A.; “Walking with
canes and forearm-crutches. I. Reduction of loads at the hip and proximal end
of the femur by one sided use of cane/crutch (author’s transl)”; Zeitschrift für
Orthopädie und ihre Grenzgebiete, vol. 115, no. 2, 174–182; 1977
[18] Brand R. A. and Crowninshield R. D.; “The effect of cane use on hip contact
force.”; Clinical Orthopaedics and Related Research, no. 147, 181–184; 1979
[19] Xiong D. and Ge S.; “Friction and wear properties of UHMWPE/Al2O3 ceramic
under different lubricating conditions”; Wear, vol. 250, 242–245; 2001
[20] Bergmann G., Graichen F., Rohlmann A., Verdonschot N., Van Lenthe G.H.;
“Frictional heating of total hip implants. Part 1: Measurements in patients.”;
Journal of Biomechanics 34: 421–428; 2001

115
Statutory declaration
I hereby declare that I have authored this thesis independently, that I have not used
other than the declared sources / resources, and that I have explicitly marked all
material which has been quoted either literally or by content from the used sources.
This PhD thesis has not been submitted for conferral of degree elsewhere.
____________________________ ____________________________ Date and Location Signature
Eidesstattliche Erklärung
Hiermit versichere ich, dass ich die vorliegende Arbeit selbstständig verfasst und
keine anderen als die angegebenen Quellen und Hilfsmittel benutzt habe. Alle
Ausführungen, die anderen veröffentlichten oder nicht veröffentlichten Schriften
wörtlich oder sinngemäß entnommen wurden, habe ich kenntlich gemacht.
Die Arbeit hat in gleicher oder ähnlicher Fassung noch keiner anderen
Prüfungsbehörde vorgelegen.
____________________________ ____________________________ Ort, Datum Unterschrift

116
Declaration to the contribution of the publications
Total hip joint prosthesis for in vivo measurement of forces and moments
Damm P. , Graichen F., Rohlmann A., Bender A., Bergmann G.;
Medical Engineering & Physics 32; 2010: p. 95-100; Impact: 1.62
Contribution in detail: conception, development, certification and fabrication of the
implants, publication
High-tech hip implant for wireless temperature measurements in vivo
Bergmann G., Graichen F., Dymke J., Rohlmann A., Duda G.N., Damm P.;
PLoS ONE 7(8): e43489. doi:10.1371/journal.pone.0043489; Impact: 3.73
Contribution in detail: conception, development, certification and fabrication of the
implants, data ascertainment, analyses and interpretation
Friction in total hip joint prosthesis measured in vivo during walking
Damm P., Dymke J., Ackermann A., Bender A., Graichen G., Bergmann G.,
PLoS ONE 8(11): e78373. doi:10.1371/journal.pone.0078373; Impact: 3.73
Contribution in detail: conception, data ascertainment, analyses and interpretation,
publication
In vivo hip joint loading during post-operative physiotherapeutic exercises
Schwachmeyer V., Damm P., Bender A., Dymke J., Bergmann G.
PLoS ONE 8(10): e77807. doi:10.1371/journal.pone.0077807; Impact: 3.73
Contribution in detail: conception, data ascertainment, analyses and interpretation
In vivo hip joint loads during three methods of walking with forearm crutches
Damm P., Schwachmeyer V., Dymke J., Bender A., Bergmann G.
Clinical Biomechanics 28; 2013; 530-535; Impact: 1.869
Contribution in detail: conception, data ascertainment, analyses and interpretation,
publication

117
List of publications
Journals
1. Damm P., Graichen F., Rohlmann A., Bender A., Bergmann G.
Total hip joint prosthesis for in vivo measurement of forces and moments; Medical
Engineering & Physics 32; 2010: p. 95-100; DOI: 10.1016/j.medengphy.2009.10.003
2. Kutzner I., Damm P., Heinlein B., Dymke J., Graichen F., Bergmann G.
The effect of laterally wedged shoes on the loading of the medial knee
compartment - in vivo measurements with instrumented knee implants.
Journal of Orthopaedic Research, 2011: 29(12): p. 1910-1915;
DOI: 10.1002/jor.21477
3. Bergmann G., Graichen F., Dymke J., Rohlmann A., Duda G.N., Damm P. High-
tech hip implant for wireless temperature measurements in vivo
PLOS One; 7 (8) 2012; e43489; DOI:10.1371/journal.pone.0043489
4. Damm P., Schwachmeyer V., Dymke J., Bender A., Bergmann G.
In vivo hip joint loads during three methods of walking with forearm crutches;
Clinical Biomechanics 28; 2013; 530-535; DOI: 10.1016/j.clinbiomech.2012.12.003
5. Damm P., Dymke J., Ackermann A., Bender A., Graichen G., Bergmann G.
Friction in Total Hip Joint Prosthesis Measured In Vivo during Walking
PLoS ONE 8(11): e78373; DOI:10.1371/journal.pone.0078373
6. Schwachmeyer V., Damm P., Bender A., Dymke J., Bergmann G.
In vivo hip joint loading during post-operative physiotherapeutic exercises
PLOS ONE 8(10); 2013; e77807; DOI:10.1371/journal.pone.0077807
7. Rohlmann A., Schmidt H., Gast U., Kutzner I., Damm P., Bergmann G.
In vivo measurements of the effect of whole body vibration on spinal loads
European Spine Journal; 2013; DOI: 10.1007/s00586-013-3087-8
8. Asseln M., Eschweiler J., Damm P., Al Hares G., Bergmann G., Tingart M.,
Radermacher K.
Evaluation of biomechanical models for the planning of total hip arthroplasty
Biomedical Engineering (58); 2013; DOI: 10.1515/bmt-2013-4116
118
Congresses
1. Damm P., Graichen F., Rohlmann A., Bergmann G.; Frühbelastung ja/nein? -
Lockerung des Schaftes; AE-Dreiländerkurs Hüfte und Hüftrevision; 2009; Luzern;
Swiss
2. Damm P., Rohlmann A.; Graichen F.; Bender A., Bergmann G.; Entwicklung einer
instrumentierten Hüftendoprothese zur Messung der in vivo auftretenden Kräfte
und Momente; 6. Jahrestagung der Deutschen Gesellschaft für Biomechanik;
2009; Münster; Germany
3. Damm P.; Graichen, F.; Rohlmann, A.; Bender, A.; Bergmann, G.; An
instrumented total hip joint prosthesis for in vivo measurement of forces and
moment; 17th Congress of the European Society of Biomechanics; 2010;
Edinburgh, United Kingdom
4. Damm P.; Dymke J.; Bender A.; Graichen F.; Bergmann G. Hip Joint Loading
during Walking with Crutches; Science Based Prevention – CSSB Symposium;
2009; Berlin; Germany
5. Damm P., Bender A., Dymke J., Graichen F., Bergmann G.; Postoperative
Änderung der in vivo Hüftgelenksbelastung beim Gehen mit Gehstützen; 7.
Jahrestagung der Deutschen Gesellschaft für Biomechanik; 2011; Murnau
6. Damm P., Bender A., Dymke J., Halder A.M., Beier A., Bergmann G.; Belastung
von Hüftendoprothesen beim Gehen mit Gehstützen; Deutscher Kongress für
Orthopädie und Unfallchirurgie; 2011; Berlin; Germany
7. Damm P., Ackermann R., Bender A., Graichen F., Bergmann G., In-vivo
measurements of the friction moment in total hip joint replacement during walking;
18th Congress of the European Society of Biomechanics. 2012; Lisbon; Portugal
8. Damm P., Bergmann G., Biomechanics of the hip - In vivo hip joint loads during
different activities; 1st Instructional Course - Anatomical Hip Reconstruction in
Total Hip Arthroplasty; 2012; Zürich; Swiss
9. Damm P., Bergmann G.; Sport und Endoprothetik - In vivo Belastungsmessungen
am künstlichen Hüftgelenk bei sportlichen Aktivitäten; 3. Bergedorfer
Sportmedizin Symposium; 2012; Hamburg; Germany
10. Damm P., Bergmann G.; Mechanische Belastung der Gelenke - In vivo
Belastungsmessungen am künstlichen Hüftgelenk; Sportmedizin Symposium;
2012; Tübingen; Germany

119
11. Damm P., Dymke J., Schwachmeyer V., Bender A., Halder A., Beier A., Graichen
F., Bergmann G.; In vivo Hüftgelenkbelastung beim Sport; Deutscher Kongress
für Orthopädie und Unfallchirurgie; 2012; Berlin; Germany
12. Damm P., Dymke J., Bender A., Halder A., Beier A., Graichen F., Bergmann G.;
Belastung des künstlichen Hüftgelenkes bei sportlichen Aktivitäten; Endoprothetik
Kongress Berlin; 2012; Berlin; Germany
13. Damm P., Dymke J., Bender A., Halder A., Beier A., Graichen F., Bergmann G.;
Hip Joint Loading during Walking with Crutches; 13th Congress of European
Federation of National Association of Orthopaedics and Traumathology; 2012;
Berlin; Germany
14. Schwachmeyer V., Damm P., Bergmann G.; In vivo hip joint loading during post-
operative physiotherapeutic exercises; 59th Annual Meeting of the Orthopaedic
Research Society; 2013; San Antonio; USA
15. Damm P., Bender A., Graichen F., Bergmann G.; In vivo friction in total hip
replacement during walking; 59th Annual Meeting of the Orthopaedic Research
Society; 2013; San Antonio; USA
16. Damm P., Ackermann R., Bender A., Graichen F., Bergmann G.; Die in vivo
wirkende Reibung am künstlichen Hüftgelenk; Endoprothetik Kongress Berlin;
2013; Berlin; Germany
17. Damm P., Bender A., Bergmann G.; Die in vivo wirkende Reibung im künstlichen
Hüftgelenk; 8. Jahrestagung der Deutschen Gesellschaft für Biomechanik; 2013;
Neu-Ulm; Germany
18. Eschweiler J., Asseln M., Damm P., Al Hares G., Bergmann G., Tingart M.,
Radermacher K.; Evaluierung biomechanischer Hüftgelenksmodelle zur Planung
von Endoprothesenversorgungen; 8. Jahrestagung der Deutschen Gesellschaft
für Biomechanik; 2013; Neu-Ulm; Germany
19. Kutzner I., Damm P., Schulze H. , Bergmann G., Die Belastung des Knie- und
Hüftgelenks beim Vibrationstraining; 8. Jahrestagung der Deutschen Gesellschaft
für Biomechanik; 2013; Neu-Ulm; Germany
20. Eschweiler J., Asseln M., Damm P., Al Hares G., Bergmann G., Tingart M.,
Radermacher K.; Evaluation of Biomechanical Models for the Planning of Total
Hip Arthroplasty; Congress of the International Society for Computer Assisted
Orthopaedic Surgery; 2013; Lake Buena Vista; USA

120
21. Damm P., Bender A., Graichen F., Bergmann G.; In vivo measurements of friction
in total hip joint prostheses during walking 3 and 12 months post-operatively;
XXIV Congress of the international society of biomechanics; 2013; Natal; Brasil
22. Bergmann G., Bender A., Graichen F., Damm P.; Is insufficient joint lubrication a
co-factor for development and progression of arthrosis?; 19th Congress of the
European Society of Biomechanics; 2013; Patras; Greece
23. Damm P.; Bender A., Bergmann G., Influence of the resting period on the in vivo
friction in hip joint replacement; 19th Congress of the European Society of
Biomechanics; 2013; Patras; Greece
24. Damm P., Kutzner I., Schulze H., Bergmann G., Die Belastung der Hüft- und
Kniegelenke beim Vibrationstraining mit einem Galileo-2000-System; Deutscher
Kongress für Orthopädie und Unfallchirurgie; 2013; Berlin; Germany
25. Damm P., Bergmann G., In vivo Belastungsmessungen am künstlichen
Hüftgelenk; Kolloquium Biomedizinische Technik, Helmholtz-Institut für
Biomedizinische Technik der RWTH Aachen; 2013; Aachen; Germany
26. Damm P., Schwachmeyer V., Krump A., Dymke J., Bergmann G., In vivo
Hüftgelenkbelastungen beim Training an Fitnessgeräten, Endoprothetik Kongress
Berlin; 2014; Berlin; Germany
27. Damm P., Bender A., Bergmann G., Postoperative Änderung der in vivo Reibung
im künstlichen Hüftgelenk beim Fahrradfahren, Endoprothetik Kongress Berlin;
2014; Berlin; Germany
28. Schuster S., Bergmann G., Dymke J., Damm P., Die in vivo Hüftgelenkbelastung
beim Nordic Walking, Endoprothetik Kongress Berlin; 2014; Berlin; Germany
29. Schmuck D., Bergmann G., Dymke J., Damm P., Untersuchung des Einflusses
unterschiedlichen Schuhwerks auf die in vivo Hüftgelenksbelastung beim Gehen,
Endoprothetik Kongress Berlin; 2014; Berlin; Germany

121
Awards
2011
Young Investigator Award (2. Place)
7. Jahrestagung der Deutschen Gesellschaft für Biomechanik; Murnau; Germany
„Postoperative Änderung der in vivo Hüftgelenksbelastung beim Gehen mit
Gehstützen“
Damm P., Bender A., Dymke J., Graichen F., Bergmann G.
2012
ESB Clinical Biomechanics Award (nominated)
18th Congress of the European Society of Biomechanics; Lisbon; Portugal
“In-vivo measurements of the friction moment in total hip joint replacement during
walking”
Damm P., Ackermann R., Bender A., Graichen F., Bergmann G.,
2013
Poster Award
6. Endoprothetikkongress; Berlin, Germany
„Die in vivo wirkende Reibung am künstlichen Hüftgelenk“
Damm P., Ackermann R., Bender A., Graichen F., Bergmann G.
Best Experimental Study Award
8. Jahrestagung der Deutschen Gesellschaft für Biomechanik; Neu-Ulm; Germany
„Die Belastung des Knie- und Hüftgelenks beim Vibrationstraining“
Kutzner I., Damm P., Schulze H. , Bergmann G.


![Hip and Knee Replacements · 2 | [footer text here] 3 Outline The Basics of Hip and Knee Replacement What’s changed over the last decade - Longevity - Pain Management - Hospital](https://static.fdocuments.in/doc/165x107/603e5ddc1246d57e120683de/hip-and-knee-2-footer-text-here-3-outline-the-basics-of-hip-and-knee-replacement.jpg)