Loading Dependent Structural Model of Polymeric Micelles ...
28
doi.org/10.26434/chemrxiv.8943251.v1 Loading Dependent Structural Model of Polymeric Micelles by Solid-State NMR Ann-Christin Pöppler, Michael M Lübtow, Jonas Schlauersbach, Johannes Wiest, Lorenz Meinel, Robert Luxenhofer Submitted date: 17/07/2019 • Posted date: 17/07/2019 Licence: CC BY-NC-ND 4.0 Citation information: Pöppler, Ann-Christin; Lübtow, Michael M; Schlauersbach, Jonas; Wiest, Johannes; Meinel, Lorenz; Luxenhofer, Robert (2019): Loading Dependent Structural Model of Polymeric Micelles by Solid-State NMR. ChemRxiv. Preprint. Physically loaded polymeric micelles - from bulk properties to a molecular level understanding: In this work, solid-state NMR complemented by PXRD and quantum chemical calculations is used to learn about the short range order and structural arrangement in polymeric micelles formed by amphiphilic triblock copolymers. From changes in chemical shift and line widths, we could observe that at higher loadings, not just the micellar core but also the hydrophilic corona is involved in coordination of poorly soluble guest molecules, which can explain the poorer dissolution properties. This can serve as a platform for the future, targeted modification of such polymers. File list (1) download file view on ChemRxiv Loading dependent Structural Model of Polymeric Micelles ... (2.47 MiB)
Transcript of Loading Dependent Structural Model of Polymeric Micelles ...
doi.org/10.26434/chemrxiv.8943251.v1
Loading Dependent Structural Model of Polymeric Micelles bySolid-State NMRAnn-Christin Pöppler, Michael M Lübtow, Jonas Schlauersbach, Johannes Wiest, Lorenz Meinel, RobertLuxenhofer
Submitted date: 17/07/2019 • Posted date: 17/07/2019Licence: CC BY-NC-ND 4.0Citation information: Pöppler, Ann-Christin; Lübtow, Michael M; Schlauersbach, Jonas; Wiest, Johannes;Meinel, Lorenz; Luxenhofer, Robert (2019): Loading Dependent Structural Model of Polymeric Micelles bySolid-State NMR. ChemRxiv. Preprint.
Physically loaded polymeric micelles - from bulk properties to a molecular level understanding: In this work,solid-state NMR complemented by PXRD and quantum chemical calculations is used to learn about the shortrange order and structural arrangement in polymeric micelles formed by amphiphilic triblock copolymers.From changes in chemical shift and line widths, we could observe that at higher loadings, not just the micellarcore but also the hydrophilic corona is involved in coordination of poorly soluble guest molecules, which canexplain the poorer dissolution properties. This can serve as a platform for the future, targeted modification ofsuch polymers.
File list (1)
download fileview on ChemRxivLoading dependent Structural Model of Polymeric Micelles ... (2.47 MiB)

Loading dependent Structural Model of Polymeric Micelles by
Solid-State NMR
Ann-Christin Pöppler,* Michael M. Lübtow, Jonas Schlauersbach, Johannes Wiest, Lorenz Meinel, Robert
Luxenhofer
* to whom correspondence is to be addressed:
Jun.-Prof. Ann-Christin Pöppler
Institute of Organic Chemistry, University of Würzburg
Am Hubland, 97074 Würzburg, Germany
Email.: [email protected]
Abstract: Detailed insight into the internal structure of drug loaded polymeric micelles is scarce, but
important for developing optimized delivery systems. We observed that an increase in curcumin loading
of triblock copolymers based on poly(2-oxazolines) and poly(2-oxazines) results in poorer dissolution
properties. Using solid-state NMR and complementary tools we can propose a loading dependent
structural model on the molecular level providing an explanation for these pronounced differences.
Changes in the chemical shifts and the respective line widths give evidence for the involvement of the
hydrophobic polymer block in the curcumin coordination for low loadings, while for higher loadings an
increase in the interaction with the hydrophilic polymer blocks is observed. The involvement of the
hydrophilic compartment may be critical for ultra-high loaded polymer micelles and can help to rationalize
specific polymer modifications to improve the performance of similar drug delivery systems.
Only if molecular level understanding of polymer drug formulations is available, it is possible to make
targeted changes to the components with the aim to optimize physico-chemical properties. Ideally, drug
delivery platforms should carry large amounts of cargo, while simultaneously maintaining suitable stability
and efficient release. In practice, drug formulations such as solid dispersions or soluble drug delivery
systems (DDS) comprising polymeric micelles have attracted a lot of attention[1] and several made their
way onto the market in the form of drug delivery platforms, health care products and biomaterials.[2]
However, the large body of published reports on DDS is not mirrored by therapeutic advances and benefit
to the patient.[3] Complexity and reproducibility are important points to be considered for polymers in
nanomedicine.[4] A molecular level understanding of these combined “macromolecule/small molecule”
materials that would help to systematically address these points is difficult to obtain due to their complex
nature and the lack of long-range order. Therefore, the prevailing picture across literature for self-
assembled polymeric micelles encapsulating drug molecules is that of a well-defined core-shell particle,
where the hydrophobic core contains the drug molecules and the hydrophilic shell of the particle has a
protection and solubilisation function.[5] This image is dominated by the look from the outside. In this
context, the work of Callari et al. was inspirational, because they were amongst the first to analyse how
the structure of a polymer micelle might be affected by the presence of drug molecules.[6] Their study
shows that a higher loading reduces the cellular uptake and cytotoxicity in vitro, attributed to an increased
packing density of the particle. In this case, a glycopolymer with discrete anchoring points for the Pt-drug
was used. However, the majority of DDS is relying on physical encapsulation featuring less well-defined
interactions. For such physically loaded micelles, this effect – a decrease in dissolution with increasing drug
loading – is also well known.[7] Here, we utilize solid-state NMR in combination with complementary tools
to generate detailed insights into ultra-high drug loaded polymeric micelles on the molecular level to
understand the interplay between drug loading and the bulk properties, e.g. dissolution behaviour, of such
formulations. We envisage this structure-property relationship to act as a basis for defined and systematic
modifications on the way to get the best from both worlds in future development – high loading and high
release.
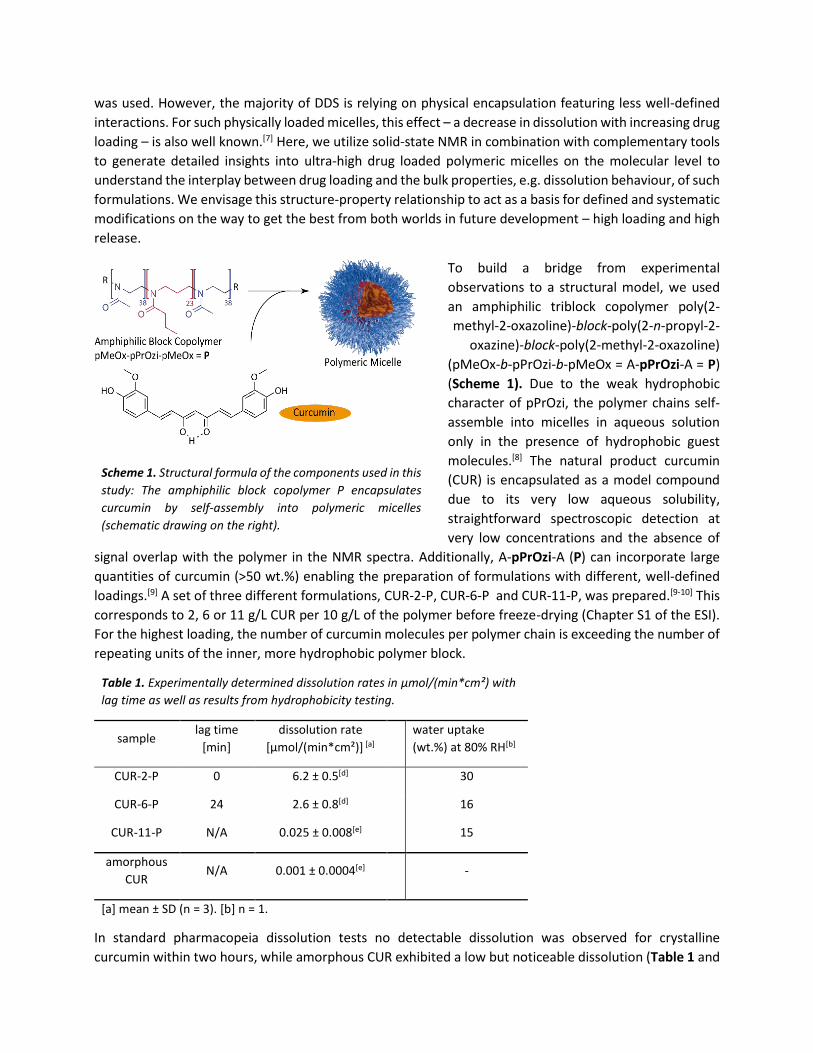
To build a bridge from experimental
observations to a structural model, we used
an amphiphilic triblock copolymer poly(2-
methyl-2-oxazoline)-block-poly(2-n-propyl-2-
oxazine)-block-poly(2-methyl-2-oxazoline)
(pMeOx-b-pPrOzi-b-pMeOx = A-pPrOzi-A = P)
(Scheme 1). Due to the weak hydrophobic
character of pPrOzi, the polymer chains self-
assemble into micelles in aqueous solution
only in the presence of hydrophobic guest
molecules.[8] The natural product curcumin
(CUR) is encapsulated as a model compound
due to its very low aqueous solubility,
straightforward spectroscopic detection at
very low concentrations and the absence of
signal overlap with the polymer in the NMR spectra. Additionally, A-pPrOzi-A (P) can incorporate large
quantities of curcumin (>50 wt.%) enabling the preparation of formulations with different, well-defined
loadings.[9] A set of three different formulations, CUR-2-P, CUR-6-P and CUR-11-P, was prepared.[9-10] This
corresponds to 2, 6 or 11 g/L CUR per 10 g/L of the polymer before freeze-drying (Chapter S1 of the ESI).
For the highest loading, the number of curcumin molecules per polymer chain is exceeding the number of
repeating units of the inner, more hydrophobic polymer block.
Table 1. Experimentally determined dissolution rates in μmol/(min*cm²) with
lag time as well as results from hydrophobicity testing.
sample lag time
[min]
dissolution rate
[μmol/(min*cm²)] [a]
water uptake
(wt.%) at 80% RH[b]
CUR-2-P 0 6.2 ± 0.5[d] 30
CUR-6-P 24 2.6 ± 0.8[d] 16
CUR-11-P N/A 0.025 ± 0.008[e] 15
amorphous
CUR N/A 0.001 ± 0.0004[e] -
[a] mean ± SD (n = 3). [b] n = 1.
In standard pharmacopeia dissolution tests no detectable dissolution was observed for crystalline
curcumin within two hours, while amorphous CUR exhibited a low but noticeable dissolution (Table 1 and
Scheme 1. Structural formula of the components used in this
study: The amphiphilic block copolymer P encapsulates
curcumin by self-assembly into polymeric micelles
(schematic drawing on the right).
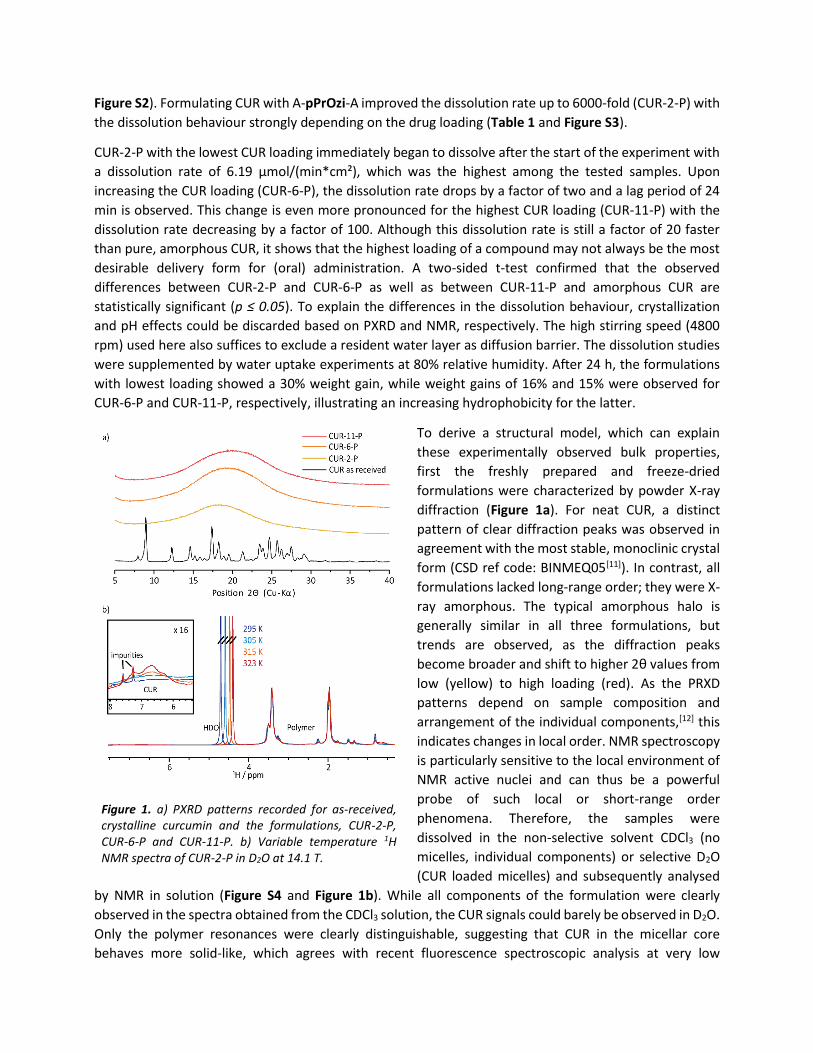
Figure S2). Formulating CUR with A-pPrOzi-A improved the dissolution rate up to 6000-fold (CUR-2-P) with
the dissolution behaviour strongly depending on the drug loading (Table 1 and Figure S3).
CUR-2-P with the lowest CUR loading immediately began to dissolve after the start of the experiment with
a dissolution rate of 6.19 μmol/(min*cm²), which was the highest among the tested samples. Upon
increasing the CUR loading (CUR-6-P), the dissolution rate drops by a factor of two and a lag period of 24
min is observed. This change is even more pronounced for the highest CUR loading (CUR-11-P) with the
dissolution rate decreasing by a factor of 100. Although this dissolution rate is still a factor of 20 faster
than pure, amorphous CUR, it shows that the highest loading of a compound may not always be the most
desirable delivery form for (oral) administration. A two-sided t-test confirmed that the observed
differences between CUR-2-P and CUR-6-P as well as between CUR-11-P and amorphous CUR are
statistically significant (p ≤ 0.05). To explain the differences in the dissolution behaviour, crystallization
and pH effects could be discarded based on PXRD and NMR, respectively. The high stirring speed (4800
rpm) used here also suffices to exclude a resident water layer as diffusion barrier. The dissolution studies
were supplemented by water uptake experiments at 80% relative humidity. After 24 h, the formulations
with lowest loading showed a 30% weight gain, while weight gains of 16% and 15% were observed for
CUR-6-P and CUR-11-P, respectively, illustrating an increasing hydrophobicity for the latter.
To derive a structural model, which can explain
these experimentally observed bulk properties,
first the freshly prepared and freeze-dried
formulations were characterized by powder X-ray
diffraction (Figure 1a). For neat CUR, a distinct
pattern of clear diffraction peaks was observed in
agreement with the most stable, monoclinic crystal
form (CSD ref code: BINMEQ05[11]). In contrast, all
formulations lacked long-range order; they were X-
ray amorphous. The typical amorphous halo is
generally similar in all three formulations, but
trends are observed, as the diffraction peaks
become broader and shift to higher 2θ values from
low (yellow) to high loading (red). As the PRXD
patterns depend on sample composition and
arrangement of the individual components,[12] this
indicates changes in local order. NMR spectroscopy
is particularly sensitive to the local environment of
NMR active nuclei and can thus be a powerful
probe of such local or short-range order
phenomena. Therefore, the samples were
dissolved in the non-selective solvent CDCl3 (no
micelles, individual components) or selective D2O
(CUR loaded micelles) and subsequently analysed
by NMR in solution (Figure S4 and Figure 1b). While all components of the formulation were clearly
observed in the spectra obtained from the CDCl3 solution, the CUR signals could barely be observed in D2O.
Only the polymer resonances were clearly distinguishable, suggesting that CUR in the micellar core
behaves more solid-like, which agrees with recent fluorescence spectroscopic analysis at very low
Figure 1. a) PXRD patterns recorded for as-received, crystalline curcumin and the formulations, CUR-2-P, CUR-6-P and CUR-11-P. b) Variable temperature 1H NMR spectra of CUR-2-P in D2O at 14.1 T.
loadings.[13] Increasing the mobility of the overall system by increasing the temperature resulted in
narrower linewidths for the CUR signals, but they remained very broad features (Figure 1b, inset). This
hampers the detailed analysis of proximities and intermolecular interactions. Diffusion (DOSY) NMR
measurements of the three formulations in solution yielded diffusion coefficients and thus approximated
radii, which agree very well with previously determined values from dynamic light scattering (DLS, Table
S2).[9] This shows that information on the size and exterior of these micelles is readily available, while
information on the molecular arrangement of and within the micellar core is more difficult to obtain.
Therefore, we turned our attention to
solid-state NMR, which has been
shown to be a very powerful analytical
technique in the pharmaceutical
context studying amorphous dosage
forms in general[14] and which is
particularly sensitive to intermolecular
interactions and subtle change in the
local arrangement. Freeze-dried
formulations were subjected to 1H and 13C CP/MAS NMR experiments at
24 kHz MAS and 14.1 T. To ensure
sample stability upon MAS, the 1H NMR
was observed at different times and
PXRD was measured after completion
of the NMR experiments (Figures S8b).
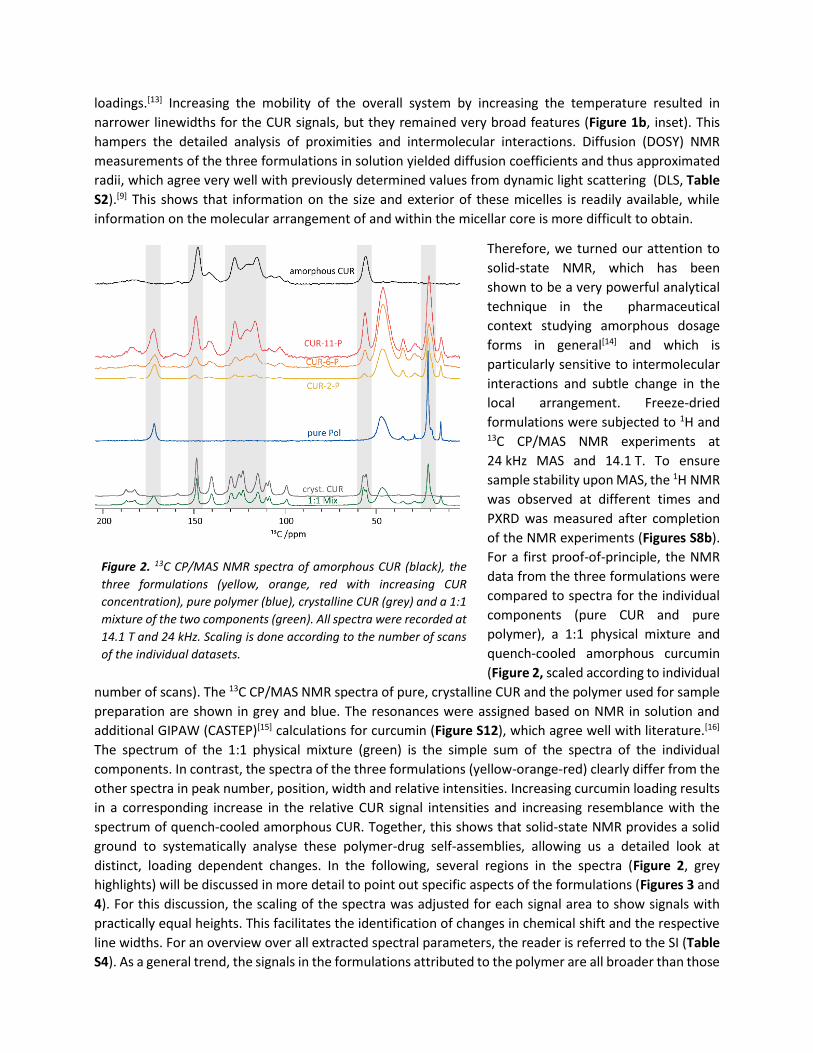
For a first proof-of-principle, the NMR
data from the three formulations were
compared to spectra for the individual
components (pure CUR and pure
polymer), a 1:1 physical mixture and
quench-cooled amorphous curcumin
(Figure 2, scaled according to individual
number of scans). The 13C CP/MAS NMR spectra of pure, crystalline CUR and the polymer used for sample
preparation are shown in grey and blue. The resonances were assigned based on NMR in solution and
additional GIPAW (CASTEP)[15] calculations for curcumin (Figure S12), which agree well with literature.[16]
The spectrum of the 1:1 physical mixture (green) is the simple sum of the spectra of the individual
components. In contrast, the spectra of the three formulations (yellow-orange-red) clearly differ from the
other spectra in peak number, position, width and relative intensities. Increasing curcumin loading results
in a corresponding increase in the relative CUR signal intensities and increasing resemblance with the
spectrum of quench-cooled amorphous CUR. Together, this shows that solid-state NMR provides a solid
ground to systematically analyse these polymer-drug self-assemblies, allowing us a detailed look at
distinct, loading dependent changes. In the following, several regions in the spectra (Figure 2, grey
highlights) will be discussed in more detail to point out specific aspects of the formulations (Figures 3 and
4). For this discussion, the scaling of the spectra was adjusted for each signal area to show signals with
practically equal heights. This facilitates the identification of changes in chemical shift and the respective
line widths. For an overview over all extracted spectral parameters, the reader is referred to the SI (Table
S4). As a general trend, the signals in the formulations attributed to the polymer are all broader than those
Figure 2. 13C CP/MAS NMR spectra of amorphous CUR (black), the
three formulations (yellow, orange, red with increasing CUR
concentration), pure polymer (blue), crystalline CUR (grey) and a 1:1
mixture of the two components (green). All spectra were recorded at
14.1 T and 24 kHz. Scaling is done according to the number of scans
of the individual datasets.
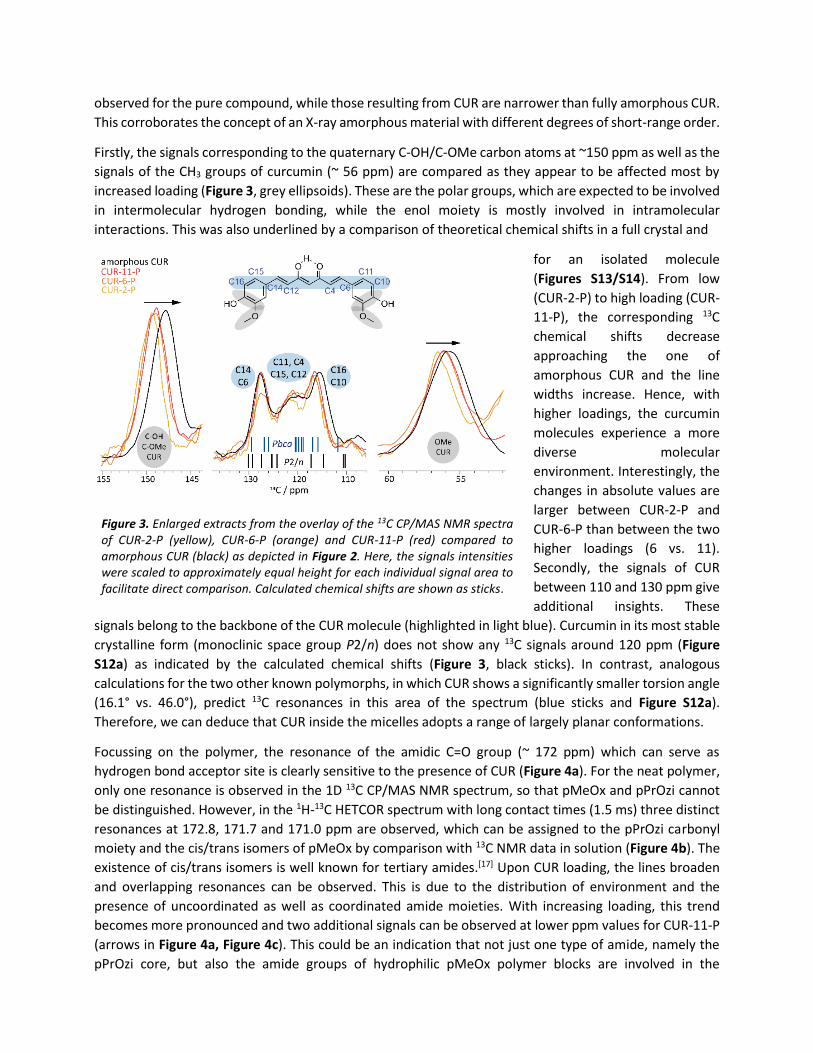
observed for the pure compound, while those resulting from CUR are narrower than fully amorphous CUR.
This corroborates the concept of an X-ray amorphous material with different degrees of short-range order.
Firstly, the signals corresponding to the quaternary C-OH/C-OMe carbon atoms at ~150 ppm as well as the
signals of the CH3 groups of curcumin (~ 56 ppm) are compared as they appear to be affected most by
increased loading (Figure 3, grey ellipsoids). These are the polar groups, which are expected to be involved
in intermolecular hydrogen bonding, while the enol moiety is mostly involved in intramolecular
interactions. This was also underlined by a comparison of theoretical chemical shifts in a full crystal and
for an isolated molecule
(Figures S13/S14). From low
(CUR-2-P) to high loading (CUR-
11-P), the corresponding 13C
chemical shifts decrease
approaching the one of
amorphous CUR and the line
widths increase. Hence, with
higher loadings, the curcumin
molecules experience a more
diverse molecular
environment. Interestingly, the
changes in absolute values are
larger between CUR-2-P and
CUR-6-P than between the two
higher loadings (6 vs. 11).
Secondly, the signals of CUR
between 110 and 130 ppm give
additional insights. These
signals belong to the backbone of the CUR molecule (highlighted in light blue). Curcumin in its most stable
crystalline form (monoclinic space group P2/n) does not show any 13C signals around 120 ppm (Figure
S12a) as indicated by the calculated chemical shifts (Figure 3, black sticks). In contrast, analogous
calculations for the two other known polymorphs, in which CUR shows a significantly smaller torsion angle
(16.1° vs. 46.0°), predict 13C resonances in this area of the spectrum (blue sticks and Figure S12a).
Therefore, we can deduce that CUR inside the micelles adopts a range of largely planar conformations.
Focussing on the polymer, the resonance of the amidic C=O group (~ 172 ppm) which can serve as
hydrogen bond acceptor site is clearly sensitive to the presence of CUR (Figure 4a). For the neat polymer,
only one resonance is observed in the 1D 13C CP/MAS NMR spectrum, so that pMeOx and pPrOzi cannot
be distinguished. However, in the 1H-13C HETCOR spectrum with long contact times (1.5 ms) three distinct
resonances at 172.8, 171.7 and 171.0 ppm are observed, which can be assigned to the pPrOzi carbonyl
moiety and the cis/trans isomers of pMeOx by comparison with 13C NMR data in solution (Figure 4b). The
existence of cis/trans isomers is well known for tertiary amides.[17] Upon CUR loading, the lines broaden
and overlapping resonances can be observed. This is due to the distribution of environment and the
presence of uncoordinated as well as coordinated amide moieties. With increasing loading, this trend
becomes more pronounced and two additional signals can be observed at lower ppm values for CUR-11-P
(arrows in Figure 4a, Figure 4c). This could be an indication that not just one type of amide, namely the
pPrOzi core, but also the amide groups of hydrophilic pMeOx polymer blocks are involved in the
Figure 3. Enlarged extracts from the overlay of the 13C CP/MAS NMR spectra of CUR-2-P (yellow), CUR-6-P (orange) and CUR-11-P (red) compared to amorphous CUR (black) as depicted in Figure 2. Here, the signals intensities were scaled to approximately equal height for each individual signal area to facilitate direct comparison. Calculated chemical shifts are shown as sticks.
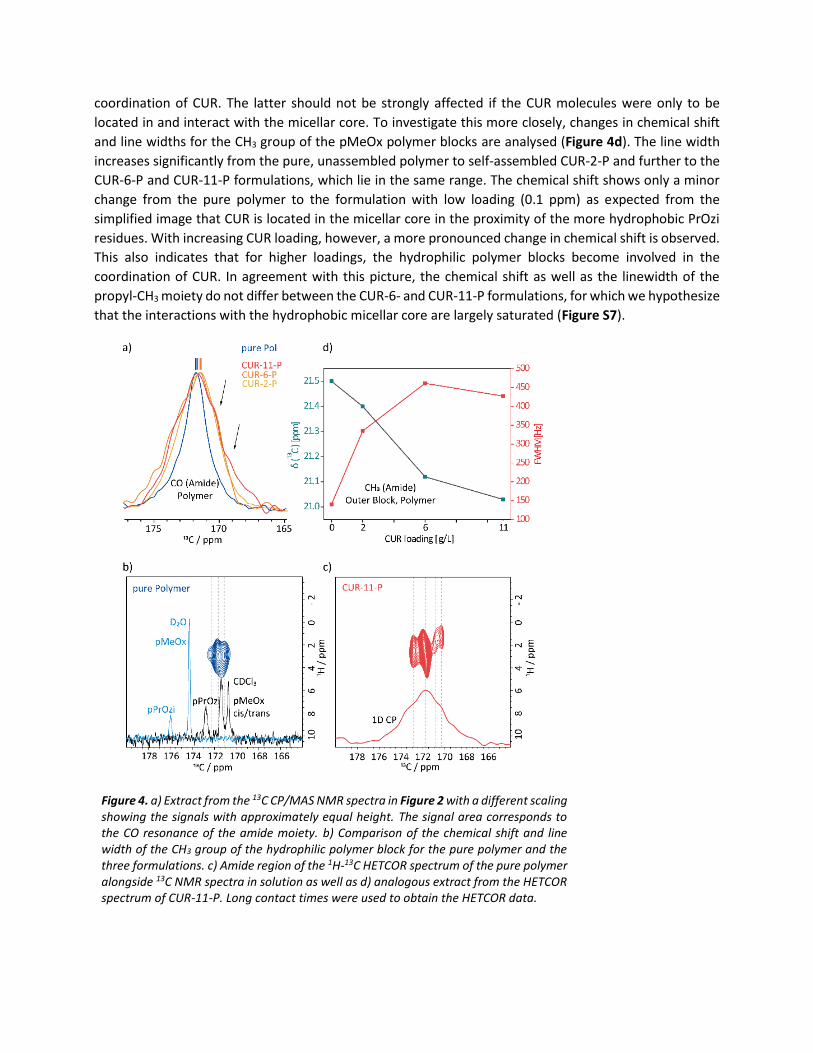
coordination of CUR. The latter should not be strongly affected if the CUR molecules were only to be
located in and interact with the micellar core. To investigate this more closely, changes in chemical shift
and line widths for the CH3 group of the pMeOx polymer blocks are analysed (Figure 4d). The line width
increases significantly from the pure, unassembled polymer to self-assembled CUR-2-P and further to the
CUR-6-P and CUR-11-P formulations, which lie in the same range. The chemical shift shows only a minor
change from the pure polymer to the formulation with low loading (0.1 ppm) as expected from the
simplified image that CUR is located in the micellar core in the proximity of the more hydrophobic PrOzi
residues. With increasing CUR loading, however, a more pronounced change in chemical shift is observed.
This also indicates that for higher loadings, the hydrophilic polymer blocks become involved in the
coordination of CUR. In agreement with this picture, the chemical shift as well as the linewidth of the
propyl-CH3 moiety do not differ between the CUR-6- and CUR-11-P formulations, for which we hypothesize
that the interactions with the hydrophobic micellar core are largely saturated (Figure S7).
Figure 4. a) Extract from the 13C CP/MAS NMR spectra in Figure 2 with a different scaling showing the signals with approximately equal height. The signal area corresponds to the CO resonance of the amide moiety. b) Comparison of the chemical shift and line width of the CH3 group of the hydrophilic polymer block for the pure polymer and the three formulations. c) Amide region of the 1H-13C HETCOR spectrum of the pure polymer alongside 13C NMR spectra in solution as well as d) analogous extract from the HETCOR spectrum of CUR-11-P. Long contact times were used to obtain the HETCOR data.
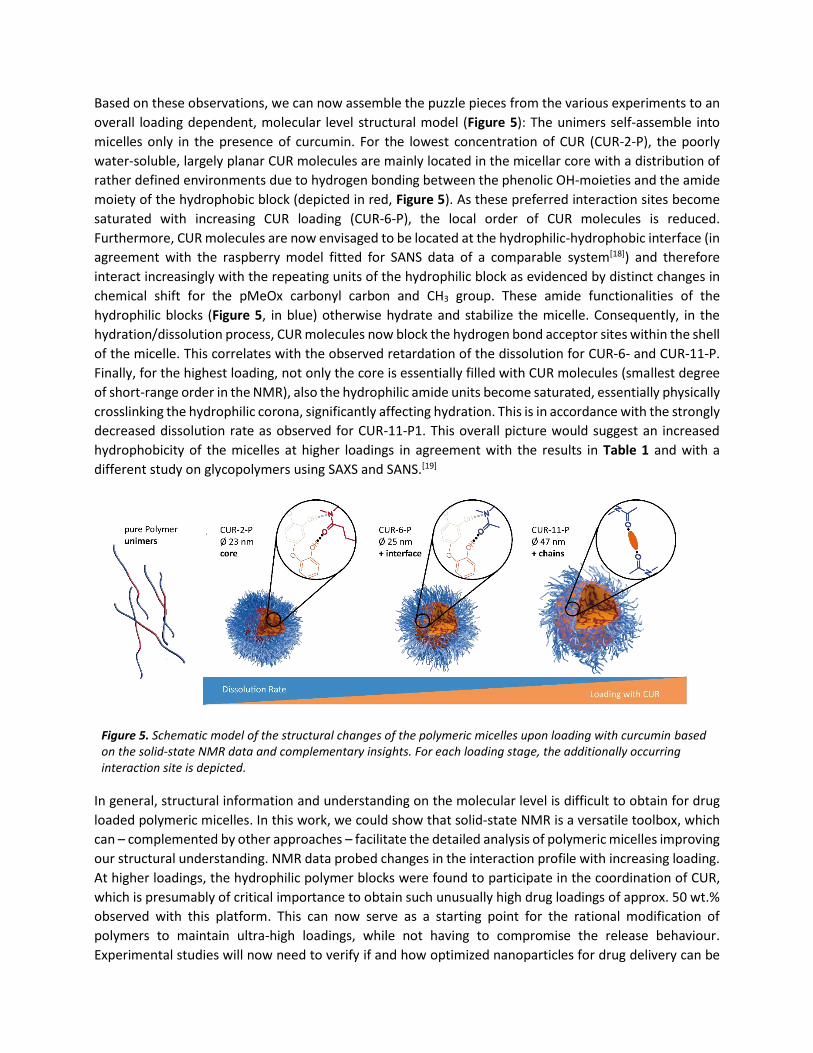
Based on these observations, we can now assemble the puzzle pieces from the various experiments to an
overall loading dependent, molecular level structural model (Figure 5): The unimers self-assemble into
micelles only in the presence of curcumin. For the lowest concentration of CUR (CUR-2-P), the poorly
water-soluble, largely planar CUR molecules are mainly located in the micellar core with a distribution of
rather defined environments due to hydrogen bonding between the phenolic OH-moieties and the amide
moiety of the hydrophobic block (depicted in red, Figure 5). As these preferred interaction sites become
saturated with increasing CUR loading (CUR-6-P), the local order of CUR molecules is reduced.
Furthermore, CUR molecules are now envisaged to be located at the hydrophilic-hydrophobic interface (in
agreement with the raspberry model fitted for SANS data of a comparable system[18]) and therefore
interact increasingly with the repeating units of the hydrophilic block as evidenced by distinct changes in
chemical shift for the pMeOx carbonyl carbon and CH3 group. These amide functionalities of the
hydrophilic blocks (Figure 5, in blue) otherwise hydrate and stabilize the micelle. Consequently, in the
hydration/dissolution process, CUR molecules now block the hydrogen bond acceptor sites within the shell
of the micelle. This correlates with the observed retardation of the dissolution for CUR-6- and CUR-11-P.
Finally, for the highest loading, not only the core is essentially filled with CUR molecules (smallest degree
of short-range order in the NMR), also the hydrophilic amide units become saturated, essentially physically
crosslinking the hydrophilic corona, significantly affecting hydration. This is in accordance with the strongly
decreased dissolution rate as observed for CUR-11-P1. This overall picture would suggest an increased
hydrophobicity of the micelles at higher loadings in agreement with the results in Table 1 and with a
different study on glycopolymers using SAXS and SANS.[19]
Figure 5. Schematic model of the structural changes of the polymeric micelles upon loading with curcumin based on the solid-state NMR data and complementary insights. For each loading stage, the additionally occurring interaction site is depicted.
In general, structural information and understanding on the molecular level is difficult to obtain for drug
loaded polymeric micelles. In this work, we could show that solid-state NMR is a versatile toolbox, which
can – complemented by other approaches – facilitate the detailed analysis of polymeric micelles improving
our structural understanding. NMR data probed changes in the interaction profile with increasing loading.
At higher loadings, the hydrophilic polymer blocks were found to participate in the coordination of CUR,
which is presumably of critical importance to obtain such unusually high drug loadings of approx. 50 wt.%
observed with this platform. This can now serve as a starting point for the rational modification of
polymers to maintain ultra-high loadings, while not having to compromise the release behaviour.
Experimental studies will now need to verify if and how optimized nanoparticles for drug delivery can be

obtained through this approach. Additionally, the NMR experiments used here can be expanded by high-
resolution proton-detected correlations at fast MAS, which should be even more sensitive to the
underlying key intermolecular interactions. This would allow the drawing of an even more accurate picture
for this and other drug-polymer arrangements. A systematic investigation by varying both polymer and
guest molecules potentially also employing isotopic labelling schemes is necessary to, for example, explain
extremely different loading efficiencies observed for structurally similar polymers.[9, 20] Moreover,
exploration of the complementary insights from pair-distribution functions based on PXRD or probing the
internal micellar structure by SANS should also be very valuable to learn more about these interesting
systems.
Acknowledgements
We thank Prof. Roland Mitric for access to his workgroup cluster for the GIAPW (CASTEP) calculations and
in particular to Matthias Wohlgemuth for helping us with the setup of the program package. We thank Dr.
Matthias Grüne for helpful and stimulating discussions. We further thank Dominik Heuler for his support
with the PXRD measurements and Malik Salman Haider for sharing his experience with respect to quench-
cooling of curcumin. Marvin Grüne and Tessa Lühmann are acknowledged for discussion and proof
reading. Financial support from the Fonds der Chemischen Industrie (FCI) in form of a material cost
allowance is acknowledged (A.-C. P.). M. M. L thanks the Evonik Foundation for providing a doctoral
fellowship. Both experimental NMR and calculated data for this study will be available through archivexxx.
Keywords: Solid-state NMR • Micelles • Polymers • Dissolution rates • Short-range order
[1] a) R. Duncan, Nat. Rev. Drug Discov. 2003, 2, 347-360; b) Y. Huang, W.-G. Dai, Acta Pharm. Sin. B.
2014, 4, 18-25; c) G. S. Kwon, K. Kataoka, Adv. Drug Delivery Rev. 2012, 64, 237-245; d) H. Cabral,
K. Kataoka, J. Control. Release 2014, 190, 465-476.
[2] a) V. Wagner, A. Dullaart, A.-K. Bock, A. Zweck, Nat Biotech 2006, 24, 1211-1217; b) N. Kamaly, Z.
Xiao, P. M. Valencia, A. F. Radovic-Moreno, O. C. Farokhzad, Chem. Soc. Rev. 2012, 41, 2971-3010.
[3] J.-C. Leroux, Angew. Chem. Int. Ed. 2017, 56, 15170-15171.
[4] R. Luxenhofer, Nanomedicine 2015, 10, 3109-3119.
[5] a) H. Chen, S. Kim, L. Li, S. Wang, K. Park, J.-X. Cheng, Proc. Natl. Acad. Sci. 2008, 105, 6596-6601;
b) H. Cho, T. C. Lai, K. Tomoda, G. S. Kwon, AAPS PharmSciTech 2014, 16, 10-20; c) Y. T. Tam, J.
Gao, G. S. Kwon, J. Am. Chem. Soc. 2016, 138, 8674-8677; d) H. Cabral, K. Miyata, K. Osada, K.
Kataoka, Chem. Rev. 2018, 118, 6844-6892.
[6] M. Callari, P. L. De Souza, A. Rawal, M. H. Stenzel, Angew. Chem. Int. Ed. Engl. 2017, 56, 8441-8445.
[7] a) R. Gref, Y. Minamitake, M. T. Peracchia, V. Trubetskoy, V. Torchilin, R. Langer, Science 1994, 263,
1600; b) M. Polakovič, T. Görner, R. Gref, E. Dellacherie, J. Control. Release 1999, 60, 169-177.
[8] M. M. Lübtow, L. C. Nelke, J. Seifert, J. Kühnemundt, G. Sahay, G. Dandekar, S. L. Nietzer, R.
Luxenhofer, J. Control. Release 2019, 303, 162-180.
[9] M. M. Lübtow, L. Hahn, M. S. Haider, R. Luxenhofer, J. Am. Chem. Soc. 2017, 139, 10980-10983.

[10] R. Luxenhofer, A. Schulz, C. Roques, S. Li, T. K. Bronich, E. V. Batrakova, R. Jordan, A. V. Kabanov,
Biomaterials 2010, 31, 4972-4979.
[11] P. Sanphui, N. R. Goud, U. B. R. Khandavilli, S. Bhanoth, A. Nangia, Chem. Commun. 2011, 47, 5013-
5015.
[12] S. Bates, G. Zografi, D. Engers, K. Morris, K. Crowley, A. Newman, Pharm. Res. 2006, 23, 2333-2349.
[13] M. M. Lübtow, H. Marciniak, A. Schmiedel, M. Roos, C. Lambert, R. Luxenhofer, Chemistry – A
European Journal, just accepted.
[14] a) R. Lefort, A. De Gusseme, J. F. Willart, F. Danède, M. Descamps, Int. J. Pharm. 2004, 280, 209-
219; b) T. N. Pham, S. A. Watson, A. J. Edwards, M. Chavda, J. S. Clawson, M. Strohmeier, F. G.
Vogt, Mol. Pharm. 2010, 7, 1667-1691; c) J. Brus, M. Urbanova, I. Sedenkova, H. Brusova, Int. J.
Pharm. 2011, 409, 62-74.
[15] a) C. J. Pickard, F. Mauri, Phys. Rev. B 2001, 63, 245101; b) S. J. Clark, M. D. Segall, C. J. Pickard, P.
J. Hasnip, M. I. J. Probert, K. Refson, M. C. Payne, Z. Kristallogr. 2005, 220, 567; c) J. R. Yates, C. J.
Pickard, F. Mauri, Phys. Rev. B 2007, 76, 024401.
[16] X. Kong, A. Brinkmann, V. Terskikh, R. E. Wasylishen, G. M. Bernard, Z. Duan, Q. Wu, G. Wu, J. Phys.
Chem. B 2016, 120, 11692-11704.
[17] a) M. Sisido, Y. Imanishi, T. Higashimura, Biopolymers 1972, 11, 399-408; b) Q. Sui, D. Borchardt,
D. L. Rabenstein, J. Am. Chem. Soc. 2007, 129, 12042-12048; c) B. C. Gorske, J. R. Stringer, B. L.
Bastian, S. A. Fowler, H. E. Blackwell, J. Am. Chem. Soc. 2009, 131, 16555-16567.
[18] A. Schulz, S. Jaksch, R. Schubel, E. Wegener, Z. Di, Y. Han, A. Meister, J. Kressler, A. V. Kabanov, R.
Luxenhofer, C. M. Papadakis, R. Jordan, ACS Nano 2014, 8, 2686-2696.
[19] C. Cao, J. Zhao, F. Chen, M. Lu, Y. Y. Khine, A. Macmillan, C. J. Garvey, M. H. Stenzel, Chem. Mater.
2018, 30, 5227-5236.
[20] M. M. Lübtow, L. Keßler, A. Appelt-Menzel, T. Lorson, N. Gangloff, M. Kirsch, S. Dahms, R.
Luxenhofer, Macromol. Biosci. 2018, 18, 1800155.
S1
Supporting Information
Loading dependent Structural Model of Polymeric Micelles
by Solid-State NMR
Ann-Christin Pöppler,* Michael M. Lübtow, Jonas Schlauersbach, Johannes Wiest, Lorenz Meinel, Robert Luxenhofer
* to whom correspondence is to be addressed:
Jun.-Prof. Ann-Christin Pöppler
Institute of Organic Chemistry, University of Würzburg
Am Hubland, 97074 Würzburg, Germany
Email.: [email protected]
Content:
S1. Preparation of the CUR-Polymer Formulations S2
S2. Dissolution Tests S2
S3. Hygroscopicity S5
S4. Characterization of the Formulations by NMR in Solution S6
S5. Characterization by Multinuclear solid-state NMR S8
S6. Characterization of the Formulations by Powder X-ray diffraction S11
S7. CASTEP Calculations S13
S8. References S17
S2
S1. Preparation of the CUR-Polymer Formulations
Curcumin (CUR) powder from Curcuma longa (Tumeric) was purchased from Sigma-Aldrich and used
as received. The polymer, poly(2-methyl-2-oxazoline)-block-poly(2-n-propyl-2-oxazine)-block-poly(2-
methyl-2-oxazoline) (PMeOx-b-PPrOzi-b-PMeOx ≡ A-pPrOzi-A ≡ P), was synthesized via living cationic
ring-opening polymerization and characterized as described in detail in the literature.[1] This
amphiphilic block-co-polymer forms micelles in the presence of guests in aqueous solution. The
formulations with CUR were prepared using the thin film method as described in the same and
previous work of this group.[1-2] Three different formulations with defined CUR loadings were prepared
(Table S1).
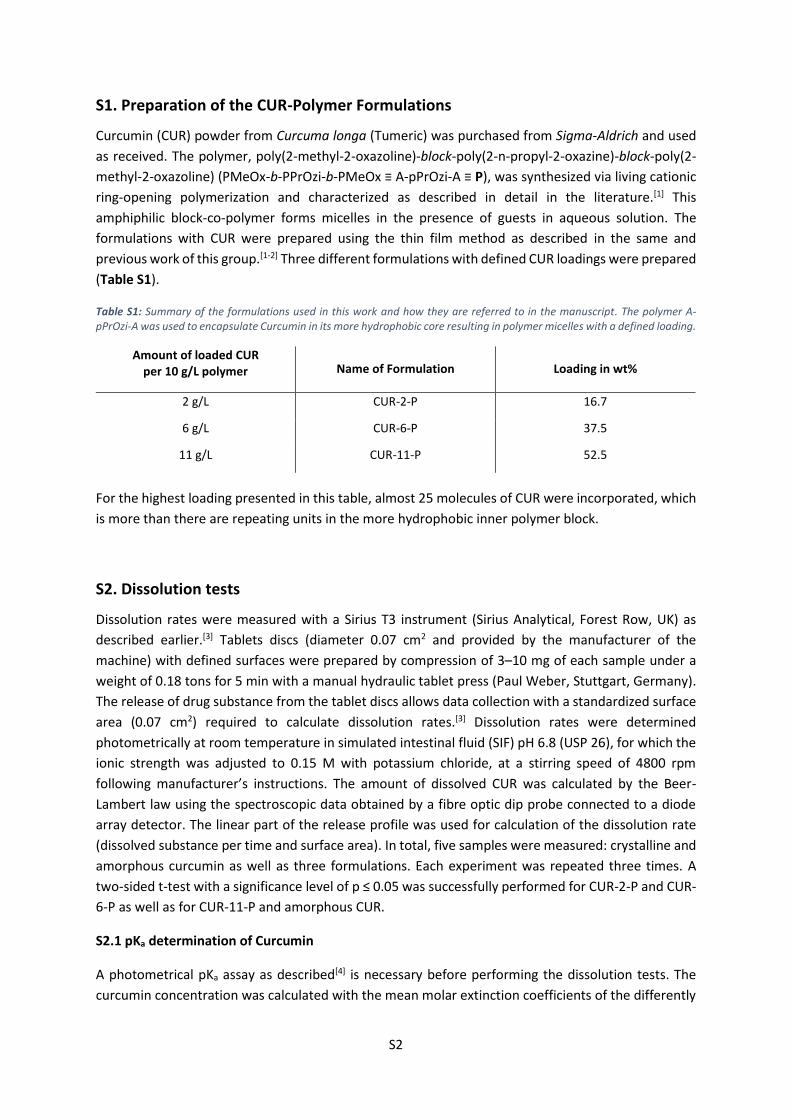
Table S1: Summary of the formulations used in this work and how they are referred to in the manuscript. The polymer A-pPrOzi-A was used to encapsulate Curcumin in its more hydrophobic core resulting in polymer micelles with a defined loading.
Amount of loaded CUR per 10 g/L polymer Name of Formulation Loading in wt%
2 g/L CUR-2-P 16.7
6 g/L CUR-6-P 37.5
11 g/L CUR-11-P 52.5
For the highest loading presented in this table, almost 25 molecules of CUR were incorporated, which
is more than there are repeating units in the more hydrophobic inner polymer block.
S2. Dissolution tests
Dissolution rates were measured with a Sirius T3 instrument (Sirius Analytical, Forest Row, UK) as
described earlier.[3] Tablets discs (diameter 0.07 cm2 and provided by the manufacturer of the
machine) with defined surfaces were prepared by compression of 3–10 mg of each sample under a
weight of 0.18 tons for 5 min with a manual hydraulic tablet press (Paul Weber, Stuttgart, Germany).
The release of drug substance from the tablet discs allows data collection with a standardized surface
area (0.07 cm2) required to calculate dissolution rates.[3] Dissolution rates were determined
photometrically at room temperature in simulated intestinal fluid (SIF) pH 6.8 (USP 26), for which the
ionic strength was adjusted to 0.15 M with potassium chloride, at a stirring speed of 4800 rpm
following manufacturer’s instructions. The amount of dissolved CUR was calculated by the Beer-
Lambert law using the spectroscopic data obtained by a fibre optic dip probe connected to a diode
array detector. The linear part of the release profile was used for calculation of the dissolution rate
(dissolved substance per time and surface area). In total, five samples were measured: crystalline and
amorphous curcumin as well as three formulations. Each experiment was repeated three times. A
two-sided t-test with a significance level of p ≤ 0.05 was successfully performed for CUR-2-P and CUR-
6-P as well as for CUR-11-P and amorphous CUR.
S2.1 pKa determination of Curcumin
A photometrical pKa assay as described[4] is necessary before performing the dissolution tests. The
curcumin concentration was calculated with the mean molar extinction coefficients of the differently
S3
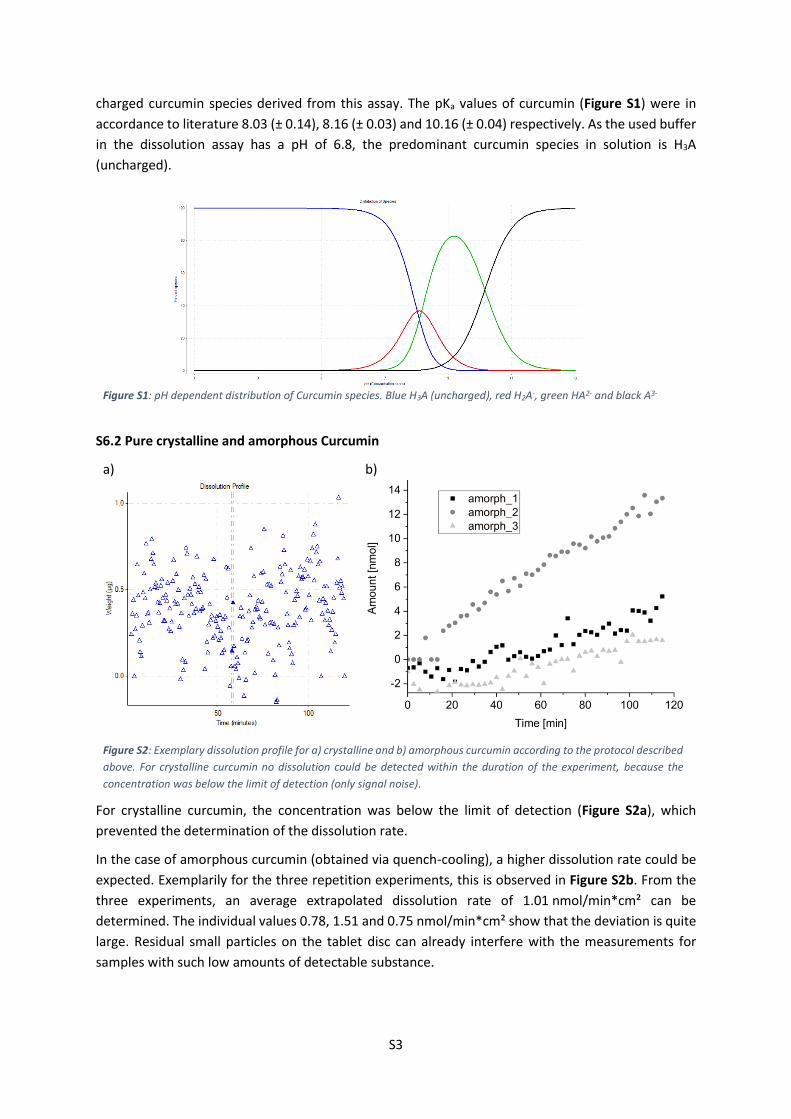
charged curcumin species derived from this assay. The pKa values of curcumin (Figure S1) were in
accordance to literature 8.03 (± 0.14), 8.16 (± 0.03) and 10.16 (± 0.04) respectively. As the used buffer
in the dissolution assay has a pH of 6.8, the predominant curcumin species in solution is H3A
(uncharged).
Figure S1: pH dependent distribution of Curcumin species. Blue H3A (uncharged), red H2A-, green HA2- and black A3-
S6.2 Pure crystalline and amorphous Curcumin
a)
b)
Figure S2: Exemplary dissolution profile for a) crystalline and b) amorphous curcumin according to the protocol described
above. For crystalline curcumin no dissolution could be detected within the duration of the experiment, because the
concentration was below the limit of detection (only signal noise).
For crystalline curcumin, the concentration was below the limit of detection (Figure S2a), which
prevented the determination of the dissolution rate.
In the case of amorphous curcumin (obtained via quench-cooling), a higher dissolution rate could be
expected. Exemplarily for the three repetition experiments, this is observed in Figure S2b. From the
three experiments, an average extrapolated dissolution rate of 1.01 nmol/min*cm² can be
determined. The individual values 0.78, 1.51 and 0.75 nmol/min*cm² show that the deviation is quite
large. Residual small particles on the tablet disc can already interfere with the measurements for
samples with such low amounts of detectable substance.

S4
S2.3 Formulations CUR-2/6/11-P
For the three formulations, dissolution profiles with varying onset could be recorded for all samples
(Figure S3).
a)
b)
c)
Figure S3: Dissolution profiles for the three samples a) CUR-2-P, b) CUR-6-P and c) CUR-11-P recorded for a pressed tablet at pH 6.8 (n =3). While the y-axis is displayed in μmol for a) and b), the axis for CUR-11-P in c) is given in nmol.

S5
S3. Hygroscopicity
Storage of part of the sample under ambient conditions already indicated that the three formulations
show different degrees of hygroscopicity (Figure S4a). Therefore, the hygroscopicity of the three
formulations was measured gravimetrically as explained in Ph. Eur: The samples inside a glas vial are
placed in a closed desiccator containing a saturated solution of ammonium chloride. Thus, a fixed
relative humidity of 80% at 25°C is achieved.[5] After 24 h, the samples were removed from the
desiccator and carefully weighed. From this, the weight gain [%] was determine for each sample.
Figure S4b shows pictures of the three samples before and after being stored in the desiccator. The
data is summarized in Table S2. Comparably small sample volumes were used. However, a general
trend is distinguishable, and the difference observed between CUR-2-P and CUR-6-P is very
pronounced, which agrees with dissolution data and our structural model.
a)
b)
Figure S4: a) Set of samples after storage at ambient conditions. b) The three samples before (top) and after (bottom) storage for 24 h at about 80% relative humidity.
Table S2: Experimental results from the hygroscopicity test according to Ph. Eur. Weighing of the vials was carried out with a high-precision balance. The temperature was 24 °C and thus slightly lower than the temperature given in the Ph. Eur. A saturated solution of ammonium chloride was used to generate the 80% RH atmosphere in the desiccator.
empty glass [mg]
filled glass [mg]
after 24h [mg]
Sample [mg]
Hygroscopicity [%]
CUR-2-P 7675.3 7682.9 7685.2 7.6 30
CUR-6-P 7685.7 7694.5 7695.9 8.8 16
CUR-11-P 7710.7 7719.6 7720.9 8.9 15
S6
S4. Characterization of the Formulations by NMR in solution
All NMR experiments were performed on a 14.1 T standard bore Bruker Avance III instrument at room
temperature. A 5 mm BBFO probe equipped with z-gradient and a temperature unit was used.
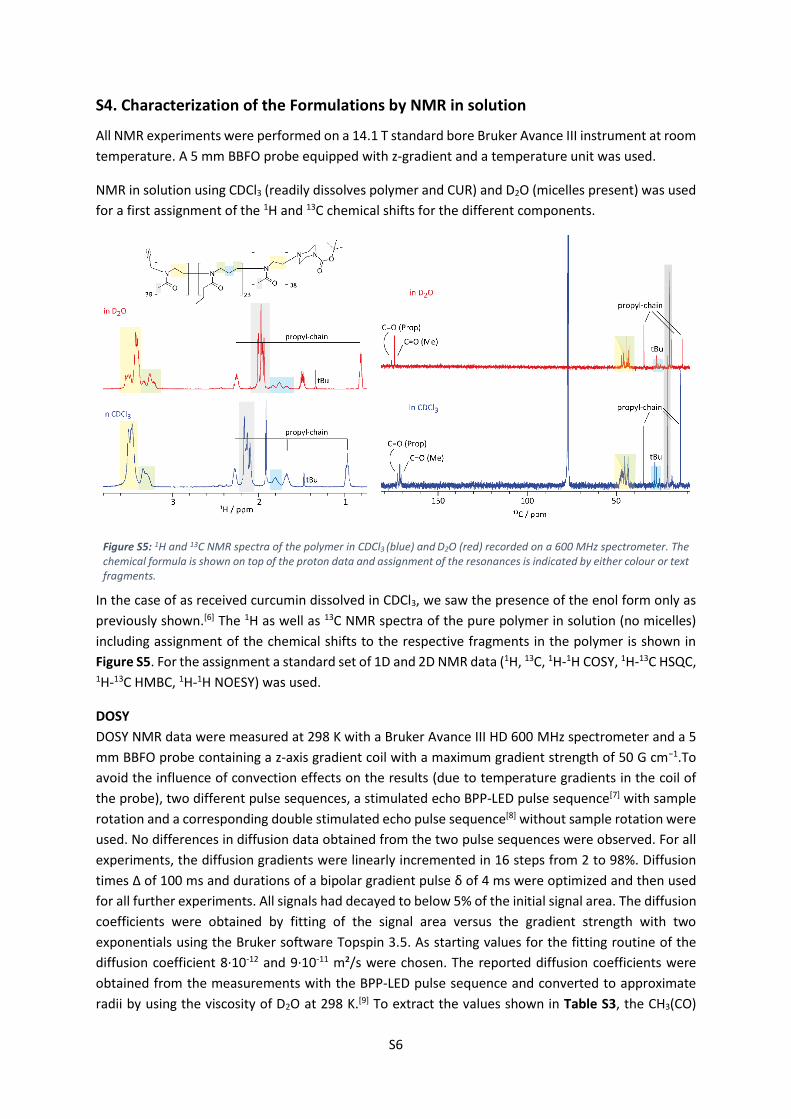
NMR in solution using CDCl3 (readily dissolves polymer and CUR) and D2O (micelles present) was used
for a first assignment of the 1H and 13C chemical shifts for the different components.
Figure S5: 1H and 13C NMR spectra of the polymer in CDCl3 (blue) and D2O (red) recorded on a 600 MHz spectrometer. The chemical formula is shown on top of the proton data and assignment of the resonances is indicated by either colour or text fragments.
In the case of as received curcumin dissolved in CDCl3, we saw the presence of the enol form only as
previously shown.[6] The 1H as well as 13C NMR spectra of the pure polymer in solution (no micelles)
including assignment of the chemical shifts to the respective fragments in the polymer is shown in
Figure S5. For the assignment a standard set of 1D and 2D NMR data (1H, 13C, 1H-1H COSY, 1H-13C HSQC, 1H-13C HMBC, 1H-1H NOESY) was used.
DOSY
DOSY NMR data were measured at 298 K with a Bruker Avance III HD 600 MHz spectrometer and a 5
mm BBFO probe containing a z-axis gradient coil with a maximum gradient strength of 50 G cm−1.To
avoid the influence of convection effects on the results (due to temperature gradients in the coil of
the probe), two different pulse sequences, a stimulated echo BPP-LED pulse sequence[7] with sample
rotation and a corresponding double stimulated echo pulse sequence[8] without sample rotation were
used. No differences in diffusion data obtained from the two pulse sequences were observed. For all
experiments, the diffusion gradients were linearly incremented in 16 steps from 2 to 98%. Diffusion
times Δ of 100 ms and durations of a bipolar gradient pulse δ of 4 ms were optimized and then used
for all further experiments. All signals had decayed to below 5% of the initial signal area. The diffusion
coefficients were obtained by fitting of the signal area versus the gradient strength with two
exponentials using the Bruker software Topspin 3.5. As starting values for the fitting routine of the
diffusion coefficient 8·10-12 and 9·10-11 m²/s were chosen. The reported diffusion coefficients were
obtained from the measurements with the BPP-LED pulse sequence and converted to approximate
radii by using the viscosity of D2O at 298 K.[9] To extract the values shown in Table S3, the CH3(CO)
S7
resonance of the hydrophilic polymer block at 1.98 ppm was used as this functional group is located
in the shell of the micelles and the signal is clearly separated.
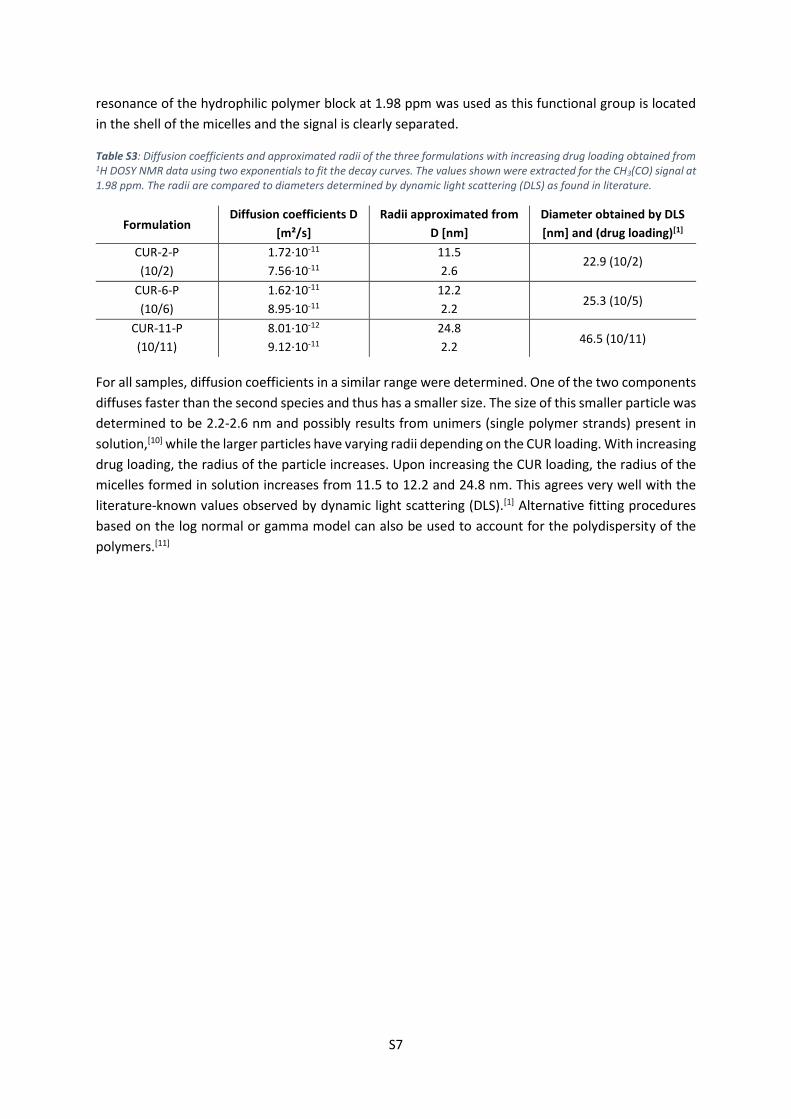
Table S3: Diffusion coefficients and approximated radii of the three formulations with increasing drug loading obtained from 1H DOSY NMR data using two exponentials to fit the decay curves. The values shown were extracted for the CH3(CO) signal at 1.98 ppm. The radii are compared to diameters determined by dynamic light scattering (DLS) as found in literature.
Formulation Diffusion coefficients D
[m²/s]
Radii approximated from
D [nm]
Diameter obtained by DLS
[nm] and (drug loading)[1]
CUR-2-P
(10/2)
1.72·10-11
7.56·10-11
11.5
2.6 22.9 (10/2)
CUR-6-P
(10/6)
1.62·10-11
8.95·10-11
12.2
2.2 25.3 (10/5)
CUR-11-P
(10/11)
8.01·10-12
9.12·10-11
24.8
2.2 46.5 (10/11)
For all samples, diffusion coefficients in a similar range were determined. One of the two components
diffuses faster than the second species and thus has a smaller size. The size of this smaller particle was
determined to be 2.2-2.6 nm and possibly results from unimers (single polymer strands) present in
solution,[10] while the larger particles have varying radii depending on the CUR loading. With increasing
drug loading, the radius of the particle increases. Upon increasing the CUR loading, the radius of the
micelles formed in solution increases from 11.5 to 12.2 and 24.8 nm. This agrees very well with the
literature-known values observed by dynamic light scattering (DLS).[1] Alternative fitting procedures
based on the log normal or gamma model can also be used to account for the polydispersity of the
polymers.[11]
S8
S5. Characterization by Multinuclear NMR
The solid-state NMR measurements were performed using a 3.2 mm double-channel Bruker probe at
14.1 T and 24 kHz MAS. For the CP, a 2 ms ramp (50 to 100%) on the 1H channel was used during the
CP contact time for all samples. For heteronuclear decoupling during acquisition, SPINAL64 was
employed with a 100 kHz nutation frequency (1H). The chemical shifts were referenced using
adamantane (left signal at 38.48 ppm) by subsequent adjustment of the magnetic field.
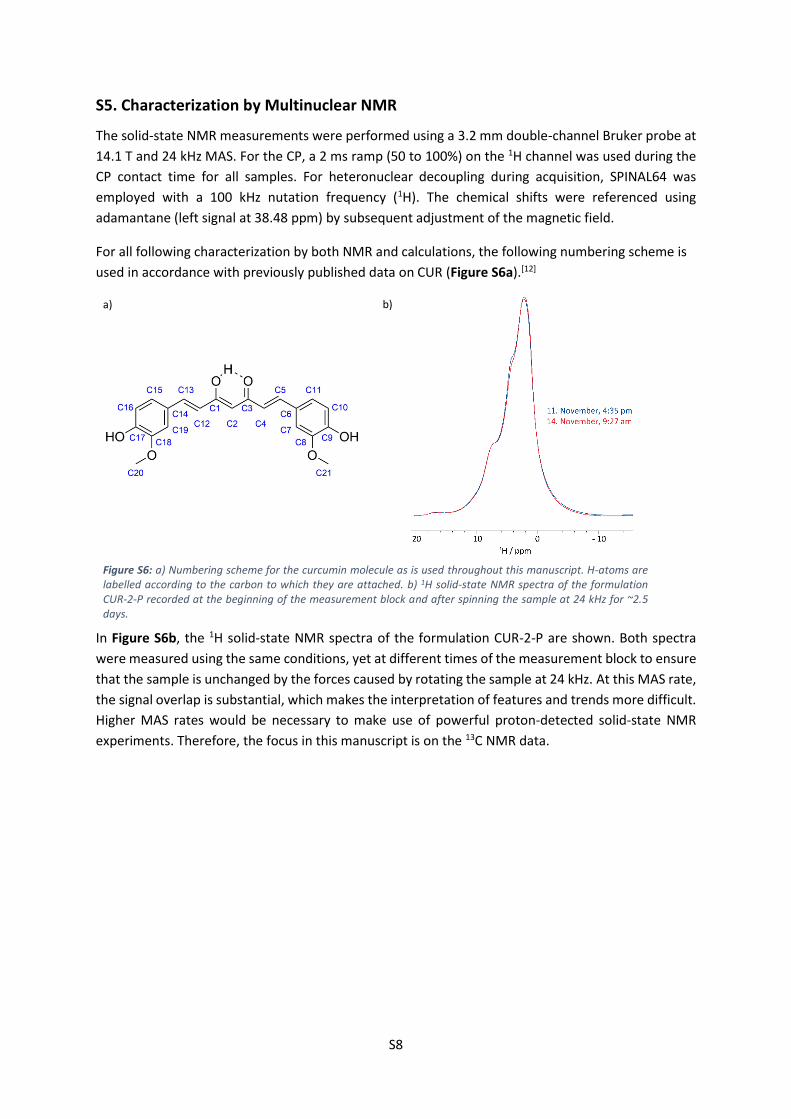
For all following characterization by both NMR and calculations, the following numbering scheme is
used in accordance with previously published data on CUR (Figure S6a).[12]
a)
b)
Figure S6: a) Numbering scheme for the curcumin molecule as is used throughout this manuscript. H-atoms are labelled according to the carbon to which they are attached. b) 1H solid-state NMR spectra of the formulation CUR-2-P recorded at the beginning of the measurement block and after spinning the sample at 24 kHz for ~2.5 days.
In Figure S6b, the 1H solid-state NMR spectra of the formulation CUR-2-P are shown. Both spectra
were measured using the same conditions, yet at different times of the measurement block to ensure
that the sample is unchanged by the forces caused by rotating the sample at 24 kHz. At this MAS rate,
the signal overlap is substantial, which makes the interpretation of features and trends more difficult.
Higher MAS rates would be necessary to make use of powerful proton-detected solid-state NMR
experiments. Therefore, the focus in this manuscript is on the 13C NMR data.

S9
To look at the changes in the
polymer 13C NMR signals in more
detail, the respective area in the 13C
CP/MAS spectra of the pure polymer
P (blue) as well as the three
formulations is shown in Figure S7.
The OMe signal of CUR indicates the
increasing CUR loading of the
micelles. The corresponding amount
of polymer should be decreasing.
Interestingly, an increase in the
signal intensity is observed, which
can result from the less mobile
arrangement and/or a larger
number of proton-carbon contacts.
If we first focus on the CH3 group of
the propyl moiety (inner polymer
block), we see a trend similar to the
one observed for the amide group of
the outer polymer blocks. The chemical shift decreases with increasing loading with CUR-6-P and CUR-
11-P having very similar values, which is mirrored by the line widths (pure polymer: 96 Hz; CUR-2-P:
168 Hz; CUR-6-P: 269 Hz; CUR-11-P: 291 Hz). Again, the difference from pure polymer to the low and
medium loadings are larger than the difference between medium and high loading, for which we
propose that the core is already full and additional CUR needs to be located at the hydrophobic-
hydrophilic interface with the amide groups of the hydrophilic blocks participating in the coordination.
An indicator for the location of CUR at the interface could be the behaviour of the signal at 29 ppm,
which belongs to the inner CH2 group of the backbone. The signal broadens and for the two higher
loadings, the signal consists of two separate parts (~28 and 29 ppm).
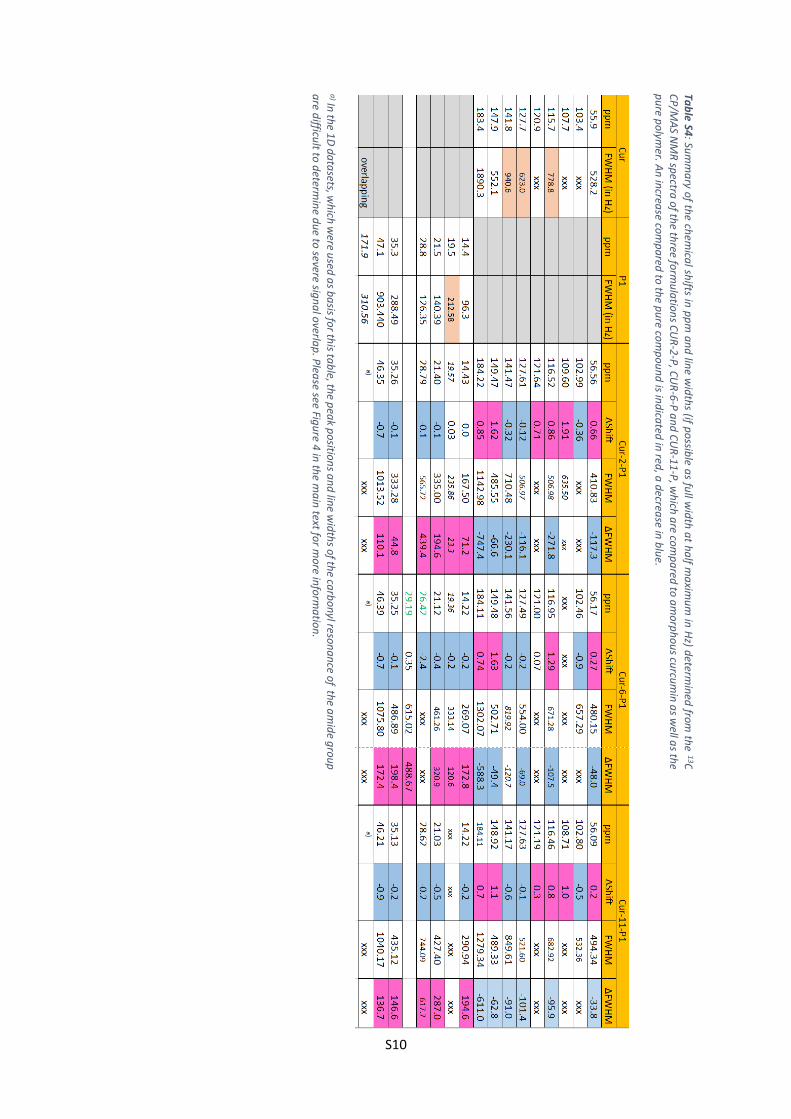
A table summarizing all chemical shifts and (if possible to determine) linewidths for amorphous CUR,
the pure polymer and the three formulations CUR-2/6/11-P is shown in the following (Table S4)
Figure S7: Extract from the 13C CP/MAS NMR spectra of the formulations CUR-2/6/11-P as well as pure polymer for comparison. Only the signal areas of the aliphatic polymer signals and that of the OMe group of CUR are shown. Scaling was applied according to the individual number of scans.
S10
Tab
le S4: Su
mm
ary o
f the ch
emica
l shifts in
pp
m a
nd
line w
idth
s (if po
ssible a
s full w
idth
at h
alf m
axim
um
in H
z) determ
ined
from th
e 13C
C
P/M
AS N
MR
spectra
of th
e three fo
rmu
latio
ns C
UR
-2-P
, CU
R-6
-P a
nd
CU
R-1
1-P
, wh
ich a
re com
pa
red to
am
orp
ho
us cu
rcum
in a
s well a
s the
pu
re po
lymer. A
n in
crease co
mp
ared
to th
e pu
re com
po
un
d is in
dica
ted in
red, a
decrea
se in b
lue.
a) In
the 1
D d
ata
sets, wh
ich w
ere used
as b
asis fo
r this ta
ble, th
e pea
k po
sition
s an
d lin
e wid
ths o
f the ca
rbo
nyl reso
na
nce o
f the a
mid
e gro
up
a
re difficu
lt to d
etermin
e du
e to severe sig
na
l overla
p. P
lease see Fig
ure 4
in th
e ma
in text fo
r mo
re info
rma
tion
.
S11
S6. Characterization of the Formulations by Powder X-ray diffraction
Powder diffractometric studies were done with a Bruker Discover D8 powder diffractometer
(Karlsruhe, Germany) using Cu Kα radiation (unsplit Kα1+Kα2 doublet, mean wavelength λ = 154.19
pm) at a power of 40 kV and 40 mA, a focusing Goebel mirror and a 2.5° axial Soller slit. The scattered
X-ray beam went through a receiving slit (3,3°). Detection was done with a LynxEye-1D-Detector
(Bruker AXS) using the full detector range of 192 channels. Measurements were done in reflection
geometry in coupled two theta/theta mode with a step size of 0.025° in 2θ and 0.55 s (pure
compounds) or 0.71 s (formulations) measurement time per step in the range of 5–50°(2θ). Data
collection was done with the software package DIFFRAC.Suite (V2 2.2.690, BrukerAXS 2009–2011,
Karlsruhe, Germany). The diffraction data was subsequently converted into ASCII format and further
handled with Origin (OriginLab, Massachusetts, USA).
Directly after sample preparation as well as after the measurements undertaken (NMR, dissolution
tests), PXRD data was recorded to ensure that the samples did not change under the measurement
conditions (e.g. Magic Angle Spinning (MAS)).
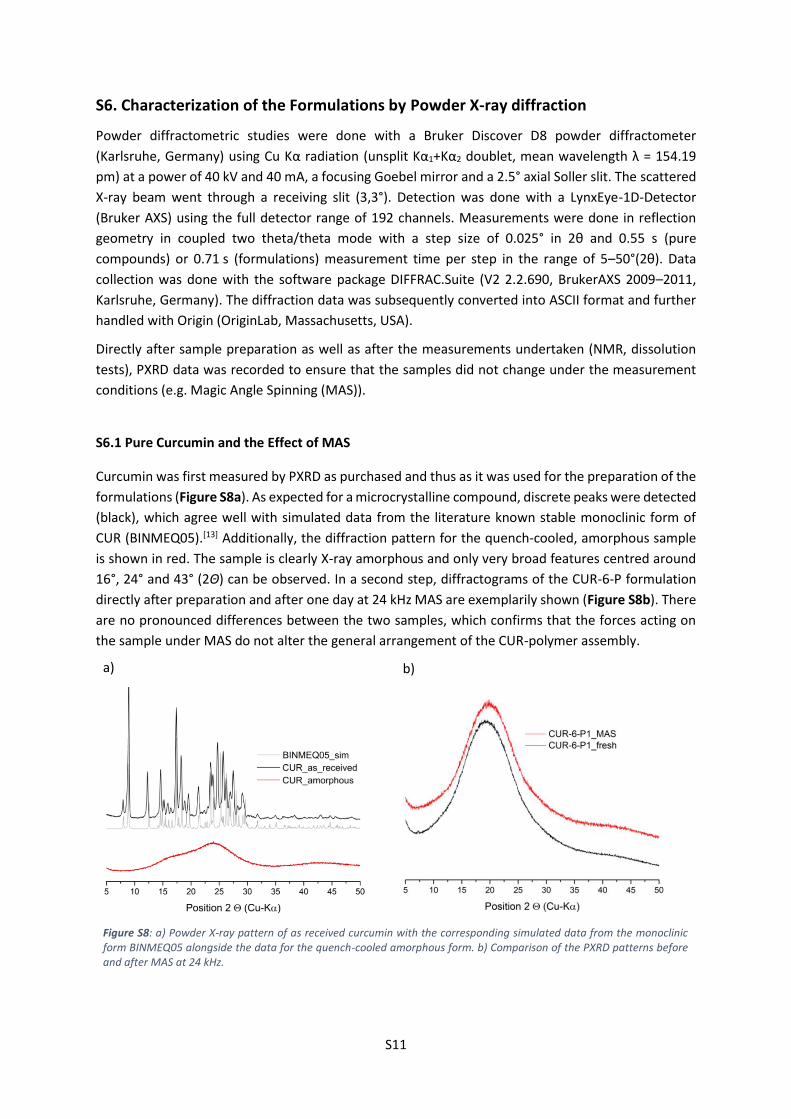
S6.1 Pure Curcumin and the Effect of MAS
Curcumin was first measured by PXRD as purchased and thus as it was used for the preparation of the
formulations (Figure S8a). As expected for a microcrystalline compound, discrete peaks were detected
(black), which agree well with simulated data from the literature known stable monoclinic form of
CUR (BINMEQ05).[13] Additionally, the diffraction pattern for the quench-cooled, amorphous sample
is shown in red. The sample is clearly X-ray amorphous and only very broad features centred around
16°, 24° and 43° (2Θ) can be observed. In a second step, diffractograms of the CUR-6-P formulation
directly after preparation and after one day at 24 kHz MAS are exemplarily shown (Figure S8b). There
are no pronounced differences between the two samples, which confirms that the forces acting on
the sample under MAS do not alter the general arrangement of the CUR-polymer assembly.
a)
b)
Figure S8: a) Powder X-ray pattern of as received curcumin with the corresponding simulated data from the monoclinic form BINMEQ05 alongside the data for the quench-cooled amorphous form. b) Comparison of the PXRD patterns before and after MAS at 24 kHz.
S12
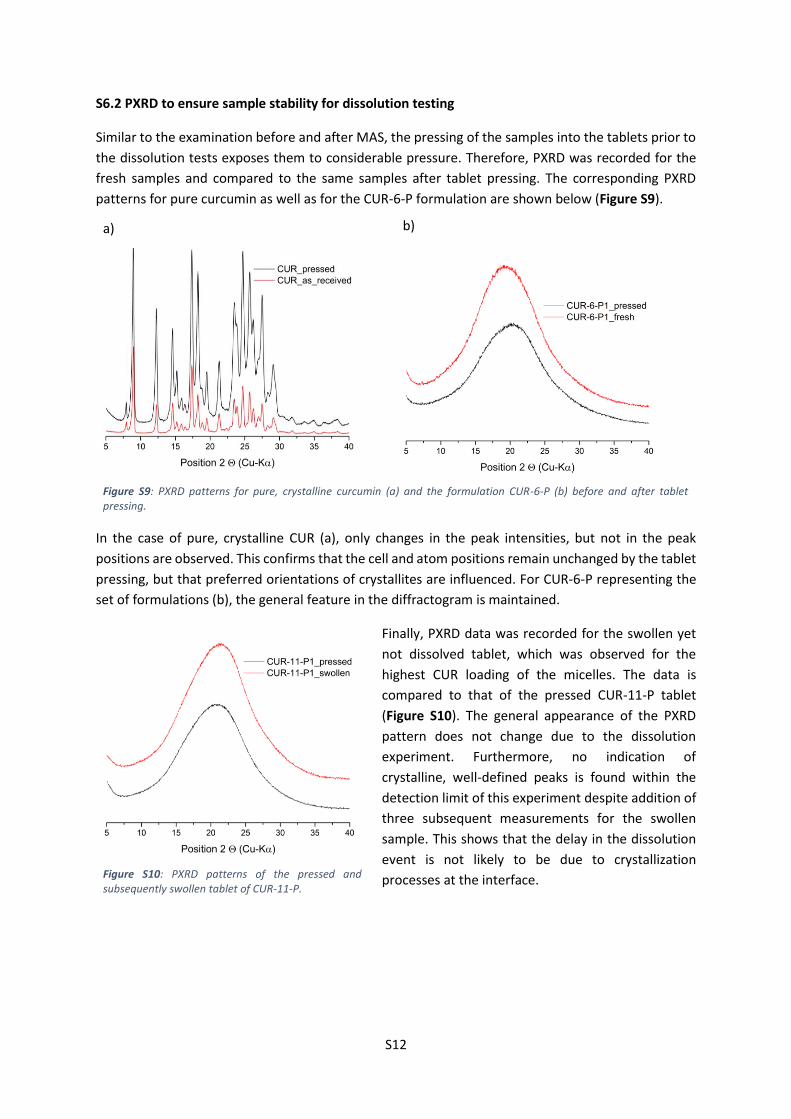
S6.2 PXRD to ensure sample stability for dissolution testing
Similar to the examination before and after MAS, the pressing of the samples into the tablets prior to
the dissolution tests exposes them to considerable pressure. Therefore, PXRD was recorded for the
fresh samples and compared to the same samples after tablet pressing. The corresponding PXRD
patterns for pure curcumin as well as for the CUR-6-P formulation are shown below (Figure S9).
In the case of pure, crystalline CUR (a), only changes in the peak intensities, but not in the peak
positions are observed. This confirms that the cell and atom positions remain unchanged by the tablet
pressing, but that preferred orientations of crystallites are influenced. For CUR-6-P representing the
set of formulations (b), the general feature in the diffractogram is maintained.
Finally, PXRD data was recorded for the swollen yet
not dissolved tablet, which was observed for the
highest CUR loading of the micelles. The data is
compared to that of the pressed CUR-11-P tablet
(Figure S10). The general appearance of the PXRD
pattern does not change due to the dissolution
experiment. Furthermore, no indication of
crystalline, well-defined peaks is found within the
detection limit of this experiment despite addition of
three subsequent measurements for the swollen
sample. This shows that the delay in the dissolution
event is not likely to be due to crystallization
processes at the interface.
a)
b)
Figure S9: PXRD patterns for pure, crystalline curcumin (a) and the formulation CUR-6-P (b) before and after tablet pressing.
Figure S10: PXRD patterns of the pressed and subsequently swollen tablet of CUR-11-P.

S13
S7. GIPAW(CASTEP) calculations
GIPAW (CASTEP) calculations[14] were used for three purposes: a) identification of the initial crystal
form (together with PXRD) and subsequent assignment of the CUR NMR resonances, b) determination
dominant interactions in the crystalline materials, c) information on the influence of the geometry of
the CUR molecules on the chemical shifts. In the following, a general information on the calculations
will be given (Chapters S7.1 and S7.2) before specific data will be discussed (Chapter S7.3).
S7.1 General Information on Version, Parameters and Conventions used
All calculations were run on the local cluster of the workgroup of Prof. Roland Mitric. They were
performed using the CASTEP code,[14a] academic release version 17.2. All structures were first
geometry optimized with the unit cell parameters fixed before chemical shieldings were calculated
using the GIPAW method.[14b, 14c] In all calculations, the PBE exchange correlation was used.[15] For the
plane wave basis set with ultra-soft pseudopotentials,[16] a maximum cut-off energy of 800 eV was
used alongside a Monkhorst–Pack grid for sampling over the Brillouin zone with minimum sample
spacing 0.1 × 2π Å−1. The forces, energies and displacements were converged to better than 0.05 eV
Å−1, 0.00002 eV, and 0.001 Å, respectively. To handle and visualize NMR output the Magresview
environment was employed.[17] For a crystal vs. molecule comparison, an additional NMR calculation
was performed for a single molecule from the optimized structure in an enlarged unit cell, which is
thus no longer interacting with neighbouring molecules.
In this work, the chemical shielding tensors obtained by GIPAW (CASTEP) calculations are presented
according to the Haeberlen-Mehring-Spiess convention:
The principal components of the chemical shielding tensor are σxx, σyy and σzz, satisfying |σzz ‒ σiso| ≥
|σxx ‒ σiso| ≥ |σyy ‒ σiso|. The isotropic chemical shielding is an average over the principal components:
σiso = (σxx+ σyy+ σzz)
3 and the anisotropy is defined as σaniso = σzz ‒ σiso. The asymmetry is obtained
according to ηasym =σyy−σxx
σansio, with ηasym = 0 corresponding to axial symmetry.
To compare the calculated chemicals shieldings to experimental chemical shift data, referencing
according to the following scheme is required: δiso = σref ‒ σiso.[18] For the discussed nuclei 1H and 13C,
the references values and their origins are given below:
Table S5: Summary of the nuclei, for which NMR parameters were calculated using the GIPAW (CASTEP) approach and the corresponding references values used to convert chemical shieldings into chemical shifts.
nucleus σref ref.
1H 30.5 (BINMEQ05)
13C 171.34 (BINMEQ05), 170.81
(BINMEQ06 and BINMEQ07)
exact value by plotting exp. chem.
shifts and calc. shieldings (fixed slope
at −1)[18-19]
S7.2 Crystal vs. Molecule
To gain additional theoretical insight into the set of intermolecular interactions that are present for a
particular form or packing arrangement, a second set of calculations was performed on a single
molecule. To do so, one molecule from the fully geometry optimized structure was kept in the unit
cell, which was also enlarged by ~5 Å in each direction. Thereby it was assured that this molecule is no
S14
longer in proximity to any neighbouring molecules. Subsequently, another set of NMR parameters was
calculated. Thus, the obtained chemical shifts were compared to the corresponding ones for the full
crystal structure. This difference = crystal ‒ molecule then represents the change induced by the sum
of all interactions the molecule is involved in.
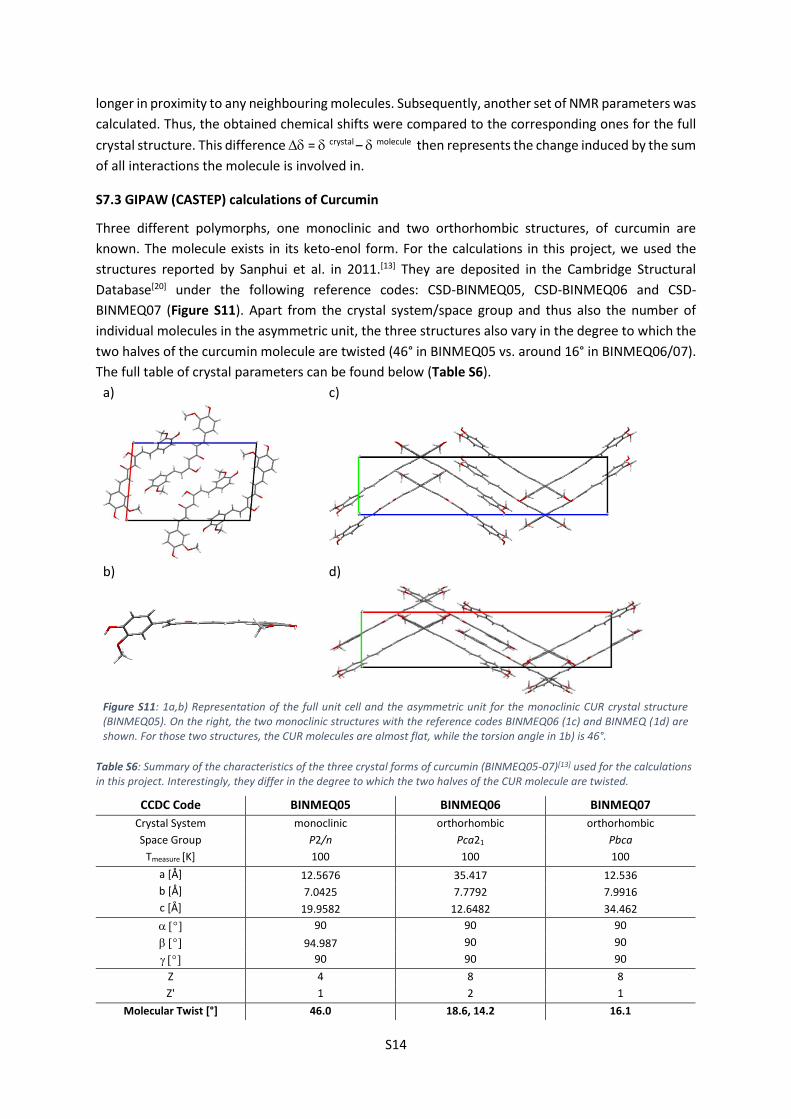
S7.3 GIPAW (CASTEP) calculations of Curcumin
Three different polymorphs, one monoclinic and two orthorhombic structures, of curcumin are
known. The molecule exists in its keto-enol form. For the calculations in this project, we used the
structures reported by Sanphui et al. in 2011.[13] They are deposited in the Cambridge Structural
Database[20] under the following reference codes: CSD-BINMEQ05, CSD-BINMEQ06 and CSD-
BINMEQ07 (Figure S11). Apart from the crystal system/space group and thus also the number of
individual molecules in the asymmetric unit, the three structures also vary in the degree to which the
two halves of the curcumin molecule are twisted (46° in BINMEQ05 vs. around 16° in BINMEQ06/07).
The full table of crystal parameters can be found below (Table S6).
a)
c)
b)
d)
Figure S11: 1a,b) Representation of the full unit cell and the asymmetric unit for the monoclinic CUR crystal structure (BINMEQ05). On the right, the two monoclinic structures with the reference codes BINMEQ06 (1c) and BINMEQ (1d) are shown. For those two structures, the CUR molecules are almost flat, while the torsion angle in 1b) is 46°.
Table S6: Summary of the characteristics of the three crystal forms of curcumin (BINMEQ05-07)[13] used for the calculations in this project. Interestingly, they differ in the degree to which the two halves of the CUR molecule are twisted.
CCDC Code BINMEQ05 BINMEQ06 BINMEQ07
Crystal System monoclinic orthorhombic orthorhombic
Space Group P2/n Pca21 Pbca
Tmeasure [K] 100 100 100
a [Å] 12.5676 35.417 12.536
b [Å] 7.0425 7.7792 7.9916
c [Å] 19.9582 12.6482 34.462
90 90 90
94.987 90 90
90 90 90
Z 4 8 8
Z' 1 2 1
Molecular Twist [°] 46.0 18.6, 14.2 16.1

S15
The three crystal structures discussed above were used as starting point for the GIPAW (CASTEP)
calculations. In agreement with PXRD data, the as received sample was identified as the monoclinic
form of curcumin. The calculated datapoints for the other two polymorphs do not fit the experimental
spectrum. To assign the solid-state NMR data, the calculated chemical shifts were used and the results
compared to the work published by Kong et al, which agrees with the data here (Figure S12a).[12]
Additionally, the agreement between experimental and calculated data was shown for a 2D 1H-13C
HETCOR spectrum, which was recorded using a short contact time of 50 μs to extract direct CH
contacts (Figure S12b). The calculated datapoints are shown as orange crosses and were generated
with a cutoff for the C-H distance of 1.2 Å.
a)
b)
Figure S12: a) 13C CP/MAS NMR spectra of crystalline, as received and quench-cooled amorphous CUR alongside GIPAW (CASTEP) calculated chemical shifts, which are shown as coloured sticks. The calculated data served as a basis for spectral assignment and the numbering scheme is as shown above and in agreement with the one chosen by Kong et al.[12] b) 1H-13C HETCOR spectrum recorded using a short contact time of 50 μs. Orange crosses represent GIPAW (CASTEP) calculated chemical shifts. All experimental data were recorded at 14.1 T and 24 kHz MAS.
For the quench-cooled amorphous sample, the lines are considerably broadened. Interestingly, there
is a broad feature at ~ 120 ppm, which is not observed in the initial untreated sample. The calculated
data for two orthorhombic crystal structures predicts resonances in this spectral region. Both
structures do not have the pronounced twist for the two halves of the molecule. Therefore, the
amorphous sample should mostly contain curcumin molecules with a relatively flat, untwisted
backbone. To learn more about key intermolecular interactions in the different polymorphs, which
will help to understand the environment of CUR within the polymeric micelles, calculations for the
crystal are compared to a single molecule calculated in an enlarged unit cell.
S6.4 GIPAW (CASTEP) calculations of Curcumin – crystal vs. molecule
After the initial full crystal geometry optimization, one molecule was selected and placed in an
enlarged unit cell to calculate the chemical shifts in the absence of intermolecular interactions. The
difference between this and the full crystal calculations are shown below (Figure S13 and Figure S14).
Generally, a positive difference for (1H) is indicative of hydrogen bonding interactions, while a
negative difference is observed if ring current effects are involved, e.g. for CH···π interactions.[21]
S16
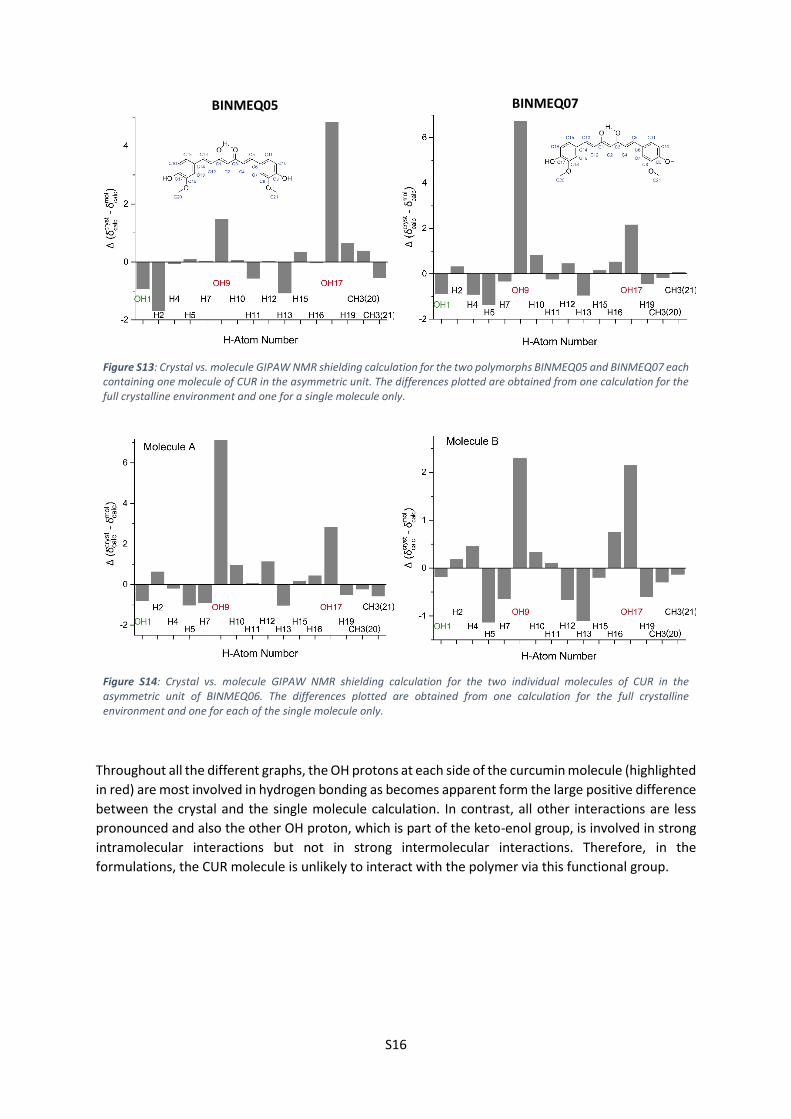
BINMEQ05
BINMEQ07
Figure S13: Crystal vs. molecule GIPAW NMR shielding calculation for the two polymorphs BINMEQ05 and BINMEQ07 each containing one molecule of CUR in the asymmetric unit. The differences plotted are obtained from one calculation for the full crystalline environment and one for a single molecule only.
Figure S14: Crystal vs. molecule GIPAW NMR shielding calculation for the two individual molecules of CUR in the asymmetric unit of BINMEQ06. The differences plotted are obtained from one calculation for the full crystalline environment and one for each of the single molecule only.
Throughout all the different graphs, the OH protons at each side of the curcumin molecule (highlighted
in red) are most involved in hydrogen bonding as becomes apparent form the large positive difference
between the crystal and the single molecule calculation. In contrast, all other interactions are less
pronounced and also the other OH proton, which is part of the keto-enol group, is involved in strong
intramolecular interactions but not in strong intermolecular interactions. Therefore, in the
formulations, the CUR molecule is unlikely to interact with the polymer via this functional group.
S17
S8. References
[1] M. M. Lübtow, L. Hahn, M. S. Haider, R. Luxenhofer, J. Am. Chem. Soc. 2017, 139, 10980-10983.
[2] R. Luxenhofer, A. Schulz, C. Roques, S. Li, T. K. Bronich, E. V. Batrakova, R. Jordan, A. V. Kabanov, Biomaterials 2010, 31, 4972-4979.
[3] T. Gravestock, K. Box, J. Comer, E. Frake, S. Judge, R. Ruiz, Analytical Methods 2011, 3, 560-567.
[4] H. H. Tønnesen, J. Karlsen, Zeitschrift für Lebensmittel-Untersuchung und Forschung 1985, 180, 402-404.
[5] a) J. F. Young, J. Appl. Chem. 1967, 17, 241-245; b) L. Greenspan, Journal of research of the national bureau of standards 1977, 81, 89-96.
[6] F. Payton, P. Sandusky, W. L. Alworth, J. Nat. Prod. 2007, 70, 143-146. [7] D. H. Wu, A. D. Chen, C. S. Johnson, Journal of Magnetic Resonance, Series A 1995, 115, 260-
264. [8] A. Jerschow, N. Müller, J. Magn. Reson. 1997, 125, 372-375. [9] R. Evans, Z. Deng, A. K. Rogerson, A. S. McLachlan, J. J. Richards, M. Nilsson, G. A. Morris,
Angew. Chem. Int. Ed. 2013, 52, 3199-3202. [10] Q. Yu, D. Pichugin, M. Cruz, G. Guerin, I. Manners, M. A. Winnik, Macromolecules 2018, 51,
3279-3289. [11] X. Guo, E. Laryea, M. Wilhelm, B. Luy, H. Nirschl, G. Guthausen, Macromol. Chem. Phys.
2017, 218, 1600440. [12] X. Kong, A. Brinkmann, V. Terskikh, R. E. Wasylishen, G. M. Bernard, Z. Duan, Q. Wu, G. Wu,
J. Phys. Chem. B 2016, 120, 11692-11704. [13] P. Sanphui, N. R. Goud, U. B. R. Khandavilli, S. Bhanoth, A. Nangia, Chem. Commun. 2011, 47,
5013-5015. [14] a) S. J. Clark, M. D. Segall, C. J. Pickard, P. J. Hasnip, M. I. J. Probert, K. Refson, M. C. Payne, Z.
Kristallogr. 2005, 220, 567; b) C. J. Pickard, F. Mauri, Phys. Rev. B 2001, 63, 245101; c) J. R. Yates, C. J. Pickard, F. Mauri, Phys. Rev. B 2007, 76, 024401.
[15] J. P. Perdew, K. Burke, M. Ernzerhof, Phys. Rev. Lett. 1996, 77, 3865-3868. [16] D. Vanderbilt, Phys. Rev. B 1990, 41, 7892-7895. [17] S. Sturniolo, T. F. Green, R. M. Hanson, M. Zilka, K. Refson, P. Hodgkinson, S. P. Brown, J. R.
Yates, Solid State Nucl. Magn. Reson. 2016. [18] R. K. Harris, P. Hodgkinson, C. J. Pickard, J. R. Yates, V. Zorin, Magn. Res. Chem. 2007, 45,
S174-S186. [19] G. N. M. Reddy, D. S. Cook, D. Iuga, R. I. Walton, A. Marsh, S. P. Brown, Solid State Nucl.
Magn. Reson. 2015, 65, 41-48. [20] C. R. Groom, I. J. Bruno, M. P. Lightfoot, S. C. Ward, Acta Crystallogr. B 2016, 72, 171-179. [21] a) J. R. Yates, T. N. Pham, C. J. Pickard, F. Mauri, A. M. Amado, A. M. Gil, S. P. Brown, J. Am.
Chem. Soc. 2005, 127, 10216-10220; b) A.-C. Uldry, J. M. Griffin, J. R. Yates, M. Pérez-Torralba, M. D. Santa María, A. L. Webber, M. L. L. Beaumont, A. Samoson, R. M. Claramunt, C. J. Pickard, S. P. Brown, J. Am. Chem. Soc. 2008, 130, 945-954.

download fileview on ChemRxivLoading dependent Structural Model of Polymeric Micelles ... (2.47 MiB)


![Polymeric nanocarrier systems for photodynamic …polymeric micelles [42-45], and polymeric nanoparti-cles [37-41] have been extensively studied for serving as PS carriers in PDT.](https://static.fdocuments.in/doc/165x107/5ed92dc96714ca7f47694afa/polymeric-nanocarrier-systems-for-photodynamic-polymeric-micelles-42-45-and-polymeric.jpg)


![Open Access Nanoscale Drug Delivery and Hyperthermia: The ...€¦ · based liposomes [11, 12]. Other self-assembling systems— polymeric micelles formed from amphiphilic block co-polymers](https://static.fdocuments.in/doc/165x107/5fa6ffd11f655536fd2de424/open-access-nanoscale-drug-delivery-and-hyperthermia-the-based-liposomes-11.jpg)