Load Transfer Test of Post-Tensioned Anchorage Zones...
9
Load Transfer Test of Post-Tensioned Anchorage Zones in High Strength Concrete Jee-Sang Kim, and Byeong Hun Woo Seokyeong University, Civil and Architectural Engineering Department Republic of Korea e-mail: [email protected] / [email protected] Abstract: The post-tensioning methods use a large amounts of strands to introduce a prestressing force into concrete. When the strands are strained, a considerable load is imposed on the concrete in the anchorage zone. Therefore, the cross section becomes larger and more reinforcements are used to prevent cracking. To decrease the inefficiency such as the increase of cross section and the use of a large amount of reinforcements, various studies are under way. In this study, the behaviors were evaluated by load transfer test of a post tensioned anchorage zones using high strength concrete. A total of 8 specimens were prepared for various amounts of spiral reinforcement and the reinforcing degree of lateral reinforcements. Compared those specified with the Korean Highway Bridge Design Code, the spiral reinforcement was found to be removable, but stronger lateral reinforcing is required rather than those specified in the design code. It may be possible to simplify lateral reinforcements when using spiral reinforcement. Keywords: Post-tension, Lateral reinforcement, Spiral, Reinforcements, Crack. 1. Introduction In the post tension method, a considerable load is imposed on the concrete due to a large amounts of strands tensioning, so that the cross section of anchorage zone becomes larger and more reinforcements are used more than necessary to prevent usual cracks. The dimensions of anchorage zone increase and the materials used also increase, resulting in environmentally and economically ineffective results. To reduce such inefficiency, high strength or high performance concrete were applied, which is being actively researched recently, or pretension method and post-tension method are applied at the same time. A research on UHPC post-tensioned anchorage zone [1] revealed that the reduction of reinforcement may be possible. In the case of using a single unbounded strand in post tensioned anchorage zones the additional reinforcement is unnecessary. Another research on experiment and finite element analysis of the post tensioned anchorage zones using Ultra-High Performance Concrete under active research in Korea [2]. It showed that sufficient strength and performance were obtained without reinforcing. In this study, the performance of the post-tensioned anchorage zones using 100MPa high strength concrete was examined by the load transfer test and crack pattern, crack width, the stresses reinforcements were measured. 2. Specimens The characteristics of the test specimens used in this experiment were designed according the exist specifications [3], [4]. Following the regulations of ETAG013, the sections must satisfy the conditions shown in (1), (2) and TABLE I, and the result is summarized in TALBE II and Fig. 1 b a y x A C (1) 1.15b y 0.85a, x (2) ISBN 978-93-84422-76-9 International Conference on Research & Innovation in Environment, Civil and Architecture Engineering (RIECAE-17) Bangkok (Thailand), Feb. 6-7, 2017 https://doi.org/10.17758/EIRAI.F0217314 106
Transcript of Load Transfer Test of Post-Tensioned Anchorage Zones...
Load Transfer Test of Post-Tensioned Anchorage Zones in High
Strength Concrete
Jee-Sang Kim, and Byeong Hun Woo Seokyeong University, Civil and Architectural Engineering Department Republic of Korea
e-mail: [email protected] / [email protected]
Abstract: The post-tensioning methods use a large amounts of strands to introduce a prestressing force into
concrete. When the strands are strained, a considerable load is imposed on the concrete in the anchorage zone.
Therefore, the cross section becomes larger and more reinforcements are used to prevent cracking. To decrease
the inefficiency such as the increase of cross section and the use of a large amount of reinforcements, various
studies are under way. In this study, the behaviors were evaluated by load transfer test of a post tensioned
anchorage zones using high strength concrete. A total of 8 specimens were prepared for various amounts of
spiral reinforcement and the reinforcing degree of lateral reinforcements. Compared those specified with the
Korean Highway Bridge Design Code, the spiral reinforcement was found to be removable, but stronger lateral
reinforcing is required rather than those specified in the design code. It may be possible to simplify lateral
reinforcements when using spiral reinforcement.
Keywords: Post-tension, Lateral reinforcement, Spiral, Reinforcements, Crack.
1. Introduction
In the post tension method, a considerable load is imposed on the concrete due to a large amounts of strands
tensioning, so that the cross section of anchorage zone becomes larger and more reinforcements are used more
than necessary to prevent usual cracks. The dimensions of anchorage zone increase and the materials used also
increase, resulting in environmentally and economically ineffective results. To reduce such inefficiency, high
strength or high performance concrete were applied, which is being actively researched recently, or pretension
method and post-tension method are applied at the same time. A research on UHPC post-tensioned anchorage
zone [1] revealed that the reduction of reinforcement may be possible. In the case of using a single unbounded
strand in post tensioned anchorage zones the additional reinforcement is unnecessary. Another research on
experiment and finite element analysis of the post tensioned anchorage zones using Ultra-High Performance
Concrete under active research in Korea [2]. It showed that sufficient strength and performance were obtained
without reinforcing.
In this study, the performance of the post-tensioned anchorage zones using 100MPa high strength concrete
was examined by the load transfer test and crack pattern, crack width, the stresses reinforcements were measured.
2. Specimens
The characteristics of the test specimens used in this experiment were designed according the exist
specifications [3], [4]. Following the regulations of ETAG013, the sections must satisfy the conditions shown
in (1), (2) and TABLE I, and the result is summarized in TALBE II and Fig. 1
bayxAC (1)
1.15by0.85a,x (2)
ISBN 978-93-84422-76-9
International Conference on Research & Innovation in Environment, Civil and Architecture Engineering
(RIECAE-17)
Bangkok (Thailand), Feb. 6-7, 2017
https://doi.org/10.17758/EIRAI.F0217314 106
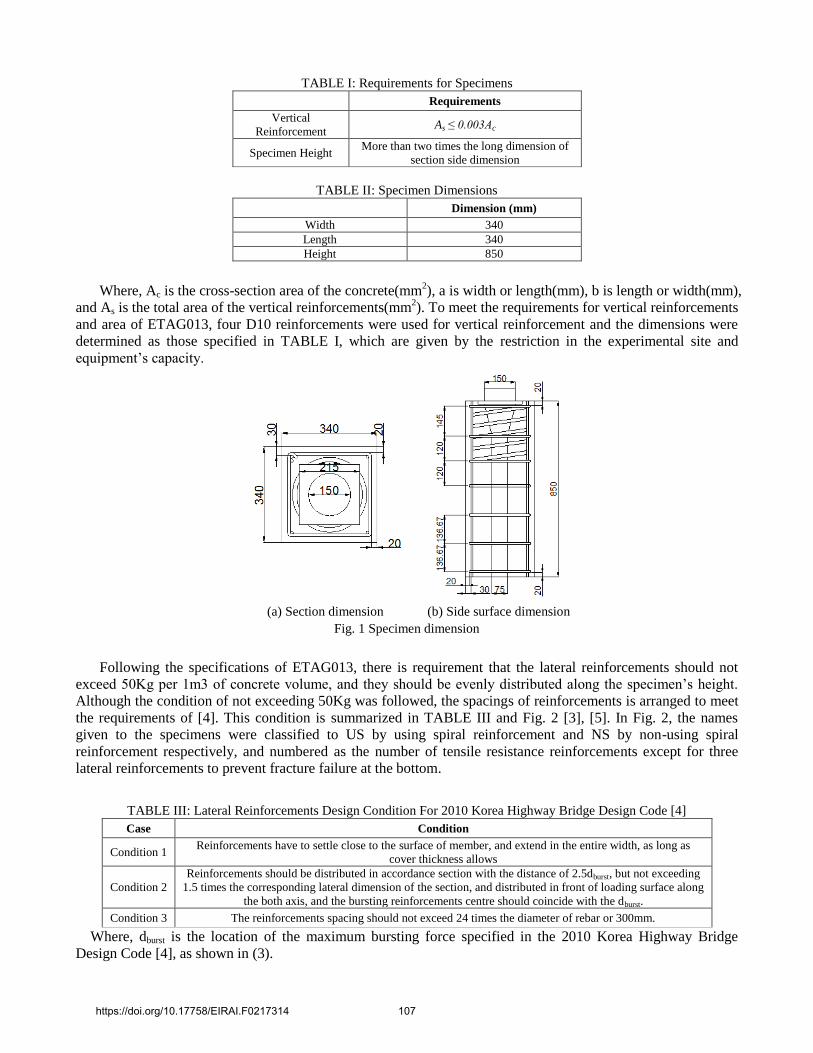
TABLE I: Requirements for Specimens
Requirements
Vertical
Reinforcement As ≤ 0.003Ac
Specimen Height More than two times the long dimension of
section side dimension
TABLE II: Specimen Dimensions
Dimension (mm)
Width 340
Length 340
Height 850
Where, Ac is the cross-section area of the concrete(mm2), a is width or length(mm), b is length or width(mm),
and As is the total area of the vertical reinforcements(mm2). To meet the requirements for vertical reinforcements
and area of ETAG013, four D10 reinforcements were used for vertical reinforcement and the dimensions were
determined as those specified in TABLE I, which are given by the restriction in the experimental site and
equipment’s capacity.
(a) Section dimension (b) Side surface dimension
Fig. 1 Specimen dimension
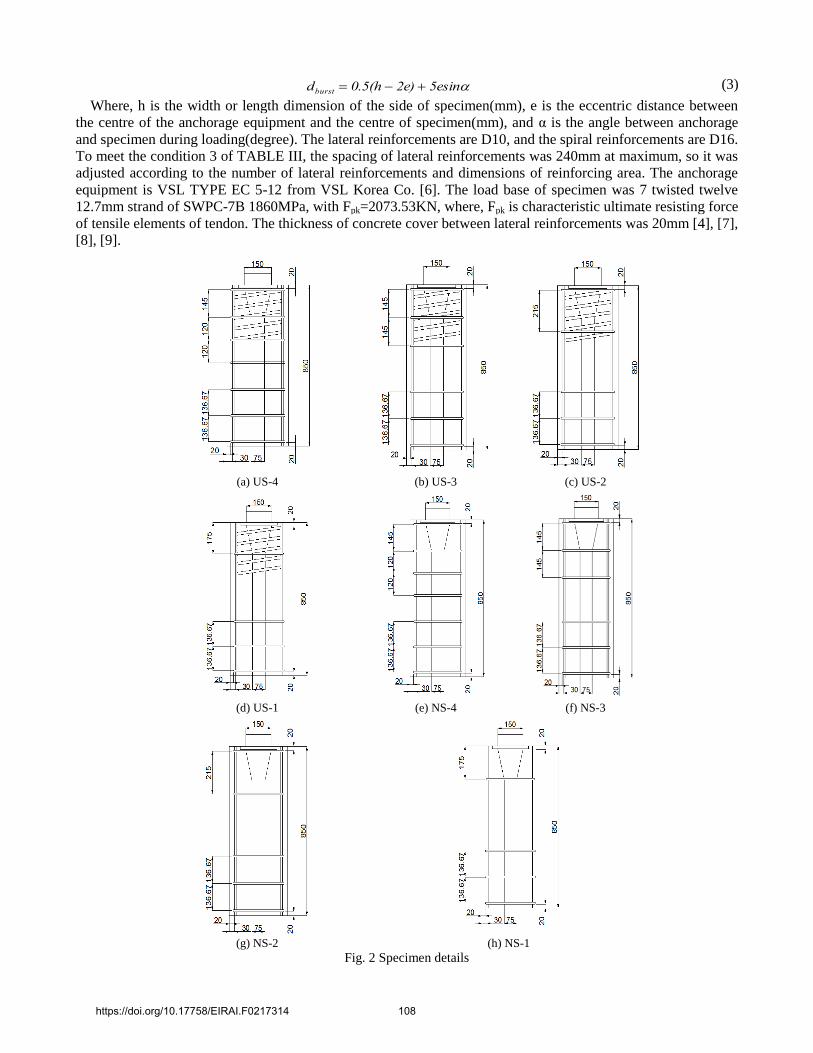
Following the specifications of ETAG013, there is requirement that the lateral reinforcements should not
exceed 50Kg per 1m3 of concrete volume, and they should be evenly distributed along the specimen’s height.
Although the condition of not exceeding 50Kg was followed, the spacings of reinforcements is arranged to meet
the requirements of [4]. This condition is summarized in TABLE III and Fig. 2 [3], [5]. In Fig. 2, the names
given to the specimens were classified to US by using spiral reinforcement and NS by non-using spiral
reinforcement respectively, and numbered as the number of tensile resistance reinforcements except for three
lateral reinforcements to prevent fracture failure at the bottom.
TABLE III: Lateral Reinforcements Design Condition For 2010 Korea Highway Bridge Design Code [4]
Case Condition
Condition 1 Reinforcements have to settle close to the surface of member, and extend in the entire width, as long as
cover thickness allows
Condition 2
Reinforcements should be distributed in accordance section with the distance of 2.5dburst, but not exceeding
1.5 times the corresponding lateral dimension of the section, and distributed in front of loading surface along
the both axis, and the bursting reinforcements centre should coincide with the dburst.
Condition 3 The reinforcements spacing should not exceed 24 times the diameter of rebar or 300mm.
Where, dburst is the location of the maximum bursting force specified in the 2010 Korea Highway Bridge
Design Code [4], as shown in (3).
https://doi.org/10.17758/EIRAI.F0217314 107
5esin2e)0.5(hdburst (3)
Where, h is the width or length dimension of the side of specimen(mm), e is the eccentric distance between
the centre of the anchorage equipment and the centre of specimen(mm), and α is the angle between anchorage
and specimen during loading(degree). The lateral reinforcements are D10, and the spiral reinforcements are D16.
To meet the condition 3 of TABLE III, the spacing of lateral reinforcements was 240mm at maximum, so it was
adjusted according to the number of lateral reinforcements and dimensions of reinforcing area. The anchorage
equipment is VSL TYPE EC 5-12 from VSL Korea Co. [6]. The load base of specimen was 7 twisted twelve
12.7mm strand of SWPC-7B 1860MPa, with Fpk=2073.53KN, where, Fpk is characteristic ultimate resisting force
of tensile elements of tendon. The thickness of concrete cover between lateral reinforcements was 20mm [4], [7],
[8], [9].
(a) US-4 (b) US-3 (c) US-2
(d) US-1 (e) NS-4 (f) NS-3
(g) NS-2 (h) NS-1
Fig. 2 Specimen details
https://doi.org/10.17758/EIRAI.F0217314 108

The specimens were fabricated using 100MPa high strength concrete. They were de-molded after one day air
curing and steam-cured for 3days. Concrete characteristics such as compressive strength, split strength, flexural
tensile strengths are summarized in TABLE IV.
TABLE IV: Characteristic of Concrete
Characteristics Value
Compressive Strength (MPa) 105.1
Splitting Strength (MPa) 4.84
Flexural Strength (MPa) 7.01
3. Measurement and Loadings
In this study, cracks and reinforcements stress were measured and analyzed. For the crack measurement,
four PI gauges were installed on the left and right sides of the specimens and the reinforcements strain gauges
were installed on the left and right sides of the spiral reinforcement and lateral reinforcements as shown in Fig. 3
(b).
(a) Crack gauge plan (b) Reinforcements plan
Fig. 3 Crack and reinforcements measurement plan
The 3000KN capacity UTM was used and loaded to 2551KN to meet the 1.1Fpk specified in ETAG013 and
considered UTM’s capacity. The judgement criteria of specimen failure were based on the yield strength of
lateral reinforcements. Load plan and operation procedures were followed by the experimental method of
ETAG013, and the application conditions are shown in TABLE V and Fig. 4. If all the condition of TALBE V
are satisfied, the strain stabilization is conducted as shown in Fig. 3 [2], [5].
Fig. 4 Strain stabilizing cycle
Crack
gauge
https://doi.org/10.17758/EIRAI.F0217314 109
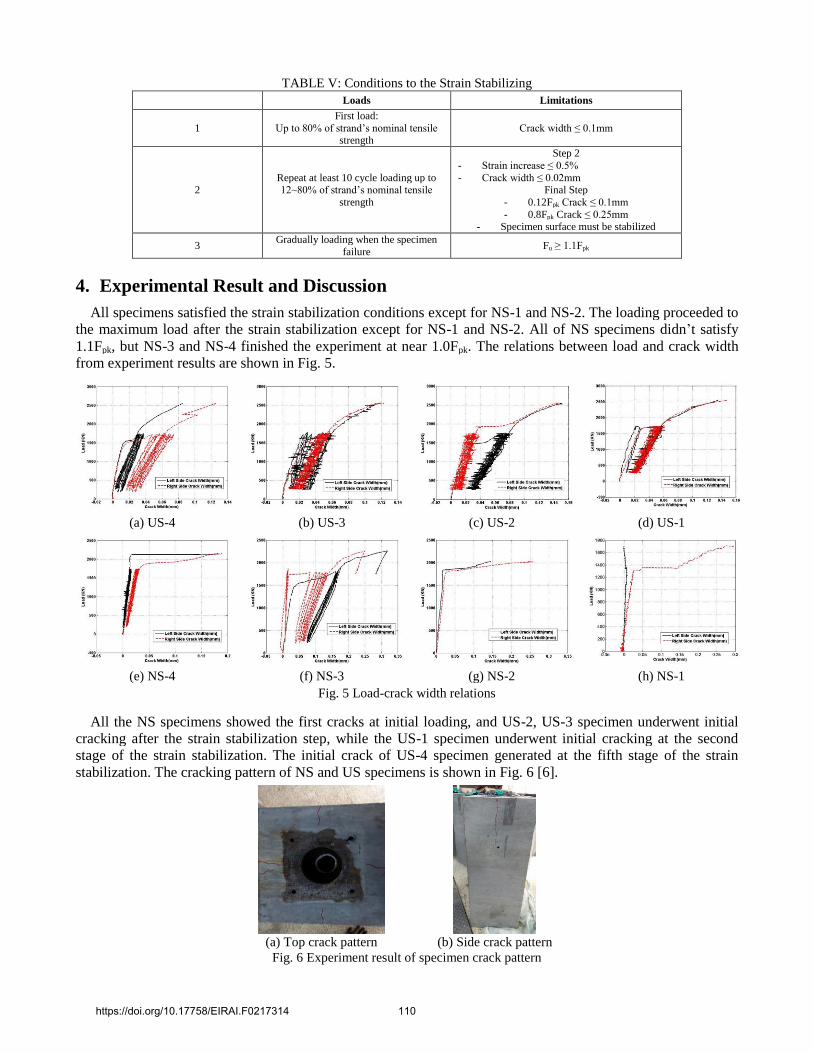
TABLE V: Conditions to the Strain Stabilizing
Loads Limitations
1
First load:
Up to 80% of strand’s nominal tensile strength
Crack width ≤ 0.1mm
2 Repeat at least 10 cycle loading up to 12~80% of strand’s nominal tensile
strength
Step 2
- Strain increase ≤ 0.5%
- Crack width ≤ 0.02mm Final Step
- 0.12Fpk Crack ≤ 0.1mm
- 0.8Fpk Crack ≤ 0.25mm - Specimen surface must be stabilized
3 Gradually loading when the specimen
failure Fu ≥ 1.1Fpk
4. Experimental Result and Discussion
All specimens satisfied the strain stabilization conditions except for NS-1 and NS-2. The loading proceeded to
the maximum load after the strain stabilization except for NS-1 and NS-2. All of NS specimens didn’t satisfy
1.1Fpk, but NS-3 and NS-4 finished the experiment at near 1.0Fpk. The relations between load and crack width
from experiment results are shown in Fig. 5.
(a) US-4 (b) US-3 (c) US-2 (d) US-1
(e) NS-4 (f) NS-3 (g) NS-2 (h) NS-1
Fig. 5 Load-crack width relations
All the NS specimens showed the first cracks at initial loading, and US-2, US-3 specimen underwent initial
cracking after the strain stabilization step, while the US-1 specimen underwent initial cracking at the second
stage of the strain stabilization. The initial crack of US-4 specimen generated at the fifth stage of the strain
stabilization. The cracking pattern of NS and US specimens is shown in Fig. 6 [6].
(a) Top crack pattern (b) Side crack pattern
Fig. 6 Experiment result of specimen crack pattern
https://doi.org/10.17758/EIRAI.F0217314 110

Cracks due to spalling force and bursting force were observed at the top of specimens, and at the all surfaces
of specimens. After the first cracking, it was found to extend upward and downward.
In the case of lateral reinforcements, all NS specimens yielded at the final load point, but the US specimens
did not yield either the spiral reinforcement and lateral reinforcements at the final load 2551KN. The results of
the reinforcements are shown in Fig. 7, and the results of the load and the reinforcements stress are shown in
TABLE VI.
(a) US-4
Lateral reinforcements (b) US-4 Spiral
(c) US-3
Lateral reinforcements
(d) US-3 Spiral
(e) US-2
Lateral reinforcements (f) US-2 Spiral
(g) US-1
Lateral reinforcements
(h) US-1 Spiral
(i) NS-4 (j) NS-3 (k) NS-2 (l) NS-1
Fig. 7 Load-reinforcements stress relations
The NS specimen’s reinforcements yielded, but the US specimen’s reinforcements did not yield as shown in
the load-reinforcements stress relationship in fig. 7. However, the US-4 of the US specimens showed the largest
stress in the lateral reinforcements. The reason for this is that the lateral reinforcements of US-1 and US-4
burdened more than the other specimens due to cracks in the gauge attachment area.
TABLE VI: Reinforcements Stresses and Loads
Specimen Final Load(KN) Stresses(MPa)
US-4 2556 Lateral reinforcements: 306,
Spiral: 65.8
US-3 2556 Lateral reinforcements: 186.8,
Spiral: 33.8
US-2 2556 Lateral reinforcements: 162.2,
Spiral: 56.6
US-1 2551.4 Lateral reinforcements: 206,
Spiral: 72
NS-4 2147.2 400 (Yielded)
NS-3 2266.3 400 (Yielded)
NS-2 2029 400 (Yielded)
NS-1 1708 400 (Yielded)
https://doi.org/10.17758/EIRAI.F0217314 111
From the experimental results, it is expected that the US specimen can be loaded greater than 1.23Fpk, which
may suggest the simplification of lateral reinforcements. NS specimens showed that NS-1 and NS-2 resisted
higher than expected and NS-3 and NS-4 met the strain stabilization conditions of ETAG013, it might can be the
basis of removal of spiral reinforcement, but reinforcing should be stronger than those given in [4].
5. Verification of highway bridge design code
In this study, the crack widths and reinforcements stress for various load steps are compared with those
specified in Korea Highway Bridge Design Code. TABLE VII is the limitation of the cracks and reinforcements
stress specified in [4].
TABLE VII: Load, Crack and Reinforcements Limit [4]
Case Limit Condition
Crack
(PS Strand)
Dry Condition Max. (0.2mm or 0.005tc)
Wet Condition Max. (0.2mm or 0.004tc)
Reinforcements
Stress Min. (0.6fy or 250MPa) at 0.35Ppu
Load Min. (0.8fpu or 0.9fpy)
Where, tc is the minimum cover thickness between outer concrete surface and reinforcements surface of the
outermost, and fy is the yield stress of reinforcements. The yield stress of reinforcements applied to this
experiment is 400MPa and the limiting stress of reinforcements proposed in [4] is 240MPa. Ppu is the maximum
load considering the number of strands used and is the same value as Fpk. Fpu is the tensile strength of the
tendon(MPa), and fpy is the yield stress of tendon(MPa).
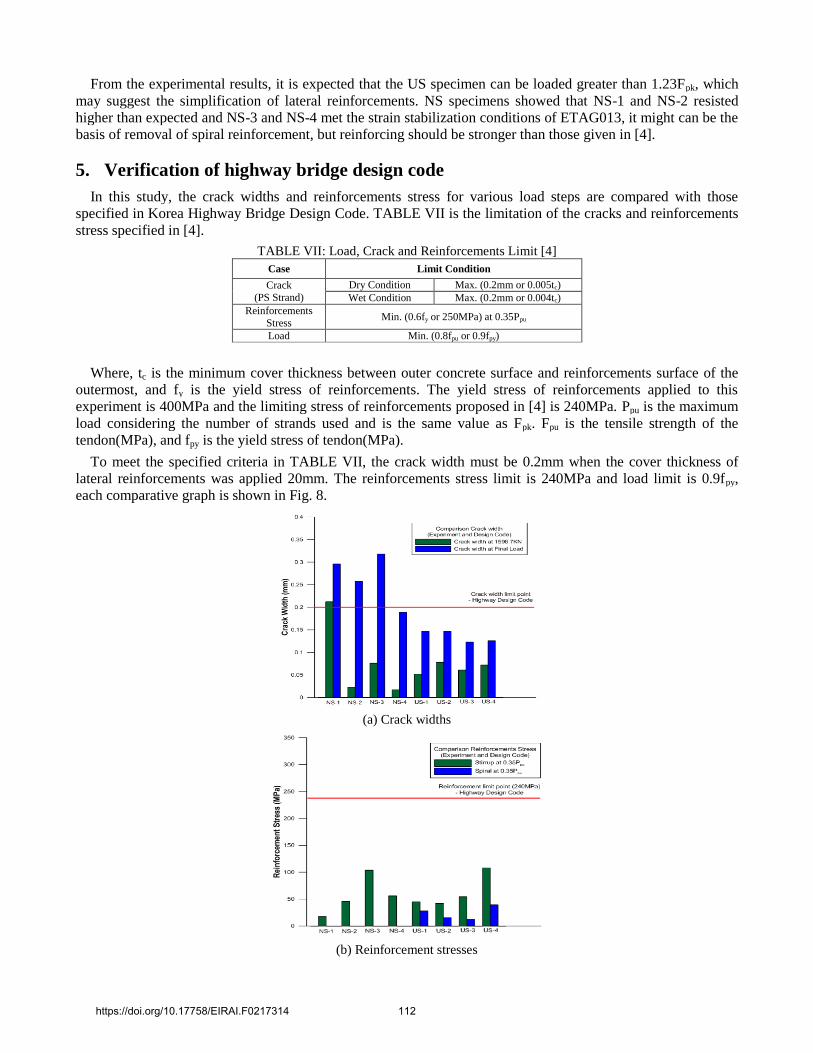
To meet the specified criteria in TABLE VII, the crack width must be 0.2mm when the cover thickness of
lateral reinforcements was applied 20mm. The reinforcements stress limit is 240MPa and load limit is 0.9fpy,
each comparative graph is shown in Fig. 8.
(a) Crack widths
(b) Reinforcement stresses
https://doi.org/10.17758/EIRAI.F0217314 112

(c) Loads
Fig. 8 Comparison experiment results and design code
In the comparison of the crack widths, the crack width tends to be considerably less than 0.2mm at the load
point 0.9fpy except for the NS-1 specimen. At the final loads, the measured crack widths of each specimen were
less than 0.2mm except NS-1, NS-2 and NS-3 specimens. Also, in the case of the reinforcements stress, a
considerable margin was left at 0.35Ppu, and the load is higher than the 2010 Korea Highway Bridge Design
Code’s load limitation. From the results, it can be concluded that post-tensioned anchorage zones using 100MPa
high strength concrete is significantly underestimated when design code is applied. Therefore, it is necessary to
apply the new design criteria for the post-tensioned anchorage zones using high strength concrete.
6. Conclusions
In this study, the behaviors of post-tensioned anchorage zones using 100MPa high strength concrete was
examined through the evaluation of crack widths and reinforcements stress, and compared with 2010 Korea
Highway Bridge Design Code.
In the NS-3 specimen, it was possible to remove the spiral reinforcement, but a somewhat stronger
reinforcing was required than those gien by the Korean Design Code. And it was confirmed that the lateral
reinforcements reinfocing can be simplified through the US specimens.
The load test results of all specimens had a considerable margin to those specified in the Code. Especially,
NS-1 specimen showed that more than 0.9fpy load limit, so it is necessary to make a new test procedure for
post-tensioned anchorage zones using high strength concrete.
The crack widths and reinforcements stresses from this experiments show a considerable difference to those
in current Code. It is suggested that the criteria for reinforcements stress, reinforcements spacing design and
crack widths of the post-tensioned anchorage zones using high strength concrete should be newly regulated.
7. References
[1] Choi, Yoon Seok, Experimental Evaluation and Finite Element Analysis of Post-Tensioned Anchorage Zones Using
UHPC, 2013, Master’s Thesis, Seokyeong University (in Korean)
[2] Ah Sir Cho, Yeong Wook Jo, Byoung Kap Jeon, Thomas H.-K. Kang, Development and Performance Test for
Unbonded Post-Tensioned Anchor, Journal of the Korea Concrete Institute, Vol. 27, No.1, 2015, pp.102-142 (in
Korean)
[3] EOTA, ETAG013, 2002, Chapter B, pp. 79-87
[4] Ministry of Land, Transport and Maritime Affairs, Highway Bridge Bridge Design Code, 2010, Chapter 4, Concrete
Bridge, pp. 133-146 (in Korean)
[5] Jee-Sang Kim, Changbin Joh, Yoon-Seok Choi, Load Transfer Test of Post-Tensioned Anchorage Zone in Ultra High
Performance Concrete, Scientific Research Publishing, Engineering, 2015, 7, pp. 115-128
[6] VSL Korea, Post-Tensioning Systems, pp. 7
https://doi.org/10.17758/EIRAI.F0217314 113
[7] AMERICAN ASSOCIATION OF STATE HIGHWAY BRIDGE AND TRANSPORTATION OFFICIALS
(AASHTO), AASHTO-LRFD, 2012, Chapter 5, pp. 122-144
[8] American Concrete Institute, Analysis and Design of Reinforced Concrete Bridge Structures (ACI 343R-95), 1995,
Chapter 5, pp. 102-109
[9] American Concrete Institute, Building Code Requirements for Structural Concrete (ACI 318-11) An ACI Standard and
Commentary, 2011, Chapter 18, pp. 302-306
https://doi.org/10.17758/EIRAI.F0217314 114