Load Growth, Transmission Projects and Engineering › sscc › law › dis › dbattach5e.nsf › 0...
128
Application No.: A.19-08 Exhibit No.: SCE-02, Vol. 4, Part 2 Witnesses: D. Cabbell C. Meissner (U 338-E) 2021 General Rate Case Load Growth, Transmission Projects and Engineering Before the Public Utilities Commission of the State of California Rosemead, California August 30, 2019
Transcript of Load Growth, Transmission Projects and Engineering › sscc › law › dis › dbattach5e.nsf › 0...
Application No.: A.19-08 Exhibit No.: SCE-02, Vol. 4, Part 2 Witnesses: D. Cabbell
C. Meissner
(U 338-E)
2021 General Rate Case
Load Growth, Transmission Projects and
Engineering
Before the
Public Utilities Commission of the State of California
Rosemead, California
August 30, 2019

SCE-02, Vol. 4, Part 2: Load Growth, Transmission Projects and Engineering
Table Of Contents
Section Page Witness
-i-
I. INTRODUCTION .............................................................................................1 D. Cabbell
A. Content and Organization of Volume ....................................................1
B. Summary of O&M and Capital Request ................................................2
II. LOAD GROWTH ..............................................................................................4
A. Overview ................................................................................................4
1. Regulatory Background/Policies Driving SCE’s Request .......................................................................................5
2. Compliance Requirements .........................................................6
a) 2015 GRC Decision (D.15-11-021) ...............................6
b) Distribution Resource Plan Track 3: Policy Issues (D.18-02-004) .....................................................7
(1) Sub track 1: Growth Scenarios ..........................7
(2) Sub track 3: Distribution Infrastructure Deferral Framework (DIDF)................................................................7
B. 2018 Decision ........................................................................................8
1. Comparison of Authorized 2018 to Recorded ...........................8
C. Distribution & Subtransmission Planning Process ..............................10
1. Development of Load & DER Forecasts .................................10
a) Development of Load Growth Forecast .......................10
b) Incorporation of DERs That Produce and Consume Energy ..........................................................11
c) Use of Forecasts for Peak Load versus High DER Analysis...............................................................12
2. Proposed Solution Identification..............................................13
a) Distribution Substation Plan (DSP) .............................14

SCE-02, Vol. 4, Part 2: Load Growth, Transmission Projects and Engineering
Table Of Contents (Continued)
Section Page Witness
-ii-
(1) Maximize Equipment Utilization .....................15
(2) Distribution Circuit Upgrades ..........................17
(3) New Distribution Circuits ................................17
(4) Substation Expansion Projects .........................18
(5) New Substation Projects ..................................18
b) Planning for DERs and the DER-driven Upgrades ......................................................................19
c) Subtransmission Planning and Transmission Substation Plan (TSP) ..................................................19
(1) Subtransmission Lines Plan .............................20
(2) A-bank Plan .....................................................21
(3) Subtransmission VAR Plan..............................22
3. System Improvement Programs ...............................................22
a) Distribution Plant Betterment ......................................22
b) Distribution VAR Plan .................................................22
c) Distribution Volt VAR Control (DVVC) ....................23
d) Substation Equipment Replacement Program ........................................................................23
e) DER-driven Circuit Breaker Upgrades ........................24
4. Deferral Opportunities .............................................................24
5. Implementation of Solutions ....................................................24
D. Capital Expenditures – Load Growth ..................................................25
1. Distribution Substation Plan ....................................................26
a) Distribution Circuit Upgrades ......................................27
(1) Program Description and Need for Program ............................................................27
SCE-02, Vol. 4, Part 2: Load Growth, Transmission Projects and Engineering
Table Of Contents (Continued)
Section Page Witness
-iii-
(2) Basis for Capital Expenditure Forecast ............................................................29
b) Distribution Substation Plan Circuits ..........................31
(1) Program Description and Need of Program ............................................................31
(2) Basis for Capital Expenditure Forecast ............................................................34
c) Distribution Substation Plan Substations .....................35
(1) Program Description ........................................36
(2) Basis for Capital Expenditure Forecast ............................................................37
d) 4 kV Cutovers – Load Growth Driven .........................48
(1) Program Description and Need for Activity ............................................................49
(2) Basis for Capital Expenditure Forecast ............................................................51
2. DER-Driven Grid Reinforcement ............................................52
a) DER-driven Distribution Circuit Upgrades .................52
(1) Program Description ........................................53
(2) Basis for Capital Expenditure Forecast ............................................................54
b) DER-driven 4 kV Cutovers ..........................................54
(1) Program Description ........................................55
(2) Basis for Capital Expenditure Forecast ............................................................56
c) DER-driven New Circuits ............................................56
(1) Program Description ........................................57

SCE-02, Vol. 4, Part 2: Load Growth, Transmission Projects and Engineering
Table Of Contents (Continued)
Section Page Witness
-iv-
(2) Basis for Capital Expenditure Forecast ............................................................58
d) DER-driven Circuit Breaker Upgrades ........................58
(1) Program Description ........................................59
(2) Basis for Capital Expenditure Forecast ............................................................60
e) DER-driven Substation Transformer Upgrades ......................................................................60
(1) Program Description ........................................61
(2) Basis for Capital Expenditure Forecast ............................................................62
3. Transmission Substation Plan ..................................................63
a) Subtransmission Lines Plan .........................................64
(1) Program Description ........................................66
(2) Licensing Status of Subtransmission Lines Projects ...................................................72
(3) Basis for Capital Expenditure Forecast ............................................................72
b) A-bank Plan .................................................................73
(1) Project or Program Description .......................75
(2) Licensing for A-bank Projects .........................75
(3) Basis for Capital Expenditure Forecast ............................................................76
c) Subtransmission VAR Plan..........................................76
4. System Improvement Programs ...............................................76
a) Distribution Plant Betterment ......................................76
(1) Program Description and Need for Activity ............................................................77

SCE-02, Vol. 4, Part 2: Load Growth, Transmission Projects and Engineering
Table Of Contents (Continued)
Section Page Witness
-v-
(2) Basis for Capital Expenditure Forecast ............................................................79
b) New Capacitors ............................................................81
(1) Program Description ........................................81
(2) Basis for Capital Expenditure Forecast ............................................................82
c) Distribution Volt-VAR Control (DVVC) and Programmable Capacitor Controller (PCC) Replacement Program .......................................82
(1) Program Description and Need for Activity ............................................................83
(2) Basis for Capital Expenditure Forecast ............................................................85
d) Substation Equipment Replacement Program (SERP)...........................................................88
(1) Program Description ........................................88
(2) Basis for Capital Expenditure Forecast ............................................................89
5. Land Rights Management ........................................................91
III. TRANSMISSION PROJECTS ........................................................................93 C. Meissner
A. Overview ..............................................................................................93
B. 2018 Decision ......................................................................................94
1. Comparison of Authorized 2018 to Recorded .........................94
C. Capital Expenditures - Transmission Projects .....................................96
1. Grid Reliability Projects ..........................................................97
a) Project Description and Need for Activity ...................99
b) Cerritos Channel Transmission Line Relocation ..................................................................100

SCE-02, Vol. 4, Part 2: Load Growth, Transmission Projects and Engineering
Table Of Contents (Continued)
Section Page Witness
-vi-
2. Renewable Transmission Projects .........................................100
a) Project Description and Need for Activity .................101
IV. ENGINEERING ............................................................................................103 D. Cabbell
A. Overview ............................................................................................103
B. 2018 Decision ....................................................................................103
1. Comparison of Authorized 2018 to Recorded .......................103
C. O&M Forecast - Engineering .............................................................105
1. Grid Engineering ....................................................................105
a) Work Description and Need.......................................105
b) Scope and Forecast Analysis .....................................107
(1) Historical Variance Analysis .........................108
(2) Forecast ..........................................................109
2. Load Side Support..................................................................110
a) Work Description and Need.......................................110
b) Scope and Forecast Analysis .....................................113
(1) Historical Variance Analysis .........................113
(2) Forecast ..........................................................114
Appendix A Project Alternatives

1
I. 1
INTRODUCTION 2
A. Content and Organization of Volume 3
The capital expenditures required to support load and DER growth, transmission grid reliability, 4
and renewable generation are included in this part of the System Augmentation Volume. Additionally, 5
the Engineering O&M that supports these activities are captured within this testimony. Because of the 6
differences in design and operation of the transmission, subtransmission, and distribution systems, each 7
system is covered under a separate planning process. The upgrades, modifications, and additions to the 8
distribution and subtransmission systems are captured in the Load Growth Chapter of this volume. 9
The upgrades, modifications, and additions to the transmission system are covered within the 10
Transmission Projects Chapter. Collectively, the capital expenditures necessary to plan for the near- and 11
long-term changes on the system are: 12
Distribution Substation Plan; 13
DER-Driven Grid Reinforcement; 14
Transmission Substation Plan; 15
System Improvement Programs; 16
Various Rights of Way (Land Rights Management); 17
Grid Reliability Transmission Projects; and 18
Renewable Transmission Projects. 19
The Grid Engineering O&M supports projects, activities, and studies across all voltage classes of 20
SCE’s power system. Load Side Support O&M addresses customer concerns with power quality. 21
Part 2 of the System Augmentation testimony is composed of the following Business Planning 22
Elements (BPEs): 23
Load Growth 24
Transmission Projects 25
Engineering 26
Each chapter includes analyses for each BPE of: (1) regulatory and compliance requirements, 27
(2) operation and maintenance (O&M) and capital funding authorized in the 2018 General Rate Case 28
(GRC) compared to recorded amounts in 2018, (3) the 2021 O&M Test Year forecast relative to 29
historical spending, and (4) the 2019 – 2023 capital expenditure forecast. 30

2
B. Summary of O&M and Capital Request 1
Volume 4, System Augmentation, presents SCE’s total requests for the System Augmentation 2
BPG of $35 million (constant 2018 dollars) in O&M expenses for 2021 Test Year and $6.923 billion in 3
capital expenditures for 2019 – 2023, and are presented in Figure I-1 and Figure I-2. 4
Figure I-1 System Augmentation Part 2 O&M Expenses 2021 Forecast
(Constant 2018 $Millions)

3
Figure I-2 System Augmentation Part 2 Capital Expenditures 2019-2023
(Total Company – Nominal $Million)
SCE’s requests for System Augmentation Part 2 include $12.8 million (constant 2018 dollars) in 1
O&M expenses for the 2021 Test Year and $3.619 billion in capital expenditures for 2019-2023 for 2
Load Growth, Transmission Projects and Engineering BPEs. 3

4
II. 1
LOAD GROWTH 2
A. Overview 3
SCE’s Load Growth Business Plan Element (BPE) covers work needed to support customer load 4
and Distributed Energy Resource (“DER”)1 growth throughout SCE’s electrical grid. Because of the 5
differences in design and operation of the transmission, subtransmission, and distribution systems, each 6
system is planned for under a separate planning process. The distribution and subtransmission planning 7
processes are detailed in this Load Growth testimony, while the transmission planning process is 8
covered later in Chapter III, Transmission Projects. 9
Each year, SCE develops transmission, subtransmission, and distribution system plans that 10
describe the projects and programs required to expand, upgrade, and reconfigure the electrical grid over 11
the next 10 years. The term “grid,” as shown in Figure II-3 below, refers to the infrastructure comprised 12
generally of transmission lines, subtransmission lines, substations, distribution circuits, and critical 13
equipment such as circuit breakers, relays, substation transformers, conductors, and automation 14
apparatus. 15
1 DERs can include energy efficiency, energy storage, demand response, electric vehicles, and distributed
generation.

5
Figure II-3 Electrical Grid – Power System Overview
SCE has presented its power system planning process in the past several GRCs. Though the 1
planning process has been refined over the past several decades, the overall driver of system 2
modification remains the same—to reliably accommodate increasing system capacity needs (resulting 3
from new customers or increased load from existing customers), while maintaining system reliability. 4
In addition, other drivers such as DER integration require additional grid reinforcements. 5
SCE plans for new infrastructure, modifications, or upgrades by considering multiple drivers to 6
find an overall least-cost, best-fit preferred solution. Alternative solutions are evaluated to make cost-7
effective choices, and SCE evaluates system needs through a progression of potential solutions to solve 8
system needs within reason. That progression is explained in more detail later in Section II.C.2. 9
This GRC application also includes new regulatory requirements for Load Growth that are discussed in 10
the next section and new public safety priorities discussed by Mr. Kevin Payne in SCE-01, Volume 1. 11
The impacts of these factors are incorporated into all of the Capital Expenditures requested in this 12
chapter. 13
1. Regulatory Background/Policies Driving SCE’s Request 14
SCE must evaluate distribution system customer needs, analyze its system, and present 15
proposals to the Commission for approval to meet those anticipated demands. 16

6
This GRC, SCE’s Load Growth capital expenditures are directly influenced by Track 3 of 1
the Distribution Resources Plan (DRP). Track 3 of the DRP is divided into three Sub tracks, and this 2
Load Growth testimony satisfies certain compliance requirements within Sub track 1: Growth Scenarios 3
and Sub track 3: Distribution Investment Deferral Framework (DIDF). 4
Sub track 1 focuses on DER adoption and distribution load forecasting. 5
Considerations include disaggregation methodologies and data sources for distribution-level forecasting. 6
Consistent with DRP guidance, SCE’s planning process, as reflected in Section C.1.a), starts with the 7
California Energy Commission’s Integrated Energy Policy Report (IEPR) California Energy Demand 8
2017 Forecast.2 9
Sub track 3 aims to integrate the DRP into planning and cost recovery processes by 10
identifying opportunities for DERs to cost effectively defer or avoid traditional investor owned utility 11
(IOU) investments. As described in Section II.C.2.a), SCE annually publishes the first five years of 12
system needs and identified projects in the Grid Needs Assessment (GNA) report and Distribution 13
Deferral Opportunity Report (DDOR) respectively as required in the DRP. 14
2. Compliance Requirements 15
a) 2015 GRC Decision (D.15-11-021) 16
In the 2015 GRC Decision, the Commission directed SCE to “provide clear unit 17
cost forecast information for the major types of equipment...so that the total cost forecast for the project 18
or program can be compared to the sum of the unit costs.”3 Consistent with this requirement, SCE has 19
included the detailed unit cost and number of units required for the major types of equipment in 20
workpapers. Unit costs can vary between projects and programs as shown in the workpapers. 21
The Commission also directed SCE to “provide analysis of the preemptive [circuit 22
breaker] replacements in combination with other types of replacements.”4 In SCE-02, Vol. 3, SCE 23
describes the circuit breaker infrastructure replacement program, which identifies bulk power circuit 24
breakers and distribution circuit breakers approaching the end of their service lives that will need 25
replacement. In that testimony, SCE presents an analysis of these preemptive circuit breaker 26
replacements. When SCE identifies circuit breakers to be replaced under infrastructure replacement, 27
2 Available at: https://www.energy.ca.gov/2017_energypolicy/documents/#demand, as of August 14 2019.
3 D.15-11-021.
4 D.15-11-021, p. 80.
7
those breakers are itemized by substation. The Substation Equipment Replacement Program (SERP), 1
described in Section II.D.4.d) of this volume, upgrades substation circuit breakers projected to exceed 2
short circuit duty interrupting capabilities. Under this program, SCE performs fault duty studies that 3
identify circuit breakers that must be upgraded to effectively and safely interrupt the fault current at a 4
substation. The forecast for this program includes only those breakers not already identified as part of 5
circuit breaker infrastructure replacement in SCE-02, Vol. 3. 6
b) Distribution Resource Plan Track 3: Policy Issues (D.18-02-004) 5 7
(1) Sub track 1: Growth Scenarios 8
DRP Track 3, Sub track 1 mandates that the “Integrated Energy Policy 9
Report (IEPR) demand forecast will be adopted with updated Distributed Energy Resources (DER) 10
forecasts in January 2018,” beginning with the “2018-2019 distribution planning cycle.”6 To accomplish 11
this, the IOUs develop and “vet disaggregation methods though the Growth Scenario Working Group 12
and incorporate best practices in their planning processes.”7 Section II.C.1.a) describes SCE’s 13
methodology for adopting the IEPR demand forecast as the load growth forecast at the system level, 14
with additional details on the disaggregation methodologies described in the Distribution Forecasting 15
Working Group (DFWG) Final Report.8 16
(2) Sub track 3: Distribution Infrastructure Deferral Framework (DIDF) 17
The October 21, 2016 Assigned Commissioner’s Ruling on Track 3 Issues 18
finalized the scope of Track 3, Sub track 3 of the DRP to (1) establish a process to identify opportunities 19
for DERs to defer or avoid traditional infrastructure projects, (2) establish a process for utilities to seek 20
authorization and cost recovery for DER sourcing to enable deferral or avoidance of traditional grid 21
infrastructure investments, and (3) consider a process to ensure savings from deferred or avoided 22
distribution investments are accurately reflected in relevant GRC filings.9 As part of the DIDF, 23
D.18-02-004 orders the IOUs to file two reports on an annual basis that are key components to achieving 24
5 Sub Track #2 focuses on Grid Modernization investments and are covered in the Grid Modernization Chapter
in SCE-04 Vol. 4 Pt. 1.
6 D.18-02-004, Ordering Paragraph 1.a., p. 2.
7 D.18-02-004, Ordering Paragraph 1.c., p. 2.
8 R.14-08-013.
9 Assigned Commissioner’s Ruling, dated October 21, 2016, in R.13-08-013.

8
the Commission’s objective to defer traditional infrastructure investments by competitively sourced 1
DERs. The Grid Needs Assessment (GNA) summarizes the forecasted deficiencies across the 2
distribution system related to capacity, reliability (back-tie), voltage, reactive power, resiliency 3
(microgrid), or a combination of services. The Distribution Deferral Opportunity Report (DDOR) 4
summarizes the traditional infrastructure investments that SCE has identified to mitigate the deficiencies 5
in the GNA. Section II.C.4, and Section II.C.2 describes SCE’s process for providing both the GNA 6
report and DDOR on an annual basis, along with details on how SCE maximizes asset utilization to 7
achieve the least-cost solution for projects. 8
B. 2018 Decision 9
1. Comparison of Authorized 2018 to Recorded 10
The 2018 GRC Decision requires SCE to compare the 2018 authorized amounts to the 11
recorded amounts;10 Figure II-4 below compares amounts for capital expenditures. 12
10 D.19-05-020, Ordering Paragraph 22, pp. 441-442.

9
Figure II-4 Load Growth
2018 GRC Authorized Variance Summary 2018 Capital11 (Total Company– Constant 2018$ Millions)
The variance in 2018 for Distribution Plant Betterment is explained in Section II.D.4.a). 1
SCE’s Grid Resiliency efforts recorded to Plant Betterment in 2018 before an official program was 2
established. 3
The 2018 expenditures in Distribution Substation Plan (DSP) Circuits are below 4
authorized levels largely due to a delay in the construction of the Safari Substation and pending permits, 5
including railroad-related permits. Additionally, SCE expenditures are lower than authorized because of 6
resource constraints accommodating Grid Resiliency efforts and construction delays due to permitting. 7
The 2018 expenditures were less than authorized for Transmission Substation Plan (TSP) 8
due to delays in several projects. For example, Johanna substation experienced delays resulting from an 9
RV park condemnation process. Approximately $65M (including FERC and CPUC jurisdictional costs) 10
11 Refer to WP SCE-07 Vol. 01 – Capital Authorized to Recorded. Note: All Other Distribution Programs
includes: 4 kV Cutovers - Load Growth Driven, Distribution Circuit Upgrades, Distribution Volt VAR Control and Capacitor Automation Program, Grid Reliability Projects, Land Rights Management, New Capacitors, Substation Equipment Replacement Program, and Substation Load Information Monitoring System.
10
is related to Alberhill, for which the CPUC issued a decision to deny the Certificate of Public 1
Convenience and Necessity (CPCN) in August 2018. The remaining underrun is primarily due to lower 2
load growth affecting deferral or cancellation of Transmission Substation Plan projects. 3
C. Distribution & Subtransmission Planning Process 4
1. Development of Load & DER Forecasts 5
The first step in SCE’s distribution and subtransmission planning process is to develop 6
peak load and DER forecasts for all distribution circuits, distribution substations, subtransmission lines, 7
and load-serving transmission substations. These forecasts span 10 years and include expected customer 8
load and DER growth. 9
Traditionally, SCE annually evaluates peak load conditions to determine the impacts to 10
SCE’s distribution and subtransmission systems over a 10-year horizon. With increasing DER 11
penetration on the distribution system, the traditional peak load studies are not able to capture criteria 12
violations due to the DERs that could arise outside of the peak hours. As such, SCE now also evaluates 13
high DER output conditions and the mitigations necessary to address criteria violations. The planning 14
process for peak load and high DER output conditions are described in more detail throughout this 15
section. 16
a) Development of Load Growth Forecast 17
For both peak load and high DER output scenarios, SCE begins by developing a 18
10-year load growth forecast at the distribution circuit level. Pursuant to Commission guidance in the 19
DRP, this load growth forecast is established through the disaggregation of the California Energy 20
Commission (CEC) Integrated Energy Policy Report (IEPR) load growth forecast.12 The CEC provides 21
this forecast to SCE, at the system-wide level, and not with the granularity necessary to account for 22
localized electrical needs on the distribution and subtransmission systems. SCE and other stakeholders 23
participate in the Distribution Forecasting Working Group (DFWG) to discuss and develop load and 24
DER methodologies to disaggregate system-wide forecasts to the distribution circuit level. “SCE also 25
incorporates additional load growth that may not have been fully reflected in the CEC forecast 26
12 The process by which SCE develops this forecast is detailed in SCE’s 2019 Grid Needs Assessment (GNA)
filed in Rulemaking (R.)14-08-013 on August 15, 2019. Due to the close proximity of filing dates for the GNA and this 2021 GRC, SCE will provide the relevant sections of the GNA as a supplemental workpaper to this testimony when available. Refer to WP SCE-02 Vol. 04 Pt. 2, Ch. II – Book B - pp. 364 - 365 – SCE’s Grid Needs Assessment Narrative.

11
(e.g. cultivation load growth not in the 2016 IEPR),”13 which SCE considers incremental14 to the IEPR 1
forecast. 2
SCE’s disaggregation methodology of the IEPR forecast encompasses specific 3
local-area knowledge from the system planning engineers on developers’ new projects, as well as 4
econometric data relative to each planning area. Local-area knowledge is derived from SCE’s system 5
planning engineers working closely with developers of agricultural, commercial, industrial, and 6
residential projects to understand the electrical needs of these developers’ projects, timing of the 7
projects, and the projected increases in demand that would be placed on SCE’s distribution facilities in 8
the area. These projected demand increases are based on information provided by the developers, as well 9
as institutional knowledge from SCE’s past experiences with similar developments, and are added into 10
the IEPR forecast, resulting in an SCE load growth forecast. 11
b) Incorporation of DERs That Produce and Consume Energy 12
Along with the development of a load growth forecast, SCE incorporates forecasts 13
that account for other load-modifying inputs such as DERs, including energy efficiency, energy storage, 14
demand response, Plug-in Electric Vehicles (PEVs), and distributed generation (DG), such as solar 15
photovoltaic (PV) systems. SCE utilizes the CEC-developed IEPR forecasts for these load-modifying 16
inputs and disaggregates them to the distribution circuit level. In some cases, these inputs can reduce 17
aggregate load (although not necessarily peak demands on certain circuits), while in other cases, they 18
may increase aggregate load. 19
For PV included in the 10-year forecast (2019-2028), SCE has incorporated an 20
updated methodology15 for representing the impacts (i.e., reductions) to peak load demand. This change 21
in methodology represents SCE’s adoption of an increase in the amount of solar PV output that is 22
considered “dependable” and can be relied upon for planning purposes, also known as “solar PV 23
dependability.” The updated dependable output values are based on (1) a cross-sectional analysis of 24
historical PV outputs for each hour of the day within a discrete operating region of SCE’s territory and 25
13 R.14-08-013, Appendix A, p. 97.
14 SCE considers Cultivation, Light Electric Vehicle (LEV) Superchargers, Mega Tract Homes, and Agricultural Pump Loads as incremental to the CEC 2017 IEPR forecast.
15 Refer to WP SCE-02 Vol. 04 Pt. 2, Ch. II – Book A - pp. 4 – 13 – SCE’s Dependable Photovoltaic Generation Methodology.

12
(2) the regional output percentage for each hour empirically-derived from the 10th percentile of each 1
cross-section’s data set. 2
Previous analysis, filed with SCE’s 2018 GRC, calculated that 19% of the 3
installed nameplate value of solar PV could be considered “dependable” for planning purposes at 12:00 4
PM. The dependable output at 5:00 PM (when the SCE system peak is expected to occur), would result 5
in 2% of the total of installed solar PV considered as dependable and could be used to “offset” load for 6
planning purposes. 7
Since the time of peak for each of SCE’s distribution circuits and substations 8
varies, SCE has continued to evaluate and refine its methodology for determining what the expected 9
maximum dependable solar PV output is. As an example of the updated methodology, 45% of the 10
installed nameplate of solar PV can be considered dependable at 12:00 PM for the San Jacinto region16 11
and 11.6% at 5:00 PM. SCE developed multiple regional-specific PV dependability curves in order to 12
represent factors such as local climate conditions in the forecasted PV performance output. SCE’s 13
updated methodology applied to the 10-year forecast results in a greater amount of solar PV output 14
considered dependable for planning purposes, an increase in the load-modifying impacts, and a 15
corresponding decrease in net load growth. 16
Once the DER forecast is developed and applied, the result is a forecast of peak 17
load and DER conditions developed for the planning activities initially associated with distribution 18
circuits and distribution substations, which then serves as the input necessary to perform the planning 19
activities associated with subtransmission lines and load-serving transmission substations. 20
This forecasting methodology is the basis of SCE’s DSP, Subtransmission Lines Plan (STL), and 21
Transmission Substation Plan (including the A-bank Plan and Subtransmission VAR Plan). 22
c) Use of Forecasts for Peak Load versus High DER Analysis 23
The Load and DER forecasts described above are the basis for both peak load and 24
high DER output analysis. For peak load analysis, SCE utilizes the forecasted peak load and 25
incorporates dependable DER output17 at the time of the peak load condition. For DER analysis, SCE 26
evaluates multiple conditions through its planning processes. Since PV is currently the largest DER 27
16 Refer to WP SCE-02 Vol. 04 Pt. 2, Ch. II – Book A - pp. 4 – 13 – SCE’s Dependable Photovoltaic Generation
Methodology. All regions are tabulated in the WP.
17 SCE only includes dependable PV output, as described in Section C.1.b), as part of the peak load analysis.
13
driving potential violations with conditions such as “reverse power flow,”18 high DER forecasts 1
currently focus on daytime hours.19 Each distribution feeder has a different minimum load level during 2
those hours or “minimum daytime loading;” therefore, selecting a single hour to analyze for all of the 3
distribution system would not fully capture all DER-driven criteria violations that may arise due to 4
different feeder behavior and types of customers on different circuits. The study process analyzes the 5
potential violations that would likely occur throughout different hours of the day, on different days, and 6
throughout the years that were studied.20 The other difference from the peak load analyses is that the 7
output curves were further broken down into monthly curves for each region and 95th percentile was 8
used.21 Identifying the criteria violations that are expected to occur under high DER output conditions is 9
necessary for SCE to plan for these conditions to reliably integrate DERs. For comparison, the San 10
Jacinto region in July, 74% of nameplate would be evaluated for impacts at 12:00 PM and 14% of 11
nameplate at 5:00 PM.22 Further, this study process incorporates analysis of different types of DERs and 12
their respective profiles. 13
2. Proposed Solution Identification 14
After the load and DER forecasts are developed, the next step in SCE’s planning 15
processes is to perform the necessary technical studies that determine whether the projected forecasts 16
can be accommodated using existing distribution, subtransmission, and transmission facilities. SCE uses 17
planning criteria as the basis for designing a reliable system. The planning criteria is based on equipment 18
loading limits (termed “planned loading limits”) that consider the effects of loading on thermal, voltage, 19
and protection limits under normal and emergency conditions. The analysis includes comparing the 20
18 “Reverse power flow” occurs when generation on a distribution circuit exceeds the amount of load on that
circuit and causes power to flow into a distribution substation instead of towards customers as originally designed.
19 Refer to WP SCE-02 Vol. 04 Pt. 2, Ch. II – Book A - pp. 14 – 29 – High Distributed Energy Resources Planning Assumptions.
20 Refer to WP SCE-02 Vol. 04 Pt. 2, Ch. II – Book A - pp. 14 – 29 – Details of the 8760 analysis are in the High Distributed Energy Resources Planning Assumptions.
21 SCE uses the 95th percentile as referenced in the Integration Capacity Analysis Working Group’s Final ICA WG Long Term Refinements Report. Available at: https://drpwg.org/wp-content/uploads/2018/01/ICA-WG-LTR-Report-Final.pdf., as of August 14, 2019.
22 Refer to WP SCE-02 Vol. 04 Pt. 2, Ch. II – Book A - pp. 14 – 29 – A sample monthly output curve is in High Distributed Energy Resources Planning Assumptions.

14
expected forecast peak load under peak heat storm conditions over a 10-year period to these established 1
planned loading limits. 2
When studies show that peak load or DER impacts are expected to exceed planned 3
loading limits, potential solutions are identified to mitigate the risk of overloading equipment, which in 4
turn serves to decrease the probability of failures and service interruptions that might affect many 5
customers. As part of identifying solution alternatives, SCE first seeks to maximize the utilization of 6
existing assets before developing projects that require capital expenditures to install new infrastructure. 7
The forecast costs, for solutions requiring new infrastructure over this GRC period, are found in Section 8
II.D. 9
a) Distribution Substation Plan (DSP) 10
During the planning process for the distribution system, SCE performs analyses of 11
system performance to identify system issues throughout the 10-year planning horizon that need to be 12
addressed. The first five years of these system needs are identified in SCE’s annually published Grid 13
Needs Assessment (GNA) report as required by the Commission in the DRP.23 SCE also performs 14
analyses to evaluate solutions to address the identified system needs throughout the ten-year planning 15
horizon, which seek to maximize asset utilization and achieve the least-cost solutions to meet the 16
electrical needs of its customers. The projects identified within the first five years are then included in 17
SCE’s annually published Distribution Deferral Opportunities Report (DDOR) as also required in the 18
DRP. Further information on the GNA and DDOR reports can be found in Grid Modernization 19
Compliance Requirements in SCE-02 Volume 4 Part 1. 20
SCE’s prioritization of solution alternatives for the Distribution Substation Plan 21
begins with evaluating the lowest cost alternatives first, and then sequentially reviewing the following 22
potential solutions: 23
Maximizing equipment utilization; 24
Distribution circuit upgrades; 25
New distribution circuits; 26
Substation expansion; and 27
New substations. 28
23 D.18-02-004, on Track 3 Policy Issues, Sub Track #1 (Growth Scenarios) and Sub Track #3 (Distribution
Investment and Deferral Process).

15
Throughout the progression, SCE develops a set of potential projects that can 1
address the forecast distribution system needs. The technical feasibility of each proposed alternative is 2
reviewed with various SCE stakeholders responsible for design, construction, and operation and 3
maintenance. SCE uses this stakeholder input, with reliability, operational flexibility, and cost-4
effectiveness factors, to determine which projects are technically feasible and eliminates those which are 5
not. Of the solutions that remain, SCE then selects the most suitable project as the preferred solution to 6
carry forward. The project lists provided in Capital Expenditures – Load Growth, Section II.D, have 7
been evaluated in this sequential manner, demonstrating that the proposed projects best fit the needs of 8
the distribution system. 9
(1) Maximize Equipment Utilization 10
When SCE forecasts that load will exceed planned loading limits on a 11
distribution circuit or substation, the first step is to analyze solutions that are minor or can be solved by 12
operational changes – options that do not require additional infrastructure. SCE’s distribution system is a 13
three-phase power system capable of serving a variety of customer needs. Many loads on the system 14
require service from all three phases of a distribution circuit, such as large motors in commercial and 15
industrial facilities; while other loads on the system require only a single phase, such as a residential 16
home. As load is added to distribution circuits, attempts are made to do so in a manner which will result 17
in approximately equivalent amounts of load connected to each of the three phases of the circuit. It is 18
important to balance load across the three phases of distribution facilities because the highest loaded 19
phase determines the peak loading of the circuit for planning activities. When there is the potential to 20
reduce the loading on the highest-loaded phase by transferring some of the single-phase load from the 21
highest phase to another phase that is lower, SCE considers this solution first as it maximizes the use of 22
existing capacity without requiring additional infrastructure to be installed. This solution is termed 23
“phase balancing.” 24
Figure II-5 below shows an example of how the peak loading on a circuit 25
can be reduced by phase balancing. The figure shows two days of loading before balancing, one day 26
during the balancing process, and one day after the balancing has occurred. While phase balancing is 27
often a cost-effective solution, this may not always be the case depending on the particular system 28
characteristics, the load profiles of individual customers and DERs, and how and where they are 29
physically connected to the circuits. 30

16
Figure II-5 Circuit Load Phase Balancing
If phase balancing is not an available option, SCE analyzes potential 1
solutions that transfer load through switching to balance the load among the distribution circuits. 2
This load balancing activity involves using existing sectionalizing devices (e.g., switches located at 3
strategic locations along a circuit) to transfer a section of one circuit to an adjacent circuit. 4
Distribution circuits are designed to include switches (normally operated in the “closed” position 5
allowing power to flow through them) along the mainline of the circuit as well as having other switches 6
(normally operated in the “open” position not allowing power to flow through them) located at the ends 7
of the circuit at connection points to adjacent circuits. If neighboring facilities have sufficient reserve 8
capacity, and if infrastructure exists that tie the circuits and/or substations together, SCE will consider 9
performing load transfers through use of those facilities to reduce loading on the facilities that are 10
projected to have loading violations. In doing so, SCE maximizes use of existing capacity and 11
infrastructure. Phase balancing and load balancing are types of solutions that typically incur minimal to 12
no capital expense and often solve identified overloads by increasing the utilization of installed assets. 13
If existing infrastructure configurations cannot address the identified needs 14
through phase balancing or load balancing, the next option is to consider upgrades to installed facilities 15

17
or installation of new facilities to allow for the use of existing capacity reserves through the transfer of 1
load between distribution circuitry and substations. This option is covered in the next section addressing 2
distribution circuit upgrades. 3
(2) Distribution Circuit Upgrades 4
Within SCE’s DSP planning process, if it is forecasted that any portion of 5
the distribution system is expected to exceed operating limits and if existing facilities cannot meet 6
system needs after evaluating phase balancing and load balancing alternatives, then projects to upgrade 7
distribution circuits are evaluated. The process begins by evaluating solutions that could provide 8
additional system capacity through upgrades to existing distribution circuits. While distribution circuit 9
upgrades most commonly address system issues, such as circuit-related capacity or reliability concerns, 10
they may also function to address distribution substation capacity concerns. Typical work includes 11
addressing loading or reliability issues through the installation of new switches, replacement of cables or 12
conductors with those of a higher capacity, or installing new cables or conductors to create circuit ties to 13
facilitate load transfers between circuits and substations. The expenditure forecast for this type of work 14
is presented in the Distribution Circuit Upgrade Section II.D.1.a). 15
(3) New Distribution Circuits 16
If a distribution circuit upgrade project is not expected to be able to meet 17
the need of a projected violation, or if the distribution circuit upgrade solution is economically 18
impractical and would not meet the long-term needs of the area, SCE then considers constructing new 19
distribution circuits. For example, if the average distribution circuit loading is projected to exceed 20
distribution planning criteria and guidelines, further analysis is performed to consider if multiple 21
existing distribution circuits in a general geographic area are forecast to reach or exceed capacity limits. 22
These considerations may result in the need for a new distribution circuit.24 23
SCE constructs new distribution circuits as part of one of three types of 24
projects: (1) standalone projects, (2) substation capacity increase projects, and (3) new substation 25
projects. When the need for a new distribution circuit is identified to relieve load from other distribution 26
circuits, the proposed new capacity is planned to not only allow for the transfer of load from the highly 27
24 As discussed previously, this type of work is only pursued after considering lower cost solutions including
phase balancing, load balancing, and distribution circuit upgrades.

18
loaded existing circuits (in order to bring them to within acceptable planned loading limits), but also to 1
provide circuit ties to increase operational flexibility. 2
(4) Substation Expansion Projects 3
SCE strives to maximize the planned utilization across the system by first 4
designing distribution facilities to provide sufficient capacity and operational flexibility to allow for 5
reconfiguring of distribution circuits while balance loading across both the distribution circuits and 6
substations to accommodate serving customer demand under peak load conditions during both normal 7
and emergency system conditions. 8
If a distribution substation is projected to exceed its planning limits, and 9
due to capacity limitations at neighboring substations or because there are no solutions possible that 10
would involve load transfers to address the capacity deficits, a project to increase the capacity of a 11
substation may be the most cost-effective solution. These types of projects are identified as “substation 12
expansion projects” and may include such activities as installing new substation transformers, replacing 13
lower capacity substation transformers with ones of higher capacity, or replacing capacity-limiting 14
components. A substation expansion project is compared to other alternatives to ensure the most 15
economical project or combination of projects is selected to reliably meet the long-term needs of the 16
area. For example, it may be more economical to add capacity at a distribution substation, often in 17
combination with a new distribution circuit to offload a neighboring substation, instead of constructing a 18
new substation. 19
(5) New Substation Projects 20
In some instances, a project to construct a new substation is the most cost-21
effective long-term solution. One example is if an addition of capacity to an existing substation through 22
either an upgrade of equipment within the existing substation property or through an expansion of the 23
substation property is not practical or feasible. Another is if multiple existing distribution substations in 24
the same geographic region are already constructed to their maximum design capacities and are 25
projected to experience continued load growth. A third is if a new development is being constructed in 26
an area either isolated from existing electrical facilities or where there is insufficient electrical 27
infrastructure. In each of the preceding examples, a new substation may prove to be the preferred 28
economical solution to address the long-term needs of the area when compared to other feasible 29
alternatives. 30

19
b) Planning for DERs and the DER-driven Upgrades 1
As described above in Section II.C.1.c), SCE analyzes high DER output 2
conditions to determine whether system upgrades are necessary to accommodate the growth of DERs. 3
The analysis includes the same planning thresholds, criteria, and practices as those used to evaluate peak 4
load conditions. This includes utilizing the same thermal loading, voltage, and protection limits of 5
distribution and substation equipment. Due to the nature and complexity of DERs in real-time, the 6
analysis also identifies areas with higher DER adoption, which can impact the ability for SCE’s grid 7
operators to effectively shift load under normal, emergency or contingency conditions. Similar to load 8
transfers, DERs need to be balanced across feeders to provide engineers and grid operators the necessary 9
level of operational flexibility.25 Because of these impacts, SCE identifies circuits and substations with 10
higher DER penetration and identifies the required upgrades in order to maintain adequate reliability and 11
operational flexibility on an increasingly complex distribution grid. 12
c) Subtransmission Planning and Transmission Substation Plan (TSP) 13
After performing the planning activities for the Distribution Substation Plan and 14
developing the associated loading projections for each of the distribution substations, these values then 15
become the necessary inputs to perform the planning activities associated with SCE’s higher voltage 16
assets: transmission substations and SCE’s subtransmission lines and equipment as shown in Figure II-3. 17
The Transmission Substation Plan (TSP), which includes the Subtransmission Line Plan, the A-bank 18
Plan, and the Subtransmission VAR Plan,26 captures the reliability needs of the higher voltage 19
substations and equipment. 20
Whereas the DSP uses the loading projected for the highest expected temperature 21
within a ten-year period, referred to as a one-in-ten year heat storm condition, the A-bank Plan and 22
Subtransmission VAR Plan use the loading expected for the highest expected temperature within a five-23
year period, referred to as a one-in-five year heat storm condition. This is because Subtransmission and 24
Transmission networks and their facilities cover much larger geographic areas as compared to 25
25 “Operational Flexibility” allows power system operators to respond in real-time to variations in load and
system voltages to pre-emptively or reactively maintain system reliability.
26 Volt-ampere reactive power (VAR) is the unit used to measure reactive power in alternating current electric systems. Because alternating current systems have varying voltage, these systems must vary the current with the voltage to maintain stability. VARs measure the lead or lag between synchronization of voltage and current.

20
distribution substations and there is a lower probability that the entire area, and each distribution 1
substation within that area, would experience the same extreme weather conditions at coincident times. 2
Conversely, because distribution substations serve smaller geographic areas, there is a higher probability 3
that several adjacent distribution substations may each experience similar extreme weather conditions at 4
coincident times, resulting in a reduction in the ability for adjacent distribution substations to provide 5
loading relief to each other. Thus while distribution substation planning requires a higher value of 6
capacity margin, the applicable criteria for the planning activities associated with the A-bank Plan and 7
Subtransmission VAR Plan allow for a reduction in the planning margins required to account for peak 8
loading. 9
(1) Subtransmission Lines Plan 10
Subtransmission lines operating at 66 kV or 115 kV deliver electricity 11
from the low-voltage side of SCE’s transmission substation transformers to the distribution substations. 12
These subtransmission lines are interconnected together to form a network of lines that serve the 13
distribution substations. A networked configuration provides multiple pathways to the distribution 14
substations, which in turn increases the reliable delivery of power to the substations, allowing for the 15
system to provide continuity of service during both normal system conditions when all facilities are in-16
service, and during abnormal system conditions when electrical facilities may be out-of-service due to 17
planned or unplanned outages. 18
The objective of the Subtransmission Lines Plan is to provide sufficient 19
66 kV or 115 kV subtransmission line capacity to serve the projected peak load of SCE’s distribution 20
substations. Through power flow studies, the capacities of each subtransmission line are evaluated to 21
determine if they can be safely operated within established loading limits under normal conditions with 22
all facilities in service (“Base Case”), and under abnormal conditions when equipment is out of service 23
due to planned or unplanned outages (“Likely Contingency”). These power flow studies also evaluate 24
whether adequate voltage can be maintained under normal and abnormal conditions. When it is 25
projected that a subtransmission line will become overloaded or that it cannot maintain adequate 26
voltage, low-cost operational solutions are first considered, similar to the distribution planning process. 27
These include determining if existing infrastructure can be utilized to transfer customer load from 28
highly-loaded subtransmission lines to others with sufficient reserve capacity. Often this occurs through 29
load transfers from one distribution substation to another using distribution circuitry. If such a solution is 30
determined to be infeasible, a project may be initiated to expand, upgrade, or reinforce the 31

21
subtransmission system to address the identified issues. Typical projects include replacing existing 1
subtransmission conductors (“reconductoring”) with higher capacity conductors, replacing limiting 2
components such as switches or circuit breakers with those of higher capacities, constructing new 3
subtransmission lines, and/or installing 66 kV or 115 kV capacitor banks at distribution substations. 4
SCE’s subtransmission planning criteria and guidelines also provide 5
guidance on how many subtransmission lines are necessary to provide adequate reliability and power 6
delivery to each of the distribution substations depending on how much load is projected to be served. 7
Over time, as distribution substation load is projected to increase in an area, an additional 8
subtransmission line may need to be constructed to ensure sufficient capacity will be available under 9
peak load conditions and under normal and abnormal system conditions. When these conditions are 10
identified, SCE reviews the various available alternatives described above to select the most cost-11
effective solution that meets the system loading needs while maintaining safe and reliable service. 12
(2) A-bank Plan 13
SCE’s load-serving substations that reduce voltage from the transmission 14
level (220 kV or 500 kV) to the subtransmission level (66 kV or 115 kV) are termed “A-bank” 15
substations. These substations function as the interface points in between the transmission system and 16
the generation units connected to it, and SCE’s subtransmission systems and distribution substations. 17
A-bank substations contain transformers that reduce transmission-level voltage (220 kV or 500 kV) to 18
lower levels (66kV or 115 kV) that are compatible with the subtransmission networks that provide 19
power to the distribution substations. SCE identifies any system-related issues and associated 20
mitigations in its annual A-bank Plan. The process is similar to SCE’s DSP; however, the A-bank Plan 21
reviews the 500/115 kV, 220/115 kV, and 220/66 kV A-bank substations over the ten-year planning 22
horizon. The purpose of the A-bank Plan is to identify potential transformer overload conditions and 23
voltage criteria violations to avoid the risk of loading beyond their capabilities. The consequences of 24
overloading these transformers could result in excessive degradation of transformer life or failures of the 25
transformer or other associated equipment that could result in service interruptions to customers. A-bank 26
substations commonly serve many distribution substations over widespread geographic areas. As they 27
act as the primary source of power to many distribution substations, the impact of power delivery can be 28
of much greater magnitude than that of distribution substations. 29

22
(3) Subtransmission VAR Plan 1
The objective of SCE’s Subtransmission VAR Plan is to fully supply the 2
reactive power needs of each of the 66 kV and 115 kV subtransmission networks including the A-bank 3
substations that serve them. This evaluation, like the Subtransmission Lines Plan and the A-bank Plan, 4
occurs using projected loading under one-in-five year heat storm conditions and is intended to ensure 5
there is sufficient reactive support to avoid reactive power deficiencies that adversely impact both the 6
transmission and subtransmission systems. This is accomplished by comparing reactive power supplies 7
(primarily 66 kV and 115 kV capacitor banks) against the projected reactive power requirements of the 8
A-bank substation transformers, subtransmission lines, and any large customers SCE serves directly at 9
the subtransmission voltage level. When it is projected that a VAR deficiency will occur within the ten-10
year planning horizon, SCE reviews alternatives, which include installations of 66 kV or 115 kV 11
substation capacitor banks. These capacitor banks are typically installed at the low-voltage side of 12
SCE’s A-bank substations. 13
3. System Improvement Programs 14
a) Distribution Plant Betterment 15
Besides improvements and projects covered by SCE’s Distribution Circuit 16
Upgrades (DCU) program, needs for other upgrades arise because of isolated local reasons. These may 17
be caused by a variety of scenarios, which could include changes in load profiles that drive localized low 18
voltage problems, instances where new protection devices and switches are needed for safety and 19
reliability, new residential developments that require a circuit voltage not present, or new street or 20
freeway improvements. The Distribution Plan Betterment program is used to address these critical 21
concerns that are outside of the needs covered under the DCU program. 22
b) Distribution VAR Plan 23
Capacitor banks are installed throughout the distribution system to supply needed 24
reactive power to help maintain adequate power factor and help supply customers sufficient voltage. 25
In the Distribution VAR Plan, SCE reviews requirements for capacitor banks on 26
distribution circuits for the upcoming year based on forecast load growth. Without a comprehensive 27
Distribution VAR Plan, SCE would risk undersupplying the reactive power needs of the distribution 28
system as demand for electricity continues to increase. Inadequate distribution VAR supplies would 29
cause the need for subtransmission and transmission systems to supply the required VARs to the 30
23
distribution system, an undesirable condition based on the need for voltage stability. Under worst case 1
conditions, voltage instability is mitigated by shedding load. 2
The objective of the Distribution VAR Plan is to fully supply the peak reactive 3
power needs of each of the distribution circuits under normal weather conditions; this means 4
maintaining unity power factor (zero reactive demand) at each distribution circuit. These reactive power 5
needs increase as load is added to distribution circuits. When a distribution circuit is forecast to have a 6
VAR deficiency, SCE will design a capital project to install either an overhead or pad mounted capacitor 7
bank on the circuit, depending on the circuit configuration. 8
c) Distribution Volt VAR Control (DVVC) 9
The Distribution Volt VAR Control (DVVC) Program centralizes control of the 10
field and substation capacitors to coordinate and optimize voltage and VARs across all distribution 11
circuits fed by a distribution substation. The DVVC program has several objectives: minimizing 12
1) system-wide voltage, 2) energy consumption, and 3) capacitor switching, while maintaining overall 13
customer Rule 227 service voltage requirements and operating within the local distribution field 14
Programmable Capacitor Controls (PCC) settings. 15
The DVVC is implemented at SCE as a centralized voltage and VAR control 16
scheme through the Distribution Management System (DMS) and the Energy Management System 17
(EMS), which controls the switching of existing capacitors in substations and on distribution circuits. 18
d) Substation Equipment Replacement Program 19
The Substation Equipment Replacement Program (SERP) evaluates the adequacy 20
of substation terminal equipment and system protection equipment, and proposes upgrades when 21
deficiencies are identified. The SERP identifies substations where available fault current, or short-circuit 22
duty, exceeds safe equipment ratings essential to the provision of safe, reliable service. 23
SCE’s electrical distribution system is designed to safely detect and isolate faults. 24
Distribution system faults can be caused by natural events, equipment failures, or accidents caused by 25
human error. When a fault occurs, dangerous levels of current flow from all electrical sources to the 26
location of the fault. Due to the magnitude of fault current, a fault condition must be isolated quickly to 27
restore safe operating conditions to the electrical system. Not isolating a fault quickly enough can cause 28
major damage to distribution equipment, can cause catastrophic failure, and can seriously jeopardize 29
27 Voltage as designated in the ANSI C84.1 standard and modified by California Rule 2.
24
public and employee safety. Substation circuit breakers are the most common devices used to isolate 1
faults and are relied upon to interrupt the highest fault currents experienced on the distribution system. 2
If they are incapable of interrupting expected fault currents, the circuit breaker(s) is/are likely to fail 3
when those faults occur. Such failures can be violent and result in widespread and prolonged outages. 4
e) DER-driven Circuit Breaker Upgrades 5
Similar to the Substation Equipment Replacement Program (SERP), SCE 6
evaluates the adequacy of substation terminal equipment and system protection equipment with the 7
increased short circuit current from DERs, and proposes upgrades when deficiencies are identified. 8
When a fault occurs near inverter-based resources such as DERs, higher levels of 9
current flow from all electrical sources (i.e. generators) to the location of the fault. SCE assumes the 10
level of fault contribution from DERs that is published in SCE’s Integrated Capacity Analysis (ICA)28 in 11
this analysis as opposed to SERP, which only considers fault contribution from generators connected at 12
the transmission and subtransmission voltage levels. 13
4. Deferral Opportunities 14
Pursuant to Commission guidance in the DRP, SCE annually publishes the projects 15
identified within the first five years that address the system needs in the Distribution Deferral 16
Opportunities Report (DDOR). This information, in conjunction with the Grid Needs Assessment 17
(GNA), provides data to the public to support competitive market participation to defer traditional 18
infrastructure investments via competitively sourced DERs. As further described in SCE-02 Volume 4 19
Part 1, Chapter II: Grid Modernization, the five Engineering and Planning (E&P) tools and GMS 20
collectively support the Commission’s vision of deferring traditional wires solutions with DERs via the 21
DIDF. 22
5. Implementation of Solutions 23
Following the completion of each of the described planning processes and the 24
determination of the appropriate solutions to meet the system needs, the next step is to proceed with the 25
needed capital improvements. The implementation of the proposed solutions begins with internal 26
stakeholder review at various stages. Part of this review includes the coordination of work activities to 27
find efficiencies through coordinating construction activities, avoiding any duplicative or redundant 28
work with other programs, such as aging infrastructure replacement. 29
28 See SCE-02, Vol. 4 Part 1 for description of ICA.

25
As an example, if it is determined that a preferred solution to meet a system capacity 1
need is to replace an older, smaller capacity substation transformer with one of a larger capacity, a 2
substation expansion project will be initiated. During the stakeholder review process it is reviewed and 3
determined that the same transformer has been identified for replacement due to review of aging 4
infrastructure. Each project’s needs are evaluated and prioritized to determine which program would 5
support the replacement of the transformer, while the other program would cancel the duplicative scope. 6
This process exists to avoid unnecessary and overlapping work. Similar reviews occur across SCE’s 7
various capital investment programs to ensure efficient and cost-effective projects are proposed. 8
These reviews occur annually as part of SCE’s 10-year horizon planning processes. 9
D. Capital Expenditures – Load Growth 10
The Distribution and Subtransmission Planning Processes evaluate the system needs under load 11
and DER growth scenarios. The following capital expenditures are the result of SCE’s solution 12
identification process but reduced to account for shifts in overall priorities for public safety as described 13
by Mr. Kevin Payne in SCE-01, Volume 1. The near-term and long-term reliability needs driven by load 14
and DER growth are still projected, however, SCE has adjusted the Load Growth capital expenditure 15
requests in this application to account for SCE’s execution expectations and prioritization given the 16
resource constraints that the higher priority work poses. 17
For each Capital Expenditure in this section, SCE addresses any of the atypical variances that 18
may have recorded historically. It is important to note that due to the constraints mentioned and 19
compliance with DRP Track 3, Sub track 1 requirements listed in Section II.A.2.b)(1), the Capital 20
Expenditure forecasts will not necessarily trend with recorded costs for 2014-2018. SCE explains the 21
basis for each expenditure category in order to complement the justification for each category’s purpose 22
and need. 23
SCE is forecast to spend $1,638 million in total capital expenditures from 2019 – 2023, of which 24
$1,539 million is CPUC-Jurisdictional. Table II-1 shows the total company (FERC and CPUC-25
jurisdictional) capital expenditure summary and Table II-2 shows the CPUC-Jurisdictional capital 26
expenditures only. 27

26
Table II-1 Load Growth Capital Expenditure Summary
(Total Company – Nominal $000)
Table II-2 Load Growth Capital Expenditure Summary
(CPUC Jurisdictional – Nominal $000)
1. Distribution Substation Plan 1
As detailed in earlier sections, the outcome of SCE’s distribution planning process is the 2
coordinated set of solutions to address expected distribution system needs due to load growth and 3
customer changes in load type and behavior. After existing equipment is evaluated for opportunities to 4
solve distribution needs, the set of infrastructure solutions resulting from the progression described in 5
Section II.C.2.a) are covered in more detail here. 6
Line No.
Program/Project Category 2019 2020 2021 2022 2023 Total
1 Distribution Substation Plan $199,876 $262,086 $183,857 $103,258 $92,716 $841,7922 DER-Driven Grid Reinforcement $0 $512 $42,523 $22,788 $27,677 $93,5003 Transmission Substation Plan $86,427 $108,769 $87,291 $117,885 $136,422 $536,7944 System Improvement Programs $45,440 $41,258 $46,806 $16,893 $12,182 $162,5795 Land Rights Management $580 $599 $633 $652 $671 $3,1356 Totals $332,323 $413,224 $361,109 $261,476 $269,668 $1,637,800
Line No.
Program/Project Category 2019 2020 2021 2022 2023 Total
1 Distribution Substation Plan $199,876 $262,086 $183,857 $103,258 $92,716 $841,7922 DER-Driven Grid Reinforcement $0 $512 $42,523 $22,788 $27,677 $93,5003 Transmission Substation Plan $83,657 $107,787 $86,243 $88,011 $72,277 $437,9754 System Improvement Programs $45,440 $41,258 $46,806 $16,893 $12,182 $162,5795 Land Rights Management $580 $599 $633 $652 $671 $3,1356 Totals $329,553 $412,242 $360,061 $231,602 $205,523 $1,538,981
27
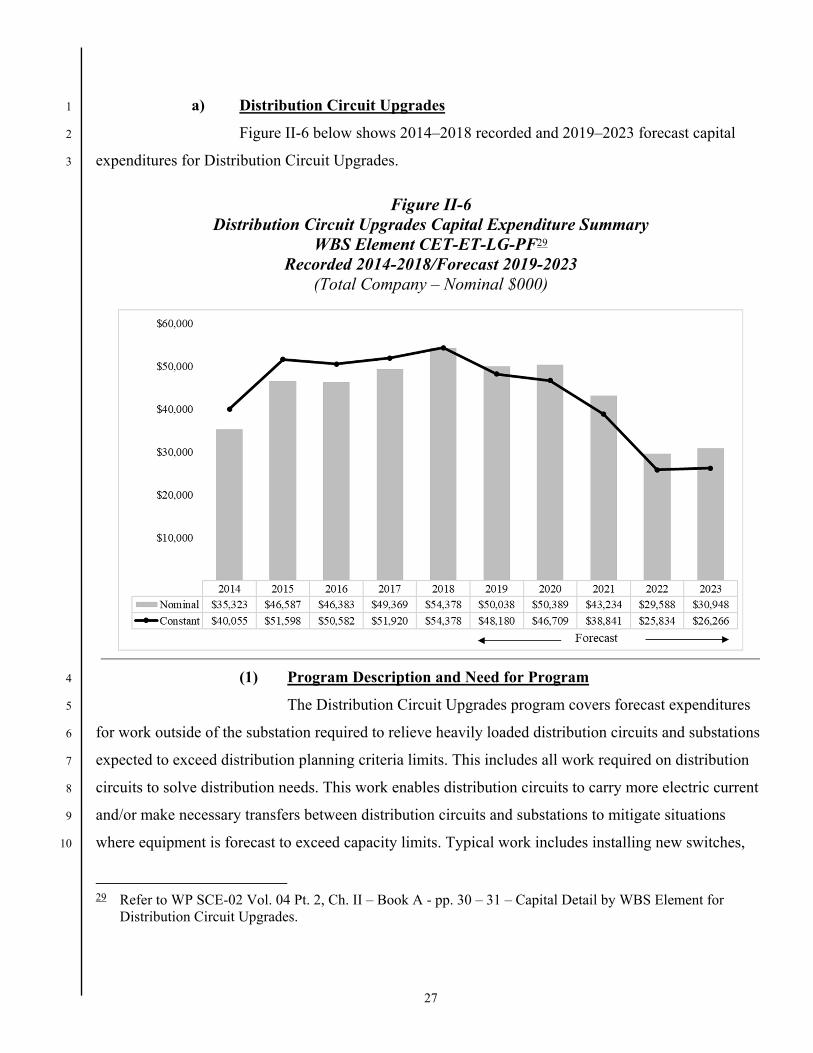
a) Distribution Circuit Upgrades 1
Figure II-6 below shows 2014–2018 recorded and 2019–2023 forecast capital 2
expenditures for Distribution Circuit Upgrades. 3
Figure II-6 Distribution Circuit Upgrades Capital Expenditure Summary
WBS Element CET-ET-LG-PF29 Recorded 2014-2018/Forecast 2019-2023
(Total Company – Nominal $000)
(1) Program Description and Need for Program 4
The Distribution Circuit Upgrades program covers forecast expenditures 5
for work outside of the substation required to relieve heavily loaded distribution circuits and substations 6
expected to exceed distribution planning criteria limits. This includes all work required on distribution 7
circuits to solve distribution needs. This work enables distribution circuits to carry more electric current 8
and/or make necessary transfers between distribution circuits and substations to mitigate situations 9
where equipment is forecast to exceed capacity limits. Typical work includes installing new switches, 10
29 Refer to WP SCE-02 Vol. 04 Pt. 2, Ch. II – Book A - pp. 30 – 31 – Capital Detail by WBS Element for
Distribution Circuit Upgrades.

28
upgrading cable or conductor, or installing new conductor to create circuit ties to facilitate load transfers 1
between substations and circuits. 2
As an example, if Substation A is forecast to exceed its installed capacity 3
and neighboring Substation B has capacity in reserve, but no circuit ties between the two exist or if 4
circuit ties do exist but are not of sufficient capacity, a distribution circuit upgrade may be proposed to 5
either create a circuit tie or to upgrade the capacity of existing facilities to allow for load transfers from 6
Substation A to Substation B. This upgrade and associated load transfer would serve to lower the 7
loading of Substation A to within its capacity limits by utilizing existing capacity reserves of Substation 8
B. This scenario is depicted in Figure II-7. 9
Figure II-7 Distribution Circuit Upgrade Relieving Substation Capacity Limitation
In Figure II-7 before any upgrade or load transfer, Substation A is shown 10
to be overloaded by 3 MW, while Substation B has 20 MW of reserve capacity. By adding a circuit tie 11

29
between Substations A and B, the projected overload condition of Substation A can be remedied by 1
utilizing the existing reserve capacity of Substation B, thus avoiding a substation upgrade project. 2
In some cases, distribution circuit upgrades are necessary to address issues 3
that result from the high loading of multiple distribution circuits which share common underground 4
facilities. Underground conduit systems are comprised of concrete-encased conduits and underground 5
structures such as vaults or manholes. Heat dissipation is a significant issue that impacts underground 6
facilities. As loading levels increase, so does the heat that the conductors emit. The operational capacity 7
of a conductor is directly correlated with the temperature of the environment that the conductor is 8
operated in. When multiple distribution circuits are in common underground structures, each contribute 9
to the collective temperature. To prevent equipment damage or failure, temperatures must be maintained 10
to within equipment specifications, and this can result in the need to reduce the individual loading 11
capabilities of each of the circuits. To avoid the loss in capacity and to maintain safe and reliable 12
operating conditions, distribution circuit upgrades may be proposed to reconfigure underground conduit 13
systems to reduce the number of circuits sharing structures, thereby producing a corresponding reduction 14
in the operating temperature of the equipment. Reconfiguration of underground facilities can include 15
installing additional conduits in separate duct banks and then rerouting distribution circuits, installing 16
additional vaults or manholes, or replacing underground cables with those of higher capacity. In this 17
manner, distribution circuit upgrades may serve to address capacity and reliability issues specifically 18
associated with underground distribution facilities. 19
(2) Basis for Capital Expenditure Forecast 20
Figure II-6 above summarizes recorded costs for the 2014–2018 period for 21
the Distribution Circuit Upgrades category, and forecast expenditures for the 2019–2023 period. 22
The total forecast cost for the 2019–2023 period is $204.20 million (in nominal dollars). From 2014–23
2018, SCE’s expenditures on this program averaged approximately $49.7 million per year (in constant 24
2018 dollars). The forecast for 2019-2023 averages to $37.2 million per year (in constant 2018 dollars). 25
Figure II-6 provides the forecast expenditures for 2019 & 2020 which are 26
based on scoped work. For 2021-2023, SCE uses a growth ratio30 to calculate the proportion of capital 27
expenditure needed in a year relative to the forecast load growth in that year. The growth ratio is 28
30 Refer to WP SCE-02 Vol. 04 Pt. 2, Ch. II – Book A - pp. 32 – 33 – Distribution Circuit Upgrades Forecast
Methodology.
30
calculated for each year using two key variables: 1) the costs of completed or planned distribution circuit 1
upgrades from a given year and 2) its corresponding load growth assumption.31 2
The growth ratio is important for Distribution Circuit Upgrades due to the 3
diversity of projects’ scope that fall under this category; work performed under this category varies 4
significantly based on the need. It can include installing new switches, upgrading cable or conductor, or 5
installing new conductor to create circuit ties to facilitate load transfers between substations and circuits. 6
It can also include rearrangement of underground facilities to reduce underground cable temperature and 7
installing or replacing equipment to increase the capacity of a distribution circuit. Typically, work for 8
this category is scoped not more than one to two years prior to the distribution need and mitigates the 9
identified need within that timeframe. The diversity of scope and the short turn-around in execution of 10
actual projects means a typical unit cost and unit count methodology isn’t optimal. A growth ratio 11
allows for adequate planning given these two factors. 12
31 Refer to WP SCE-02 Vol. 04 Pt. 2, Ch. II – Book A - pp. 32 – 33 – Distribution Circuit Upgrades Forecast
Methodology.
31
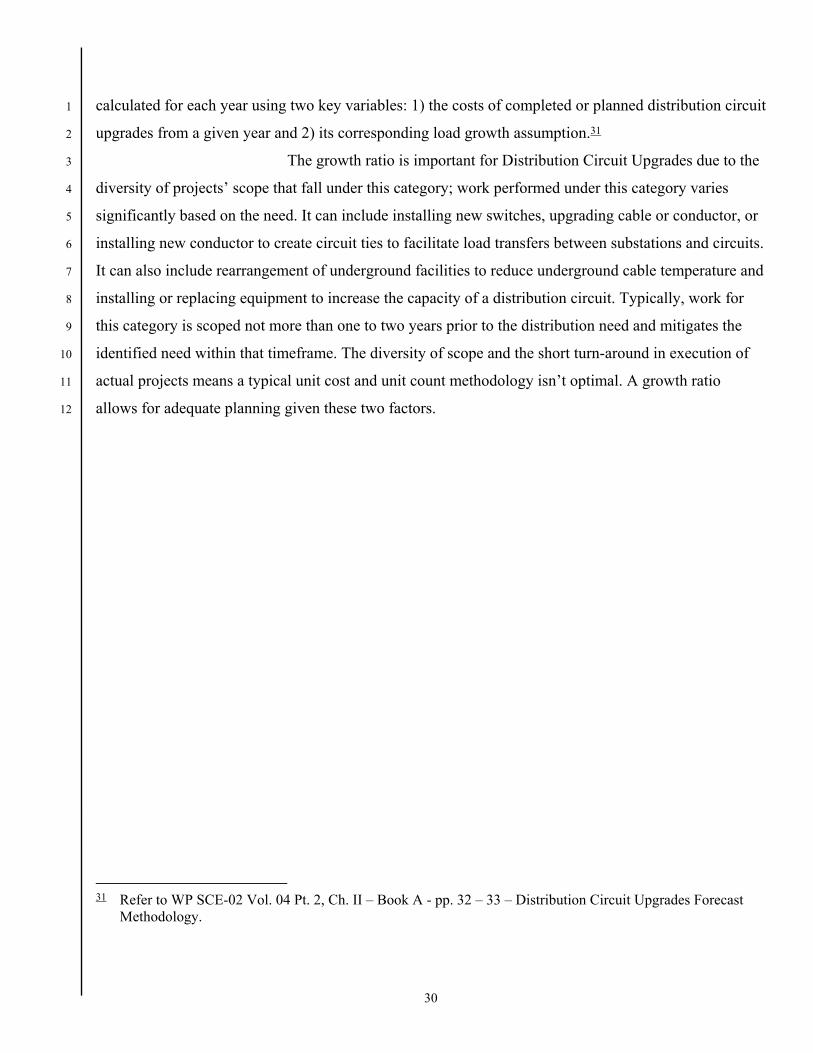
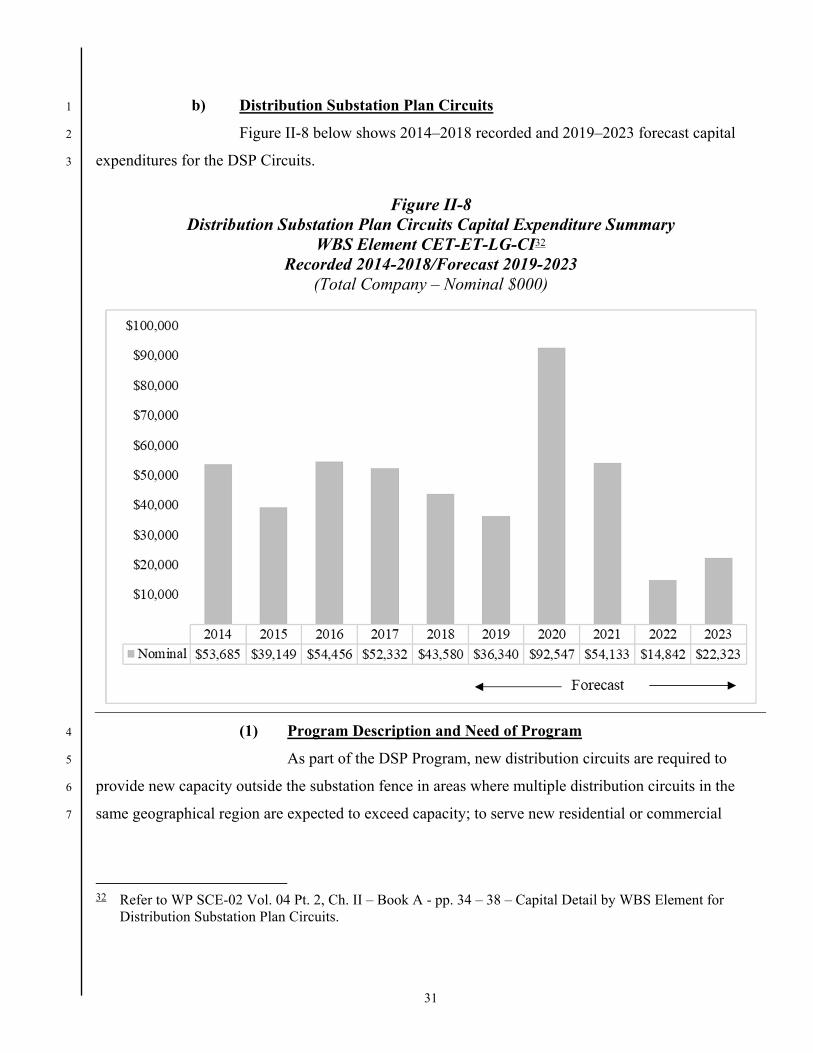
b) Distribution Substation Plan Circuits 1
Figure II-8 below shows 2014–2018 recorded and 2019–2023 forecast capital 2
expenditures for the DSP Circuits. 3
Figure II-8 Distribution Substation Plan Circuits Capital Expenditure Summary
WBS Element CET-ET-LG-CI32 Recorded 2014-2018/Forecast 2019-2023
(Total Company – Nominal $000)
(1) Program Description and Need of Program 4
As part of the DSP Program, new distribution circuits are required to 5
provide new capacity outside the substation fence in areas where multiple distribution circuits in the 6
same geographical region are expected to exceed capacity; to serve new residential or commercial 7
32 Refer to WP SCE-02 Vol. 04 Pt. 2, Ch. II – Book A - pp. 34 – 38 – Capital Detail by WBS Element for
Distribution Substation Plan Circuits.

32
developments in areas with no existing electrical infrastructure; and to relieve existing circuits projected 1
to exceed capacity in geographically isolated areas with limited usable circuit ties to transfer load. 2
As described in Section II.D.1.a)(1), distribution circuits may also be used 3
to relieve distribution substations expected to exceed capacity by transferring existing customers to a 4
neighboring substation through the circuit. When the existing circuitry does not have adequate capacity, 5
new circuits are needed to accomplish this transfer of customers. As an example, if Substation A is 6
forecast to exceed its substation transformer capacity limit and it is determined that the adjacent 7
Substation B has available substation transformer capacity that can provide loading relief to Substation 8
A through balancing loads between them, SCE evaluates means to transfer load from Substation A to 9
Substation B through the existing distribution circuitry between the two substations. If there is 10
insufficient distribution circuit capacity to accommodate this, SCE evaluates whether construction of a 11
new distribution circuit is economically preferred over other alternatives such as adding substation 12
transformer capacity to Substation A or constructing a new distribution substation. If for example, the 13
distance between Substation A and Substation B is significant and the corresponding new distribution 14
circuit scope is substantial, the cost to construct a new distribution circuit may exceed other alternatives 15
such as substation transformer capacity addition. The option of a new distribution circuit as a solution to 16
offload a neighboring substation is compared to the cost and overall effectiveness of a substation 17
capacity addition project to determine the preferred alternative to meet the long term needs of the area. 18
Figure II-9 represents a graphical depiction of the example. 19

33
Figure II-9 DSP New Circuit Used to Offload Substation
In the pre-project condition, Substation A is projected to be overloaded by 1
5 MW and Substation B has 20 MW of reserve capacity. The loading on the existing circuits that tie 2
between the two substations are highly loaded, cannot be sufficiently offloaded to other circuits, and are 3
unable to be further upgraded. In this example, a new distribution circuit could be constructed from 4
Substation B in a manner than could perform several functions. Properly designed, it would provide a 5
means to connect to both the highly loaded circuits from Substation A and Substation B to transfer load 6
from those circuits to it thereby reducing the circuit loading on those circuits. Additionally, as it would 7
provide loading relief to the highly loaded circuit(s) from Substation A, it in turn provides the needed 8
loading relief to the substation transformers of Substation A. The post-project condition results in an 9
34
infrastructure addition of a new distribution circuit effectively addressing capacity deficiencies of 1
Substation A. This is performed by utilizing available capacity of Substation B with the net result being 2
the desired reduction of loading at Substation A to within acceptable loading limits while also 3
maintaining the loading at Substation B to within acceptable loading limits. The new distribution circuit 4
also adds operational flexibility to the area by reducing the loading on the highly loaded circuits 5
impacted, thereby increasing their transfer capability, which is especially important during unplanned 6
outages while restoring service. 7
(2) Basis for Capital Expenditure Forecast 8
Figure II-8 above shows the historical and forecast costs for all three 9
categories of new distribution circuits resulting from new substation projects, substation capacity 10
increase projects, and projects with unique drivers. 11
Based on the need identified in the DSP process, SCE estimates the cost of 12
new distribution circuits. For circuits that have a need identified approximately two years out, SCE 13
develops detailed plans based on the specific characteristics of the project. The cost estimate for new 14
circuits needed beyond two years are typically estimated using historical costs, since detailed design and 15
cost estimates are not yet completed.33 16
Costs to construct a new circuit vary depending on several factors such as 17
whether the circuit is overhead or underground, the length of circuit, and geographic location. 18
The voltage of the new circuit is another large contributor in the variation of the cost of a new circuit. 19
New 33kV circuits are typically more expensive than 12kV or 16 kV circuits. This is due to the need for 20
larger equipment and larger facilities to accommodate the higher voltage. The average historic unit costs 21
for 12 kV and 16 kV circuits are $3.5 million and 33 kV circuits are $9.8 million.34 For new circuits, 22
SCE’s forecast reflects the timing of designing and constructing new distribution circuits. This is 23
becoming increasingly complex due to environmental and permitting requirements of local jurisdictional 24
agencies. 25
To allow sufficient lead time to complete construction of a new circuit, 26
SCE begins the design process one year before the need date for the circuit. Typically, SCE plans to 27
33 Refer to WP SCE-02 Vol. 04 Pt. 2, Ch. II – Book A - pp. 39 – 41 – Distribution Substation Plan Circuits
Forecast Methodology.
34 Refer to WP SCE-02 Vol. 04 Pt. 2, Ch II – Book A - pp. 39 – 41 – Distribution Substation Plan Circuits Forecast Methodology.

35
spend approximately 10 percent of the cost of a new circuit on early planning and design work one year 1
prior to the operating date of the circuit, and the remaining approximately 90 percent to complete 2
construction in the year that the circuit becomes operational. 3
c) Distribution Substation Plan Substations 4
Figure II-10 below shows 2014–2018 recorded and 2019–2023 forecast capital 5
expenditures for the DSP Substations. The figure provides Distribution Substation Plan costs SCE has 6
already incurred (i.e., expenditures made in 2018 or prior years for projects completed in the 2019-2023 7
period) and forecast costs for projects planned to be completed through 2023. The capital cost for each 8
of the projects are presented in the appropriate tables in the Section II.D.1.c)(2), which groups the 9
projects based on the scope of the work required. 10
Figure II-10 Distribution Plan Substations Capital Expenditure Summary
WBS Element CET-ET-LG-SU35 Recorded 2014-2018/Forecast 2019-2023
(Total Company – Nominal $000)
35 Refer to WP SCE-02 Vol. 04 Pt. 2, Ch. II – Book A - pp. 42 – 141 – Capital Detail by WBS Element for
Distribution Substation Plan Substations.
2014 2015 2016 2017 2018 2019 2020 2021 2022 2023
Nominal $71,121 $94,272 $59,669 $73,427 $87,084 $75,380 $92,282 $67,655 $39,450 $19,509
$10,000
$20,000
$30,000
$40,000
$50,000
$60,000
$70,000
$80,000
$90,000
$100,000
Forecast

36
(1) Program Description 1
As described in Section II.C.2, SCE identifies required substation projects 2
through the Distribution Substation Planning process when lower cost solutions, such as distribution 3
circuit upgrades or new circuits, do not adequately address an overload. Substation projects include 4
capacity additions or upgrades to facilities at existing substations and within the existing perimeter of 5
the substation property, additions or upgrades that require perimeter expansion of the substation 6
property, and new substations. 7
Distribution substation expansion projects come in two categories: 8
(1) Installation of new, or upgrades to existing, substation equipment within the existing fenced property 9
of a substation; and (2) Installation of new, or upgrades to existing, substation equipment at a substation 10
that requires additional substation property and/or expansion of its existing property to accommodate the 11
capacity increase. Most commonly, the preferred economical solution is to upgrade an existing 12
substation within the existing property prior to proposing to upgrade an existing substation by expanding 13
the property. However, sometimes the scope, costs, or other impacts required to upgrade or expand an 14
existing substation may be prohibitive when compared to the construction of a new substation. 15
These could include such things as power system limitations, limited available space to expand the 16
property, community impacts, and/or environmental impacts. New substation projects are covered in the 17
following section. 18

37
(2) Basis for Capital Expenditure Forecast 1
Table II-3 below provides Distribution Substation Plan costs we have 2
already incurred (i.e., expenditures made in 2018 or prior years for projects completed in the 2019-2023 3
period) and forecast costs for projects planned to be completed through 2023. 4
Table II-3 Substation Capacity Projects Capital Expenditure Summary36
(Total Company – Nominal $000)
SCE has identified 17 substation capacity projects with costs equal to or 5
greater than $3 million and the total cost for these 17 projects is $400.1 million. The projects are 6
separated into three categories: substation capacity projects without perimeter expansion, substation 7
capacity projects requiring perimeter expansion, and new substations. Additional projects with less than 8
$3 million in CPUC-jurisdictional costs are not discussed here, but are included in workpapers.37 9
The total cost for these projects is $37.05 million and all of it is CPUC-jurisdictional. Projects with costs 10
in years 2019 - 2023, but have in service dates outside 2019-2023 are not discussed. The total for these 11
36 Refer to WP SCE-02 Vol. 04 Pt. 2, Ch. II – Book A - pp. 142 – 327 – Table II-3 Substation Capacity Projects.
37 Refer to WP SCE-02 Vol. 04 Pt. 2, Ch. II – Book A - pp. 328 – 329 – DSP Substations Projects Less than $3M CPUC-jurisdictional Costs.
Line No.
ProjectNo.
Project NameOperating
DatePrior 2019 2020 2021 2022 2023 Total
1 7796 Sullivan 66/12 kV Substation Jan-19 2,590 831 - - - - 3,421 2 8079 Sawtelle 66/16 kV Substation Jan-19 3,887 555 - - - - 4,442 3 7736 Goshen 66/12 kV Substation Apr-19 5,068 1,814 - - - - 6,882 4 5397 Falcon Ridge 66/12 kV Substation May-19 63,059 9,019 - - - - 72,078 5 8007 Rosamond 66/12 kV Substation Jun-19 2,063 2,377 - - - - 4,440 6 8125 Garnet 115/33 kV Substation Jun-19 389 3,784 - - - - 4,173 7 5194 Presidential 66/16 kV - System Alternative A Dec-19 9,519 2,586 - - - - 12,105 8 8146 Edwards 115/33 kV Substation Feb-20 46 2,016 5,010 - - - 7,072 9 8143 Signal Hill 66/12 kV Substation Mar-20 11 38 1,173 1,903 - - 3,125
10 7516 Safari 33/12 kV Substation Mar-20 30,429 9,953 5,088 - - - 45,470 11 8126 Devers 115/33 kV Substation Jun-20 69 3,989 8,041 62 - - 12,162 12 7188 Lee Vining 115/55 kV Hydro Substation Sep-20 4,584 8,024 13,661 13,098 - - 39,367 13 5174 San Antonio 66/16 kV Substation Dec-20 32 1,381 2,043 - - - 3,455 14 8101 Lancaster 66/12 kV Substation Dec-20 79 2,289 4,937 4,080 - - 11,385 15 8043 Garnet 115/33 kV Substation Nov-21 520 10,778 37,828 13,497 12,640 - 75,263 16 8102 Del Sur 66/12 kV Substation Dec-21 164 300 2,900 2,300 - - 5,664 17 6575 Circle City 66/12 kV Substation May-23 21,932 1,202 3,479 28,660 19,755 14,595 89,623 18 Subtotal 144,442 60,935 84,160 63,601 32,395 14,595 400,128 19 Projects with CPUC-jurisdictional cost < $3 M 7,867 13,371 7,973 3,072 4,142 624 37,048 20 Projects with operating date outside of GRC window 154,496 1,074 150 982 2,913 4,290 163,905 21 Total 306,805 75,380 92,282 67,655 39,450 19,509 601,081

38
projects is $9.4 million for 2019 – 2023.38 The tables in the following sections provide a brief scope 1
description and justification for each project in the category. Besides the three upcoming tables, three 2
additional projects fit outside of those categories and are documented separately in the section named 3
“Substation Projects with Unique Drivers.” The total capital expenditure for DSP substations from 2019-4
2023 is $294.3 million. 5
Examples of these types of projects include such things as replacement or 6
upgrades of substation transformers, circuit breakers, or other capacity-limiting equipment and additions 7
of facilities required for new distribution circuits. Table II-4 below itemizes nine DSP projects that can 8
be constructed inside the existing perimeter of the substation. These are classified as “Substation 9
Modification Projects” in Table II-7 and have been reviewed and determined not to require GO 131-D 10
licensing activities. 11
12
38 Refer to WP SCE-02 Vol. 04 Pt. 2, Ch. II – Book A - pp. 330 – 331 – DSP Substations Projects Outside the
GRC Window.

39
Tab
le I
I-4
Su
bsta
tion
Cap
acit
y P
roje
cts
Wit
hou
t Per
imet
er E
xpan
sion
(T
otal
Com
pany
– N
omin
al $
000)
Lin
e N
o.S
ubst
atio
nP
roje
ctN
o.O
pera
ting
D
ate
Loc
atio
nD
rive
rF
orec
aste
d V
iola
tion
Pro
ject
Sco
peT
otal
Cos
t
1S
ulliv
an66
/12
7796
2019
City
of S
anta
Ana
Bas
e lo
ad g
row
thR
evie
w o
f sub
stat
ion
com
pone
nts
resu
lted
in
dera
tion
of s
ubst
atio
n ca
paci
ty
Sul
livan
66/
12 S
ubst
atio
n is
pro
ject
ed to
rea
ch 1
05%
in 2
019
unde
r 1-
in-1
0 w
eath
er c
ondi
tions
I
nsta
ll 1-
28 M
VA
tran
sfor
mer
$3
,421
2S
awte
lle66
/16
8079
2019
Wes
t Los
A
ngel
es
Exp
ansi
on o
f loc
al m
etro
tran
spor
tatio
n S
awte
lle 6
6/16
Sub
stat
ion
is a
ppro
achi
ng c
apac
ity li
mita
tions
in 2
019
unde
r 1-
in-1
0 w
eath
er c
ondi
tions
Rem
ove
2-11
.2 M
VA
tran
sfor
mer
sIn
stal
l 2-2
8 M
VA
tran
sfor
mer
sIn
stal
l 1-1
6 kV
circ
uit
$4,4
42
3R
osam
ond
66/1
280
0720
19 C
ity o
f Ros
amon
d L
arge
indu
stria
l gro
wth
Ros
amon
d 66
/12
Sub
stat
ion
capa
city
wou
ld b
e un
able
to s
erve
pro
ject
ed
sing
le la
rge
cust
omer
gro
wth
. Bas
ed u
pon
anal
ysis
of t
he p
hase
of t
he
cust
omer
's lo
ad e
nerg
ized
in 2
018
and
unce
rtai
nty
in th
e cu
stom
ers
futu
re
phas
ing,
the
over
all n
eed
for
proj
ect 8
007
was
red
uced
. Pro
ject
800
7 w
as
alre
ady
near
com
plet
ion
whe
n th
e fo
reca
sted
nee
d re
duce
d. D
ue to
the
prog
ress
alre
ady
mad
e, th
e op
erat
ing
date
for
proj
ect 8
007
rem
ains
in 2
019
Rem
ove
1-10
MV
A tr
ansf
orm
erIn
stal
l 1-1
4 M
VA
tran
sfor
mer
Reb
uild
12
kV s
witc
hrac
kIn
stal
l 1-1
2 kV
circ
uit
$4,4
40
4G
arne
t11
5/33
8125
2019
Nor
th P
alm
S
prin
gs
New
cul
tivat
ion
load
in th
e ci
ty o
f Des
ert H
ot
Spr
ings
Gar
net 1
15/3
3 S
ubst
atio
n is
pro
ject
ed to
rea
ch 1
04%
in 2
019
unde
r 1-
in-1
0 w
eath
er c
ondi
tions
Pie
rson
, Gre
ener
, and
Pal
mvi
ew 3
3 kV
circ
uits
are
pro
ject
ed to
rea
ch
111.
3%, 1
02.2
%, a
nd 1
00.5
% r
espe
ctiv
ely
in 2
019
unde
r 1-
in-1
0 w
eath
er
cond
ition
s
Ins
tall
1-56
MV
A tr
ansf
orm
erIn
stal
l 2-3
3kV
circ
uits
$4
,173
5D
ever
s11
5/33
8126
2020
City
of D
eser
t H
ot S
prin
gs
New
cul
tivat
ion
load
in th
e ci
ty o
f Des
ert H
ot
Spr
ings
Pal
mvi
ew 3
3 kV
circ
uit i
s pr
ojec
ted
to r
each
127
% in
202
0 un
der
1-in
-10
wea
ther
con
ditio
nsC
oach
ella
and
Pie
rson
33
kV c
ircui
ts a
re p
roje
cted
to r
each
249
% a
nd 1
69%
re
spec
tivel
y in
202
1 un
der
1-in
-10
wea
ther
con
ditio
ns
Ins
tall
2-56
MV
A tr
ansf
orm
erIn
stal
l 33
kV s
witc
hrac
kIn
stal
l 2-3
3 kV
circ
uits
$1
2,16
2
6S
an A
nton
io66
/16
5174
2020
City
of M
ontc
lair
Bas
e lo
ad g
row
th
San
Ant
onio
66/
12 S
ubst
atio
n is
pro
ject
ed to
rea
ch 1
03%
in 2
021
unde
r 1-
in-
10 w
eath
er c
ondi
tions
Rem
ove
2-22
.4 M
VA
tran
sfor
mer
sIn
stal
l 2-2
8 M
VA
tran
sfor
mer
sIn
stal
l 2-1
2 kV
circ
uits
$3
,455
7L
anca
ster
66/1
281
0120
20 C
ity o
f Lan
cast
er B
ase
load
gro
wth
New
cul
tivat
ion
grow
th in
the
city
of L
anca
ster
L
anca
ster
66/
12 S
ubst
atio
n is
pro
ject
ed to
rea
ch 1
03%
in 2
019
and
111%
in
2021
und
er 1
-in-
10 w
eath
er c
ondi
tions
Rem
ove
2-22
.4 M
VA
tran
sfor
mer
sIn
stal
l 2-2
8 M
VA
tran
sfor
mer
sIn
stal
l 1-1
2 kV
circ
uits
$1
1,38
5
8S
igna
l Hill
66/1
281
4320
20 C
ity o
f Sig
nal H
ill
New
cul
tivat
ion
load
in th
e ci
ty o
f Lon
g B
each
S
igna
l Hill
66/
12 S
ubst
atio
n is
pro
ject
ed to
rea
ch 1
10%
in 2
019
and
112%
in
2021
und
er 1
-in-
10 w
eath
er c
ondi
tions
R
emov
e 2-
14 M
VA
tran
sfor
mer
sIn
stal
l 2-2
8 M
VA
tran
sfor
mer
s $3
,125
9D
el S
ur66
/12
8102
2021
City
of L
anca
ster
New
cul
tivat
ion
grow
th in
the
city
of L
anca
ster
Fle
et v
ehic
le e
lect
rific
atio
n S
now
den
12 k
V c
ircui
t pro
ject
ed to
rea
ch 1
49%
in 2
021
unde
r 1-
in-1
0 w
eath
er c
ondi
tions
I
nsta
ll 3-
12 k
V c
ircui
ts
$5,6
64
40
(a) Substation Capacity Projects Requiring Perimeter Expansion 1
Table II-5 lists the three DSP projects where the substation 2
capacity increase requires the existing substation perimeter to be expanded. The expansion may occur on 3
SCE-owned property or in some cases land must be purchased. The licensing determination and GO 4
131-D status information for these projects is contained in Section II.D.1.c)(2)(d) in the “Licensing 5
Status of New Substations and Substations Requiring Perimeter Expansions” section of this testimony. 6

41
Tab
le I
I-5
Su
bsta
tion
Cap
acit
y P
roje
cts
Req
uir
ing
Per
imet
er E
xpan
sion
(T
otal
Com
pany
– N
omin
al $
000)
Lin
e N
o.S
ubst
atio
nP
roje
ctN
o.O
pera
ting
D
ate
Loc
atio
nD
rive
rF
orec
aste
d V
iola
tion
Pro
ject
Sco
peT
otal
Cos
t
1G
oshe
n66
/12
7736
2019
City
of G
oshe
n B
ase
load
gro
wth
driv
en b
y ag
ricul
tura
l and
co
mm
erci
al lo
ads
Gos
hen
66/1
2 is
pro
ject
ed to
rea
ch 1
03%
in 2
021
unde
r 1-
in-1
0 w
eath
er c
ondi
tions
Har
rell
12 k
V c
ircui
t is
proj
ecte
d to
rea
ch 1
00.2
%
in 2
021
unde
r 1-
in-1
0 w
eath
er c
ondi
tions
Pro
ject
773
6 w
as a
lread
y in
con
stru
ctio
n w
hen
the
need
def
erre
d to
202
1. D
ue to
the
prog
ress
al
read
y m
ade
the
proj
ect o
pera
ting
date
rem
ains
in
2019
Rem
ove
2-14
MV
A tr
ansf
orm
ers
Rem
ove
1-15
.5 M
VA
tran
sfor
mer
Inst
all 2
-28
MV
A tr
ansf
orm
ers
Inst
all 1
-12
kV c
ircui
t
$6,8
82
2E
dwar
ds11
5/33
8146
2020
Ker
n C
ount
y,
Eas
t of R
osam
ond
New
cul
tivat
ion
load
in C
alifo
rnia
City
Ran
dsbu
rg 1
15/3
3 su
bsta
tion
proj
ecte
d to
rea
ch
257%
in 2
020
unde
r 1-
in-1
0 w
eath
er c
ondi
tions
Hea
vy 3
3 kV
circ
uit i
s pr
ojec
ted
to r
each
315
% in
20
20 u
nder
1-i
n-10
wea
ther
con
ditio
ns
$7,0
72
3G
arne
t11
5/33
8043
2021
Nor
th P
alm
S
prin
gs
New
cul
tivat
ion
load
in th
e ci
ty o
f Des
ert H
ot
Spr
ings
G
arne
t Sub
stat
ion
is u
nabl
e to
ser
ve n
ew
cutiv
atio
n lo
ad d
ue to
the
subs
tatio
n co
nfig
urat
ion
Ins
tall
1-56
MV
A tr
ansf
orm
erR
eloc
ate
3 -
56 M
VA
tran
sfor
mer
sR
ebui
ld 1
15 k
V s
witc
hrac
kR
ebui
ld 3
3 kV
sw
itchr
ack
$75,
263

42
(b) New Substations 1
Examples include those projects for which construction of new 2
substations are needed to provide the additional capacity required to meet the electrical needs of the 3
area. The projects below represent new substation projects which may require licensing activities. 4
The licensing determination and GO 131-D status information for these projects is contained in Table II-5
7 in the “Construction Licensing under G.O. 131-D” section of this testimony. SCE plans to construct 6
two new substations from 2019 – 2023, all of which are documented in Table II-6. 7

43
Tab
le I
I-6
New
Su
bsta
tion
Pro
ject
s (T
otal
Com
pany
– N
omin
al $
000)
Lin
e N
o.S
ubst
atio
nP
roje
ctN
o.O
pera
ting
D
ate
Loc
atio
nD
rive
rF
orec
aste
d V
iola
tion
Pro
ject
Sco
peT
otal
Cos
t
1F
alco
n R
idge
66/1
253
9720
19 C
ity o
f Ria
lto
Lar
ge r
esid
entia
l dev
elop
men
ts in
the
citie
s of
Ria
lto a
nd F
onta
na
Ran
dall
66/1
2 S
ubst
atio
n is
pro
ject
ed to
rea
ch
105%
in 2
019
unde
r 1-
in-1
0 w
eath
er c
ondi
tions
Con
stru
ct n
ew 6
6/12
sub
stat
ion
Inst
all 2
-28
MV
A tr
ansf
orm
ers
Inst
all 4
-12
kV c
ircui
ts
$72,
078
2S
afar
i33
/12
7516
2020
City
of I
rvin
e L
arge
dat
acen
ter
grow
thba
se r
esid
entia
l and
com
mer
cial
load
gr
owth
San
tiago
66/
12 S
ubst
atio
n is
pro
ject
ed to
rea
ch
100.
1% in
202
2 un
der
1-in
-10
wea
ther
con
ditio
nsE
uro
12 k
V c
ircui
t is
proj
ecte
d to
rea
ch 1
07%
in
2020
and
124
% in
202
1 un
der
1-in
-10
wea
ther
co
nditi
ons
Spe
cial
ized
12
kV c
ircui
t is
proj
ecte
d to
rea
ch
103%
in 2
020
unde
r 1-
in-1
0 w
eath
er c
ondi
tions
Tol
ar 1
2 kV
circ
uit i
s pr
ojec
ted
to r
each
106
% in
20
21 u
nder
1-i
n-10
wea
ther
con
ditio
ns
Con
stru
ct n
ew 3
3/12
sub
stat
ion
Inst
all 2
-28
MV
A tr
ansf
orm
ers
Inst
all 3
-12
kV c
ircui
tsC
onst
ruct
new
66/
33 s
ubst
atio
nIn
stal
l 2-5
6 M
VA
tran
sfor
mer
sIn
stal
l 2-3
3 kV
circ
uits
$45,
470
44
(c) Substation Projects With Unique Drivers 1
The dedicated descriptions below explain the unique nature of 2
three projects that do not fit in the three categories described above. These projects involve a system 3
alternative for a new substation and rebuilding a hydro substation facility. 4
(i) Presidential 66/16 kV Substation – System Alternative 5
A (Project #5194) 6
Presidential 66/16 kV Substation was a new proposed 7
substation planned near the border of Thousand Oaks and Simi Valley. The CPUC issued an amendment 8
to the final EIR on November 26, 2013 and the final Decision39 selected “System Alternative A” as the 9
preferred project, with the Presidential 66/16 kV substation project as the alternative project. The project 10
scope includes work at Royal 66/16 kV Substation in the city of Simi Valley and Potrero 66/16 kV 11
Substation in the city of Thousand Oaks. Royal 66/16 kV and Potrero 66/16 kV are projected to 12
approach capacity limits due to continuing residential load growth in Simi Valley and both residential 13
and commercial load growth in Thousand Oaks. The scope of work at Royal 66/16 kV Substation was to 14
replace a 22.4 MVA transformer bank with a 28 MVA transformer bank with an operating date of June 15
2016 and construct one new 16 kV distribution circuit with an operating date of June 2017. The scope of 16
work at Potrero 66/16 kV Substation was to construct a new 16 kV distribution circuit with an operating 17
date of June 2018 and replace limiting substation components to increase substation capacity with an 18
operating date of June 2019. The total project cost including work at both substations is $12.1 million. 19
SCE has identified one alternative for this project. 20
The alternative is to construct the new Presidential 66/16 kV Substation consisting of two 28 MVA, 21
66/12 kV transformers and four 16 kV distribution circuits. The preferred project “System Alternative 22
A,” was selected as part of D.14-03-00640 and is the least-cost solution. 23
(ii) Lee Vining 115/55 kV Hydro Substation (Project #7188) 24
Lee Vining 115/55 kV Substation is in the southern portion 25
of Lee Vining in Mono County, serves customers in the town of Lee Vining and provides 26
interconnection to multiple hydro generators in the area. Lee Vining 115/55 kV Substation was built in 27
the early 1900’s with a bus configuration that requires an outage for all customers served by the 28
39 D.14-03-006.
40 Id.
45
substation when any substation equipment requires servicing. The substation is also located 1
approximately a quarter mile from the Mono Lake Fault line and has antiquated equipment that is 2
vulnerable to significant earthquakes. The scope of the project includes a complete rebuild of the 3
substation to current reliability and seismic standards. This includes rebuilding the 115 kV and 55 kV 4
switchracks, replacing the 2.4 kV switchrack with a 12 kV switchrack, installing two 7 MVA 115/55 kV 5
transformers, and installing two 14 MVA 55/12 kV transformers. Upon completion of rebuilding Lee 6
Vining Substation, the Cain Ranch 2.4/12 kV substation will be decommissioned and the existing 2.4 kV 7
circuit currently served from Lee Vining Substation will require a new 12/2.4 kV pole top transformer. 8
This will allow SCE to continue serving customers from the same 2.4 kV distribution circuit. 9
The operating date is September 2020 with a total project cost of $39.4 million. 10
SCE has identified one alternative for this project. 11
The alternative is to eliminate the 55 kV facilities at Lee Vining 115/55 kV substation, which would 12
require upgrades to subtransmission lines and neighboring Lundy 55/16 kV substation. Under this 13
alternative, the scope of work at Lee Vining 115/55 kV substation would include converting the 14
substation from 115/55/2.4 kV to a 115/12 kV substation, rebuilding the 115 kV switchrack, installing 15
two 7 MVA 115/12 kV transformers, replacing the low voltage switchrack from 2.4 kV to 12 kV, and 16
reconfiguring distribution circuitry. The scope of work at Lundy 55/16 kV substation would include 17
replacing the existing 55 kV switchrack with a 115 kV switchrack, install two 14 MVA 115/16 kV 18
transformers, and install one 5 MVA 115/2.4 kV transformer to interconnect existing hydroelectric 19
generation. The subtransmission line work includes replacing approximately 14.8 miles of conductor 20
and poles converting both Lee Vining-Lundy No.1 and Lee Vining-Lundy No.2 from 55 kV to 115 kV 21
and tie in a new subtransmission line to feed temporary 115/55 kV transformation while the Lee Vining 22
115/55 kV substation rebuild construction is completed. The preferred project was selected because it is 23
the most cost-effective solution. 24
(iii) Circle City 66/12 kV Substation (Project #6575) 25
The Circle City 66/12 kV Substation Project was originally 26
proposed as a single project that combined two primary scope elements: 1) a new 66/12 kV distribution 27
substation (Circle City Substation), and 2) a new 66 kV subtransmission line (Mira Loma-Jefferson 66 28
kV Line). The Circle City 66/12 kV Substation portion of the project was a new proposed substation 29
planned in the City of Corona. Residential and commercial load growth was projected to exceed the 30
capacity of the existing facilities in the area: Corona 66/12 kV Substation, Chase 66/12 kV Substation, 31

46
Jefferson 66/12 kV Substation. The Mira Loma-Jefferson 66 kV Line portion of the project was a 1
proposed new 10.9 mile 66 kV subtransmission line connecting Mira Loma Substation and Jefferson 2
Substation addressing projected overload conditions on the existing 66 kV lines serving the area. 3
In recent planning cycles, the anticipated load growth in the 4
area has not materialized at the rate previously expected and may be attributed to a reduction in the 5
forecast due to increased DER adoption and new load growth being served by a local electrical 6
municipality which was previously anticipated to be served by SCE. 7
As a result of the reduction of the forecast, current load 8
projections do not demonstrate a capacity need for the Circle City Substation portion of the project. 9
Additionally, while the need for the Mira Loma-Jefferson 66 kV Line portion of the project persists. 10
As a result, the scope of Project 6575 has been reduced by 11
eliminating the Circle City Substation portion of the project while retaining the Mira Loma-Jefferson 66 12
kV Line portion. The revised scope now includes only installing a 66 kV line position and circuit 13
breaker at Mira Loma 220/66 kV Substation, installing approximately 10.9 miles of new 66 kV circuitry 14
(10.5 miles overhead and 0.4 miles underground) to connect with the existing Jefferson segment of the 15
existing Mira Loma-Corona-Jefferson 66 kV Subtransmission line. The total cost for Project 6575 is 16
$89.6 million. 17
(d) Licensing Status of New Substations and Substations 18
Requiring Perimeter Expansions 19
SCE must comply with the licensing provisions of General Order 20
131-D (G.O. 131-D) before constructing electric facilities operating at voltages greater than 50 kV.41 21
Table II-7 below contains the licensing and exemption information for each of DSP Substation projects. 22
Besides identifying the projects for which Certificate of Public Convenience and Necessity (CPCN)42 or 23
Permit to Construction (PTC)43 applications have already been filed under G.O. 131-D, a review of the 24
project in Table II-7. This review aimed to determine 1) the need for a CPCN or PTC application to be 25
filed under G.O. 131-D, 2) whether a project could qualify for an exemption under G.O. 131-D, or 3) 26
41 D. 94-06-014, D.95-08-038 Rules Relating to the Planning and Construction of Electric Generation,
Transmission/Power/Distribution Line Facilities and Substations Located in California.
42 General Order 131-D, Section A.
43 General Order 131-D, Section B.

47
whether a project was subject to the G.O. 131-D provisions. The determinations regarding the 1
application and exemption status for the projects in our current load growth plan are provided. 2
Based on these determinations, the planned projects fall into four 3
primary categories. First, there are projects for which a CPCN44 or PTC45 has already been filed. 4
Second, there are projects for which SCE expects a CPCN or PTC to be filed. Third, there are those 5
projects considered exempt under G.O. 131-D (e.g., a project involving construction for the minor 6
relocation of existing power lines facilities up to 2,000 in length may qualify for a PTC exemption under 7
G.O. 131-D, Section III.B.1.c.). Last, there are those projects known as “substation modification” 8
projects46 which are not subject to PTC requirements because they involve construction within an 9
existing substation that does not exceed the substation’s previously rated voltage. 10
44 CPCNs are required for projects involving construction of transmission line facilities operating at 200 kV or
greater.
45 PTCs are required for projects involving construction of subtransmission line facilities operating between 50 kV and 200 kV and substations operating above 50 kV.
46 G.O. 131-D, Section B.
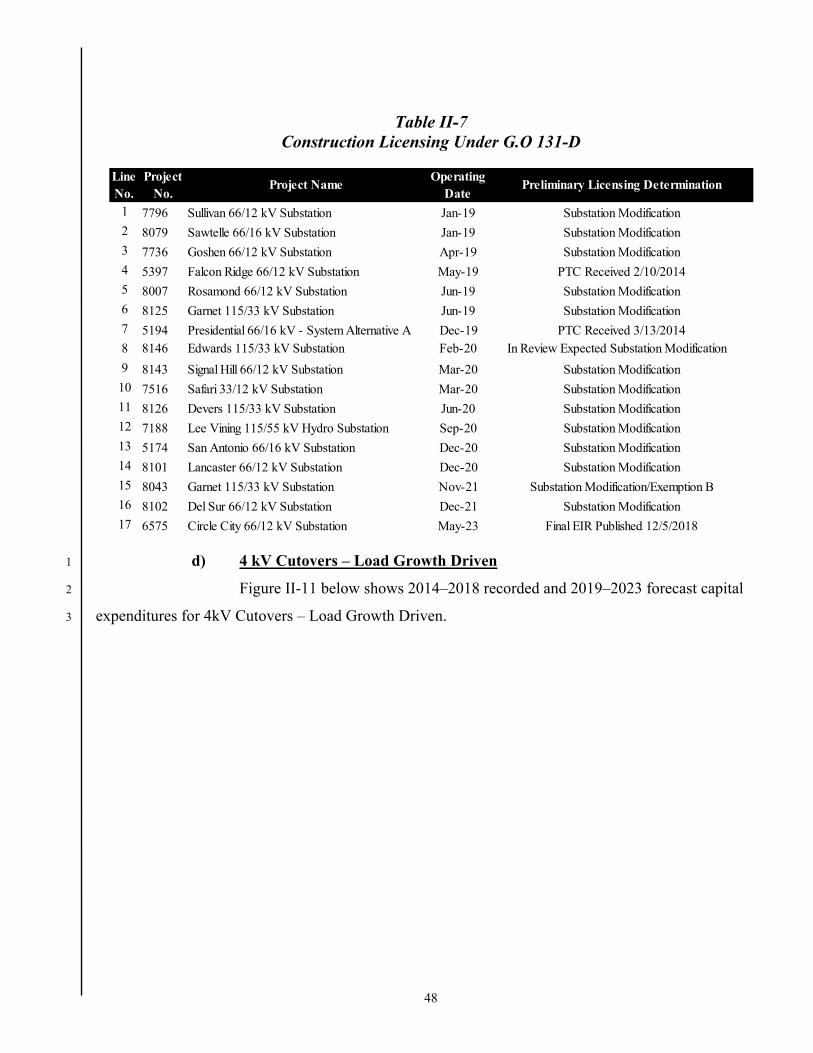
48
Table II-7 Construction Licensing Under G.O 131-D
d) 4 kV Cutovers – Load Growth Driven 1
Figure II-11 below shows 2014–2018 recorded and 2019–2023 forecast capital 2
expenditures for 4kV Cutovers – Load Growth Driven. 3
Line No.
ProjectNo.
Project NameOperating
DatePreliminary Licensing Determination
1 7796 Sullivan 66/12 kV Substation Jan-19 Substation Modification2 8079 Sawtelle 66/16 kV Substation Jan-19 Substation Modification3 7736 Goshen 66/12 kV Substation Apr-19 Substation Modification4 5397 Falcon Ridge 66/12 kV Substation May-19 PTC Received 2/10/20145 8007 Rosamond 66/12 kV Substation Jun-19 Substation Modification6 8125 Garnet 115/33 kV Substation Jun-19 Substation Modification7 5194 Presidential 66/16 kV - System Alternative A Dec-19 PTC Received 3/13/20148 8146 Edwards 115/33 kV Substation Feb-20 In Review Expected Substation Modification
9 8143 Signal Hill 66/12 kV Substation Mar-20 Substation Modification10 7516 Safari 33/12 kV Substation Mar-20 Substation Modification11 8126 Devers 115/33 kV Substation Jun-20 Substation Modification12 7188 Lee Vining 115/55 kV Hydro Substation Sep-20 Substation Modification13 5174 San Antonio 66/16 kV Substation Dec-20 Substation Modification14 8101 Lancaster 66/12 kV Substation Dec-20 Substation Modification15 8043 Garnet 115/33 kV Substation Nov-21 Substation Modification/Exemption B16 8102 Del Sur 66/12 kV Substation Dec-21 Substation Modification17 6575 Circle City 66/12 kV Substation May-23 Final EIR Published 12/5/2018

49
Figure II-11 4kV Cutovers – Load Growth Driven Capital Expenditure Summary
WBS Element CET-ET-LG-4C47 Recorded 2014-2018/Forecast 2019-2023
(Total Company – Nominal $000)
(1) Program Description and Need for Activity 1
The 4 kV Cutovers – Load Growth Driven program addresses overloads 2
on 4 kV circuits and substations due to load growth in areas that these circuits and substations serve. 3
Most of SCE’s distribution circuits operate at voltages of 12 kV, 16 kV, or 33 kV. However, about 4
19 percent of distribution circuits and about 27 percent of distribution substations operate at voltages of 5
2.4 kV, 4.16 kV, and 4.8 kV,48 which comprise 4 kV Cutovers – Load Growth Driven program. 6
A cutover is defined as change of primary service voltage from lower to higher voltage, including 7
change out of service transformers, conductor insulation, and other relevant equipment to facilitate 8
47 Refer to WP SCE-02 Vol. 04 Pt. 2, Ch. II – Book A - pp. 332 – 333 – Capital Detail by WBS Element for 4
kV Cutovers – Load Growth Driven.
48 Herein collectively referred to as 4 kV systems.

50
cutover. Many of the 4 kV circuits and substations make up some of the oldest parts of our system, 1
much of which was designed and installed between 1940 and 1960. Over time, the age and obsolescence 2
of this system poses challenges with providing service to additional load growth in those areas. 3
When new load growth projects or forecasted load growth cannot be 4
served from existing infrastructure, SCE typically proposes equipment upgrades such as an increase in 5
substation transformer capacity or construction of a new circuit. The 4 kV system has limitations, such 6
as equipment obsolescence, space constraints, limited operational flexibility, and voltage issues, which 7
are described more in-depth below and in 4 kV Substation Elimination Program in SCE-02 V.01 8
Distribution Grid Part 1 – Distribution Infrastructure Replacement. For 4 kV circuits and substations 9
experiencing overloads, SCE’s approach is to partially or completely cutover circuits, enough to reduce 10
the loading below the established planned loading limits. 11
The typical 4 kV circuit can serve only approximately 2.3 MW of load 12
when compared to a standard 12 kV circuit designed and capable of serving over 10 MW, based on 13
thermal and protection limitations. The average ability of a 4 kV circuit to serve customers is less than 14
half that of higher voltages; averaging roughly 660 customers per 4 kV circuit in compared to almost 15
1,400 customers for 12 kV and 16 kV. While the load density on 4 kV circuits is lower, these limitations 16
prevent circuits from being expanded to accommodate any substantial increases in customer demand. 17
Because SCE cannot prevent customers from adding additional load in the areas that are served by 4 kV 18
circuits, SCE continues to experience overloads which continues to drive a need for the 4 kV Cutovers - 19
Load Growth Driven program. 20
Underground cable, overhead conductor, substation voltage regulators, 21
and substation transformers limit 4 kV circuit and substation capacity. Due to the lower demand of 22
customers at the time when new 4 kV infrastructure was designed, both the cable itself and the ducts 23
protecting the cable are much smaller than today’s SCE standards require. PILC (Paper-Insulated Lead-24
Covered) cable, which is environmentally hazardous due to lead but prevalent across 4 kV distribution 25
circuits, was designed to have a minimal diameter and a relatively small conduit, generally no more than 26
3” in diameter. When PILC cable is projected to be overloaded, the 3” conduit limits the size of 27
replacement cable, which could limit circuit capacity or require higher costs to maintain similar 28
capacity. Cutover to 12 and 16 kV voltage, which utilizes SCE’s standard 5” conduit for mainline cable, 29
can accommodate cables with larger current carrying capacity. Similarly, smaller gauge of wire was 30
used for 4 kV overhead conductor construction. Approximately 65% of overhead conductors on 4 kV 31

51
systems are wires smaller than 1/0 Aluminum Conductor Steel Reinforced (ACSR). Higher demand 1
from our customers today leads to thermal overloads of these smaller conductors and the need to 2
increase the capacity. 3
Many of SCE’s 4 kV substations do not meet current design standards that 4
require specific substation dimensions, configurations, and equipment. The addition of new load growth 5
to 4 kV systems will eventually result in the need to expand and upgrade substation equipment, in 6
addition to circuit upgrades. The need to upgrade or add a piece of equipment like a new 4 kV substation 7
transformer often requires more significant work to be done and potentially the need to rebuild 8
substations to current design standards. 9
With additional new load, other 4 kV substation equipment such as 10
voltage regulators can become overloaded. The result of these overloads is reduced voltage regulation 11
capability, excess strain on the equipment, and reduced loading capacity on the circuit. 12
The limitations of the 4 kV system described above do not allow SCE to 13
safely and cost-effectively serve additional load growth and thus require cutover to higher voltage before 14
new load growth can be added to the area. 15
Additionally, some 4 kV systems are islanded because there are no 16
physical connection points to other 4 kV circuits/substations. During a contingency (planned or 17
unplanned outage), it is not feasible to restore power to customers through the transfer of the 4 kV load 18
to an adjacent circuit. Without this transfer capability, both planned and emergent maintenance can 19
negatively impact reliability. To maintain safe and reliable service to the customers that are currently 20
served from islanded 4 kV systems, SCE plans to cutover sections of circuit or full circuits that do not 21
have adequate operational flexibility. 22
(2) Basis for Capital Expenditure Forecast 23
As mentioned in other Load Growth capital expenditures, the needed 24
capital expenditures for the 4 kV Cutovers - Load Growth Driven program is higher than what SCE 25
estimates it will execute due to Grid Resiliency priorities and resource constraints. The forecast in 26
Figure II-11 is based on the two categories of 4 kV load growth needs described above. SCE identified 27
4 kV circuits that would be overloaded over the next ten years due to load growth exceeding equipment 28
limitations and the corresponding number of 4 kV transformers on those circuits that would be required 29
to be cutover to a higher voltage. The forecast is split between (1) 2019-2020 based on detailed scope 30
and (2) 2021-2023 unit counts based on remaining ten-year need levelized over 2021-2028. Each year’s 31
52
transformer count is multiplied by a transformer unit cost calculated based on historical average of 1
cutovers divided by the total number of 4 kV transformers replaced over the years 2014-2018.49 2
The second category of 4 kV circuits that need to be cutover is driven by islanded 4 kV circuits. 3
The contingency-driven 4 kV cutovers in the forecast is only included as part of the 2019 detailed scope 4
due to resource constraints. 5
2. DER-Driven Grid Reinforcement 6
DER-Driven Grid Reinforcement capital expenditures upgrade the distribution system to 7
enable the integration of DERs. The upgrades shown below are required to mitigate criteria violations 8
that can compromise the safety and reliability of the distribution grid due to distribution assets 9
exceeding equipment limitations or reducing the operational flexibility of the grid. These DER-Driven 10
Grid Reinforcements include circuit upgrades, 4 kV cutovers, new distribution circuits, circuit breaker 11
upgrades, and substation transformer upgrades. SCE uses distribution planning criteria to determine 12
potential DER-driven violations. SCE has identified five categories of mitigations to address these 13
violations that are discussed in more detail below. 14
a) DER-driven Distribution Circuit Upgrades 15
Figure II-12 below shows the forecast capital expenditures for the DER-driven 16
Distribution Circuit Upgrades. The forecast expenditures start in 2021. 17
49 Refer to WP SCE-02 Vol. 04 Pt. 2, Ch. II – Book A - pp. 334 – 336 – 4 kV Load Growth Cutovers Forecast
Methodology.

53
Figure II-12 DER-driven Distribution Circuit Upgrades Capital Expenditure Summary
WBS Element CET-PD-GM-LR50 Recorded 2014-2018/Forecast 2019-2023
(Total Company – Nominal $000)
(1) Program Description 1
DER-driven Distribution Circuit Upgrades covers forecast expenditures 2
for work outside of the substation required to relieve heavily loaded distribution circuits forecast to 3
exceed distribution planning criteria limits due to increased DER growth. Work in this category enables 4
distribution circuits to carry more electric current to mitigate situations where equipment is forecast to 5
exceed capacity limits. SCE performs a system-wide analysis to determine needed upgrades based on 6
the increased DER growth using the CEC IEPR forecast described in Section C.1.c). The work includes 7
upgrading cable or conductors, installing new voltage regulators, and installing new automatic reclosers. 8
These projects were triggered due to conductor ratings being exceeded, system voltage outside of our 9
criteria, and inadequate protection on the distribution system. These upgrades are necessary because as 10
more DERs integrate into the system, they will cause smaller conductors to become overloaded, voltage 11
50 Refer to WP SCE-02 Vol. 04 Pt. 2, Ch. II – Book B - pp. 1 - 2 – Capital Detail by WBS Element for DER-
driven Distribution Circuit Upgrades.
54
to go outside of acceptable criteria, and/or protection schemes to become inadequate due to short circuit 1
current contributions from DERs.51 And as discussed in Section C.1.c), as DER growth increases, these 2
issues can exist outside of traditional peak load conditions. 3
(2) Basis for Capital Expenditure Forecast 4
SCE bases its DER-driven Distribution Circuit Upgrades forecast on 5
reliability criteria violations projected from DER growth as explained in Section C.1.52 As with other 6
Load Growth capital expenditures, the forecasts are impacted by anticipated resource constraints due to 7
Grid Resiliency efforts. Since the variety of upgrades proposed is small (in comparison to the diversity 8
of those proposed for traditional load growth in Section 1.a)), the DER-driven Distribution Circuit 9
Upgrades forecast is based on unit costs developed for each upgrade type from historical averages over 10
2014-2018. The actual years of data varies whether projects of that type were completed in those years 11
historically. 12
b) DER-driven 4 kV Cutovers 13
Figure II-13 below shows the 2019–2023 forecast capital expenditures for the 14
DER-driven 4 kV Cutovers. The forecast expenditures start in 2021. 15
51 Refer to WP SCE-02 Vol. 04 Pt. 2, Ch. II – Book A - pp. 14 – 29 – High Distributed Energy Resources
Planning Assumptions.
52 Refer to WP SCE-02 Vol. 04 Pt. 2, Ch. II – Book B - pp. 3 - 5 – DER-driven Distribution Circuit Upgrades Forecast Methodology. SCE performed simulations for DER-driven line section related needs for 2019 – 2023. The results of these simulations were used to identify line segment specific needs for the 2019 - 2021 period, and SCE has higher confidence those needs will persist in the specific locations identified by the simulation. However, simulation results for 2022 – 2023 were used to inform the general level of funding that will be required to serve the expected needs in that period, as the locations of these projects are subject to a higher degree of change over time. While locations of projects may change, the need for this work is expected to remain at the levels forecast for 2022 – 2023.

55
Figure II-13 DER-driven 4 kV Cutovers Capital Expenditure Summary
WBS Element CET-PD-GM-4C53 Recorded 2014-2018/Forecast 2019-2023
(Total Company – Nominal $000)
(1) Program Description 1
SCE distribution system is mainly composed of four voltage classes: 4 kV, 2
12 kV, 16 kV, and 33 kV. SCE analyzed 4 kV circuits to determine impacts from forecasted DER 3
penetration.54 The criteria are the same as used for load growth-driven 4 kV cutovers. This includes 4
exceedance of the thermal rating of conductors and violation of voltage criteria. DERs on 4 kV circuits 5
can often increase the amps flowing on the circuit. During minimum loading conditions, this can cause 6
the flow of the amps to go back into the substation and can lead to thermal and voltage violations. 7
The results of this analysis identified circuits that need to be cutover to a higher voltage feeder.55 8
53 Refer to WP SCE-02 Vol. 04 Pt. 2, Ch. II – Book B - pp. 6 - 7 – Capital Detail by WBS Element for DER-
driven 4 kV Cutovers.
54 Refer to WP SCE-02 Vol. 04 Pt. 2, Ch. II – Book A - pp. 14 – 29 – High Distributed Energy Resources Planning Assumptions.
55 The need to cutover to a higher voltage is explained in the 4 kV Cutovers – Load Growth section.

56
To avoid overlapping projects with the other 4 kV circuit cutovers, the study compared the circuits to be 1
eliminated to the distribution planning process, to ensure there was no double-counting on the projects, 2
and only circuits not already identified in other 4 kV elimination programs were selected for a cutover 3
under this program. 4
(2) Basis for Capital Expenditure Forecast 5
SCE bases its DER-driven 4 kV Cutovers forecast on reliability criteria 6
violations projected from DER growth as explained in Section C.1. As with other Load Growth capital 7
expenditures, the forecasts are impacted by anticipated resource constraints due to Grid Resiliency 8
efforts. Although the need for cutovers and the criteria violations are the same as the 4 kV cutovers 9
driven by Load Growth, the DER-driven cutover work is very similar to the transformer replacement 10
costs from 4 kV Substation Elimination Program. To develop the forecast,56 DER-driven 4 kV Cutovers 11
used the unit cost57 from 4 kV Substation Elimination Program. 12
c) DER-driven New Circuits 13
Figure II-14 below shows the 2019–2023 forecast capital expenditures for the 14
DER-driven New Circuits. The forecast expenditures start in 2021. 15
56 Refer to WP SCE-02 Vol. 04 Pt. 2, Ch. II – Book B - pp. 8 - 10 – DER-driven 4 kV Cutovers Forecast
Methodology.
57 Refer to WP SCE-02 Vol. 01, Pt. 1 – pp. 97 - 98 – Cost of Cutting Over a 4 kV Circuit.
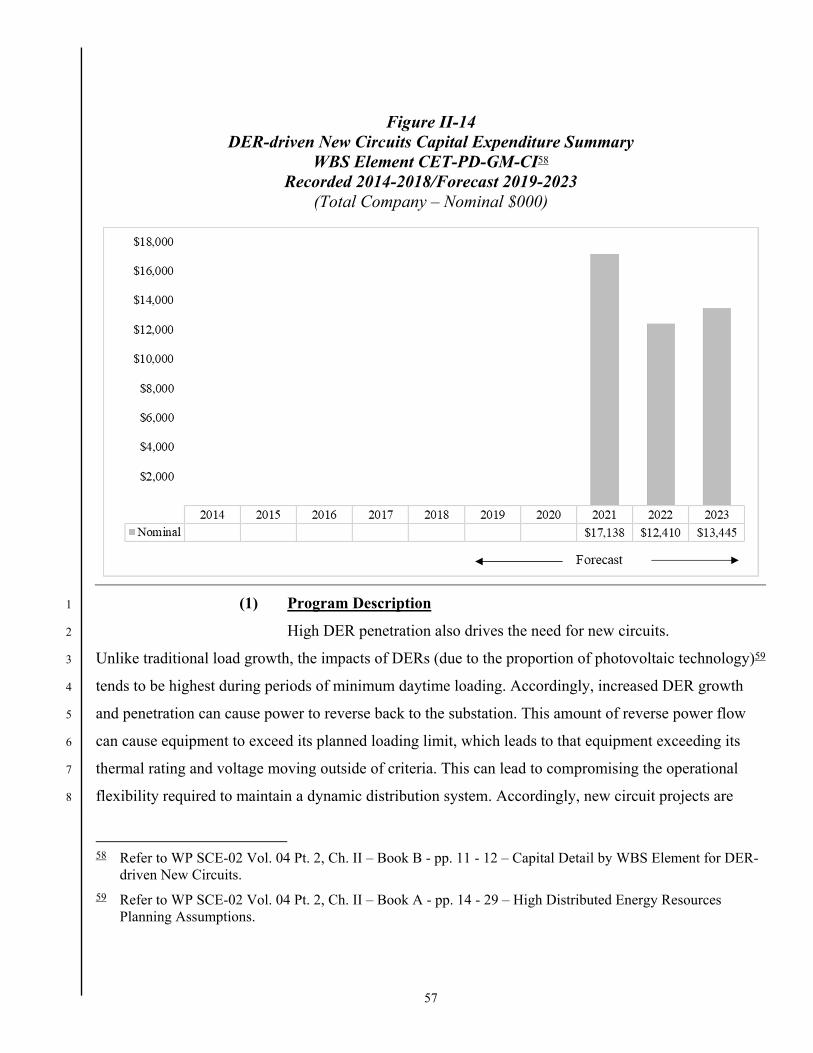
57
Figure II-14 DER-driven New Circuits Capital Expenditure Summary
WBS Element CET-PD-GM-CI58 Recorded 2014-2018/Forecast 2019-2023
(Total Company – Nominal $000)
(1) Program Description 1
High DER penetration also drives the need for new circuits. 2
Unlike traditional load growth, the impacts of DERs (due to the proportion of photovoltaic technology)59 3
tends to be highest during periods of minimum daytime loading. Accordingly, increased DER growth 4
and penetration can cause power to reverse back to the substation. This amount of reverse power flow 5
can cause equipment to exceed its planned loading limit, which leads to that equipment exceeding its 6
thermal rating and voltage moving outside of criteria. This can lead to compromising the operational 7
flexibility required to maintain a dynamic distribution system. Accordingly, new circuit projects are 8
58 Refer to WP SCE-02 Vol. 04 Pt. 2, Ch. II – Book B - pp. 11 - 12 – Capital Detail by WBS Element for DER-
driven New Circuits.
59 Refer to WP SCE-02 Vol. 04 Pt. 2, Ch. II – Book A - pp. 14 - 29 – High Distributed Energy Resources Planning Assumptions.

58
required to minimize reverse power flow through the distribution circuits, ensure that planned loading 1
limit is not exceeded, and to ensure adequate flexibility is maintained in the distribution system. 2
(2) Basis for Capital Expenditure Forecast 3
SCE bases its DER-driven New Circuit forecast on reliability criteria 4
violations projected from DER growth as explained in Section C.1. The DER-driven New Circuit 5
forecast60 uses the unit costs developed for Distribution Substation Plan Circuits in Section 1.b)(2) based 6
on final costs for DSP circuits completed between 2016 and 2018.61 7
d) DER-driven Circuit Breaker Upgrades 8
Figure II-15 below shows the 2019–2023 forecast capital expenditures for the 9
DER-driven Circuit Breaker Upgrades. The forecast expenditures start in 2020. 10
60 Refer to WP SCE-02 Vol. 04 Pt. 2, Ch. II – Book B - pp. 13 - 15 – DER-driven New Circuits Forecast
Methodology.
61 Refer to WP SCE-02 Vol. 04 Pt. 2, Ch. II – Book A - pp. 39 - 41 – Distribution Substation Plan Circuits Forecast Methodology.

59
Figure II-15 DER-driven Circuit Breaker Upgrades Capital Expenditure Summary
WBS Element CET-PD-GM-CB62 Recorded 2014-2018/Forecast 2019-2023
(Total Company – Nominal $000)
(1) Program Description 1
DER-driven Circuit Breaker Upgrades identify circuit breakers for 2
upgrades as they approach or exceed their fault current ratings due to DERs adding short circuit current 3
during a fault. Under this analysis, SCE identifies substations where available fault current, or short-4
circuit duty, exceeds safe equipment ratings essential to the provision of safe and reliable service. 5
SCE’s electrical distribution system is designed to safely detect and isolate faults. When a fault occurs, 6
dangerous levels of current flow from all electrical sources (generators) to the location of the fault. 7
Prolonged fault current will cause major damage to distribution equipment, can cause catastrophic 8
failure, and can seriously jeopardize public and employee safety. Due to the magnitude of fault current, 9
a fault condition must be isolated quickly to restore safe operating conditions of the power system. 10
62 Refer to WP SCE-02 Vol. 04 Pt. 2, Ch. II – Book B - pp. 16 - 17 – Capital Detail by WBS Element for DER-
driven Circuit Breaker Upgrades.
60
Substation circuit breakers are the most common devices used to isolate faults and are relied upon to 1
interrupt the highest fault currents experienced on the distribution system. Substation circuit breakers 2
incapable of interrupting expected fault currents are likely to fail when those faults occur. 3
The IEPR forecasts increased DER penetration on the distribution system. 4
When that happens the total amount of short circuit duty on the system increases as DERs contribute to 5
and increase the amount of short circuit duty on the system. SCE performed a system-wide analysis to 6
determine the substations which are anticipated to experience increased short circuit current due to the 7
increase in fault contribution from DERs. Where the short circuit duty levels exceed the fault current 8
rating of the circuit breakers, SCE plans to upgrade the circuit breaker with a higher fault current rating, 9
capable of safely interrupting the fault on the system. 10
(2) Basis for Capital Expenditure Forecast 11
SCE identified circuit breaker upgrades over the five-year forecast 12
period.63 The identified projects were checked against those identified in SERP and the Substation 13
Infrastructure Replacement Circuit Breaker program, no duplicates are included. Unit Cost used for this 14
program is the same unit costs that the Substation Equipment Replacement Program are using.64 15
Since both programs identify specific circuit breakers to be replaced and the unit costs are developed per 16
voltage classes, the unit costs from SERP are most appropriate for this new program. 17
e) DER-driven Substation Transformer Upgrades 18
Figure II-16 below shows 2019–2023 forecast capital expenditures for the DER-19
driven Substation Transformer Upgrades. The forecast expenditures start in 2020. 20
63 Refer to WP SCE-02 Vol. 04 Pt. 2, Ch. II - Book B - pp. 18 - 19 – DER-driven Circuit Breaker Upgrade
Forecast Methodology.
64 Refer to WP SCE-02 Vol. 04 Pt. 2, Ch. II – Book B - pp. 20 - 22 – Substation Equipment Replacement Program Forecast Methodology.
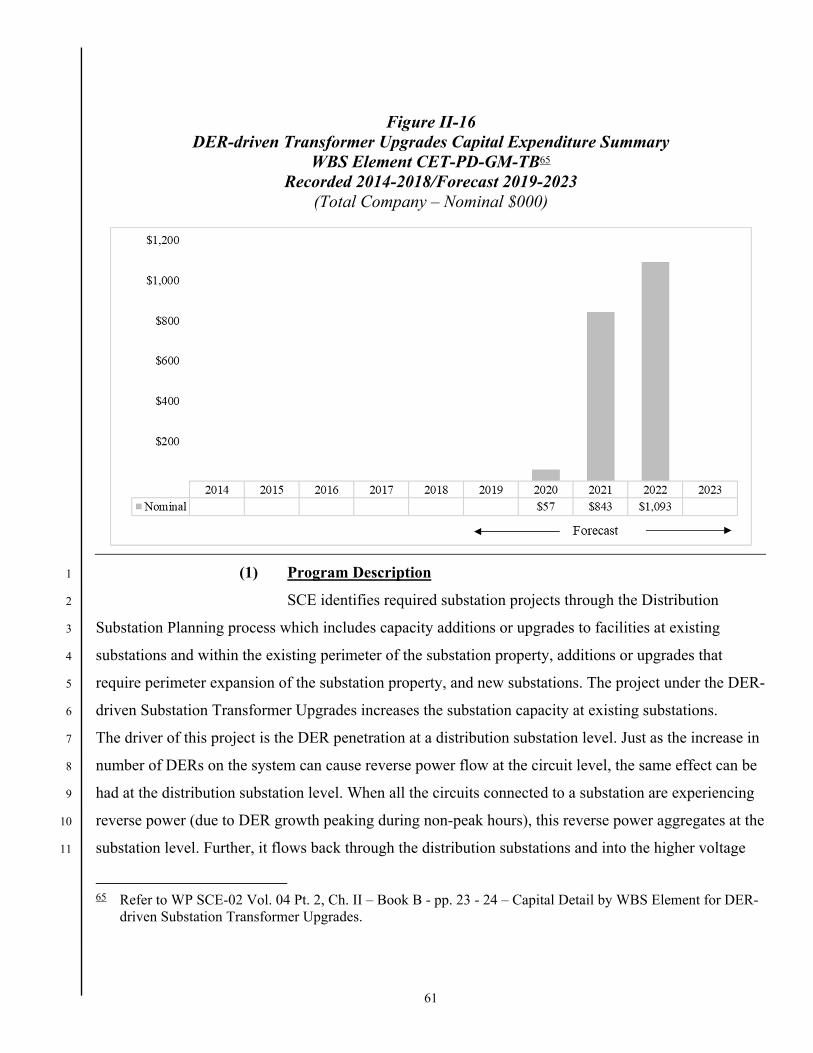
61
Figure II-16 DER-driven Transformer Upgrades Capital Expenditure Summary
WBS Element CET-PD-GM-TB65 Recorded 2014-2018/Forecast 2019-2023
(Total Company – Nominal $000)
(1) Program Description 1
SCE identifies required substation projects through the Distribution 2
Substation Planning process which includes capacity additions or upgrades to facilities at existing 3
substations and within the existing perimeter of the substation property, additions or upgrades that 4
require perimeter expansion of the substation property, and new substations. The project under the DER-5
driven Substation Transformer Upgrades increases the substation capacity at existing substations. 6
The driver of this project is the DER penetration at a distribution substation level. Just as the increase in 7
number of DERs on the system can cause reverse power flow at the circuit level, the same effect can be 8
had at the distribution substation level. When all the circuits connected to a substation are experiencing 9
reverse power (due to DER growth peaking during non-peak hours), this reverse power aggregates at the 10
substation level. Further, it flows back through the distribution substations and into the higher voltage 11
65 Refer to WP SCE-02 Vol. 04 Pt. 2, Ch. II – Book B - pp. 23 - 24 – Capital Detail by WBS Element for DER-
driven Substation Transformer Upgrades.

62
systems. Just as with traditional load growth-driven programs, when the amount of power flowing 1
through our equipment exceeds planned loading limits, SCE designs a project to help mitigate the 2
problem. The project under this program follow the same criteria as load growth-driven projects; 3
however, these DER-driven projects address the amount of power flowing through the distribution 4
substation that is being pushed back from the total aggregate reverse power from the distribution 5
circuits. 6
(2) Basis for Capital Expenditure Forecast 7
Only one transformer bank was identified as exceeding its capacity rating 8
due to the DER growth in the five year forecast period. A unit cost66 was used based on historical work 9
order averages completed between 2015-2017 in the same voltage class. The forecast in Figure II-16 10
shows the forecasts and expected expenditures for the work to upgrade the transformer bank. 11
66 Refer to WP SCE-02 Vol. 04 Pt. 2, Ch. II – Book B - pp. 25 - 26 – DER-driven Transformer Upgrades
Forecast Methodology.
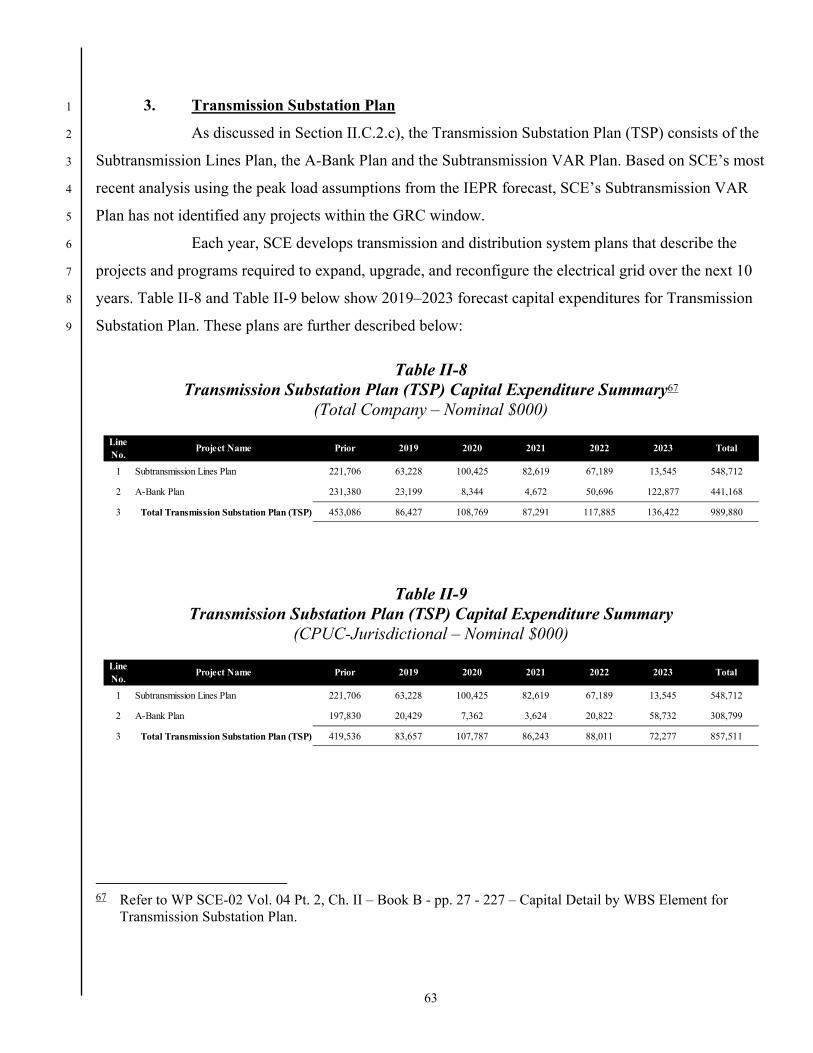
63
3. Transmission Substation Plan 1
As discussed in Section II.C.2.c), the Transmission Substation Plan (TSP) consists of the 2
Subtransmission Lines Plan, the A-Bank Plan and the Subtransmission VAR Plan. Based on SCE’s most 3
recent analysis using the peak load assumptions from the IEPR forecast, SCE’s Subtransmission VAR 4
Plan has not identified any projects within the GRC window. 5
Each year, SCE develops transmission and distribution system plans that describe the 6
projects and programs required to expand, upgrade, and reconfigure the electrical grid over the next 10 7
years. Table II-8 and Table II-9 below show 2019–2023 forecast capital expenditures for Transmission 8
Substation Plan. These plans are further described below: 9
Table II-8 Transmission Substation Plan (TSP) Capital Expenditure Summary67
(Total Company – Nominal $000)
Table II-9 Transmission Substation Plan (TSP) Capital Expenditure Summary
(CPUC-Jurisdictional – Nominal $000)
67 Refer to WP SCE-02 Vol. 04 Pt. 2, Ch. II – Book B - pp. 27 - 227 – Capital Detail by WBS Element for
Transmission Substation Plan.
Line No.
Project Name Prior 2019 2020 2021 2022 2023 Total
1 Subtransmission Lines Plan 221,706 63,228 100,425 82,619 67,189 13,545 548,712
2 A-Bank Plan 231,380 23,199 8,344 4,672 50,696 122,877 441,168
3 Total Transmission Substation Plan (TSP) 453,086 86,427 108,769 87,291 117,885 136,422 989,880
Line No.
Project Name Prior 2019 2020 2021 2022 2023 Total
1 Subtransmission Lines Plan 221,706 63,228 100,425 82,619 67,189 13,545 548,712
2 A-Bank Plan 197,830 20,429 7,362 3,624 20,822 58,732 308,799
3 Total Transmission Substation Plan (TSP) 419,536 83,657 107,787 86,243 88,011 72,277 857,511
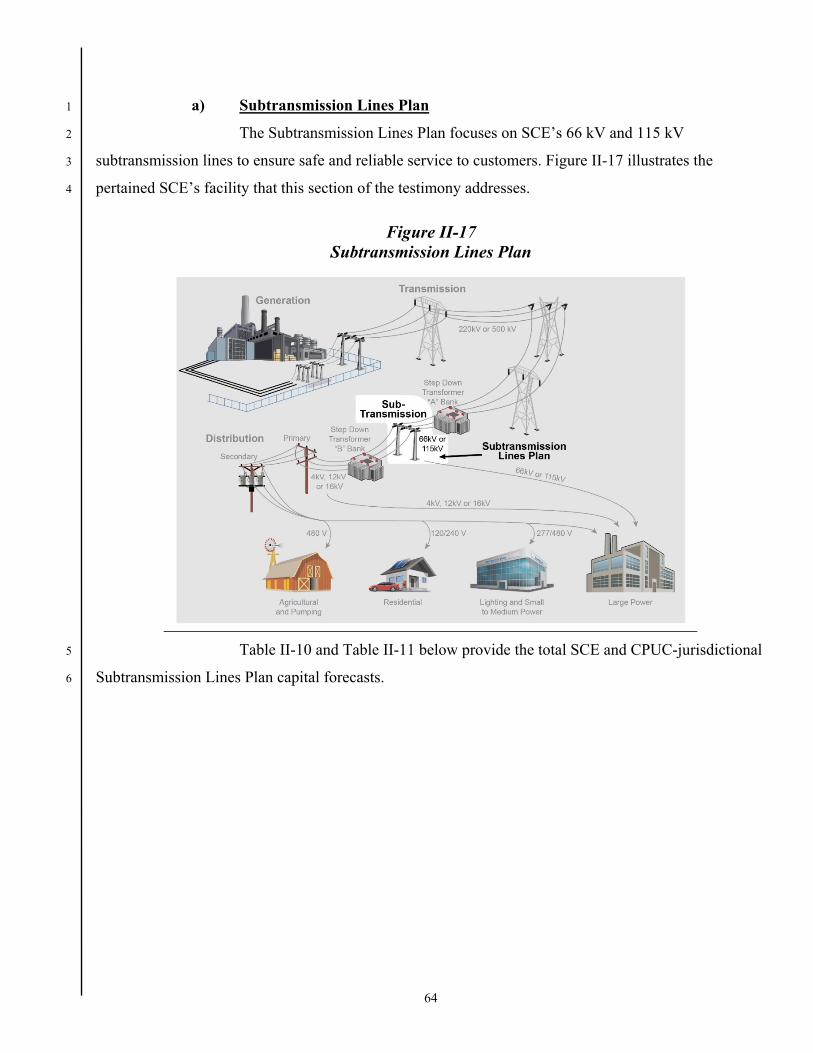
64
a) Subtransmission Lines Plan 1
The Subtransmission Lines Plan focuses on SCE’s 66 kV and 115 kV 2
subtransmission lines to ensure safe and reliable service to customers. Figure II-17 illustrates the 3
pertained SCE’s facility that this section of the testimony addresses. 4
Figure II-17 Subtransmission Lines Plan
Table II-10 and Table II-11 below provide the total SCE and CPUC-jurisdictional 5
Subtransmission Lines Plan capital forecasts. 6
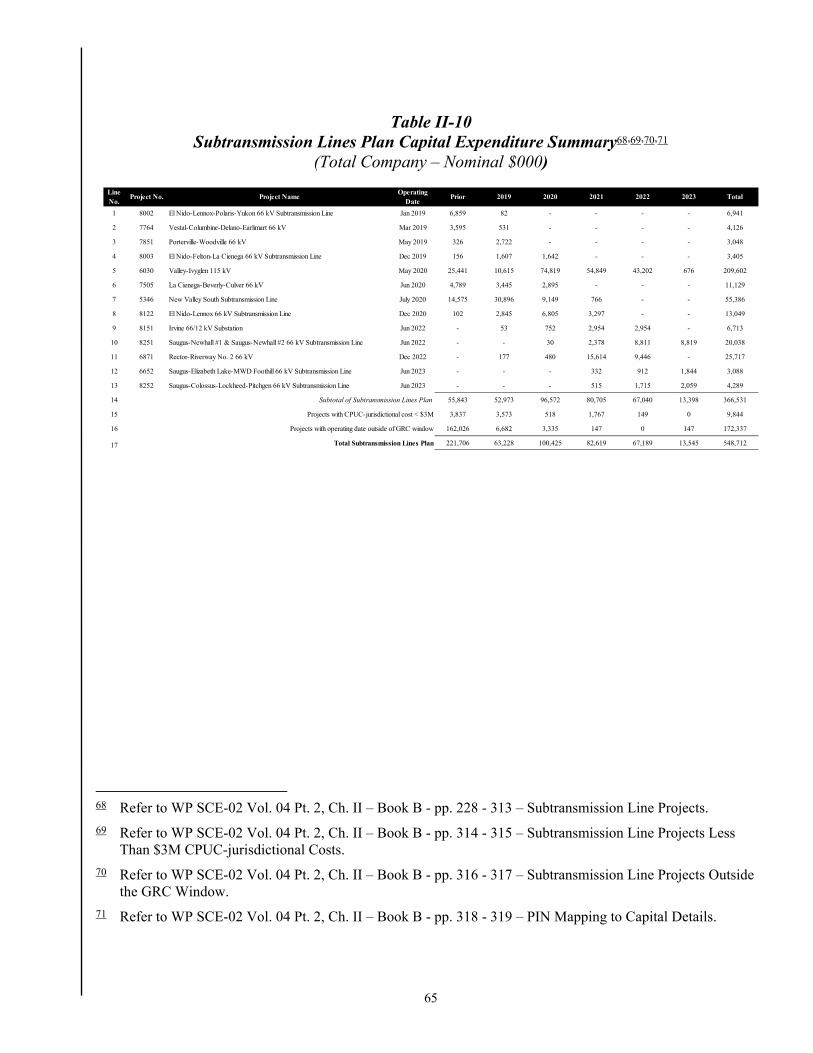
65
Table II-10 Subtransmission Lines Plan Capital Expenditure Summary68,69,70,71
(Total Company – Nominal $000)
68 Refer to WP SCE-02 Vol. 04 Pt. 2, Ch. II – Book B - pp. 228 - 313 – Subtransmission Line Projects.
69 Refer to WP SCE-02 Vol. 04 Pt. 2, Ch. II – Book B - pp. 314 - 315 – Subtransmission Line Projects Less Than $3M CPUC-jurisdictional Costs.
70 Refer to WP SCE-02 Vol. 04 Pt. 2, Ch. II – Book B - pp. 316 - 317 – Subtransmission Line Projects Outside the GRC Window.
71 Refer to WP SCE-02 Vol. 04 Pt. 2, Ch. II – Book B - pp. 318 - 319 – PIN Mapping to Capital Details.
Line No.
Project No. Project NameOperating
DatePrior 2019 2020 2021 2022 2023 Total
1 8002 El Nido-Lennox-Polaris-Yukon 66 kV Subtransmission Line Jan 2019 6,859 82 - - - - 6,941
2 7764 Vestal-Columbine-Delano-Earlimart 66 kV Mar 2019 3,595 531 - - - - 4,126
3 7851 Porterville-Woodville 66 kV May 2019 326 2,722 - - - - 3,048
4 8003 El Nido-Felton-La Cienega 66 kV Subtransmission Line Dec 2019 156 1,607 1,642 - - - 3,405
5 6030 Valley-Ivyglen 115 kV May 2020 25,441 10,615 74,819 54,849 43,202 676 209,602
6 7505 La Cienega-Beverly-Culver 66 kV Jun 2020 4,789 3,445 2,895 - - - 11,129
7 5346 New Valley South Subtransmission Line July 2020 14,575 30,896 9,149 766 - - 55,386
8 8122 El Nido-Lennox 66 kV Subtransmission Line Dec 2020 102 2,845 6,805 3,297 - - 13,049
9 8151 Irvine 66/12 kV Substation Jun 2022 - 53 752 2,954 2,954 - 6,713
10 8251 Saugus-Newhall #1 & Saugus-Newhall #2 66 kV Subtransmission Line Jun 2022 - - 30 2,378 8,811 8,819 20,038
11 6871 Rector-Riverway No. 2 66 kV Dec 2022 - 177 480 15,614 9,446 - 25,717
12 6652 Saugus-Elizabeth Lake-MWD Foothill 66 kV Subtransmission Line Jun 2023 - - - 332 912 1,844 3,088
13 8252 Saugus-Colossus-Lockheed-Pitchgen 66 kV Subtransmission Line Jun 2023 - - - 515 1,715 2,059 4,289
14 Subtotal of Subtransmission Lines Plan 55,843 52,973 96,572 80,705 67,040 13,398 366,531
15 Projects with CPUC-jurisdictional cost < $3M 3,837 3,573 518 1,767 149 0 9,844
16 Projects with operating date outside of GRC window 162,026 6,682 3,335 147 0 147 172,337
17 Total Subtransmission Lines Plan 221,706 63,228 100,425 82,619 67,189 13,545 548,712
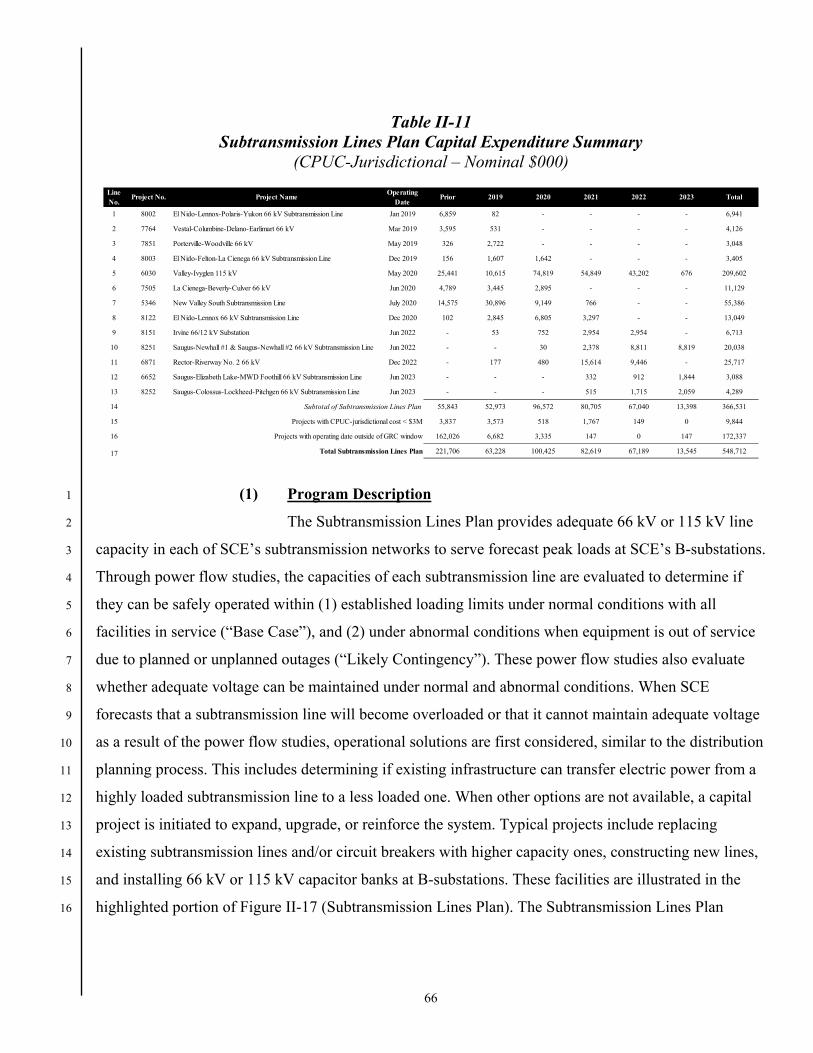
66
Table II-11 Subtransmission Lines Plan Capital Expenditure Summary
(CPUC-Jurisdictional – Nominal $000)
(1) Program Description 1
The Subtransmission Lines Plan provides adequate 66 kV or 115 kV line 2
capacity in each of SCE’s subtransmission networks to serve forecast peak loads at SCE’s B-substations. 3
Through power flow studies, the capacities of each subtransmission line are evaluated to determine if 4
they can be safely operated within (1) established loading limits under normal conditions with all 5
facilities in service (“Base Case”), and (2) under abnormal conditions when equipment is out of service 6
due to planned or unplanned outages (“Likely Contingency”). These power flow studies also evaluate 7
whether adequate voltage can be maintained under normal and abnormal conditions. When SCE 8
forecasts that a subtransmission line will become overloaded or that it cannot maintain adequate voltage 9
as a result of the power flow studies, operational solutions are first considered, similar to the distribution 10
planning process. This includes determining if existing infrastructure can transfer electric power from a 11
highly loaded subtransmission line to a less loaded one. When other options are not available, a capital 12
project is initiated to expand, upgrade, or reinforce the system. Typical projects include replacing 13
existing subtransmission lines and/or circuit breakers with higher capacity ones, constructing new lines, 14
and installing 66 kV or 115 kV capacitor banks at B-substations. These facilities are illustrated in the 15
highlighted portion of Figure II-17 (Subtransmission Lines Plan). The Subtransmission Lines Plan 16
Line No.
Project No. Project NameOperating
DatePrior 2019 2020 2021 2022 2023 Total
1 8002 El Nido-Lennox-Polaris-Yukon 66 kV Subtransmission Line Jan 2019 6,859 82 - - - - 6,941
2 7764 Vestal-Columbine-Delano-Earlimart 66 kV Mar 2019 3,595 531 - - - - 4,126
3 7851 Porterville-Woodville 66 kV May 2019 326 2,722 - - - - 3,048
4 8003 El Nido-Felton-La Cienega 66 kV Subtransmission Line Dec 2019 156 1,607 1,642 - - - 3,405
5 6030 Valley-Ivyglen 115 kV May 2020 25,441 10,615 74,819 54,849 43,202 676 209,602
6 7505 La Cienega-Beverly-Culver 66 kV Jun 2020 4,789 3,445 2,895 - - - 11,129
7 5346 New Valley South Subtransmission Line July 2020 14,575 30,896 9,149 766 - - 55,386
8 8122 El Nido-Lennox 66 kV Subtransmission Line Dec 2020 102 2,845 6,805 3,297 - - 13,049
9 8151 Irvine 66/12 kV Substation Jun 2022 - 53 752 2,954 2,954 - 6,713
10 8251 Saugus-Newhall #1 & Saugus-Newhall #2 66 kV Subtransmission Line Jun 2022 - - 30 2,378 8,811 8,819 20,038
11 6871 Rector-Riverway No. 2 66 kV Dec 2022 - 177 480 15,614 9,446 - 25,717
12 6652 Saugus-Elizabeth Lake-MWD Foothill 66 kV Subtransmission Line Jun 2023 - - - 332 912 1,844 3,088
13 8252 Saugus-Colossus-Lockheed-Pitchgen 66 kV Subtransmission Line Jun 2023 - - - 515 1,715 2,059 4,289
14 Subtotal of Subtransmission Lines Plan 55,843 52,973 96,572 80,705 67,040 13,398 366,531
15 Projects with CPUC-jurisdictional cost < $3M 3,837 3,573 518 1,767 149 0 9,844
16 Projects with operating date outside of GRC window 162,026 6,682 3,335 147 0 147 172,337
17 Total Subtransmission Lines Plan 221,706 63,228 100,425 82,619 67,189 13,545 548,712

67
includes loop-in projects, reconductor or recable projects, new line projects and voltage-driven capacitor 1
projects. 2
Without a comprehensive plan, SCE risks loading its 66 kV and 115 kV 3
subtransmission lines beyond their capabilities as the peak demand for electricity continues to increase 4
in some areas within SCE’s service territory. This could ultimately result in failures of overhead and/or 5
underground subtransmission lines and service interruptions to tens of thousands of customers over local 6
geographic areas. 7
SCE’s comprehensive Subtransmission Lines Plan includes four different 8
types of projects described in section below: 9
(a) Loop-In or Reconfiguration Projects 10
SCE has an obligation to provide safe and reliable power to its 11
customers. Over time, as load increases in an area, there may be a time when an additional 12
subtransmission line must be brought into a B-substation. Many times this can be accomplished by 13
looping an existing tapped line into and out of a B-substation, creating two new subtransmission lines. 14
Looping the existing line into a substation implies that there will be one line coming into the substation 15
and another leaving the substation creating two new lines from the one previous existing line. 16
Looping an existing line is often more economical than construction a new subtransmission line and 17
typically provides a second, different source line into the B-substation improving reliability to the 18
B-substation. 19
A reconfiguration project typically involves rearranging the 20
subtransmission lines near the substation. This could involve changing a Preferred/Emergency 21
configuration to a paralleled configuration or installing a new switchrack upon which multiple 22
subtransmission lines can be terminated. The loop-in/reconfiguration projects are described below. 23
The costs for these projects are 100 percent CPUC-jurisdictional. 24
Table II-12 Loop-In/Reconfiguration Projects
Line No. Project No. Project Name Project Scope Operating Date Project Type Total Cost
1 4891 Arrowhead 115/33 kV SubstationLoop in project and reconfigure 115 kV subtransmission line arrangement.
Feb 2021 Reliability 1,860
68
(b) Reconductor and Recable Projects 1
As shown in Table II-13, reconductor or recable projects are 2
identified to increase the capacity of existing subtransmission lines by replacing existing conductors or 3
cables with higher capacity ones so that the forecast load can be safely and reliably served during both 4
normal conditions and emergency Likely Contingency conditions. 5
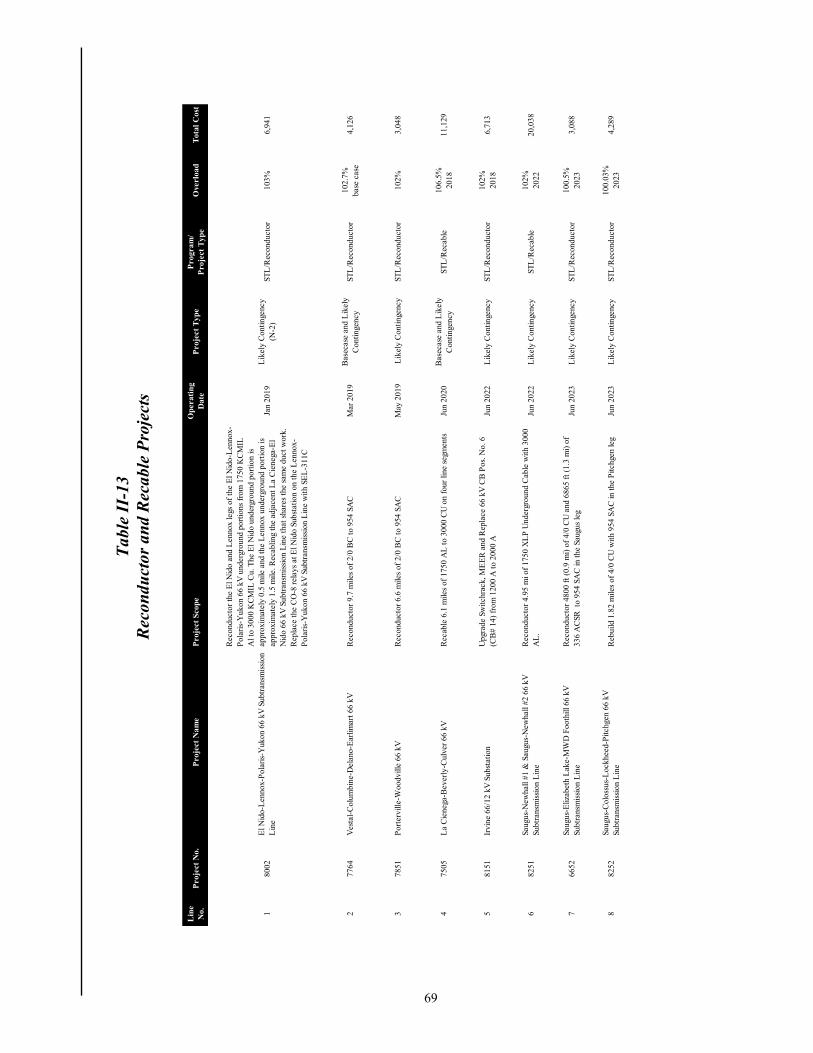
69
Tab
le I
I-13
R
econ
duct
or a
nd R
ecab
le P
roje
cts
Lin
e N
o.P
roje
ct N
o.P
roje
ct N
ame
Pro
ject
Sco
peO
pera
ting
D
ate
Pro
ject
Typ
eP
rogr
am/
Pro
ject
Typ
eO
verl
oad
Tot
al C
ost
180
02E
l Nid
o-L
enno
x-P
olar
is-Y
ukon
66
kV S
ubtr
ansm
issi
on
Lin
e
Rec
ondu
ctor
the
El N
ido
and
Len
nox
legs
of
the
El N
ido-
Len
nox-
Pol
aris
-Yuk
on 6
6 kV
und
ergr
ound
por
tions
fro
m 1
750
KC
MIL
A
l to
3000
KC
MIL
Cu.
The
El N
ido
unde
rgro
und
port
ion
is
appr
oxim
atel
y 0.
5 m
ile a
nd th
e L
enno
x un
derg
roun
d po
rtio
n is
ap
prox
imat
ely
1.5
mile
. Rec
ablin
g th
e ad
jace
nt L
a C
iene
ga-E
l N
ido
66 k
V S
ubtr
ansm
issi
on L
ine
that
sha
res
the
sam
e du
ct w
ork.
R
epla
ce th
e C
O-8
rel
ays
at E
l Nid
o Su
bsta
tion
on th
e L
enno
x-P
olar
is-Y
ukon
66
kV S
ubtr
ansm
issi
on L
ine
with
SE
L-3
11C
Jan
2019
Lik
ely
Con
tinge
ncy
(N-2
)ST
L/R
econ
duct
or10
3%6,
941
277
64V
esta
l-C
olum
bine
-Del
ano-
Ear
limar
t 66
kVR
econ
duct
or 9
.7 m
iles
of 2
/0 B
C to
954
SA
CM
ar 2
019
Bas
ecas
e an
d L
ikel
y C
ontin
genc
yST
L/R
econ
duct
or10
2.7%
ba
se c
ase
4,12
6
378
51P
orte
rvill
e-W
oodv
ille
66 k
VR
econ
duct
or 6
.6 m
iles
of 2
/0 B
C to
954
SA
CM
ay 2
019
Lik
ely
Con
tinge
ncy
STL
/Rec
ondu
ctor
102%
3,04
8
475
05L
a C
iene
ga-B
ever
ly-C
ulve
r 66
kV
Rec
able
6.1
mile
s of
175
0 A
L to
300
0 C
U o
n fo
ur li
ne s
egm
ents
Jun
2020
Bas
ecas
e an
d L
ikel
y C
ontin
genc
yST
L/R
ecab
le10
6.5%
2018
11,1
29
581
51Ir
vine
66/
12 k
V S
ubst
atio
nU
pgra
de S
witc
hrac
k, M
EE
R a
nd R
epla
ce 6
6 kV
CB
Pos
. No.
6
(CB
# 14
) fr
om 1
200
A to
200
0 A
Ju
n 20
22L
ikel
y C
ontin
genc
yST
L/R
econ
duct
or10
2%20
186,
713
682
51Sa
ugus
-New
hall
#1 &
Sau
gus-
New
hall
#2 6
6 kV
Su
btra
nsm
issi
on L
ine
Rec
ondu
ctor
4.9
5 m
i of
1750
XL
P U
nder
grou
nd C
able
with
300
0 A
L.
Jun
2022
Lik
ely
Con
tinge
ncy
STL
/Rec
able
102%
2022
20,0
38
766
52Sa
ugus
-Eliz
abet
h L
ake-
MW
D F
ooth
ill 6
6 kV
Su
btra
nsm
issi
on L
ine
Rec
ondu
ctor
480
0 ft
(0.
9 m
i) o
f 4/
0 C
U a
nd 6
865
ft (
1.3
mi)
of
336
AC
SR t
o 95
4 SA
C in
the
Saug
us le
gJu
n 20
23L
ikel
y C
ontin
genc
yST
L/R
econ
duct
or10
0.5%
2023
3,08
8
882
52Sa
ugus
-Col
ossu
s-L
ockh
eed-
Pitc
hgen
66
kV
Subt
rans
mis
sion
Lin
eR
ebui
ld 1
.82
mile
s of
4/0
CU
with
954
SA
C in
the
Pitc
hgen
leg
Jun
2023
Lik
ely
Con
tinge
ncy
STL
/Rec
ondu
ctor
100.
03%
2023
4,28
9

70
(c) New Line Projects 1
As shown in Table II-14, new line projects are identified when it is 2
not feasible to transfer sufficient load to lower the forecast load of existing subtransmission lines to 3
below their planned loading limits under emergency Likely Contingency conditions. 4
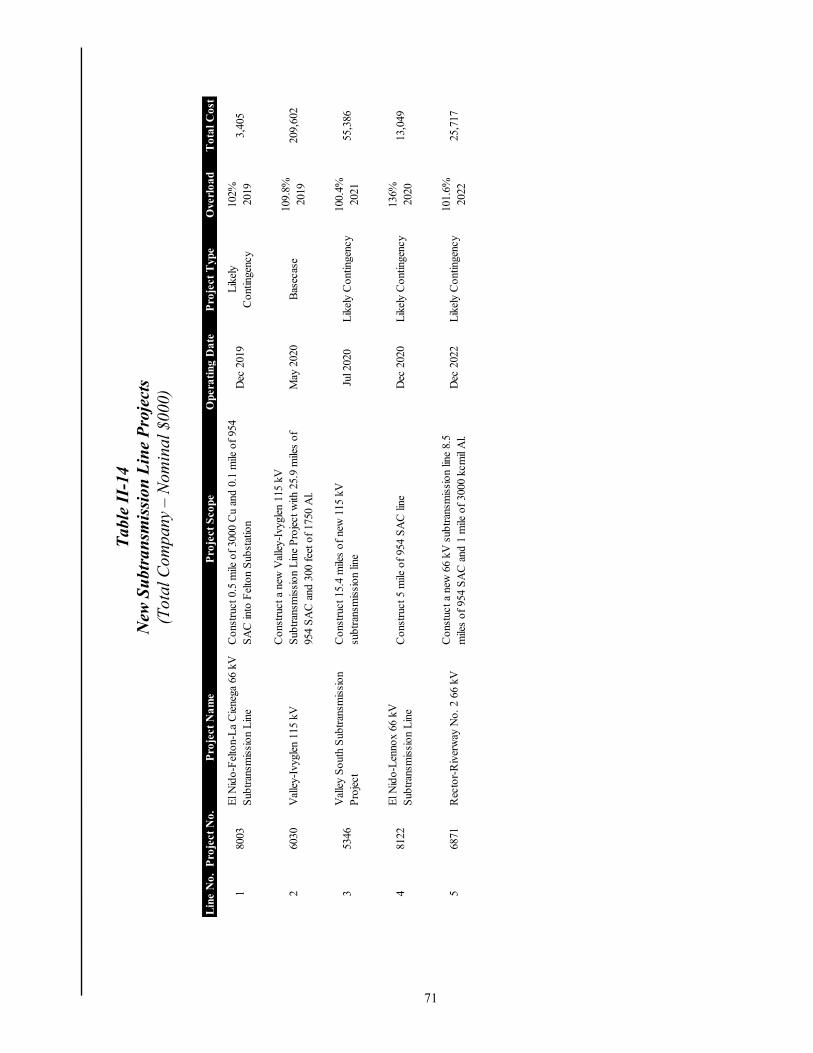
71
Tab
le I
I-14
N
ew S
ubt
ran
smis
sion
Lin
e P
roje
cts
(Tot
al C
ompa
ny –
Nom
inal
$00
0)
Lin
e N
o.P
roje
ct N
o.P
roje
ct N
ame
Pro
ject
Sco
pe
Ope
rati
ng D
ate
Pro
ject
Typ
eO
verl
oad
Tot
al C
ost
180
03E
l Nid
o-F
elto
n-L
a C
iene
ga 6
6 kV
S
ubtr
ansm
issi
on L
ine
Con
stru
ct 0
.5 m
ile o
f 30
00 C
u an
d 0.
1 m
ile o
f 95
4 S
AC
into
Fel
ton
Sub
stat
ion
Dec
201
9L
ikel
y C
ontin
genc
y10
2%20
193,
405
260
30V
alle
y-Iv
ygle
n 11
5 kV
Con
stru
ct a
new
Val
ley-
Ivyg
len
115
kV
Sub
tran
smis
sion
Lin
e P
roje
ct w
ith 2
5.9
mile
s of
95
4 S
AC
and
300
fee
t of
1750
Al.
May
202
0B
asec
ase
109.
8%20
1920
9,60
2
353
46V
alle
y S
outh
Sub
tran
smis
sion
P
roje
ctC
onst
ruct
15.
4 m
iles
of n
ew 1
15 k
V
subt
rans
mis
sion
line
Jul 2
020
Lik
ely
Con
tinge
ncy
100.
4%20
2155
,386
481
22E
l Nid
o-L
enno
x 66
kV
S
ubtr
ansm
issi
on L
ine
Con
stru
ct 5
mile
of
954
SA
C li
neD
ec 2
020
Lik
ely
Con
tinge
ncy
136%
2020
13,0
49
568
71R
ecto
r-R
iver
way
No.
2 6
6 kV
Con
stuc
t a n
ew 6
6 kV
sub
tran
smis
sion
line
8.5
m
iles
of 9
54 S
AC
and
1 m
ile o
f 30
00 k
cmil
Al.
Dec
202
2L
ikel
y C
ontin
genc
y10
1.6%
2022
25,7
17

72
(d) Voltage-Driven Projects 1
There are three subtransmission capacitor projects required to 2
correct greater than 5 percent voltage drop conditions during emergency Likely Contingency events. 3
These three projects are each under $3 million.72 4
(2) Licensing Status of Subtransmission Lines Projects 5
As discussed in Section II.D.1.c)(2)(d), Table II-15 below contains the 6
licensing and exemption information for each of Subtransmission Lines projects. 7
Table II-15 Licensing and Exemption Status of Subtransmission Lines Projects
(3) Basis for Capital Expenditure Forecast 8
SCE has identified thirteen subtransmission lines projects with costs equal 9
to or greater than $3 million and the total cost for these thirteen projects is $311 million for years 2019-10
2023. Additional projects with less than $3 million in CPUC-jurisdictional costs are not discussed here, 11
but are included in workpapers. The total cost for these projects is $10 million. 12
72 Refer to WP SCE-02 Vol. 04 Pt. 2, Ch. II – Book B - pp. 314 - 315 – Subtransmission Lines Projects Less
Than $3M CPUC-jurisdictional Costs.
Line No. Project No. Project Operating DatePreliminary Licensing
Determination
1 8002 El Nido-Lennox-Polaris-Yukon 66 kV Subtransmission Line Jan 2019 Exemption G
2 7764 Vestal-Columbine-Delano-Earlimart 66 kV Mar 2019 Advice Letter Filed 9/18/2014
3 7851 Porterville-Woodville 66 kV May 2019 Exemption G
4 8003 El Nido-Felton-La Cienega 66 kV Subtransmission Line Dec 2019 Exemption G
5 6030 Valley-Ivyglen 115 kV May 2020 PTC Granted
6 7505 La Cienega-Beverly-Culver 66 kV Jun 2020 Exemption G
7 5346 Valley South Subtransmission Project Jul 2020 PTC Granted
8 8122 El Nido-Lennox 66 kV Subtransmission Line Dec 2020 GO 131-D Under Review
9 8151 Irvine 66/12 kV Substation Jun 2022 Substation Modification
10 8251 Saugus-Newhall No.1 & Saugus-Newhall No.2 66 kV Subtransmission Lin Jun 2022 Exemption E
11 6871 Rector-Riverway No. 2 66 kV Dec 2022 GO 131-D Under Review
12 6652 Saugus-Elizabeth Lake-MWD Foothill 66 kV Subtransmission Line Jun 2023 Exemption G
13 8252 Saugus-Colossus-Lockheed-Pitchgen 66 kV Subtransmission Line Jun 2023 Exemption B
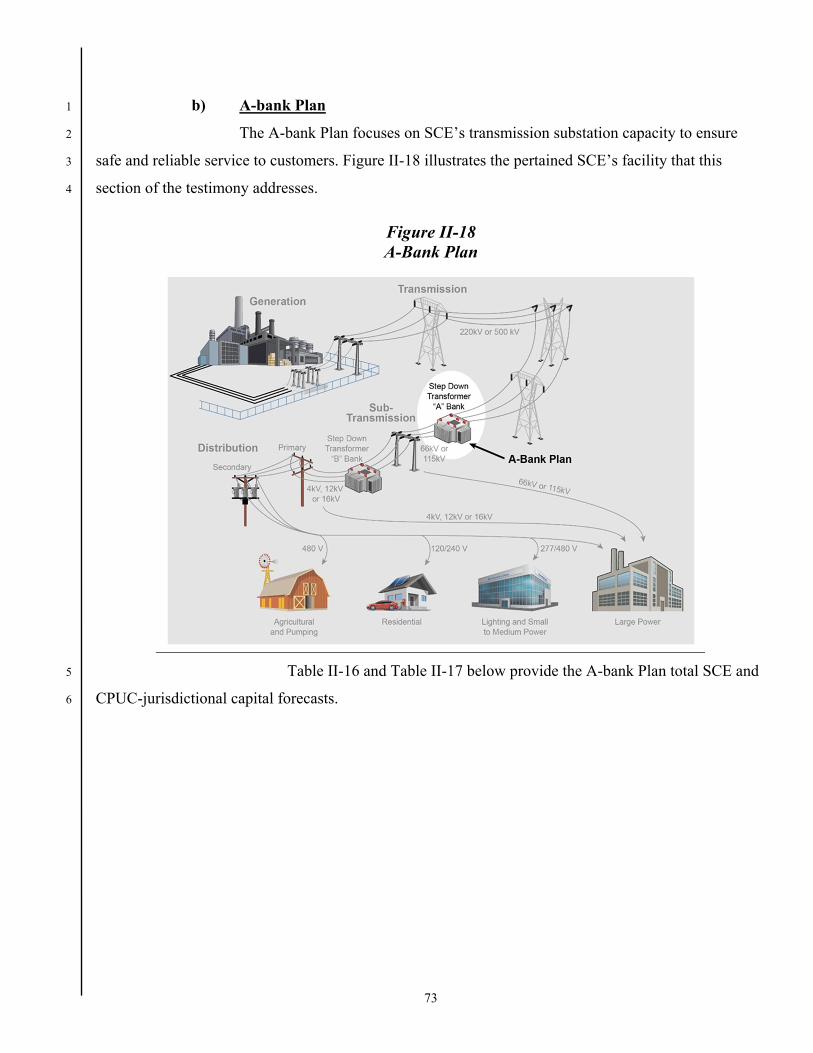
73
b) A-bank Plan 1
The A-bank Plan focuses on SCE’s transmission substation capacity to ensure 2
safe and reliable service to customers. Figure II-18 illustrates the pertained SCE’s facility that this 3
section of the testimony addresses. 4
Figure II-18 A-Bank Plan
Table II-16 and Table II-17 below provide the A-bank Plan total SCE and 5
CPUC-jurisdictional capital forecasts. 6

74
Table II-16 A-Bank Plan Capital Expenditure Summary73,74,75
(Total Company – Nominal $000)
Table II-17 A-Bank Plan Capital Expenditure Summary
(CPUC-Jurisdictional – Nominal $000)
73 Refer to WP SCE-02 Vol. 04 Pt. 2, Ch. II – Book B - pp. 320 - 333 – A-Bank Projects.
74 Refer to WP SCE-02 Vol. 04 Pt. 2, Ch. II – Book B - pp. 334 - 335 – A-Bank Projects Less Than $3M CPUC-jurisdictional Costs.
75 Refer to WP SCE-02 Vol. 04 Pt. 2, Ch. II – Book B - pp. 336 - 337 – A-Bank Projects Outside the GRC Window.
Line No.
Project No. Project NameOperating
DatePrior 2019 2020 2021 2022 2023 Total
1 5383 Chino 220/66 kV Dec 2019 42,365 9,773 1,002 2,672 - - 55,812
2 7767 Johanna 220/66 kV May 2020 10,265 7,044 - - - - 17,309
3 7740 Del Amo 220/66 kV Dec 2020 432 252 3,164 - - - 3,848
4 Subtotal of A-Bank Plan 53,062 17,069 4,166 2,672 0 0 76,969
5 Project with CPUC-jurisdictional cost < $3M 0 60 738 0 0 0 798
6 Projects with operating date outside of GRC window 178,318 6,070 3,440 2,000 50,696 122,877 363,401
7 Total A-Bank Plan 231,380 23,199 8,344 4,672 50,696 122,877 441,168
Line No.
Project No. Project NameOperating
DatePrior 2019 2020 2021 2022 2023 Total
1 5383 Chino 220/66 kV Dec 2019 41,135 8,920 805 2,672 - - 53,532
2 7767 Johanna 220/66 kV May 2020 10,265 7,044 - - - - 17,309
5 7740 Del Amo 220/66 kV Dec 2020 432 252 3,164 - - - 3,848
6 Subtotal of A-Bank Plan 51,832 16,216 3,969 2,672 - - 74,689
7 Project with CPUC-jurisdictional cost < $3M - 60 738 - - - 798
8 Projects with operating date outside of GRC window 145,998 4,153 2,655 952 20,822 58,732 233,312
9 Total A-Bank Plan 197,830 20,429 7,362 3,624 20,822 58,732 308,799
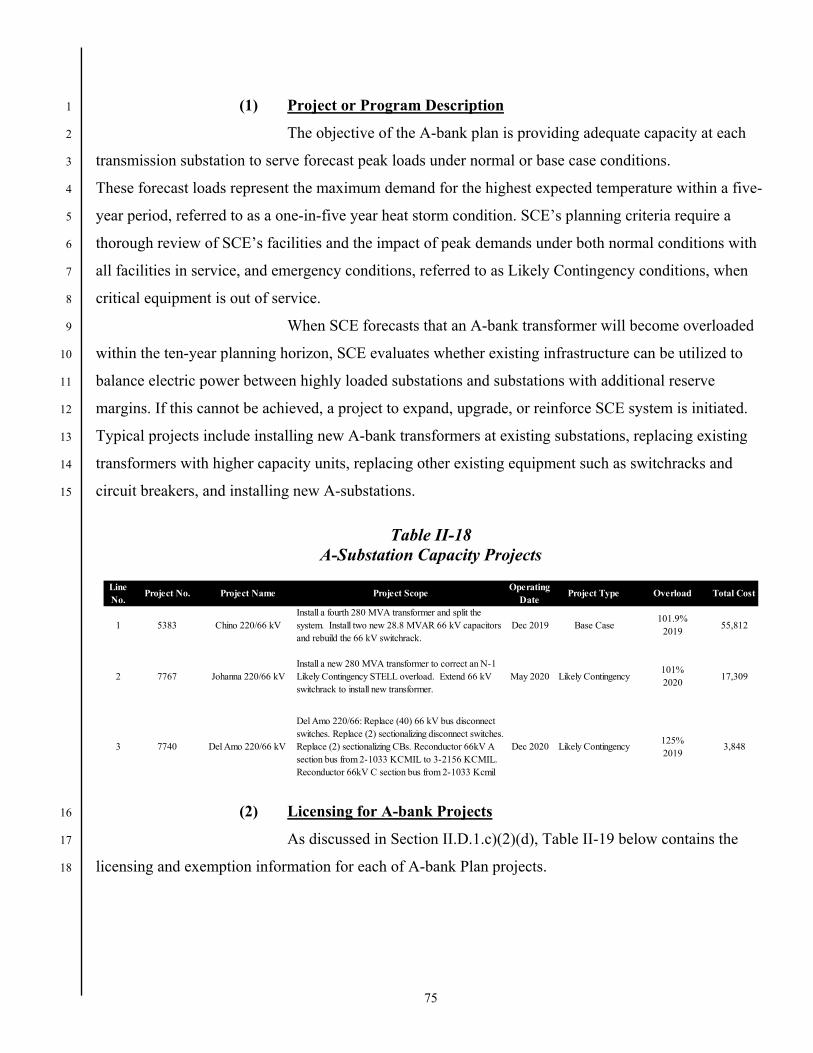
75
(1) Project or Program Description 1
The objective of the A-bank plan is providing adequate capacity at each 2
transmission substation to serve forecast peak loads under normal or base case conditions. 3
These forecast loads represent the maximum demand for the highest expected temperature within a five-4
year period, referred to as a one-in-five year heat storm condition. SCE’s planning criteria require a 5
thorough review of SCE’s facilities and the impact of peak demands under both normal conditions with 6
all facilities in service, and emergency conditions, referred to as Likely Contingency conditions, when 7
critical equipment is out of service. 8
When SCE forecasts that an A-bank transformer will become overloaded 9
within the ten-year planning horizon, SCE evaluates whether existing infrastructure can be utilized to 10
balance electric power between highly loaded substations and substations with additional reserve 11
margins. If this cannot be achieved, a project to expand, upgrade, or reinforce SCE system is initiated. 12
Typical projects include installing new A-bank transformers at existing substations, replacing existing 13
transformers with higher capacity units, replacing other existing equipment such as switchracks and 14
circuit breakers, and installing new A-substations. 15
Table II-18 A-Substation Capacity Projects
(2) Licensing for A-bank Projects 16
As discussed in Section II.D.1.c)(2)(d), Table II-19 below contains the 17
licensing and exemption information for each of A-bank Plan projects. 18
Line No.
Project No. Project Name Project ScopeOperating
DateProject Type Overload Total Cost
1 5383 Chino 220/66 kVInstall a fourth 280 MVA transformer and split the system. Install two new 28.8 MVAR 66 kV capacitors and rebuild the 66 kV switchrack.
Dec 2019 Base Case101.9%
201955,812
2 7767 Johanna 220/66 kVInstall a new 280 MVA transformer to correct an N-1 Likely Contingency STELL overload. Extend 66 kV switchrack to install new transformer.
May 2020 Likely Contingency101%2020
17,309
3 7740 Del Amo 220/66 kV
Del Amo 220/66: Replace (40) 66 kV bus disconnect switches. Replace (2) sectionalizing disconnect switches. Replace (2) sectionalizing CBs. Reconductor 66kV A section bus from 2-1033 KCMIL to 3-2156 KCMIL. Reconductor 66kV C section bus from 2-1033 Kcmil
Dec 2020 Likely Contingency125%2019
3,848
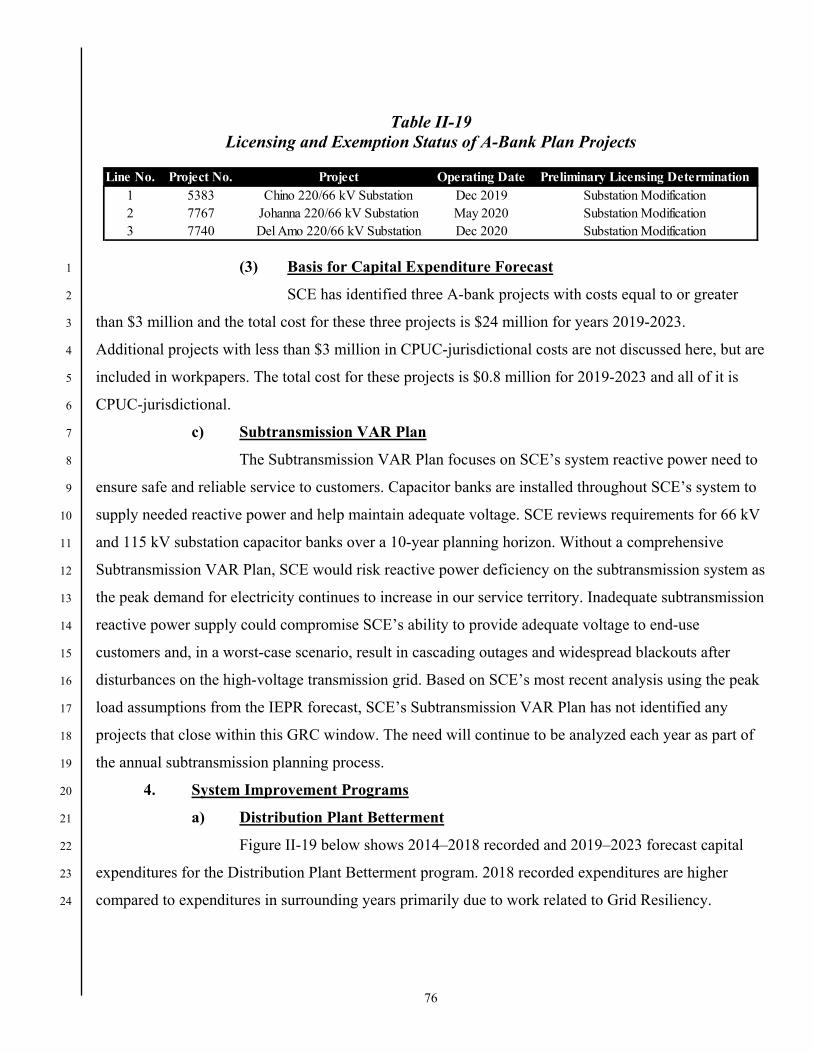
76
Table II-19 Licensing and Exemption Status of A-Bank Plan Projects
(3) Basis for Capital Expenditure Forecast 1
SCE has identified three A-bank projects with costs equal to or greater 2
than $3 million and the total cost for these three projects is $24 million for years 2019-2023. 3
Additional projects with less than $3 million in CPUC-jurisdictional costs are not discussed here, but are 4
included in workpapers. The total cost for these projects is $0.8 million for 2019-2023 and all of it is 5
CPUC-jurisdictional. 6
c) Subtransmission VAR Plan 7
The Subtransmission VAR Plan focuses on SCE’s system reactive power need to 8
ensure safe and reliable service to customers. Capacitor banks are installed throughout SCE’s system to 9
supply needed reactive power and help maintain adequate voltage. SCE reviews requirements for 66 kV 10
and 115 kV substation capacitor banks over a 10-year planning horizon. Without a comprehensive 11
Subtransmission VAR Plan, SCE would risk reactive power deficiency on the subtransmission system as 12
the peak demand for electricity continues to increase in our service territory. Inadequate subtransmission 13
reactive power supply could compromise SCE’s ability to provide adequate voltage to end-use 14
customers and, in a worst-case scenario, result in cascading outages and widespread blackouts after 15
disturbances on the high-voltage transmission grid. Based on SCE’s most recent analysis using the peak 16
load assumptions from the IEPR forecast, SCE’s Subtransmission VAR Plan has not identified any 17
projects that close within this GRC window. The need will continue to be analyzed each year as part of 18
the annual subtransmission planning process. 19
4. System Improvement Programs 20
a) Distribution Plant Betterment 21
Figure II-19 below shows 2014–2018 recorded and 2019–2023 forecast capital 22
expenditures for the Distribution Plant Betterment program. 2018 recorded expenditures are higher 23
compared to expenditures in surrounding years primarily due to work related to Grid Resiliency. 24
Line No. Project No. Project Operating Date Preliminary Licensing Determination1 5383 Chino 220/66 kV Substation Dec 2019 Substation Modification2 7767 Johanna 220/66 kV Substation May 2020 Substation Modification3 7740 Del Amo 220/66 kV Substation Dec 2020 Substation Modification

77
Figure II-19 Distribution Plant Betterment Capital Expenditure Summary
WBS Element CET-PD-LG-PB76 Recorded 2014-2018/Forecast 2019-2023
(Total Company – Nominal $000)
(1) Program Description and Need for Activity 1
Plant Betterment is an activity that performs system improvements and 2
projects to address local needs that are not covered by the Distribution Circuit Upgrades (DCU) 3
program. This activity can include projects to address changes in load profiles that drive local low 4
voltage problems, new protection devices and switches needed for safety and reliability, new 5
developments that require a single-phase circuit voltage where none exists, new street or freeway 6
improvements that impact SCE’s electric infrastructure, and more. 7
One example of plant betterment work is facilities required to help ensure 8
SCE is able to meets its obligation of providing adequate voltage within the allowable range as 9
76 Refer to WP SCE-02 Vol. 04 Pt. 2, Ch. II – Book B - pp. 338 - 340 – Capital Detail by WBS Element for
Distribution Plant Betterment.
78
prescribed by SCE’s Commission-approved Rule 2.77 In some areas customer load additions or changes 1
in distribution system configurations may lead to voltage violations and must be resolved quickly. 2
Installing voltage regulators, capacitors, or increasing the size of existing overhead conductors or 3
underground cables are typical solutions to remedy voltage issues. 4
Another example of plant betterment work includes distribution circuit 5
modifications that may be necessary for reliability, safety, or protection reasons. The distribution system 6
is dynamic and changes to it can occur frequently and quickly to meet the electrical needs of customers. 7
Over time and due to these changes, distribution circuits may require additional facilities to be installed 8
(e.g., switches, protective devices, etc.) to help ensure reliable and safe electrical service, along with 9
providing system operational flexibility. For example, to minimize the number of customers that may be 10
impacted when performing routine system maintenance, strategically located switches to sectionalize 11
and transfer load are required. Additionally, to minimize both the magnitude (number of customers 12
impacted) and the duration of unplanned outages, automatic reclosers78 are also required in strategic 13
locations. Sometimes, particularly on longer distribution circuits and as circuit configurations change or 14
customer loads change, the location of the existing automatic reclosers are insufficient to perform the 15
needed functions. In these cases, SCE may install additional automatic reclosers. In other cases, 16
customer loads change, that requires the installation of new or upgraded devices. 17
A third example of a plant betterment addition is the modification of a 18
distribution circuit to allow for the transfer of load from one circuit to an adjacent circuit where the 19
current configuration of the circuitry would not allow it. As identified above, SCE’s distribution system 20
consists of a three-phase power system that provides electricity to customers through either three-phase 21
or single-phase service. The distribution circuits that deliver this power are configured as either three-22
wire circuits or four-wire circuits. Three-wire circuits have three conductors only; one for each of the 23
three phases. Four-wire circuits have four conductors; one for each of the three phases and a fourth for a 24
neutral path. When single-phase service is required, it can be provided in either of two configurations: 25
“phase-to-phase” or “phase-to-ground.” Both configurations provide single-phase service to the 26
77 D.97-10-087.
78 Automatic reclosers are switches that have the capability to perform protection functions by being able to interrupt fault current in a manner similar to circuit breakers.

79
customer; however the connections necessary to provide the service are different and the voltage ratings 1
of the transformers providing the service are different. 2
When SCE identifies a load transfer from one circuit to another as the 3
preferred solution to addressing a projected loading issue, the two circuits must be compatible in their 4
configuration to perform the transfer (e.g., both four-wire circuits or both three-wire circuits). Should the 5
two circuits not have compatible configurations,79 the addition of a fourth-wire is considered to make the 6
circuit configurations compatible. The addition of a fourth wire to an existing three-wire circuit can 7
often be a cost-effective alternative solution to other distribution circuit upgrades or new distribution 8
circuits. 9
Finally, another example of plant betterment investments include adding 10
infrastructure during street improvement plans or freeway crossings which provide SCE the opportunity 11
to underground facilities for future use at the time that the improvements are occurring rather than at a 12
later date. By leveraging the construction activities in progress, SCE is able to install underground 13
facilities that would otherwise be disruptive and costly to install at a later date, such as after street 14
paving and road closures are complete. Adding pathways (e.g., underground conduits) through bridges 15
or in freeway overpasses can also avoid these impacts when the facilities would become needed in the 16
future. Developers often work with SCE in these situations to allow for these plant betterment 17
investments to occur in an optimal and a cost-effective manner. 18
(2) Basis for Capital Expenditure Forecast 19
The Distribution Plant Betterment forecast expenditures include work 20
required to meet anticipated load growth causing voltage violations, for either reliability or safety and 21
protection reasons, and to meet contingency scenarios. Work in this category improves voltage profiles 22
to better serve customers by installing voltage regulators or increasing the size of conductor or cable. 23
Due to the diverse project scope, SCE does not forecast costs based on unit cost. 24
Figure II-19 above shows 2014–2018 recorded and 2019–2023 forecast 25
expenditures for the Distribution Plant Betterment program. Recorded expenditures in 2014 and 2015 26
are higher compared to expenditures in surrounding years due to the inclusion of upgrades completed to 27
meet regional needs identified by districts throughout the SCE service territory, upgrades to the Long 28
79 Single-phase “phase-to-ground” connected load requires one phase conductor and a ground conductor (also
known as a “fourth wire”) and are served by four-wire circuits. This load cannot be transferred to a three-wire circuit as it does not have a “fourth wire” or ground conductor necessary to provide appropriate voltage.
80
Beach secondary network system after the downtown area experienced long outage durations in 2015, 1
including the installation of vault cover restraints, and work similar to the Overhead Conductor Program 2
(OCP) before the program was created. 3
In 2018, recorded expenditures are higher compared to expenditures in 4
surrounding years primarily due to work related to Grid Resiliency before SCE officially established this 5
program and regional grid needs. As discussed in SCE-01, SCE needed to act with a sense of urgency in 6
2018 to address the wildfire threat; as such, SCE used the Plant Betterment program to record 7
expenditures until the grid resiliency program could be established with its own accounting needs.80 8
The basis for the forecast looks at qualifying Plant Betterment historical 9
work between 2015-2018. Historical costs for the work similar to OCP, regional grid needs, Long Beach 10
secondary network upgrades, and the 2018 Grid Resiliency work are not included in the calculated 11
forecast for 2019–2023. In 2018 constant dollars, average expenditures over the 2015–2018 historical 12
period is $16.7 million.81 We expect the forecast need to match the historical workload in this category 13
during the forecast period (excluding the previously mentioned adders in 2015 and 2018). However, due 14
to the Grid Resiliency effort, additional considerations needed to be taken due to the reduction in 15
resources. SCE anticipates to include all needed work for Distribution Plant Betterment in the 2024 16
General Rate Case. The total forecast expenditures from 2019–2023 is $32.9 million (in nominal 17
dollars).82 18
80 See also Exhibit SCE-01, Volume 1 and Exhibit SCE-04, Volume 5.
81 Refer to WP SCE-02 Vol. 04 Pt. 2, Ch. II – Book B - pp. 341 - 342 – Distribution Plant Betterment Forecast Methodology.
82 Id.
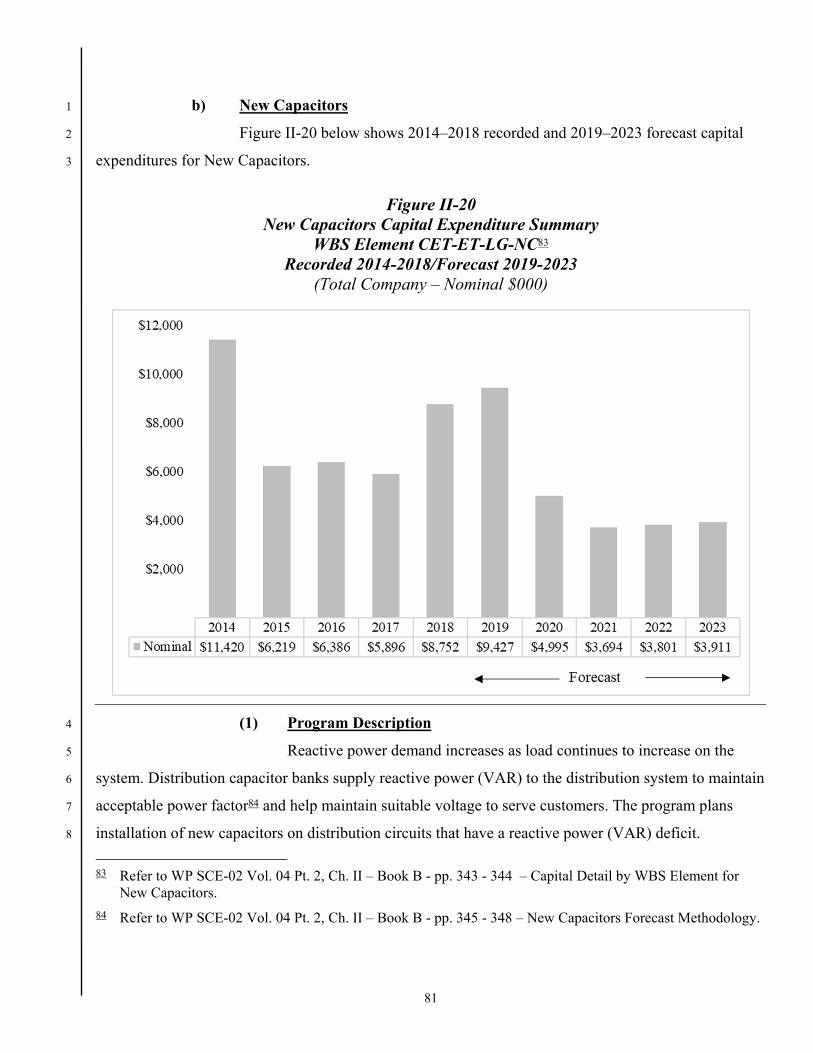
81
b) New Capacitors 1
Figure II-20 below shows 2014–2018 recorded and 2019–2023 forecast capital 2
expenditures for New Capacitors. 3
Figure II-20 New Capacitors Capital Expenditure Summary
WBS Element CET-ET-LG-NC83 Recorded 2014-2018/Forecast 2019-2023
(Total Company – Nominal $000)
(1) Program Description 4
Reactive power demand increases as load continues to increase on the 5
system. Distribution capacitor banks supply reactive power (VAR) to the distribution system to maintain 6
acceptable power factor84 and help maintain suitable voltage to serve customers. The program plans 7
installation of new capacitors on distribution circuits that have a reactive power (VAR) deficit. 8
83 Refer to WP SCE-02 Vol. 04 Pt. 2, Ch. II – Book B - pp. 343 - 344 – Capital Detail by WBS Element for
New Capacitors.
84 Refer to WP SCE-02 Vol. 04 Pt. 2, Ch. II – Book B - pp. 345 - 348 – New Capacitors Forecast Methodology.

82
(2) Basis for Capital Expenditure Forecast 1
SCE’s forecast expenditures for 2019–2023, as shown in Figure II-20, are 2
based on estimated growth in VAR demand of each circuit on SCE’s distribution system and 3
corresponding numbers of capacitor banks that need to be installed to meet this VAR demand. The VAR 4
demand is calculated based on SCE’s peak load forecast and historical load characteristics of each 5
distribution circuit.85 The capacitor bank cost is inclusive of all capital to complete an installation as it is 6
based on an average of historical closed work orders for completed capacitor installation projects. 7
In addition to meeting estimated growth in VAR demand, SCE’s forecast 8
expenditures also include installing capacitors to address existing VAR deficit, such as on 33 kV 9
circuits. Due to unavailability of 33 kV rated capacitor banks, SCE was not able to completely meet 10
VAR needs of these circuits in previous years. To address these needs, SCE is expecting the 11
development of required components for 33 kV rated capacitor banks to be finalized and available for 12
standard installation in 2020-2021. The New Capacitors forecast includes anticipated work for these 13
capacitor banks beginning in 2021. 14
c) Distribution Volt-VAR Control (DVVC) and Programmable Capacitor 15
Controller (PCC) Replacement Program 16
Figure II-21 below shows the recorded cost in 2014-2018 and forecast capital 17
expenditure in 2019-2023. 18
85 Id.

83
Figure II-21 Distribution Volt VAR Control & Programmable Capacitor Control Replacement Capital
Expenditure Summary WBS Element CET-PD-LG-CV86
Recorded 2014-2018/Forecast 2019-2023 (Total Company - Nominal $000)
(1) Program Description and Need for Activity 1
The Programmable Capacitor Control (PCC) Replacement program and 2
the associated Distribution Volt VAR Control (DVVC) algorithm are implemented at SCE to allow for 3
Conservation Voltage Regulation87 (CVR) to decrease energy consumption, while maintaining reliable 4
voltage delivery88 to SCE customers. 5
Programmable capacitor controls are specifically designed for the control 6
and automation of pole-mounted and pad-mounted switched capacitor banks in SCE’s distribution 7
86 Refer to WP SCE-02 Vol. 04 Pt. 2, Ch. II – Book B - pp. 349 - 351 – Capital Detail by WBS Element for
DVVC.
87 Conservation Voltage Regulation and Conservation Voltage Reduction are used interchangeably in the utility industry. CVR is the ratio between percentage of energy reduction to percentage voltage reduction.
88 Voltage as designated in the ANSI C84.1 standard and modified by California Rule 2.

84
system. A capacitor control’s basic function is to provide remote capability89 to open or close switches 1
on capacitor banks based on established engineering settings for voltage, temperature, and/or time bias 2
control strategies. PCCs are an important asset to the implementation of CVR and play an integral part 3
for the DVVC algorithm. SCE’s PCC Replacement program replaces failed or non-functional PCCs and 4
upgrades obsolete PCCs in support of the DVVC algorithm. PCCs are also used for automating existing 5
installed capacitor banks90 to provide additional telemetry capability as well as reliability to the system. 6
The DVVC program is implemented at SCE as a centralized control 7
algorithm designed to achieve an optimal voltage and VARs across all circuits fed by substation 8
transformers. As shown in Figure II-22 below, supervisory-controlled distribution substation capacitors 9
and existing standard automated distribution field capacitors on distribution circuits are leveraged to 10
provide input for the DVVC algorithm to make real-time decisions by switching on or off the above-11
mentioned field and substation capacitors. As a result of the optimization, the system average voltage is 12
reduced; which in turn reduces energy consumption while maintaining overall customer service voltage 13
requirements.91 SCE DVVC program began in 2016, and successfully implemented the DVVC 14
algorithm to 297 substations. As a result of the DVVC algorithm implementation, SCE has demonstrated 15
that this centralized control strategy resulted in a CVR of 1.07 (0.6% in energy reduction and 0.56% 16
voltage reduction) in 2016 and 2017, 1.33 (0.8% energy reduction and 0.6% voltage reduction) in 2018. 17
As the CVR program evolves, the need for continued improvement and expansion of the current 18
algorithm to the rest the substations across service territory will further improve CVR benefits.92 19
89 System telemetry at a capacitor location is provided via the Distribution Management System (DMS) such as
device status, remote capability, voltage reading, harmonic readings, internal settings, and provides the ability for operators to remotely modifying the PCC internal settings over the air via existing Netcomm system.
90 Existing installed capacitor banks that do not have remote control capability are often called “fixed capacitor banks”.
91 DVVC optimizes customer voltage profiles through dynamic switching of substation and field capacitors. Engineering analysis determines the voltage thresholds for DVVC algorithm at different loading conditions (summer peak vs. winter peak load), while maintaining customer voltage within its required voltage range.
92 Refer to WP SCE-02 Vol. 04 Pt. 2, Ch. II – Book B - pp. 352 - 359 – DVVC and PCC Replacement Program Details.

85
Figure II-22 DVVC Optimization Process
(2) Basis for Capital Expenditure Forecast 1
SCE PCC replacement forecast is based on recorded replacement from 2
2014-2018. In 2016 and 2017, with the increased visibility from the implementation of the DVVC 3
algorithm, the PCC replacement ramped up due to the number of failed or non-functioning PCCs and 4
upgrade obsolete PCCs in order to support the DVVC algorithm. From the historical recorded 5
replacement and cost, this is used to derive the forecasted PCC replacement forecast and unit cost. 6
Table II-20 below shows the capital expenditure forecast for the DVVC 7
and PCC replacement program in 2019-2023. 8
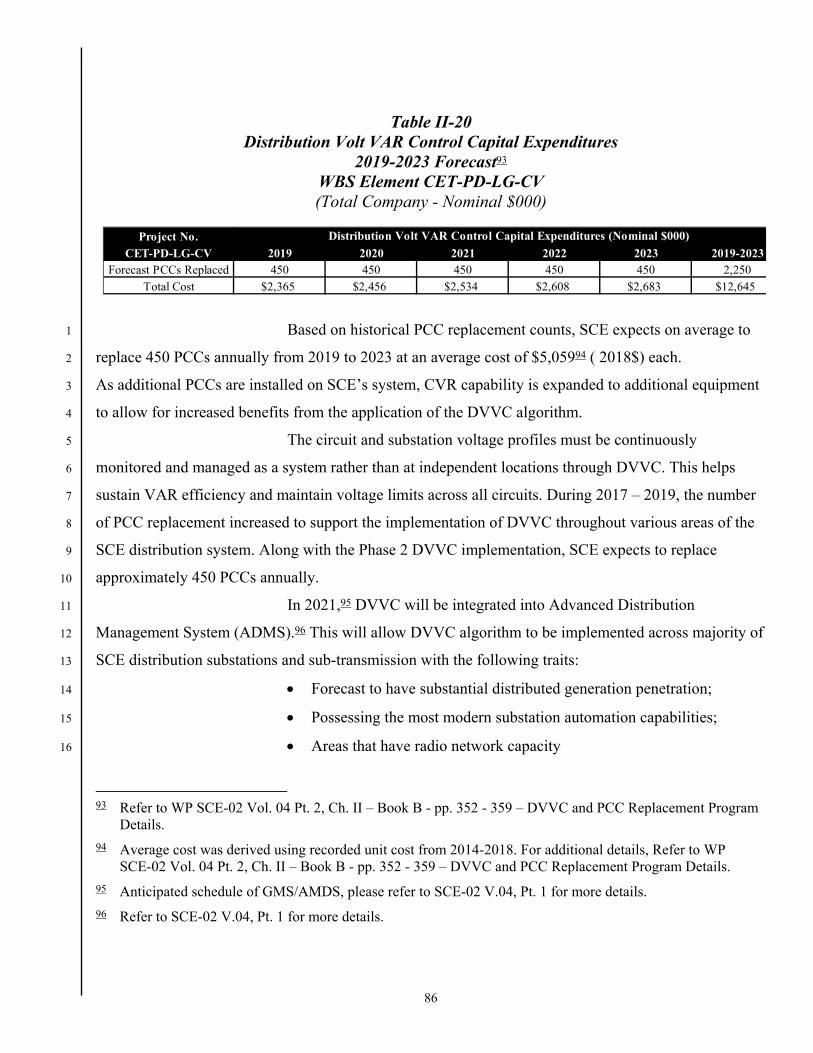
86
Table II-20 Distribution Volt VAR Control Capital Expenditures
2019-2023 Forecast93 WBS Element CET-PD-LG-CV (Total Company - Nominal $000)
Based on historical PCC replacement counts, SCE expects on average to 1
replace 450 PCCs annually from 2019 to 2023 at an average cost of $5,05994 ( 2018$) each. 2
As additional PCCs are installed on SCE’s system, CVR capability is expanded to additional equipment 3
to allow for increased benefits from the application of the DVVC algorithm. 4
The circuit and substation voltage profiles must be continuously 5
monitored and managed as a system rather than at independent locations through DVVC. This helps 6
sustain VAR efficiency and maintain voltage limits across all circuits. During 2017 – 2019, the number 7
of PCC replacement increased to support the implementation of DVVC throughout various areas of the 8
SCE distribution system. Along with the Phase 2 DVVC implementation, SCE expects to replace 9
approximately 450 PCCs annually. 10
In 2021,95 DVVC will be integrated into Advanced Distribution 11
Management System (ADMS).96 This will allow DVVC algorithm to be implemented across majority of 12
SCE distribution substations and sub-transmission with the following traits: 13
Forecast to have substantial distributed generation penetration; 14
Possessing the most modern substation automation capabilities; 15
Areas that have radio network capacity 16
93 Refer to WP SCE-02 Vol. 04 Pt. 2, Ch. II – Book B - pp. 352 - 359 – DVVC and PCC Replacement Program
Details.
94 Average cost was derived using recorded unit cost from 2014-2018. For additional details, Refer to WP SCE-02 Vol. 04 Pt. 2, Ch. II – Book B - pp. 352 - 359 – DVVC and PCC Replacement Program Details.
95 Anticipated schedule of GMS/AMDS, please refer to SCE-02 V.04, Pt. 1 for more details.
96 Refer to SCE-02 V.04, Pt. 1 for more details.
Project No.
CET-PD-LG-CV 2019 2020 2021 2022 2023 2019-2023Forecast PCCs Replaced 450 450 450 450 450 2,250
Total Cost $2,365 $2,456 $2,534 $2,608 $2,683 $12,645
Distribution Volt VAR Control Capital Expenditures (Nominal $000)
87
Including 33kV substations that will have voltage and VAR support 1
apparatus with the deployment of 33kV automated capacitors. 2
SCE’s CVR program will continue to improve the already-implemented 3
DVVC algorithm systems, as well as expanding to stations with active voltage regulation such as Load 4
Tap Changers (LTC), Voltage Regulators, newly-automated distribution substation(s), and newly 5
installed distribution substation(s). The CVR program will focus on stations with active voltage controls 6
to implement DVVC algorithm to all automated substations across territory. The intention for expanding 7
the DVVC algorithm is to stretch the CVR benefits while collecting and refining LTC, voltage regulator 8
settings and prepare for the implementation of DVVC algorithm into advanced solution such as ADMS 9
in a near future. Prior to commissioning DVVC for a substation, all settings for transformer LTC, line 10
and field voltage regulators settings must be collected for engineering analysis. If the collected settings 11
need to be updated, SCE Substation Construction & Maintenance technician must perform these settings 12
update. This is to ensure the cohesiveness of the transformer LTC, voltage regulators operation align 13
with DVVC optimization. Additionally, all system operators and Substation Construction & 14
Maintenance technicians must understand how to safely operate associated substation equipment. 15
This requires that DVVC-related substation operating procedures and instructions be updated to mitigate 16
any potential safety concerns that could arise during normal maintenance activities. Procedures requiring 17
update include circuit breaker clearing, circuit breaker analysis, and standard station instructions for 18
each DVVC-related substation commissioned. Additionally, SCE Power System Control (PSC) group 19
update DVVC algorithm accordingly in Distribution Management System (DMS) and Energy 20
Management System (EMS) to reflect the actual locations of station and field capacitors. 21

88
d) Substation Equipment Replacement Program (SERP) 1
Figure II-23 below shows 2014–2018 recorded and 2019–2023 forecast capital 2
expenditures for SERP. 3
Figure II-23 Substation Equipment Replacement Program Capital Expenditure Summary
WBS Element CET-ET-LG-SU97 Recorded 2014-2018/Forecast 2019-2023
(Total Company – Nominal $000)
(1) Program Description 4
The Substation Equipment Replacement Program (SERP) replaces 5
substation equipment identified to exceed their protection ratings to interrupt fault current. 6
SCE identifies substation circuit breakers projected to exceed short circuit duty interrupting capabilities 7
by comparing each circuit breaker’s short circuit duty rating with the potential fault current that circuit 8
breaker will have to interrupt. Circuit breakers attempting to interrupt fault current that exceed ratings 9
97 Refer to WP SCE-02 Vol. 04 Pt. 2, Ch. II – Book B - pp. 360 - 361 – Capital Detail by WBS Element for
Substation Equipment Replacement Program.
89
have the potential to cause catastrophic failure resulting in prolonged outages. Leaving these breakers in 1
service can jeopardize worker safety, such as if a catastrophic failure were to occur when work is being 2
performed in the substation. When SCE has identified these conditions in the past, an operating bulletin 3
or procedure restricting personnel access into substations because of safety concerns has been developed 4
as a short-term work around. 5
Circuit breakers identified within this program are 115 kV, 66 kV, 16 kV, 6
12 kV, and 4 kV in voltage and are typically replaced with higher short-circuit duty rated circuit 7
breakers. An alternative option to replacing circuit breakers is to split the substation bus. This can reduce 8
short circuit duty with circuit breakers at the bus being split. However, this solution can only be 9
accomplished at subtransmission substations and is not available for distribution substations. 10
Splitting the bus at a distribution substation can potentially reduce the amount of available fault current 11
needed to operate circuit breakers as required. In addition, the option of splitting a subtransmission 12
substation bus is usually not a cost-effective solution compared to replacing circuit breakers. 13
(2) Basis for Capital Expenditure Forecast 14
As addressed in SCE’s 2018 GRC, an analysis in 2016 identified a 15
prioritized list of circuit breakers to be replaced in the years 2016-2020. The execution of this has 16
expanded to 2021 for distribution system over-stressed circuit breakers. Additionally, a 2018 analysis of 17
the subtransmission short circuit duty levels identified over-stressed circuit breakers for 2019-2023. 18
The forecast for 2022 and 2023 contain only subtransmission circuit breakers to be upgraded at this 19
point in time. The forecast varies based on need dates, execution timing, and the voltage class of the 20
circuit breakers being replaced. Table II-21 shows the counts of over-stressed circuit breakers by voltage 21
class and year of need. 22

90
Table II-21 Substation Equipment Replacement Program
Circuit Breaker Counts
The forecast is developed from circuit breaker unit costs as a starting point 1
for planned circuit breaker replacements. Unit Cost averages are calculated for each voltage class of 2
circuit breakers for the period 2014-2018.98 These are same unit costs used by the Substation 3
Infrastructure Replacement program in SCE-02 Volume 3, Section IV.B.1. The annual expenditures for 4
each circuit breaker are then split across the in-service year and the year prior. 5
As projects get closer to execution, additional details will factor into 6
project specific adjustments for materials and construction execution. The final forecast for 2019-2023 is 7
a mix of known adjustments for specific projects and unit costs for planned projects with operating dates 8
in 2021-2023.99 9
98 Refer to WP SCE-02, Vol. 3, pp. 139 - 149 – CB and Xfmr Cost Forecast.
99 Refer to WP SCE-02 Vol. 04 Pt. 2, Ch. II – Book B - pp. 20 - 22 – Substation Equipment Replacement Program Forecast Methodology.
Voltage Class 2019 2020 2021 2022 2023115 kV CBs 0 7 0 0 066 kV CBs 66 0 78 31 916 kV CBs 5 16 3 0 012 kV CBs 7 90 83 0 04 kV CBs 14 19 53 0 0
Total CBs to Replace 92 132 217 31 9
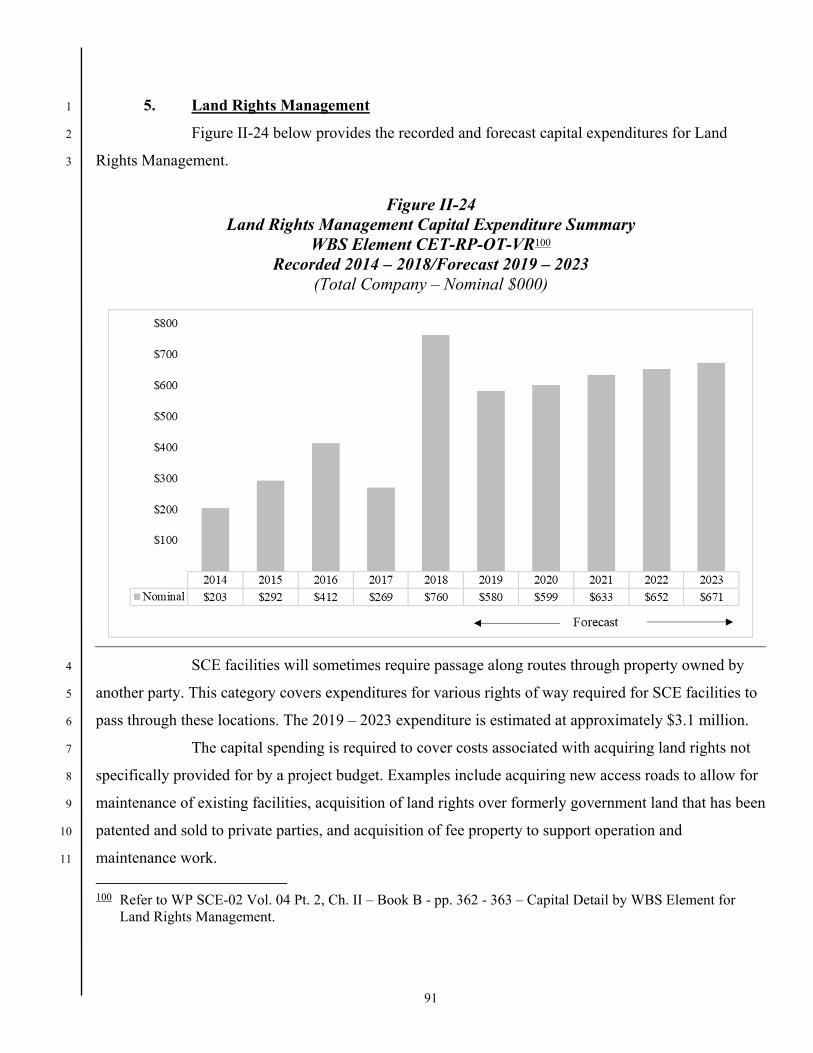
91
5. Land Rights Management 1
Figure II-24 below provides the recorded and forecast capital expenditures for Land 2
Rights Management. 3
Figure II-24 Land Rights Management Capital Expenditure Summary
WBS Element CET-RP-OT-VR100 Recorded 2014 – 2018/Forecast 2019 – 2023
(Total Company – Nominal $000)
SCE facilities will sometimes require passage along routes through property owned by 4
another party. This category covers expenditures for various rights of way required for SCE facilities to 5
pass through these locations. The 2019 – 2023 expenditure is estimated at approximately $3.1 million. 6
The capital spending is required to cover costs associated with acquiring land rights not 7
specifically provided for by a project budget. Examples include acquiring new access roads to allow for 8
maintenance of existing facilities, acquisition of land rights over formerly government land that has been 9
patented and sold to private parties, and acquisition of fee property to support operation and 10
maintenance work. 11
100 Refer to WP SCE-02 Vol. 04 Pt. 2, Ch. II – Book B - pp. 362 - 363 – Capital Detail by WBS Element for
Land Rights Management.

92
Since the purpose of this request is to cover miscellaneous acquisitions that are not 1
associated with a specific project or major project, whereby a land right must be acquired and the cost 2
associated with the acquisition was not expected for the year. The forecast is based on an operating level 3
that has generally covered historical and anticipated expenses in the forecast period. 4
Example expenditures are permit-to-license conversion, load growth and when no documented 5
transmission rights are found. The forecast would cover all costs associated with acquiring the land 6
right, document preparation, valuation, negotiations, and survey/mapping. 7

93
III. 1
TRANSMISSION PROJECTS 2
A. Overview 3
The Transmission Projects Business Plan Element includes work SCE completes on its high 4
voltage transmission system (500 kV and 220 kV). SCE’s high voltage transmission system, which 5
includes transmission lines, substations, and 500/220 kV transformers, are under the operational control 6
of the California Independent System Operator (CAISO) and subject to Federal Energy Regulatory 7
Commission (FERC) jurisdiction. In order to sustain system reliability and flexibility, and meet our 8
customers’ future needs, SCE must continue to maintain, expand, and improve the transmission system. 9
The transmission system must be designed to handle fluctuation in load, generation, and imports, and 10
withstand disturbances from outages, storms, and other events. 11
SCE’s remaining electric system, with the exception of two subtransmission systems,101 are 12
under the operational control of SCE and within CPUC jurisdiction. Figure III-25 below illustrates the 13
general jurisdictional split between the CPUC and FERC. 14
101 The two subtransmission systems under the operational control of the CAISO (as they operate in parallel with
the CAISO controlled transmission system) are: (1) the Antelope-Bailey 66 kV System, and (2) the Victor-Kramer 115 kV System.

94
Figure III-25 General Jurisdictional Split Between CPUC and FERC
B. 2018 Decision 1
1. Comparison of Authorized 2018 to Recorded 2
Pursuant to the 2018 GRC Decision, SCE provides the following comparison between 3
2018 authorized and recorded expenditures;102 Figure III-26 shows the comparison for Transmission 4
Projects. 5
102 D.19-05-020, Ordering Paragraph 22, pp. 441-442.

95
Figure III-26 Transmission Projects
2018 GRC Authorized Variance Summary 2018 Capital103 (Total Company - Nominal $Millions)
For Renewable Transmission Projects, SCE spent $72 million less than authorized in 1
2018. The largest portion of the variance was $41 million related to the West of Devers Upgrade Project 2
and this amount is 100% FERC jurisdictional. Actual expenditures for the West of Devers Upgrade 3
Project were lower than originally forecast in the 2018 GRC due to lower market prices as bids were 4
awarded and execution delays arising from licensing and permitting issues. The other primary driver of 5
the variance was due to the deferral of the second Colorado River Substation AA-bank project. 6
As project commencement is triggered when enough generation customers interconnect to the 7
substation, customer project withdrawals in the cluster study process pushed the project start date (and 8
corresponding expenditures) from the date originally projected in the 2018 GRC. 9
103 Refer to WP SCE-07 Vol. 01. – Capital Authorized to Recorded.

96
For Grid Reliability Projects, the Mesa 500 kV Substation Project came in over the 2018 1
authorized amount by $83 million (mostly FERC-jurisdictional) due to scope changes, additional project 2
support required for licensing and permitting delays, and unit price changes and escalation. 3
Conversely, the Eldorado-Lugo-Mohave Series Capacitor Project, which is listed as a Grid Reliability 4
project in this filing, experienced a $77 million underrun due to the application needing to be amended 5
and re-filed from a Permit to Construction to a Certificate of Public Need and Necessity. 6
C. Capital Expenditures - Transmission Projects 7
While the majority of work for Transmission Projects fall within FERC jurisdiction, some of 8
these projects include components under CPUC jurisdiction – including upgrades to the underlying 9
subtransmission system and equipment supporting telecommunications, automation, and controls.104 10
Both the total project and CPUC-jurisdictional expenditures forecast for these projects from 2019 to 11
2023 are shown in Table III-22 and Table III-23, respectively. 12
In general, a forecast and its associated expenditure plan are developed based on the scope of 13
work, the timing of execution and activities, the costs of goods and services, and the applicable 14
allocations, adjustments and/or allowances. Hence, the forecast reflects the cash requirement and reserve 15
for the planned activities in an accounting period. Allocations are indirect costs, including overheads, 16
attributable to execution. Adjustments and allowances are any informed changes to the forecast 17
incorporating identified risks and opportunities, lessons learned, spending or resource constraints, 18
studies of historic expenditures, and/or expert judgment. 19
Transmission Projects are categorized as Grid Reliability, Renewable Transmission, or 20
Generation Interconnection Remedial Action Scheme (RAS). Details for Grid Reliability and Renewable 21
Transmission Projects are provided Sections III.C.1 and III.C.2 below. However, the Generation 22
Interconnection RAS is not discussed further as there are no CPUC-jurisdictional capital expenditures 23
forecast from 2019 to 2023. 24
104 See SCE-07, Vol. 1 for SCE’s methodology for separating capital expenditures between FERC and CPUC
jurisdiction.

97
Table III-22 Transmission Projects Capital Expenditure Summary105,106
(Total Company – Nominal $000)
Table III-23 Transmission Projects Capital Expenditure Summary
(CPUC-Jurisdictional – Nominal $000)
1. Grid Reliability Projects 1
The two tables below, Table III-24 (Total Company) and Table III-25 (CPUC-2
jurisdictional only), list the Grid Reliability Projects with over $3 million in CPUC-jurisdictional capital 3
expenditures that are expected to be completed and operational by the end of 2023. Details regarding 4
forecast expenditures for Grid Reliability Projects with CPUC-jurisdictional costs of less than $3 million 5
each are provided in workpapers.107 6
105 Refer to WP SCE-02 Vol. 04 Pt. 2, Ch. III – Book C - pp. 1 - 223 – Capital Detail by WBS Element for
Transmission Projects.
106 Forecast IT/Telecomm reflects projected telecommunication infrastructure expenditures supporting planned projects where no specific telecommunication scope estimates have been finalized at the time of filing.
107 Refer to WP SCE-02 Vol. 04 Pt. 2, Ch. III – Book C - pp. 224 – 225 – Grid Reliability Projects Less Than $3M CPUC-jurisdictional Costs.
Line No.
Program/Project Category Prior 2019 2020 2021 2022 2023 Total
1 Grid Reliability 596,348 235,708 345,041 258,409 193,899 113,378 1,742,783 2 Renewable Transmission 2,281,982 190,594 204,100 185,388 202,174 - 3,064,238 3 Generation Interconnection RAS 21,189 4,914 2,120 10,651 1,006 - 39,879 4 Forecast IT/Telecomm - 2,675 - - 11,819 9,601 24,094 5 Total Transmission Projects 2,899,520 433,891 551,260 454,448 408,897 122,978 4,870,994
Line No.
Program/Project Category Prior 2019 2020 2021 2022 2023 Total
1 Grid Reliability 275,123 81,963 50,257 26,051 24,529 19,731 477,655 2 Renewable Transmission 459,726 5,779 5,638 5,443 8,857 - 485,443 3 Generation Interconnection RAS - - - - - - - 4 Forecast IT/Telecomm - 2,675 - - 11,819 9,601 24,094 5 Total Transmission Projects 734,849 90,418 55,895 31,494 45,204 29,332 987,192

98
Table III-24 Grid Reliablity Projects Capital Expenditure Summary108,109,110,111
CWBS Elements CET-ET-TP-RL (Total Company – Nominal $000)
Table III-25 Grid Reliability Projects Capital Expenditure Summary
CWBS Elements CET-ET-TP-RL (CPUC-Jurisdictional – Nominal $000)
108 Refer to WP SCE-02 Vol. 04 Pt. 2, Ch. III – Book C - pp. 226 - 233 – Transmission Projects Descriptions.
109 Refer to WP SCE-02 Vol. 04 Pt. 2, Ch. III – Book C - pp. 234 – 267 – Grid Reliability Projects.
110 Refer to WP SCE-02 Vol. 04 Pt. 2, Ch. III – Book C - pp. 268 – 269 – Grid Reliability Projects In-Service Prior to 2019.
111 The Eldorado-Lugo-Mohave Series Capacitor Project is considered a Renewable Transmission Project; however, its associated capital expenditures are internally accounted for under Grid Reliability (CWBS Elements CET-ET-TP-RL).
Line
No.
ProjectNo.
Project NameOperating
DatePrior 2019 2020 2021 2022 2023 Total
1 5450 Riverside Transmission Reliability Project Dec 2023 8,951 1,992 18,997 104,396 117,847 58,554 310,738 2 7119 Walnut 230/66 kV: Bank on Circuit Breaker Project Jun 2019 10,802 1,278 - - - - 12,080 3 7546 Eldorado-Lugo-Mohave Series Capacitor Project Dec 2021 58,895 39,448 84,032 39,602 32,501 728 255,206 4 7120 Chino 230/66 kV: Bank on Circuit Breaker Project Dec 2020 37,736 1,891 3,648 2,989 - - 46,265 5 7555 Mesa 500 kV Substation Project Mar 2022 267,959 134,777 133,387 53,686 8,019 48,395 646,223 6 7727 Digital 395 Project Dec 2020 2,672 1,934 2,946 - - - 7,552 7 7884 Cerritos Channel Transmission Line Relocation Project Jul 2022 22,231 30,873 44,533 30,192 23,682 - 151,512 8 8104 Moorpark-Pardee 220 kV No. 4 Circuit Dec 2020 179 15,567 14,778 7,077 - - 37,601 9 8077 Annual Transmission Reliability Assessment Protection Upgrades Mar 2021 11 534 14,888 3,721 - - 19,155 10 Subtotal 409,437 228,294 317,210 241,662 182,049 107,678 1,486,331 11 Projects with CPUC-jurisdictional cost < $3 M 17,019 6,010 27,831 16,747 11,850 5,700 85,156 12 Projects In-Service prior to 2019 169,892 1,404 - - - - 171,296 13 Total 596,348 235,708 345,041 258,409 193,899 113,378 1,742,783
Line
No.
ProjectNo.
Project NameOperating
DatePrior 2019 2020 2021 2022 2023 Total
1 5450 Riverside Transmission Reliability Project Dec 2023 - - 809 1,952 3,871 4,728 11,360 2 7119 Walnut 230/66 kV: Bank on Circuit Breaker Project Jun 2019 6,373 754 - - - - 7,127 3 7546 Eldorado-Lugo-Mohave Series Capacitor Project Dec 2021 83 400 8,063 7,883 2,198 - 18,627 4 7120 Chino 230/66 kV: Bank on Circuit Breaker Project Dec 2020 15,242 693 1,343 2,453 - - 19,731 5 7555 Mesa 500 kV Substation Project Mar 2022 141,630 48,675 11,509 1,264 935 15,003 219,016 6 7727 Digital 395 Project Dec 2020 2,630 1,148 1,256 - - - 5,035 7 7884 Cerritos Channel Transmission Line Relocation Project Jul 2022 15,226 25,788 22,727 11,660 17,525 - 92,926 8 8104 Moorpark-Pardee 220 kV No. 4 Circuit Dec 2020 3 2,281 521 839 - - 3,643 9 8077 Annual Transmission Reliability Assessment Protection Upgrades Mar 2021 - - 3,282 - - - 3,282 10 Subtotal 181,187 79,739 49,509 26,051 24,529 19,731 380,746 11 Projects with CPUC-jurisdictional cost < $3 M 2,069 1,194 748 - - - 4,011 12 Projects In-Service prior to 2019 91,868 1,030 - - - - 92,898 13 Total 275,123 81,963 50,257 26,051 24,529 19,731 477,655

99
a) Project Description and Need for Activity 1
Grid Reliability Projects are planned on the portion of SCE’s system under 2
CAISO’s operational control.112 They are developed as part of CAISO’s Transmission Planning Process 3
(TPP)113 and are required to support reliability and compliance with NERC,114 WECC,115 and CAISO116 4
system performance standards and criteria. In addition, SCE has its own transmission planning criteria 5
comprised of internal technical design and planning practices. The costs and scope of Grid Reliability 6
Projects are largely under FERC jurisdiction, but may contain certain CPUC-jurisdictional components 7
in scope. 8
In coordination with CAISO’s TPP, SCE performs an Annual Transmission 9
Reliability Assessment (ATRA) for its portion of the CAISO-controlled grid. This assessment is 10
designed to: 11
Evaluate the performance of the SCE transmission system under peak and off-12
peak conditions for near-term and long-term planning horizons;117 13
Determine transmission constraints under stressed system conditions;118 14
Identify upgrades needed to maintain the reliability of the transmission system 15
and comply with NERC Reliability Standards, WECC Regional Business 16
112 California Independent System Operator Corporation, Fifth Replacement FERC Electric Tariff, Section 25
(available at: http://www.caiso.com/Documents/ConformedTariff-asof-Apr1-2019.pdf as of August 14, 2019).
113 Id. As described in Section 24 of the CAISO Tariff, this process identifies projects needed for reliability, projects needed to interconnect large generation, projects needed to meet policy goals, and projects driven by economics.
114 NERC TPL-001-4 (available at https://www.nerc.com/_layouts/15/PrintStandard.aspx?standardnumber=TPL-001-4&title=Transmission%20System%20Planning%20Performance%20Requirements&jurisdiction=United%20States as of August 14, 2019).
115 TPL-001-WECC-RBP-2 (available at https://www.wecc.biz/Reliability/TPL-001-WECC-RBP-2.1.pdf as of August 14, 2019).
116 California ISO Planning Standards effective September 6, 2018 (available at http://www.caiso.com/Documents/ISOPlanningStandards-September62018.pdf as of August 14, 2019).
117 For planning horizons, “near-term” refers to one- to five-years-out while “long-term” refers to six- to ten-years-out.
118 “Stressed system conditions” refers to instances involving the electric grid when there is maximum transmission line loading.
100
Practice, CAISO Planning Standards, and SCE’s transmission planning 1
criteria. 2
SCE’s ATRA is performed in parallel with the CAISO TPP under the CAISO’s 3
FERC jurisdictional tariff.119 SCE’s Grid Reliability Projects are identified in the CAISO TPP and 4
subject to review and approval by the CAISO Board of Directors and cost recovery based upon the 5
CAISO Transmission Access Charge (TAC).120 6
b) Cerritos Channel Transmission Line Relocation 7
In the 2018 GRC Decision, cost recovery for the Cerritos Channel Project was 8
disallowed due to its late operating date and concerns that it would not be used and useful in the rate 9
case period.121 The delayed completion and forecast increase are largely driven by the complexity of the 10
project and higher than anticipated bids for removal of existing underwater foundations inside the 11
channel. Another major contributor to the forecast increase is poor soil conditions resulting in the need 12
for new foundations that are larger than anticipated. 13
2. Renewable Transmission Projects 14
The two tables below, Table III-26 (Total Company) and Table III-27 (CPUC-15
jurisdictional only), list the Renewable Transmission Projects that have over $3 million in CPUC-16
jurisdictional capital expenditures and are expected to be completed and operational by the end of 2023. 17
Details regarding forecast expenditures of Renewable Transmission Projects with CPUC-jurisdictional 18
costs of less than $3 million each are provided in workpapers.122 19
119 California Independent System Operator Corporation, Fifth Replacement FERC Electric Tariff, Section 25
(available at: http://www.caiso.com/Documents/ConformedTariff-asof-Apr1-2019.pdf as of August 14, 2019).
120 Id. The CAISO TAC is a two-part rate structure utilized to recover transmission revenue requirements. For more information, see Section 26 of CAISO Tariff.
121 See D.19-05-020 pp. 63-64.
122 Refer to WP SCE-02 Vol. 04 Pt. 2, Ch. III – Book C - pp. 270 – 271 – Renewable Transmission Projects Less Than $3M CPUC-jurisdictional Costs.
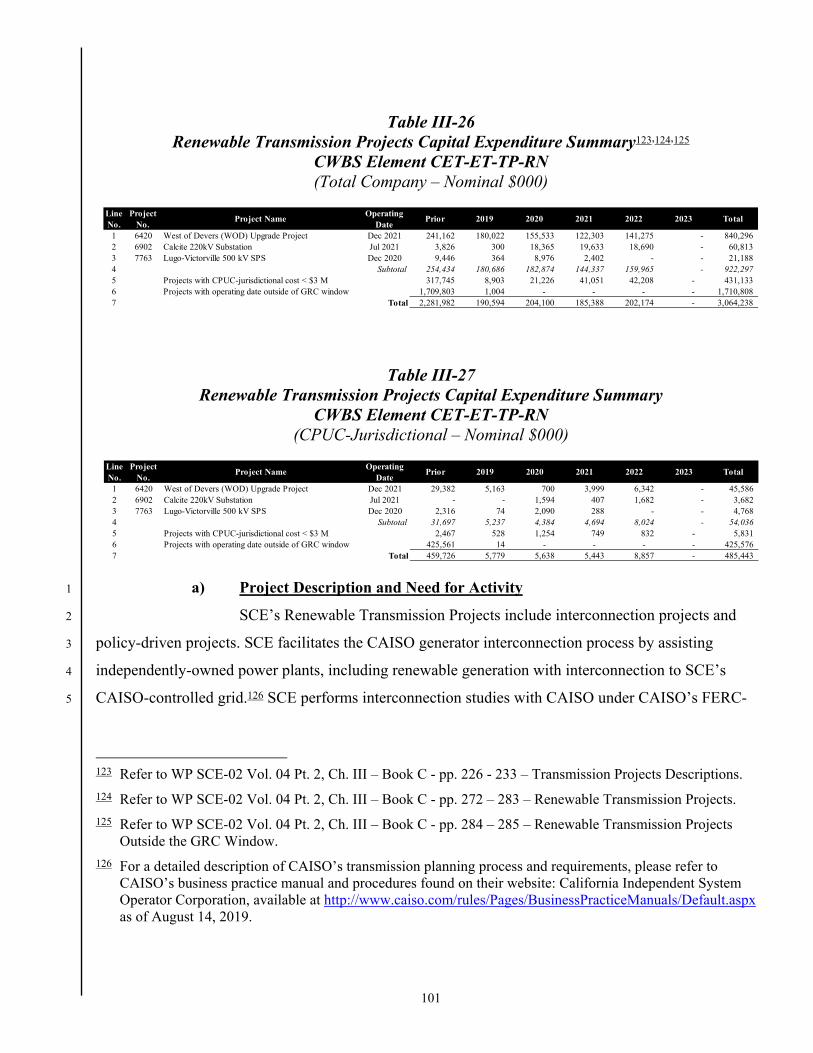
101
Table III-26 Renewable Transmission Projects Capital Expenditure Summary123,124,125
CWBS Element CET-ET-TP-RN (Total Company – Nominal $000)
Table III-27 Renewable Transmission Projects Capital Expenditure Summary
CWBS Element CET-ET-TP-RN (CPUC-Jurisdictional – Nominal $000)
a) Project Description and Need for Activity 1
SCE’s Renewable Transmission Projects include interconnection projects and 2
policy-driven projects. SCE facilitates the CAISO generator interconnection process by assisting 3
independently-owned power plants, including renewable generation with interconnection to SCE’s 4
CAISO-controlled grid.126 SCE performs interconnection studies with CAISO under CAISO’s FERC-5
123 Refer to WP SCE-02 Vol. 04 Pt. 2, Ch. III – Book C - pp. 226 - 233 – Transmission Projects Descriptions.
124 Refer to WP SCE-02 Vol. 04 Pt. 2, Ch. III – Book C - pp. 272 – 283 – Renewable Transmission Projects.
125 Refer to WP SCE-02 Vol. 04 Pt. 2, Ch. III – Book C - pp. 284 – 285 – Renewable Transmission Projects Outside the GRC Window.
126 For a detailed description of CAISO’s transmission planning process and requirements, please refer to CAISO’s business practice manual and procedures found on their website: California Independent System Operator Corporation, available at http://www.caiso.com/rules/Pages/BusinessPracticeManuals/Default.aspx as of August 14, 2019.
Line No.
ProjectNo.
Project NameOperating
DatePrior 2019 2020 2021 2022 2023 Total
1 6420 West of Devers (WOD) Upgrade Project Dec 2021 241,162 180,022 155,533 122,303 141,275 - 840,296 2 6902 Calcite 220kV Substation Jul 2021 3,826 300 18,365 19,633 18,690 - 60,813 3 7763 Lugo-Victorville 500 kV SPS Dec 2020 9,446 364 8,976 2,402 - - 21,188 4 Subtotal 254,434 180,686 182,874 144,337 159,965 - 922,297 5 Projects with CPUC-jurisdictional cost < $3 M 317,745 8,903 21,226 41,051 42,208 - 431,133 6 Projects with operating date outside of GRC window 1,709,803 1,004 - - - - 1,710,808 7 Total 2,281,982 190,594 204,100 185,388 202,174 - 3,064,238
Line No.
ProjectNo.
Project NameOperating
DatePrior 2019 2020 2021 2022 2023 Total
1 6420 West of Devers (WOD) Upgrade Project Dec 2021 29,382 5,163 700 3,999 6,342 - 45,586 2 6902 Calcite 220kV Substation Jul 2021 - - 1,594 407 1,682 - 3,682 3 7763 Lugo-Victorville 500 kV SPS Dec 2020 2,316 74 2,090 288 - - 4,768 4 Subtotal 31,697 5,237 4,384 4,694 8,024 - 54,036 5 Projects with CPUC-jurisdictional cost < $3 M 2,467 528 1,254 749 832 - 5,831 6 Projects with operating date outside of GRC window 425,561 14 - - - - 425,576 7 Total 459,726 5,779 5,638 5,443 8,857 - 485,443

102
jurisdictional tariff127 and NERC Reliability Standards, and identifies interconnection projects specific to 1
each generator enabling them to interconnect without adverse effects on system reliability. 2
Policy-driven projects are identified by CAISO through the TPP128 as those 3
enabling the grid to support state and federal directives. This includes California’s renewable portfolio 4
standard (RPS) to source 33 percent of energy sales from renewable resources by 2020 and Senate Bills 5
350129 and 100130 mandating renewable energy and greenhouse gas (GHG) reduction targets, 6
respectively, over designated periods. Achieving these objectives requires the development and 7
interconnection of renewable generating resources and the construction of new infrastructure to deliver 8
their output to customers. 9
127 California Independent System Operator Corporation, Fifth Replacement FERC Electric Tariff, Section 25
(available at: http://www.caiso.com/Documents/ConformedTariff-asof-Apr1-2019.pdf as of August 14, 2019.) See also, CAISO Generator Interconnection Procedures, Appendix Y, available at: http://www.caiso.com/Documents/AppendixY-GIPForInterconnectionRequests-asof-Nov27-2018.pdf as of August 14, 2019.
128 For more information on CAISO Policy-Driven assessments, please refer to the CAISO’s transmission planning process and latest CAISO Transmission Plan available at http://www.caiso.com/planning/Pages/TransmissionPlanning/Default.aspx http://www.caiso.com/Documents/ISO_BoardApproved-2018-2019_Transmission_Plan.pdf as of August 14, 2019.
129 Senate Bill No. 350 available at http://leginfo.legislature.ca.gov/faces/billNavClient.xhtml?bill_id=201520160SB350 as of August 14, 2019.
130 Senate Bill No. 100 available at http://leginfo.legislature.ca.gov/faces/billNavClient.xhtml?bill_id=201720180SB100 as of August 14, 2019.

103
IV. 1
ENGINEERING 2
A. Overview 3
The Engineering Business Plan Element (BPE) includes SCE’s Transmission and Distribution 4
Grid Engineering costs that are required to ensure our grid is reliable, capable of providing adequate 5
power and allows for interconnection of new generation sources to accommodate load growth and meet 6
California’s RPS requirements. The Engineering BPE also includes the investigative and engineering 7
work to address customer-reported concerns with power quality. The categorization of SCE’s O&M 8
within this Part of the System Augmentation Volume includes: 9
Engineering BPE 10
- Grid Engineering GRC Activity 11
- Load Side Support GRC Activity 12
The Grid Engineering131 GRC Activity includes identifying necessary system modifications and 13
expansions on our transmission grid to: a) help ensure compliance with the North American Electric 14
Reliability Council (NERC) and Western Electric Coordinating Council (WECC) Reliability Standards 15
& Criteria; b) participate in local, regional and state activities that involve the planning of new 16
generation, transmission lines and substations; and c) develop detailed engineering designs for system 17
upgrades, modifications, and additions to support the construction, maintenance, and operations of its 18
electrical facilities. As for the remaining portion of the Engineering BPE, if SCE learns through its 19
customers that a service issue has developed, SCE’s Load Side Support Business Plan Activity captures 20
the investigation of the concern and the solution development. 21
B. 2018 Decision 22
1. Comparison of Authorized 2018 to Recorded 23
The 2018 GRC Decision requires SCE to compare the 2018 authorized amounts to the 24
recorded amounts.132 In SCE’s 2018 GRC Application,133 SCE’s System Planning O&M expense 25
131 Whereas SCE requested funds for these activities in two distinct categories (Grid Engineering O&M and
Transmission & Interconnection Planning O&M) in its 2018 GRC, in this GRC, SCE requests these funds collectively within this Grid Engineering Business Plan Activity.
132 D.19-05-020, Ordering Paragraph 22, pp. 441-442.
133 SCE-02, Vol. 03 R, 2018 General Rate Case, Transmission & Distribution, Volume 3 R – System Planning, September 27, 2016.

104
forecasts included the work for Transmission Interconnection and Planning, Grid Engineering, and Load 1
Side Support. The Commission authorized $13.4 million in 2018 for these activities. Figure IV-27 below 2
compares amounts for O&M expenses. 3
Figure IV-27 2018 GRC Authorized Variance Summary 2018 O&M Expenses134
(Nominal $Millions)
For Grid Engineering, SCE labor expenses were lower than authorized due to several 4
factors, including (1) organizational realignment activities; (2) employee attrition without adequate 5
backfill activities; and (3) a shift in Root Cause engineering work being charged to overhead activities, 6
rather than direct charging to this GRC activity. Non-labor expenses decreased in 2018 as work related 7
to Distribution Apparatus, Engineering Support, Protection, and Transmission contract services on 8
several projects was deferred to later years. 9
While the amount of Load Side Support work remained relatively unchanged from prior 10
years, an accounting discrepancy reduced recorded Labor expenses charged to the 2018 Load Side 11
Support activity. This is described in more detail in Section IV.C.2. 12
134 Refer to WP SCE-07 Vol. 01 – O&M Authorized to Recorded.

105
C. O&M Forecast - Engineering 1
1. Grid Engineering 2
a) Work Description and Need 3
SCE’s engineers and transmission planners perform activities that support the 4
modification and operation of the power system. From long-term planning activities to near-term design 5
and engineering activities, this work supports all voltages of SCE’s transmission and distribution 6
systems and the various stages of grid engineering. 7
SCE’s transmission system is under operational control of the CAISO, and SCE’s 8
distribution grid is under the operational control of SCE. The details of each planning and engineering 9
process are captured in other chapters of this volume. Chapter III - Transmission Projects describes the 10
work related to the CAISO-controlled portions of SCE’s grid and Section II.C of the Load Growth 11
chapter highlights the planning process for the system under SCE’s operational control (distribution and 12
subtransmission systems). 13
SCE’s transmission system performance and configuration are routinely evaluated 14
against mandatory NERC Reliability Standards,135 WECC Reliability Standards/Criteria,136 and the 15
CAISO Planning Criteria.137 Necessary modifications and system expansions must be identified and 16
planned to help ensure compliance with these standards and criteria. System modifications include 17
adding new substations, expanding existing facilities, upgrading equipment, installing voltage support 18
equipment, adding new transmission lines, adding capacity to existing lines, and reconfiguring the 19
system. 20
As part of evaluating the future reliability of the SCE transmission system, SCE 21
participates in root cause evaluations of major disturbances on the Western Interconnection138 and in 22
developing recommendations to prevent similar system disturbances. 23
135 NERC Reliability Standards available at:
https://www.nerc.com/pa/stand/Pages/ReliabilityStandardsUnitedStates.aspx?jurisdiction=United%20States as of August 14 2019.
136 WECC Reliability Standards/Criteria available at: https://www.wecc.org/Standards/Pages/Default.aspx, as of August 14 2019.
137 CAISO Planning Criteria available at: http://www.caiso.com/Documents/ISOPlanningStandards-September62018.pdf, as of August 14 2019.
138 The U.S. Department of Energy describes the Western Interconnection as “[stretching] from Western Canada South to Baja California in Mexico, reaching eastward over the Rockies to the Great Plains.” Available at:
(Continued)

106
SCE transmission planners participate in developing CAISO, WECC, and NERC 1
Reliability Standards/Criteria. They also participate in local, regional and state activities that involve the 2
planning of new generation, transmission lines and substations. The studies and planning processes 3
managed by this group require an advanced understanding of bulk power flow, engineering standards, 4
and quantitative modeling. This work is conducted by engineers who have expertise in SCE’s 5
transmission system and experience in electric system planning and regulatory policy. SCE also uses 6
contract personnel to perform work associated with specialized projects. These activities are O&M 7
expenses that are necessary to support transmission system reliability and safety. 8
In addition to work that supports planning activities, Grid Engineering includes 9
the engineering activities to support the construction, maintenance, and operations of its electrical 10
facilities across all voltages. This includes developing detailed engineering designs for system upgrades, 11
modifications, and additions to the transmission system, subtransmission system, and distribution 12
system. These activities include: 13
1. Studying the root cause of equipment failures in the field to identify necessary 14
corrective actions; 15
2. Performing engineering studies necessary to support requests for 16
interconnection or non-standard service requests. Engineering interconnection 17
studies involve evaluating the impact of the interconnection on our 18
equipment/facilities. The studies are necessary to determine if existing 19
equipment/facilities are adequate or if SCE must add/upgrade 20
equipment/facilities to accommodate the interconnection; 21
3. Assisting and guiding field personnel in properly installing, operating and 22
maintaining substation and distribution equipment and assets; 23
4. Performing evaluations on poles/towers on our system so that structures are 24
properly designed to withstand impacts from high wind-ice combinations and 25
unbalanced longitudinal wire loads; 26
Continued from the previous page https://www.energy.gov/oe/services/electricity-policy-coordination-and-implementation/transmission-planning/recovery-act-0.

107
5. Performing equipment verification and various engineering studies; 1
6. Evaluating and/or testing equipment developed by vendors for potential 2
widespread use on the SCE system; 3
7. Performing analyses on equipment or devices that may provide safety and/or 4
reliability benefits (e.g. using fuses versus reclosing devices on the 5
distribution network); 6
8. Assessing and designing protective relays, system controls, and automation 7
schemes for SCE’s grid; 8
9. Evaluating and selecting components, software, and systems to enable remote 9
monitoring and operations of transmission and distribution facilities. 10
b) Scope and Forecast Analysis 11
The recorded and forecast O&M expenses for Grid Engineering are shown below 12
in Figure IV-28. 13

108
Figure IV-28 Grid Engineering139
Recorded 2014-2018/Forecast 2019-2021 (Constant 2018 $000)
(1) Historical Variance Analysis 1
(a) Labor 2
Labor expenses include the costs for SCE personnel to perform or 3
support the activities described above. As shown in Figure IV-28, labor costs have decreased year-over-4
year from 2014-2018. These decreases resulted from several factors, including (1) organizational 5
realignment activities; (2) employee attrition without adequate backfill activities; and (3) a shift in Root 6
Cause engineering work being charged to overhead activities, rather than direct charging to this GRC 7
activity. While labor resources were reduced, aggregate workload remained stable or increased. 8
Recognizing this paradigm is not sustainable, especially as forecast workload in this area is anticipated 9
to increase significantly, SCE must right-size labor resources that perform the engineering and planning 10
functions housed in this GRC activity. 11
139 Refer to WP SCE-02 Vol. 04 Pt. 2, Ch. IV – Book C - pp. 286 - 292 – O&M Detail for Grid Engineering.
2014 2015 2016 2017 2018 2019 2020 2021Labor $8,748 $8,379 $7,529 $6,675 $6,600 $6,880 $6,880 $6,880
Non-Labor $6,630 $3,980 $6,013 $4,858 $4,412 $4,600 $4,600 $4,600Other
Total Expenses $15,378 $12,359 $13,542 $11,533 $11,012 $11,480 $11,480 $11,480
Ratio of Labor to Total 57% 68% 56% 58% 60% 60% 60% 60%
Recorded Forecast
$2,000
$4,000
$6,000
$8,000
$10,000
$12,000
$14,000
$16,000
$18,000
2014 2015 2016 2017 2018 2019 2020 2021
Labor Non-Labor Other
109
(b) Non-Labor 1
Non-labor expenses include costs for contract engineering work 2
required to supplement work performed by SCE personnel. In addition, non-labor expenses include 3
allocated overheads. A significant portion of non-labor costs incurred in 2014 resulted from SCE’s 4
Transmission Line Rating Study. Non-labor expense was reduced by approximately $2.5 million in 2015 5
due to the completion of the study. 6
Starting in 2016 and ending in 2018, SCE needed to contract 7
supplemental work to improve the data quality of the subtransmission network modeling data used in 8
interconnection studies and system planning studies. Non-labor expenses for this work were $0.4 million 9
in 2016, $0.6 million in 2017, and $0.3 million in 2018. 10
Also in 2016, SCE experienced an increase in engineering work 11
that was performed by external engineering contract resources for Transmission, Substation, 12
Distribution Apparatus, and Protection projects. SCE performed this work using external contract 13
resources due to the need to complete this work on an abbreviated basis, and as SCE resources were 14
fully utilized for other projects and the aforementioned reduction in forces. 15
Non-labor expenses decreased in 2018 as work related to 16
Distribution Apparatus, Engineering Support, Protection, and Transmission contract services on several 17
projects was deferred work to later years. This deferred work amounted to approximately $0.6 18
million.140 19
(2) Forecast 20
(a) Labor 21
SCE forecasts 2021 Test Year labor expense by using 2018 22
recorded expense as a base. This is consistent with Commission guidance which states if recorded 23
expenses have shown a trend in a certain direction over three or more years, the last recorded year is an 24
appropriate base estimate.141 To this base, SCE adds incremental expense to cover the costs of necessary 25
activities required to be performed in the Test Year. These activities include annual planning 26
assessments, operational studies, long term assessments supporting State initiatives, other non-27
140 Refer to WP SCE-02 Vol. 04 Pt. 2, Ch. IV – Book C - pp. 293 - 295 – Incremental Grid Engineering Forecast
Details.
141 In D.89-12-057, and subsequently in D.04.07-022, the CPUC stated that if recorded expenses have shown a trend in a certain direction over three or more years, the last recorded year is an appropriate base estimate.
110
capitalized work including property reviews and support for regulatory activities at the CPUC and 1
FERC, and increased resources devoted to root cause investigations, including for wildfire event 2
equipment investigations.142 3
As California implements the tenets of Senate Bill 100 and Senate 4
Bill 350, which require a shift to a carbon-neutral resource portfolio, SCE expects that the volume 5
and/or complexity of generation interconnection requests, gas plant retirements, and studies to identify 6
upgrades to expand grid infrastructure will increase each year. SCE’s requested O&M forecast reflects a 7
reasonable increase in resources commensurate with this growth to accommodate the complexities in 8
planning for and engineering the electric system to enable the achievement of California’s policy 9
objectives. 10
(b) Non-Labor 11
Similar to labor costs discussed above, non-labor costs have 12
decreased over the three-year period from 2016-2018. Accordingly, SCE forecasts 2021 Test Year non-13
labor expense by using 2018 recorded expense as a base. This is consistent with Commission guidance 14
which states if recorded expenses have shown a trend in a certain direction over three or more years, the 15
last recorded year is an appropriate base estimate.143 To this base, SCE adds incremental expense of $0.2 16
million to cover the costs of necessary activities required to be performed in the Test Year. These 17
incremental costs generally support the activities discussed in section 1.b)(2)(a) above, and more 18
specifically support additional engineering assessments and studies on various wildfire-related activities, 19
Transmission-level projects, and Protection and Distribution Apparatus projects.144 20
2. Load Side Support 21
a) Work Description and Need 22
Load Side Support is an SCE program that addresses issues that can arise as a 23
result of the generation, transmission and delivery of power to our customers. This program provides 24
investigative services that extend beyond the revenue meter and include wiring and grounding 25
142 Refer to WP SCE-02 Vol. 04 Pt. 2, Ch. IV – Book C - pp. 293 - 295 - Incremental Grid Engineering Forecast
Details.
143 In D.89-12-057, and subsequently in D.04.07-022, the CPUC stated that if recorded expenses have shown a trend in a certain direction over three or more years, the last recorded year is an appropriate base estimate.
144 Refer to WP SCE-02 Vol. 04 Pt. 2, Ch. IV – Book C - pp. 293 – 295 Incremental Grid Engineering Forecast Details.

111
inspections, power quality monitoring, and radio frequency interference measurements. SCE’s Power 1
Quality department personnel identify the cause of power quality and interference problems and may 2
recommend solutions to customers and/or system owners. 3
The proliferation of microprocessor controllers within DERs, EVs, protective 4
relays, appliances and manufacturing equipment has increased the level of sensitivity customers have to 5
momentary power system disturbances.145 Power system faults, capacitor switching, and starting of large 6
loads are common sources of disturbances that are addressed by this program. Electronic-based 7
generation and motor control systems have also led to an increase in distortion of the 60-Hertz 8
sinusoidal voltage supplied by the power system.146 This steady-state phenomenon is referred to as 9
harmonic distortion and results in overheating of motors and transformers, mis-operation of 10
microprocessor controllers, and nuisance tripping of loads such as EV chargers and uninterruptible 11
power supplies. 12
Electromagnetic interference can disrupt the reception and transmission of 13
devices that include radios, wireless networks, audio equipment, computers, and televisions. 14
Affected systems include emergency communication operations (911, police, fire), control systems, 15
utility SCADA systems, and amateur radio. Tracking across soiled or damaged insulators and loose line 16
hardware are sources of interference from the transmission and distribution system. Customer wiring 17
systems and equipment may also generate interference due to devices such as failing doorbell 18
transformers and lighting ballasts. 19
Power Quality Advisors ensure the quality of power delivered to SCE’s customers 20
remains within industry recommended limits.147,148 Corrective actions may include changes to the 21
customer systems, SCE systems, or both. Recommendations provided to customers to reduce sensitivity 22
to disturbances often include low-cost mitigation equipment and settings changes. Customers operating 23
loads that interfere with the service provided to other customers may be required to install filters or 24
equipment designed to minimize starting currents. 25
145 IEEE 1250-2018, IEEE Guide for Identifying and Improving Voltage Quality in Power Systems.
146 IEEE 519-2014, IEEE Recommended Practice and Requirements for Harmonic Control in Electric Power Systems.
147 ANSI C84.1-2016, Electric Power Systems and Equipment — Voltage Ratings (60 Hertz).
148 IEEE 1453-2015, IEEE Recommended Practice for the Analysis of Fluctuating Installations on Power Systems.

112
Power Quality Advisors also investigate causes of stray voltage reported by 1
customers or other utilities. Stray voltage results from the normal delivery or use of electricity that may 2
be present between two conductive surfaces that can be simultaneously contacted by members of the 3
general public or animals.149 Stray voltage is not related to electrical faults, but it can be result of electric 4
or magnetic fields near transmission lines or from normal return current. These investigations may 5
include testing of underground cabling and inspection of grounding systems owned by customers. 6
SCE employs contract linemen to respond to customer complaints of radio 7
interference, television interference, or similar issues. They perform investigations that reveal the nature 8
of the interference and its cause. These employees recommend solutions to customers and, when needed, 9
work with other SCE field personnel to perform corrective actions to comply with FCC regulations. 10
Corrective actions on the SCE system may include washing or replacing insulators and tightening line 11
hardware. 12
Independent consulting services may be utilized in the resolution of complex 13
issues involving DERs, DC fast charging, or other emerging technologies. The rapid deployment of 14
inverter-based generation and high demand charging in SCE’s territory requires advanced circuit 15
modeling to analyze the effects of bi-directional current flow in distribution systems. 16
149 IEEE 1695-2016, IEEE Guide to Understanding, Diagnosing, and Mitigating Stray and Contact Voltage.

113
b) Scope and Forecast Analysis 1
The recorded and forecast O&M expenses for Load Side Support are shown 2
below in Figure IV-29. 3
Figure IV-29 Load Side Support150
Recorded 2014-2018/Forecast 2019-2021 (Constant 2018 $000)
(1) Historical Variance Analysis 4
(a) Labor 5
While the amount of work remained relatively unchanged from 6
prior years, an accounting discrepancy reduced recorded Labor expenses charged to the 2018 Load Side 7
Support activity from the actual $799,000.151 SCE analyzed timesheet entries to calculate the additional 8
Labor that should have recorded to Load Side Support over the $224,000 that correctly recorded to Load 9
150 Refer to WP SCE-02 Vol. 04 Pt. 2, Ch. IV – Book C – pp. 296 – 302 – O&M Detail for Load Side Support.
151 Refer to WP SCE-02 Vol. 04 Pt. 2, Ch. IV – Book C – pp. 303 – 304 – Load Side Support Corrected Forecast Details.
2014 2015 2016 2017 2018 2019 2020 2021Labor $855 $936 $968 $934 $224 $900 $900 $900
Non-Labor $147 $121 $186 $170 $159 $377 $377 $377Other
Total Expenses $1,001 $1,057 $1,154 $1,103 $383 $1,277 $1,277 $1,277
Ratio of Labor to Total 85% 89% 84% 85% 58% 71% 70% 71%
Recorded Forecast
$200
$400
$600
$800
$1,000
$1,200
$1,400
2014 2015 2016 2017 2018 2019 2020 2021
Labor Non-Labor Other
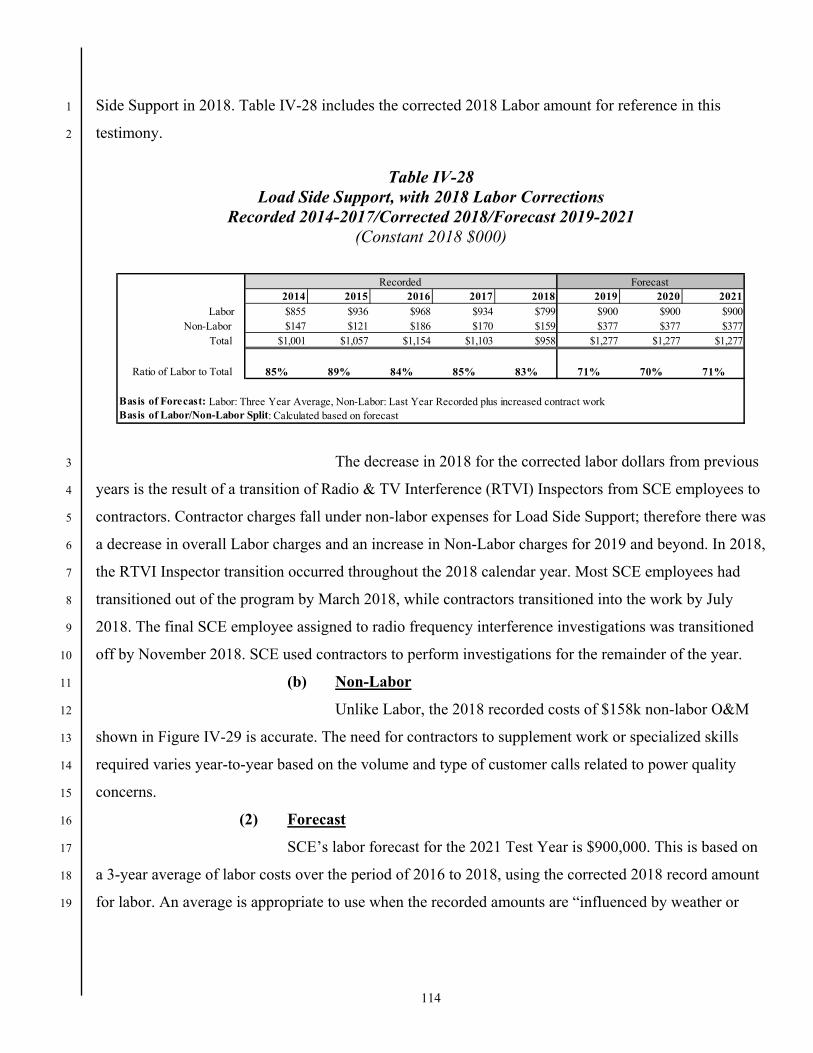
114
Side Support in 2018. Table IV-28 includes the corrected 2018 Labor amount for reference in this 1
testimony. 2
Table IV-28 Load Side Support, with 2018 Labor Corrections
Recorded 2014-2017/Corrected 2018/Forecast 2019-2021 (Constant 2018 $000)
The decrease in 2018 for the corrected labor dollars from previous 3
years is the result of a transition of Radio & TV Interference (RTVI) Inspectors from SCE employees to 4
contractors. Contractor charges fall under non-labor expenses for Load Side Support; therefore there was 5
a decrease in overall Labor charges and an increase in Non-Labor charges for 2019 and beyond. In 2018, 6
the RTVI Inspector transition occurred throughout the 2018 calendar year. Most SCE employees had 7
transitioned out of the program by March 2018, while contractors transitioned into the work by July 8
2018. The final SCE employee assigned to radio frequency interference investigations was transitioned 9
off by November 2018. SCE used contractors to perform investigations for the remainder of the year. 10
(b) Non-Labor 11
Unlike Labor, the 2018 recorded costs of $158k non-labor O&M 12
shown in Figure IV-29 is accurate. The need for contractors to supplement work or specialized skills 13
required varies year-to-year based on the volume and type of customer calls related to power quality 14
concerns. 15
(2) Forecast 16
SCE’s labor forecast for the 2021 Test Year is $900,000. This is based on 17
a 3-year average of labor costs over the period of 2016 to 2018, using the corrected 2018 record amount 18
for labor. An average is appropriate to use when the recorded amounts are “influenced by weather or 19
2014 2015 2016 2017 2018 2019 2020 2021Labor $855 $936 $968 $934 $799 $900 $900 $900
Non-Labor $147 $121 $186 $170 $159 $377 $377 $377 Total $1,001 $1,057 $1,154 $1,103 $958 $1,277 $1,277 $1,277
Ratio of Labor to Total 85% 89% 84% 85% 83% 71% 70% 71%
Basis of Forecast: Labor: Three Year Average, Non-Labor: Last Year Recorded plus increased contract work Basis of Labor/Non-Labor Split: Calculated based on forecast
Recorded Forecast
115
other external forces beyond the control of the utility.”152 Power Quality concerns are driven by third-1
party activities and can vary year over year. With respect to the observable downward labor trend in the 2
last three years and the labor variances previously described for 2018, SCE contends that Load Side 3
Support is best approximated using a three-year average of recorded costs. SCE expects to experience a 4
similar average workload in the Test Year. 5
The non-labor forecast for this activity is based on 2018 recorded 6
amounts, plus additional costs to support specialized investigations and contract work to address 7
customer needs.153 The use of the last recorded year as the basis for the Test Year request is also 8
consistent with the Commission’s guidance on forecasting methodologies. As mentioned earlier, non-9
labor work is expected to increase due to specialized investigation work performed by a third party firm 10
and contract employees for specialized engineering based on customer needs. This level of funding will 11
enable SCE to adequately respond to and resolve customer issues. 12
The forecast for this incremental external support is based on the 13
increasing complexity of interference and power quality issues that must be addressed by the Power 14
Quality department. Investigations are primarily in response to customer or system issues, therefore the 15
need for these external expert services can vary from year to year. 16
152 D.89-12-057.
153 Refer to WP SCE-02 Vol. 04 Pt. 2, Ch. IV – Book C - pp. 303 - 304 – Load Side Support Corrected Forecast Details.

Appendix A
Project Alternatives
A-1
APPENDIX A
PROJECT ALTERNATIVES
Table 1 and Table 2 include information about the alternative projects that SCE considered for the
Substation Expansion projects described in Section II.D.1.c). Table 3 and Table 4 represent alternative
projects discussed in the Subtransmission Lines Plan (Section II.D.3.a)) and A-Bank Plan (Section
II.D.3.b)).

A-2
Tab
le 1
S
ubs
tati
on E
xpan
sion
Pro
ject
Alt
ern
ativ
e D
etai
ls 1
- 8
(T
otal
Com
pany
Nom
inal
$00
0)
Lin
e N
o.S
ubst
atio
nP
roje
ctN
o.P
roje
ct S
cope
Tot
alC
ost
Alt
erna
tive
Pro
ject
Sco
peA
lter
nati
ve C
ost
Rea
son
Not
Sel
ecte
d
1S
ulliv
an66
/12
7796
Inst
all 1
-28
MV
A tr
ansf
orm
er$3
,421
Bro
okhu
rst 6
6/12
Inst
all 1
-28
MV
A tr
ansf
orm
erU
pgra
de 1
2 kV
sw
itchr
ack
Inst
all 1
new
12
kV c
ircui
t
$5,7
37N
ot th
e co
st e
ffect
ive
optio
n
2S
awte
lle66
/16
8079
Rem
ove
2-11
.2 M
VA
tran
sfor
mer
sIn
stal
l 2-2
8 M
VA
tran
sfor
mer
sIn
stal
l 1-1
6 kV
circ
uit
$4,4
42
Pur
ple
66/1
6 kV
Sub
stat
ion
Con
stru
ct n
ew 6
6/16
kV
cus
tom
er s
ubst
atio
nIn
stal
l 2-1
4 M
VA
tran
sfor
mer
sIn
stal
l 1-1
6 kV
circ
uit
Cus
tom
er o
wne
d an
d fu
nded
Cus
tom
er c
hose
to n
ot c
ontin
ue w
ith th
e cu
stom
er s
ubst
atio
nS
pace
lim
ited,
no
room
for
new
sub
stat
ion
3F
alco
n R
idge
66/1
253
97C
onst
ruct
new
66/
12 s
ubst
atio
nIn
stal
l 2-2
8 M
VA
tran
sfor
mer
sIn
stal
l 4-1
2 kV
circ
uits
$72,
078
Con
stru
ct n
ew 1
15/1
2 S
ubst
atio
nIn
stal
l 2-2
8 M
VA
tran
sfor
mer
sIn
stal
l 4-1
2 kV
circ
uits
$112
,522
Not
the
cost
effe
ctiv
e so
lutio
nR
equi
res
long
er s
ubtr
ansm
issi
on li
nes
to s
erve
ne
w s
ubst
atio
n
4G
oshe
n66
/12
7736
Rem
ove
2-14
MV
A tr
ansf
orm
ers
Rem
ove
1-15
.5 M
VA
tran
sfor
mer
Inst
all 2
-28
MV
A tr
ansf
orm
ers
Inst
all 1
-12
kV c
ircui
t
$6,8
82In
stal
l 2-1
2 kV
circ
uits
, 10
mile
s lo
ng e
ach
$11,
200
Not
the
cost
effe
ctiv
e so
lutio
nT
imel
ine
does
not
mee
t are
a ne
ed
5R
osam
ond
66/1
280
07
Rem
ove
1-10
MV
A tr
ansf
orm
erIn
stal
l 1-1
4 M
VA
tran
sfor
mer
Reb
uild
12
kV s
witc
hrac
kIn
stal
l 1-1
2 kV
circ
uit
$4,4
40
Gre
at L
akes
66/
12 k
V S
ubst
atio
nR
ebui
ld G
reat
Lak
es 6
6/12
kV
sub
stat
ion
Inst
all 1
-28
MV
A tr
ansf
orm
erIn
stal
l 1 n
ew 1
2 kV
circ
uit
$14,
865
Not
the
cost
effe
ctiv
e op
tion
6G
arne
t11
5/33
8125
Inst
all 1
-56
MV
A tr
ansf
orm
erIn
stal
l 2-3
3kV
circ
uits
$4,1
73
Blu
e D
ream
Sub
stat
ion
Con
stru
ct n
ew 1
15/3
3 kV
sub
stat
ion
Inst
all 4
-56
MV
A tr
ansf
orm
ers
Inst
all 4
new
33
kV c
ircui
ts
$99,
469
Not
the
cost
effe
ctiv
e so
lutio
nT
imel
ine
does
not
mee
t are
a ne
edD
oes
not a
ddre
ss a
ging
infr
astr
uctu
re a
t Gar
net
Sub
stat
ion
7S
afar
i33
/12
7516
Con
stru
ct n
ew 3
3/12
sub
stat
ion
Inst
all 2
-28
MV
A tr
ansf
orm
ers
Inst
all 3
-12
kV c
ircui
tsC
onst
ruct
new
66/
33 s
ubst
atio
nIn
stal
l 2-5
6 M
VA
tran
sfor
mer
sIn
stal
l 2-3
3 kV
circ
uits
$45,
470
Con
stru
ct n
ew 6
6/12
kV
sub
stat
ion
Inst
all 2
-28
MV
A tr
ansf
orm
ers
Inst
all 4
-12
kV c
ircui
tsIn
stal
l 2-1
2 kV
circ
uits
at n
eigh
borin
g su
bsta
tions
to s
erve
load
whi
le
licen
sing
act
iviti
es c
oncl
ude
$69,
301
Not
the
cost
effe
ctiv
e so
lutio
nT
imel
ine
does
not
mee
t are
a ne
ed
8D
ever
s11
5/33
8126
Inst
all 2
-56
MV
A tr
ansf
orm
erIn
stal
l 33
kV s
witc
hrac
kIn
stal
l 2-3
3 kV
circ
uits
$12,
162
Blu
e D
ream
Sub
stat
ion
Con
stru
ct n
ew 1
15/3
3 kV
sub
stat
ion
Inst
all 4
-56
MV
A tr
ansf
orm
ers
Inst
all 4
new
33
kV c
ircui
ts
$99,
469
Not
the
cost
effe
ctiv
e so
lutio
nT
imel
ine
does
not
mee
t are
a ne
edD
oes
not a
ddre
ss a
ging
infr
astr
uctu
re a
t Gar
net
Sub
stat
ion
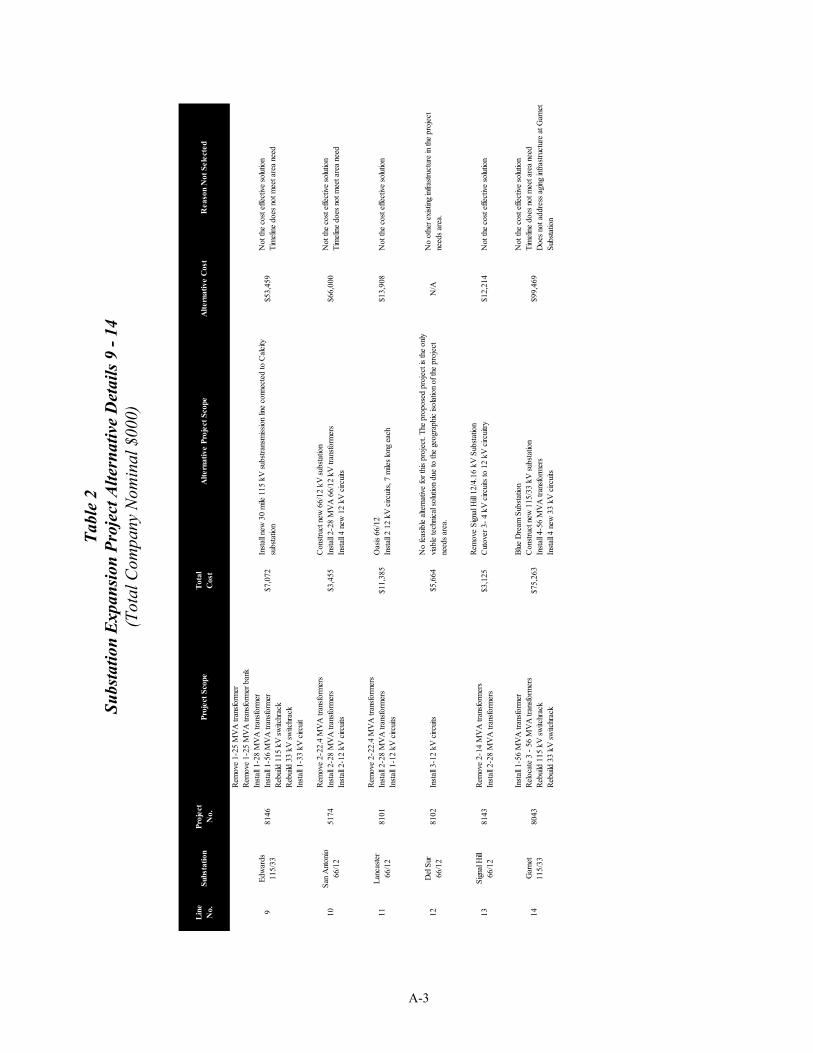
A-3
Tab
le 2
S
ubs
tati
on E
xpan
sion
Pro
ject
Alt
ern
ativ
e D
etai
ls 9
- 1
4 (T
otal
Com
pany
Nom
inal
$00
0)
Lin
e N
o.S
ubst
atio
nP
roje
ctN
o.P
roje
ct S
cope
Tot
alC
ost
Alt
erna
tive
Pro
ject
Sco
peA
lter
nati
ve C
ost
Rea
son
Not
Sel
ecte
d
9E
dwar
ds11
5/33
8146
Rem
ove
1-25
MV
A tr
ansf
orm
erR
emov
e 1-
25 M
VA
tran
sfor
mer
ban
kIn
stal
l 1-2
8 M
VA
tran
sfor
mer
Inst
all 1
-56
MV
A tr
ansf
orm
erR
ebui
ld 1
15 k
V s
witc
hrac
kR
ebui
ld 3
3 kV
sw
itchr
ack
Inst
all 1
-33
kV c
ircui
t
$7,0
72In
stal
l new
30
mile
115
kV
sub
stra
nsm
issi
on li
ne c
onne
cted
to C
alci
ty
subs
tatio
n$5
3,45
9N
ot th
e co
st e
ffect
ive
solu
tion
Tim
elin
e do
es n
ot m
eet a
rea
need
10S
an A
nton
io66
/12
5174
Rem
ove
2-22
.4 M
VA
tran
sfor
mer
sIn
stal
l 2-2
8 M
VA
tran
sfor
mer
sIn
stal
l 2-1
2 kV
circ
uits
$3,4
55C
onst
ruct
new
66/
12 k
V s
ubst
atio
nIn
stal
l 2-2
8 M
VA
66/
12 k
V tr
ansf
orm
ers
Inst
all 4
new
12
kV c
ircui
ts$6
6,00
0N
ot th
e co
st e
ffect
ive
solu
tion
Tim
elin
e do
es n
ot m
eet a
rea
need
11L
anca
ster
66/1
281
01R
emov
e 2-
22.4
MV
A tr
ansf
orm
ers
Inst
all 2
-28
MV
A tr
ansf
orm
ers
Inst
all 1
-12
kV c
ircui
ts$1
1,38
5O
asis
66/
12In
stal
l 2 1
2 kV
circ
uits
, 7 m
iles
long
eac
h$1
3,90
8N
ot th
e co
st e
ffect
ive
solu
tion
12D
el S
ur66
/12
8102
Inst
all 3
-12
kV c
ircui
ts$5
,664
No
feas
ible
alte
rnat
ive
for
this
pro
ject
. The
pro
pose
d pr
ojec
t is
the
only
vi
able
tech
nica
l sol
utio
n du
e to
the
geog
raph
ic is
olat
ion
of th
e pr
ojec
t ne
eds
area
.N
/AN
o ot
her
exis
ting
infr
astr
uctu
re in
the
proj
ect
need
s ar
ea.
13S
igna
l Hill
66/1
281
43R
emov
e 2-
14 M
VA
tran
sfor
mer
sIn
stal
l 2-2
8 M
VA
tran
sfor
mer
s$3
,125
Rem
ove
Sig
nal H
ill 1
2/4.
16 k
V S
ubst
atio
nC
utov
er 3
- 4
kV c
ircui
ts to
12
kV c
ircui
try
$12,
214
Not
the
cost
effe
ctiv
e so
lutio
n
14G
arne
t11
5/33
8043
Inst
all 1
-56
MV
A tr
ansf
orm
erR
eloc
ate
3 -
56 M
VA
tran
sfor
mer
sR
ebui
ld 1
15 k
V s
witc
hrac
kR
ebui
ld 3
3 kV
sw
itchr
ack
$75,
263
Blu
e D
ream
Sub
stat
ion
Con
stru
ct n
ew 1
15/3
3 kV
sub
stat
ion
Inst
all 4
-56
MV
A tr
ansf
orm
ers
Inst
all 4
new
33
kV c
ircui
ts
$99,
469
Not
the
cost
effe
ctiv
e so
lutio
nT
imel
ine
does
not
mee
t are
a ne
edD
oes
not a
ddre
ss a
ging
infr
astr
uctu
re a
t Gar
net
Sub
stat
ion

A-4
Tab
le 3
A
-Ban
k an
d S
ubt
ran
smis
sion
Lin
es P
lan
Pro
ject
Alt
ern
ativ
e D
etai
ls 1
- 9
(Tot
al C
ompa
ny N
omin
al $
000)
Lin
e N
o.P
roje
ct T
ype
Pro
ject
ID
N
umbe
rP
roje
ct N
ame
Pro
ject
Sco
peP
ropo
sed
Pro
ject
Cos
tA
lter
nati
ve P
roje
ct S
cope
Alt
erna
tive
Cos
tR
easo
n N
ot S
elec
ted
1N
ew L
ine
6030
Val
ley-
Ivyg
len
115
kVC
onst
ruct
a n
ew V
alle
y-Iv
ygle
n 11
5 kV
Sub
tran
smis
sion
L
ine
Pro
ject
with
25.
9 m
iles
of 9
54 S
AC
and
300
feet
of
1750
Al.
$112
,634
,047
GR
C A
LT
ER
NA
TIV
E -
Tra
nsfe
r Iv
ygle
n S
ub to
Mira
Lom
a 66
kV
Sys
tem
$108
,757
,240
Alte
rnat
ive
cost
gre
ater
than
pro
pose
d pr
ojec
t co
st. P
ropo
sed
proj
ect i
s te
chni
cally
sup
erio
r to
alte
rnat
ive.
2N
ew L
ine
6871
Rec
tor-
Riv
erw
ay N
o. 2
66
kVC
onst
uct a
new
66
kV s
ubtr
ansm
issi
on li
ne 8
.5 m
iles
of
954
SA
C a
nd 1
mile
of 3
000
kcm
il A
l.$2
5,69
8,96
6R
ebui
ld e
xist
ing
rect
or r
iver
way
, reb
uild
7.4
mile
s of
653
acs
r to
954
sac
, and
re
build
0.2
32 m
iles
of 2
000
cu to
300
cu
and
Bui
ld a
new
~14
mile
s 95
4 S
CA
R R
ecto
r-O
akgr
ove
66 li
ne$3
9.6
mill
ion
Mor
e ex
pens
ive
and
addi
tiona
l wor
k w
ould
be
requ
ired
to e
xpan
d O
akgr
ove
subs
tatio
n
3R
ecab
le75
05L
a C
iene
ga-B
ever
ly-C
ulve
r 66
kV
Rec
able
6.1
mile
s of
175
0 A
L to
300
0 C
U o
n fo
ur li
ne
segm
ents
$11,
649,
786
Inst
all n
ew c
able
s, a
nd c
ondu
ctor
s to
bui
ld a
2nd
La
Cie
nega
-Bev
erly
66k
V li
ne
alon
g th
e ex
istin
g ro
ute
in e
xist
ing
duct
s an
d st
ruct
ures
. 5 m
iles
of U
G 2
000
cu in
ex
istin
g du
cts
and
stru
ctur
es. a
nd 5
mile
s of
954
OH
on
exis
ting
pole
s$1
2.2
mill
ion
Cos
t was
hig
her
than
the
prop
osed
pro
ject
4R
econ
duct
or66
52S
augu
s-E
lizab
eth
Lak
e-M
WD
Foo
thill
66
kV
Sub
tran
smis
sion
Lin
e R
econ
duct
or 4
800
ft (0
.9 m
i) of
4/0
CU
and
686
5 ft
(1.3
m
i) of
336
AC
SR
to
954
SA
C in
the
Sau
gus
leg
$3,0
87,8
87C
onst
ruct
app
roxi
mat
ely
4 m
iles
of n
ew S
augu
s -
Pitc
hgen
66
kV li
ne w
ith 9
54
SA
C$1
0,73
9,54
0C
ost w
as h
ighe
r th
an th
e pr
opos
ed p
roje
ct
5N
ew L
ine
8003
El N
ido-
Fel
ton-
La
Cie
nega
66
kV S
ubtr
ansm
issi
on L
ine
Con
stru
ct 0
.5 m
ile o
f 300
0 C
u an
d 0.
1 m
ile o
f 954
SA
C
into
Fel
ton
Sub
stat
ion
$4,9
05,3
31C
onst
ruct
5 m
ile c
ircui
t with
954
SA
C fo
r a
new
El N
ido-
Len
nox
66 k
V L
ine
$13,
032,
364
Cos
t was
hig
her
than
the
prop
osed
pro
ject
6R
econ
duct
or82
52S
augu
s-C
olos
sus-
Loc
khee
d-P
itchg
en 6
6 kV
S
ubtr
ansm
issi
on L
ine
Reb
uild
1.8
2 m
iles
of 4
/0 C
U w
ith 9
54 S
AC
in th
e P
itchg
en le
g$4
,288
,805
Con
stru
ct a
ppro
xim
atel
y 4
mile
s of
new
Sau
gus
- P
itchg
en 6
6 kV
line
with
954
S
AC
$10,
739,
540
Cos
t was
hig
her
than
the
prop
osed
pro
ject
7R
econ
duct
or81
51Ir
vine
66/
12 k
V S
ubst
atio
nU
pgra
de S
witc
hrac
k, M
EE
R a
nd R
epla
ce 6
6 kV
CB
P
os. N
o. 6
(C
B#
14)
from
120
0 A
to 2
000
A
$6,7
13,0
30E
xten
d S
antia
go-E
stre
lla N
o. 1
66
kV S
ubtr
ansm
issi
on L
ine
to L
as L
omas
S
ubst
atio
n$7
,398
,738
Cos
t of a
ltern
ativ
e pr
ojec
t doe
s no
t ref
lect
po
tent
ial l
icen
sing
cos
t ass
ocia
ted
with
the
3.5
mile
line
ext
ensi
on.
8R
ecab
le82
51S
augu
s-N
ewha
ll #1
& S
augu
s-N
ewha
ll #2
66
kV
Sub
tran
smis
sion
Lin
eR
econ
duct
or 4
.95
mi o
f 175
0 X
LP
Und
ergr
ound
Cab
le
with
300
0 A
L.
$20,
035,
081
Con
stru
ct a
new
6.4
mi.
line
- 5.
15 m
i. ov
erhe
ad a
nd 1
.24
mi.
unde
rgro
und
from
Sau
gus
- N
ewha
ll.$2
4,85
7,00
0C
ost w
as h
ighe
r th
an th
e pr
opos
ed p
roje
ct a
nd
the
pote
ntia
l lic
ensi
ng r
equi
rem
ent o
f pro
posi
ng
a ne
w li
ne.
9N
ew L
ine
5346
New
Val
ley
Sou
th S
ubtr
ansm
issi
on L
ine
Con
stru
ct 1
5.4
mile
s of
new
115
kV
sub
tran
smis
sion
line
-
14.8
OH
and
0.6
UG
(3.
4 m
iles
reco
nduc
tor,
2 m
iles
of
doub
le c
ircui
t, 10
mile
s ne
w)
$68,
138,
846
GR
C A
LT
ER
NA
TIV
E -
Val
ley
- T
riton
115
kV L
ine,
Con
stru
ct a
ppro
xim
atel
y 21
.5 m
iles
of 1
15kV
line
to c
reat
e th
e ne
w V
alle
y-T
riton
115
kV li
ne.
$16,
530,
000
Pro
pose
d pr
ojec
t util
izes
exi
stin
g lin
es a
nd
posi
tions
. Pro
ject
alte
rnat
ive
cost
doe
s no
t re
flect
pot
entia
l lic
ensi
ng c
osts
and
ch
alle
nges
of 2
1.5
mile
s of
new
115
kV
line
in
new
RO
W.

A-5
Tab
le 4
A
-Ban
k an
d Su
btra
nsm
issi
on L
ines
Pla
n P
roje
ct D
etai
ls 1
0 -1
6 (T
otal
Com
pany
Nom
inal
$00
0)
Lin
e N
o.P
roje
ct T
ype
Pro
ject
ID
N
umbe
rP
roje
ct N
ame
Pro
ject
Sco
peP
ropo
sed
Pro
ject
Cos
tA
lter
nati
ve P
roje
ct S
cope
Alt
erna
tive
Cos
tR
easo
n N
ot S
elec
ted
10R
econ
duct
or77
64V
esta
l-C
olum
bine
-Del
ano-
Ear
limar
t 66
kVR
econ
duct
or 9
.7 m
iles
of 2
/0 B
C to
954
SA
C$3
,268
,070
AL
TE
RN
AT
IVE
to V
esta
l-C
olum
bine
-Del
ano-
Ear
limar
t 66
kV R
econ
duct
or
(PIN
776
4) &
Ear
limar
t-W
heat
land
66
kV R
econ
duct
or (
PIN
785
2).
Ves
tal 2
20/6
6 (S
) -
New
13.
7 m
ile 6
6 kV
Ves
tal-
Ear
limar
t lin
e$3
0,86
4,31
0A
ltern
ativ
e C
ost s
igni
fican
tly g
reat
er th
an
Pro
pose
d P
roje
ct C
ost
11R
econ
duct
or80
02E
l Nid
o-L
enno
x-P
olar
is-Y
ukon
66
kV S
ubtr
ansm
issi
on
Lin
e
Rec
ondu
ctor
the
El N
ido
and
Len
nox
legs
of t
he E
l Nid
o-L
enno
x-P
olar
is-Y
ukon
66
kV u
nder
grou
nd p
ortio
ns fr
om
1750
KC
MIL
Al t
o 30
00 K
CM
IL C
u. T
he E
l Nid
o un
derg
roun
d po
rtio
n is
app
roxi
mat
ely
0.5
mile
and
the
Len
nox
unde
rgro
und
port
ion
is a
ppro
xim
atel
y 1.
5 m
ile.
Rec
ablin
g th
e ad
jace
nt L
a C
iene
ga-E
l Nid
o 66
kV
S
ubtr
ansm
issi
on L
ine
that
sha
res
the
sam
e du
ct w
ork.
R
epla
ce th
e C
O-8
rel
ays
at E
l Nid
o S
ubst
atio
n on
the
Len
nox-
Pol
aris
-Yuk
on 6
6 kV
Sub
tran
smis
sion
Lin
e w
ith
SE
L-3
11C
$6,9
40,7
05C
onst
ruct
5 m
ile c
ircui
t with
954
SA
C fo
r a
new
El N
ido-
Len
nox
66 k
V L
ine
$13,
032,
364
Cos
t was
hig
her
than
the
prop
osed
pro
ject
12L
oop-
In48
91A
rrow
head
115
/33
kV S
ubst
atio
nL
oop
in p
roje
ct a
nd r
econ
figur
e 11
5 kV
sub
tran
smis
sion
lin
e ar
rang
emen
t.$1
,859
,728
13A
-Ban
k53
83C
hino
220
/66
kVIn
stal
l a fo
urth
280
MV
A tr
ansf
orm
er a
nd s
plit
the
syst
em.
Inst
all t
wo
new
28.
8 M
VA
R 6
6 kV
cap
acito
rs a
nd
rebu
ild th
e 66
kV
sw
itchr
ack.
$53,
531,
956
Inst
all a
new
280
MV
A tr
ansf
orm
er b
ank
atM
ira L
oma
220/
66 k
V S
ubst
atio
n an
d co
nstr
uct a
new
20
mile
66
kV s
ubtr
ansm
issi
on li
ne to
Fire
hous
e S
ubst
atio
n an
d re
build
the
switc
hrac
k at
Chi
no S
ubst
atio
n$8
8,07
4,00
0C
ost w
as h
ighe
r th
an th
e pr
opos
ed p
roje
ct
14A
-Ban
k77
67Jo
hann
a 22
0/66
kV
Inst
all a
new
280
MV
A tr
ansf
orm
er to
cor
rect
an
N-1
L
ikel
y C
ontin
genc
y S
TE
LL
ove
rload
. E
xten
d 66
kV
sw
itchr
ack
to in
stal
l new
tran
sfor
mer
.$1
9,30
7,15
8
Inst
all a
new
280
MV
A tr
ansf
orm
er b
ank
at V
illa
Par
k 22
0/66
kV
Sub
stat
ion
and
split
the
66 k
V b
us. E
xten
d th
e 22
0 kV
sw
itchr
ack
one
posi
tion.
R
econ
figur
e 66
kV
sub
tras
nmis
sion
line
s. A
dd g
roun
d ba
nks
to tw
o A
-ban
k tr
ansf
orm
ers.
$39,
959,
000
Not
the
low
er c
ost o
tpio
n
15A
-Ban
k77
40D
el A
mo
220/
66 k
V
Del
Am
o 22
0/66
: Rep
lace
(40
) 66
kV
bus
dis
conn
ect
switc
hes.
Rep
lace
(2)
sec
tiona
lizin
g di
scon
nect
sw
itche
s.
Rep
lace
(2)
sec
tiona
lizin
g C
Bs.
Rec
ondu
ctor
66k
V A
se
ctio
n bu
s fr
om 2
-103
3 K
CM
IL to
3-2
156
KC
MIL
. R
econ
duct
or 6
6kV
C s
ectio
n bu
s fr
om 2
-103
3 K
cmil
$3,8
47,5
02
Tra
nsfe
r C
arm
enita
66/
12 k
V S
ubst
atio
n to
Cen
ter
by lo
opin
g C
arm
enita
to
Cen
ter-
Mur
phy-
Pio
neer
-Tel
egra
h L
ine.
Con
stru
ct a
3.5
mile
new
66
kV li
ne.
Rec
onfig
ure
Car
men
tia-L
a M
irada
66
kV L
ine
to fo
rm E
ric-L
a M
irada
66
kV
Lin
e. a
nd C
arm
enita
-Gre
enin
g L
ine
to E
ric-G
reen
ing
line.
$8,0
00,0
00C
ost w
as h
ighe
r th
an th
e pr
opos
ed p
roje
ct
16R
econ
duct
or78
51P
orte
rvill
e-W
oodv
ille
66 k
VR
econ
duct
or 6
.6 m
iles
of 2
/0 B
C to
954
SA
C$3
,048
Con
stru
ct a
ppro
xim
atel
y 15
mile
s of
new
Spr
ingv
ille-
Woo
dvill
e 66
kV
line
with
95
4 S
AC
$46,
233
Not
the
low
er c
ost o
tpio
n
No
Alte
rnat
ive
is n
eede
d fo
r th
is p
roje
ct <
$3M