LNN Energy Feasibility Study Final Reportlocalnexus.org/wp-content/uploads/2015/04/LNN-Energy... ·...
91
July 2016 LNN Energy Feasibility Study Final Report López-Avilés, A. and Leach, M., Centre for Environmental Strategy, University of Surrey
Transcript of LNN Energy Feasibility Study Final Reportlocalnexus.org/wp-content/uploads/2015/04/LNN-Energy... ·...
July 2016
LNN Energy Feasibility Study
Final Report
López-Avilés, A. and Leach, M.,
Centre for Environmental Strategy, University of Surrey

Energy Feasibility Study Final report 2
Executive Summary
The Food-Energy-Water Local Nexus Network (LNN) for redistributed manufacturing focuses on the
development of local nexuses of food manufacturing and energy and water supply which may
provide opportunities for rationally customising resource utilisation, production, and consumption
while contributing to the shared prosperity between business and community, and between
human society and natural ecosystems.
This network involves a multidisciplinary academic team across six UK universities working with
representative stakeholders that will study the local nexuses along four research themes:
engineering, business, policy and society, and systems integration. Two case study locales provide a
common background for different research themes to interact and integrate, and will serve
purposes ranging from collection of empirical data to stakeholder engagement. These two case
studies represent respectively situations of “new development”, (Northstowe, Cambridgeshire,
where opportunities exist to introduce a new food, energy and water system), and “retrofitting”
(Oxford, where an existing system is to be changed to benefit from the paradigm of local nexuses).
The work will be developed through six inter-related feasibility projects. This report covers the work
undertaken to date within the Energy Feasibility Study.
The specific objectives of the Energy Feasibility study are:
1. Assess requirements for energy supply (electricity and heat of different qualities) to
localised food systems (e.g. production, storage), including typical temporal (diurnal
and seasonal) variations
2. Assess opportunities for energy integration across the local supply and production
chains (e.g. CO2 emissions to be used in green-houses to aid tomatoes ripen, re-use
heat loss from cooling down after evaporation etc.).
3. Assess potential for energy recovery from waste arisings from food production
across the local supply chain, plus arisings from local water/wastewater treatment
systems
4. Develop local energy system scenarios, including other potential users
5. Evaluate energy generation and storage technologies suitable for implementing the
scenarios: efficiency, cost effectiveness, safety, and environmental impact
Based on the objectives above, existing literature and data were reviewed on the Nexus and the
linkages between Energy and Water, Energy and Food etc. A review of existing academic and grey
literature and data on energy use for the production of two chosen food products: tomato paste
and bread, is also summarised in this report, and a detailed study of selected energy system
scenarios linked to bread manufacturing processes is also presented illustrating the current situation
versus a possible future where redistributed manufacturing (RDM) would be more widespread.
Energy Feasibility Study Final report 3
Contents
Executive Summary ................................................................................................................................ 2
1. Background to the Food-Energy-Water Local Nexus Network for Redistributed Manufacturing
project ............................................................................................................................................. 6
1.1. LNN Energy Feasibility Study ................................................................................................... 6
2. Introduction to the Water-Energy-Food Nexus............................................................................. 8
2.1. Water-Energy linkages ............................................................................................................ 9
2.2. Energy-Water linkages .......................................................................................................... 10
2.3. Energy-Food linkages ............................................................................................................ 11
2.4. Water-Food linkages ............................................................................................................. 11
3. Energy involved in industrial food processing: the case of tomato paste ................................. 13
3.1. Energy and CO2 emissions of vegetable oils ......................................................................... 13
3.2. Energy and CO2 emissions of tomato paste .......................................................................... 15
3.2.1. Energy and CO2 emissions of tomato paste in Europe, Canada and other countries ... 16
3.2.2. Energy and CO2 emissions of tomatoes in the UK ........................................................ 18
3.3. Opportunities for energy integration across the local supply and production chains of
tomato paste production in California .................................................................................. 19
3.4. Opportunities for tomato paste production in the UK ......................................................... 21
3.4.1. Industrial symbiosis: using waste energy from other industries to grow tomatoes .... 21
3.5. Example of tomato nurseries, Worcestershire, and interview with local tomato grower ... 22
3.5.1. Water ............................................................................................................................ 22
3.5.2. Energy ........................................................................................................................... 23
3.5.3. Waste and waste water, and energy from waste ......................................................... 26
3.5.4. Juice business model and general aspects .................................................................... 27
4. Energy involved in industrial food processing: the case of bread .............................................. 29
4.1. Introduction .......................................................................................................................... 29
4.2. Energy and emissions linked to the production of wheat for bread .................................... 29
4.3. Bread making and energy requirements .............................................................................. 30
4.4. Studies/data available on energy involved in bread making in the UK ................................ 32
4.4.1. Energy used in food manufacturing in the UK .............................................................. 32
4.4.2. Energy and green-house gas (GHG) emissions of growing wheat in the UK ................ 32
Energy Feasibility Study Final report 4
4.4.3. Energy and green-house gas (GHG) emissions associated with the industrial bakery
sector in the UK ............................................................................................................. 34
4.4.4. Energy intensities of bread in the UK ........................................................................... 36
4.4.5. Emissions associated with bread in the UK................................................................... 40
4.4.6. Energy efficiencies in the bakery sector ....................................................................... 40
4.4.7. Summary of the energy implications of making bread in the UK ................................. 42
4.4.8. Wastes and by-products from the bread supply chain and potential for energy
generation ..................................................................................................................... 43
4.4.9. Industrial symbiosis: waste energy from other industries for bread manufacturing ... 44
4.5. Interviews with local mills and bakeries ............................................................................... 44
4.5.1. A Mill, Oxfordshire ........................................................................................................ 44
4.5.2. B Mill, Oxfordshire ........................................................................................................ 46
4.5.3. Village bakery and local bakery facility, Oxfordshire .................................................... 47
5 Summary of findings relevant to the Energy Feasibility Study from one-to-one interviews .... 51
5.1. Areas for further investigation according to interviews and site visits ................................ 52
5.1.1. Tomato paste case study .............................................................................................. 52
5.1.2. Bread case study: mills .................................................................................................. 52
5.1.3. Bread case study: bakery shop and local bakery facility ............................................... 52
6. Stakeholder engagement ............................................................................................................. 53
6.1. Feedback from stakeholders workshops .............................................................................. 53
7. Background and framework for the energy analysis .................................................................. 57
7.1. Framework for analysis of energy usage in food manufacturing ......................................... 58
7.2. Choice of scenarios for the energy analysis .......................................................................... 59
8. Evaluation of implications on energy use and emissions of localising bread manufacturing ... 61
8.1. Assessment of opportunities for improvement at the national scale .................................. 61
8.1.1. Comparing energy use and emissions of baking using gas or electricity ...................... 61
8.1.2. Energy use and emissions linked to best available bakery-plant technology ............... 64
8.1.3. Other technological /system efficiencies that may help reduce energy use and
emissions ....................................................................................................................... 65
8.1.4. Energy from waste (efw) in the UK’s baking sector ...................................................... 65
8.2. Energy consumption and emissions linked to scenarios for bread manufactured at various
scales in the UK .................................................................................................................... 66
8.2.1. Energy use and emissions for the current situation: 98% of the country’s bread
produced in industrial plants with 2% of bread produced locally ............................... 69

Energy Feasibility Study Final report 5
8.2.2. Energy use and emissions for bread manufacturing if a change meant that 20% of the
UK’s bread production was localised Re-Distributed Manufacturing (RDM) .............. 71
8.3. Renewable sources of energy ................................................................................................... 77
8.4. Small-scale technologies ............................................................................................................ 78
9. Conclusions ................................................................................................................................... 80
10. Future research.............................................................................................................................. 83
References ............................................................................................................................................ 85
Appendix A ........................................................................................................................................... 90
Energy Feasibility Study Final report 6
1. Background to the Food-Energy-Water Local Nexus
Network for Redistributed Manufacturing project
The Local Nexus Network (LNN) is one of six 24-month research networks on Redistributed
Manufacturing (RDM) funded by the EPSRC and the ESRC which started in early 2015.
The LNN focuses on the development of local nexuses of food manufacturing and energy and water
supply, which may provide opportunities for rationally customising resource utilisation, production,
and consumption to meet the services required within a local context while contributing to the
shared prosperity between business and community and between human society and natural
ecosystems. This represents a complex and significant transition, which requires “smart”
engineering (smaller scale technologies, integrated processes), and driving forces from businesses,
communities and policy makers to turn the potential of local nexuses into an economic and social
reality.
This network involves a multidisciplinary academic team involving six UK universities and interacting
with representative stakeholders. This network will study the local nexuses along four research
themes: engineering, business, policy and society, and systems integration, supported by two case
studies representing respectively situations of “new development”, (Northstowe, Cambridgeshire,
where opportunities exist to introduce a new food, energy and water system), and “retrofitting”
(Oxford, where an existing system is to be changed to benefit from the paradigm of local nexuses).
These case study locales will provide a common background for different research themes to
interact and integrate and will serve purposes ranging from collection of empirical data to
stakeholder engagement. The total space of 3 sectors, 4 research themes and 2 types of locales is
explored through six inter-related feasibility projects. This draft report covers the work undertaken
to date within the Energy Feasibility Study.
1.1. LNN Energy Feasibility Study
The Oxford case study was used for background empirical data collection and to develop new
thinking around localised production of food and energy supply for local food systems.
The specific objectives of the Energy Feasibility study are:
1. Assess requirements for energy supply (electricity and heat of different qualities) to
localised food systems (e.g. production, storage), including typical temporal (diurnal
and seasonal) variations
2. Assess opportunities for energy integration across the local supply and production
chains (e.g. CO2 emissions to be used in green-houses to aid tomatoes ripen, re-use
heat loss from cooling down after evaporation etc.).
Energy Feasibility Study Final report 7
3. Assess potential for energy recovery from waste arisings from food production
across the local supply chain, plus arisings from local water/wastewater treatment
systems
4. Develop local energy system scenarios, including other potential users
5. Evaluate energy generation and storage technologies suitable for implementing the
scenarios: efficiency, cost effectiveness, safety, and environmental impact
Based on the objectives above which are outlined in the Energy Feasibility Study Profile, existing
literature was reviewed on the Nexus and the linkages between Energy and Water, Energy and Food
etc. and this is summarised below. A review of existing academic and grey literature and data on
energy use for the production of two chosen food products: tomato paste and bread, is also
included below. Work is currently ongoing for the energy system scenario development and
analysis.
Energy Feasibility Study Final report 8
2. Introduction to the Water-Energy-Food Nexus
The increasing water demands resulting from agriculture and industrial processes, lifestyle changes
and population growth are resulting in rising financial and environmental costs. More energy and
chemicals are increasingly being used to make water potable, to distribute it and to protect against
more frequent and damaging flooding in all countries. Climate change predictions point to more
extremes both in terms of water scarcity and flooding in many regions of the world. Drought-
affected areas will increase in extent, but rainfall concentrated in wet season, and intense
precipitation events will increase flood risk. The atmosphere and oceans have warmed, the amount
of snow and ice have diminished, sea level has risen and the concentrations of GHGs have increased,
and further emissions of GHGs will cause more warming and changes in all components of the
climate system (IPCC, 2013 and 2014).
Furthermore, water and energy-intensive industrial and agricultural practices are also likely to
increase in order to meet demand for goods and food all over the world, thus existing water
resources are under pressure from ever-increasing competing uses. According to McKinsey &
Company (2009) agriculture accounts for 31% (3100 billion m3) of global water withdrawals and
these are expected to increase to 4500 billion m3 by 2030. The OECD (2010) estimates that
agriculture is the major user of water ‘accounting for about 70% of the World’s freshwater
withdrawals and over 40% of OECD countries’ total water withdrawals’. Whichever figure is chosen,
what is clear is that agriculture accounts for a significant share of the World’s freshwater use, and
globally it is estimated that approximately 50% more food will need to be produced by 2030, and
production will need to be doubled by 2050. This will have to be done with less water due to climate
change impacts and the pressures of competing water uses linked to urbanisation and
industrialisation (OECD, 2010), with population growth and global trade adding to the complexities
and multidimensionality of the Nexus (Mohtar and Daher, 2012).
According to Professor John Beddington (2009) “a ‘perfect storm’ of problems around simultaneous
water, energy and food shortages will lead to public unrest and international conflict in the near
future unless 50% more food, 50% more energy and 30% more freshwater are available by 2030,
whilst mitigating and adapting to climate change”.
Given the emerging issues of insecurity in terms of energy and food supply across the world, both
the energy and agriculture/agro-industrial sectors are under pressure to meet future demand while
producing more cheaply. Hence, society faces real challenges to minimise emissions of Green-House
Gases (GHGs), adapt to climate change impacts and to satisfy food, water and energy demands while
reducing our environmental footprint.
Ringler et al., (2013) recognise that the inter-connections between the Water, Energy, Land and
Food sectors has become more apparent as a result of pressures on natural resources and
emphasise the need for all nexus analyses to consider human well-being and environmental
outcomes in addition to assessing benefits across the three sectors. It has been recognised also that
many of the issues that the Water-Energy-Food Nexus Agenda aims to address are not new and have
faced significant barriers to progress in the past due to political economy challenges, overambitious
aims and the complexity of working across disciplines, which could again lead to the downfall of the
Energy Feasibility Study Final report 9
Nexus agenda (Leck et al., 2015). However the same authors acknowledge that the increasing use of
resources across the world, together with better modelling and assessment tools to study
interdependencies between the three sectors can create the momentum to overcome old barriers.
In relation to assessment tools for the study of Nexus relationships, after a review of integrated
resource assessment and modelling literature, Bazilian et al., (2011) confirmed that existing
analytical and decision-making tools available are for a single resource/system, thus justifying the
need for a new Nexus modelling framework, which they present as the Climate, Land, Energy and
Water (CLEW) modelling framework. Developed by the International Atomic Energy Agency CLEW
was designed to map key Nexus relationships (including in developing countries), and also aims to
assist decision-making, policy assessment and harmonisation, technology assessments, and scenario
development.
Some of the Nexus linkages between the three sectors are summarised below.
2.1. Water-Energy linkages
Energy is required for pumping water from aquifers, for distributing fresh water, drainage from
roads and fields, for collecting foul water, desalination, water treatment, distribution in farms and
cities, irrigation, sewage treatment etc.
The water sector is a large consumer of energy, for example via desalination, ranging from reverse
osmosis plants that consume 4-6kWh/m3 of treated water versus 21-58kWh/m3 for multistage flash
(MSF distillation is a water desalination process that distils sea water by flashing a portion of the
water into steam in multiple stages - mainly employed for large-scale, thermal desalination plants
where thermal energy is available in the form of low-pressure steam (>2 bar a), e.g. in combination
with thermal power plants or industrial complexes (http://www.wabag.com/performance-
range/processes-and-technologies/msf-multi-stage-flash/) –see Semiat, 2008).
However it should be noted that desalination is more energy intensive than other methods of
producing potable water. Groundwater supply uses about 30% more electricity on a unit basis than
supply from surface water (i.e. rivers, lakes and reservoirs) due to the pumping element of ground
water abstraction that has been estimated to be 2100 kW/h per million gallons (i.e. 3,785,412 litres),
plus water transport (WEF, 2011).
The energy inputs of transporting water are often overlooked. Generic energy requirements in
transporting water (i.e. energy in kWh required to deliver 1m3 of clean water) have been summarised
in the table below from a study by the World Economic Forum (see WEF, 2011):
Lake or river 0.37 kWh/m3
Groundwater 0.48 kWh/m3
Wastewater treatment 0.62-0.87 kWh/m3
Wastewater re-use 1-2.5 kWh/m3
Seawater 2.58-8.5 kWh/m3

Energy Feasibility Study Final report 10
The distance that water needs to travel is also a major factor to consider when looking at energy
inputs.
2.2. Energy-Water linkages
The opposite is also true, the energy sector itself is a major water consumer with the ‘largest
withdrawal of water in the USA and most industrialised countries going for power plant cooling’ (see
WEF, 2011). For example, in 2005, this amounted to half of all withdrawals (49%) in the USA (CSS,
2014).
Nuclear is the highest water demanding thermoelectric technology although other energy sources
such as biofuels (see under the Energy-Food linkages of the nexus too) have also been reported as
the most water-intensive fuel sources (one or two orders of magnitude greater than that of
alternative sources of liquid fuels) in contrast with solar and wind energy that can help meet
increasing energy demands without applying more pressure on the Nexus (see Mielke et al., 2010).
In relation to the water footprint of different types of biomass and the linkages between energy and
food (see 1.1.3 below), Gerbens-Leenes et al., (2009) looked at 15 crops including one tree species
and a bio-energy crop, and compared these and food crops in terms of their water footprint in
relation with fossil fuels. The research highlights the controversy of whether to use land and water
for food or energy crops. In terms of water use, this paper indicates that nuclear and fossil fuels use
less water (in their operational phases only) than many food crops, although a counterargument can
be made that the choice of food crops and regions to grow them which is used for this study may not
be the best for a biomass study comparing bio-energy crops with other energy sources such as wind,
nuclear, natural gas, coal, solar, oil, solar thermal and hydro.
In relation to the linkages Water-Food (and land), ‘thirsty’ crops that can be used as fuel (e.g. corn)
are often grown as food because of benefits such as high yields, nutritional value or income-
generation, despite their high land and water footprints. However, Gerbens-Leenes et al., (2009)
and Jordaan et al., (2013) point out that increasing the contribution of energy from biomass to meet
energy security goals will mean larger consumption of fresh water and competition for water and
land between energy and food crops.
Thus, as highlighted by Bazilian et al., (2011) single resource tools such as water footprinting are not
a good way to assess the suitability or not of biomass because they ignore Nexus and geographical
linkages such as whether there is competition between food crops and other land uses, and /or
whether water footprint is an issue at all or not in a particular region.
The issue of boundaries is also problematic when making comparative studies. Gerbens-Leenes et
al., (2009), for example, consider the water footprint of mining operations only for uranium, gas,
coal etc. therefore limiting the comparative study to the first stages of the supply chain, but huge
amounts of water are lost through evaporation in later stages, for example in the cooling down
process in nuclear and fossil fuel power stations.
Other studies on energy and water focus specifically on biomass. King et al., (2013) suggests that
water availability is the most important climatic change to consider in the design of future bioenergy
Energy Feasibility Study Final report 11
systems. Despite the variations on bioenergy productivity in relation to water availability, biomass
has an advantage over other energy sources in that it favours small scale decentralised systems
where, unlike in huge power stations, water is not needed for cooling, or where water /steam used
for cooling -if any- is re-circulated in a close circuit and can be then used for heating (combined heat
and power CHP plants).
2.3. Energy-Food linkages
In relation to energy and food (and land), the prices of food are linked to the global price of oil (i.e.
see for example food prices soaring globally between 2006 and 2008). Transporting food around the
world makes food dependent on oil as the main energy source. The controversy arises with
alternatives to fossil fuels such as biofuels are considered as discussed more extensively above under
Energy-Water linkages.
Policies that aim to diversify the sources of energy away from oil (e.g. the drive to turn corn into
ethanol in the USA, softwood and sugarcane into biodiesel in Brazil and Mauritius) mean that food
products are being transformed into fuel, and more and more arable land is being used for biofuel
production in competition with growing food. Mohtar and Daher (2012) point out the controversy
that biodiesels generate also in relation to water consumption and soil and water degradation
associated with the excessive use of fertilizers.
2.4. Water-Food linkages
According to a study by the ‘2030 Water Resources Group’ of businesses and water stakeholders,
‘agriculture accounts for 31% (3100 billion m3) of global water withdrawals, which is expected to
increase to 4500 billion m3 by 2030’ (McKinsey & Company, 2009).
A Study by the Organisation for Economic Co-operation and Development indicates that agriculture
is the major user of water, accounting for about 70% of the world’s freshwater withdrawals and over
40% of OECD countries’ total water withdrawals. This study also indicates 50% more food will need
to be produced up to 2030, and production will need to be doubled by 2050 with less water
available due to growing pressures from urbanisation, industrialisation and climate change (OECD,
2010).
A number of academics (e.g. Allan (1998), Allan (2012), Hoekstra (2003), Chapagain et al., (2006),
Mekonnen and Hoekstra (2011)) have worked extensively in defining ‘green water’ (rain-fed) and
‘blue water’ (surface and groundwater), and calculating volumes of both green and blue water
across the world to ascertain the trade of ‘virtual water’ embedded in agricultural and industrial
products. Different countries have different water productivity (output per unit of water volume
consumed), so some countries with high water productivity have a competitive advantage, while
others have a competitive disadvantage that can lead to water being ‘imported’ via importing food
goods. This is the case in many Middle East countries which import nearly the totality of their food
(and water), thus creating political and social dependency on other regions of the world. The
complexity of these dependencies have led to some scholars to emphasise the need to globally grow
food products maximising ‘green water’ and saving blue water, viewing water as a global resource

Energy Feasibility Study Final report 12
that should be saved by all countries wherever possible for food production (Mohtar and Daher,
2012).

Energy Feasibility Study Final report 13
3. Energy involved in industrial food processing: the case
of tomato paste
After setting the linkages between Energy and Food and Energy and Water above, this section will
focus on reviewing existing literature on the energy involved in producing tomato paste, which is
one of the three chosen food products to be investigated under the LNN project. Although the focus
of the Energy Feasibility study is on the linkage between Energy and Food, water can contribute to
save energy by re-using the heat stored in water and steam during manufacturing processes, hence
the importance of considering the complete Nexus in the Energy Feasibility study.
Integrating renewable sources of energy into the industrial processes is the subject of research by
Hummel et al., (2013) that examined the opportunities for solar thermal energy in the supply of
process heat (for temperatures between 30 and 150˚C), including its economic feasibility. The study
looked at various industrial processes under different economic and climatic conditions, and
indicates that solar thermal systems have the potential to reduce fossil fuel inputs but are currently
long-term investments with pay-back periods between 8 and 12 years, and longer, even after
including current subsidies available in Austria. The main reason found for this long pay-back period
is the low price of fossil fuels, while the economic feasibility of solar thermal systems also depends
on geographical and climatic conditions. The work by Hummel et al., also indicates that lower
process temperatures make solar thermal systems more efficient, while waste heat recovery
(another avenue to reduce energy inputs) reduces energy demand from the solar thermal system,
thus making the solar systems less efficient in economic terms.
Reducing fossil fuel inputs via waste heat recovery and re-use within a product’s processing phases is
the subject of various investigations and will be examined in relation to tomato commodities below.
3.1. Energy and CO2 emissions of vegetable oils
Although industrial processes can be energy intensive, studies that looked at the energy and CO2
emissions of some vegetable products have found that agriculture is responsible for most of the
emissions to the atmosphere. Özilgen and Sorgüven (2011) investigated the production of soybean,
sunflower, and olive oils and found that most of the energy used and CO2 emissions for these
products were related to the agricultural phases as a result of excessive use of fertilizers, and the
consumption of diesel as the dominant source of exergy (high quality energy) and total energy
(addition of exergy and anergy -wasted energy with less capacity to perform work). Figure 1 after
Özilgen and Sorgüven (2011) compares cumulative energy consumption (CEnC) and cumulative
exergy consumption (CExC) in the production of oil from one ton of olives, soybeans and sunflower
seeds (*). Most energy and exergy is used in agriculture, followed by packaging. Figure 2 illustrates
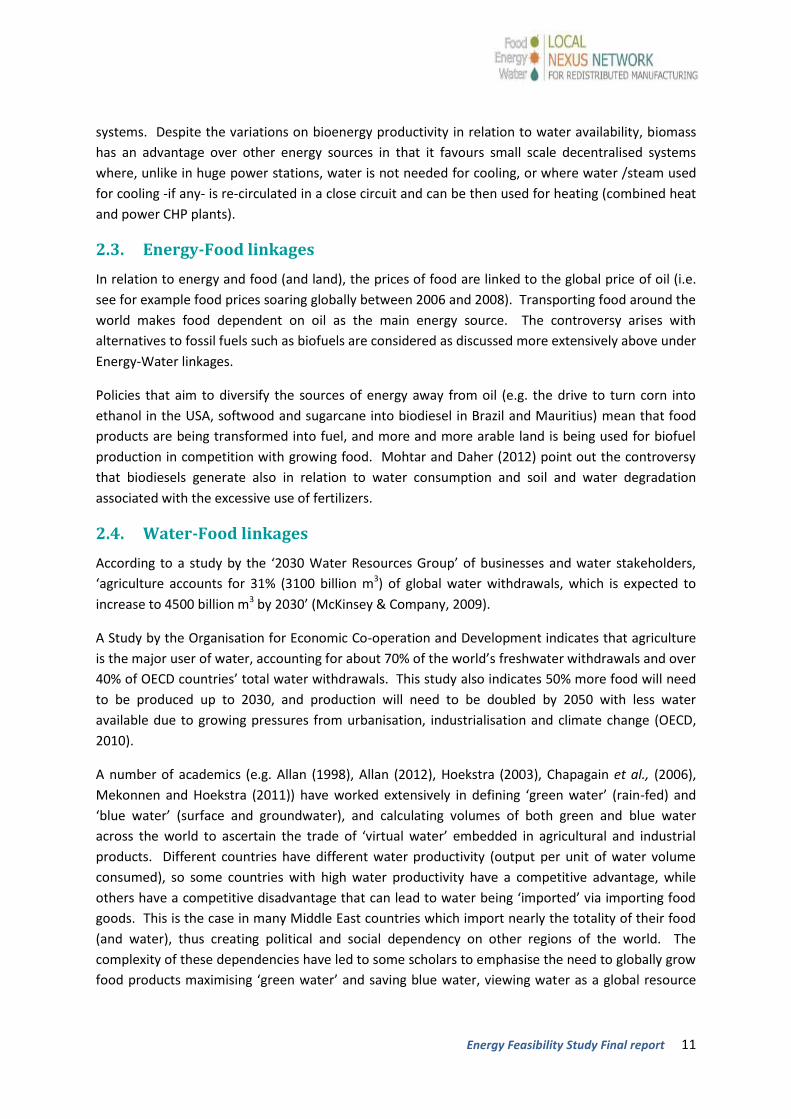
the carbon footprints of these three types of oils with soya having the most CO2 emissions per ton of
seeds due to the intensive use of fertilizers to grow this crop and despite the olive oil production
process being the most energy intensive process. The paper argues that better agricultural practices
and biodiesels from renewable sources can help in reducing exergy use.

Energy Feasibility Study Final report 14
Figure 1 Comparison of the cumulative energy and exergy consumptions to produce oil from one ton of olives, soybeans and sunflower seeds. Source: Özilgen and Sorgüven (2011)
(*) Note that cumulative exergy consumption (CExC) is defined as the sum of exergy of all resources consumed in all the steps of a production process. CExC is a function of the pathway that the process follows, and quantifies the total consumption of exergy including those of raw materials, transportation, work, and heat transfer for production. Cumulative energy consumption (CEnC) does not consider the non-energetic raw materials, and cannot provide a measure for the impact of the process on the environment. This explains why the exergy (CExC) figures are higher than the energy (CenC) figures in Figure 1.
Energy Feasibility Study Final report 15
Figure 2 Comparison of the CO2 emissions to produce oil from one ton of olives, soybeans and sunflower seeds. Source: Özilgen and Sorgüven (2011)
3.2. Energy and CO2 emissions of tomato paste
As highlighted in the LNN Initial Research Note on Tomato Paste1, the variety of tomatoes used for
tomato paste are harder in consistency allowing mechanical harvesting and transportation, are
grown outdoors and are generally irrigated. In relation to irrigation, substantial amounts of energy
may be required for pumping water from the ground or surface water body directly for irrigation,
and also for pumping from the ground or water body, treatment and distribution through the pipes
network for irrigation, if water comes from a centralised water supply organisation.
Large scale tomato paste processing plants work intensively (typically 24 hours a day during the
tomato season), first sorting and washing tomatoes mechanically harvested. Energy is required for
the mechanical collection and transportation processes, and for treating and pumping water for
washing tomatoes. Energy requirements in some of the above phases are reduced in small scale and
artisanal production lines where some of the processes are done by hand.
Tomatoes are then crushed and heated to form a pulp. This pulp is further heated to a hot (98-
100°C), or cold (60°C) break that results in a more or less viscous paste respectively. These phases
require substantial energy inputs. The pulp is put through screens with some energy input in this
process, and then a vacuum evaporator is used to thicken the paste, which is subsequently sterilised
and rapidly cooled.
1 LNN Initial Research Note on Tomato Paste by Julian Cottee, August 2015

Energy Feasibility Study Final report 16
Finally in the production process, wastage is often dried and used to feed dairy cattle, for pet food or
is sent to landfill, thus, there is also potential for this waste to be used to feed decentralised
combined heat and power plants (CHPs) to generate energy locally.
3.2.1. Energy and CO2 emissions of tomato paste in Europe, Canada and other
countries
Most of the above processing phases for tomato paste production are energy intensive. Karakaya
and Özilgen (2011) studied the energy and CO2 emissions involved in the production of fresh, paste,
whole-peeled, diced, and juiced tomatoes in Turkey including packaging, transportation, and waste
management. This comparative study found that the energy used to make tomato paste
(understood in this work as tomato pulped and then concentrated in multi-effect evaporators) is
twofold that of producing and packaging fresh tomatoes, while for juice the increase is five times,
and for peeled or diced-tomatoes the energy use increases by seven times the energy of processing
the same amount of fresh tomatoes. CO2 emissions were calculated to be 189.4 kg of CO2/ton (Kg/t)
for fresh tomatoes with retail packaging, and very similar for tomato paste. Emissions of peeled or
diced tomatoes increased twofold, while emissions of juiced tomatoes increased threefold.
As with the study by Özilgen and Sorgüven (2011) about vegetable oils, the Karakaya and Özilgen
(2011) study found that chemical fertilizers and transport are the main contributors to CO2 emissions
but that these also depend on the energy source used in the processing, with natural gas generating
relatively fewer emissions than electric power. This study of tomato products also found that energy
use is strongly linked to the amount of water content of the final product. Although evaporation for
tomato paste is energy intensive, the study concludes that because the mass of product to be
transported is reduced in the case of tomato paste, the total amount the energy used for paste is
relatively less than for processed whole-peeled, diced and juiced tomatoes.
Manfredi and Vignali (2014) work analyses the life cycle (LCA) of 700 g tomato puree packaged in a
glass jar as a reference product and its production in northern Italy including the cultivation,
processing, packaging and transportation phases. The study aims to identify potential
improvements in each phase by looking comprehensively at all operations related to each of these
phases, for example from land preparation to post-harvest processes in cultivation, and all transport
involved in the supply chain of tomato puree. Farmers and the Italian processing company provided
primary data and Ecoinvent v2.2 was used for secondary data. The water footprint of growing and
processing tomatoes into puree was also calculated.
Similar to other studies (e.g. Özilgen and Sorgüven (2011) and Karakaya and Özilgen (2011)), the
Manfredi and Vignali study found that fertilizers cause the largest environmental burdens, and thus
the cultivation phase was found to have higher environmental impacts than the transportation and
processing phases as a result of the use of fertilizers (eutrophication), pesticides and diesel.
In Manfredi and Vignali’s study, packaging required large amounts of energy for its production and
was found to account for a large part of the environmental impacts of the tomato puree life cycle, so
Energy Feasibility Study Final report 17
improvements proposed include reducing the weight of the glass jars (the most common way of
packaging puree in Italy).
In relation to the processing phase, the industrial operations detailed in this study relate to Emilia
Romagna company and are defined as a ‘standardized filling line where puree is filled into glass jars
that then are pasteurized, labelled and packaged in carton trays, before being sent to warehouses
ready to be delivered to clients in Italy’. Impacts of the processing phase are due to the amount of
electricity and natural gas used in pasteurization and concentration of the tomato puree.
In the Manfredi and Vignali’s case study, transport to the retailers contributes to environmental
impacts quite significantly too and so improvements are reported to be possible by reducing the
distance to travel and by optimizing energy use. Other improvement proposed is the use of organic
fertilizers instead of mineral ones in the cultivation phase.
Other studies into tomatoes production include Carlsson-Kanyama, A. and Faist, M. (2000) who
looked at the energy used in the production of various crops based on data from various countries.
They report that for example cucumbers in greenhouses require more than 100 times the fuel
needed when cultivated in the open ground, and similar results have reportedly been recorded for
tomatoes.
Furthermore, Martínez-Blanco et al., (2011) provide inventories for the horticultural production of
tomato using compost and mineral fertilizers in both open-fields and greenhouses using Life cycle
assessment (LCA) to ascertain environmental impacts and viability of four cultivation options;
whereas Payen et al., (2015) examine the energy and water implications of importing Moroccan
tomatoes into France in comparison to consuming tomatoes grown in France. They emphasise the
need to consider all impact categories when performing an agricultural LCA, especially to assess the
impacts of freshwater use. This is because they observe that although French grown tomatoes
result in greater impacts on total energy consumption, global warming, and eutrophication (even
when including transport to France for the Moroccan tomatoes), there is a trade-off between
freshwater use impacts and the other mostly energy-related impacts.
Kissinger in Boye (2015) dedicates Chapter 2 of this book to the case of tomatoes and tomato
products in Canada, assessing the biophysical footprint of this functional food, including its carbon
and land footprints. According to this study based on previous work by the author, the average
carbon footprint of imported tomatoes in Canada is over 400 grams of CO2 per kilogram of tomato.
The carbon footprint of imported tomatoes from Mexico is reported as 750 grams of CO2 per
kilogram of tomato (out of which 540 grams are associated with transportation by truck), compared
with 400 grams of CO2 per kilogram of tomato (out of which 130 grams are linked to transportation
by boat) if the tomatoes are imported from southern Spain. If shipped by air, the Spanish tomatoes
footprint is estimated to increase to 5240 grams (5.24 Kg) of CO2 per kilogram of tomato. The study
also reports differences in the carbon footprint of the same type of tomatoes within the same
country (e.g. Spain), depending on the study and production conditions.
The land footprint (crop and energy land) of different tomato products in Canada is reported as 1.24
global m2per kg of fresh tomatoes, 2.1 gm2/kg of processed tomatoes, and up to 6.7 gm2/kg of
ketchup. The study compares the carbon and land footprints for tomatoes (and other products) in
Energy Feasibility Study Final report 18
different countries, paying attention to the comparison between fresh tomatoes grown in California
and imported to Canada, versus tomatoes grown in Ontario, Canada, in green-houses. The study
finds that shipping tomatoes from California to Canada can help reduce the carbon footprint of
Canada, even though there is energy involved in the tomatoes transportation, and even though the
study also reports that Ontario’s green-house tomato yields are up to 20 times higher than the yields
of field tomatoes grown in California.
The author concludes that the land (including different production systems) and carbon footprints of
functional foods such as tomatoes (including the energy and carbon footprint along the product’s
full life cycle) have to be considered when looking at the long-term sustainability of the products.
Climate, availability of water and land, and the technological and development conditions of the
region/ country all influence the ecological footprint of the food product.
Studies of small scale tomato processing industries / operations appear to be rarer, although some
studies exist on the energy use of small scale tomato paste production in developing countries, for
example Abubakar et al., (2010) in Nigeria. This study looks at energy use and production data for a
four year period which shows inconsistencies in the consumption of diesel (98% of the energy source
used in these industries) between these years pointing to leakages and/or malfunctions. The study
is incomplete because no energy data were available in the industries examined for the
manufacturing, transportation and repairs phases, which highlights the difficulties for resource
assessments in some businesses and geographies.
3.2.2. Energy and CO2 emissions of tomatoes in the UK
In the UK, the Department for Environment Food and Rural Affairs (DEFRA) commissioned a study by
Cranfield University that using Life Cycle Assessment (LCA) models the resource use and
environmental impacts of 10 common agricultural and horticultural commodities including
tomatoes, wheat and poultry meat (see Williams et al., 2006). The study included primary resources
such as coal, oil and mined ore as inputs for all commodities, as well as all farm production
supporting activities were also included. The study also differentiated among different varieties of
the same commodity, for example, loose and on-the-vine tomatoes nationally produced in the
correct proportion.
In relation to tomatoes, the study found that ‘about 97% of the energy used in tomato production is
for heating and lighting to extend the growing season’. The lowest yielding tomatoes are organic on-
the-vine tomatoes (yield 75% of non-organic) and they incur up to six times more environmental
burdens than the highest yielding tomatoes -non-organic loose classic or beefsteak tomatoes. These
incur the lowest environmental burdens. This is because the amount of energy used is the same for
all tomato production systems per unit area.
In the case of tomatoes, the DEFRA study found that tomato burdens can be reduced by 70% if the
proportion of Combined Heat at Power (25% in 2006) increased nationally to 100% (see Williams et
al., 2006).

Energy Feasibility Study Final report 19
Other important findings of the DEFRA study are that in agriculture (unlike in other industries)
nitrogen, and also methane, dominate the emissions, and that nitrogen fluxes also cause
eutrophication and acidification. Hence most environmental burdens from agriculture are linked to
the nitrogen cycle. The study also reports that for organic production, more land is always required
(65% to 200% extra). The model used for this study can be accessed via the Cranfield University web
site at www.silsoe.cranfield.ac.uk (then search for IS0205 and LCA) and www.defra.gov.uk.
Another DEFRA study (see Defra, 2011) looks at water and land use in agriculture and horticulture in the UK via surveys that took place in 2009-10. Relevant results on land-use required to grow tomatoes are summarised in Table 1.
Table 1 Land needed to grow tomato of different types of tomato, m2/t
Product Non-organic Organic
Classic loose 19 25
Specialist loose 38 51
Classic vine 45 61
Specialist vine 92 122
3.3. Opportunities for energy integration across the local supply and
production chains of tomato paste production in California
As described in the previous section, most of the processing phases for tomato paste production
require energy, and there is potential for energy integration between some of these phases. A
number of studies have been developed on energy recovery around specific facilities in the main
tomato paste producing countries (e.g. USA: California).
Approximately 35% of global tomato processing takes place in California (Trueblood et al., 2013;
Morning Star Company, 2014). According to Trueblood et al., (2013) processing tomatoes is
extremely energy intensive with approximately 6% of the total costs of the tomato processing
operation in Californian plants spent on energy, and great potential to reduce consumption (and
costs) of energy and fresh water via efficiency and demand management measures (see Figure 3),
especially if energy and water are considered together.

Energy Feasibility Study Final report 20
Figure 3 Distribution of electrical energy consumption in a typical plant: most energy intensive processes are cooling towers consuming 17%, hot breaks and evaporators consuming 13% each, and cookers consuming 9%. Source: Trueblood et al., (2013)
Studies such as that of Rumsey et al., 1984 investigated the efficiency of the evaporation process in
tomato paste production in relation to technology, i.e. the study looked at daily average
performance data for single, double and triple effect evaporators, and compared their average daily
steam economy against the theoretical average for these evaporators. The study provided baseline
data for future improvements.
Pacific Gas and Electric (PG & E) have studied the potential for energy integration in tomato paste
processing in California by recompressing vapour generated by the evaporation and using this as the
heat source for the evaporation itself, thus reducing consumption of natural gas for the boilers (see
PG & E, 2008). Compared to other evaporation systems such as triple effect evaporators where the
final vapour produced is condensed, mechanical vapour recompression (MVR) compresses the
vapour to higher pressure and recovers the higher energy content of the vapour to use it in the
evaporation process itself, thus resulting in less energy loss.
MVR can reportedly cut down the amount of natural gas used in processing tomatoes into tomato
paste by up to 89%, which suggests that investing in a MVR compressor may be a worthwhile long-
term investment for agricultural process requiring evaporation for concentrate.
Amon et al., (2015) have used water and energy usage data to model the potential heat transfer
from evaporator condensate to the tomatoes hot break phase in a commercial scale Californian
plant also. Their study models the recovery of condensate waste heat and its application to the
tomato hot break phase to explore energy and economic savings linked to using less steam,
groundwater pumping, cooling, and wastewater processing. This investigation indicates that heat
recovery and re-using condensate need other processing steps to change so that there is demand for
condensate waste heat, but it can lead to significant reductions in the use of natural gas in boilers
(savings of up to 7.3 GWh) and overall electricity savings (up to $166,000) at the facility, depending
on the heat exchanger design, season and processing conditions.
Energy Feasibility Study Final report 21
3.4. Opportunities for tomato paste production in the UK
Around 90% of tomato paste consumed in the UK is imported from the EU (Italy, Spain, Portugal and
Greece), with the remainder mostly coming from China (see LNN Initial Research Note on Tomato
Paste). Some of this tomato paste is re-exported as further-processed food products.
The two fundamental problems identified with potential localised production of tomato paste in
Oxford and /or Cambridge areas are:
1) the inability of UK produced tomato paste to compete with large-scale operations in
regions such as California, and
2) the supply of raw materials near the processing plants, which in the UK would mean
substantial land-use changes to grow tomatoes in green-houses.
These aspects have a negative influence on the cost of tomato paste in the UK and make widespread
re-distributed manufacturing (RDM) of tomato paste a case with little viability in the UK, unless
substantially larger volumes of tomatoes are grown in the UK. This would require changes in land-
use and water and energy supply systems.
Opportunities exist for localising energy systems that can help increase the production of tomatoes
in the UK, for example, by using renewable sources of energy (e.g. energy generation from waste
food and wastewater arisings across the local supply chain, biomass from local sources, solar, hydro,
heat pumps) and through energy integration (e.g. waste heat recovery and re-use in other
processes).
An example of the feasibility of generating energy from waste is presented by the study by Mahony
et al., 2002 for the Environmental Protection Authority (EPA) Ireland. This study in Ireland examined
the potential for renewable energy generation using animal manures and other biodegradable
wastes from the agriculture sector as feedstock. Organic waste arisings originate from agricultural
wastes; urban wastewater sludge; biological sludge from food and other industrial wastewater
treatment plants; organic wastes and wastewaters from the food processing, beverage and other
industries; and from the organic waste within municipal solid waste. The focus of the study was to
minimise surface and groundwater, and soil contamination from animal manure and slurry to meet
EU landfill regulation, while exploring also the potential to use phosphorus removed from secondary
effluents of municipal wastewater treatment plants for energy generation.
Tomato juice or processing other products in the same facility may offer further opportunities for
RDM (see LNN Initial Research Note on Tomato Paste).
3.4.1. Industrial symbiosis: using waste energy from other industries to grow
tomatoes
Using energy wasted in some processes for other manufacturing phases has been discussed in
sections above. Furthermore, some experience exists in the UK to go further and use waste energy

Energy Feasibility Study Final report 22
from other industries (industrial symbiosis) to provide heating to ripe tomatoes, for example British
Sugar uses waste heat and CO2 generated when refining sugar (their main business) to help ripe
tomatoes in green-houses, thus producing a large percentage of UK tomatoes.
3.5. Example of tomato nurseries, Worcestershire, and interview with
local tomato grower
A tomato nursery that includes a small facility that makes tomato juice was visited on Monday 26
Oct 2015, and a semi-structured interview was conducted with the owner. The facility includes
three large green-houses growing tomatoes. The footprint of the green-houses is 2 acres which is a
bit less than one hectare (5 acres = 2 Ha). They have no possibility to expand as there is no land
available in the surroundings.
The varieties grown have moved from classic, to loose cherry, to ‘on the vyne’ /truss tomatoes
(which have more waste and less gradable). Thus the waste, which comprising split and misshaped
tomatoes, is now used to make juice. Juice is different to other nearby business like chutney making
in that it does not need onions and cooking, so it does not need massive effort for processing. The
business supplies tomatoes to shops, farm markets and supermarkets, while juice is supplied to pubs
and shops.
3.5.1. Water
The supply of water is from the main water supplier, but there is also a borehole for spring water
that can and is used in one or two green-houses. The other greenhouse uses mains water.
The system works by having a continuous flow of water with feed that fills the sacks (hydroponics)
by gravity, and the water is re-circulated into a tank also by gravity. The water is tested and water,
feed and temperature are all controlled by a computerised system that adds nutrients when needed.
The owner believes maybe water quality changes towards the summer with less dilution of
chemicals because the plants seem to absorb less iron in the houses irrigated with borehole water,
and their leaves become yellow. Ground water could be stored before the summer when its quality
changes, to be used in the summer, but then there is the need for a water tank that would require
water to be maintained and tested.
Local water is high in calcium and nitrogen. It is hard water and they add nitric acid to acidify water
to pH 6. Borehole water is cheaper to pump than to pay for tap/mains water. The water table is
close to surface (only around 8 m deep).
They still use some water from mains water supply even though they could use all spring water for
which they have no limit and is cheap. Before borehole water was used, the water bill was £20,000
per year. With boreholes, they have to pump the water (spending on energy) but the cost of this is
Energy Feasibility Study Final report 23
cheaper than using water from mains, but the owner still considers water is cheap compared with
energy.
If you use trickle irrigation, you don’t need to pay an abstraction licence fee and their water supply
has no limits in the area/region where they are.
Water from tomatoes close circuit is used to irrigate cucumbers too. Nutrients fade at the end of the
season (computer-controlled) and they dispose of water freely.
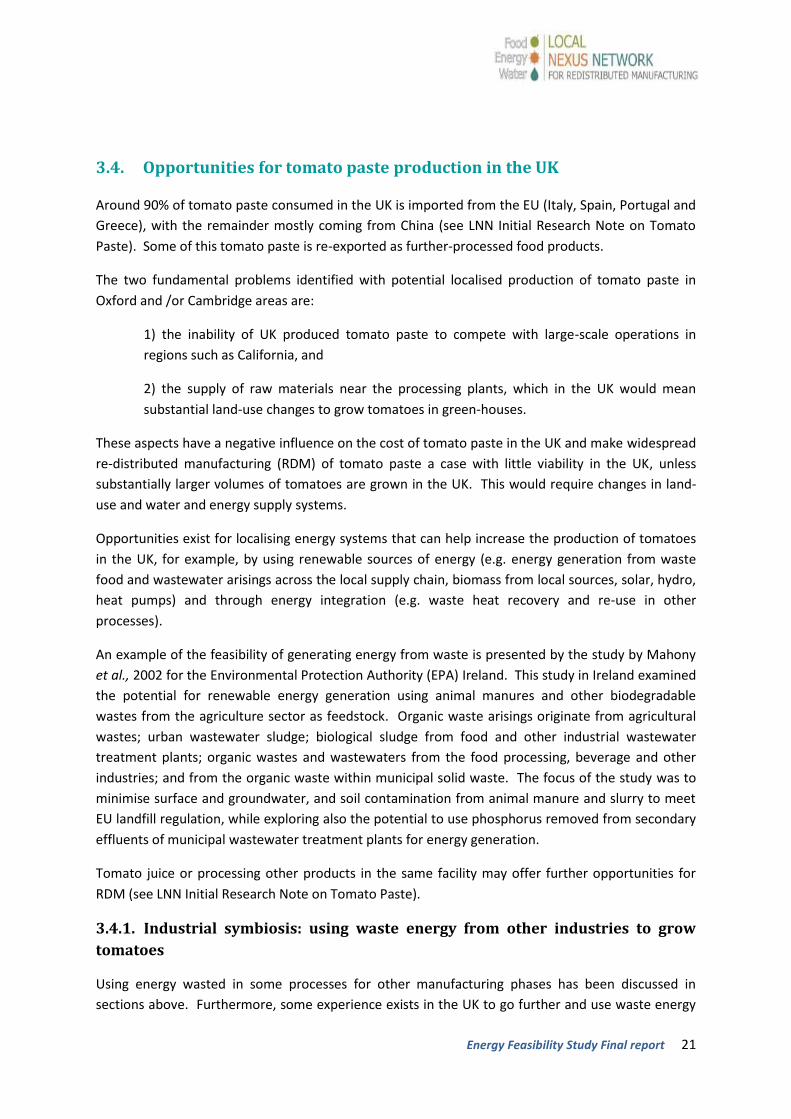
Plates 1 and 2 show tomato plants planted approximately 10 months earlier. Seeds are planted in November
and into greenhouses in December-January. They are then transplanted in early April to hydroponics, where the roots grow in a solution of water and nutrients with no soil required.
3.5.2. Energy
The green-houses have shades/sun screens that together with water, feed and temperature are
controlled by a computerised system. The nurseries’ owner defined themselves as ‘heat importers’
as the green-houses need heat in winter and vents-on in the summer for ventilation as there is too
much humidity and this can lead to fungi growth.

Energy Feasibility Study Final report 24
Each row of tomato plants has a hot water heating pipe that works in a similar way to a normal
central heating where water is heated by a boiler. These pipes (see plate 1) are also used as a rail for
trolleys. The ideal temperature for the greenhouses is 16° C at night and 19° C during the day in all
seasons, from July to the winter months. LED light gives some temperature but heating is still
needed and this is supplied by a coal boiler (see plate 3) and kerosene sometimes. Hardly ever on oil
as this is too expensive. They changed because there was a grant to convert from oil to coal (back in
the 1970s-1980s). This coal is graded (known as shingle), and it is more difficult to find and more
expensive than the coal used in power stations. Their usage is 400 tons of coal in 12 months.
The energy input is significant and the owner sometimes asks himself whether the current way is
cost-effective, and considers whether it would be better to do just one harvest per year in the
summer.
On the other hand, in the hotter months in particular, transpiration is huge especially in the top of
the roof it is very hot and humid, and ventilation is needed which necessitates energy to move vents
and extract air, even with sun/light screens. Transpiration is less in the lower parts where
temperature is cooler.
In terms of efficiencies, the glass of green-houses was replaced 15 years ago with some grants/
funding available and it is recognised that there are better technologies and facilities nowadays. A
similar business has invested around £3 million in continuous LED lighting for green-houses and a
CHP with gas, a fuel that helps reduce the CO2 emissions associated with their crop (gas instead of
coal), and also CO2 emissions can be pumped into the green-house to help tomatoes to ripe more
quickly. New green-house plants have better heating, they are more efficient in terms of heat and
space.
Other synergies or symbiotic processes that could help with energy inputs in this business as well as
in reducing GHG emissions include using heat waste /steamed water from other industries or from
cooling towers for (e.g. obsolete case of Battersea power station in London that provided district
heat for blocks of flats on the opposite side of the River Thames, or the British Coal Nottingham
district heating scheme that provided 3MW of electricity and 80 MW of heat to shops, offices and to
4000 homes (see Drax Group, 2012 and Crook, 1994).
Energy Feasibility Study Final report 25
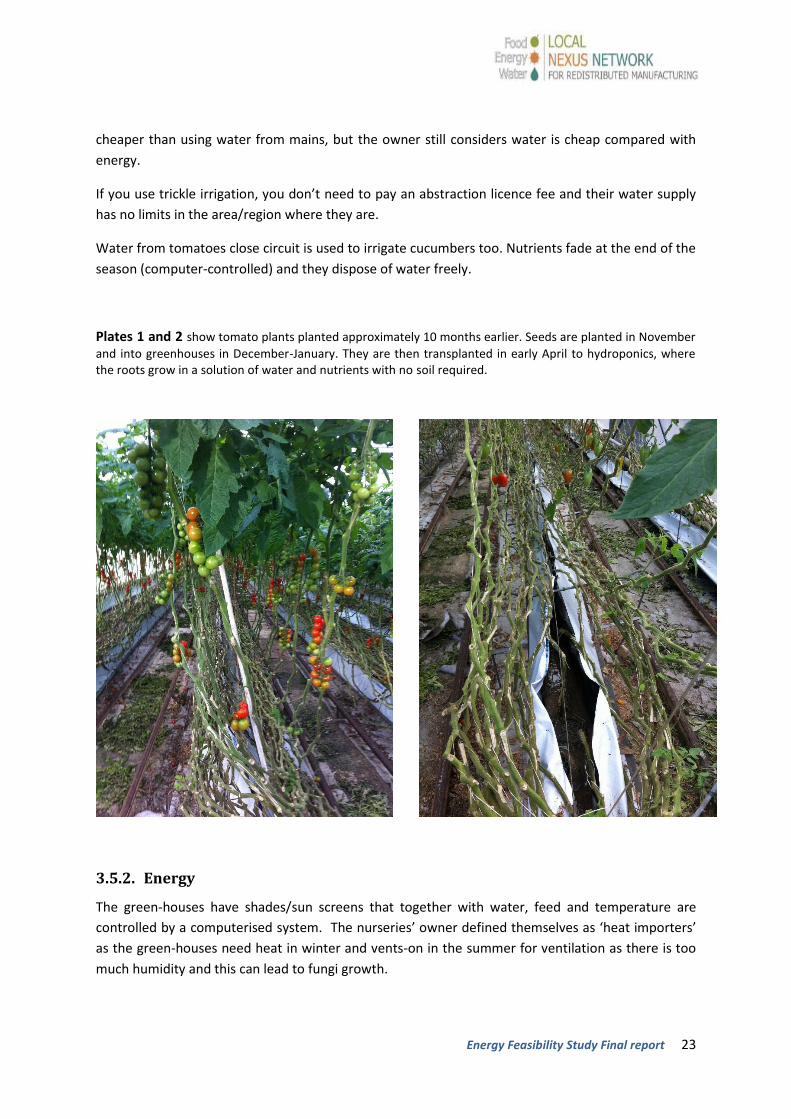
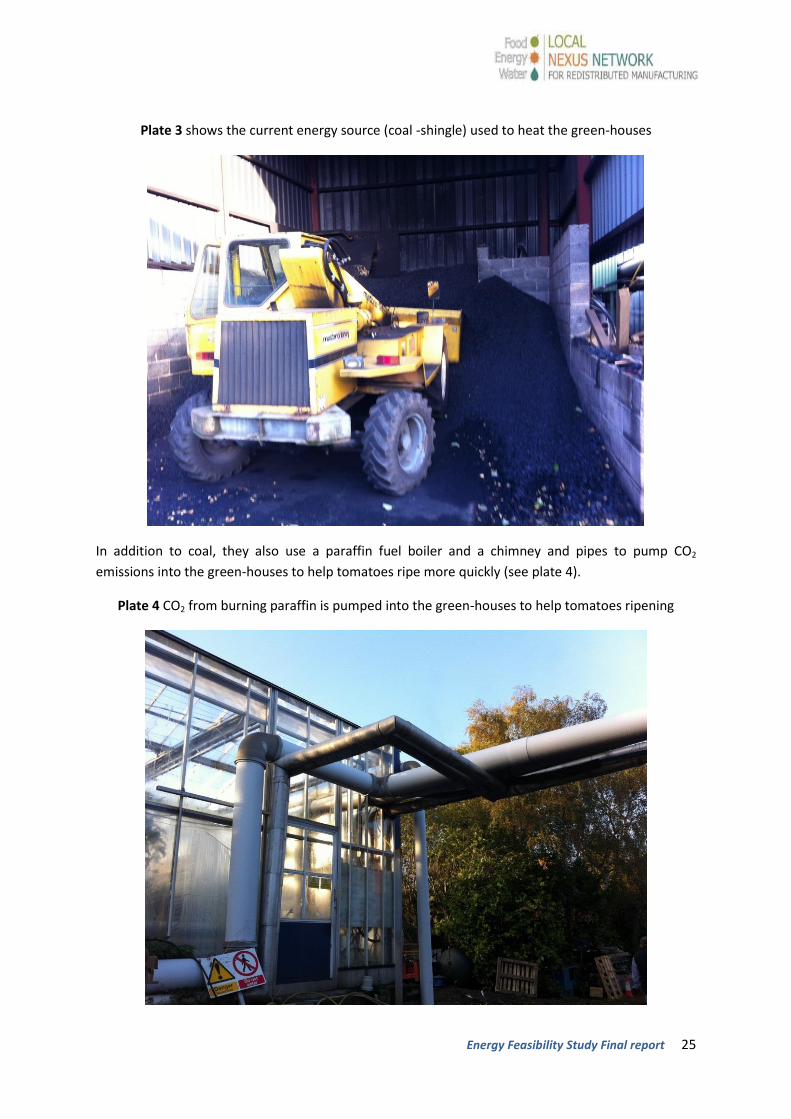
Plate 3 shows the current energy source (coal -shingle) used to heat the green-houses
In addition to coal, they also use a paraffin fuel boiler and a chimney and pipes to pump CO2
emissions into the green-houses to help tomatoes ripe more quickly (see plate 4).
Plate 4 CO2 from burning paraffin is pumped into the green-houses to help tomatoes ripening

Energy Feasibility Study Final report 26
In terms of other sources of energy, the owner acknowledged that it is also possible to use a biomass
/woodchip boiler but this would mean a new heating plant and there are no grants available. There
is some potential to install a Combined Heat and Power (CHP) boiler, and it was reported that 1,000
tons of straw which is equivalent to 2,000 bales of straw as biomass would be needed. Storage
space is an issue for straw-bales, even though this fuel appears the most ready available material
from surrounding areas and thus the most sustainable.
PV panels would need extra land to install as they cannot be installed on the roofs of green-houses
because panels would block the light.
There is potential to use heat from top of green-houses and to capture this heat and store it, for
example in an under-ground water reservoir, to use the heat as needed.
Asked about the potential for coils under the surface of the green-houses (ground sourced heat and
pumps), the owner said this would be low grade heat and blowers may be needed to heat the green-
houses versus the existing system of hot water in rails which is what the farmers are used to. CHPs
and biomass are more familiar to growers, but there is potential to be investigated.
3.5.3. Waste and waste water, and energy from waste
There is reportedly no waste (almost) because split or misshaped tomatoes are used for juice. At
least not enough waste for a CHP probably, nor enough effluent for a biological treatment plant (bio-
digester for effluent treatment before discharging used water into a local watercourse, which
requires a consent to discharge from the Environment Agency, and re-using organic recovered
material as biomass).
In terms of waste, the stems of the plants once the season ends are quite long as they are stretched
and turned around the length of the green house (see plates 1 and 2). They could be used as fuel for
a biomass boiler/ CHP, however the rope used to hold the plants in place is very long too and made
of nylon which makes them unsuitable for incineration (see plates 1 and 2). They are shredded and
taken away for landfill instead.
Biodegradable cord is too thick and it gets entangled, it is difficult to manage and it blocks light due
to its volume because it is much thicker than the nylon cord. This is an area where potential
improvements can be made if an alternative rope of biodegradable material equal in thickness to the
nylon rope can be developed. Then the waste from old plants together with the ropes could be used
as biomass. There may also be some potential in using damaged cardboard packaging also.

Energy Feasibility Study Final report 27
Plate 5 illustrates the packaging used for transportation of ‘on the vyne’ an cherry tomatoes
3.5.4. Juice business model and general aspects
Tomato juice varies depending on the tomato variety used. It is pure squeezed tomato juice. The
acidity is the most important aspect (needs to be below 4.3 and they try to keep it below 4).
Anything above 4.3 they add malic acid (or citric acid) for safety. Cooking temperature and pH are
critical. In Autumn the tomatoes tend to be more acidic.
They nip flower in the vine to make vines shorter, and when tomatoes get ripe, they pick the red
ones at the top for loose tomatoes (too expensive for juice –only split or misshapen tomatoes), and
leave the green ones at the bottom to ripe. If green tomatoes are taken, these can be used for
chutneys.
In terms of energy use for making the juice, this is made in an artisanal way cooking tomatoes in big
pots in a simple home-style kitchen (see plate 6). After bringing the tomatoes to the boil, they have
to be boiling for 20 minutes. After cooking them, filtering the skins out and mashing them, the liquid
is put in glass jars and boiled-pasteurised for 2 hours and then the jars are labelled.
They sell approximately 10,000 bottles/jars per year directly to shops or through whole-sale agents.
90% of the waste tomatoes used to make juice are cherry split tomatoes that would otherwise be
wasted. There is probably more tomato waste among big businesses of tomato growers, and these

Energy Feasibility Study Final report 28
may be used as biomass or in bio-digesters for effluent treatment before discharging into local
watercourses.
Plate 6 the small juice-making facility at a Tomato Nurseries
Energy Feasibility Study Final report 29
4. Energy involved in industrial food processing: the case
of bread
Based on these objectives outlined in the Energy Feasibility Study Profile, existing academic and grey
literature was reviewed and data on energy use for bread, one of the chosen food products to be
examined under the LNN project, were collected from literature, interviews and site visits and are
summarised below.
4.1. Introduction
For the purposes of this project when talking about Bread, this refers to Bread as in unsweetened,
leavened loaves. Typically primary ingredients in the bulk of UK bread are flour from wheat, and
water (60% of total flour in the recipe2) which is therefore the second most important ingredient by
weight added to flour to form dough2. As wheat is the main ingredient for bread, a number of
sources have been examined and data collected which relate to wheat and the energy and green-
house gas (GHG) emissions embedded in growing wheat. These will be detailed in sections below.
The links between water, energy and bread can be considered in the context of the embedded
energy in potable water (e.g. energy for pumping, treating and distributing water), and also there
are important links between water and the production of wheat for bread (e.g. raw materials
cultivation accounts for c. 95% of the water used to produce bread –WRAP, 2013). Water used for
wheat growing in the UK is mainly stored in the soils as green water, but the water-footprint of
wheat can be more significant in water-stressed areas outside the UK where wheat may be irrigated
(e.g. Kansas, Utah, Oregon in the USA).
4.2. Energy and emissions linked to the production of wheat for bread
Wheat is the UK’s most widely grown crop in terms of land area, covering 1.9m ha, or around 30% of
the UK’s arable land. 16.6 million tonnes of wheat were harvested in 2014, with a market value of
£2.4bn3. Of the total harvest, around as much wheat is used for animal feed every year as it is sent
for flour milling. UK wheat yields are amongst the highest in the world, at an average 7.6 tonnes/ ha
compared to a world average of 3 tonnes /ha. This high yield is attributable to the high inputs of
herbicides, fungicides, insecticides, growth regulators, and fertilisers used in the UK2, which is an
important factor to consider in relation to Green-House Gas emissions (GHG).
The use of fertilizers has been seen to be the main cause of GHG emissions in the agricultural stage.
Özilgen and Sorgüven (2011) investigated the production of soybean, sunflower, and olive oils and
found that most of the energy used and CO2 emissions for these products were related to the
agricultural phases as a result of excessive use of fertilizers, and the consumption of diesel, with
2 http://www.bakersassist.nl/rawmaterials
3 See LNN Initial Research Note on BREAD by Julian Cottee, September 2015. DATA from Defra Agriculture in
the UK 2014
Energy Feasibility Study Final report 30
soybean having the most CO2 emissions per ton of seeds due to the intensive use of fertilizers to
grow this crop.
Karakaya and Özilgen (2011) studied the energy and CO2 emissions involved in the production of
various types of tomato-based products in Turkey including packaging, transportation, and waste
management. This study found that chemical fertilizers and transport are the main contributors to
CO2 emissions. Manfredi and Vignali (2014) also found that fertilizers cause the largest
environmental burdens of growing tomatoes to produce tomato paste, and thus the cultivation
phase was found to have higher environmental impacts than the transportation and processing
phases as a result of the use of fertilizers (eutrophication), pesticides and diesel. Transport to
retailers also contributed to environmental impacts quite significantly.
Thus improvements in terms of environmental impacts from the wheat cultivation phase may
include using organic fertilizers instead of mineral ones and optimizing energy use (e.g. machinery
diesel).
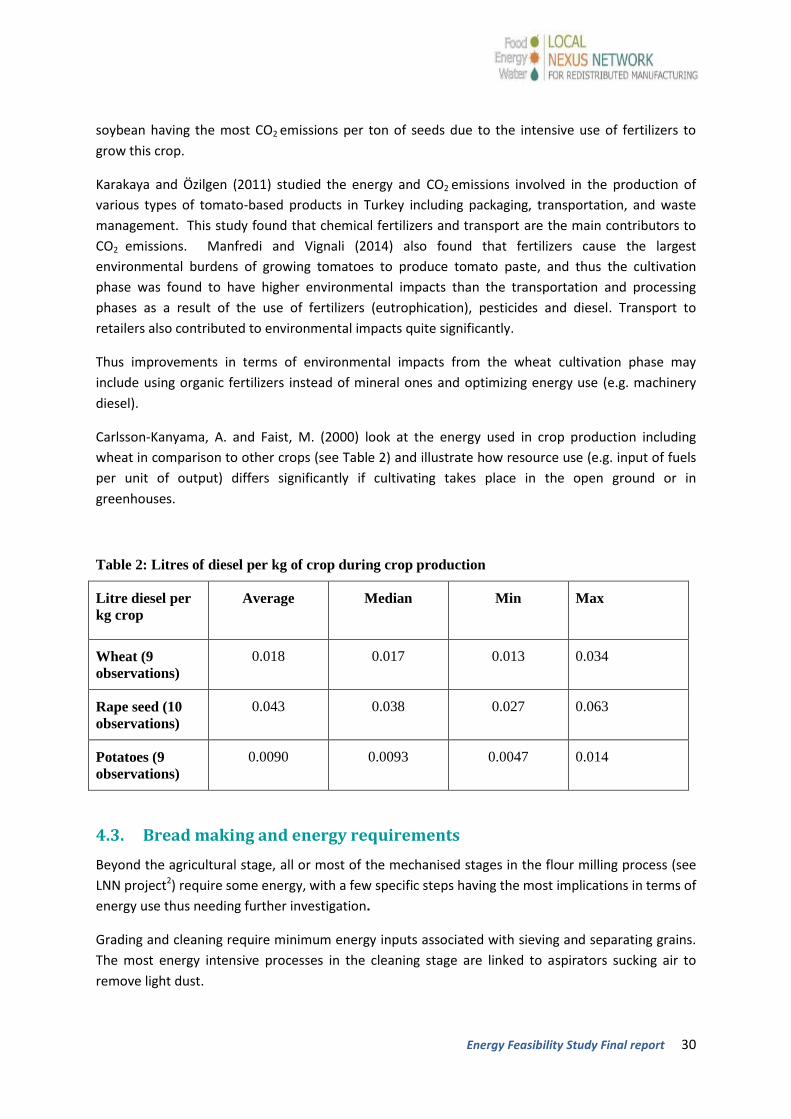
Carlsson-Kanyama, A. and Faist, M. (2000) look at the energy used in crop production including
wheat in comparison to other crops (see Table 2) and illustrate how resource use (e.g. input of fuels
per unit of output) differs significantly if cultivating takes place in the open ground or in
greenhouses.
Table 2: Litres of diesel per kg of crop during crop production
Litre diesel per
kg crop
Average Median
Min
Max
Wheat (9
observations)
0.018 0.017 0.013 0.034
Rape seed (10
observations)
0.043 0.038 0.027 0.063
Potatoes (9
observations)
0.0090 0.0093 0.0047 0.014
4.3. Bread making and energy requirements
Beyond the agricultural stage, all or most of the mechanised stages in the flour milling process (see
LNN project2) require some energy, with a few specific steps having the most implications in terms of
energy use thus needing further investigation.
Grading and cleaning require minimum energy inputs associated with sieving and separating grains.
The most energy intensive processes in the cleaning stage are linked to aspirators sucking air to
remove light dust.

Energy Feasibility Study Final report 31
Conditioning (tempering) is the process whereby water is added to soften the wheat, making it
easier to process. Warm (46°C water for 60-90 minutes) and hot (60°C water or steam) conditioning
have some implications in terms of the embedded energy in potable water plus the energy required
to warm water to high temperatures.
There are also some energy requirements for mechanical processes such as blending, breaking into
middlings, separation/purification of middlings, grinding of middlings into flour by large smooth
metal rollers, and packing into bags for industrial, commercial or household use.
Furthermore, there are important implications in terms of energy involved in most stages of the
baking process, including mixing, proving / fermenting, baking itself (high /very high energy
requirements), and cooling. Both the proving / fermenting and cooling processes may have the
potential for energy-heat recovery and re-use in other processes such as for example the cooking
step).
In relation to the fermenting process of commercial bread produced in the UK, the Chorleywood
Bread Process (CBP) invented in the 1960s is used for most bagged sliced industrial bread on sale.
The more traditional Bulk Fermentation Process (BFP) is used by some smaller commercial bakers
and craft bakers2. While traditional bulk fermentation requires around 3 hours of fermentation
time, the innovation of the CBP was introducing a significant level of mechanical energy, and adding
a mixture of chemicals to the dough, extra water and hard fats so that the fermentation time was
reduced significantly. The whole baking process is reduced from 5 plus hours in the traditional BFP
to 3.5 hours in the CBP, and specifically in terms of dough cooking the CBP only requires 17 to 25
minutes for baking, compared to 30 min in the BFP2. Shortening the fermentation and cooking times
is important in terms of energy inputs, although more water and chemicals are needed.
As detailed above most of the national bread in the UK is baked following the CBP method in large
centralised manufacturing facilities that sell to supermarkets and a minority of independent shops,
versus 1-2% of local/artisanal/craft bread produced at the local scale in the UK.
The amount of energy used, energy intensities (energy consumption per unit output), as well as the
emissions involved in bread making are different for centrally produced large scale industrial bread
and for artisanal/craft bread manufactured at the local level. The bread study case is on-going and
defining the system, its boundaries and the various supply chain configurations including for
redistributed manufacturing of bread will be necessary in order to analyse the system’s energy
implications in any detail.
Available literature on energy and potential energy efficiencies in making bread has been reviewed,
and the energy /energy intensity and emissions data below are taken from recent studies on wheat
and industrially manufactured bread for the UK and elsewhere. Furthermore, interviews with local
wheat mills and a local bakery have taken place and the main findings are included below.
Energy Feasibility Study Final report 32
4.4. Studies/data available on energy involved in bread making in the UK
4.4.1. Energy used in food manufacturing in the UK
Industry produces approximately 125 million tonnes of CO2 (MtCO2) per year which is equivalent to
25% of the UK’s total emissions4. According to the Carbon Trust (2010), savings of 4-6 MtCO2 (up to
4% of current emissions) could be realistically achieved in industry with appropriate interventions.
Within this context, Tassou, Kolokotroni, Gowreesunker et al., (2014) offer an extensive literature
review of the UK’s food manufacturing sector reporting that this accounts for 15% (60 TWh) of the
total food-chain energy use, producing 13 Mt of CO2 equivalent emissions (Mt CO2e).
Based on their review of existing studies, Tassou, Kolokotroni, Gowreesunker et al., (2014) offer a
breakdown of the type of fuel used in food manufacturing as 61% natural gas, 31% electricity, 6%
petroleum, with fuel oil and coal accounting for the rest. They also report that the majority
(approximately 68%) of the energy is used by fuel-fired boilers and heating systems for process and
space heating, 16% of the energy used is electrical energy used by electric motors, 8% is used by
electric heating, 6% by refrigeration equipment and the rest by air compressors.
This paper also reports that the energy consumption figures indicate that 80% of the carbon
emissions in food manufacturing are linked to only a few products including bread and fresh
pastries, beer and alcoholic beverages, and the production of cheese, dairy, meat and poultry
products. They also highlight the vast amounts of food waste that is mainly landfilled. The authors
point out the need to use resources more efficiently to minimise waste, to the potential for
producing by-products and for energy recovering from waste (via efficient incineration, gasification,
pyrolysis or anaerobic digestion), and to the need to improve technologies such as processing
equipment, refrigeration, boilers, ovens, pumps, space heating and lighting. They also indicate that
energy can be saved at the processing plant level by optimising and integrating processes and
systems.
4.4.2. Energy and green-house gas (GHG) emissions of growing wheat in the UK
In the UK, the Department for Environment Food and Rural Affairs (DEFRA) commissioned a study by
Cranfield University that using Life Cycle Assessment (LCA) investigated the resource use and
environmental impacts of 10 common agricultural and horticultural commodities including wheat
(see Williams et al., 2006). The study found that producing bread wheat (only 0.7% of which is
organic) consumes 2.5 gigajoules (GJ5) of primary energy per tonne of wheat (1.7 GJ per tonne of
organic wheat), and produces 0.80 t CO2 (projected global warming potential over 100 years) per
tonne of wheat.
4 http://www.carbontrust.com/client-services/technology/innovation/industrial-energy-efficiency-accelerator
5 1GJ (Gigajoule)=277.7 kWh, thus 2.5 GJ is the same as 694 kWh of energy used per tonne of bread wheat.
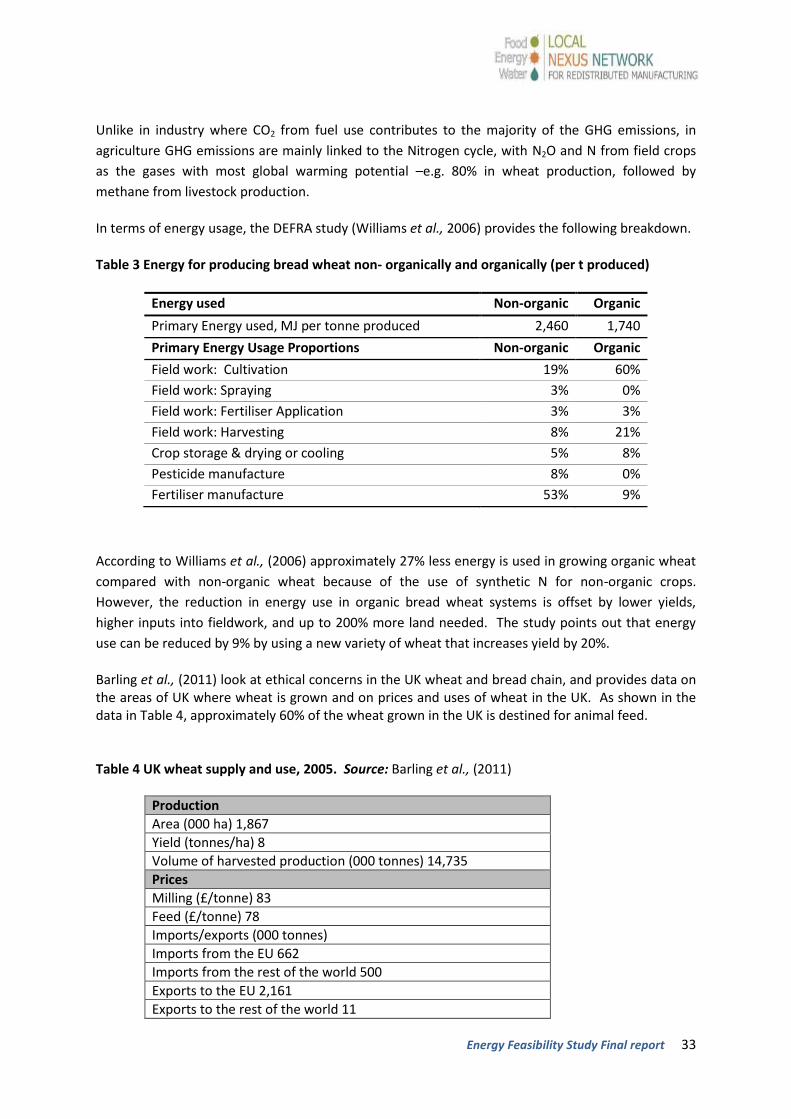
Energy Feasibility Study Final report 33
Unlike in industry where CO2 from fuel use contributes to the majority of the GHG emissions, in
agriculture GHG emissions are mainly linked to the Nitrogen cycle, with N2O and N from field crops
as the gases with most global warming potential –e.g. 80% in wheat production, followed by
methane from livestock production.
In terms of energy usage, the DEFRA study (Williams et al., 2006) provides the following breakdown.
Table 3 Energy for producing bread wheat non- organically and organically (per t produced)
Energy used Non-organic Organic
Primary Energy used, MJ per tonne produced 2,460 1,740
Primary Energy Usage Proportions Non-organic Organic
Field work: Cultivation 19% 60%
Field work: Spraying 3% 0%
Field work: Fertiliser Application 3% 3%
Field work: Harvesting 8% 21%
Crop storage & drying or cooling 5% 8%
Pesticide manufacture 8% 0%
Fertiliser manufacture 53% 9%
According to Williams et al., (2006) approximately 27% less energy is used in growing organic wheat
compared with non-organic wheat because of the use of synthetic N for non-organic crops.
However, the reduction in energy use in organic bread wheat systems is offset by lower yields,
higher inputs into fieldwork, and up to 200% more land needed. The study points out that energy
use can be reduced by 9% by using a new variety of wheat that increases yield by 20%.
Barling et al., (2011) look at ethical concerns in the UK wheat and bread chain, and provides data on the areas of UK where wheat is grown and on prices and uses of wheat in the UK. As shown in the data in Table 4, approximately 60% of the wheat grown in the UK is destined for animal feed. Table 4 UK wheat supply and use, 2005. Source: Barling et al., (2011)
Production
Area (000 ha) 1,867
Yield (tonnes/ha) 8
Volume of harvested production (000 tonnes) 14,735
Prices
Milling (£/tonne) 83
Feed (£/tonne) 78
Imports/exports (000 tonnes)
Imports from the EU 662
Imports from the rest of the world 500
Exports to the EU 2,161
Exports to the rest of the world 11
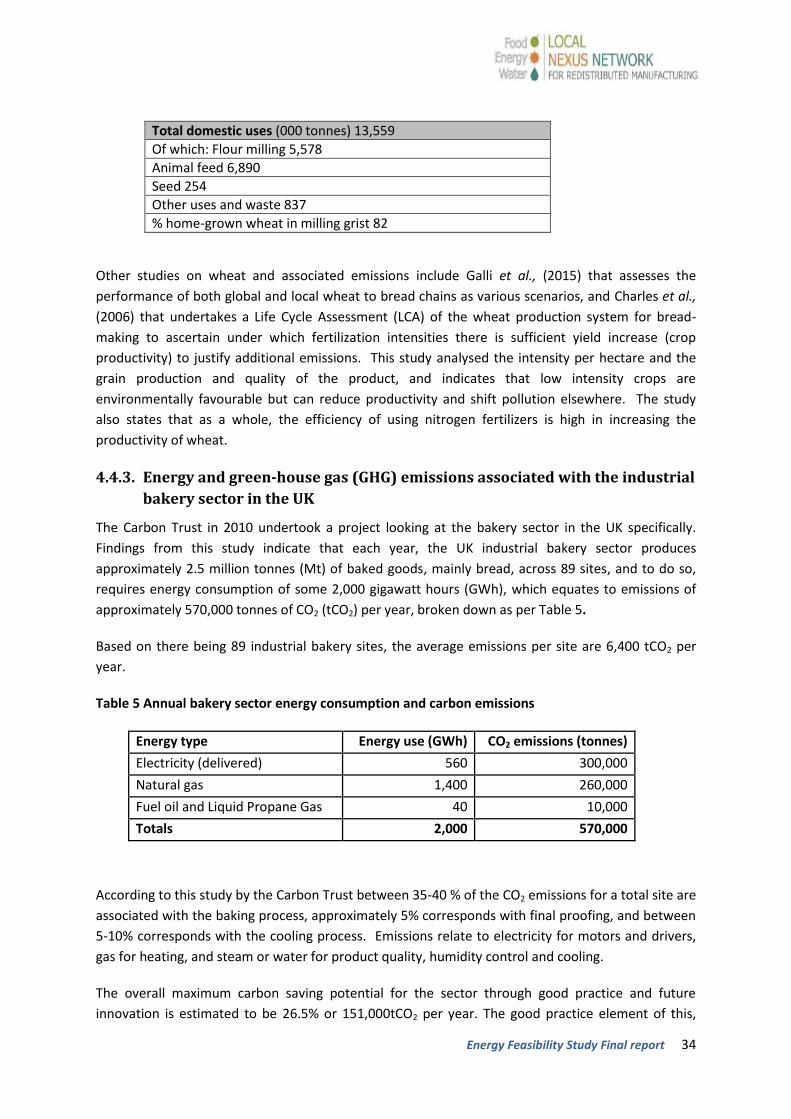
Energy Feasibility Study Final report 34
Total domestic uses (000 tonnes) 13,559
Of which: Flour milling 5,578
Animal feed 6,890
Seed 254
Other uses and waste 837
% home-grown wheat in milling grist 82
Other studies on wheat and associated emissions include Galli et al., (2015) that assesses the
performance of both global and local wheat to bread chains as various scenarios, and Charles et al.,
(2006) that undertakes a Life Cycle Assessment (LCA) of the wheat production system for bread-
making to ascertain under which fertilization intensities there is sufficient yield increase (crop
productivity) to justify additional emissions. This study analysed the intensity per hectare and the
grain production and quality of the product, and indicates that low intensity crops are
environmentally favourable but can reduce productivity and shift pollution elsewhere. The study
also states that as a whole, the efficiency of using nitrogen fertilizers is high in increasing the
productivity of wheat.
4.4.3. Energy and green-house gas (GHG) emissions associated with the industrial
bakery sector in the UK
The Carbon Trust in 2010 undertook a project looking at the bakery sector in the UK specifically.
Findings from this study indicate that each year, the UK industrial bakery sector produces
approximately 2.5 million tonnes (Mt) of baked goods, mainly bread, across 89 sites, and to do so,
requires energy consumption of some 2,000 gigawatt hours (GWh), which equates to emissions of
approximately 570,000 tonnes of CO2 (tCO2) per year, broken down as per Table 5.
Based on there being 89 industrial bakery sites, the average emissions per site are 6,400 tCO2 per
year.
Table 5 Annual bakery sector energy consumption and carbon emissions
Energy type Energy use (GWh) CO2 emissions (tonnes)
Electricity (delivered) 560 300,000
Natural gas 1,400 260,000
Fuel oil and Liquid Propane Gas 40 10,000
Totals 2,000 570,000
According to this study by the Carbon Trust between 35-40 % of the CO2 emissions for a total site are
associated with the baking process, approximately 5% corresponds with final proofing, and between
5-10% corresponds with the cooling process. Emissions relate to electricity for motors and drivers,
gas for heating, and steam or water for product quality, humidity control and cooling.
The overall maximum carbon saving potential for the sector through good practice and future
innovation is estimated to be 26.5% or 151,000tCO2 per year. The good practice element of this,
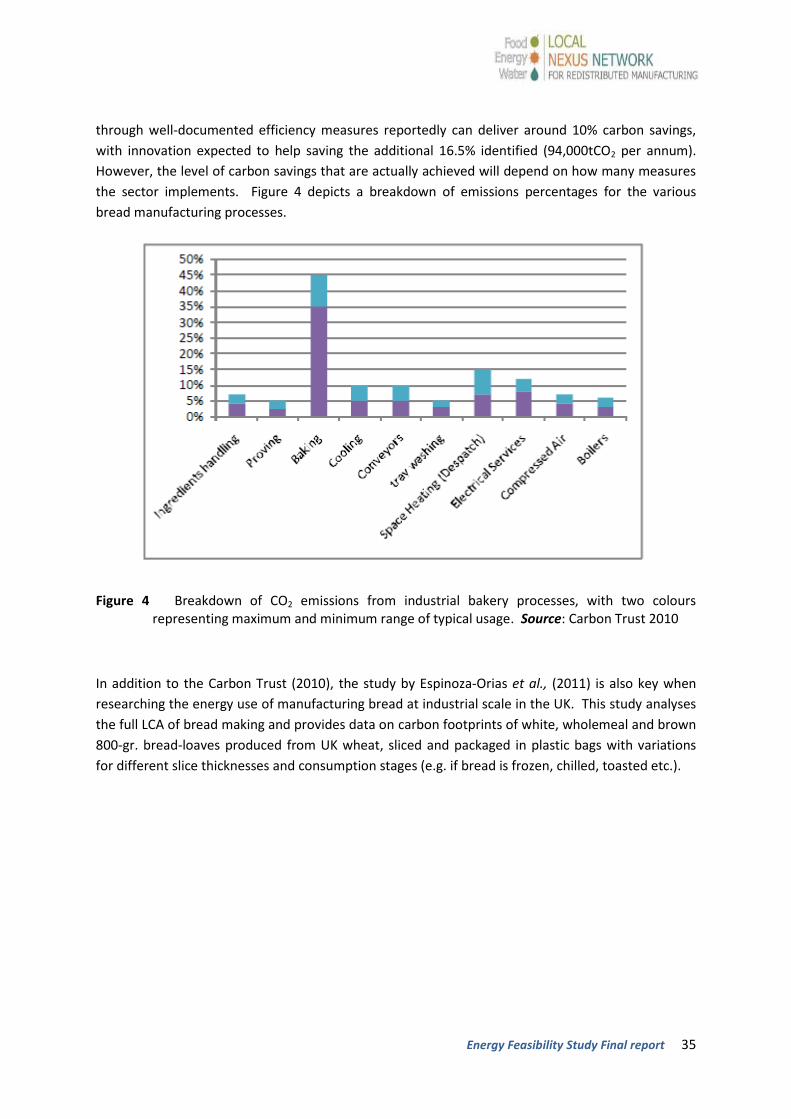
Energy Feasibility Study Final report 35
through well-documented efficiency measures reportedly can deliver around 10% carbon savings,
with innovation expected to help saving the additional 16.5% identified (94,000tCO2 per annum).
However, the level of carbon savings that are actually achieved will depend on how many measures
the sector implements. Figure 4 depicts a breakdown of emissions percentages for the various
bread manufacturing processes.
Figure 4 Breakdown of CO2 emissions from industrial bakery processes, with two colours representing maximum and minimum range of typical usage. Source: Carbon Trust 2010
In addition to the Carbon Trust (2010), the study by Espinoza-Orias et al., (2011) is also key when
researching the energy use of manufacturing bread at industrial scale in the UK. This study analyses
the full LCA of bread making and provides data on carbon footprints of white, wholemeal and brown
800-gr. bread-loaves produced from UK wheat, sliced and packaged in plastic bags with variations
for different slice thicknesses and consumption stages (e.g. if bread is frozen, chilled, toasted etc.).
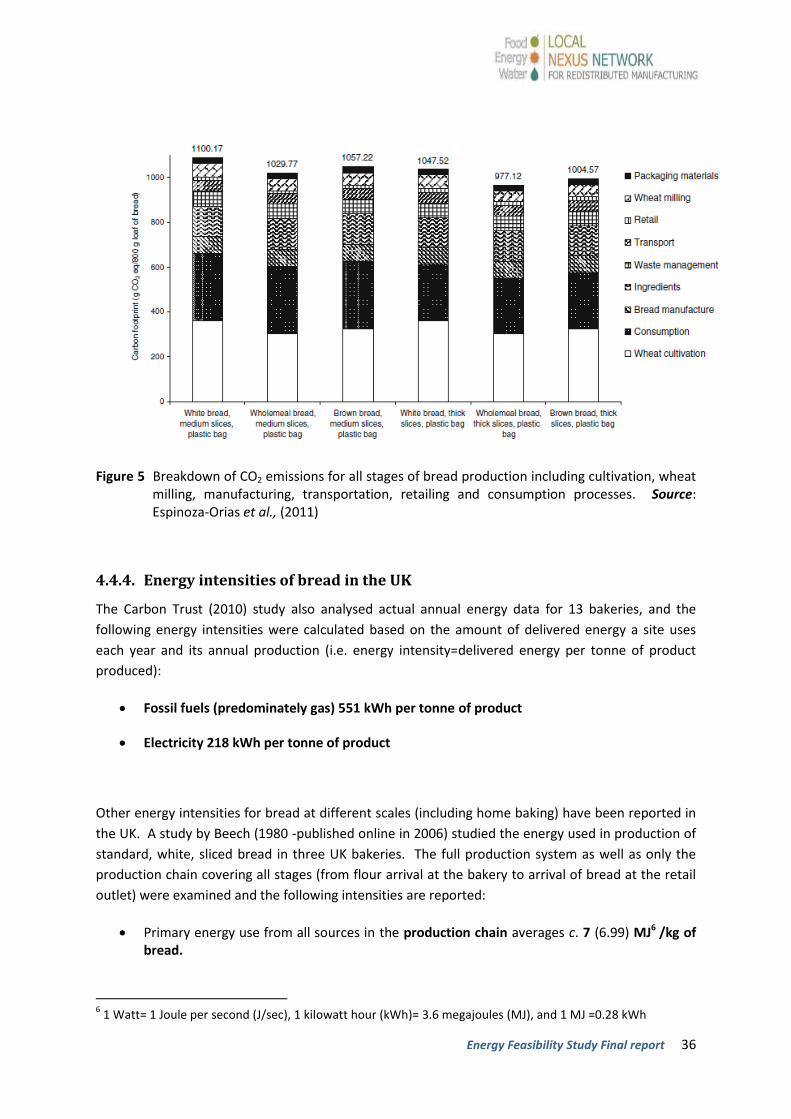
Energy Feasibility Study Final report 36
Figure 5 Breakdown of CO2 emissions for all stages of bread production including cultivation, wheat milling, manufacturing, transportation, retailing and consumption processes. Source: Espinoza-Orias et al., (2011)
4.4.4. Energy intensities of bread in the UK
The Carbon Trust (2010) study also analysed actual annual energy data for 13 bakeries, and the
following energy intensities were calculated based on the amount of delivered energy a site uses
each year and its annual production (i.e. energy intensity=delivered energy per tonne of product
produced):
Fossil fuels (predominately gas) 551 kWh per tonne of product
Electricity 218 kWh per tonne of product
Other energy intensities for bread at different scales (including home baking) have been reported in
the UK. A study by Beech (1980 -published online in 2006) studied the energy used in production of
standard, white, sliced bread in three UK bakeries. The full production system as well as only the
production chain covering all stages (from flour arrival at the bakery to arrival of bread at the retail
outlet) were examined and the following intensities are reported:
Primary energy use from all sources in the production chain averages c. 7 (6.99) MJ6 /kg of bread.
6 1 Watt= 1 Joule per second (J/sec), 1 kilowatt hour (kWh)= 3.6 megajoules (MJ), and 1 MJ =0.28 kWh
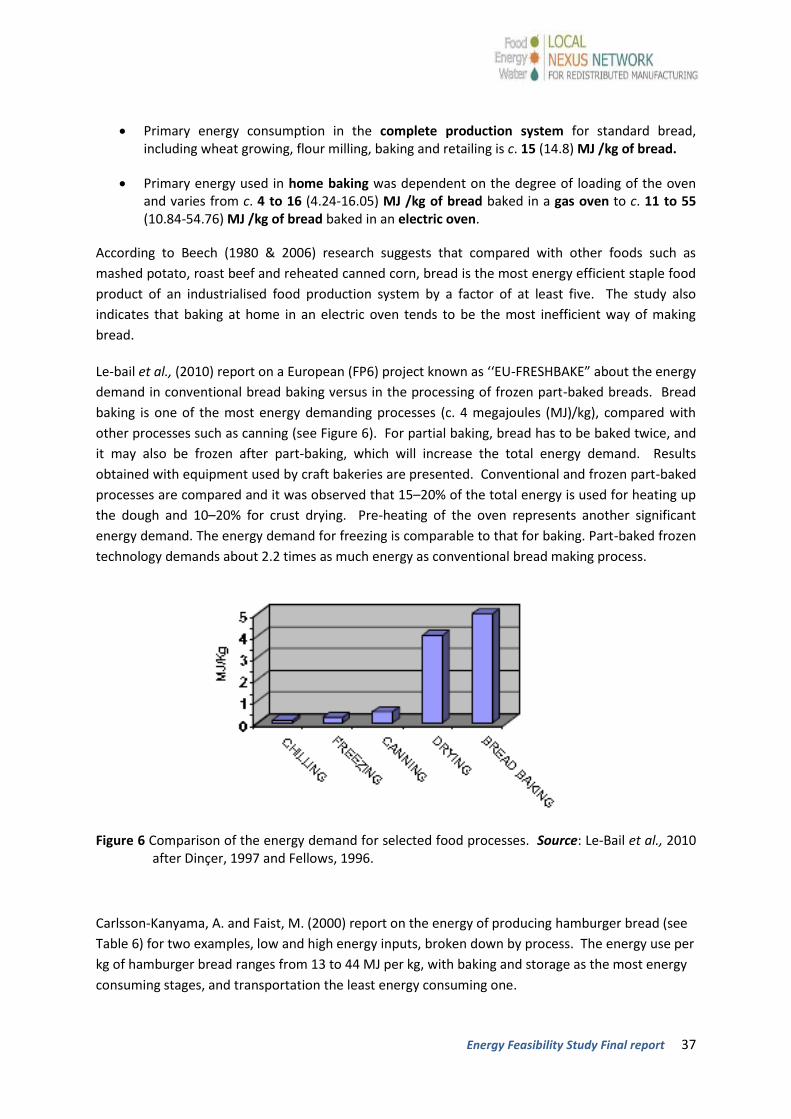
Energy Feasibility Study Final report 37
Primary energy consumption in the complete production system for standard bread, including wheat growing, flour milling, baking and retailing is c. 15 (14.8) MJ /kg of bread.
Primary energy used in home baking was dependent on the degree of loading of the oven and varies from c. 4 to 16 (4.24-16.05) MJ /kg of bread baked in a gas oven to c. 11 to 55 (10.84-54.76) MJ /kg of bread baked in an electric oven.
According to Beech (1980 & 2006) research suggests that compared with other foods such as
mashed potato, roast beef and reheated canned corn, bread is the most energy efficient staple food
product of an industrialised food production system by a factor of at least five. The study also
indicates that baking at home in an electric oven tends to be the most inefficient way of making
bread.
Le-bail et al., (2010) report on a European (FP6) project known as ‘‘EU-FRESHBAKE” about the energy
demand in conventional bread baking versus in the processing of frozen part-baked breads. Bread
baking is one of the most energy demanding processes (c. 4 megajoules (MJ)/kg), compared with
other processes such as canning (see Figure 6). For partial baking, bread has to be baked twice, and
it may also be frozen after part-baking, which will increase the total energy demand. Results
obtained with equipment used by craft bakeries are presented. Conventional and frozen part-baked
processes are compared and it was observed that 15–20% of the total energy is used for heating up
the dough and 10–20% for crust drying. Pre-heating of the oven represents another significant
energy demand. The energy demand for freezing is comparable to that for baking. Part-baked frozen
technology demands about 2.2 times as much energy as conventional bread making process.
Figure 6 Comparison of the energy demand for selected food processes. Source: Le-Bail et al., 2010 after Dinçer, 1997 and Fellows, 1996.
Carlsson-Kanyama, A. and Faist, M. (2000) report on the energy of producing hamburger bread (see
Table 6) for two examples, low and high energy inputs, broken down by process. The energy use per
kg of hamburger bread ranges from 13 to 44 MJ per kg, with baking and storage as the most energy
consuming stages, and transportation the least energy consuming one.
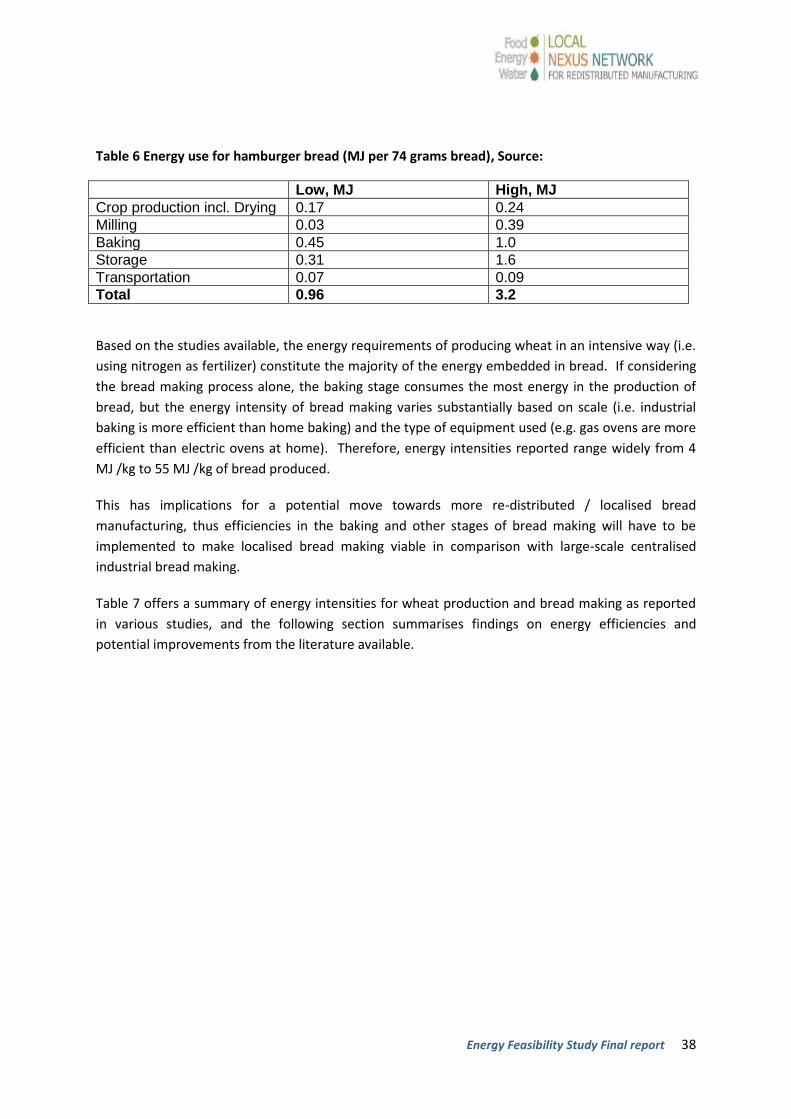
Energy Feasibility Study Final report 38
Table 6 Energy use for hamburger bread (MJ per 74 grams bread), Source:
Low, MJ High, MJ
Crop production incl. Drying 0.17 0.24
Milling 0.03 0.39
Baking 0.45 1.0
Storage 0.31 1.6
Transportation 0.07 0.09
Total 0.96 3.2
Based on the studies available, the energy requirements of producing wheat in an intensive way (i.e.
using nitrogen as fertilizer) constitute the majority of the energy embedded in bread. If considering
the bread making process alone, the baking stage consumes the most energy in the production of
bread, but the energy intensity of bread making varies substantially based on scale (i.e. industrial
baking is more efficient than home baking) and the type of equipment used (e.g. gas ovens are more
efficient than electric ovens at home). Therefore, energy intensities reported range widely from 4
MJ /kg to 55 MJ /kg of bread produced.
This has implications for a potential move towards more re-distributed / localised bread
manufacturing, thus efficiencies in the baking and other stages of bread making will have to be
implemented to make localised bread making viable in comparison with large-scale centralised
industrial bread making.
Table 7 offers a summary of energy intensities for wheat production and bread making as reported
in various studies, and the following section summarises findings on energy efficiencies and
potential improvements from the literature available.
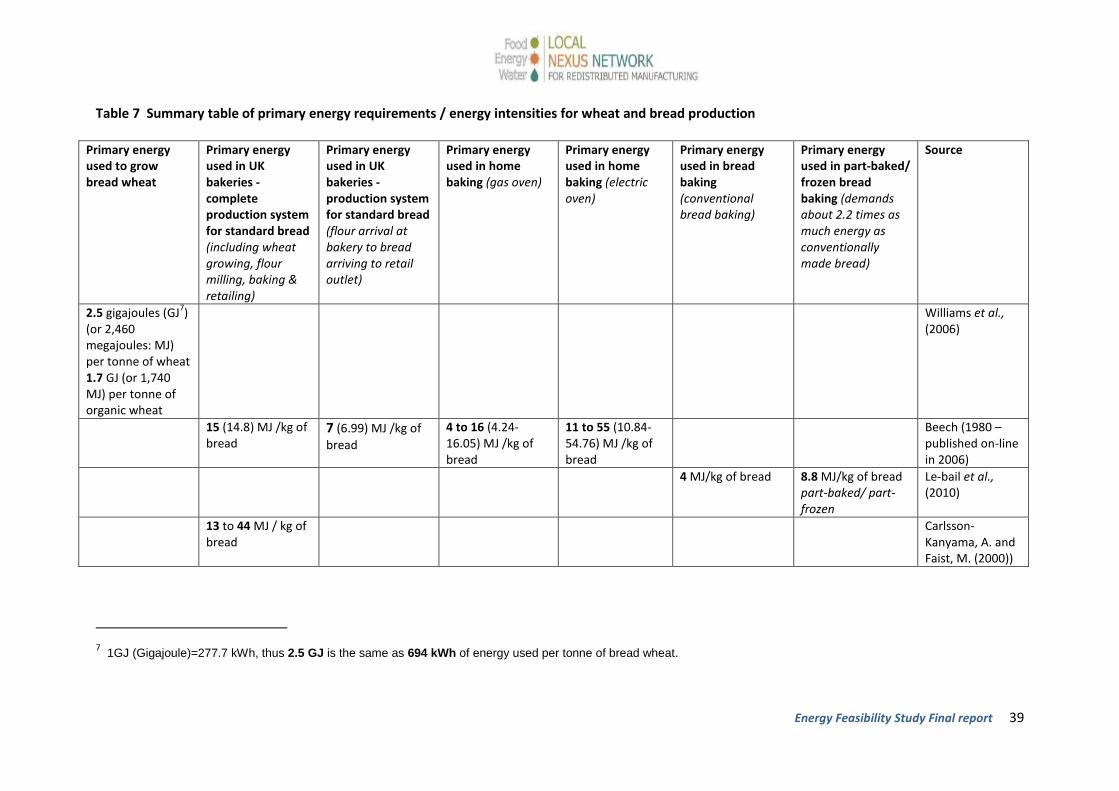
Energy Feasibility Study Final report 39
Table 7 Summary table of primary energy requirements / energy intensities for wheat and bread production
Primary energy used to grow bread wheat
Primary energy used in UK bakeries -complete production system for standard bread (including wheat growing, flour milling, baking & retailing)
Primary energy used in UK bakeries -production system for standard bread (flour arrival at bakery to bread arriving to retail outlet)
Primary energy used in home baking (gas oven)
Primary energy used in home baking (electric oven)
Primary energy used in bread baking (conventional bread baking)
Primary energy used in part-baked/ frozen bread baking (demands about 2.2 times as much energy as conventionally made bread)
Source
2.5 gigajoules (GJ7)
(or 2,460 megajoules: MJ) per tonne of wheat 1.7 GJ (or 1,740 MJ) per tonne of organic wheat
Williams et al., (2006)
15 (14.8) MJ /kg of bread
7 (6.99) MJ /kg of
bread
4 to 16 (4.24-16.05) MJ /kg of bread
11 to 55 (10.84-54.76) MJ /kg of bread
Beech (1980 –published on-line in 2006)
4 MJ/kg of bread 8.8 MJ/kg of bread part-baked/ part-frozen
Le-bail et al., (2010)
13 to 44 MJ / kg of bread
Carlsson-Kanyama, A. and Faist, M. (2000))
7 1GJ (Gigajoule)=277.7 kWh, thus 2.5 GJ is the same as 694 kWh of energy used per tonne of bread wheat.

Energy Feasibility Study Final report 40
4.4.5. Emissions associated with bread in the UK
When looking at the emissions specifically associated with bread in the UK, according to WRAP
(2013) bread baking (at plant, in-store or at home) is reported to be responsible for 20% of the GHG
emissions of bread, while user behaviour (bread freezing and toasting) and appliance use contribute
25% of the total GHG emissions, and fertiliser use in wheat growing accounts for 25% of the total
GHG emissions.
On the water footprint of bread, wheat cultivation accounts for over 95% of lifecycle water use of
bread in the UK. On bread wasted in the home, WRAP reports that about 660,000 tonnes of bread
(worth £640 million) is wasted in UK homes every year.
4.4.6. Energy efficiencies in the bakery sector
In terms of energy efficiency studies in the bakery sector, the Carbon Trust (2010) study on industrial
bread making in the UK points out to energy savings derived from well-tested efficiencies and
innovative opportunities for carbon emissions reduction across four areas: improving oven
combustion efficiency, reducing thermal mass of baking tins, improving control of oven and cooler
electrical equipment, and recovering oven heat.
However, in line with other studies reported in Table 3, the Carbon Trust study (2010) also shows
that there is significant variation in the specific energy consumption depending on differences in the
baking operations (e.g. product formulation and type/s of product, production volumes, operating
hours), plant technology (e.g. degree of automation, efficiency controls on process and space
heating systems), and site location which influences heating demands.
Potential areas for improving energy performance in bread making plants are reportedly driven by
compliance with regulations, cost control and corporate responsibility, and include actions such as:
turn-off and energy awareness campaigns for conveyors
monitoring and targeting programmes
shutdown procedures for provers, ovens, coolers
improved insulation of major process plant such as ovens and provers
improved insulation of steam and chilled water distribution systems
compressed air management practices and more efficient/less leakage in air compressor plant, including:
o variable speed drives (VSDs) on bakery ventilation systems
o reducing the amount of air entering despatch areas – by improving seals and air curtains
high-efficiency lighting applications and occupancy control of lights in lower use areas such as offices, meeting rooms, stores and plant rooms
space heating control improvements – office wet systems temperature compensation and boiler optimisation; process area convector heater advanced controls

Energy Feasibility Study Final report 41
Based on the literature, various types of efficiencies in systems are possible and could result in the
following reductions in emissions summarised in Table 8.
Table 8 Possible reduction in emissions as a result of efficiencies in systems (Source: Carbon Trust,
2010)
Improve ovens combustion efficiency
Reduce thermal mass of baking tins
Integrated electrical control
Heat recovery from ovens
Cooler Oven
Estimated project payback for each site (years) 3 - 4 4.5 6
Average CO2 saving -site level (tCO2/yr) 196 70-115 65 55 234
Percentage of site the technology can be applied 100 100 100 100 100
Maximum CO2 savings (tCO2/yr) -assumes max take-
up 17466 6164 5761 4935 20805
Market penetration over 10 years 50% 50% 75% 30% 50%
It should be noted that according to the breakdown for the bread manufacturing phase reported by
the Carbon Trust (2010), the largest portion of CO2 emissions from industrially manufactured bread
(35% to 45% of the total, see Figure 4) are attributed to the baking process, and it is assumed this
represents a similar proportion of the total energy use. The UK’s bread leading producers Kingsmill8,
using a ‘cradle to grave’ approach that includes wheat growing, packaging, retail etc. report that 18%
of all total energy involved in bread is associated with bread processing.
Further research has recently been developed in some of these areas, for example, Patton (2013)
focused his research in investigating ways of improving the efficiency of industrial processes
associated with commercial bread-making. Patton looked at the energy used in bread
manufacturing in order to provide solutions to improve efficiency in commercial bakeries as well as
to reduce their environmental impact. Paton identified that between 40 and 49 % of heat is wasted
in industrial ovens, and that the proofing (or proving) process, where dough is exposed to specific
amounts of heat and humidity to activate yeast, is responsible for 5 % of carbon emissions in
bakeries. He identified that standard practices use large volumes of air-flows and provers are over-
engineered affecting energy costs, even though the need for such air-flows is not scientifically
justified. Using simulations of various air changes in experiments, this research indicates that
efficiencies can be made in the ‘proofing stage’ and that it is possible to reduce airflow by 33 % and
electricity demand by over 70%.
The Carbon Trust study by Ashcroft (2015a) reports on recently commissioned work on improving
the efficiency of bakery ovens, by undertaking experimental research in a single chamber test-oven
with a fixed speed set-up. This research indicates that up to 42% of energy savings could be
8 http://www.kingsmillbread.com/fresh-thinking/environment/carbon-footprint

Energy Feasibility Study Final report 42
achieved by optimising flue gas, i.e. by minimising excess air and balancing this with exhaust gas
exiting to the atmosphere via a flue or conveying pipe from this kind of oven. The Carbon Trust in
2015b reports on further work undertaken in collaboration with an industrial bread manufacturer to
replicate and scale up the experimental test to industrial ovens (typically three-zone ovens in a
modern commercial bakery with lower heat losses and the same heat load for long periods). The
industrial tests involved improved ventilation in ovens through the use of variable speed drives and
sensors that match exhaust fans to the volume of gases produced within the ovens. Results from
these industry trials demonstrate that this technology could provide gas savings of 4.7% in
commercial bread baking plants by linking variable speed drives with combustion control.
4.4.7. Summary of the energy implications of making bread in the UK
The following main findings have been summarised from the studies on energy consumption for part
or the whole of the life cycle of the production of standard bread in the UK detailed in the sections
above. In the work by Beech published in 1980, he estimated the primary energy consumption for
growing bread wheat to c. 4 MJ/kg bread (out of the total consumption of c. 15 MJ/kg bread for
wheat production, milling, baking and keeping in shops), which is significantly higher than 2.5 MJ/kg
wheat, an estimate for standard bread wheat growth from a more recent study by Williams et al.,
(2006). The latter work also presented an estimate of 1.7 MJ/kg organic wheat, the reduction
compared to the standard wheat is mainly because of the avoided use of synthetic nitrogen
fertilizers. However, the reduction in energy use in organic bread wheat systems is offset by lower
yields, higher inputs into fieldwork, and up to 200% more land needed.
Among the manufacturing steps, the baking process appears to be most energy-intensive. Beech
(1980) estimated the primary energy consumption of standard industrial making to c. 7 MJ/kg bread.
In comparison, the Carbon Trust (2010) study analysed actual annual energy data for 13 bakeries,
and the following energy intensities were calculated based on the amount of delivered energy a site
uses each year and its annual production, with estimates of 551 kWh of fossil fuels (predominately
gas) and 218 kWh of electricity, per tonne of product. Assuming a 35% conversion rate from primary
energy to electricity, this is approximately 4MJ/kg bread of primary energy, which is very close to the
estimate from a European study by Le-bail et al., in 2010.
It appears that the more recent studies have shown a greater energy efficiency across the life cycle
of bread production, which may be attributed to improvement in technology and practice. More
interestingly for re-distributed manufacturing and in relative terms, Beech (1980) concluded that
compared to industrial baking, energy consumption of home baking could be lower if sufficient
loading (e.g. 2-3 loafs of 670g each per batch) is adopted and gas is used as the fuel; the efficiency
can drop significantly with lower loading levels and in any case with electricity-power ovens. Le-bail
et al., (2010) on the other hand, compared the energy demand in conventional bread baking with
that in the processing of frozen part-baked breads and concluded that the part-baked process
demands about 2.2 times as much energy as conventional bread making process.
Closely related to energy consumption is greenhouse gas (GHG) emissions. According to Williams et
al., (2006), 0.80 t CO2 equivalent is produced per tonne of wheat, 80% of which arises from the use
of fertilisers. For the bakery operations, the Carbon Trust study (2010) showed 0.23 t CO2 equivalent
per tonne of baked product (primarily breads) when averaged across 89 industrial bakery sites in the
Energy Feasibility Study Final report 43
UK, mounting to 0.57 million tonnes of CO2 equivalent per year and responsible for approximately
0.45% of the UK’s industrial emissions. The overall maximum carbon saving potential for the sector
through good practice and future innovation is estimated to be 26.5%. In a separate study by WRAP
(2013), bread baking (at plant, in-store or at home) is reported to be responsible for 20% of the GHG
emissions of bread, while user behaviour (bread freezing and toasting) and appliance use contribute
25% of the total GHG emissions, and fertiliser use in wheat growing accounts for 25% of the total
GHG emissions. While a detailed study is needed to draw definite conclusions, it can be suggested
that if changes occur to the locations and scales of different activities in the bread system, and in
user behaviour, the picture of GHG emissions is most likely to change.
4.4.8. Wastes and by-products from the bread supply chain and potential
for energy generation
Across the whole UK food system, bread is one of the products with the highest wastage rates.
According to estimates by Tesco, 34% of bread that is produced is never eaten. The figure is higher
for sliced, white bread, of which 44% is never eaten.9
Waste from milling (germ and bran) often used for animal feed and also as fertilizer, so milling waste
is considered to be minimal/negligible.
Waste from baking up to 16% of bread (smaller percentage in smaller-scale bakeries) produced is
wasted at manufacturing stage due to overproduction, misshapen or poor quality loaves, stoppages
and burning caused by malfunctions and human errors3.
Waste in the retail stage is reported to be between 1-4% of bread produced or 4.3% of bread sales
including bread ‘reduced to clear’ (one of the biggest single areas of food waste10 ).
Waste at consumer level. By weight, bread is the number one household food waste product. In
2012 households disposed of 460,000 tonnes of standard bread and 49,000 tonnes of speciality
bread, mainly because it was not used in time or they were ends and crusts. It is estimated that 28%
of bread purchased in 2012 was wasted.11 This wasted bread (other study food products and
possibly other by-products not used for animal feed) supposedly is composted. Explore potential to
use locally for energy generation -EfW potential. Also note that ‘potable water’ and its embedded
energy is also wasted in the process. Perhaps buying locally made bread every day could help
reducing bread waste, thus avoiding wasted energy and water too.
Consider there is also the drive for supermarkets to reduce waste and donate food close to expiry
date to food banks (e.g. new EU regulation coming into place), thus it is possible that the situation
around bread waste will change in the near future. This could be the basis for different policy
scenarios to model.
9 Tesco (2014) Food waste hotspots
http://www.tescoplc.com/assets/files/cms/Resources/Food_waste/T_S_Hotspots_190514v3.pdf 10
Tesco (2015) Corporate responsibility 2014/15 half-year update http://library.the-group.net/tesco/client_upload/file/Half_year_report_2014_15.pdf 11
WRAP (2012) Household food and drink waste in the United Kingdom 2012
Energy Feasibility Study Final report 44
4.4.9. Industrial symbiosis: waste energy from other industries for bread
manufacturing
Like with growing tomatoes in green-houses, there is also some experience of using energy wasted
in other industries to manufacture bread (industrial symbiosis). The Glockenbrot bakery12 in
Bergkirchen close to Munich, Germany is an example of industrial symbiosis. This bakery uses
energy from three incineration lines that process approximately 110,000 tonnes of waste per year
that provides district heat and steam supply. The bakery has introduced innovative energy efficient
production processes reducing the energy demand to 70% of conventional production systems. The
Bergkirchen bakery reportedly emits 46% less greenhouse gases than traditional bakeries.
4.5. Interviews with local mills and bakeries
Semi-structure interviews were conducted with two local mills in the Oxfordshire area, and with a
local bakery and local scale bakery facility also located in Oxfordshire in October and November of
2015. A draft of the questions to be asked at the semi-structured interviews was prepared and can
be seen in Appendix A. Main findings from the interviews relevant to the energy study are
summarised below.
4.5.1. A Mill, Oxfordshire
This Mill was visited on 16 Oct 2015, and the Managing Director and Production Manager were
interviewed. Their customer-base is national, they supply soft biscuit flour for 3 big companies in
Dublin and for shops and some supermarkets like Aldi. They have much bigger competitors for
example Finelady bakery in Banbury or Heygates, which produces 70 tons of flour per hour
compared to Matthews mill which produces 3-4 tons per hour. They have increased production to
500 tons per week by increasing their power, but even with this they have limitations to do with size
of their factory and location which means they cannot expand. They are next to the railway line
which their ancestors viewed as key for their business (i.e. to transport the flour out of the premises
-most mills were located near ports and river-ports). They have moved towards an approach of
diversification of products instead.
4.5.1.1. Energy
The mill’s energy has always been provided by a gas turbine, and also have electricity, and it is run
24 hours 7 days a week unless there are issues of staffing.
They looked at the possibility for installing solar panels on the available roof but this would require
an investment of £40,000 and approximately 7 years pay-back time with subsidies, which is still
expensive and would only provide approximately 4% of their energy needs as they do not have
enough roof space. The mill (like most mills) are vertical structures with 3 floors to use one conveyor
on the vertical.
12
http://www.proplanet-label.com/produkte/rewe/brot-und-backwaren.html) and http://www.gfa-online.com/index.php

Energy Feasibility Study Final report 45
They would install solar panels if the upfront cost was not so much. Efficiency of the carbon tax and
carbon credits is questionable, but localised/decentralised energy provision would beneficial for
Corporate Social Responsibility (CSR)/emissions/environmental reports and for public relations and
trust.
They pay £22,000 per month in electricity which is associated with the milling machines which have
all moving elements to mill grain into flour, and with dust collectors and fans. Air conveying is an
energy intensive activity.
Three is no energy involved in heating anything. Conditioning uses only cold water so water does
not have to be heated.
In terms of efficiencies, they are operating a similar system to what they had 90 years ago and in the
same building. They are not wasteful, but there are more efficient motors (e.g. German) nowadays
and larger mills can be more efficient too.
Production manager did not perceive that there is much that can be improved: ‘the milling industry
has not changed massively in the past 100 years’. There is only a small efficiency gap between top-
end and slightly less good equipment – cheaper Chinese motors are 96% efficient vs German motors
which are 99% efficient.
They could not operate better/larger machines given space constraints and power available. They
have a power correction factor in the three-phase system13, and they are balancing limitations in
terms of power by putting a new substation to secure supply, but still this isn’t enough power. This
has to be seen versus the potential from renewables (e.g. solar energy potential as described above).
The only real way to improve efficiency was seen to be a fresh start in a new mill. Interviewees
reported that Whitworths have opened a new mill with latest technology, only a one-storey
operation rather than spread over several floors like this mill (possible to use up to 5 Megawatts in
large size factories –order of magnitude, which is similar to modern high-power diesel-electric
locomotives typically have a peak power of 3–5 MW, which has to be seen versus renewables).
4.5.1.2. Water
Thames Water is the water supplier and they use this mains water without needing to check water
quality for conditioning which requires only a small amount of water. Maximum 4-5 baths-full per
day (200l/hour maximum). Thus, they reported hardly any expense on the water bill which was seen
as very small bill compared to the energy bill. Water is not heated for conditioning (cold
conditioning).
13
Converters with power factor correction (PFC) capability are used in distributed power systems and are implemented using two-stages consisting of a PFC stage followed by a DC/DC converter. The purpose of the front-end converter is to regulate the DC output voltage, guarantee current sharing, and charge a bank of batteries to provide backup energy when the power grid breaks down. One of the main concerns of the power supply industry is to obtain a front-end converter with a low-cost PFC stage, while still complying with required standards, especially for high-power three-phase applications. Barbosa, P. M. (2002) ‘Three-Phase Power Factor Correction Circuits for Low-Cost Distributed Power Systems’, PhD thesis, Virginia Polytechnic Institute and State University.
Energy Feasibility Study Final report 46
4.5.1.3. Waste and energy/circular economy
There is no waste from wholemeal flour, and what does not go into wholemeal flour, the flakes or
bran is sold locally to farms as animal feed. When the feed market was poor due to less demand for
feed during the BSE (mad cow disease) crisis, bran was burned at Didcot power station along with
saw-dust. It was a bit of a biomass experiment, but the price of wheat and bran for animal feed is
led globally, and so when the value of bran for feed rose again, they sold once more for feed.
4.5.2. B Mill, Oxfordshire
This mill was visited on 19 October 2015, and a semi-structured interview took place with the owner.
Their customers are at national scale, but this mill mostly supply small bakeries, some of which are
local to them, farm shops and private local customers too.
The mill’s running cost is approximately £180/ton which compares to £40 a ton for larger mills.
Labour is one of the highest running costs – this rolling milling plant is not an efficient mill. For this
mill, 2 men on a shift produce 2 tons/hour (no computerised milling). At a big plant a computer
makes 60 tons/hour.
4.5.2.1. Energy
In terms of carbon savings and incentives/discounts, they prefer to take the fine than consider
efficiencies which would be more expensive. They pay 10% which is approximately £8,400 which
still means savings per year compared to having to change machines/other efficiencies. There is too
much bureaucracy to save carbon.
Energy is mains electricity. The electricity bill is £7,000 per month. They consume approximately
80,000 KW/month. Hydro-electricity (in the best of times) is a very small proportion of this.
The use electricity from the grid, although they have a screw-hydraulic wheel in Oxford on the site of
the original mill now transformed into flats.
The energy generated is sold to the grid, but there has been no rain and flow levels are low, so in the
last three months they have not used and have not been able to sell any hydro-electricity generated
on the site.
This wheel produces approximately 30KW/hour which is enough to provide electricity for 5,000
houses. In 3 years, this screw has produced 0.5 million KW, so in 36 months this equates to 13,888
KW/month. This is 17.3% of the energy needs of this mill. However it should be noted that no
electricity has been produced in July-August and September 2015 due to low flows.
In the old times, this would have been sufficient to produce 1 ton of flour per hour because less
energy was required before as there were no air conveyors (no energy to blow flour around was
needed).
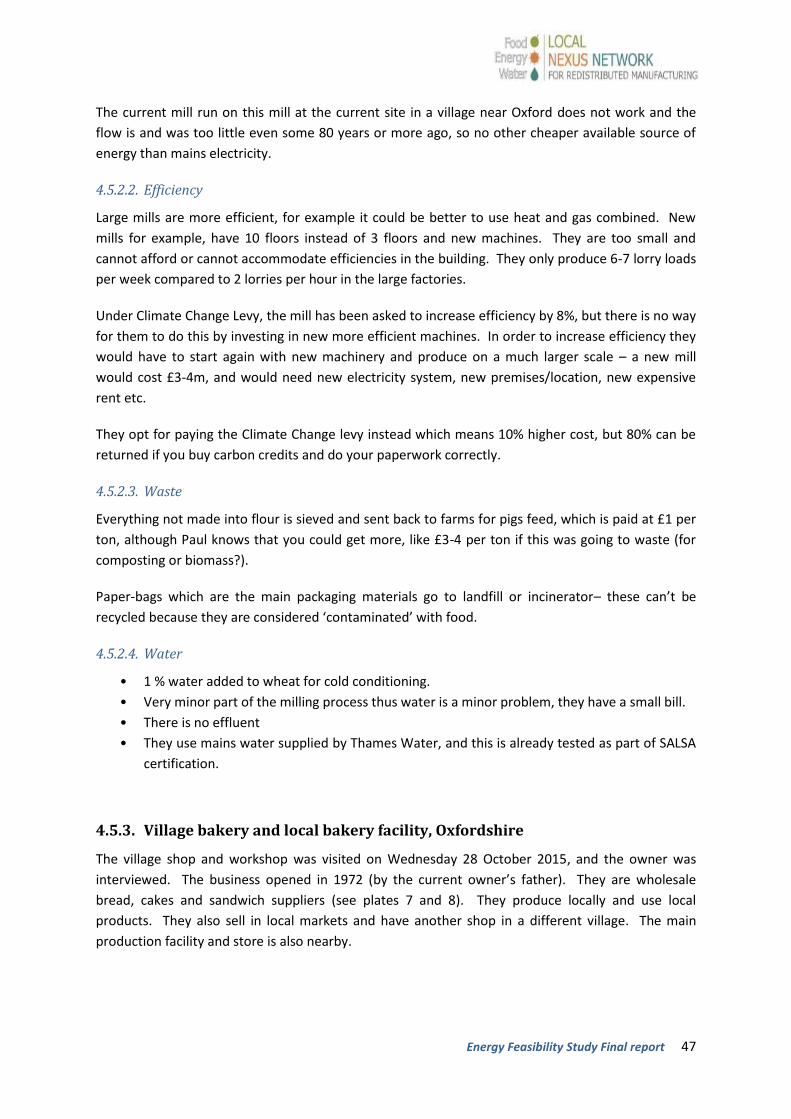
Energy Feasibility Study Final report 47
The current mill run on this mill at the current site in a village near Oxford does not work and the
flow is and was too little even some 80 years or more ago, so no other cheaper available source of
energy than mains electricity.
4.5.2.2. Efficiency
Large mills are more efficient, for example it could be better to use heat and gas combined. New
mills for example, have 10 floors instead of 3 floors and new machines. They are too small and
cannot afford or cannot accommodate efficiencies in the building. They only produce 6-7 lorry loads
per week compared to 2 lorries per hour in the large factories.
Under Climate Change Levy, the mill has been asked to increase efficiency by 8%, but there is no way
for them to do this by investing in new more efficient machines. In order to increase efficiency they
would have to start again with new machinery and produce on a much larger scale – a new mill
would cost £3-4m, and would need new electricity system, new premises/location, new expensive
rent etc.
They opt for paying the Climate Change levy instead which means 10% higher cost, but 80% can be
returned if you buy carbon credits and do your paperwork correctly.
4.5.2.3. Waste
Everything not made into flour is sieved and sent back to farms for pigs feed, which is paid at £1 per
ton, although Paul knows that you could get more, like £3-4 per ton if this was going to waste (for
composting or biomass?).
Paper-bags which are the main packaging materials go to landfill or incinerator– these can’t be
recycled because they are considered ‘contaminated’ with food.
4.5.2.4. Water
• 1 % water added to wheat for cold conditioning.
• Very minor part of the milling process thus water is a minor problem, they have a small bill.
• There is no effluent
• They use mains water supplied by Thames Water, and this is already tested as part of SALSA
certification.
4.5.3. Village bakery and local bakery facility, Oxfordshire
The village shop and workshop was visited on Wednesday 28 October 2015, and the owner was
interviewed. The business opened in 1972 (by the current owner’s father). They are wholesale
bread, cakes and sandwich suppliers (see plates 7 and 8). They produce locally and use local
products. They also sell in local markets and have another shop in a different village. The main
production facility and store is also nearby.
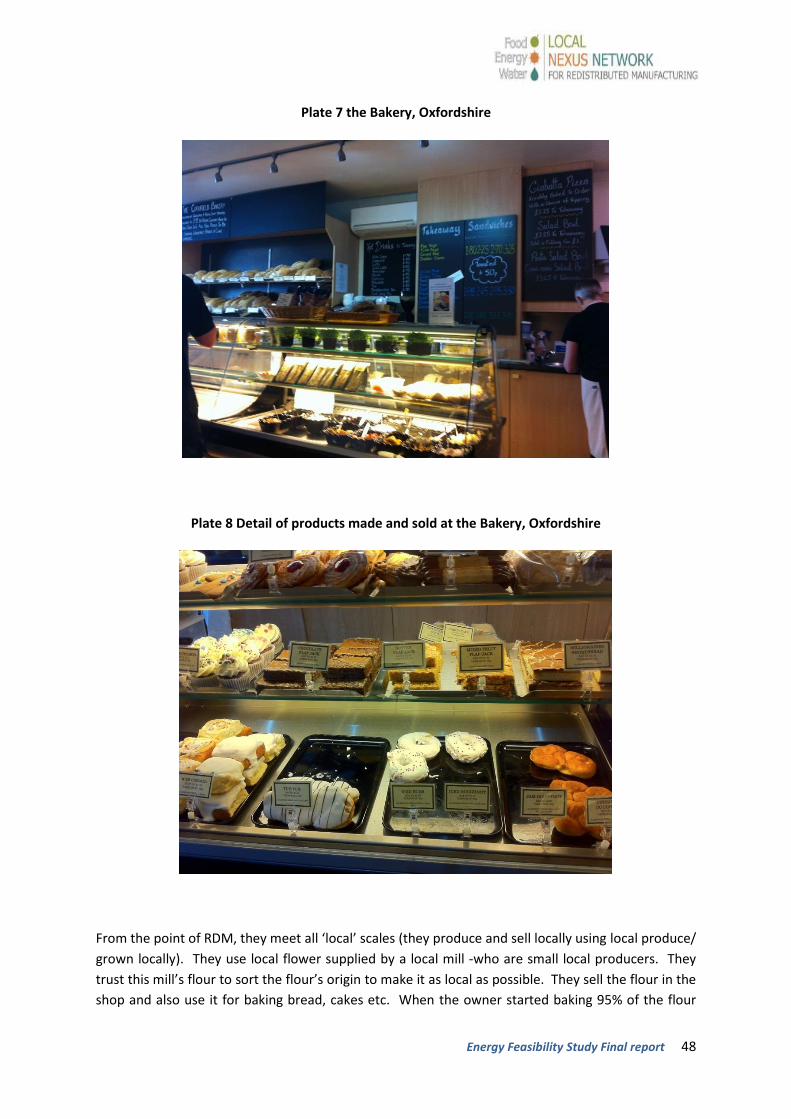
Energy Feasibility Study Final report 48
Plate 7 the Bakery, Oxfordshire
Plate 8 Detail of products made and sold at the Bakery, Oxfordshire
From the point of RDM, they meet all ‘local’ scales (they produce and sell locally using local produce/
grown locally). They use local flower supplied by a local mill -who are small local producers. They
trust this mill’s flour to sort the flour’s origin to make it as local as possible. They sell the flour in the
shop and also use it for baking bread, cakes etc. When the owner started baking 95% of the flour
Energy Feasibility Study Final report 49
was Canadian and 5% was English, now it is very different as flours can get gluten added. Their
gluten-free bread mix comes from Germany.
They currently use 4.5-5 tons of flour/week in all premises. The amount of flour used correlates to
approximately 1.6 tons of bread per ton of flour.
Their business in approximately 70% wholesale (they travel in Oxfordshire and Buckinghamshire in a
c. 50 miles radius). They supply competitively to cafes, shops, hospitals and schools (most are price
driven, but some are not even though they are not private but funded by Oxfordshire).
4.5.3.1. Energy
In the village shop they have installed solar panels which are operational since April 2015, but there
is no potential for expansion on south facing roof. In the production site there is no potential for
solar energy for the business as the landlord has already developed it as a solar field.
In the premises they use all the solar energy they produce. Since April this amounts roughly to 3,300
Kilowatts (KW) split as: 641 KW in May, 732 KW in June, 614 KW in July, 457 KW in August (less due
to cloud cover, no higher temperature), and 446 KW in September (plus October’s generated energy
–the month was incomplete at the time of the interview).
The calculation is that the solar panels payback time will be 6 years, but the owner thinks this is
conservative and he’ll pay them sooner. They have feeding tariff (if they sell energy to the grid) but
they use it all and need more. They had no loans or subsidies for installation.
The business’ energy provider is British Gas, and in this village shop and bakery workshop the energy
bill is approximately 5,000 KW per month (mains electric). This means that the bakery produces
approximately 11% of their energy needs via the newly installed solar panels.
4.5.3.2. Energy efficiencies
There is room to have more efficient ovens and machines; these are quite small so less energy-
efficient in comparison to large production centres. Ovens, mixers etc. are from 1988 or 1989 made
in Manchester. They got new ovens in the new production facility which were supposed to be more
energy efficient but are not in reality, because it takes too long for them to heat. His energy bill is
still too large, and he reported that he partly-regrets not going for some wood pellet ovens that he
had seen, but that were too new at the time and he was worried about the supply of
pellets/woodchips.
The new machines for the other bakery / production plant were all made in Italy and are all electric.
In addition to the electricity bill, he is concerned with vans/fleet fuel, and will consider electric fleet
when/if he needs to replace vehicles. Vehicle efficiency is high in the agenda, for economic and
moral reasons.
Waste was not mentioned.

Energy Feasibility Study Final report 50
4.5.3.3. Water
They installed a water meter as the company, which is Thames Water, insisted, but water
consumption is not a concern for the business. The electricity bill and vehicle fuel are much higher
in the list of worries.
Water in the winter and if very cold has to be heated by kettle sometimes to add to the mix, and in
the summer it has to be cold or with ice, but no significant energy input required for either.
Energy Feasibility Study Final report 51
5 Summary of findings relevant to the Energy Feasibility
Study from one-to-one interviews
A number of important findings from one-to-one interviews have been summarised below.
However it should be noted in the context of energy and possible configurations that even among
independent local businesses such as mills, there are uncertainties around how much of the locally
manufactured product (e.g. flour produced by a local mill such as A mill near Oxford) ends being
consumed locally for bread and cakes baked in and around Oxford, and how much of it goes to other
places.
All businesses interviewed so far have looked at and continue to consider energy efficiencies and some have installed renewable energy solutions such as solar panels and micro-hydroelectricity schemes. However the energy demand of all businesses interviewed is greater than the energy supply they believe they can produce themselves, which ranges from 4% (A mill feasibility study on solar potential) to 11% actual solar power generated at the village bakery and workshop facility, and 17% hydroelectricity generated at B mill.
All businesses interviewed have looked at available options and have incorporated ‘easy wins’ in terms of energy and water efficiencies as there is a clear understanding by the owners of the links with economic savings.
However, there are physical limitations to possible efficiencies too (old buildings and machines) unless relocating the manufacturing plant and investing significant capital. Business decision makers feel it is preferable (in some instances) to pay the Carbon levy than to invest in making the manufacturing process more efficient.
Some local food manufacturers have the potential to switch technology (e.g. from coal to biomass, or even to ground-source low grade heat in the case of tomato green-houses). However there are financial and physical barriers to installing or retrofitting these technologies (e.g. 2,000 local straw-bales to use as biomass to heat green-houses would require large storage space that is not available; or the roof of the bakery facility already has solar panels owned by the landowner).
Energy-wise, all businesses interviewed pointed out that newer and larger operations have more room for efficiencies and are more competitive due to economies of scale (e.g. tomato paste factories, or large mills manufacturing 24 hours 7 days a week). Space to grow the business and to change technology is the main/one of the main drivers for change.
Local businesses investing in green technologies and looking positive about the future are family businesses where young generations of family members are involved in the business.
‘Redistributed manufacturing’ means different things for different people, thus we could talk of
grades of decentralisation/redistribution. ‘Local scale’ also means different things for different
people, e.g. a medium or even small-size local mill can supply at national (or even international)
scale across the whole UK, and use international organic wheat for locally crafted bread (i.e.
from countries as far away as Canada or Australia) depending on the year, the quality of the
yield and prices on global market.
Energy Feasibility Study Final report 52
5.1. Areas for further investigation according to interviews and site visits
5.1.1. Tomato paste case study
Potential to re-use and/or store heat from the top of the roof peach of greenhouses (heat
capture, storage for example in under-ground water reservoirs).
Potential for ground-sourced heat (coils) under the surface of the green-houses
Other synergies or symbiotic processes including using heat from steam/water from cooling
towers for local greenhouses.
Relocating greenhouses near industries with excess energy losses e.g. bakery.
Biodegradable cord to hold tomato plants is too thick and it gets entangled, it is difficult to
manage and it blocks light due to its volume because it is much thicker than the nylon cord.
This is an area where potential improvements can be made if an alternative rope of
biodegradable material equal in thickness to the nylon rope can be developed. This would
mean that old plants together with the ropes could be used as biomass.
5.1.2. Bread case study: mills
• Potential for ground-sourced pumps
• Other synergies or symbiotic processes including using heat from steam/water from cooling
towers in power stations to store energy in water reservoirs/move turbines etc.
• Potential for using other wasted / energy losses energy from other industries e.g. bakeries
for milling, which may mean relocating mills near those industries
• Potential for CHPs/biomass, energy from waste (EfW), solar –if cheaper, hydro and other
sources of renewable energy, including potential to use packaging material (paper-bags) and
waste bran as biomass for a CHP instead of landfill or incineration.
5.1.3. Bread case study: bakery shop and local bakery facility
The role of family-run small and medium businesses as key drivers of RDM (e.g. in the mills,
bakeries, green-house horticulture and brewery businesses). Thus, replicating the family
business model in RDM may be useful.
There is potential to use heat losses from another industry (e.g. power station) to make
bread, which may mean geographical relocation of manufacturing facilities. There is also
potential to store heat from ovens (capture/ storage for example in under-ground water
reservoirs) and to re-use heat in other processes/industries (e.g. locating a bakery next to a
green-house for symbiotic processes).

Energy Feasibility Study Final report 53
6. Stakeholder engagement
In addition to the one to one interviews and site visits presented in the previous section, a variety of
national and local stakeholders were consulted through workshops held in London and Oxford.
Feedback from stakeholders relevant to the Energy Feasibility Study is presented below and was
used in defining research questions and prioritising areas where further research is needed. Some of
this research is being undertaken via detailed investigations on specific energy scenarios and supply
chains, and will be presented in sections 7 and 8.
6.1. Feedback from stakeholders workshops
The following feedback relevant to the Energy Feasibility study was obtained at two stakeholder
events that examined the Nexus Food-Energy-Water in localised food manufacturing. One of this
events took place in London in November 2015 with stakeholders at the national scale (e.g. the
Association for Decentralised Energy, Nestle, Packaging Federation, Waitrose, Innovate UK etc.), and
the other event was held in Oxford in December 2015 and consultees were mainly from the local
food business community in the Oxford area.
Plates 9 and 10 Stakeholder consultation event held in Oxford in December 2015
The objective of these events was to identify CHALLENGES and OPPORTUNITIES for redistributing
manufacturing in the UK. Among the opportunities outlined were job creation, increased food
security for some products, better and more efficient water and energy use, and potential synergies
for waste heat recovery.
BARRIERS identified by stakeholders included a number of issues linked to business and supply chain
structures, regulation, the cost of local raw materials and labour, availability of space and land for
local food production. For the Energy Feasibility Study the barriers identified that are most relevant
were those linked to the suitability of infrastructure and technology, and the cost and security of
energy supply. Stakeholders asked if the infrastructure and technology for redistributed
manufacturing exist, e.g. small industrial units, smaller-scale technology.

Energy Feasibility Study Final report 54
Also it was pointed out that small-scale equipment can be lower efficiency in resource use and may
have higher environmental impacts per unit of production, plus the cost of production may also be
higher than for larger scale manufacturing due to economies of scale. Finance /access to capital to
invest in alternative energy and water technologies as well as new manufacturing equipment was
also highlighted as an important issue, and it was proposed that tax breaks and grants should be
available, for example, for local energy generation in the local food manufacturing sector.
Table 9 below focuses on water and energy aspects and disaggregates into CHANGES and
CONDITIONS the comments made by stakeholders in relation to how to overcome BARRIERS for
localised food manufacturing. ‘Conditions’ were understood to be the factors, circumstances, the
landscape (e.g. policies, regulation, market conditions, trade, business models, funding etc.) that
would enable the proposed ‘Change’. Some Conditions are ‘paired’ with the corresponding Change,
but some Changes were proposed with little corresponding discussion among participants about the
Conditions necessary to enable the Change (thus the blank lines).

Energy Feasibility Study Final report 55
Table 9 CHANGES AND CONDITIONS relevant for the Energy Study
Changes Conditions
Technology Specific models for different scales/climate change to enable downscaling big systems to small-scale
Integrated and automated technology (e.g. waste by-products, energy, water)
Industrial symbiosis: manufacturing, energy, heat, water
Heat waste recovery technology and energy efficiencies)
Infrastructure (mainly energy and water) Localised energy infrastructure Carbon/climate change levy etc.
Improve energy transmission losses (electricity losses up to 30%)
Renewable and/or localised energy for greenhouses
Integrate systems to manage heat/cold energy networks, water connection, CHPs
Regional economic development through industrial supply chains
Industrial symbioses to help improve energy and water efficiency
Regional economic development through industrial supply chains
Water treatment plants (more research and development of decentralised plants)
Regulation to recover methane for energy, fertilizers and heavy metals
Energy decentralisation Pay more for your energy possible
More wind generation for villages as exchange for free/cheap electricity
Tax incentives, subsidies
Reconfiguration of transport infrastructure for access to markets
Prices Lower cost of retrofitting technologies such as water recirculation
Products prices to reflect the real cost of food, and environmental and social burdens
Policies for triple accounting real costs: food, environmental & social burdens
Policy, planning and regulation Regulation to be more pro-active to minimise energy & water use, and food waste while increasing local jobs.
Need to regulate the front-end (e.g. no overproduction to avoid food waste)
Stronger legislation and regulation e.g. market and innovation (e.g. infrastructure)
Legislative/regulatory framework for full systems needed
Re-organisation of land-use and spatial planning system for local food production (where we grow, build, have green spaces, build localised heating, water recycling drainage etc.)
Legislative framework for local Authorities to drive change, e.g. community heating from heat recovered in manufacturing etc.
New developments such as Northstowe –near Cambridge- to include energy and water efficiency measures
Right planning, regulation and investment
Vision Have a vision of co-benefits of localised food manufacturing e.g. training, jobs, housing, urban development, healthier society, experimental food and energy production off-grid as well as on-grid systems etc.
Energy Feasibility Study Final report 56
Based on the feedback from stakeholders consulted, the following areas were outlined as requiring
further investigation in this Feasibility study in relation to specific supply chains for the chosen study
products: bread and tomato paste (see sections 7 and 8 below), or in future research projects.
Model different shocks to supply chains at various scales /downscaling industrial systems
and supply chains to localised small-scale
Integrated technologies (integrate systems to manage heat/cold, energy networks, water-
energy connections, heat waste recovery technologies)
Energy efficiencies: industrial symbiosis to help improve energy and water efficiency (re-
use/optimise energy, water and also waste/ waste by-products e.g. heavy metals)
Energy decentralisation: potential for localised renewable energy sources (e.g. biomass
/CHPs, solar, energy from waste, more wind generation for villages as exchange for
free/cheap electricity, biogas -recover methane etc.)
Water treatment plants (potential for decentralised plants and links to biogas)

Energy Feasibility Study Final report 57
7. Background and framework for the energy analysis
A vision from Government for the UK’s energy systems is to include a variety of renewable energy
sources, local plants for combined heat and power (CHP), plus low carbon businesses, energy
efficient homes and sustainable agriculture (see Figure 7 ‘A vision for 2050’ from HM Government’s
Low Carbon Transition Plan, 2009).
Originally inspired on this Low Carbon vision, a number of possible scenarios for re-distributed
manufacturing and supply chains were developed with the understanding that RDM can play a role
in encouraging local low carbon businesses and an overall reduction in greenhouse gas emissions.
Having a wider geographical spread of food manufacturing can be positive in socio-economic (e.g.
job creation) and environmental terms also because renewable energy and water sources may be
used at the local level (e.g. greenhouse tomatoes grown in the UK using waste energy from another
industry may also use local water resources with lower embedded energy).
However, as mentioned in previous sections, when considering re-distributed food manufacturing,
down-scaling and decentralising manufacturing may have the opposite effects and could result in
greater energy and water consumption due to the loss of economies of scale and logistical problems
(e.g. limited space to implement efficiencies in manufacturing processes at local or factory level).
Hence the need for analysing various scenarios and supply chains from the point of view of energy
and water usage.
Figure 7 Possible future energy systems. Source: UK’s Low Carbon Transition Plan (2009)
Energy Feasibility Study Final report 58
7.1. Framework for analysis of energy usage in food manufacturing
Informed by the literature review, data gap analysis, site visits, one-to-one interviews and feedback
from stakeholders (see sections above), this section aims to provide a snapshot around local energy
system scenarios for some supply chain configurations towards redistributed food manufacturing by
studying the energy and emissions implications of an increase in the percentage of local
manufacture of some specific example foods from 2% (the current situation for bread in the UK) to
20% (see Fig. 8).
It is worth noting that a move to RDM may happen as an incremental change driven by policy and/or
based on consumers and entrepreneurs’ changing preferences and behaviours (e.g. 1% increase
towards RDM every 2 years for 25 years between 2015 to 2040), or as a single step change as result
of a shock (e.g. climate shock/ conflict affecting food availability and prices) or radical change (e.g.
through radical policy interventions). These two pathways would mean different choices and
consequences, for example in relation to innovation and adoption of RDM technologies and
alternative energy sources, and also in terms of energy usage and emissions.
It is also noted that a number of barriers to growing more food locally to enable a shift towards RDM
have been identified around security of global supply chains, land availability, land-use policy, and
local water and energy resources. Other concerns linked to localised food manufacturing include
availability and cost of retail spaces, premises and labour in the UK, poor access to market, and huge
food waste (see previous sections on interviews and stakeholder engagement).
However, in this analysis a number of assumptions are made to provide a few snapshots of a
possible shift from a large scale centralised industrial food manufacturing and energy system to a
more decentralised RDM model (see Figure 8 as an illustration of what this analysis aims to study
using bread as the chosen product). Aspects of energy security, global food supply chains, food
prices, stability of financial markets, population growth, land availability etc. have been purposely
ignored in order to focus on the effects of potentially using different energy sources and various
manufacturing technologies at different scales in the UK; some of these wider aspects are addressed
by other projects within the Local Nexus Network activity, and recommendations for further
research are included in section 10. Thus, the specific aims of this analysis are:
a) to explore and compare the impacts of various technologies and methods used at
industrial and local scales, and
b) to outline which scenario (i.e. which efficiencies and technologies, and at which scale)
appears to have the best results in terms of reducing energy use and GHG emissions
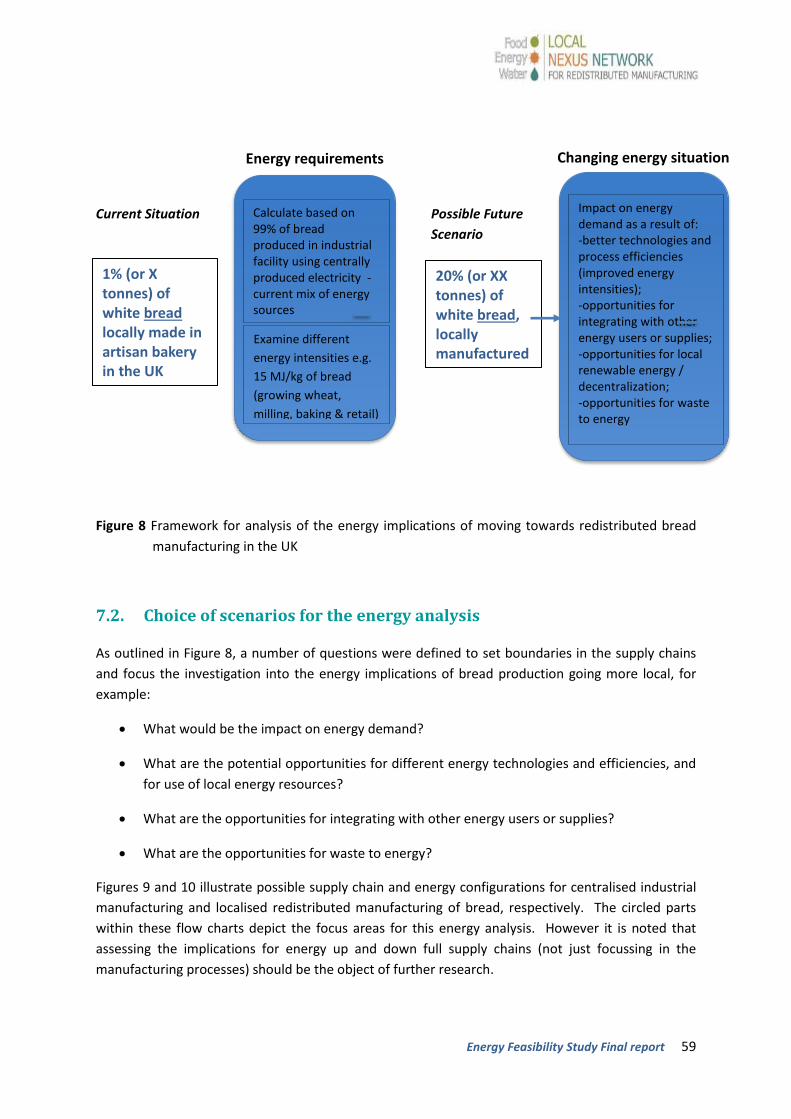
Energy Feasibility Study Final report 59
Current Situation Possible Future
Scenario
Figure 8 Framework for analysis of the energy implications of moving towards redistributed bread
manufacturing in the UK
7.2. Choice of scenarios for the energy analysis
As outlined in Figure 8, a number of questions were defined to set boundaries in the supply chains
and focus the investigation into the energy implications of bread production going more local, for
example:
What would be the impact on energy demand?
What are the potential opportunities for different energy technologies and efficiencies, and
for use of local energy resources?
What are the opportunities for integrating with other energy users or supplies?
What are the opportunities for waste to energy?
Figures 9 and 10 illustrate possible supply chain and energy configurations for centralised industrial
manufacturing and localised redistributed manufacturing of bread, respectively. The circled parts
within these flow charts depict the focus areas for this energy analysis. However it is noted that
assessing the implications for energy up and down full supply chains (not just focussing in the
manufacturing processes) should be the object of further research.
20% (or XX tonnes) of white bread, locally manufactured
Impact on energy demand as a result of: -better technologies and process efficiencies (improved energy intensities); -opportunities for integrating with other energy users or supplies; -opportunities for local renewable energy / decentralization; -opportunities for waste to energy
Examine different
energy intensities e.g.
15 MJ/kg of bread
(growing wheat,
milling, baking & retail)
Calculate based on 99% of bread produced in industrial facility using centrally produced electricity -current mix of energy sources
Energy requirements Changing energy situation
1% (or X tonnes) of white bread locally made in artisan bakery in the UK
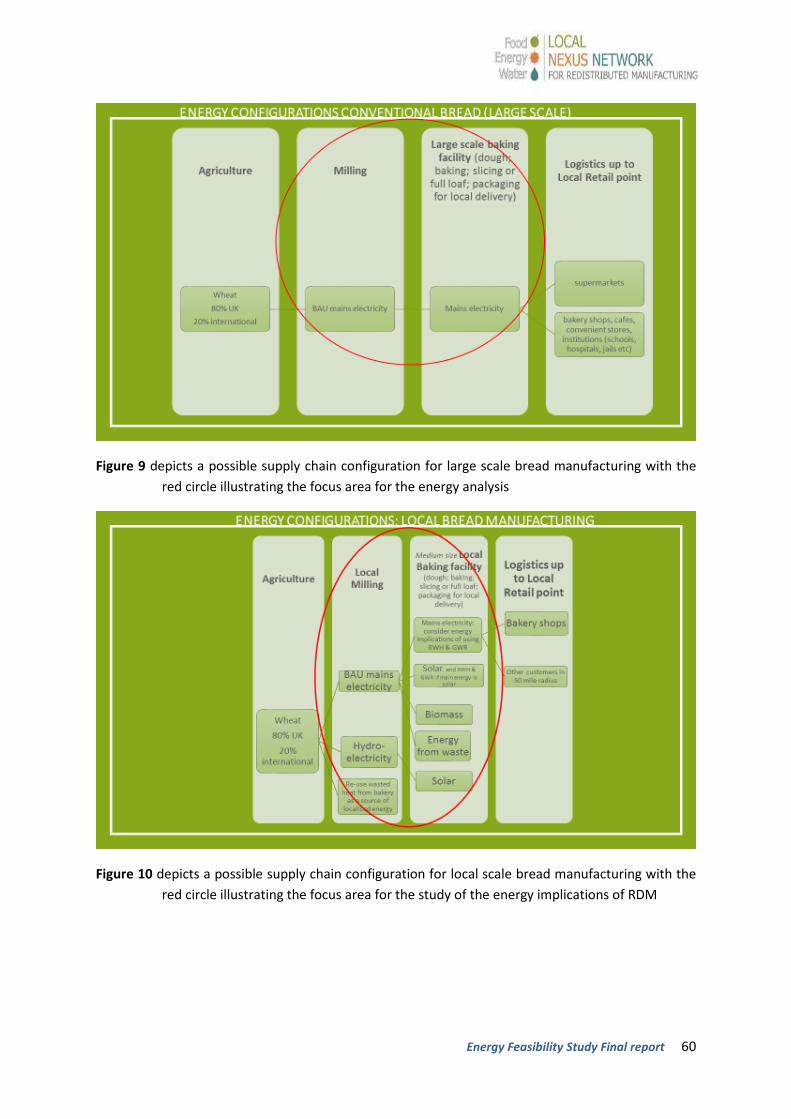
Energy Feasibility Study Final report 60
Figure 9 depicts a possible supply chain configuration for large scale bread manufacturing with the
red circle illustrating the focus area for the energy analysis
Figure 10 depicts a possible supply chain configuration for local scale bread manufacturing with the
red circle illustrating the focus area for the study of the energy implications of RDM
Energy Feasibility Study Final report 61
8. Evaluation of the implications on energy use and
emissions of localising bread manufacturing
8.1. Assessment of opportunities for improvement at the national scale
Available literature including a study on the UK’s bread manufacturing sector by the Carbon Trust in
2010 has been reviewed and summarised in Section 4.4 of this report. As detailed in section 4.4.3,
the Carbon Trust study reported that the majority of the national bread is being baked in large
centralised manufacturing facilities that are supplied electricity from the grid and sell to
supermarkets and a few independent shops. The study reports that the bakery sector uses 2,000
GWh/year across 89 industrial bakery sites that emit 570,000 tons of CO2 to produce a total of 2.5
million tonnes (Mt) of goods, mainly bread, per year. These data are used as the benchmark for the
current situation in bread manufacturing in the UK against which to compare energy usage and
emissions under hypothetical scenarios around using different technologies and energy sources for
the whole sector. It should be noted that ‘scaling up’ to the whole sector is intended as an
illustration of which and where improvements could be achieved. The headings below are used to
frame this analysis.
8.1.1. Comparing energy use and emissions of baking using gas or electricity
This section presents some estimates calculated in order to investigate and compare potential
energy use and emissions linked to using natural gas or electricity. Based on the energy use of 89
industrial plants constituting the UK’s bakery sector reported as 2,000 GWh/year, and considering
the breakdown in the sector with approximately 70% of industrial bakery produce -mainly bread-
baked using natural gas according to the Carbon Trust (2010) study, if only natural gas technologies
were used instead of the current mix of electricity, natural gas and other, and assuming the same
emission factors per energy source used in the Carbon Trust study in 2010, overall emissions for the
sector could go down by as much as 35% from 570,000 to 371,420 tonnes of CO2-e per year (see
Table 10).
Based on the same data and study, if only electricity-based technologies were used in baking bread,
with the same carbon-intensity of electricity supply, i.e. assuming the same emission factors per
energy source used in the Carbon Trust study, overall emissions for the sector would increase by
87% from 570,000 to 1,071,420 tonnes of CO2-e per year (see Table 10). However it should be noted
that these figures are coarse estimates, and emission factors per energy source have varied in the
last few years. Also, going for 100% gas or electric apparatus in the sector is not realistic as this
might not be feasible. Thus these are hypothetical scenarios intended to highlight the differences in
emissions between using one technology over another.
Technology and energy-wise, it is noted that electric ovens are generally more energy efficient than
gas-fired ones, however electricity generated using any form of fossil fuel will be more carbon-
intensive than direct use of gas in the ovens. The CO2 intensity factor for baking using natural gas
has been calculated to be 186 tonnes of CO2-e emissions per GWh of gas used, based on data from
the Carbon Trust study (2010). Figures published in 2014 by the Department of Energy and Climate
Change (DECC) attribute 320 tonnes of CO2-e per GWh for electricity generated using gas, versus 730
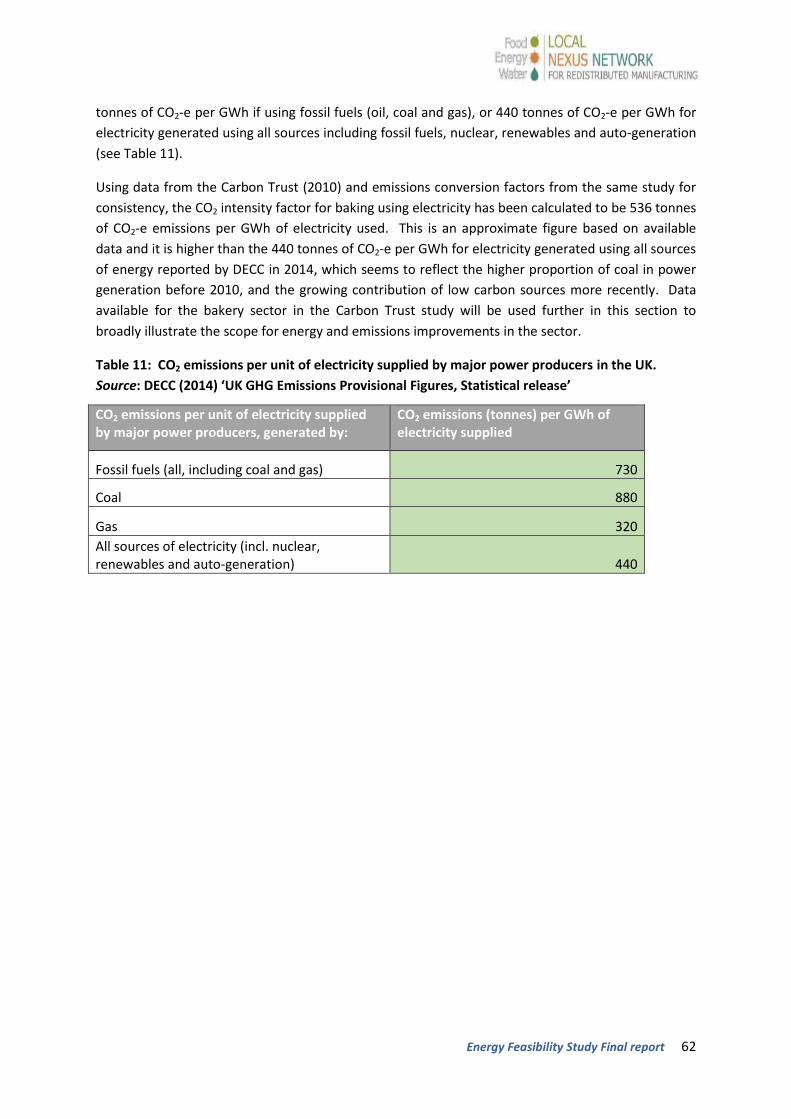
Energy Feasibility Study Final report 62
tonnes of CO2-e per GWh if using fossil fuels (oil, coal and gas), or 440 tonnes of CO2-e per GWh for
electricity generated using all sources including fossil fuels, nuclear, renewables and auto-generation
(see Table 11).
Using data from the Carbon Trust (2010) and emissions conversion factors from the same study for
consistency, the CO2 intensity factor for baking using electricity has been calculated to be 536 tonnes
of CO2-e emissions per GWh of electricity used. This is an approximate figure based on available
data and it is higher than the 440 tonnes of CO2-e per GWh for electricity generated using all sources
of energy reported by DECC in 2014, which seems to reflect the higher proportion of coal in power
generation before 2010, and the growing contribution of low carbon sources more recently. Data
available for the bakery sector in the Carbon Trust study will be used further in this section to
broadly illustrate the scope for energy and emissions improvements in the sector.
Table 11: CO2 emissions per unit of electricity supplied by major power producers in the UK.
Source: DECC (2014) ‘UK GHG Emissions Provisional Figures, Statistical release’
CO2 emissions per unit of electricity supplied by major power producers, generated by:
CO2 emissions (tonnes) per GWh of electricity supplied
Fossil fuels (all, including coal and gas) 730
Coal 880
Gas 320
All sources of electricity (incl. nuclear, renewables and auto-generation) 440
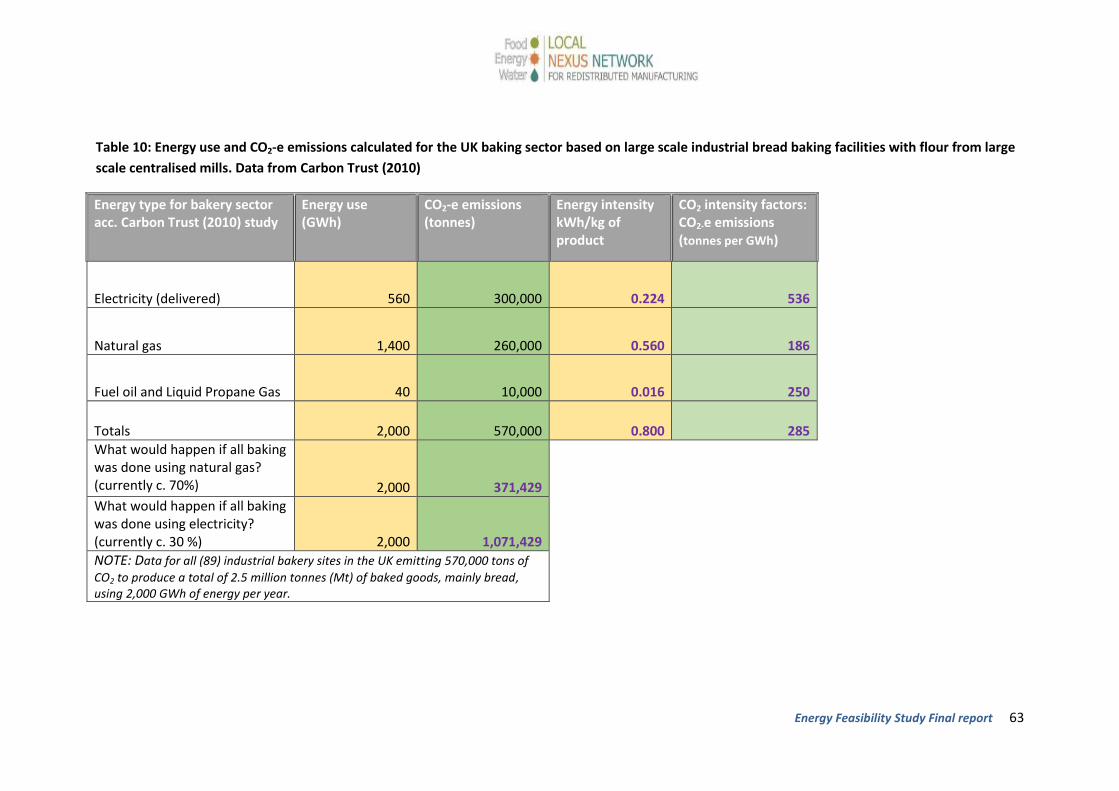
Energy Feasibility Study Final report 63
Table 10: Energy use and CO2-e emissions calculated for the UK baking sector based on large scale industrial bread baking facilities with flour from large
scale centralised mills. Data from Carbon Trust (2010)
Energy type for bakery sector acc. Carbon Trust (2010) study
Energy use (GWh)
CO2-e emissions (tonnes)
Energy intensity kWh/kg of product
CO2 intensity factors: CO2-e emissions (tonnes per GWh)
Electricity (delivered) 560 300,000 0.224 536
Natural gas 1,400 260,000 0.560 186
Fuel oil and Liquid Propane Gas 40 10,000 0.016 250
Totals 2,000 570,000 0.800 285
What would happen if all baking was done using natural gas? (currently c. 70%) 2,000 371,429
What would happen if all baking was done using electricity? (currently c. 30 %) 2,000 1,071,429
NOTE: Data for all (89) industrial bakery sites in the UK emitting 570,000 tons of
CO2 to produce a total of 2.5 million tonnes (Mt) of baked goods, mainly bread, using 2,000 GWh of energy per year.

Energy Feasibility Study Final report 64
8.1.2. Energy use and emissions linked to best available bakery-plant technology
This section presents results of calculations aimed to investigate potential energy and emissions
reduction if the most efficient baking technologies were used in the whole of the UK sector. This
analysis is based on data on specific annual energy consumption -SEC (delivered energy per tonne of
product produced) for 13 bakery sites reported in the Carbon Trust study (2010). This study
indicates that scale of production, location, design, age, efficiency and degree of automation of plant
technology, operating hours and number and type of products baked all influence the specific
energy consumption of the sites investigated. The analysis here presented builds on the Carbon
Trust study to identify the best plant/s and to estimate the energy and emissions reduction that
could potentially be achieved if optimum technologies were used throughout the sector.
Following the current mix of electricity and gas reported in the Carbon Trust study, fossil fuel based
energy intensities were calculated for the 13 bakery sites which vary in their annual production from
10,000 tonnes per year at the smaller plant to 70,000 tonnes per year at the largest site. A bimodal
pattern of energy consumption was observed for larger and smaller production sites respectively.
For sites with smaller production, the average fossil fuel energy intensity is: 0.82 kWh/kg of product
(0.656 kWh/800 g of product). For sites with largest production, the average fossil fuel energy
intensity calculated is: 0.50 kWh/kg of product. The most efficient site is number 4 which has a fossil
fuel energy intensity of 0.40kWh/kg of product.
For electrical energy used in these 13 sites, the bimodal pattern seems less apparent than for fossil
fuels usage versus production. There are sites of varied scale of production that have large
electricity use, although generally, larger production plants appear to also be more efficient in terms
of electricity consumption.
Average intensity for electricity used across all 13 sites is: 0.18 kWh/kg of product, with the most
efficient site (site number 4) producing at 0.14kWh/kg of product, while the least efficient plant has
an electricity energy intensity of 0.25 kWh/Kg of product.
From these results, it is possible to conclude that there is more variance in fossil fuel usage (natural
gas) across the range of plants studied, with smaller production plants being less efficient than large
plants, whereas electricity use tends to be more consistent across all sites regardless of the scale of
production. Another important conclusion is that site 4 is the most efficient of all plants studied in
both electricity and fossil fuel usage, and it is worth noting that this most efficient plant is not one
with the largest production. It produces around 40,000 tonnes of bread per year and has a fossil fuel
intensity of 0.40 kWh/kg of product, and electricity use of 0.14 kWh/kg of product. Thus in this case,
efficiency seems to be linked to optimum technology and practices, not to scale of production.
Based on data from the Carbon Trust (2010), the total energy consumption used by 89 industrial
plants to produce 2.5 million tons of bread every year is 2,000 GWh, thus the average energy
intensity in the UK's bakery sector is 0.8 kWh/kg of product.
If it is assumed that all bakery plants were to replicate site 4 and use its optimum technology,
products, operating hours etc., the energy used by the UK's industrial bakery sector could be
Energy Feasibility Study Final report 65
reduced by nearly 30% from 2,000 GWh to 1,405 GWh to produce the present day 2.5 million tonnes
(Mt) of baked goods, mainly bread, per year.
This has been calculated by assuming an intensity of 0.40 kWh/kg (instead of 0.551 kWh/kg) on 72%
of 2,000 GWh attributed to natural and propane gas (i.e. 1,045 GWh of energy used), and an
intensity of 0.14 kWh/kg (instead of 0.218 kWh/kg) on 28% of 2,000 GWh attributed to electricity
(i.e. 360 GWh of energy used).
It should be noted that this potential reduction in energy use has been estimated under a
hypothetical scenario for the whole sector assuming that the optimum technology for site 4,
producing 40,000 tonnes of bread per year, is applicable to other scales. This exercise does not
attempt to suggest that whole sector changes are feasible or desirable. Instead, hypothetical effects
in the whole bakery sector are presented here to illustrate that energy savings and significant
reductions in CO2-e emissions are linked to ‘state of the art’ technologies and technological
improvements, and that from the detailed analysis of 13 sites, it appears that optimum technologies
for baking are not necessarily linked to scale. This is important for the Local Nexus Network study
which is concerned with possible scenarios of changing manufacturing scale.
8.1.3. Other technological /system efficiencies that may help reduce energy use
and emissions
According to the Carbon Trust (2010) for the bread manufacturing phase, the largest portion of CO2
emissions (it is assumed the same for energy use) from industrially manufactured bread is attributed
to the baking process (i.e. 35% to 45% of the total -see Figure 4). Based on this, various types of
systems’ efficiencies around the baking process and associated reductions in emissions have been
reported in the same study and are reviewed in section 4.4.6 of this report (e.g. see Table 8).
According to studies for the Carbon Trust (Carbon Trust, 2015a and 2015b) also reviewed in section
4.4.6, up to 42% of energy savings are possible by optimising flue gas in experimental single-
chamber test ovens, which tested in industrial trials could reportedly provide gas savings of up to
4.7% in commercial bread baking plants (see Carbon Trust, 2015b).
If optimising flue gas technology was widely used in the UK's bakery sector, applying a reduction of
4.7% in the energy consumed by gas ovens in industrial bakery plants simply by improving
ventilation in ovens could mean significant energy savings (i.e. a reduction from 1,440 GWh gas
energy used by the sector as reported by the Carbon Trust (2010) down to 1,372 GWh).
It should be noted that the ‘whole sector’ approach (scaling up to the whole sector) used for the
above calculations simply aims to illustrate the improvements in performance that best technologies
can bring about by comparing these with most common technologies and current energy use in the
sector. This approach does not attempt to suggest that whole sector changes are feasible or
desirable. Section 8.2 will consider the effects of these improved technologies at various scales.
8.1.4. Energy from waste (efw) in the UK’s baking sector
According to reports by WRAP (2012) up to 660,000t (£640 million) of bread is wasted in the UK
every year. Based on this figure, some energy savings could be achieved by avoiding bread wastage.
Energy Feasibility Study Final report 66
If 660,000 fewer tonnes of bread were produced at an energy intensity of 0.800 kWh/Kg (800 kWh/t
as reported in Carbon Trust, 2010), this would mean 528,000,000 kWh (528 GWh) in energy savings
per year in the UK. This represents approximately 1/4 of the current total energy used in the sector
(2,000 GWh as per the Carbon Trust 2010 study).
Alternatively, some energy can be generated from 660,000 tonnes of waste bread. Anaerobic
Digestion (AD) of food waste is becoming an alternative for energy generation in the UK and could
represent between 3.8 and 7.5% of the renewable energy that it is estimated we will require in
2020. Digesting 1 tonne of food waste can generate about 300 kWh of energy 14.
Therefore, AD of 660,000 tonnes of bread wasted in the UK every year could result in 198,000,000
kWh (198 GWh) being generated per year in the UK. This represents approximately 10% of the
current total energy used in the sector (2,000 GWh as per the Carbon Trust 2010 study), and in
addition there would be a valuable digestate usable as fertilizer. However it should be noted that
this is only a hypothetical scenario scaled up to the whole sector to illustrate potential
improvements in energy use.
8.2. Energy consumption and emissions linked to scenarios for bread
manufactured at various scales in the UK
The amount of energy used, energy intensities (energy consumption per unit output), as well as the
emissions involved in bread making are different for centrally produced large scale industrial bread
and for home-baked or artisanal/craft bread manufactured at the local level. Differences exist also
depending on the type of cultivation, fertilizing, milling and manufacturing technology and sources
of energy used as seen in sections 3 and 4.
Following a review of literature available, energy and emissions data linked to bread manufacturing
at different scales and using different technologies were collected and used to calculate various
energy intensities (see Table 12). Best available data on bread production and energy use for the
UK’s bakery sector reported in the study by the Carbon Trust (2010) were used for benchmarking.
These data are based on most of the national bread being baked in large centralised manufacturing
facilities that are supplied electricity from the grid and sell to supermarkets and a few independent
shops.
Using data from the Carbon Trust study (2010) and Espinoza-Orias et al., (2011) for typical UK large
scale bread producers: Kingsmill (i.e. centralised large scale baking and flour milling facilities) as the
benchmark for the current situation in bread manufacturing in the country, various energy
intensities were used to model the energy usage and emissions for the scenario representing the
current situation (Scenario 1), and hypothetical scenarios (Scenarios 2a, 2b and 2c) where a larger
proportion of UK’s bread would be manufactured at local level using different types of re-distributed
manufacturing (RDM):
14
http://www.biogas-info.co.uk/about/faqs/
Energy Feasibility Study Final report 67
1) 98% of all bread consumed in the UK produced in the industrial sector, with 2% of bread
produced using current technologies at local/ RDM level including medium to small scale
and artisanal bakeries (1.5%) and home baking (0.5%), that will be refer to as RDM -medium
/artisan and RDM -home baking respectively; and
2) a change where 80% of UK’s bread production would remain industrial and 20% of bread
would be produced at the local scale either as RDM -medium /artisan (scenario 2a), or RDM
–home baking (scenario 2b) scales with current technologies, or RDM local small scale
industrial plant using optimum technology, that will be referred to as RDM –optimum
technology (scenario 2c).
Therefore, the following section headings have been formulated in line with the above scenarios to
help investigate the implications in terms of energy and emissions if 20% of bread production in the
UK was localised/RDM.

Energy Feasibility Study Final report 68
Table 12 Energy requirements (kwh/kg of bread) for various manufacturing processes and scales
(including industrial and domestic flour milling) as reported in multiple sources
Scale Process, and bakery technology type
Energy use kWh/Kg of bread
Source
IND
UST
RIA
L M
ILLI
NG
Wheat milling (kWh/ 800gr white-bread loaf) 0.07
Espinoza-Orias et al., (2011) reported as
0.059 kWh per 800 g white bread-loaf
Wheat milling (kWh/800gr brown-bread loaf) 0.06
Espinoza-Orias et al., (2011) reported as
0.048 kWh per 800 g white bread-loaf
Wheat milling (kWh/800gr all-bread type loaf) 0.13
Espinoza-Orias et al., (2011) reported as
0.107 kWh per 800 g white bread-loaf
IND
UST
RIA
L B
AK
ING
Large bakery facility 800gr white-bread loaf 0.75
Espinoza-Orias et al., (2011) reported as
0.6 kWh per 800 g white bread-loaf
Large plant facility 0.80 Calculated based on data from Carbon Trust (2010)
Large plant bakery 1.11 Le-bail et al., (2010) reported as 4 MJ/Kg of bread
Large plant bakery (inc. wheat
growing, flour milling, baking & retail) 4.11 Beech (1980) reported as 14.8 MJ/Kg of bread
Large plant bakery (flour arrival at
bakery to bread arrival at retail outlet) 1.94 Beech (1980) reported as 6.99 MJ/Kg of bread
Large plant bakery 1.31 Braschkat et al., (2004) reported as 4.7 MJ/Kg of bread
Large plant bakery (organic wheat) 0.97 Braschkat et al., (2004) reported as 3.5 MJ/Kg of bread
RD
M M
EDIU
M
AR
TISA
N
Medium bakery facility (part-frozen/part-baked bread) 2.44
Le-bail et al., (2010) reported as 8.8 MJ/Kg of bread
Artisan bakery facility 1.67 Braschkat et al., (2004) reported as 6 MJ/Kg of bread
Artisan bakery facility (organic wheat) 1.44
Braschkat et al., (2004) reported as 5.2 MJ/Kg of bread
RD
M
HO
ME
Home baking gas oven 2.82 Beech (1980) average 10.15 MJ/Kg of bread taken from range 4.24 to 16.05
Home baking electric oven 9.11 Beech (1980) average 32.8 MJ/Kg of bread taken from range 10.84 to 54.76
Home bread maker, domestic mill 2.39 Braschkat et al., (2004) reported as 8.6 MJ/Kg of bread
Home bread maker, industrial mill 2.28 Braschkat et al., (2004) reported as 8.2 MJ/Kg of bread
Home bread maker, domestic mill (organic wheat) 2.17
Braschkat et al., (2004) reported as 7.8 MJ/Kg of bread
Home bread maker, industrial mill (organic wheat) 2.03
Braschkat et al., (2004) reported as 7.3 MJ/Kg of bread
Energy Feasibility Study Final report 69
8.2.1. Energy use and emissions for the current situation: 98% of the country’s
bread produced in industrial plants with 2% of bread produced locally
Based on total UK bread production data from the Carbon Trust study of 2010 (i.e. 100% of bread
assumed to be produced industrially), the energy use and emissions of the UK's bakery sector were
estimated for the current situation and hypothetical scenarios. For the purpose of this analysis, it
was estimated that 98% of all bread consumed in the UK is produced in the industrial sector, leaving
2% of bread assumed to be produced using current technologies at local level in small and medium
scale bakeries (comprising more or less industrial plants and bakeries), artisans and at home. These
will be referred to as RDM –medium / artisan scale, and RDM - home scale, and are assumed to
represent 1.5% and at home baking 0.5%, respectively.
The modelled scenarios were linked to energy intensity factors for different technologies (e.g.
electric and gas ovens, industrial and local milling) and scales (e.g. industrial, artisan and home
scales) reported in the literature (see Table 12). Results are presented in Tables 13 and14, and
Figures 11 and 12 for energy and emissions respectively.
The following assumptions were made in this analysis, for example to calculate energy use for the
sector under RDM scenarios, and to estimate average power / demand (in GW) for a year based on
the different operational times of the different types of bread manufacturing plants. These
assumptions are as follows:
Figures for the UK industrial bakery sector reported in the study by the Carbon Trust (2010)
assumed to represent the totality of the sector,
It was assumed that current bread production at the local level (Re-Distributed
Manufacturing –RDM) is a mix of artisan, small and medium scale bakeries (some of them
that could be classified as small local scale industrial plants), and home baking activities.
It was assumed that the industrial bakery sector produces 24 h per day 7 days a week, every
week of the year.
For the RDM -medium / artisan scale scenarios, it was assumed that the local scale sector
produces approximately 1.5% of all UK bread, and that this is produced during 5h per day, 6
days a week, every week except for 2 weeks of holidays.
It was also assumed that 0.5% of all UK bread is produced at the home level, in 3 h per day, 5
days per week, every week except 2 weeks of holidays in most households baking their own
bread.
Figure 11 (Scenario 1) represents a realistic scenario reflecting the current situation in the UK’s
bread sector, where 98% of bread in the UK is produced at the industrial scale, and 2% of all bread
assumed to be produced at local level. This 2% of localised bread manufacturing is understood to
mostly take place in small to medium scale localised plants and artisanal bakeries producing
approximately 2-3 tonnes per day (RDM -medium / artisanal scale), plus there is also some home-
baked bread (RDM -home scale). The modelled variations within this scenario are linked to energy
intensity factors for different technologies (e.g. electric and gas ovens, industrial and local milling)
and scales (e.g. industrial, medium / artisan and home scales) reported in the literature (see Table
12). Results are presented in Tables 13 and 14, and Figures 11 and 12.
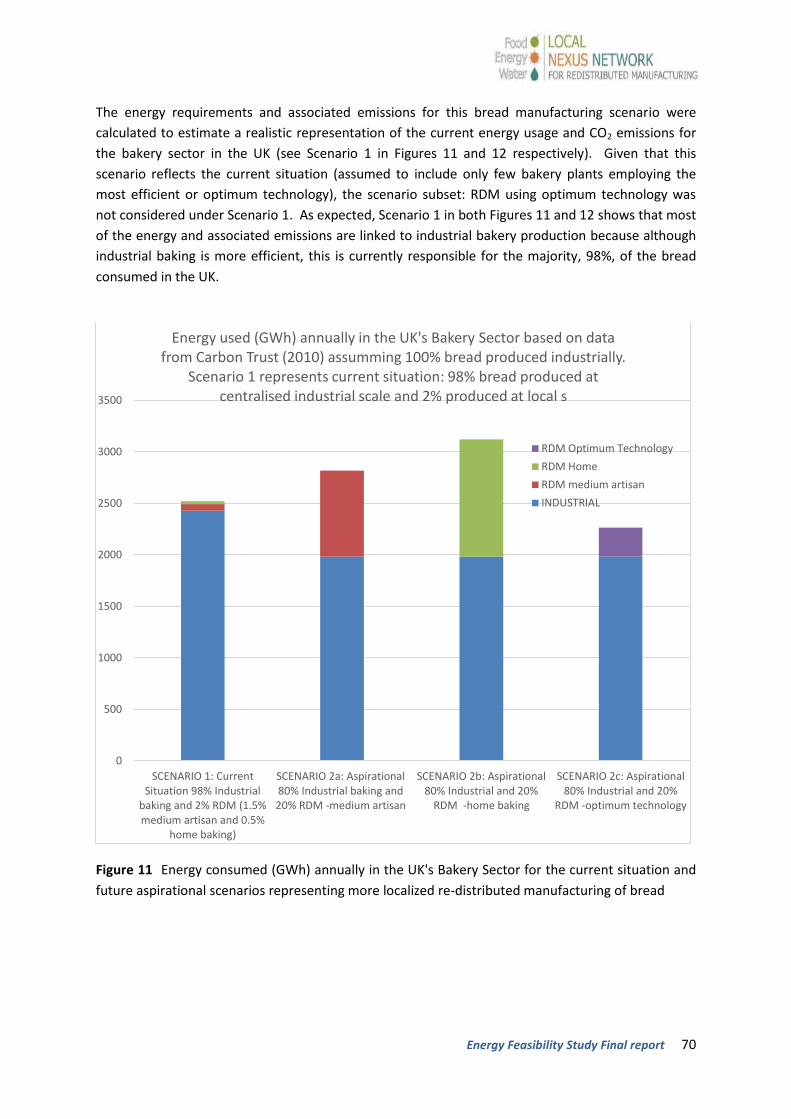
Energy Feasibility Study Final report 70
The energy requirements and associated emissions for this bread manufacturing scenario were
calculated to estimate a realistic representation of the current energy usage and CO2 emissions for
the bakery sector in the UK (see Scenario 1 in Figures 11 and 12 respectively). Given that this
scenario reflects the current situation (assumed to include only few bakery plants employing the
most efficient or optimum technology), the scenario subset: RDM using optimum technology was
not considered under Scenario 1. As expected, Scenario 1 in both Figures 11 and 12 shows that most
of the energy and associated emissions are linked to industrial bakery production because although
industrial baking is more efficient, this is currently responsible for the majority, 98%, of the bread
consumed in the UK.
Figure 11 Energy consumed (GWh) annually in the UK's Bakery Sector for the current situation and
future aspirational scenarios representing more localized re-distributed manufacturing of bread
0
500
1000
1500
2000
2500
3000
3500
SCENARIO 1: CurrentSituation 98% Industrial
baking and 2% RDM (1.5%medium artisan and 0.5%
home baking)
SCENARIO 2a: Aspirational80% Industrial baking and20% RDM -medium artisan
SCENARIO 2b: Aspirational80% Industrial and 20%
RDM -home baking
SCENARIO 2c: Aspirational80% Industrial and 20%
RDM -optimum technology
Energy used (GWh) annually in the UK's Bakery Sector based on data from Carbon Trust (2010) assumming 100% bread produced industrially.
Scenario 1 represents current situation: 98% bread produced at centralised industrial scale and 2% produced at local s
RDM Optimum Technology
RDM Home
RDM medium artisan
INDUSTRIAL

Energy Feasibility Study Final report 71
8.2.2. Energy use and emissions for bread manufacturing if a change meant that
20% of the UK’s bread production was localised Re-Distributed Manufacturing
(RDM)
Based on total UK bread production data from the Carbon Trust study of 2010, the energy usage and
emissions of the UK's bakery sector were estimated for hypothetical aspirational scenarios where a
change would mean that 20% of all bread would be produced at local level, either as RDM -medium
/ artisan scale (Scenario 2a), or RDM -home scale (Scenario 2b), or RDM using optimum technology
available (Scenario 2c). The modelled scenarios are linked to energy intensity factors for different
technologies (e.g. electric and gas ovens, industrial milling) and scales (e.g. industrial, artisan and
home scales) reported in the literature (see Table 12). Results are presented in Tables 13 and 14,
and Figures 11 and 12, and indicate that energy usage and emissions, respectively, would increase if
20% of bread production was RDM, except in the case of using optimum technologies where
improvements both in terms of energy use and emissions can be made in comparison to the current
situation.
Analysing this in some detail, Scenario 2 in both Figures 11 and 12 shows that if 20% of the UK’s
bread was produced at medium /artisanal and home levels, the energy used and associated
emissions produced annually would increase significantly if compared to the current situation where
only approximately 2% of bread is baked at local scale (see Scenario 1 in Figures 11 and 12). This
increase in energy use would be the result of using much less efficient technologies to produce up to
20% of the national bread at local bakeries and medium to small baking facilities, and especially if
baking bread in private homes. Accordingly, emissions would also increase significantly (see
Scenarios 2a, 2b and 2c in Figure 12), although industrial baking would still be responsible for the
majority of emissions produced.
This would suggest that more localised production of bread would result in negative trends in energy
use and associated emissions for the bakery sector. However, results shown in Scenario 2c in
Figures 11 and 12 indicate that it is possible to produce 20% of the UK’s bread locally without
increasing energy usage and emissions.
Scenario 2c represents a modelled variation where data were used from a site investigated in the
Carbon Trust study of 2010, which produces 40,000 tonnes of bread per year15. This site was
considered to have the most efficient technology in place which meant the lowest energy
consumption of all 13 sites investigated. The energy requirements and associated emissions for the
UK’s bread manufacturing sector were calculated assuming that 20% of the bread in the UK would
be produced using this optimum technology at small scale (i.e. plants producing around 2-3 tonnes
per day -between 2,500 and 3,750-loaves of bread 800 grams each). Results shown in Scenario 2c in
Figures 11 and 12 indicate that this technology would enable to produce 20% of the UK’s bread
locally without increasing energy usage or emissions, as long as RDM optimum technologies would
replace existing less efficient medium / artisan scale, and home manufacturing technologies.
15
Note from section 8.1 that the most efficient plant in the UK is not the one with the largest production/largest scale, but a plant that produces c. 40,000 tonnes of bread per year (approximately 110 tonnes per day) and has a fossil fuel intensity of 0.40 kWh/kg of product, and electricity use of 0.14 kWh/kg of product.
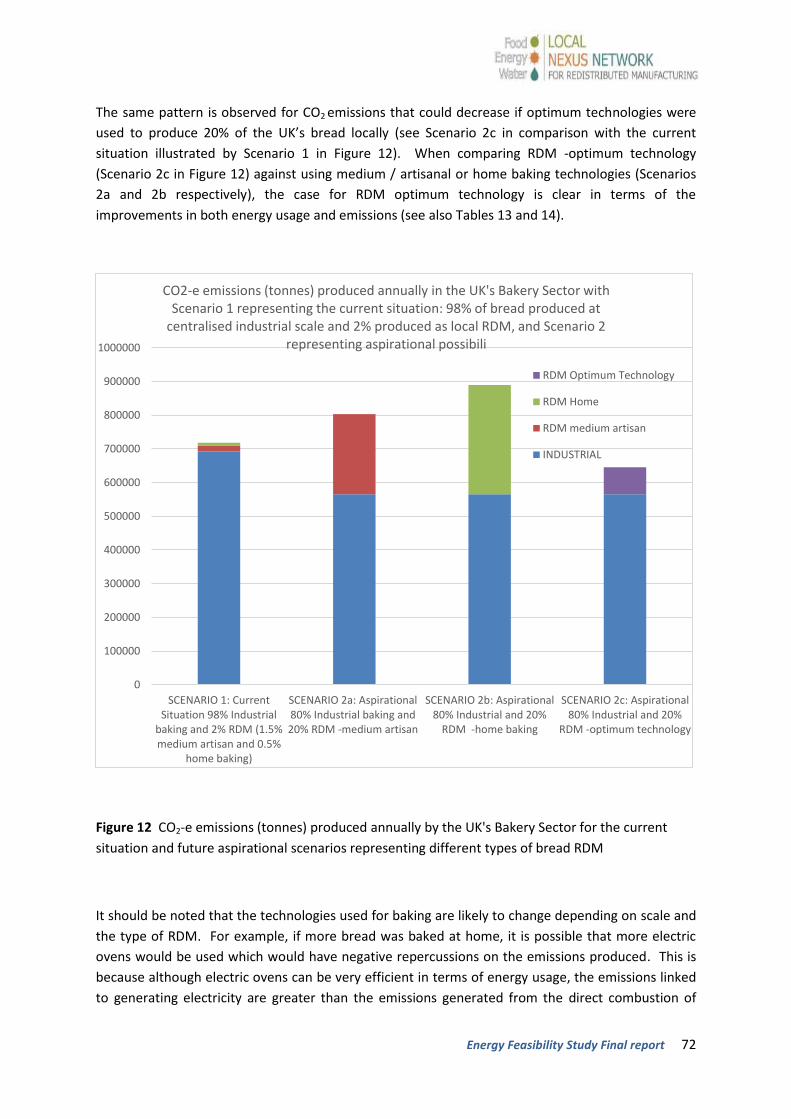
Energy Feasibility Study Final report 72
The same pattern is observed for CO2 emissions that could decrease if optimum technologies were
used to produce 20% of the UK’s bread locally (see Scenario 2c in comparison with the current
situation illustrated by Scenario 1 in Figure 12). When comparing RDM -optimum technology
(Scenario 2c in Figure 12) against using medium / artisanal or home baking technologies (Scenarios
2a and 2b respectively), the case for RDM optimum technology is clear in terms of the
improvements in both energy usage and emissions (see also Tables 13 and 14).
Figure 12 CO2-e emissions (tonnes) produced annually by the UK's Bakery Sector for the current
situation and future aspirational scenarios representing different types of bread RDM
It should be noted that the technologies used for baking are likely to change depending on scale and
the type of RDM. For example, if more bread was baked at home, it is possible that more electric
ovens would be used which would have negative repercussions on the emissions produced. This is
because although electric ovens can be very efficient in terms of energy usage, the emissions linked
to generating electricity are greater than the emissions generated from the direct combustion of
0
100000
200000
300000
400000
500000
600000
700000
800000
900000
1000000
SCENARIO 1: CurrentSituation 98% Industrial
baking and 2% RDM (1.5%medium artisan and 0.5%
home baking)
SCENARIO 2a: Aspirational80% Industrial baking and20% RDM -medium artisan
SCENARIO 2b: Aspirational80% Industrial and 20%
RDM -home baking
SCENARIO 2c: Aspirational80% Industrial and 20%
RDM -optimum technology
CO2-e emissions (tonnes) produced annually in the UK's Bakery Sector with Scenario 1 representing the current situation: 98% of bread produced at
centralised industrial scale and 2% produced as local RDM, and Scenario 2 representing aspirational possibili
RDM Optimum Technology
RDM Home
RDM medium artisan
INDUSTRIAL

Energy Feasibility Study Final report 73
natural gas in ovens. However, Figure 12 does not take this fact into account because the
breakdown of sources of energy used in the respective hypothetical RDM scenarios would have had
to be estimated. Thus, emissions have been factored based on energy usage and the current
breakdown of energy sources in baking, hence the similarities between Figures 11 and 12.
In order to compare energy use more easily, average power or demand, as in the rate of energy used
in a year in the UK's Bakery Sector, was also calculated for the two scenarios: current situation and
aspirational locally re-distributed manufactured bread. This meant that some assumptions had to be
made on the operational times of the different types of plants (e.g. industrial plants operate 24 h per
day 7 days a week, every week of the year versus RDM artisan or medium plant assumed to produce
5h per day, 6 days a week, every week except for 2 weeks of holidays -see above in section 8.2.1).
Average power data (GW) calculated per year for the different scales and RDM types are included in
summary Table 14. This analysis suggests that if 20% of the UK's bread was produced using the
optimum technology already employed in a middle size bakery plant (see section 8.1 for details),
then an overall annual reduction in average power of up to 0.123 GW could be achieved for the UK's
bakery sector.
It should be noted that in addition to the scenarios presented here, energy consumption for bread
manufacturing may also vary significantly depending on whether flour is milled using domestic/small
scale mills versus industrial mills as reported by Braschkat et al., (2004). This is an aspect that could
be further investigated in relation to RDM of bread in the UK if data are available.

Energy Feasibility Study Final report 74
Table 13 Energy data for analysed scenarios
SCENARIO 1: Current situation with 98% of the bread produced at the industrial scale and 2% at local RDM scale as a mix of Artisan (1.5%) and Home (0.5%) scales
SCENARIO 2: Aspirational scenario if 80% of UK bread was produced industrially plus 20% of the UK's bread was produced at the RDM Artisan or RDM Home scales, or at RDM scale with optimum technology
Scal
e
SOU
RC
E FO
R
DA
TA
Energy use for UK sector (GWh)- Carbon Trust 2010
Bread annual production (Kg) in UK - Carbon Trust 2010
Energy intensity factor kWh/kg of product
Breakdown of UK bread annual production (Kg) for different scales
Energy use UK sector (GWh) every year - various energy intensities
CO2-e emissions (tonnes per GWh)*
Power/ demand (GW) in the UK's bakery sector per year
Breakdown of UK bread annual production (Kg) for different scales
Energy use UK sector (GWh) every year -various energy intensities
CO2-e emissions (tonnes per GWh)*
Power/ demand (GW) in the UK's bakery sector per year
IND
UST
RIA
L B
AK
ING
Carbon Trust (2010) 2,000 2,500,000,000 0.80 2,450,000,000 1,960 558,600 0.224 2,000,000,000 1,600 456,000 0.183
Espinoza-Orias et al (2011) 2,000 2,500,000,000 0.75 2,450,000,000 1,838 523,688 0.210 2,000,000,000 1,500 427,500 0.172
Le-bail et al., (2010) 2,000 2,500,000,000 1.11 2,450,000,000 2,720 775,058 0.311 2,000,000,000 2,220 632,700 0.254
Braschkat et al, 2004 2,000 2,500,000,000 1.31 2,450,000,000 3,199 911,604 0.366 2,000,000,000 2,611 744,167 0.299
Mean 2,429 692,237 0.278 1,983 565,092 0.227
RD
M-m
ediu
m
arti
san
Braschkat et al, 2004 2,000 2,500,000,000 1.67 37,500,000 63 17,848 0.042 500,000,000 835 237,975 0.557
RD
M
H
OM
E Braschkat et al, 2004 -home bread makers, industrial mills 2,000 2,500,000,000 2.28 12,500,000 28 8,115 0.038 500,000,000 1,139 324,583 1.519

Energy Feasibility Study Final report 75
RD
M -
Tech
.
Op
tim
um
RDM optimum technology 1,405 2,500,000,000 0.56 500,000,000 281 80,085 0.032
Table 14 Summary data: Average
power / demand, Energy use and
CO2-e emissions data for analysed
scenarios
SCENARIO 1: Current situation: Power used and emissions produced annually in the UK's bakery sector with 98% bread produced at the Industrial scale and 2% at local RDM artisan (1.5%) and home (0.5%) scales
SCENARIO 2: Aspirational scenario: Power used and emissions produced annually in the UK's bakery sector if 80% of bread was produced at industrial scale and 20% of bread was produced at local scale (RDM Artisanal OR Home OR Optimum technology)
SOURCE for DATA
Scale Energy use (GWh)
CO2-e emissions (tonnes per GWh)
Average power / demand (GW)
Energy use (GWh)
CO2-e Emissions (tonnes per GWh)
Average power / demand (GW)
Average misc sources
INDUSTRIAL 2,429 692,237 0.278 1,983 565,092 0.227
Braschkat et al, 2004
RDM medium artisan 63 17,848 0.042 835 237,975 0.557
Braschkat et al, 2004
RDM Home 28 8,115 0.038 1,139 324,583 1.519
Carbon Trust 2010
RDM Optimum Technology
281 80,085 0.032
Also see below data for conversion factors used in this analysis
CONVERSION FACTOR USED which is in agreement with conversion factors for indirect and direct energy source reported by DEFRA, 2015 (below) Source: Carbon Trust, 2010 (derived from energy and emissions data in Carbon Trust 2010 study)
Unit Tonnes CO2e Unit kg CO2e
tonnes per GWh 285 kWh 0.285
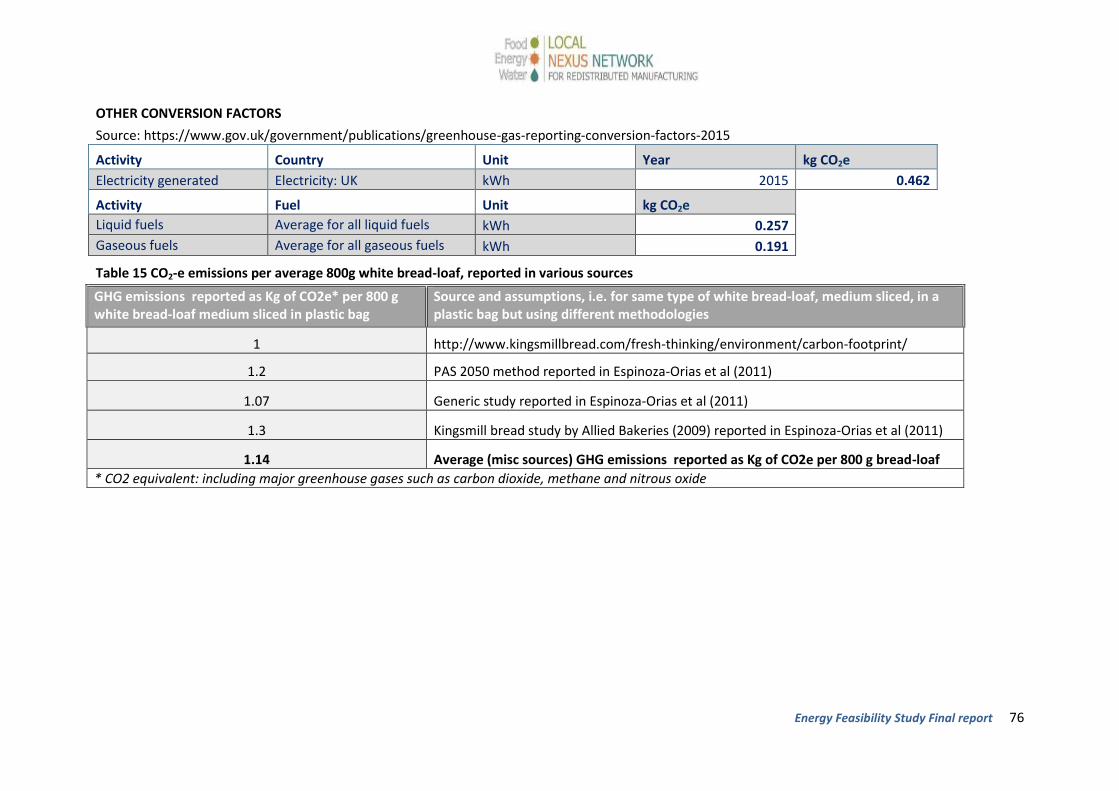
Energy Feasibility Study Final report 76
OTHER CONVERSION FACTORS
Source: https://www.gov.uk/government/publications/greenhouse-gas-reporting-conversion-factors-2015
Activity Country Unit Year kg CO2e
Electricity generated Electricity: UK kWh 2015 0.462
Activity Fuel Unit kg CO2e Liquid fuels Average for all liquid fuels kWh 0.257
Gaseous fuels Average for all gaseous fuels kWh 0.191
Table 15 CO2-e emissions per average 800g white bread-loaf, reported in various sources
GHG emissions reported as Kg of CO2e* per 800 g white bread-loaf medium sliced in plastic bag
Source and assumptions, i.e. for same type of white bread-loaf, medium sliced, in a plastic bag but using different methodologies
1 http://www.kingsmillbread.com/fresh-thinking/environment/carbon-footprint/
1.2 PAS 2050 method reported in Espinoza-Orias et al (2011)
1.07 Generic study reported in Espinoza-Orias et al (2011)
1.3 Kingsmill bread study by Allied Bakeries (2009) reported in Espinoza-Orias et al (2011)
1.14 Average (misc sources) GHG emissions reported as Kg of CO2e per 800 g bread-loaf
* CO2 equivalent: including major greenhouse gases such as carbon dioxide, methane and nitrous oxide
Energy Feasibility Study Final report 77
8.3. Renewable sources of energy
When undertaking this investigation some questions were outlined also around the implications in
terms of energy and emissions if renewable sources of energy were to be used at the local level, i.e:
▪ What are the implications in terms of energy use if using renewable sources of energy at
local level (e.g. solar, hydro, biomass/CHP) in the milling and baking processes? (i.e. using
data from interviews and site visits, e.g. monthly energy bills, flour tonnage, bread
production). What are the operational energy (and emissions) savings in the A mill that uses
hydro and in the bakery plant & shop that has installed solar panels? What are the savings in
the gas and electricity bills?
▪ Based on fieldwork and interviews, is it possible to estimate energy consumption for local
manufacturers and what they would save with localised renewables over a horizon of 20
years? Is it possible to estimate the energy consumption of the wider supply chain for bread
and tomato puree?
However a problem was faced around insufficient data on energy and water monthly bills, flour
tonnage, bread and tomatoes production etc. from the tomatoes nursery, mills, bakery plant and
shop visited as part of this project. Only limited information was made available that would enable
to calculate energy consumption using various energy intensities for local baking from the literature.
Nevertheless, some theoretical calculations based on the limited information available are
presented here in order to shed some light into the potential improvements that renewable sources
of energy can bring to local scale manufacturing, although of course there could be some barriers to
realise this theoretical potential.
The owner of mill A reported that their energy bill (electricity to move flour around) is £7,000 per
month plus 10% carbon tax they have to pay= £8,400 per year. In 3 years their hydro power
generator has produced 0.5 million kWh, which equates roughly to 13,888 kWh per month or 17.3%
of the mill's energy needs, based on information that their energy use is 80,000 kWh per month.
This presents some significant energy and emissions savings derived from localised hydropower,
however the owner also reported that it is not always reliable and that in the last three months
previous to the interview (July to September 2015) no hydro-electricity had been generated on the
site due to low flows in the rivers.
The owner of the bakery plant and shop visited reported that energy consumption at the
Oxfordshire shop and bakery is c. 5,000 kWh per month (mains electricity provided by British Gas).
The newly installed solar panels had produced 3,300 kWh from April to October 2015 (6 months) at
the time of the interview. This means that 11% of their energy needs are being generated via the
newly installed solar panels.
According to data provided in interview by the owner of a local scale bakery facility and shops in
Oxfordshire, 1 tonne of flour produces 1.6 tonnes of bread, and they are using 4.5 to 5 tonnes (5,000
kg) of flour per week, thus 8 tonnes (8,000 kg) of bread (and cakes) per week. Using the optimum
technology available which has an energy intensity factor of 0.56 kWh per kg of product, this would
Energy Feasibility Study Final report 78
mean 8,000 kg*0.56 kWh per kg of product per week, thus 4,480 kWh per week (c. 20,000 kWh
monthly) for the bakery shop and bakery plant combined.
Data provided for the small bakery shop indicates that they use 5,000 kWh of electric energy per
month, of which 11% is generated via newly installed solar panels on the roof of the small shop.
Data on energy consumption for the main production facility was not provided but it is assumed that
this must be at least 10 times the size of the local bakery shop, thus using around 40,000- 50,000
kWh per month.
It is expected that with the optimum technology, energy use could be halved, or at least reduced
very significantly. This is in agreement with the feedback received from the owner who stated that
their electric ovens & mixers are old (from the late 1980s), and that even new ones in their main
bakery facility (not visited) are not too efficient. He said to regret not to have invested in ovens
fuelled by pellets/biomass instead of these new electric ones because they are not as efficient as
expected.
It should also be mentioned here that large scale plants and mills could also invest in renewables,
although some barriers were already pointed out, for example on roof space limitations to install
solar panels. More efficient large scale mills may have much more efficient conveyors and machines
to mill larger tonnage of mill, but the roof space of the plant may only be slightly larger than that of
an older less efficient small scale localised mill. Thus, theoretical energy savings may be difficult to
realise in practice due to physical limitations. In this instance, the physical characteristics of mills
that tend to be tall buildings with limited footprint and roof area could work against the feasibility of
installing solar panels in centralised/large scale mills with high energy requirements compared with
the RDM scale, where renewables such as solar energy might be suitable to be installed in the roof
space available in order to produce at least part of the energy needs of a mill.
Other small-scale technologies are summarised below which could be useful for off-grid contexts.
Thus, it is noted that these technologies may not be relevant in the UK context especially when it is
doubtful that liquid or gaseous fuels would be valuable in bread-making compared with options such
as going all electric.
8.4. Small-scale technologies
Solar hydrogen and other small-scale technologies could also be of interest as a source of energy for
RDM in the UK. Solar hydrogen systems consisting of an electrolyser powered by photovoltaic
panels to produce hydrogen as fuel have been tested around the world in renewable energy
systems, and industrial and domestic applications, but only recently have been reported for small-
scale cooking applications in a small communities in Jamaica (Topriska et al., 2015a) and Ghana
(Topriska et al., 2015b).
In regions with high solar irradiance using hydrogen as cooking gas produced through photovoltaics
powered electrolysis can help achieve development and is a sustainable process to provide an
energy system with little environmental cost because electrolysis is an emission free process. A

Energy Feasibility Study Final report 79
calibrated model was used to develop a large scale case study analysis for a small community in
Jamaica with a daily cooking demand of 39.6 kWh (1.7 kg of H2 gas, see Topriska et al., 2015a). The
model simulations of the system indicate that the proposed hydrogen production plan would be
sufficient to meet the cooking needs of the community with some extra hydrogen to act as backup.
The system has important capital cost but operational costs (maintenance) are minor as well as are
the embedded emissions of the solar panel materials. The study concludes that a government-
funded solar hydrogen plant is a viable and sustainable way of providing free or very low price
cooking fuel to developing country communities.
In the case of Ghanaian households, fieldwork was conducted in three south-east Ghana villages,
where main cooking fuels in 57% of the households were charcoal and firewood. Consumption,
prices and emissions were calculated and a study was conducted on a small participating community
on the effects of replacing these fuels with an autonomous solar hydrogen system for the supply of
hydrogen cooking gas. The daily cooking demand of the study area was found to be 2.5kWh and the
modelled annual cooking demand of the small participating community is 784kg of hydrogen with an
optimum system designed that provides 808kg. It was calculated that using hydrogen avoids the
emission of 1986 tonnes of CO2 per year (Topriska et al., 2015b).

Energy Feasibility Study Final report 80
9. Conclusions
Following the literature review, data collection, and stakeholders engagement presented in Sections
2 to 6 of this report, a series of key questions were outlined which are relevant to the energy study:
What are the critical differences between local and centralised bread and tomato paste
manufacturing? e.g. technologies, supply and value chains.
How do centralised and localised bread manufacturing perform relative to each other – what
are the key performance indicators (environmental such as water and energy savings,
decentralisation, transport, employment, waste etc.) that could be used to compare them?
If possible in this study, how do centralised and localised tomato paste manufacturing
compare?
What are the energy and emissions implications of downscaling production / redistributing
manufacturing? Would buying locally made bread every day, for example, help reducing
bread waste, thus avoiding wasted energy and water? Would this contribute to a reduction
in energy linked to transportation of bread from far away locations?
The detailed analysis presented in Sections 7 and 8 of this report addressed some of these key
questions while focusing on bread manufacturing only. Results presented in Sections 7 and 8 are
based on data from a comprehensive study by the Carbon Trust (2010) that considered the annual
energy used and bread production of 89 industrial bakery plants constituting the UK’s bakery sector.
The study provided detailed energy consumption data for 13 of these plants, and a breakdown by
energy type (i.e. natural gas, electricity) in the sector. This allowed for some coarse calculations
about the potential energy use and emissions linked to using either only natural gas or electricity to
manufacture bread in the UK. Results indicate that if only natural gas technologies were used
instead of the current mix of electricity, natural gas and other, and assuming the same emission
factors per energy source used in the Carbon Trust study in 2010, overall emissions for the sector
could go down by as much as 35% from 570,000 to 371,420 tonnes of CO2-e per year. If only
electricity-based technologies were used, overall emissions for the sector would increase by 87%
from 570,000 to 1,071,420 tonnes of CO2-e per year. This is because technology-wise, although
electric ovens are generally more energy efficient than gas-fired ovens, the combustion of gas
directly in the plant would produce fewer emissions than electricity generated using any form of
fossil fuels, which is more carbon-intensive than direct use of gas.
Also, it should be noted that these figures are coarse estimates, and emission factors per energy
source have varied in the last few years. Moreover, going for 100% gas or electric apparatus in the
sector is not realistic as this might not be feasible, hence the hypothetical scenarios used in this
study were intended to highlight the differences in emissions between using one technology over
another.
Results of the analysis of data from the Carbon Trust study also suggest that when considering fossil
fuel usage (natural gas) and production across the range of 13 plants studied in more detail, the
smaller production plants are less efficient than large plants. However, regarding electricity use and
production, this was more consistent across all sites regardless of the scale of production. Another
important conclusion is that a particular site, site 4, appeared to be the most efficient of all plants
studied in both electricity and fossil fuel usage despite not being a large-scale operation. This most
Energy Feasibility Study Final report 81
efficient plant produces around 40,000 tonnes of bread per year and has a fossil fuel intensity of
0.40 kWh/kg of product, and electricity use of 0.14 kWh/kg of product. Thus in this case, efficiency
seemed to be linked to optimum technology and practices, not to scale of production.
Other findings include the possibility of energy savings if technology for the optimisation of flue gas
was widely used in the UK's bakery sector. Energy savings of up to 4.7% could be achieved simply by
improving ventilation in ovens, which in the UK's bakery sector could mean a reduction from 1,440
GWh gas energy use reported by the Carbon Trust (2010) down to 1,372 GWh used by the sector.
Furthermore, the analysis concludes that energy savings of up to 528 GWh per year in the UK could
be achieved by avoiding bread wastage, which represents approximately 1/4 of the current total
energy used in the sector (2,000 GWh as per the Carbon Trust 2010 study). Also, some energy
estimated to be up to 198 GWh could be generated using anaerobic digestion from 660,000 tonnes
of bread wasted in the UK every year. This represents approximately 10% of the current total energy
used in the sector, and in addition fertilizer could also be produced out of the digestate.
It should be noted that the ‘whole sector’ approach (scaling up to the whole sector) used for the
above calculations simply aims to illustrate the improvements in performance that best technologies
can bring about by comparing these with most common technologies and current energy use in the
sector. This approach does not attempt to suggest that whole sector changes are feasible or
desirable.
Based on the findings above, a series of scenarios were modelled to analyse energy consumption
and emissions for the bread manufacturing at different scales in the UK. A benchmarking scenario
was first modelled that represents the current situation in the sector with an estimated 98% of all
bread consumed in the UK being produced in the industrial sector, and 2% of bread assumed to be
produced at local level in medium to small scale plants and artisan bakeries (1.5%) and at home
(0.5%) using current technologies. These were referred to as RDM -medium / artisan scale, and RDM
-home scale scenarios respectively. The current situation scenario was then compared against a
scenario where 20% of the UK’s bread would be produced at local level by either RDM at the
medium / artisan scale, or RDM at the home scale, or by RDM using the best available technology
available as reported for site 4 above.
The detailed analysis shows that if 20% of the UK’s bread was produced at medium / artisanal and
home level, the energy used and associated emissions produced annually would increase
significantly compared to the current situation where only approximately 2% of bread is baked at
local scale. This increase in energy use would be the result of using much less efficient technologies
at local bakeries, and especially in homes to produce up to 20% of the national bread. Emissions
would also increase significantly, although industrial baking would still be responsible for the
majority of energy usage and emissions produced in the sector. However, improvements in energy
usage appear possible if bread production was localised, but optimum technologies were used. This
would result also in a substantial reduction in emissions in comparison with the current situation.
When considering the average power or demand (in GW), as in the rate of energy used in a period of
time (a year) for the different scales, the analysis in this study shows that if 20% of the UK’s bread
production was decentralised at the local level by using RDM -medium /artisan bakeries and RDM –

Energy Feasibility Study Final report 82
home baking, the average energy demand and associated emissions for the bakery sector would
increase. However, significant reductions in overall energy demand of up to 0.123 GW could be
achieve for the sector if using RDM -optimum technologies similar to that already employed in a
highly efficient middle size bakery plant in the country.
Finally, based on limited data collected during site investigations, some estimates were calculated to
illustrate the potential for renewable energies at local level. This exercise suggests that one of the
local mills visited around Oxford can generate up to 17% of their energy needs using a local hydro
power generator on one of their sites. Similarly, the newly installed solar panels on a small
combined bakery facility and shop near Oxford produced approximately 11% of their energy needs.
It was noted through site visits and interviews, that proximity to rivers and limitations in river flows
for hydroelectricity generation, as well as limitations in roof-space for solar energy could make these
options more attractive for the small localised manufacturing scale than for the large centralised
scale.

Energy Feasibility Study Final report 83
10. Future research
Some areas requiring further investigation have been outlined for the bread and tomato paste case
studies in section 5.1 following the presentation of results from interviews and site visits. Other
areas that would benefit from further research were highlighted by stakeholders and are
summarised in section 6.1 of this report. This section builds on the findings from sections 5.1 and
6.1 and highlights areas of interest for future research with an energy focus based on data gaps
identified in sections 7 and 8 of this study, as follows:
Undertaking a detailed supply chain and energy feasibility study for the tomato paste case
similar to the analysis presented for bread in this report. Energy analysis for growing
tomatoes and producing tomato paste locally based on supply chain configurations as
follows:
This figure depicts a possible supply chain configuration for local scale tomatoes and tomato puree
manufacturing for the study of the energy implications of moving from centralised conventional to
localised / redistributed manufacturing of tomato puree
Data collection and further exploration of the potential for symbiotic processes to re-
use/optimise energy, water and waste/ waste by-products, such as using wasted energy
from other industries in milling and baking processes (e.g. using heat from steam/water
from cooling towers in power stations for district heating and local bakeries, using waste
heat from bakeries or district heating for milling, potential to capture and store heat from
ovens in under-ground water reservoirs to re-use heat and water in other processes/
industries such as nearby tomatoes green-houses, collecting and storing rainwater from
green-houses roofs).
Energy Feasibility Study Final report 84
Study geographical implications of relocating manufacturing facilities (e.g. potential for
relocating greenhouses near industries with excess energy losses such as bakery plants).
Data collection and further exploration of the potential for ground-source heat pumps
(specially ground-sourced heat coils under green-houses), CHPs/biomass, energy from
waste, solar, wind and hydro in the milling and bread manufacturing sectors.
Data collection and investigation of the operational emissions and potential for emissions
reduction if more solar and hydro were used instead of gas or grid-electricity at local level.
Investigate energy decentralisation and the role of policy in promoting localised renewable
energy sources (e.g. biomass /CHPs, solar, energy from waste, wind, hydro, biogas for
villages as exchange for free/cheap electricity)
Data collection and investigation of the links between potential for decentralised water
treatment plants and links to biogas.
Investigate if efficiencies are possible when using hydrogen for cooking at local scale in UK.
Further research the implications for energy up and down the full food supply chain (not
only focussing in the manufacturing processes, including energy from waste in the studied
or other food supply chains).
Investigate potential for water re-use, and water and energy nexuses for suitable foods
and their full supply chain (e.g. upstream water and energy footprints in agriculture,
rainwater harvesting from green-houses, grey water/ effluent recycling and heat storage for
processing).
Data collection and calculation of energy savings linked to rainwater harvesting and grey
water recycling (e.g. for tomatoes -if possible completing information collected from
interviews and fieldwork- and other food supply chains).
Data collection and study energy savings in relation to economic savings (i.e. savings in
emissions and energy bills over a horizon of 20 years if alternative energy sources were
used).
Data collection and study energy use for bread manufacturing depending on whether flour is milled using domestic and/or small scale local mills (relevant in relation to RDM of bread in the UK if data are available) versus industrial centralised mills.
Energy Feasibility Study Final report 85
References
Abubakar, M. S., Umar, B. and Ahmad, D. (2010) ‘Energy Use Patterns in Tomato Paste Production: A
case study of Savannah Integrated Farms Limited, Dadinkowa, Gombe State, Nigeria’,
International Journal of Engineering & Technology, IJET-IJENS Vol: 10 No: 01 16.
Allan, J.A. (1998) ‘Virtual water: a strategic resource, global solutions to regional conflicts.
Groundwater 36 (4), 545-546.
Allan, J.A. (2012) ‘The Middle East Water Question: Hydropolitics and the Global Economy’,
published by Tauris 30 Jul 2012, first edition 2002, 387 pp.
Amón, R., Maulhardt, M., Wong, T., Kazama, D. and Simmons, C.W. (2015) ‘Waste heat and water
recovery opportunities in California tomato paste processing’, Applied Thermal Engineering, Vol
78, 5 March 2015, p. 525-532, ISSN 1359-4311
http://dx.doi.org/10.1016/j.applthermaleng.2014.11.081
Barling D., Sharpe, R. and Lang, T. (2011) ‘Traceability and ethical concerns in the UK wheat—bread
chain: from food safety to provenance to transparency’, International Journal of Agricultural
Sustainability, http://www.tandfonline.com/loi/tags20 Published online: 08 Jun 2011
Bazilian, M., Rogner, H. Howells, M., Hermann, S., Arent, D., Gielen, D., Steduto, P., Mueller, A.
Komor, P., Tol, R. S. J. and Yumkella, K. K. (2011) ‘Considering the energy, water and food nexus:
towards an integrated modelling approach’, Energy Policy, 39 (2011) 7896-7906.
Beddington J. (2009) ‘Food, energy, water and the climate: a perfect storm of global events?’ In
Conference presentation given to the Sustainable Development UK Annual Conference, QEII
Conference Centre, London, 19 March 2009. See http://www.bis.gov.uk/assets/goscience/docs/p/perfect-
storm-paper.pdf (accessed 11 May 2015).
Beech, G. A. (1980) Energy use in bread baking’, First published in 1980 in the Journal of the Science
of Food and Agriculture, Volume 31, Issue 3, pages 289–298, March 1980, the Society of Chemical
Industry, John Wiley & Sons, Ltd. Article published online: 19 SEP 2006. DOI:
10.1002/jsfa.2740310314
Boye, J. I. (2015) ‘Nutraceutical and Functional Food Processing Technology’, Wiley-Blackwell ISBN:
978-1-118-50494-9, January 2015, pp. 400.
Braschkat, J., Patyk, A., Quirin, M., & Reinhardt, G. A. (2004) ‘Life cycle assessment of bread
production - a comparison of eight different Scenarios’. In Halberg, N. (ed.) ‘Life Cycle
Assessment’ DIAS report, Danish Institute of Agricultural Sciences, Department of Agro-ecology,
2004.
Carlsson-Kanyama, A. and Faist, M. (2000) ‘Energy Use in the Food Sector: a data survey’,
Environmental Strategies Research Group, Stockholm University, Sweden and Department of Civil
and Environmental Engineering, Swiss Federal Institute of Technology, Switzerland.

Energy Feasibility Study Final report 86
Carbon Trust (2010) ‘Industrial Energy Efficiency Accelerator - Guide to the industrial bakery sector’,
known as Industrial bakery report CTG034 prepared by the Carbon Trust from the technical work
completed by SKM Enviros Ltd with assistance from the Food and Drink Association, pp. 65.
Carbon Trust (2015a) (study by Ashcroft) ‘Improving the efficiency of bakery ovens case study’,
report CTS402. http://www.carbontrust.com/media/642185/cts402-improving-efficiency-of-
bakery-ovens.pdf
Carbon Trust (2015b) reporting on ‘Taking the hot air out of baking bread’, 2 April 2015, see
http://www.carbontrust.com/about-us/press/2015/04/carbon-trust-takes-the-hot-air-out-of-
baking-bread
Chapagain, A.K., Hoekstra, A. Y. and Savenije, H.H.G. (2006), ‘Water saving through international
trade of agricultural products’, Hydrology and Earth System Sciences,2006, 10(3), 455-468.
Charles, R., Jolliet, O., Gaillard, G. and Pellet, D. (2006) ‘Environmental analysis of intensity level in
wheat crop production using life cycle assessment’, Agriculture, Ecosystems and Environment,
113, pp. 216-225.
Crook, A. W. (Ed.) (1994) ‘Profiting from Low-grade Heat: Thermodynamic Cycles for Low-
temperature Heat sources’, published by the Institution of Electrical Engineers, the Watt
Committee Energy report No. 26.
CSS (2014) ‘U.S. Water Supply and Distribution Factsheet’, Centre for Sustainable Systems, University
of Michigan Pub. No. CSS05-17. October 2014 www.css.snre.umich.edu/css_doc/CSS05-17
DECC (2014) ‘UK GHG Emissions Provisional Figures, Statistical release’, Department of Energy and
Climate Change, www.gov.uk/government/organisations/department-of-energy-climate-change
DEFRA (2011) ‘Water Usage in Agriculture and Horticulture; Results from the Farm Business Survey
2009/10 and the Irrigation Survey 2010.
Drax Group (2012) ‘Drax Power Station Environmental Performance Review’, pp.30.
Espinoza-Orias, N., Stichnothe, H. and Azapagic, A. (2011) ‘The carbon footprint of bread’,
International Journal of Life Cycle Assessment, 16:351–365. DOI 10.1007/s11367-011-0271-0.
Galli, F., Bartolini, F., Brunori, G., Colombo, L., Gava, O., Grando, S. and Marescotti, A. (2015)
‘Sustainability assessment of food supply chains: an application to local and global bread in Italy’
Agricultural and Food Economics, 3:21, DOI 10.1186/s40100-015-0039-0.
Gerbens-Leenes, P.W., Hoekstra, A.Y. and van der Meer, Th. (2009) ‘The water footprint of energy
from biomass: A quantitative assessment and consequences of an increasing share of bio-energy
in energy supply’, Ecological Economics, 68, 2009, p. 1052-1060.
HM Government (2009) ‘The UK Low Carbon Transition Plan. National strategy for climate and
energy’. Presented to Parliament pursuant to Sections 12 and 14 of the Climate Change Act 2008.
http://www.carbontrust.com/about-us/press/2015/04/carbon-trust-takes-the-hot-air-out-of-baking-bread

Energy Feasibility Study Final report 87
Amended 20th July 2009 from the version laid before Parliament on 15th July 2009, published by
TSO (The Stationery Office) pp. 223.
Hoekstra, A. Y. (2003), ‘Virtual Water Trade: Proceedings of the International Expert Meeting on
Virtual Water Trade’, Delft, The Netherlands,12-13 December 2002, Value of Water Research
Report Series no. 12. UNESCO-IHE Delft, The Netherlands, 248 pp.
Hummel, M., Kranzl, L., Hummel, F., Brunner, C. and Fluch, J. (2013) ‘Reducing Fuel Consumption in
Industry: Assessment of the Economic Efficiency of the Integration of Solar Thermal Energy into
Industrial Processes’, 2013 ACEEE Summer Study on Energy Efficiency in Industry.
IPCC (2014) ‘Climate Change 2014: Synthesis Report. Contribution of Working Groups I, II and III to
the Fifth Assessment Report of the Intergovernmental Panel on Climate Change’. Core Writing
Team, R.K. Pachauri and L.A. Meyer (eds.). IPCC, Geneva, Switzerland, 151 pp.
IPCC (2013), ‘Climate Change 2013: The Physical Science Basis. Contribution of Working Group I to
the Fifth Assessment Report of the Intergovernmental Panel on Climate Change’. Stocker, T.F., D.
Qin, G.-K. Plattner, M. Tignor, S.K. Allen, J. Boschung, A. Nauels, Y. Xia, V. Bex and P.M. Midgley
(eds.). Cambridge University Press, Cambridge, United Kingdom and New York, NY, USA, 1535 pp.
Jordaan, S., Diaz-Anadon, L., Mielke, E. and Schrag D. (2013) ‘Regional Water Implications of
Reducing Oil Imports with Liquid Transportation Fuel Alternatives in the United States’, Journal
Article, Environmental Science and Technology, Vol 47, issue 21, pages 11976-11984, November
5, 2013.
Karakaya and Özilgen (2011) ‘Energy utilization and carbon dioxide emission in the fresh, paste,
whole-peeled, diced, and juiced tomato production processes’, Energy xxx (2011), p. 1-10.
doi:10.1016/j.energy.2011.06.007
Karakaya and Özilgen (2011) ‘Energy utilization and carbon dioxide emission in the fresh, paste,
whole-peeled, diced, and juiced tomato production processes’, Energy xxx (2011), p. 1-10.
doi:10.1016/j.energy.2011.06.007
King, S.J., Ceulemans, R., Albaugh, J.M., Dillen, S. Y., Domec, J. C., Fichot, R., Fischer, M., Leggett, Z.,
Sucre, E., Trnka, M. and Zenone, T. (2013) ‘The Challenge of Lignocellulosic Bioenergy in a Water-
Limited World’, BioScience, February 2013, Vol. 63 No. 2, p. 102-117.
Kingsmill see http://www.kingsmillbread.com/fresh-thinking/environment/carbon-footprint
(accessed April 2016)
Le-bail, A., Dessev, T., Jury, V., Zuniga, R., Park, T., and Pitroff, M. (2010) ‘Energy demand for selected
bread making processes: Conventional versus part baked frozen technologies’, Journal of Food
Engineering 96 (2010) 510–519.
Leck, H. Conway, D, Bradshaw, M. and Rees, J. (2015), ‘Tracing the Water-Energy-Food Nexus:
Description, Theory and Practice’, Geography Compass 9/8 (2015): 445-460, Wiley and Sons Ltd.
Mahony, T., O’Flaherty, V., Colleran, E., Killilea, E., Scott, S. and Curtis, J. (2002) ‘Feasibility study for
centralised anaerobic digestion for treatment of various wastes and wastewaters in sensitive
Energy Feasibility Study Final report 88
catchment areas’, 2002 Final Project Report for the Environmental Protection Authority (EPA)
Ireland, Project Co-ordinator: Professor Emer Colleran, IRELAND.
Manfredi, M. and Vignali, G. (2014) ‘Life cycle assessment of a packaged tomato puree: a
comparison of environmental impacts produced by different life cycle phases’, Journal of Cleaner
Production, Vol 73 (2014), p. 275-284.
Manfredi, M. and Vignali, G. (2014) ‘Life cycle assessment of a packaged tomato puree: a
comparison of environmental impacts produced by different life cycle phases’, Journal of Cleaner
Production, Vol 73 (2014), p. 275-284.
Martínez-Blanco, J., Muñoz, P., Antón, A., and Rieradevall, J. (2011) ‘Assessment of tomato
Mediterranean production in open-field and standard multi-tunnel greenhouse, with compost or
mineral fertilizers, from an agricultural and environmental standpoint’, Journal of Cleaner
Production 19 (2011) 985-997.
McKinsey & Company (2009) ‘Charting Our Water Future: Economic frameworks to inform decision-
making’, 2030 Water Resources Group, p. 185.
Mekonnen, M.M. and Hoekstra, A. Y. (2011) ‘The green, blue and grey water footprint of crops and
derived crop products’, Hydrology and Earth System Sciences, 15, 1577–1600. www.hydrol-earth-
syst-sci.net/15/1577/2011/doi:10.5194/hess-15-1577-2011
Mielke, E., Diaz-Anadon, L. and Narayanamurti, V. (2010) ‘Water consumption of energy resource
extraction, processing, and conversion. A review of the literature for estimates of water intensity
of energy resource extraction, processing to fuels, and conversion to electricity’, Energy
Technology Innovation Policy Discussion Paper Series, Discussion Paper No. 2010-15, October
2010, Harvard Kennedy School.
Mohtar, R. H. and Daher, B. (2012) ‘Water, Energy, and Food: the Ultimate Nexus’, Encyclopedia of
Agricultural, Food and Biological Engineering. Second Edition.
Morning Star Company (2014) 2014 Tomato paste and processed tomato statistics.
http://morningstarco.com/statdocs/2014_Tomato_Stats.pdf
OECD (2010) ‘Sustainable Management of Water Resources in Agriculture’, published by the
Organisation for Economic Co-operation and Development (OECD), p. 122.
Özilgen and Sorgüven (2011) ‘Energy and exergy utilization, and carbon dioxide emission in
vegetable oil production’, Energy 36 (2011), pp. 5954-5967.
Paton J. B. (2013) ‘Energy utilisation in commercial bread baking’, PhD thesis.
Payen S., Basset-Mens, C. and Perret, S. (2015) ‘LCA of local and imported tomato: an energy and
water trade-off‘, Journal of Cleaner Production 87 (2015) 139-148.
PG & E (2008) ‘Tomato Processing Industry Ripe for MVR Technology’, Factsheet of PG & E -Pacific
Gas and Electric Company, a subsidiary of PG & E Corporation, under the auspices of the
California Public Utilities Commission, January 2008 C-3099.

Energy Feasibility Study Final report 89
Ringler C., Bhaduri, A. and Lawford, R. (2013) ‘The nexus across water, energy, land and food (WELF):
potential for improved resource use efficiency?’, Current Opinion in Environmental Sustainability
2013, 5:617–624.
Rumsey, T. R., Conant, T. T., Fortis, T., Scott, E.P., Pedersen, L. D. and Rose, W. W. (1984) ‘Energy use
in tomato paste evaporation’, Journal of Food Process Engineering, 1984, Vol.7(2), p.111-121.
Article published online: 30 JAN 2007, DOI: 10.1111/j.1745-4530.1984.tb00641.x
Semiat, R. (2008) ‘Energy Issues in Desalination Processes’, Environmental Science & Technology,
VOL. 42, NO. 22, 2008 / 9 8193.
Tassou, S.A., Kolokotroni, M., Gowreesunker, B., Stojceska, V., Azapagic, A., Fryer, P. and Bakalis, S.
(2014) ‘Energy demand and reduction opportunities in the UK food chain’. Proceedings of the
Institution of Civil Engineers, Energy Volume 167 Issue EN3, August 2014, Pages 162–170
http://dx.doi.org/10.1680/ener.14.000
Tesco (2014) ‘Food waste hotspots’ see
http://www.tescoplc.com/assets/files/cms/Resources/Food_waste/T_S_Hotspots_190514v3.pdf
Tesco (2015) ‘Corporate responsibility 2014/15 half-year update’ http://library.the-
group.net/tesco/client_upload/file/Half_year_report_2014_15.pdf
Topriska, E., Kolokotroni, M., Dehouche, Z. and Wilson, E.A. (2015a) ‘Solar hydrogen system for
cooking applications: Experimental and numerical study’, Renewable Energy 83 (2015) 717-728.
Topriska, E., Kolokotroni, M., Dehouche, Z., Novieto, D. T. and Wilson, E.A. (2015b) ‘Analysis of
domestic cooking fuels demand in Ghana: field work and case study application of solar hydrogen
cooking systems’, WREC XIV Proceedings, University POLITEHNICA of Bucharest, Romania, June 8
– 12, 2015.
Trueblood, A.J., Wu, Y. Y. and Ganji, A. R. (2013) ‘Potential for energy, peak demand, and water
savings in California tomato processing facilities’, Industrial Energy Technology Conference, New
Orleans, LA May 21-24, 2013.
WEF -World Economic Forum (2011) ‘Water Security: the Water-Food-Energy-Climate Nexus’
Chapter 2: Energy. Inland Press, the Centre for Resource Economics, Waughray D. (Ed).
Williams, A.G., Audsley, E. and Sandars, D.L. (2006) Determining the environmental burdens and
resource use in the production of agricultural and horticultural commodities. Main Report and
Executive Summary, Defra Research Project IS0205. Bedford: Cranfield University and Defra.
Available on www.silsoe.cranfield.ac.uk, and www.defra.gov.uk
WRAP (2012) Household food and drink waste in the United Kingdom 2012
WRAP (2013) ‘Hotspots, opportunities & initiatives: Bread & rolls’, May 2013, see
http://www.wrap.org.uk/sites/files/wrap/Bread%20&%20rolls%20v1.pdf
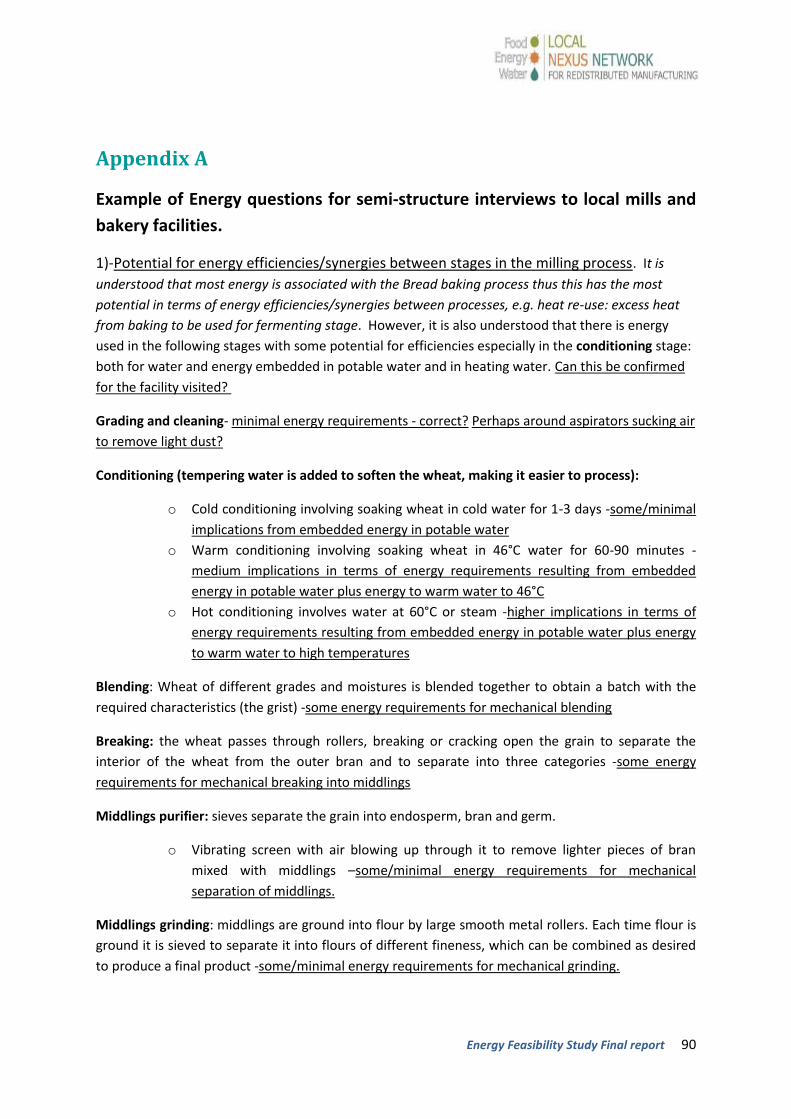
Energy Feasibility Study Final report 90
Appendix A
Example of Energy questions for semi-structure interviews to local mills and
bakery facilities.
1)-Potential for energy efficiencies/synergies between stages in the milling process. It is
understood that most energy is associated with the Bread baking process thus this has the most
potential in terms of energy efficiencies/synergies between processes, e.g. heat re-use: excess heat
from baking to be used for fermenting stage. However, it is also understood that there is energy
used in the following stages with some potential for efficiencies especially in the conditioning stage:
both for water and energy embedded in potable water and in heating water. Can this be confirmed
for the facility visited?
Grading and cleaning- minimal energy requirements - correct? Perhaps around aspirators sucking air
to remove light dust?
Conditioning (tempering water is added to soften the wheat, making it easier to process):
o Cold conditioning involving soaking wheat in cold water for 1-3 days -some/minimal
implications from embedded energy in potable water
o Warm conditioning involving soaking wheat in 46°C water for 60-90 minutes -
medium implications in terms of energy requirements resulting from embedded
energy in potable water plus energy to warm water to 46°C
o Hot conditioning involves water at 60°C or steam -higher implications in terms of
energy requirements resulting from embedded energy in potable water plus energy
to warm water to high temperatures
Blending: Wheat of different grades and moistures is blended together to obtain a batch with the
required characteristics (the grist) -some energy requirements for mechanical blending
Breaking: the wheat passes through rollers, breaking or cracking open the grain to separate the
interior of the wheat from the outer bran and to separate into three categories -some energy
requirements for mechanical breaking into middlings
Middlings purifier: sieves separate the grain into endosperm, bran and germ.
o Vibrating screen with air blowing up through it to remove lighter pieces of bran
mixed with middlings –some/minimal energy requirements for mechanical
separation of middlings.
Middlings grinding: middlings are ground into flour by large smooth metal rollers. Each time flour is
ground it is sieved to separate it into flours of different fineness, which can be combined as desired
to produce a final product -some/minimal energy requirements for mechanical grinding.

Energy Feasibility Study Final report 91
Packing into bags for industrial, commercial or household use -medium energy requirements
associated with packing (?).
2)- Where do you think energy could be saved and how? Any additional stages not outlined
above where energy (and water) is used and could be saved?
3)- Any advice / leads on work around local energy technologies/ small-scale renewable
energy in the milling/bakery sector, e.g. another mill or bread manufacturing facility or local
bakery that may be using decentralised sources of energy such as local mill for hydroelectricity
generation, Combined Heat and Power from biomass or Energy from Waste (especially CHPs and /or
EfW where feedstock is mainly agriculture and/or food waste such as wheat by-products, wasted
bread etc.
4)- Do they have data on their energy and water consumption, and would they be willing to share
data? Are they interested in any collaboration to explore possible efficiencies?