LNG: cheaper for longer Asia Oil & Gas...
36
See important disclosures, including any required research certifications, beginning on page 34 ■ What's new Our short- and long-term (out to 2025E) analysis of the Asia-Pacific LNG market indicates that while it may be tight until 2016, new sources of LNG supply could alter the market’s dynamics in many ways. ■ What's the impact A rosy future for LNG demand. We believe gas demand will remain strong over the next decade, spurred on by policy initiatives, carbon- reduction schemes, and the increasing availability of relatively cheap unconventional gas. Key factors that could affect demand include Japan’s nuclear energy policy, China’s success in finding commercial quantities of shale gas, and whether or not LNG will see wider adoption as a transportation fuel. However, we expect significant growth in LNG supply. We estimate that about 41 new LNG projects are currently planned or under development, which could lead to LNG capacity more than doubling to 630mtpa by 2021. Most of these new LNG projects target Asia markets and will have to compete with existing projects. While some of these projects may not make it past the planning stage, there is still a plentiful supply of new LNG capacity that could easily fill an Asia demand gap of 155mtpa in 2025E. LNG prices likely to be lower in real terms. We expect an increase in spot LNG trading, greater competition between sellers, increasing price sensitivity from buyers, and further energy market deregulation to combine to reduce LNG prices over the next decade. In addition, the potential rise of North America LNG exports, which are indexed to lower Henry Hub gas prices, could add downward pressure to prices. Floating LNG (FLNG) becoming more accepted, but lacks scale. Over the past three years, the number of planned FLNG projects has increased from three to eight, indicating wider acceptance of its ability to monetise stranded gas resources. However, the eight projects only total about 28mtpa, which would not negatively affect the supply picture, in our view. ■ What we recommend In terms of direct investment exposure to LNG, Asia has very few stocks with decent exposure. We highlight four that are exposed to their respective domestic gas demand growth or would cater to global LNG supply growth: Perusahaan Gas Negara (PGAS) (PGAS IJ, IDR5,750, Buy [1]), ENN Energy (ENN) (2688 HK, HKD42.90, Buy [1]), Petronet LNG (Petronet) (PLNG IN, INR119.75, Outperform [2]) and Samsung Heavy Industries (SHI) (010140 KS, KRW35,050, Buy [1]). From a macro perspective, major LNG-importing countries would benefit from lower LNG prices, thus potentially increasing their competitiveness. As such, key sectors that could benefit include Japan and Korea gas utilities, while Australia LNG players are most at risk given their high cost of producing LNG relative to the new LNG-exporting areas, such as North America and East Africa. 5 July 2013 LNG: cheaper for longer • We forecast global LNG capacity to more than double over 2012- 21 and turn a tight market into a buyers’ market after 2016 • Stocks that should benefit from the LNG story include PGAS, ENN Energy, Petronet LNG and Samsung Heavy Industries • Key sectors that could benefit include Japan and Korea gas utilities: Australia LNG players seem most at risk Asia Oil & Gas Sector Key stock calls Source: Daiwa forecasts. Energy / Asia ex Japan Adrian Loh (65) 6499 6548 [email protected] Benjamin Lim (65) 6321 3086 b[email protected] New Prev. PT Perusahaan Gas Negara Tbk (PGAS IJ) Rating Buy Buy Target 7,100 7,100 Upside 23.5% ENN Energy (2688 HK) Rating Buy Buy Target 48.50 48.50 Upside 13.1% Samsung Heavy Industries (010140 KS) Rating Buy Buy Target 45,000 45,000 Upside 28.4%
Transcript of LNG: cheaper for longer Asia Oil & Gas...

See important disclosures, including any required research certifications, beginning on page 34
■ What's new Our short- and long-term (out to 2025E) analysis of the Asia-Pacific LNG market indicates that while it may be tight until 2016, new sources of LNG supply could alter the market’s dynamics in many ways. ■ What's the impact A rosy future for LNG demand. We believe gas demand will remain strong over the next decade, spurred on by policy initiatives, carbon-reduction schemes, and the increasing availability of relatively cheap unconventional gas. Key factors that could affect demand include Japan’s nuclear energy policy, China’s success in finding commercial quantities of shale gas, and whether or not LNG will see wider adoption as a transportation fuel. However, we expect significant growth in LNG supply. We estimate that about 41 new LNG projects are currently planned or under development, which could lead to LNG capacity more than
doubling to 630mtpa by 2021. Most of these new LNG projects target Asia markets and will have to compete with existing projects. While some of these projects may not make it past the planning stage, there is still a plentiful supply of new LNG capacity that could easily fill an Asia demand gap of 155mtpa in 2025E. LNG prices likely to be lower in real terms. We expect an increase in spot LNG trading, greater competition between sellers, increasing price sensitivity from buyers, and further energy market deregulation to combine to reduce LNG prices over the next decade. In addition, the potential rise of North America LNG exports, which are indexed to lower Henry Hub gas prices, could add downward pressure to prices. Floating LNG (FLNG) becoming more accepted, but lacks scale. Over the past three years, the number of planned FLNG projects has increased from three to eight, indicating wider acceptance of its ability to monetise stranded gas resources. However, the eight projects only total about 28mtpa, which would not negatively affect the supply picture, in our view. ■ What we recommend In terms of direct investment exposure to LNG, Asia has very few stocks with decent exposure. We highlight four that are exposed to their respective domestic gas demand growth or would cater to
global LNG supply growth: Perusahaan Gas Negara (PGAS) (PGAS IJ, IDR5,750, Buy [1]), ENN Energy (ENN) (2688 HK, HKD42.90, Buy [1]), Petronet LNG (Petronet) (PLNG IN, INR119.75, Outperform [2]) and Samsung Heavy Industries (SHI) (010140 KS, KRW35,050, Buy [1]). From a macro perspective, major LNG-importing countries would benefit from lower LNG prices, thus potentially increasing their competitiveness. As such, key sectors that could benefit include Japan and Korea gas utilities, while Australia LNG players are most at risk given their high cost of producing LNG relative to the new LNG-exporting areas, such as North America and East Africa.
5 July 2013
LNG: cheaper for longer
• We forecast global LNG capacity to more than double over 2012-21 and turn a tight market into a buyers’ market after 2016
• Stocks that should benefit from the LNG story include PGAS, ENN Energy, Petronet LNG and Samsung Heavy Industries
• Key sectors that could benefit include Japan and Korea gas utilities: Australia LNG players seem most at risk
Asia Oil & Gas Sector
Key stock calls
Source: Daiwa forecasts.
Energy / Asia ex Japan
Adrian Loh(65) 6499 [email protected]
Benjamin Lim(65) 6321 [email protected]
New Prev.PT Perusahaan Gas Negara Tbk (PGAS IJ)Rating Buy BuyTarget 7,100 7,100Upside 23.5%
ENN Energy (2688 HK)Rating Buy BuyTarget 48.50 48.50Upside 13.1%
Samsung Heavy Industries (010140 KS)Rating Buy BuyTarget 45,000 45,000Upside 28.4%

Asia Oil & Gas Sector 5 July 2013
- 2 -
Source: Daiwa forecasts
Sector stocks: key indicators
Share
Company Name Stock code Price New Prev. New Prev. % chg New Prev. % chg New Prev. % chg
Anton Oilfield Services Group 3337 HK 5.69 Buy Buy 7.00 7.00 0.0% 0.191 0.191 0.0% 0.262 0.262 0.0%
China Oilfield Services 2883 HK 14.42 Buy Buy 19.30 19.30 0.0% 1.074 1.074 0.0% 1.240 1.240 0.0%
CNOOC 883 HK 12.80 Buy Buy 19.70 19.70 0.0% 1.412 1.412 0.0% 1.399 1.399 0.0%
PetroChina 857 HK 8.96 Outperform Outperform 11.75 11.75 0.0% 0.717 0.717 0.0% 0.908 0.908 0.0%
Sinopec Corp 386 HK 5.25 Hold Hold 6.00 6.00 0.0% 0.632 0.632 0.0% 0.657 0.657 0.0%
Rating Target price (local curr.) FY1
EPS (local curr.)
FY2

Asia Oil & Gas Sector 5 July 2013
- 3 -
Contributors: Adrian Loh (65) 6499 6548 [email protected]
Benjamin Lim (65) 6321 3086 [email protected]
Maurine Wan (852) 2848 4451 [email protected]
Nirmal Raghavan(91) 22 6622 1018 [email protected]
Gary Zhou (852) 2773 8535 [email protected]
Sung Yop Chung (82) 2 787 9157 [email protected]
Asia LNG: premium pricing plus strong demand ....................................................................... 4 What’s so great about the Asia LNG market? .......................................................................... 4 A transformation may be coming ............................................................................................ 4 The tug of war between demand and supply ............................................................................ 5 What could derail the LNG train? ............................................................................................ 5 What we recommend ................................................................................................................ 5
LNG demand forecast: a rosy future ............................................................................................ 7 A rosy future .............................................................................................................................. 7 Demand-side factors to watch out for over the next 3-5 years ............................................... 8 A brief analysis of LNG demand by country ............................................................................ 9 What is Daiwa’s demand forecast for LNG? ........................................................................... 14
Supply growth outlook appears strong ...................................................................................... 15 A suppliers’ market in the next five years, but things will change ......................................... 15 Global LNG projects in detail ................................................................................................. 15 New supply routes have opened up in the past five years ...................................................... 17 Rising construction costs ........................................................................................................ 19 Moving towards a more liberalised LNG supply market ...................................................... 20
LNG pricing: change is afoot ..................................................................................................... 22 Catalysts for change ............................................................................................................... 22 LNG supply contracts: mainly long-term in nature .............................................................. 22 Understanding the current Asian LNG pricing model .......................................................... 23 What is the future for LNG pricing? ...................................................................................... 23
Floating LNG plans .................................................................................................................... 25 Background ............................................................................................................................. 25 Major drivers ........................................................................................................................... 25 Illustrative capital costs of FLNG versus onshore LNG ........................................................ 26 Applications of FLNG technology .......................................................................................... 26 Still a few hurdles .................................................................................................................... 27
Background on LNG .................................................................................................................. 29 History and properties ........................................................................................................... 29 Processing and transportation ............................................................................................... 29
Contents

Asia Oil & Gas Sector 5 July 2013
- 4 -
Asia LNG: premium pricing plus strong demand
Asia LNG remains an attractive market because of its size, its volume-growth outlook, and premium pricing
What’s so great about the Asia LNG market?
The Asia LNG market, in which Japan is the largest consumer, is typified by a high LNG price that comes closest to crude-oil price parity versus any other market globally, as seen in the following chart. Along with a high price, the Asia-Pacific region is seen as the one that provides the best demand outlook given the lack of natural resources in places such as Japan, South Korea, and Taiwan. In addition, LNG demand in Asia has continued to increase over the past 5-10 years due to the emergence of growing economies such as China, India and Indonesia, as well as the depletion of domestic natural-gas resources in countries such as Malaysia and Thailand. Gas prices of selected countries vs. OECD equivalent oil price
Source: BP Energy Review 2013
Note: All prices are CIF basis; NBP = National Balancing Point
Over the past two decades, Asia LNG buyers have had to operate in a sellers’ market, as the LNG supply raced
to catch up with demand that increased at a CAGR of nearly 9% over the 1992-2012 period. However, over the next decade, we see sufficient supply-side catalysts to lead to a buyers’ market.
A transformation may be coming
At the start of 2013, the global LNG industry was capable of producing 282mtpa and regasifying about 660mtpa, according to data from the International Group of LNG Importers (officially known as the Groupe International des Importateurs de Gaz Natural Liquéfié). Global LNG trade in 2012 was largely stagnant at 236.3mtpa, compared with the 240mtpa of net LNG trade movements for 2011. Some of the key issues that we see affecting the LNG market over the next few years, and which we address in this report, include the following.
• LNG exports from the US. LNG planning in the past couple of years has taken place under the shadow of potential LNG exports from the US. We believe that US LNG exports are inevitable, given the massive scale of the country’s shale gas resources and the current low gas prices in the country.
• Infrastructure improvements should help. US LNG exports should be aided by the Panama Canal expansion in 2014 that will enable US supplies to access Southeast Asia.
• The demand is there. We believe Asia LNG demand will continue to increase, especially given that nuclear-power plants are now out of favour.
• Pricing. Asia LNG buyers look at Henry Hub prices and note how low it is relative to their own purchase prices. Already, we have seen Asia buyers sign gas sales contracts that use FOB pricing based on Henry Hub pricing rather than oil-indexed pricing.
• Speed of development of other LNG export centres. The key among these are LNG projects in East Africa and West Africa. East Africa appears to be the largest threat to current LNG producers given the substantial resource and also the lack of a local market to absorb production. However, the key stumbling blocks in Mozambique and Tanzania are the political and legal systems, which do not appear robust enough for the potential volume of trading.
• The changing nature of China gas demand. With the country’s rapidly-growing gas market, it is unclear how China will divide up its market between the many different sources of gas, such as conventional domestic gas, shale and coal-bed methane, offshore Myanmar, Central Asia and
0.00
2.00
4.00
6.00
8.00
10.00
12.00
14.00
16.00
18.00
20.00
1996
1997
1998
1999
2000
2001
2002
2003
2004
2005
2006
2007
2008
2009
2010
2011
2012
(USD/mmBtu)
Japan
OECD oil equivalent
EU
UK NBP
Canada (Alberta)
US Henry Hub

Asia Oil & Gas Sector 5 July 2013
- 5 -
Russia pipeline supplies, and LNG. Russia’s proposed pipeline link to China from West Siberia alone is likely to equal half the LNG Qatar put on the market between 2009 and 2011.
• New technology. With FLNG gradually gaining acceptance as a way to monetise small, stranded gas fields, this new technology could start to add incremental supply to the market from as early as 2015.
The tug of war between demand and supply
Over the past 20 years, global LNG demand has risen in a relatively linear fashion, while the capex-intensive nature of the industry has resulted in the lumpy supply of LNG into the market. This necessarily leads to periods of tightness as well as periods of oversupply. Over the next few years, we note that new supply projects will be more complex, more costly, and take longer to develop than in the past. Nevertheless, we believe there is a plentiful supply of cheap gas globally (eg, from North America shale), such that the current status quo may undergo a material disruption between now and 2025. As the LNG business expands, we expect a reshaping of the region’s commercial business models and LNG pricing trends. Specifically, we expect real LNG prices to fall in the next 10 years as the confluence of new US LNG tolling models, new trade flows, more short-term sales, and more liberal commercial terms exert downward pressure on LNG prices.
What could derail the LNG train?
Geopolitics. This includes key government decisions that could directly affect the Asia-Pacific LNG business. These include: Japan’s nuclear policy, US gas export policy, and China’s development of unconventional gas and India’s gas market reforms. Current high LNG prices. The high delivered LNG prices in China and India at present could negatively affect demand over the medium-to-long term, and perhaps artificially buoy their coal demand. The global economy. An economic downturn in Europe/the US could affect Asia economies and thus slow the adoption of natural gas and LNG.
What we recommend
In terms of direct plays on LNG, Asia has very few stocks available to investors. Some of the ones that we identify are as follows. Perusahaan Gas Negara, which is seeing volume growth through its floating storage and regasification unit (FSRU) projects, and more importantly is leveraged to Indonesia’s medium- and long-term gas-demand growth. After 2015, we expect the company to extend the reach of its distribution pipelines, which could provide another leg of volume growth for the company. In addition, it has deployed mobile refuelling units for compressed natural gas (CNG), and which could provide an incremental earnings base for PGAS as this is rolled out more intensively over the next 12-24 months. We highlight that its 2014E valuation appears very cheap, trading at a PER of 12.5x and a dividend yield of 5%. (See also: Upgrade to Buy on compelling valuations, published on 27 June 2013.) Petronet LNG may also benefit, due to its position as an LNG importer serving the India gas market. Should lower LNG prices eventuate, we believe this could result in increased gas demand and consumption in India given the market’s sensitivity to high prices. In addition, the company is looking at expanding its Dahej LNG terminal from 10mtpa to 15mtpa by the end of 2015, as well as potentially adding 5mtpa of new capacity on the east coast of India. Should this all go to plan, the company could see its LNG import capacity increase by 67% between 2012 and 2016. Based on our forecasts, the company’s stock is trading currently at an FY14E PER and PBR of 9.2x and 1.9x, respectively, and we forecast a 22% ROE for FY14. Although we forecast muted EPS growth over the next two years, we believe the company’s long-term fundamentals are strong. (See also: Flat earnings profile but strong long-term fundamentals, published on 28 December 2012.) ENN Energy. We forecast a 25% earnings CAGR for 2012-15, driven by China’s continuing gas shortage and a lack of new natural-gas sources over the next few years. For 2013, Daiwa expects 89% of the company’s projects to have access to new natural gas sources, which should allow ENN to expand at a faster organic rate than its other domestic peers. On top of its secured sources for natural gas, the company is also expanding its LNG and CNG vehicle-refuelling stations over the next three years. (See also: NDR feedback – a week in the US, published on 22 April 2013.)
Asia Oil & Gas Sector 5 July 2013
- 6 -
Samsung Heavy Industries is our top pick among the Korean yards, as we believe the company’s market-leading position in LNGCs and high-margin drillships gives it better earnings and order-win visibility than its peers. As at the end of June 2013, SHI had secured 61%, or USD7.9bn, in new orders compared with its 2013 guidance of USD13bn (up 35% compared with 2012’s amount of USD9.6bn). We note that 24% of its order wins year-to-date are associated with LNG-related vessels, and the company is currently in talks with Malaysia’s Petronas to receive a USD1bn order for an LNGC-floating, production, storage and offloading vessel that may materialise as early as 3Q13. In addition, SHI could win a number of LNGC orders from Russia’s largest independent gas producer, Novatek, which may place orders for 16 LNGCs for the Yamal LNG project in 2H13. (See also: Cream of the crop should fare better, published on 22 April 2013.) Other companies that are not rated by Daiwa but which have exposure to LNG or LNG-related businesses include:
• Kunlun Energy, which is an LNG importer, and
• CIMC Enric, a gas-equipment manufacturer. We believe there would be minimal impact on the listed exploration and production (E&P) companies. PetroChina (857 HK, HKD8.96, Outperform [2]) is the only company with a meaningful natural gas pipeline business, and thus might benefit from reduced LNG prices, as this could mean lower losses for its natural gas pipeline segment. However, LNG prices may only fall in 3-4 years’ time. While Sinopec (386 HK, HKD5.25, Hold [3]) and CNOOC (883 HK, HKD12.80, Buy [1]) might benefit from China’s marginal substitution away from coal and towards gas, we believe the impact on the companies will be minimal, and thus is difficult to quantify. At the sector level Our analysis in this report indicates that LNG supplies will be significant starting from 2015, and may result in an oversupply in the market from 2016 onwards, thus real LNG prices may decline from then on. In this respect, the companies that would benefit should be the Japan and Korea utilities, while the expensive Australia LNG producers may be most at risk, given their high cost of LNG production relative to the new LNG-exporting areas, such as North America and East Africa. Arguably, the economies of Japan and Korea would receive a boost, too, given that they are importing cheaper energy, but this is unlikely to increase their
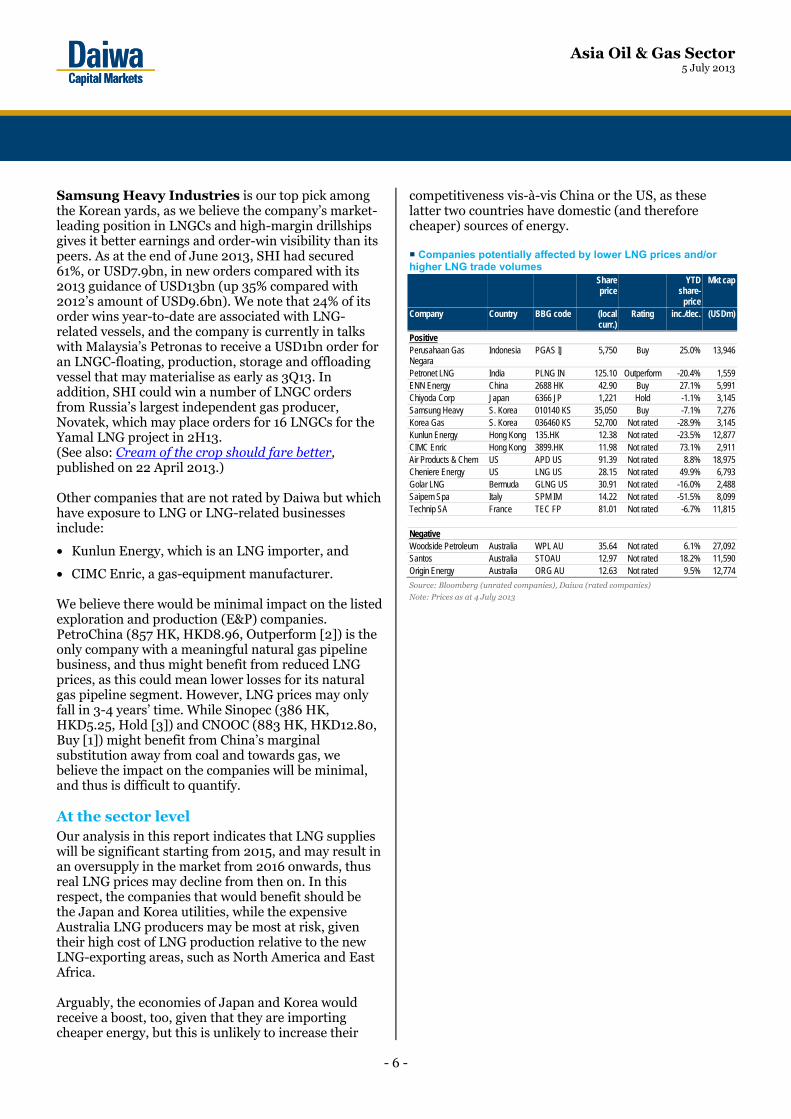
competitiveness vis-à-vis China or the US, as these latter two countries have domestic (and therefore cheaper) sources of energy. Companies potentially affected by lower LNG prices and/or higher LNG trade volumes Share
price YTD
share-price
Mkt cap
Company Country BBG code (local curr.)
Rating inc./dec. (USDm)
Positive Perusahaan Gas Negara
Indonesia PGAS IJ 5,750 Buy 25.0% 13,946
Petronet LNG India PLNG IN 125.10 Outperform -20.4% 1,559 ENN Energy China 2688 HK 42.90 Buy 27.1% 5,991 Chiyoda Corp Japan 6366 JP 1,221 Hold -1.1% 3,145 Samsung Heavy S. Korea 010140 KS 35,050 Buy -7.1% 7,276 Korea Gas S. Korea 036460 KS 52,700 Not rated -28.9% 3,145 Kunlun Energy Hong Kong 135.HK 12.38 Not rated -23.5% 12,877 CIMC Enric Hong Kong 3899.HK 11.98 Not rated 73.1% 2,911 Air Products & Chem US APD US 91.39 Not rated 8.8% 18,975 Cheniere Energy US LNG US 28.15 Not rated 49.9% 6,793 Golar LNG Bermuda GLNG US 30.91 Not rated -16.0% 2,488 Saipem Spa Italy SPM IM 14.22 Not rated -51.5% 8,099 Technip SA France TEC FP 81.01 Not rated -6.7% 11,815 X Negative Woodside Petroleum Australia WPL AU 35.64 Not rated 6.1% 27,092 Santos Australia STOAU 12.97 Not rated 18.2% 11,590 Origin Energy Australia ORG AU 12.63 Not rated 9.5% 12,774
Source: Bloomberg (unrated companies), Daiwa (rated companies)
Note: Prices as at 4 July 2013

Asia Oil & Gas Sector 5 July 2013
- 7 -
LNG demand forecast: a rosy future
Gas demand should remain strong over the next decade, spurred on by policy initiatives, carbon-reduction schemes, and the increased use of unconventional gas
A rosy future
According to the International Energy Agency (IEA), global consumption of natural gas should increase by 49-65% over the 2011-35 period under its different demand scenarios. The agency highlights three key issues that could lead to the higher end of this natural gas consumption growth materialising:
• policy initiatives by various countries (not just Japan) to reduce dependence on nuclear power following the Fukushima disaster,
• carbon-reduction schemes, and
• the development of unconventional gas. As can be seen in the following chart, CO2 emissions in the US fell by 712mt, or -11%, over the 2007-12 period, partly due to increased fuel substitution towards shale gas. This meant that it saw the largest reduction in emissions among all countries or regions, and should provide future impetus for others to follow suit. Global CO2 emissions growth (2007-12)
Source: BP Energy Review 2013
If China is successful in discovering its own shale gas resources, this could be the biggest driver of emissions reduction over the next 10 years, in our view. It is an issue that the PRC Government would probably welcome keenly, given the air-pollution problems that have plagued the country over the past decade. According to the IEA’s projections, the vast bulk of the growth in gas demand is expected to come from non-OECD nations, particularly China and India, reflecting higher energy usage per capita as well as a rise in the share of energy derived from natural gas. In both countries, natural gas currently accounts for a relatively low proportion of energy consumption (see the following chart), but China in particular has a policy objective to roughly double the energy share of natural gas to more than 8% by 2015 in order to improve energy efficiency and energy diversification. Primary energy consumption by selected countries/regions
Source: BP Energy Review 2013
We also note that past LNG-demand projections have been conservative, as seen in the following chart, with forecasts revised up by nearly 35%, or about 70mtpa, in the space of three years. Top-four LNG importers in 2025E
Source: Wood Mackenzie
(712)(484)
8
432 482
847
2,697
(1,000)
(500)
0
500
1,000
1,500
2,000
2,500
3,000
US EU Japan Middle East India Rest of the World
China
(m tonnes)
23.9%
48.6%33.3% 29.6% 22.0%
8.7% 4.7%0%
20%
40%
60%
80%
100%
World Middle East EU/Eurasia US Japan India China
Gas Oil Coal Nuclear Hydro Renewables
0
25
50
75
100
125
Japan China India South Korea
2009 forecast 2012 forecast
(mtpa)Asia's top four importers of LNG may account for over 260mtpa of demand in 2025

Asia Oil & Gas Sector 5 July 2013
- 8 -
Demand-side factors to watch out for over the next 3-5 years
As can be seen in the following table, all of the major Asia countries depend on LNG as a fuel. Importantly, even traditional powerhouse LNG exporters such as Indonesia and Malaysia have, in recent years, been forced to import LNG to satisfy domestic power generation needs as they have moved away from coal or fuel oil-fired generation. Status of gas imports and exports for various Asia countries
Country Indigenous production LNG importer LNG exporter
Pipeline importer
Pipeline exporter
Japan South Korea Taiwan China Hong Kong India Thailand Indonesia Malaysia Singapore
Source: Daiwa
In this section, we examine a few demand-side factors that investors should watch out for over the next 3-5 years. LNG as a transportation fuel New LNG demand may come from using the gas as a transportation fuel. To date, this has been slow to happen due to the slow development of engine technology. However, we believe that in the next few years, this will be increasingly used as a fuel source. We note that in China, LNG fuel has already developed rapidly and LNG vehicles (both trucks and buses) are now being considered for long-distance routes. This should boost gas demand in China generally, and as a result may also increase the country’s LNG import demand. In addition, the use of LNG as a marine-transportation fuel has also been mooted in the past few years. However, the uptake has been disappointing due to a range of issues, such as the number of new ships being bought, the financing of a ship with new technology, charter agreements not encouraging the owners to reduce fuel-oil consumption, and a lack of LNG-refuelling infrastructure. Despite these factors, we believe that there is a positive outlook over the medium term as new environmental-protection agreements come into force. Both of these factors could result in an increase in LNG demand.
Economic recession Some Western economies, particularly in the EU, are still struggling economically, and as a result their future energy developments are unclear. This is likely to affect trade with Asia countries and may result in downward revisions to near-term Asia gas demand. Japan The world’s largest LNG market currently has a lot of uncertainty: first, regarding its long-term energy demand, and second, on the contribution that gas will make to the energy mix. The three broad options that have been under discussion range from 0-25%. In September 2012, the Japan Government proposed a nuclear-free energy policy by the 2030s, with a desire to get to that point before the 2030s. If this is implemented, then thermal-power generation, ie, LNG-based power generation, will take up the slack, in our view, and the proportion of gas within the power generation mix would increase materially. Options for Japan’s power generation mix in 2030
Source: Ministry of Economy, Trade and Industry (Japan)
Nuclear energy consumption of selected Asia countries
Source: BP Energy Review 2013
FSRU development New LNG demand is also likely to develop from a variety of new countries opting for FSRUs. According to Golar LNG, 50% of all new LNG import markets
15%25%
35%
30%25%
50%40% 35%
15% 15% 15%
0%
10%
20%
30%
40%
50%
60%
70%
80%
90%
100%
Option 1 Option 2 Option 3
Nuclear Renewable Thermal Co-generation
0
50
100
150
200
250
300
350
1993
1994
1995
1996
1997
1998
1999
2000
2001
2002
2003
2004
2005
2006
2007
2008
2009
2010
2011
2012
China Japan S. Korea Taiwan
(Terawatt hours)

Asia Oil & Gas Sector 5 July 2013
- 9 -
since 2005 have opted for FSRUs rather than land-based terminals. The company attributes this to the fact that this technology is accepted by the oil majors, offer a low-cost/fast start-up option, provides access to high-value gas markets, and is flexible in terms of location (and mostly out of sight of the local population). We note that globally, about 25 projects are under development, although it is difficult to forecast accurately how many and how quickly they will develop. Global floating regasification fleet development
Source: Golar LNG
Shale gas competing with LNG As indicated in our China shale gas report published on 13 April 2012 (China shale: a long term paradigm shift), we believe that China shale gas is likely be a 2018+ play, while Indonesia shale gas may take even longer. The following chart points out the differences in terms of the accessibility and the ease of monetising shale in both the US and China. Key success factors in the US shale industry vs. China US China Rig and services availability Poor rig and services availability
Attractive geology Attractive geology Large domestic market Large domestic market Extensive pipeline network Extensive pipeline network Attractive fiscal terms Unknown fiscal terms
Supportive regulators Supportive regulators Landowners as royalty owners Government as royalty owners
Source: Daiwa
Note: Shaded areas represent poor characteristics
Currently, it looks as though the development of shale gas, and indeed other unconventional gas streams, in China will take some time. Despite the fact that the PRC Government has publicly stated that unconventional gas is a strategic imperative for the country, shale-gas exploration has yet to increase to the level where the 2015 production targets can be met, on our estimates. In March 2012, China’s National Energy Administration (NEA) released its targets for the
country’s shale-gas production. Apart from emphasising the need for foreign co-operation and better technology in developing the sector, the ambitious production targets include:
• 6.5bcm, or 229bcf of shale gas production by 2015, and
• 60-100bcm, or 2,118-3,530bcf of shale gas production, by 2020 (China’s 2010 gas production was 96.8bcm).
In our opinion, the shale-gas production target of 60-100bcm in 2020 is very bullish, as it implies a 56-73% CAGR over five years (2015-20). We believe the target is very ambitious and will be difficult to meet.
A brief analysis of LNG demand by country
China China’s gas demand has increased exponentially over the past decade and, as a result, looks set to change the country’s supply dynamics in the next few years. As can be seen in the following chart, the domestic gas supply has not been able to keep up with demand, and thus the country has had to build up its gas-import infrastructure. China: natural gas production vs. consumption
Source: BP Energy Review 2013
China now has a natural-gas market that comprises multiple supply sources with different prices (see the following map). As a result of this, price-tolerance levels vary greatly, depending on the income level for a province. We note that year-to-date in 2013, local governments have been reluctant to increase gas prices due to street protests. Nevertheless, the country has seen a rapid build-up of infrastructure over the past decade, and we believe this will continue for at least the next five years.
0
5
10
15
20
25
2004 2005 2006 2007 2008 2009 2010 2011 2012 2013E 2014E
Newbuild Conversion
(No. of FSRU)
0
2
4
6
8
10
12
14
1992
1993
1994
1995
1996
1997
1998
1999
2000
2001
2002
2003
2004
2005
2006
2007
2008
2009
2010
2011
2012
Production Consumption
20-year CAGR:Gas production: 10.1%Gas consumption : 15.8%
(bcf/day)

Asia Oil & Gas Sector 5 July 2013
- 10 -
China: current and potential gas sources, and aggregate gas price (assuming price is oil indexed at USD95/bbl)
Source: Daiwa estimates
Note: * Due to start in 2H13
While natural gas’s share in China’s energy supply remained marginal in 2011, at only 5% of primary energy, demand has risen rapidly. Over 2001-11, natural-gas demand increased at a 17% CAGR, albeit off a low base. However, we note that gas demand is still small compared with coal demand in China. We attribute this to the following: 1) there are infrastructural constraints in the supply of domestic gas, and 2) coal prices continue to be cheap relative to gas. The main upside to gas demand over the next decade could come from an increase in the share of industrial feedstock usage and power generation, although we acknowledge that the latter may be difficult due to the pricing differential with coal. However, the government can assist in encouraging the use of gas-fired power generation by implementing supportive policies and subsidies. Shale gas. While shale-gas exploration activity is accelerating, large-scale commercial production
remains distant, and long-term production targets may be difficult to achieve. Shale-gas production: PRC Government targets vs. Daiwa forecasts
Source: Reuters, Daiwa forecasts
Note: Daiwa forecasts are combined shale gas and CBM production
Natural-gas price reform. This issue has been mooted for the better part of 12 months, and it remains
Potential gas imports
Potential new sources of domestic gas
Shale gas
CBM
CBM
LNG from Australia, Indonesia, Malaysia, Qatar:
USD15-18/mcf
Pipeline gas from Central and Eastern
Siberia:USD10-12/mcf
Pipeline gas from Central Asia:
USD11-12/mcf
Pipeline gas from Myanmar*:
USD8-9/mcf
Shale gas
CBMCurrent gas imports
229.5
2,824.0
353.0 529.5
0
500
1,000
1,500
2,000
2,500
3,000
2015E 2020E
PRC Gov't targets Daiwa forecasts
(bcf/year)

Asia Oil & Gas Sector 5 July 2013
- 11 -
to be seen whether China’s new government, which came into power in March 2013, will proceed with these reforms. The key obstacle is political, given that local governments in China have been complaining vociferously about high prices, and thus the central government will have to manage this issue. The country’s build-up of LNG receiving terminals, which reflects its strong LNG-demand outlook, has continued over the past year. These include the following.
• CNOOC’s first FSRU: in early 2012, the company began building an FSRU to be moored southeast of Nanjiang port in Tianjin harbour, Bohai Bay. Phase 1 of the project is due to start up in 2H13 and will be able to handle 2.2mtpa, while Phase 2 (start-up in 2015) would add a 3.8mtpa onshore terminal and include four 160,000m3 tanks.
• In mid-2012, China’s National Development and Reform Commission (NDRC) approved CNOOC’s plans to build a second LNG terminal in the southern city of Shenzhen. The Diefu terminal will be able to receive 4mtpa, although a start-up date has not been announced. Supporting its operations will be four 160,000 m3 LNG tanks.
• In late 2012, CNOOC commissioned its fourth LNG-receiving terminal, in Ningbo, Zhejiang Province, capable of importing 3.5mtpa.
• Sinopec’s proposal for a 3mtpa LNG receiving terminal in Lianyungang port, in eastern Jiangsu Province, received approval from the NDRC in 2Q13.
Japan Japan’s LNG-consumption patterns have changed markedly in the post-Fukushima disaster period, with LNG purchasing having been stepped up to plug the energy gap. Between 2010 and 2011, the country increased its LNG imports by 12.2% YoY; this was followed by another large increase of 11.1% YoY for 2012. While Japan saw a 9.8% YoY decline in LNG imports for May 2013, this was mainly the result of a sharp rise in fossil-fuel imports in May last year, as the country’s entire nuclear capacity was offline. Since then, two nuclear reactors have resumed operation, slightly easing the demand for imported fossil fuels. Japan’s new Nuclear Regulation Authority (NRA) is due to start safety checks of reactors that are currently idle before allowing them to restart. However, the NRA has said that these checks will take at least six months. According to estimates from Chevron, the nine-year period from 2011-20 may see Japan consume 96m tonnes more LNG than Chevron’s previous estimates prior to the Fukushima disaster. Assuming an LNG
price of USD10/mcf (ie, lower than current LNG prices), this would equate to an incremental USD50bn gas-import bill, which may have negative ramifications for the domestic economy. Japan: gas consumption vs. nuclear-power generation
Source: BP Energy Review 2013
Malaysia The country’s strong desire for supply diversity stems from the fact that gas production in peninsula Malaysia has been stagnant at about 6bcf/day since 2005, which has resulted in limited additional investment in new industries such as glass and plastics. Malaysia: natural-gas production vs. consumption
Source: BP Energy Review 2013
As a result, the government has plans, similar to those in Indonesia, to use imported LNG, with the 3.8mtpa Melaka LNG import terminal receiving its first cargo in April 2013 from Nigeria. Petronas has signed three LNG-import agreements in place at present: a 2.5mtpa 3.5-year contract with GDF Suez starting from August 2012, a 1.5mtpa 20-year contract with Qatargas starting in 2013, and an agreement with Statoil with undisclosed terms. The bulk of the country’s gas reserves are in east Malaysia, where the nine-train Bintulu LNG project is located. However, all of this gas is committed for exports, mainly to North Asia. Thus, we believe that
0
50
100
150
200
250
300
350
0
2
4
6
8
10
12
1992
1993
1994
1995
1996
1997
1998
1999
2000
2001
2002
2003
2004
2005
2006
2007
2008
2009
2010
2011
2012
Gas consumption (LHS) Nuclear consumption (RHS)
(bcf/day) (Terawatt hours)
0
2
4
6
8
10
12
14
1992
1993
1994
1995
1996
1997
1998
1999
2000
2001
2002
2003
2004
2005
2006
2007
2008
2009
2010
2011
2012
Production Consumption
(bcf/day)
20-year CAGR:Gas production : 5.4%Gas consumption : 7.2%

Asia Oil & Gas Sector 5 July 2013
- 12 -
any new gas finds in the country may be allocated to domestic usage. Indonesia The country has, in our view, been one of the most aggressive in Asia in re-focusing its gas resources for internal use rather than exporting them as LNG. This is because of its steady gas demand CAGR of 3.9% over the 1990-11 period, reaching an average of 3.46bcf/day in 2012. At the same time, Indonesia’s gas production has been stagnant at about 7.0bcf/day over the past 10 years, leading to concerns in the government that too much gas is being exported at the expense of domestic consumption. Indonesia: natural-gas production vs. consumption
Source: BP Energy Review 2013
As a result, we believe that an increasing share of new gas supply will be allocated to serve the domestic market, as there is unfulfilled gas demand in different regions for industry and power generation. While these two segments have readily available capacity or infrastructure to consume gas, they have no access to required supplies, which led the country to trigger the domestic-market obligation clauses in gas-sale contracts to supply industry and power generation. Thus, Indonesia’s first FSRU was put into operation in 2012, while another three are due to come onstream between 2014 and 2016. One positive move undertaken by the government was to increase gas prices in 2011 to reflect more accurately market dynamics. Over the next five years, continued regulatory support will be important to ensure that gas supply continues to increase. In 2Q13, Bloomberg news reports indicated that the LNG selling prices at various export projects were likely to be negotiated upwards. Over the next five years, Indonesia has a very active construction programme for both LNG export and import terminals.
• Abadi LNG. In early 2013, Inpex (operator and 60% owner) awarded the front end engineering and design contract for a 2.5mtpa FLNG vessel to develop the Abadi gas field off the Tanimbar Islands, Indonesia. The vessel will also have a condensate production capacity of 8,400bpd.
• Tangguh LNG expansion. In late 2012, the Indonesia Government approved BP’s plan to build a third LNG train at its Tangguh LNG project, which could cost about USD2bn. The train should add 3.8mtpa of liquefaction capacity at Tangguh and raise its total capacity to 11.4mtpa. BP Indonesia said the new train would sell 40% of its production in Indonesia, while the rest would be exported to buyers in the Asia-Pacific region.
• The first of four potential FSRUs. In mid-2012, Nusantara Regas (a joint venture between Pertamina and PGAS) started up the country’s first FRSU, a 3mtpa vessel in Jakarta Bay, West Java. In 1H14, PGAS will start up Indonesia’s second FSRU at Lampung in South Sumatra, while other plans call for an extra two FSRUs to be installed in the Sumatra-Java area by 2018.
India In the early 2000s, the future appeared bright for India’s natural-gas supply given large gas discoveries in the Krishna-Godavari basin off the country’s east coast. However, the reality has been far different, with insufficient natural-gas infrastructure built at the national level to meet domestic demand. As a result, India has had to rely increasingly on imported LNG, which is used as a substitute for coal for electricity generation. According to the latest data from the US Energy Information Administration, India’s power and fertiliser sectors accounted for 45% and 28%, respectively, of the country’s natural gas demand for 2010. The government has categorised these as priority sectors for domestic programmes, which ensures that they receive larger shares of any new gas supply than other consumers. The country’s 20-year CAGR in gas consumption (1992-2012) has outstripped supply, at 9.0% and 5.1% respectively. In 2012, India imported 15.1m tonnes of LNG, which accounted for about 38% of total gas demand in the country. India’s Ministry of Petroleum and Natural Gas projects that this trend of higher LNG imports will continue, with the country’s gas demand more than doubling over the next five years to 2018.
0
2
4
6
8
10
12
14
1992
1993
1994
1995
1996
1997
1998
1999
2000
2001
2002
2003
2004
2005
2006
2007
2008
2009
2010
2011
2012
Production Consumption
20-year CAGR:Gas production : 1.7%Gas consumption : 3.5%
(bcf/day)

Asia Oil & Gas Sector 5 July 2013
- 13 -
India: natural-gas production vs. consumption
Source: BP Energy Review 2013
The build-up of the country’s LNG importing infrastructure has faced material delays, as can be seen from the list of planned terminals mentioned below. Such delays, along with other wrangling among companies and the central and/or state governments, has prompted Wood Mackenzie and other industry analysts to caution LNG suppliers against counting too much on industry segments in India as a source of demand over the near-to-medium term. Currently, India has four LNG-receiving terminals, of which the Kochi and Dabhol terminals were only commissioned in 2013 (the other existing ones are located at Dahej and Hazira).
• The 5mtpa Kochi LNG receiving terminal, on which construction started in 2007, was finally commissioned in 1Q13 after having been delayed from its original start-up of 2010. Even then, the lack of pipeline capacity feeding the terminal will hold its initial operations to less than 1mtpa for at least a year, according to Petronet.
• In early January 2013, GAIL India commissioned its 5.0mtpa Dabhol LNG terminal at Ratnagiri, Maharashtra, about 210 miles south of Mumbai. The company has said that the new terminal should be expanded to a capacity of 7.5mtpa over the next 2-3 years, and thereafter to 10.0mtpa.
The Philippines The country’s only gas field, the offshore Malampaya field operated by Shell, has been producing for 11 years, with production from this field going into power generation, the industrial sector, and CNG for transportation. Currently, the Malampaya joint venture (made up of Shell, Chevron and the Philippine National Oil Company) is working on Phase 2, which aims to extend the life of the field beyond 2023. Nevertheless, we believe that the country may need to develop an LNG-import capability if it is to expand its gas demand beyond the current customer base. In our view, the
country’s gas consumption is constrained only by the lack of an indigenous gas supply. We note that incremental power generation in the Philippines is geared towards coal-fired power plants, implying that natural gas will lose market share over time. Even if new sources of gas are discovered offshore Philippines, the mountainous terrain of the country and its geographic fragmentation may make supply a challenge. Thailand The country’s gas consumption, led by industrial and petrochemical demand, increased at a CAGR of 12.6% over the 1992-2012 period. However, its production CAGR over the same period was lower, at 8.2%. As a result, it has had to rely on gas imports from Myanmar since 2001 to meet in its demand needs, which is why we present an aggregated picture of the two countries’ production data in the following chart compared with Thailand’s consumption. Thailand & Myanmar: natural-gas production vs. consumption
Source: BP Energy Review 2013
Thailand’s LNG import strategy, implemented three years ago, was driven by its expectation that its major source of gas, the Gulf of Thailand, would hit peak production in the following 10 years, and thus the country could face a natural decline in reserves over the next 10-15 years. In addition, the recent opening up of Myanmar, and its potential industrialisation, could lead to less gas being available for consumption by Thailand in the foreseeable future. As recently as three years ago, the country raised the issue of nuclear power, but with the Fukushima disaster, these plans have been shelved. As a result, the government has accelerated plans to expand its current 5mtpa LNG regasification facility to 10mtpa in the next three years. The country currently imports LNG from Qatar, and over the long term could see LNG imports from PTT Exploration & Production’s (PTTEP TB, THB159, Sell, covered by Thanachart Securities)
0
2
4
6
8
10
12
14
1992
1993
1994
1995
1996
1997
1998
1999
2000
2001
2002
2003
2004
2005
2006
2007
2008
2009
2010
2011
2012
Production Consumption
20-year CAGR:Gas production: 5.1%Gas consumption : 9.0%
Demand gap met by LNG imports
(bcf/day)
0
2
4
6
8
10
12
14
1992
1993
1994
1995
1996
1997
1998
1999
2000
2001
2002
2003
2004
2005
2006
2007
2008
2009
2010
2011
2012
Thailand Myanmar Thailand consumption
20-year CAGR:Thailand's gas production: 8.2%Myanmar's gas production: 14.4%
Thailand's gas consumption : 12.6%
(bcf/day)

Asia Oil & Gas Sector 5 July 2013
- 14 -
proposed floating LNG project at the Cash/Maple gas field offshore Australia.
What is Daiwa’s demand forecast for LNG?
In our modelling (shown in the following chart), we forecast a 5.2% CAGR for LNG demand in the region over the 2011-25 period. This is based on the following assumptions:
• Asia GDP growth averages about 4% annually over the period, and
• Japan reduces its dependence on nuclear power from 25% to 15% of its primary energy demand.
In 2025, Japan is still likely to be the largest import market for LNG globally, with China moving into second place, and India and Korea in third and fourth, respectively. As a result of our modelling, we arrive at a demand gap of 155mtpa of LNG in 2025. In the next section of this report, we look at where the new supply could come from – both regionally and globally – to fill this gap for Asia. Asia-Pacific LNG demand vs. supply model
Source: Daiwa forecasts
Global LNG demand vs. supply model
Source: Daiwa forecasts
0
50
100
150
200
250
300
350
2000
2001
2002
2003
2004
2005
2006
2007
2008
2009
2010
2011
2012
2013
E20
14E
2015
E20
16E
2017
E20
18E
2019
E20
20E
2021
E20
22E
2023
E20
24E
2025
E
Supply - operational
Supply - under construction
(mtpa)
Asia-Pacific demand
Demand gap of 155mtpa in 2025
0
100
200
300
400
500
600
2012
2013
E
2014
E
2015
E
2016
E
2017
E
2018
E
2019
E
2020
E
2021
E
2022
E
2023
E
2024
E
2025
E
Supply Demand - Mid-case
Demand - Low-case Demand - High-case
(mtpa)

Asia Oil & Gas Sector 5 July 2013
- 15 -
Supply growth outlook appears strong
Our analysis indicates that global LNG capacity could more than double by 2021, thus creating a buyers’ market
A suppliers’ market in the next five years, but things will change
In the next five years out to 2017, we believe the global LNG market will remain reasonably tight given that within this timeframe, the demand/supply balance favours LNG suppliers over buyers due to robust new LNG demand in Japan and several other markets, and expected delays in new Australian supply projects. As a result, LNG imports are likely to be needed from the Middle East and the Atlantic Basin to keep the Asian market in equilibrium. Thus, short-term freight rates will likely remain strong due to these longer distance trade flows. A different world expected post 2017 We estimate that project sponsors globally are currently developing 35 projects (total unrisked capacity is 230mtpa) with most of these projects in competition to supply Asia. As can be seen in the chart below, we forecast a peak of around 410mtpa of global LNG capacity in 2020 with a natural decline taking over thereafter. Historical and forecast LNG supply
Source: Cedigaz, IEA, Daiwa estimates
Increasingly, unconventional gas supply is being planned as feedstock for these new LNG export projects. According to the IEA, 65% of global natural gas supply growth will come from unconventional sources over the 2010-35 period, as seen in the chart below. However, we note that 390bcm, or one-third, of this projected growth will come from China, which we view as overly optimistic given the current mixed results being reported by its shale gas exploration program. Nevertheless, even if we were to risk China’s unconventional gas supply at 50%, the total amount of 1,625bcm of gas supply would appear to make it a buyers’ market within the next five years. IEA: natural gas supply growth forecasts from 2010-35
Source: IEA
Over the past two years, conventional LNG project proponents have cited the possible levels of North American LNG exports from 2020 onwards as being a key risk factor that could see lower LNG prices, and therefore returns. Currently, nearly 20 permits to build around 150mtpa of capacity have been filed, which represents about one-third of US natural gas production in 2011. According to BG Group, between 20mtpa and 40mtpa of this 150mtpa may be in operation by 2020 and up to 60mtpa by 2025.
Global LNG projects in detail
In the table below, we present a list of global LNG plants that we think are likely to come onstream by 2018, which totals some 160mtpa of LNG. Importantly, this list excludes FLNG as well as most of the proposed North American LNG projects. If we include the FLNG projects and the North American projects, this would add another 193.6mtpa of LNG (28.3mtpa of FLNG and 165.3mtpa from North America) resulting in nearly 354mtpa of unrisked LNG supply by around 2020/21. Should all of this capacity come onstream, this would increase global LNG
0
50
100
150
200
250
300
350
400
450
2000
2001
2002
2003
2004
2005
2006
2007
2008
2009
2010
2011
2012
2013
E20
14E
2015
E20
16E
2017
E20
18E
2019
E20
20E
2021
E20
22E
2023
E20
24E
2025
E
(mtpa)
0
200
400
600
800
1,000
1,200
1,400
Conventional Unconventional
MENA
Russia
Rest of the World
China
USA
AustraliaIndiaEU
Rest of the World
IndonesiaCanada
(bcm)

Asia Oil & Gas Sector 5 July 2013
- 16 -
capacity by 126% from 282mtpa as at January 2013 to 636mtpa by around 2020/21, as shown in the chart below. Clearly, this would more than adequately supply the Asia-Pacific market – and even if we were to discount some of these projects, we still believe the weight of future supply would likely exert downward pressure on LNG prices. Potential global LNG capacity additions: 2013-21
Source: Daiwa estimates
Another factor that we have not taken into account is that of Asian shale gas, which we think bears careful monitoring in the next few years. How quickly or how
materially it will develop is unclear, but the potential is starting to emerge in North America, with several project sponsors and Asian buyers progressing a variety of new LNG plants to export unconventional gas. Longer term, shale gas developed directly in Asia could also become a new competitor to LNG, particularly if it is developed in China as a cost-effective alternative to LNG imports. As a result, it can be clearly seen from the many LNG plans that the market will remain a buyers’ one for the next decade. However as a cautionary note, we would add that the LNG industry has tended to overestimate supply growth, especially given what the future could hold: more and more expensive projects being developed in new locations and geography. Apart from the higher levels of complexity in such new locations and geography, higher levels of sovereign risk must also be taken into account. And as can be seen in Australia’s LNG industry, when so many projects compete for the same material and human resources, delays and cost escalations are inevitable.
Global LNG projects due to come onstream between 2013 and 2019 Project Participants Start-up Capacity Cost Cost Current status mtpa USDm USD/t Conventional gas Angola LNG Sonangol, Chevron, BP, Total, ENI 2Q13 5.2 10,000 1,923 ConstructionDonggi-Senoro LNG Medco Energi, Pertamina, Mitsubishi, Kogas 4Q14 2.0 3,700 1,850 ConstructionGorgon LNG Shell, Exxon, Chevron, Osaka Gas, Tokyo Gas, Chubu Electric 2Q15 15.6 55,000 3,526 ConstructionIchthys LNG Inpex, Total 4Q16 8.4 34,000 4,048 ConstructionPNG LNG Exxon, Oil Search 2Q14 6.9 19,000 2,754 ConstructionSabine Pass LNG Cheniere 3Q15 18.0 6,000 333 ConstructionWheatstone LNG Chevron, Apache, Kufpec, Kyushu Electric, Tokyo Electric 3Q16 8.9 29,000 3,258 ConstructionBrass LNG NNPC, EBI, ConocoPhillips, Total 2016 10.0 15,000 1,500 PlannedGulf LNG InterOil 2016 3.8 9,300 2,447 PlannedMozambique LNG Anadarko, PTTEP, BPCL, Videocon 2018 20.0 N/a N/a PlannedOlokola LNG NNPC, Shell, Chevron N/a 11.0 N/a N/a PlannedYamal LNG Novatek, Total 2017 16.5 20,000 1,212 PlannedTotal 126.3 X Unconventional gas Australia-Pacific LNG ConocoPhillips, Origin Energy, Sinopec 2015 9.0 25,200 2,800 ConstructionGladstone LNG Santos, Petronas, Total, Kogas 2015 7.8 18,500 2,372 ConstructionQueensland Curtis LNG BG 2014 8.5 20,500 2,412 ConstructionFisherman's Landing LNG LNG Ltd 2015 3.8 1,700 447 PlannedKitimat LNG Chevron, Apache 2015 5.0 4,500 900 PlannedBC LNG LNG Partners LLC 2019 1.8 N/a N/a PlannedTotal 34.1
Source: Companies, Daiwa
282
636
126 34
165 28
0100200300400500600700
LNG
cap
acity
as
at
Jan
2013
Conv
entio
nal L
NG
Unco
nven
tiona
l LNG
N. A
mer
ica
LNG
FLNG
Tota
l by
2021
(mtpa)
An addition of 354mtpa of capacity

Asia Oil & Gas Sector 5 July 2013
- 17 -
New supply routes have opened up in the past five years
Over the past five years, the shale gas revolution in North America has opened up both Canada and the US as potential new LNG supply sources for Asia. In addition, the tremendous exploration success seen in East Africa – and in particular Mozambique – has potentially planted that region as a future LNG exporter by the end of this decade. We estimate that, assuming peak production in the early 2020s, these three areas could contribute around 242mtpa to the global LNG trade on an unrisked basis. Relative ranking of key development issues and risks (note: 1 = good, 3 = bad) Issue USA Canada E.Africa Comment Level of overall infrastructure required
Full value chains needed in E. Africa; Upstream and pipelines required in Canada; less overall infrastructure needed in the US.
Risk of not getting export permits
Canadian and E. African Governments reasonably committed to large-scale exports. US situation more fluid.
Financing risk Financing is a major issue for all supply basins, bigger one for greenfield plays.
Reserve risk Limited resource risk in all three supply regions.
Contractual complexity Canada/E. Africa offering a bundled FOB/Ex-ship deal. US. is complicated requiring multiple agreements.
Opposition to Governments’ direct/indirect involvement
E. African projects enjoy direct support of host governments while Canada is pro-project. US political leaders likely to be more cautious.
Political risk
Source: Galway Group
Canada – British Columbia Like the US, Canada has seen a similar amount of shale gas plays being opened up by oil and gas companies. The country has a number of prospective shale gas targets in various stages of exploration and exploitation in British Columbia, Alberta, Saskatchewan, Ontario, Quebec, New Brunswick and Nova Scotia. While the country has negligible shale gas production due to the lack of demand within the country, and the US gas-export market being closed off due to low natural gas prices, the natural inclination for land owners is to look westwards towards the lucrative Asian LNG markets. As a result, there are currently four projects planned to come onstream between 2018 and 2019 with a total of 42mtpa of capacity.
Canada: planned and proposed LNG export terminals
Canada Partners Quantity
(mpta) Approval
statusProposed
start-upKitimat LNG Apache, Chevron 2 x 5.0 Approved 2016Petronas LNG Petronas, Japex 3 x 6.0 Review 2018BC LNG LNG Partners 1.8 Approved 2019Shell LNG Shell, Kogas, Mitsubishi,
PetroChina 12.0 Approved 2020
Total 41.8
Source: Companies
Of Canada’s four projects, the three that have received approvals are:
• Kitimat LNG: The two-train Kitimat LNG project, targeting start-up in 2016, is in front-end engineering and design at present. Its National Energy Board licence allows export of 10mtpa. In January 2013, Chevron entered the project by announcing plans to buy 50% of Kitimat LNG and the proposed Pacific Trail Pipeline, and 50% in 644,000 acres in the Horn River and Liard shale gas basins in British Columbia.
• BC LNG: In 2012, Canada’s Ministry of Natural Resources approved a 20-year export licence for the BC LNG Export Cooperative following similar approval by the NEB in February 2012 for export capacity of 1.8mtpa. The company is owned by LNG Partners LLC, Houston, and HN DC LNG LP, each with 50%.
• Shell LNG: Received approval in early 2013 from Canada’s National Energy Board (NEB) to export its proposed plant near Kitimat, British Columbia. The license authorises the company to export up to 24mtpa for 25 years with start-up targeted for 2020. This project is a joint venture of Shell Canada (Not rated), Korea Gas (Not rated), Mitsubishi Heavy Industries (7011 JP, JPY596, Buy [1]), and PetroChina (857 HK, HKD8.96, Outperform [2]).
US Gulf Coast According to our estimates, the US has around 151mtpa of planned LNG export projects (on an unrisked basis) that could come onstream in the next 5-8 years. This 151mtpa represents 45% of the global LNG trade movements in 2011 which is a significant expansion of LNG export capacity, if it all comes to fruition. LNG markets in Asia, Europe and Latin America have been watching the debate in the US over whether it would allow LNG exports of some or none of its shale gas. In December 2012, under commission from the US Department of Energy, NERA Consulting issued a report on the likely effect of US LNG exports on the domestic economy.

Asia Oil & Gas Sector 5 July 2013
- 18 -
Its scenario analysis for global LNG supply and demand concluded that in all its cases, US LNG exports would not harm the US economy, and that its forecast increase in Henry Hub gas prices would be modest as a result of such LNG exports. Post this report, the LNG industry is awaiting decisions on several proposed US LNG export projects, especially those requesting approval to export to countries with which the US does not have a Free Trade Agreement (FTA). US: planned and proposed LNG export terminals Project name Location Quantity Approval status Proposed (mtpa) DOE FTA DOE non-FTA FERC Start-upSabine Pass LNG Sabine Pass, LA 17.0 Approved Approved Approved 2016Freeport LNG Freeport, TX 2 x 10.8 Approved Review Prefield 2017Cameron LNG Cameron, LA 13.0 Approved Review Prefield 2017Cove Point LNG Cove Point, LA 7.7 Approved Review n/a 2017Lake Charles LNG Lake Charles, LA 15.5 Approved Review Prefield 2018Jordan Cove LNG Jordan Cove, OR 15.5 Approved Review Prefield 2017Carib Energy LLC n/a 0.3 Approved Review n/a n/aGulf Coast LNG Brownsville, TX 21.6 Review Review n/a 2018Gulf LNG Pascagoula, MS 11.6 Approved n/a n/a n/aCambridge Energy n/a 2.0 Review n/a n/a n/aOregon LNG Warrenton, OR 9.7 Approved Review Prefield n/aSB Power Solutions n/a 0.5 Approved n/a n/a n/aSouthern LNG Co. n/a 3.8 Approved n/a n/a n/aExcelerate Liq. Solutions
Port Lavacca, TX 10.7 Under review
n/a n/a n/a
Total 150.5
Source: Companies, Federal Energy Regulatory Commission
Note: FTA = Free Trade Agreement countries only; Prefield = pre-project field studies
Thus far, only the Cheniere Energy-led Sabine Pass LNG project has received all the export approvals and begun construction. In 1Q13, Cheniere Energy (Not rated) filed with the US Federal Energy Regulatory Commission (FERC) to add a fifth and sixth LNG train to the Sabine Pass project, as well as filed with the US Department of Energy for approvals for those trains to export to both FTA and non-FTA countries. To illustrate the demand for US LNG, all of the capacity from trains 1-4 has already been sold to BG (5.5mtpa), Gas Natural Fenosa (3.5mtpa), Kogas (3.5mtpa), and GAIL (3.5mtpa). Alaska – another potential new supply source for Asia? Between 2010 and 2012, two separate groups proposed a c.1,800km mostly buried pipeline from the Prudhoe Bay field on Alaska’s North Slope (ANS) to South-central Alaska where a 15-18mtpa LNG export plant and port would be located. These two groups are: 1) ExxonMobil, ConocoPhillips and BP, which are the main ANS oil and gas producers, and the Canadian pipeline company TransCanada, and 2) the Alaska Gasline Port Authority, which has proposed a government-owned Valdez LNG project.
While the Alaskan Gasline Port Authority does not have any capex estimates as yet, the ANS producers have estimated their project will cost between USD45bn and USD65bn, which includes the cost for a gas treatment plant, the liquefaction plant, as well as infrastructure such as the pipeline, and an LNG storage and a tanker terminal. At a construction cost of USD3,000-3,600/tpa, this project would be at the expensive end of LNG projects globally. Alaska’s natural gas projects
Source: Office of the Federal Coordinator for Alaska Natural Gas Transportation Projects
Mozambique, East Africa According to Anadarko, the 10mtpa USD15bn Mozambique LNG project has about 35tcf to over 65tcf of recoverable natural gas as feedstock. Importantly, it could be starting LNG exports in 2018 and producing around 20mtpa by 2020. Mozambique: discovery and reserves announcement timeline
Source: Anadarko, ENI
0
20
40
60
80
100
120
140
Jan-
10
Mar
-10
May
-10
Jul-1
0
Sep-
10
Nov-
10
Jan-
11
Mar
-11
May
-11
Jul-1
1
Sep-
11
Nov-
11
Jan-
12
Mar
-12
May
-12
Jul-1
2
Sep-
12
Nov-
12
(tcf)
1st d
isco
very
2nd
disc
over
y3r
d di
scov
ery
4th
disc
over
y
1st a
ppra
isal
wel
l

Asia Oil & Gas Sector 5 July 2013
- 19 -
Three new global LNG trade routes that should open up from 2015 onwards
Source: BG, Daiwa
Rising construction costs
Over the past 15 years, we have witnessed significant cost inflation in the construction of greenfield LNG plants. In the 1980s, the cost of building a greenfield LNG liquefaction plant was around USD350 per tonne of annual LNG production. The cost had dropped to around USD200 per tonne by the early 2000s as materials and energy costs declined on the back of lower energy prices, but started to skyrocket from 2004, reaching around USD1,000 per tonne by 2008. Why did costs escalate so sharply from 2004-08?
• Low availability of engineering, procurement and construction (EPC) contractors as a result of the extraordinarily high number of oil and gas projects globally in the mid- to late-2000s.
• High raw-material prices as a result of the surge in demand from fast-growing economies such as China.
• A lack of skilled and experienced workers in the LNG industry.
• The devaluation of the US Dollar against most global currencies.
In addition, we note that several new projects that were started post 2008 have seen their costs escalate due to their complexity, geography, environmental constraints or lack of infrastructure. Given the fact that so many projects are now using pioneering technology (coal-bed methane feed gas, floating liquefaction, deepwater, CO2 sequestration etc), we think it is realistic to expect that, barring a new breakthrough in construction costs, new LNG projects will generally be more expensive than in the past. Current LNG construction costs versus historical levels
Source: Companies, Daiwa estimates
British Columbia to Japan3,950 nautical miles
US Gulf Coast to Japan9,300 nautical miles
East Africa to Japan6,750 nautical miles
Traditional LNG trade routes:Qatar to Japan6,300 nautical milesAustralia to Japan3,700 nautical miles
350 200 4001,000
2,502 2,528
3,700
0500
1,0001,5002,0002,5003,0003,5004,000
1980
s
Early
200
0s
Mid
200
0s
Late
200
0s
Conv
entio
nal L
NG
Aust
ralia
n CB
M-
base
d LN
G
FLNG
(USD per tonne of annual LNG production)
Current LNG construction costs are 2.5x those seen
five years ago

Asia Oil & Gas Sector 5 July 2013
- 20 -
Construction costs at the project level at present
Source: IEA, Companies
Note: Dark blue = producing; light blue = proposed; orange = under construction; Sabine Pass relates only to Phase 1; East Africa LNG costs are a range of estimates
Australian costs: the only way is up Just in the past 18 months, we have seen Australia’s large LNG production projects announcing big cost overruns. Nevertheless, the projects’ construction schedules are continuing apace.
• A 6% cost overrun at Woodside’s AUD15bn one-train 4.3mtpa Pluto LNG project in the Carnarvon Basin, Western Australia, which started operations in 2Q12, one year behind schedule.
• A 15% cost increase for Santos’s two-train, 7.8mtpa coal-bed methane-based Gladstone LNG project in Queensland, in northeast Australia. In addition, the company said it needs to find more feedstock gas ahead of the AUD18.5bn project’s planned 2015 start-up.
• A 36% cost increase for BG Group’s two-train, 8.5mtpa Queensland Curtis Island LNG project. This cost increase to USD20.4bn, up from USD15bn, was attributed to regulatory costs, changes to the project, and a stronger Australian dollar.
• A 41% cost increase for Chevron’s Gorgon LNG expansion to USD52bn versus the USD37bn cost estimate when the project received Final Investment Decision in September 2009. While around USD5bn of this increase has been attributed to the strong Australian Dollar, poor productivity at the remote Barrow Island site off Western Australia, labour costs and weather delays have also taken a toll. Apart from the cost increase, first cargoes from the project have been delayed until 1Q15 instead of late 2014.
In addition, we also highlight the 20% cost increase to USD19bn that ExxonMobil announced for its PNG LNG project in Papua New Guinea in November 2012. This was attributed to unfavourable exchange rates, delays caused by disgruntled workers and landowners.
Fortunately for the project, there has been no delay to its start-up and delivery of gas in 2014. Shipping costs have also been increasing We note that the new LNG supply routes (such as from the US, Canada or East Africa) are now generally moving the cargoes longer distances to market. When more trade flows move from the US Gulf Coast (USGC) to Asia in the latter part of this decade, the shipping distances will be nearly 10,000 nautical miles, which is double the average shipping journey for a traditional route like Australia-to-Japan. According to CWC Insights, shipping costs from the USGC to Asia could be around USD4/mcf by 2015 which we note is much higher than Cheniere Energy’s estimate of USD3/mcf. Delivery cost of LNG to Asian markets
Source: Cambridge Energy Research Associates
Moving towards a more liberalised LNG supply market
With the large number of LNG projects coming onstream globally over the next 10 years, especially if new North American exports develop a critical mass and LNG projects are owned by a new group of sellers, we believe new business models may also emerge which could lead to a more liquid and more liberalised LNG market compared to what we have today. Already, we have seen various companies moving towards such a change and it is highly likely that the LNG market of today will be less restrictive and more liberalised going forward. These new business models include:
• Free On Board (FOB) sales at Henry Hub pricing and full destination flexibility, which may reduce short-term volatility in pricing.
• Utility companies have been farming into upstream acreage in the US in order to form a vertically
800
940
1,00
0
1,02
6
1,50
0
1,73
1
1,85
0
2,08
3
2,40
0
2,75
4
2,80
0
3,25
8
3,33
3
3,50
0
3,65
1
4,04
82,50
0
0500
1,0001,5002,0002,5003,0003,5004,0004,500
Sabi
ne P
ass
Kitim
at L
NG
Darw
in
Qat
arga
s 4
East
Afri
ca L
NG
Ango
la L
NG
Dong
gi-S
enor
o
Sakh
alin
2
Que
ensl
and
Curti
s
PNG
LNG
APLN
G
Whe
atst
one
Gor
gon
Prel
ude
FLNG
Plut
o
Icht
hys
(USD per tonne of production)
1.90 1.503.80 2.50
4.80 5.00 4.30 3.002.60
3.30 4.20
4.20 6.004.30 2.50 4.50
4.70
1.30
0.502.30
0.80 0.70 1.10 2.70 1.70 3.10
0.002.004.006.008.00
10.0012.0014.00
Mid
dle
East
Brow
nfie
ld
Paci
fic
Brow
nfie
ld
W. A
frica
G
reen
field
Paci
fic
Gre
enfie
ld
Paci
fic
Gre
enfie
ld
WC
Cana
daG
reen
field
USG
CBr
ownf
ield
E. A
frica
Gre
enfie
ld
Arct
icG
reen
field
Upstream Liquefaction Shipping
Asian oil-indexed LNG price (2015-2035)
(USD/mcf)

Asia Oil & Gas Sector 5 July 2013
- 21 -
integrated supply chain, mostly as a risk management technique. We see the trend continuing.
• LNG buyers building a diversified portfolio of supply from a variety of sources and business models in order to balance and manage their contractual and operational procurement risks.
• An Asian short-term pricing index may evolve which would be the reference for both physical and paper transactions.
• The emergence of a secondary market for LNG due to the potential influx of players in the market which would increase liquidity, thus allowing buyers and sellers to optimise their portfolios and balance their short-term supply and demand needs using short-term sales. Thus, the market would need to move away from individual sellers’ Master Sales Agreements and adopt standard general terms and conditions for buying and selling spot cargoes.
Already, we have seen a deeper LNG market evolve over the past 20 years, with the number of LNG suppliers per importer and LNG customers per exporter increasing steadily over time. This implies that the increase in LNG trade volumes has been accompanied by a deeper market. Also, should LNG trade volumes continue to rise and expand over the next 10-15 years (as BP’s forecast for an increase in regasification and liquefaction terminals implies), we expect the LNG market to become a much deeper one. Suppliers per importer vs. customers per exporter
Source: BP Energy Outlook to 2030
BP’s forecast of growth in regasification and liquefaction terminals
Source: BP Energy Outlook to 2030
Impact on Asian LNG players In the medium to long term, we expect liberalisation of the LNG market to benefit Asia in that the real prices of LNG will likely be lower. At the country level, key LNG importing countries like Japan, South Korea and Taiwan would benefit as they could see a decline in overall costs. For Asia-Pacific LNG exporters such as Australia, Indonesia and Malaysia, they would need to adapt to a new paradigm where the potential capacity equivalent to 2½ Qatars may come onto the market over the next 10 years.
0
2
4
6
8
10
1991
1992
1993
1994
1995
1996
1997
1998
1999
2000
2001
2002
2003
2004
2005
2006
2007
2008
2009
2010
2011
Suppliers per importer Customers per ex porter
(No. of customers)
0
20
40
60
80
100
120
140
1990 2000 2005 2010 2015 2020
Re-gas terminals Liquefaction terminals
(No. of terminals)

Asia Oil & Gas Sector 5 July 2013
- 22 -
LNG pricing: change is afoot
New trends in Asia-Pacific LNG pricing are likely in the next 3-5 years
Catalysts for change
In our view, the two key catalysts that have led to increased uncertainty over LNG pricing in the past three years are: 1) the surplus of gas in North America due to the shale gas revolution, and more recently the large offshore East Africa gas discoveries, and 2) the tight market created by Chinese growth and post-Fukushima Japanese demand. At present, the LNG industry is dominated by long-term contracts with Asian LNG prices out of line with the rest of the world as can be seen in the chart below. This was most notable in 2008 when oil-indexed, long-term LNG prices hit USD16-20/mcf, thus leading Japan and South Korea to question the traditional Southeast Asia pricing scheme and to start seeking an alternative hub-based pricing or a net back structure. As a result, the Japanese in particular have taken initial steps away from the traditional LNG pricing formula by taking equity stakes in North American LNG export projects. Should Japan establish LNG supplies from North America with a different pricing structure, this would likely have important negative ramifications for the very expensive Australian LNG developments. In our view, the next 3-5 years could see the advent of a new LNG pricing structure in the Asia-Pacific region that should lead to the commoditisation of LNG and gas prices.
LNG supply contracts: mainly long-term in nature
Historically, Asia-Pacific LNG trade was conducted under long-term supply contracts which were seen as beneficial for both LNG buyers and sellers. In addition,
the long-term nature of these contracts made it conducive to obtain financing.
• LNG buyers: these have exclusively been utilities companies in Japan, Korea and Taiwan given their lack of natural resources. As a result, the long-term LNG contracts gave them security of energy supply which was critical to maintaining the “always-on” nature of electricity supply to their mainly industrial customers.
• LNG producers: the major LNG exporting countries in Asia (such as Australia, Indonesia and Malaysia) have found that these long-term contracts allowed a high degree of certainty when making large scale, long-term investment decisions.
• Financing: in addition, we note that banks were eager to provide financing given the back-to-back marriage of LNG suppliers to the producers.
As a result, long-term contracts were particularly prevalent in the Asia-Pacific market, accounting for more than 86% of the region’s exports in 2010. LNG exports by contract type in 2010
Source: Cedigaz, PFC Energy
A gradual shift to spot LNG trading Over the past decade, we note that there has been a gradual shift to more flexible LNG purchasing arrangements as the market has grown in size and value, and become more diverse in terms of the numbers of importers as well as exporters. As can be seen in the chart below, trade in spot LNG cargoes (defined as contracts for delivery within one year) and under short-term contracts (defined as contracts with duration of less than four years) rose from around 5% in 2000 to over 25% of global LNG trade volumes in 2011. We believe spot and short-term cargoes will continue to increase as a percentage of total LNG trade volumes in the next few years, and combined with ‘destination-free’ supplies from the US,
0
20
40
60
80
100
120
Atlantic Middle East Asia-Pacific
Spot and short-term contract Long-term contract
(bcm)
37% 26% 14%

Asia Oil & Gas Sector 5 July 2013
- 23 -
this intrinsically should lead to relatively lower LNG prices. Spot and short term LNG cargoes as a % of global LNG trade volumes
Source: International Gas Union
Understanding the current Asian LNG pricing model
There are three major pricing systems in current LNG contracts globally:
• oil-indexed contracts used primarily in Japan, Korea, Taiwan and China,
• oil, oil products and other energy carriers indexed contracts used primarily in Continental Europe, and
• market-indexed contracts used in the US and the UK.
Since Brunei first commissioned its LNG plant in 1973, long-term LNG contracts in Asia have been of the oil indexed variety. Although this concept may sound simple, the actual derivation of the LNG price is more involved given that there are typically three pieces to the calculation: the oil price, the slope and the constant.
• The oil price (or the base price). In Asia, the crude oil marker that is often used is the Japan customs-cleared crude price (also known as the Japanese Crude Cocktail, or JCC). This JCC price represents the average monthly price of a basket of various crude oils (with a one-month lag to the spot price) that is imported into Japan. Given that these crude oils are mainly from the Middle East, they typically move in line with other global crude oil benchmarks.
• The slope. This is a negotiated factor between the LNG buyer and seller and essentially determines the relationship between oil and gas prices, which is then multiplied by the JCC. In terms of energy equivalents, 1m British thermal units of gas has
16.67% of the energy content of a barrel of oil. Thus, if we were to use energy-equivalent parity, the slope would be 16.67%. However, typical LNG contracts involve slopes of around 14-15% which implies that the buyer is paying a discount to energy-equivalent parity. A very common variation to this contract is the S-curve contract (see chart below) which has flatter slopes at the higher and lower end of pricing which protects the buyer and the seller respectively.
• The constant. This represents a fixed payment that again is negotiated between the buyer and seller, and usually references shipping costs. In general, this fixed payment is around USD1/mmBtu.
A notional LNG s-curve contract vs. straight line contract
Source: International Gas Union
What is the future for LNG pricing?
In our view, some of the key medium- to long-term issues that will engender change in the current oil-indexed, S-curve structure of LNG pricing include:
• Greater competition between sellers, especially given the large new gas finds in North American shale and offshore East Africa.
• Buyers becoming more price-sensitive as their maturing economies struggle to remain competitive.
• Increasing energy deregulation.
• Higher levels of gas-on-gas competition with the completion of large long-distance pipelines.
• Increasing spot market liquidity and availability of spot price-based LNG exports.
In our view, the key issue that could change Asia’s LNG pricing structure is the first one. We note that in the past few years as the shale gas revolution in the US has taken hold, Japanese and Korean utilities as well as Japanese trading houses have taken note and have bought equity stakes in both shale gas acreage as well
0%
5%
10%
15%
20%
25%
30%
2000 2001 2002 2003 2004 2005 2006 2007 2008 2009 2010 2011
0
2
4
6
8
10
12
14
16
18
$6 $12 $18 $24 $30 $36 $42 $48 $54 $60 $66 $72 $78 $84 $90 $96
Gas
pric
e(USD/mmBtu)
Oil pr ice (USD/bbl)
Straight-line contract
S-curve contract
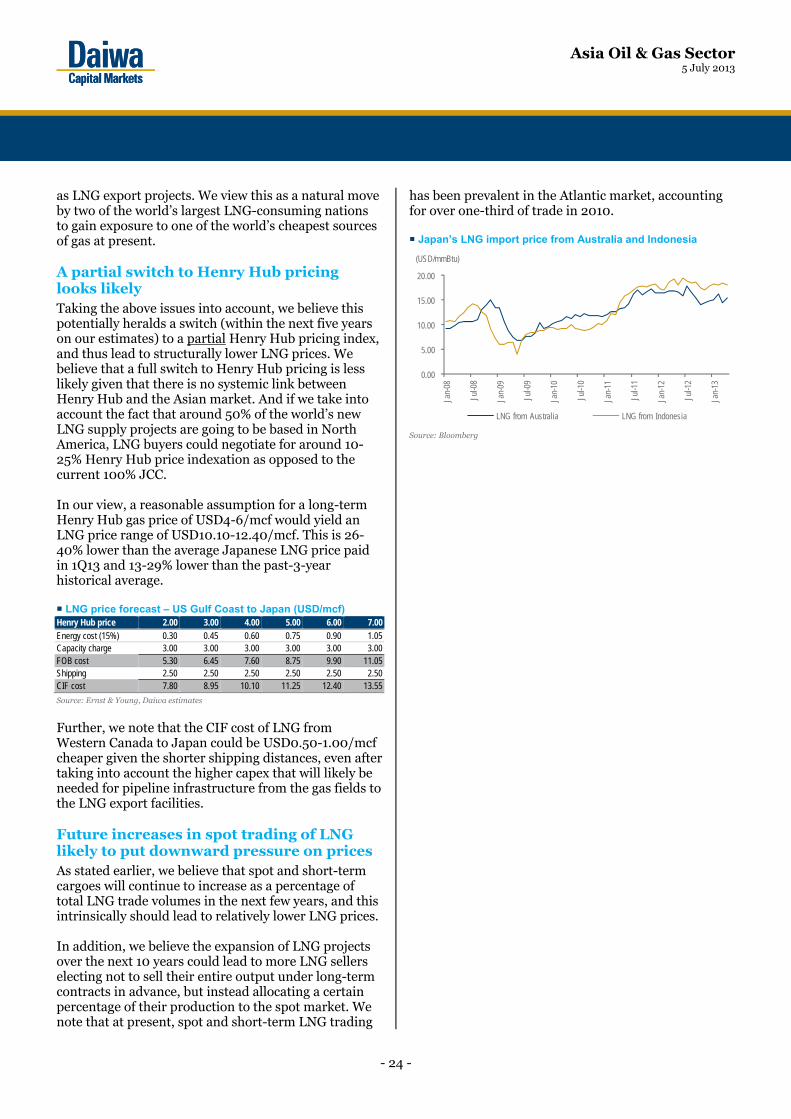
Asia Oil & Gas Sector 5 July 2013
- 24 -
as LNG export projects. We view this as a natural move by two of the world’s largest LNG-consuming nations to gain exposure to one of the world’s cheapest sources of gas at present. A partial switch to Henry Hub pricing looks likely Taking the above issues into account, we believe this potentially heralds a switch (within the next five years on our estimates) to a partial Henry Hub pricing index, and thus lead to structurally lower LNG prices. We believe that a full switch to Henry Hub pricing is less likely given that there is no systemic link between Henry Hub and the Asian market. And if we take into account the fact that around 50% of the world’s new LNG supply projects are going to be based in North America, LNG buyers could negotiate for around 10-25% Henry Hub price indexation as opposed to the current 100% JCC. In our view, a reasonable assumption for a long-term Henry Hub gas price of USD4-6/mcf would yield an LNG price range of USD10.10-12.40/mcf. This is 26-40% lower than the average Japanese LNG price paid in 1Q13 and 13-29% lower than the past-3-year historical average. LNG price forecast – US Gulf Coast to Japan (USD/mcf) Henry Hub price 2.00 3.00 4.00 5.00 6.00 7.00Energy cost (15%) 0.30 0.45 0.60 0.75 0.90 1.05Capacity charge 3.00 3.00 3.00 3.00 3.00 3.00FOB cost 5.30 6.45 7.60 8.75 9.90 11.05Shipping 2.50 2.50 2.50 2.50 2.50 2.50CIF cost 7.80 8.95 10.10 11.25 12.40 13.55
Source: Ernst & Young, Daiwa estimates
Further, we note that the CIF cost of LNG from Western Canada to Japan could be USD0.50-1.00/mcf cheaper given the shorter shipping distances, even after taking into account the higher capex that will likely be needed for pipeline infrastructure from the gas fields to the LNG export facilities. Future increases in spot trading of LNG likely to put downward pressure on prices As stated earlier, we believe that spot and short-term cargoes will continue to increase as a percentage of total LNG trade volumes in the next few years, and this intrinsically should lead to relatively lower LNG prices. In addition, we believe the expansion of LNG projects over the next 10 years could lead to more LNG sellers electing not to sell their entire output under long-term contracts in advance, but instead allocating a certain percentage of their production to the spot market. We note that at present, spot and short-term LNG trading
has been prevalent in the Atlantic market, accounting for over one-third of trade in 2010. Japan’s LNG import price from Australia and Indonesia
Source: Bloomberg
0.00
5.00
10.00
15.00
20.00
Jan-
08
Jul-0
8
Jan-
09
Jul-0
9
Jan-
10
Jul-1
0
Jan-
11
Jul-1
1
Jan-
12
Jul-1
2
Jan-
13
LNG from Australia LNG from Indonesia
(USD/mmBtu)

Asia Oil & Gas Sector 5 July 2013
- 25 -
Floating LNG plans
From nowhere in 2010, FLNG could account for around 8% of global LNG projects by 2021, on our estimates
Background
The energy industry has discussed floating natural gas liquefaction for more than 30 years as an option to develop gas from remote offshore locations. As the larger gas fields are developed, the relatively smaller and/or more remote fields therefore remain ‘stranded’ due to the fact that the fields are too far offshore to make pipeline delivery to a land-based plant economically unattractive. Thus, the concept of floating LNG vessels was developed in order to monetise these stranded assets that would otherwise be marginal due to magnitude and/or location. At present, there are no FLNG vessels in operation, however there are currently seven projects at various stages of planning and preparation as seen in the table below. It would appear that the first project will be Petronas’s FLNG-1 which will service the Kanowit field, located 180km away from the Bintulu LNG project in the state of Sarawak, East Malaysia. Nearly USD50bn in capex on FLNG over the next 10 years According to estimates by Douglas-Westwood, about USD47bn will be spent on FLNG over the 2013-19 period, of which USD28bn will be spent on FLNG vessels, and another USD19bn on import terminals.
Shell’s Prelude FLNG
Source: Shell
Major drivers
We identify four major drivers of FLNG:
• An increasing desire to monetise gas fields that are located far from existing infrastructure (pipelines, gas processing, onshore LNG export facilities, etc.), or where the installation costs of such infrastructure degrades returns and is thus uneconomic.
• Onshore liquefaction projects have seen continuing delays and material cost increases in recent years, especially in Australia, and thus the FLNG concept can now compete with equivalent onshore projects in certain circumstances. The addition of an FLNG also reduces the need for other on-field infrastructure lowering overall project cost.
• Companies are now actively looking at export and production options that avoid gas flaring and unnecessary reinjection, and FLNG solves these problems.
• The modular aspect of FLNG technology offers the ability to redeploy expensive assets at appropriate times in the overall project life, thereby achieving capital efficiency.
Floating LNG projects under construction or planned Project Participants Start-up Capacity Cost Cost Current status (mtpa) (USDm) (USD/tonne) Petronas FLNG-1 Petronas 2015 1.2 N/a N/a ConstructionPrelude Shell 2017 3.6 12,600 3,500 PlannedAbadi Inpex, Shell, Energi Mega Persada 2018 2.5 10,000 4,000 ConstructionBonaparte LNG GDF Suez, Santos 2018 3.0 N/a N/a PlannedSunrise LNG Woodside 2018 3.5 12,600 3,600 PlannedScarborough LNG Exxon, BHP Billiton 2021 7.0 N/a N/a PlannedBrowse LNG Woodside, PetroChina N/a 6.0 N/a N/a PlannedPetronas FLNG-2 Petronas N/a 1.5 N/a N/a Planned
Source: Companies

Asia Oil & Gas Sector 5 July 2013
- 26 -
Browse could be a turning-point Woodside’s Browse LNG project in Western Australia may be a turning-point in the development of FLNG globally given that it was first conceived of as a land-based LNG project. However in April 2013, Woodside indefinitely postponed the development of the Browse LNG project due to cost escalation, but stated that it would re-look at the project using Shell’s FLNG technology, as that could be the fastest way to monetise the gas asset. However, BHP Billiton (with an 8.3% stake in Browse) said it did not support FLNG as a development option for the project, as it considered the technology untested. The company subsequently sold its stake to PetroChina (857 HK, HKD8.96, Outperform [2]) for USD1.63bn. Concerns have also been raised in Western Australia from both state-level politicians and the labour unions, as the FLNG option is seen to create fewer jobs. In our view, this project could be a turning-point for FLNG merely on the basis that it started life as an onshore LNG project, however owing to various cost and environmental pressures, it is now being mooted as a potential FLNG project instead.
Illustrative capital costs of FLNG versus onshore LNG
In an analysis of LNG capital costs in 2011, Purvin & Gertz showed that, depending on the situation, FLNG can be less costly than land-based LNG development. Capital cost comparison: onshore LNG vs. FLNG USDbn Onshore FLNG LNG 1 x 4mtpa 2 x 2mtpa Production facilities 1.9 1.9 1.9 FPSO 1.2 - - Export pipeline 2.5 - - LNG plant 5.5 5.8 6.6 Total 11.1 7.7 8.5
Source: Purvin & Gertz
As can be seen in the table above, the FLNG option combines the functions of the FPSO and LNG production onto a floating vessel at the production site, and is potentially most appealing when the export pipeline is particularly long or costly. In this analysis, cost savings could be achieved by avoiding the requirement for the FPSO and the export pipeline, and thus offset the extra capital and operating costs associated with FLNG. In our analysis of various Asia-Pacific LNG projects, the cost of a gas export pipeline to an onshore LNG
plant can constitute between 25% and 40% to the cost of the LNG project. In some cases, such as Woodside’s planned Sunrise LNG project, the export pipeline to Timor Leste may cross seismically active areas. In the table below, Purvin & Gertz estimates that on a liquefaction-cost basis, FLNG is between 18% and 27% less expensive than onshore LNG, with the key assumptions being a 30-year operating life for both types of assets and a 10% per year rate of return on the total invested capital. In this example, FLNG production offers superior economics compared with onshore LNG production, however Purvin & Gertz did note that as the scale of the LNG installation increases, the attractions of FLNG are considerably less. Illustrative economics for FLNG USDm/year unless stated Onshore FLNG LNG 1 x 4mtpa 2 x 2mtpa Capital cost (USDbn) 11.1 7.7 8.5 Annual capital recovery - 30 years 370 257 283 Annual cost of service return 1,100 770 850 Annual capital charge 1,470 1,027 1,133 Fixed operating costs 220 164 200 Sustaining capital 84 97 113 Variable operating cost 10 11 11 Total annual cost 1,784 1,299 1,457 x LNG production (mtpa) 4.00 4.00 4.00 LNG production (mmBtu/year) 208 208 208 x Total liquefaction cost (USD/mmBtu) 8.58 6.24 7.01
Source: Purvin & Gertz
Applications of FLNG technology
According to Shell, FLNG technology may be considered for developing smaller gas-condensate fields of around 3-5tcf and at a relatively large distance from shore >200km which could otherwise not be developed economically. Further economic feasibility studies by Shell in the past few years have indicated that FLNG could see a much wider application, for example where multiple smaller fields are exploited by means of sub-sea tie-backs.

Asia Oil & Gas Sector 5 July 2013
- 27 -
FLNG application modes as envisioned by Shell
Source: Shell
Still a few hurdles
In our view, there are still a few hurdles to overcome related to the commercialisation of FLNG technology in the next few years. These include:
• Lack of technological precedence: as it is with any new technology, there may be delays in getting the vessel up and running on time and on budget. Given the size and cost of the vessel, cost over-runs due to design changes and re-engineering may be considerable. Once in operation, there may be operational issues given the newness of the technology.
• Given that FLNG is a ship-based solution, it will need to satisfy flag state requirements and class
requirements in addition to fulfilling requirements of the gas-production state (eg, environmental approvals).
• Whether these vessels will have a residual value is unknown due to the embryonic nature of the FLNG market. While there is a market for FPSOs once the initial contracts have been fulfilled, the fact that FLNGs are likely to be project-specific rather than a more generalised design may limit their prospects of being sold in a secondary market.
• There are other key issues, such as: 1) capital cost, 2) modularity, and 3) insurance attributes of FLNG installations to consider – capital cost and modularity provide key advantages that support selection of FLNG over land-based LNG installations when the conditions are right. Insurance is a potentially important area that could contribute to decisions on scale and modularity of the FLNG installation chosen.
• Insurance is a potential stumbling block for FLNG, since no such installation has ever been insured. One issue to consider would be the scale of the FLNG vessel as the cost of a vessel could be between USD4-6bn. This would imply that only a large syndicate would be able to fully insure one vessel. In addition, the insurer would not only need to consider the total loss of the facility but also the business interruption risk.
Who are the technology players in this emerging field? In our analysis of companies with exposure to FLNG, we found very few Asian companies, with most being listed in the US or Europe. The companies below have won contracts from oil companies for various components within the FLNG value chain, but this is not meant to be an exhaustive list:
• Technip SA (TEC FP, Not rated) of France and Samsung Heavy Industries (010140 KS, KRW35,050, Buy [1]) are handling front-end engineering and design process work for Shell’s Prelude FLNG.
• Daewoo Shipbuilding & Marine Engineering (042660 KS, KRW24,850, Hold [3]) and Technip have a JV for the engineering, procurement, construction, installation, and commissioning of Petronas’s FLNG-1 project.
• Höegh LNG (HLNG NO, Not rated) provides floating LNG infrastructure services under long-term contracts. At present, the company owns and operates FSRUs and LNG carriers, and has stated that it is looking at managing FLNG vessels as well.
FLNG
Exploration potential
1. SMALLER SINGLE FIELD
2. LARGER SINGLE FIELD – MULTIPLE OR PHASED SOLUTION
3. MULTIPLE GAS FIELDSClusters of sub-commercial volumes with additional exploration
potential
FLNG
FLNG
FLNG

Asia Oil & Gas Sector 5 July 2013
- 28 -
• Air Products (APD US, Not rated): heat exchangers for Petronas’s FLNG-1 project.
• Honeywell (HON US, Not rated): acid gas removal technology from its wholly owned subsidiary, UOP, for Petronas’s FLNG-1 project.
• Chiyoda (6366 JP, JPY1,221, Hold [3]): liquefaction technology, heat exchangers, gas turbine cooling systems, engineering, procurement, construction and design of FLNG vessels.
• SBM Offshore (SBMO NA, Not rated): already has experience in designing, building and operating FPSOs and is trying to draw on this experience to develop its FLNG business – particularly for mid-scale FLNG conversions in the 1.5-2.0mtpa size, or gas fields of around 0.5-2.0tcf.

Asia Oil & Gas Sector 5 July 2013
- 29 -
Background on LNG
History and properties
LNG refers to the liquid that is formed when natural gas is cooled to -162°C. This liquid is clear, odourless, non-toxic and non-corrosive with the latter two properties in particular making it relatively easy to transport. The liquefaction process takes place when natural gas is cooled under high pressure, is then condensed, and then further reduced in pressure for storage. The resulting liquid is 1/600th of the volume of natural gas, and about half as dense as water. Purified LNG is usually composed of 90% methane and small amounts of ethane, propane, butane and heavier alkanes. The history of natural gas liquefaction dates back to the 19th century when commercial LNG plants were built in West Virginia in 1912 and Ohio in 1941. The first LNG tanker, the Methane Pioneer, transported LNG from Louisiana to the UK in 1959, demonstrating the viability of long-range transport. In 1964, Algeria became the first continuous large-scale exporter. What is the difference between LNG and CNG? LNG achieves a higher reduction in volume than compressed natural gas (CNG), so that the energy density of LNG is 2.4 times greater than that of CNG, ie, for any given size of fuel tank, there is 2.4x more energy in an LNG fuel tank versus CNG. This makes LNG very cost-efficient to transport over long distances where pipelines do not exist.
Processing and transportation
Processing Feedgas must be processed through four stages before it enters the liquefaction process. It must be:
• compressed by steam turbines,
• purified to remove carbon dioxide and hydrogen sulphide and other impurities,
• dehydrated to reduce water content, and
• fractionated to separate liquefied petroleum gases (LPG).
Finally, the resulting hydrocarbons (mainly methane and ethane) are liquefied via cryogenic heat exchangers. Seaborne transportation LNG’s primary benefit is its ease of transportation and density of storage. It can be transported efficiently over long distances where pipelines are not an option – the usual rule-of-thumb is that LNG is used to transport gas if the distances are greater than 1,000km. Specially designed seagoing vessels incorporate double hulls and insulated storage tanks, in which the LNG is carried at standard atmospheric pressure. LNG is not generally considered explosive, but is flammable in air concentrations of 5-15%. Older LNG vessels utilise Moss spherical containment vessels, which can be identified by dome-shaped protrusions above the deck. Later designs utilize membrane containment systems (see picture below), which allows greater capacity for a given ship size, but are more susceptible to sloshing loads when partially filled. Qatargas’ 210,000m3 LNG carrier ‘Alvbahiya’
Source: Daewoo Shipbuilding and Marine Engineering
A key transportation issue is boil-off, which is the loss of cargo due to evaporation as the cargo warms. The loss rate is typically in the region of 0.15% per day. Most vessels allow this evaporation to take place in order to keep the remaining cargo cool. This boiled-off gas can then be used as fuel in onboard steam-turbine power plants. Alternatively, some vessels now carry on-board re-liquefaction facilities, allowing nearly 100% of the cargo to be delivered. After unloading, a small amount of LNG cargo (‘heel’) must be retained in the vessel in order to keep the tanks cool. Otherwise, a cooling down period of 12-24

Asia Oil & Gas Sector 5 July 2013
- 30 -
hours would be required before loading another cargo, incurring additional boil-off losses. The cargo capacity of a standard vessel is 126,000-155,000 m3, although the Qatari shipping fleet operated by Nakilat was designed with larger capacities to achieve economies of scale. These Q-Class vessels carry 210,000 m3 (Q-Flex) and 266,000m3 (Q-Max) but can only be accepted at a limited number of ports. LNG can also be transported by small-scale tankers (7,500m3) and trucks. At the receiving terminal, LNG is typically stored in tanks and later reheated into gaseous form and distributed via pipeline. Since nitrogen is lost during the seagoing voyage, regasified LNG is often too rich in calorific value to meet network transmission gas quality requirements. LNG terminals therefore incorporate nitrogen ballasting facilities to blend gas down to meet quality standards. Spot LNG freight rates in April 2013 were at around USD100,000-105,000/day, up from the lows of USD25,000-USD50,000/day seen in 2009 and 2010.

Asia Oil & Gas Sector 5 July 2013
- 31 -
Daiwa’s Asia Pacific Research Directory
HONG KONG
Hiroaki KATO (852) 2532 4121 [email protected] Regional Research Head
John HETHERINGTON (852) 2773 8787 [email protected] Regional Deputy Head of Asia Pacific Research; Regional Head of Product Management
Pranab Kumar SARMAH (852) 2848 4441 [email protected] Regional Head of Research Promotion
Dave DAI (852) 2848 4068 [email protected] Deputy Head of Hong Kong and China Research; Pan-Asia/Regional Head of Clean Energy and Utilities; Utilities; Power Equipment; Renewables (Hong Kong, China)
Kevin LAI (852) 2848 4926 [email protected] Deputy Head of Regional Economics; Macro Economics (Regional)
Christie CHIEN (852) 2848 4482 [email protected] Macro Economics (Taiwan)
Jonas KAN (852) 2848 4439 [email protected] Head of Hong Kong Research; Head of Hong Kong and China Property; Regional Property Coordinator; Property Developers (Hong Kong)
Jeff CHUNG (852) 2773 8783 [email protected] Automobiles and Components (China)
Grace WU (852) 2532 4383 [email protected] Head of Greater China FIG; Banking (Hong Kong, China)
Jerry YANG (852) 2773 8842 [email protected] Banking (Taiwan)/Diversified Financials (Taiwan and China)
Leon QI (852) 2532 4381 [email protected] Banking (Hong Kong, China)
Joseph HO (852) 2848 4443 [email protected] Head of Industrials and Machineries (Hong Kong, China); Capital Goods –Electronics Equipments and Machinery (Hong Kong, China)
Winston CAO (852) 2848 4469 [email protected] Capital Goods – Machinery (China)
Bing ZHOU (852) 2773 8782 [email protected] Consumer/Retail (Hong Kong, China); Hotels, Restaurants and Leisure - Casinos and Gaming (Hong Kong, Macau)
Cris XU (852) 2773 8736 [email protected] Household & Personal Products (China)
Eric CHEN (852) 2773 8702 [email protected] Pan-Asia/Regional Head of IT/Electronics; Semiconductor/IC Design (Regional)
Felix LAM (852) 2532 4341 [email protected] Head of Materials (Hong Kong, China); Cement and Building Materials (China, Taiwan); Property (China)
John CHOI (852) 2773 8730 [email protected] Regional Head of Small/Medium Cap; Small/Mid Cap (Regional); Head of Multi-Industries (Hong Kong, China); Internet (China)
Joey CHEN (852) 2848 4483 [email protected] Steel (China)
Kelvin LAU (852) 2848 4467 [email protected] Head of Transportation (Hong Kong, China); Hong Kong and China Research Coordinator; Transportation (Regional)
Jibo MA (852) 2848 4489 [email protected] Head of Custom Products Group; Custom Products Group
Thomas HO (852) 2773 8716 [email protected] Custom Products Group
PHILIPPINES
Rommel RODRIGO (63) 2 813 7344 ext 302
Head of Philippines Research; Strategy; Capital Goods; Materials
SOUTH KOREA
Chang H LEE (82) 2 787 9177 [email protected] Head of Korea Research; Strategy
Sung Yop CHUNG (82) 2 787 9157 [email protected] Pan-Asia Co-head/Regional Head of Automobiles and Components; Automobiles; Shipbuilding; Steel
Jun Yong BANG (82) 2 787 9168 [email protected] Tyres; Chemicals
Anderson CHA (82) 2 787 9185 [email protected] Banking/Finance
Mike OH (82) 2 787 9179 [email protected] Capital Goods (Construction and Machinery)
Sang Hee PARK (82) 2 787 9165 [email protected] Consumer/Retail
Jae H LEE (82) 2 787 9173 [email protected] IT/Electronics (Tech Hardware and Memory Chips)
Joshua OH (82) 2 787 9176 [email protected] IT/Electronics (Handset Components)
Thomas Y KWON (82) 2 787 9181 [email protected] Pan-Asia Head of Internet & Telecommunications; Software (Korea) – Internet/On-line Game
SoYoung WANG (82) 2 787 9133 [email protected] Transportation/Logistics
TAIWAN
Mark CHANG (886) 2 8758 6245 [email protected] Head of Research
Steven TSENG (886) 2 8758 6252 [email protected]
IT/Technology Hardware (PC Hardware)
Christine WANG (886) 2 8758 6249 [email protected] IT/Technology Hardware (Automation); Cement; Consumer
Lynn CHENG (886) 2 8758 6253 [email protected] IT/Electronics (Semiconductor)
Rita HSU (886) 2 8758 6254 [email protected] Small/Mid Cap
INDIA
Punit SRIVASTAVA (91) 22 6622 1013 [email protected] Head of Research; Strategy; Banking/Finance
Navin MATTA (91) 22 6622 8411 [email protected] Automobiles and Components
Saurabh MEHTA (91) 22 6622 1009 [email protected] Capital Goods; Utilities
Mihir SHAH (91) 22 6622 1020 [email protected] FMCG/Consumer
Deepak PODDAR (91) 22 6622 1016 [email protected]
Materials
Nirmal RAGHAVAN (91) 22 6622 1018 [email protected] Oil and Gas; Utilities
SINGAPORE
Adrian LOH (65) 6499 6548 [email protected] Head of Singapore Research, Regional Head of Oil and Gas; Oil and Gas (ASEAN and China); Capital Goods (Singapore)
Srikanth VADLAMANI (65) 6499 6570 [email protected] Banking (ASEAN)
David LUM (65) 6329 2102 [email protected] Property and REITs
Ramakrishna MARUVADA (65) 6499 6543 [email protected] Head of ASEAN & India Telecommunications; Telecommunications (ASEAN & India)

Asia Oil & Gas Sector 5 July 2013
- 32 -
Daiwa’s Offices
Office / Branch / Affiliate Address Tel Fax
DAIWA SECURITIES GROUP INC
HEAD OFFICE Gran Tokyo North Tower, 1-9-1, Marunouchi, Chiyoda-ku, Tokyo, 100-6753 (81) 3 5555 3111 (81) 3 5555 0661
Daiwa Securities Trust Company One Evertrust Plaza, Jersey City, NJ 07302, U.S.A. (1) 201 333 7300 (1) 201 333 7726
Daiwa Securities Trust and Banking (Europe) PLC (Head Office) 5 King William Street, London EC4N 7JB, United Kingdom (44) 207 320 8000 (44) 207 410 0129
Daiwa Europe Trustees (Ireland) Ltd Level 3, Block 5, Harcourt Centre, Harcourt Road, Dublin 2, Ireland (353) 1 603 9900 (353) 1 478 3469
Daiwa Capital Markets America Inc Financial Square, 32 Old Slip, New York, NY10005, U.S.A. (1) 212 612 7000 (1) 212 612 7100
Daiwa Capital Markets America Inc. San Francisco Branch 555 California Street, Suite 3360, San Francisco, CA 94104, U.S.A. (1) 415 955 8100 (1) 415 956 1935
Daiwa Capital Markets Europe Limited 5 King William Street, London EC4N 7AX, United Kingdom (44) 20 7597 8000 (44) 20 7597 8600
Daiwa Capital Markets Europe Limited, Frankfurt Branch Trianon Building, Mainzer Landstrasse 16, 60325 Frankfurt am Main, Federal Republic of Germany
(49) 69 717 080 (49) 69 723 340
Daiwa Capital Markets Europe Limited, Paris Representative Office 36, rue de Naples, 75008 Paris, France (33) 1 56 262 200 (33) 1 47 550 808
Daiwa Capital Markets Europe Limited, London, Geneva Branch 50 rue du Rhône, P.O.Box 3198, 1211 Geneva 3, Switzerland (41) 22 818 7400 (41) 22 818 7441
Daiwa Capital Markets Europe Limited, Moscow Representative Office
Midland Plaza 7th Floor, 10 Arbat Street, Moscow 119002, Russian Federation
(7) 495 641 3416 (7) 495 775 6238
Daiwa Capital Markets Europe Limited, Bahrain Branch 7th Floor, The Tower, Bahrain Commercial Complex, P.O. Box 30069, Manama, Bahrain
(973) 17 534 452 (973) 17 535 113
Daiwa Capital Markets Hong Kong Limited Level 28, One Pacific Place, 88 Queensway, Hong Kong (852) 2525 0121 (852) 2845 1621
Daiwa Capital Markets Singapore Limited 6 Shenton Way #26-08, DBS Building Tower Two, Singapore 068809, Republic of Singapore
(65) 6220 3666 (65) 6223 6198
Daiwa Capital Markets Australia Limited Level 34, Rialto North Tower, 525 Collins Street, Melbourne, Victoria 3000, Australia
(61) 3 9916 1300 (61) 3 9916 1330
DBP-Daiwa Capital Markets Philippines, Inc 18th Floor, Citibank Tower, 8741 Paseo de Roxas, Salcedo Village, Makati City, Republic of the Philippines
(632) 813 7344 (632) 848 0105
Daiwa-Cathay Capital Markets Co Ltd 14/F, 200, Keelung Road, Sec 1, Taipei, Taiwan, R.O.C. (886) 2 2723 9698 (886) 2 2345 3638
Daiwa Securities Capital Markets Korea Co., Ltd. One IFC, 10 Gukjegeumyung-Ro, Yeouido-dong, Yeongdeungpo-gu, Seoul, 150-876, Korea
(82) 2 787 9100 (82) 2 787 9191
Daiwa Securities Capital Markets Co Ltd, Beijing Representative Office
Room 3503/3504, SK Tower, No.6 Jia Jianguomen Wai Avenue, Chaoyang District, Beijing 100022, People’s Republic of China
(86) 10 6500 6688 (86) 10 6500 3594
Daiwa SSC Securities Co Ltd 45/F, Hang Seng Tower, 1000 Lujiazui Ring Road, Pudong, Shanghai 200120, People’s Republic of China
(86) 21 3858 2000 (86) 21 3858 2111
Daiwa Securities Capital Markets Co. Ltd, Bangkok Representative Office
18th Floor, M Thai Tower, All Seasons Place, 87 Wireless Road, Lumpini, Pathumwan, Bangkok 10330, Thailand
(66) 2 252 5650 (66) 2 252 5665
Daiwa Capital Markets India Private Ltd 10th Floor, 3 North Avenue, Maker Maxity, Bandra Kurla Complex, Bandra East, Mumbai – 400051, India
(91) 22 6622 1000 (91) 22 6622 1019
Daiwa Securities Capital Markets Co. Ltd, Hanoi Representative Office
Suite 405, Pacific Palace Building, 83B, Ly Thuong Kiet Street, Hoan Kiem Dist. Hanoi, Vietnam
(84) 4 3946 0460 (84) 4 3946 0461
DAIWA INSTITUTE OF RESEARCH LTD
HEAD OFFICE 15-6, Fuyuki, Koto-ku, Tokyo, 135-8460, Japan (81) 3 5620 5100 (81) 3 5620 5603
MARUNOUCHI OFFICE Gran Tokyo North Tower, 1-9-1, Marunouchi, Chiyoda-ku, Tokyo, 100-6756 (81) 3 5555 7011 (81) 3 5202 2021
New York Research Center 11th Floor, Financial Square, 32 Old Slip, NY, NY 10005-3504, U.S.A. (1) 212 612 6100 (1) 212 612 8417
London Research Centre 3/F, 5 King William Street, London, EC4N 7AX, United Kingdom (44) 207 597 8000 (44) 207 597 8550

Asia Oil & Gas Sector 5 July 2013
- 33 -
Samsung Heavy Industries: share price and Daiwa recommendation trend
Source: Daiwa
Date Target price Rating Date Target price Rating Date Target price Rating03/11/10 38,000 Outperform 25/08/11 40,000 Outperform 13/08/12 45,000 Outperform20/12/10 45,000 Outperform 01/11/11 36,000 Outperform 01/11/12 45,000 Buy25/01/11 50,000 Outperform 02/02/12 42,000 Outperform 30/01/13 49,000 Buy07/07/11 55,000 Outperform 14/03/12 48,000 Outperform 22/04/13 45,000 Buy
24,000
34,000
38,000
45,000
50,000
55,000
40,000
36,000
42,000
48,000
45,000
49,000
45,000
20,000
25,000
30,000
35,000
40,000
45,000
50,000
55,000
Jul-1
0
Aug-
10
Sep-
10
Oct
-10
Nov-
10
Dec-
10
Jan-
11
Feb-
11
Mar
-11
Apr-1
1
May
-11
Jun-
11
Jul-1
1
Aug-
11
Sep-
11
Oct
-11
Nov-
11
Dec-
11
Jan-
12
Feb-
12
Mar
-12
Apr-1
2
May
-12
Jun-
12
Jul-1
2
Aug-
12
Sep-
12
Oct
-12
Nov-
12
Dec-
12
Jan-
13
Feb-
13
Mar
-13
Apr-1
3
May
-13
Jun-
13
Jul-1
3
Target price (KRW) Closing Price (KRW)
Share price and Daiwa recommendation trend

Asia Oil & Gas Sector 5 July 2013
- 34 -
Disclaimer
This publication is produced by Daiwa Securities Group Inc. and/or its non-U.S. affiliates, and distributed by Daiwa Securities Group Inc. and/or its non-U.S. affiliates, except to the extent expressly provided herein. This publication and the contents hereof are intended for information purposes only, and may be subject to change without further notice. Any use, disclosure, distribution, dissemination, copying, printing or reliance on this publication for any other purpose without our prior consent or approval is strictly prohibited. Neither Daiwa Securities Group Inc. nor any of its respective parent, holding, subsidiaries or affiliates, nor any of its respective directors, officers, servants and employees, represent nor warrant the accuracy or completeness of the information contained herein or as to the existence of other facts which might be significant, and will not accept any responsibility or liability whatsoever for any use of or reliance upon this publication or any of the contents hereof. Neither this publication, nor any content hereof, constitute, or are to be construed as, an offer or solicitation of an offer to buy or sell any of the securities or investments mentioned herein in any country or jurisdiction nor, unless expressly provided, any recommendation or investment opinion or advice. Any view, recommendation, opinion or advice expressed in this publication may not necessarily reflect those of Daiwa Securities Capital Markets Co. Ltd., and/or its affiliates nor any of its respective directors, officers, servants and employees except where the publication states otherwise. This research report is not to be relied upon by any person in making any investment decision or otherwise advising with respect to, or dealing in, the securities mentioned, as it does not take into account the specific investment objectives, financial situation and particular needs of any person. Daiwa Securities Group Inc., its subsidiaries or affiliates, or its or their respective directors, officers and employees from time to time have trades as principals, or have positions in, or have other interests in the securities of the company under research including derivatives in respect of such securities or may have also performed investment banking and other services for the issuer of such securities. The following are additional disclosures. Japan Daiwa Securities Co. Ltd. and Daiwa Securities Group Inc. Daiwa Securities Co. Ltd. is a subsidiary of Daiwa Securities Group Inc. Investment Banking Relationship
Within the preceding 12 months, The subsidiaries and/or affiliates of Daiwa Securities Group Inc. * has lead-managed public offerings and/or secondary offerings (excluding straight bonds) of the securities of the following companies: Beijing Jingneng Clean Energy Company Limited (579 HK); REXLot Holdings Limited (555 HK); Huadian Fuxin Energy Corporation Limited (816 HK); Chaowei Power Holdings Limited (951 HK); CITIC Securities Company Limited (6030 HK); China Outfitters Holdings Limited (1146 HK); The People's Insurance Company (Group) of China Limited (1339 HK); China Precious Metal Resources Holdings Company Limited (1194 HK); Jiangnan Group Limited (1366 HK).
*Subsidiaries of Daiwa Securities Group Inc. for the purposes of this section shall mean any one or more of: Daiwa Capital Markets Hong Kong Limited, Daiwa Capital Markets Singapore Limited, Daiwa Capital Markets Australia Limited, Daiwa Capital Markets India Private Limited, Daiwa-Cathay Capital Markets Co., Ltd., Daiwa Securities Capital Markets Korea Co., Ltd. Hong Kong This research is distributed in Hong Kong by Daiwa Capital Markets Hong Kong Limited (“DHK”) which is regulated by the Hong Kong Securities and Futures Commission. Recipients of this research in Hong Kong may contact DHK in respect of any matter arising from or in connection with this research. Ownership of Securities For “Ownership of Securities” information, please visit BlueMatrix disclosure Link at https://daiwa3.bluematrix.com/sellside/Disclosures.action. Investment Banking Relationship For “Investment Banking Relationship”, please visit BlueMatrix disclosure Link at https://daiwa3.bluematrix.com/sellside/Disclosures.action. Relevant Relationship (DHK) DHK may from time to time have an individual employed by or associated with it serves as an officer of any of the companies under its research coverage. DHK market making DHK may from time to time make a market in securities covered by this research. Korea The developing analyst of this research and analysis material hereby states and confirms that the contents of this material correctly reflect the analyst’s views and opinions and that the analyst has not been placed under inappropriate pressure or interruption by an external party.
Name of Analyst : Sung Yop Chung
Disclosure of Analysts’ Interests If an analyst engaging in or a person who exercises influences on the preparation or publication of a Research Report containing recommendations for general investors to trade financial investment instruments with regard to which the analyst or the influential person has personal interests and if the recommendations contained in the Report may have impacts on the personal interests, Daiwa Securities Capital Markets Korea Co., Ltd.(“Daiwa Securities Korea”)shall ensure that the Analyst or the influential person notifies that he/she has personal interests with regard to: 1. The equity, the equity-linked bonds and the instruments with the subscription right to the equity issued by the legal entity covered in the Research Report (or the legal entity subject to the investment recommendations); 2. The stock option granted by the legal entity covered in the Research Report (or the legal entity subject to the investment recommendations); or 3. The equity futures, the equity options and the equity-linked warrants backed by the equity prescribed in the preceding Paragraph 1 as the underlying assets. Legal Entities subject to Research Report Coverage Restrictions Daiwa Securities Korea hereby states and confirms that Daiwa Securities Korea has no conflicts of interests with the legal entity covered in this Research Report: 1. In that Daiwa Securities Korea does NOT offer direct or indirect payment guarantee for the legal entity by means of, for instance, guarantee, endorsement, provision of collaterals or the acquisition of debts; 2. In that Daiwa Securities Korea does NOT own one-hundredth (or 1/100) or more of the total number of outstanding equities issued by the legal entity; 3. In that The legal entity is NOT an affiliated company of Daiwa Securities Korea pursuant to Sub-paragraph 3, Article 2 of the Monopoly Regulation and Fair Trade Act of Korea; 4. In that, although Daiwa Securities Korea offers advisory services for the legal entity with regard to an M&A deal, the size of the M&A deal does NOT exceed five-hundredths (or 5/100) of the total asset size or the total number of equities issued and outstanding of the legal entity; 5. In that, although Daiwa Securities Korea acted in the capacity of a Lead Underwriter for the initial public offering of the legal entity, more than one-year has passed since the IPO date; 6. In that Daiwa Securities Korea is NOT designated by the legal entity as the ‘tender offer agent’ pursuant to the Paragraph 2, Article 133 of the Financial Services and Capital Market Act or the legal entity is NOT the issuer of the equity subject to the proposed tender offer; this requirement, however applies until the maturity of the tender offer period; or 7. In that Daiwa Securities Korea does NOT have significant or material interests with regard to the legal entity. Disclosure of Prior Distribution to Third Party This report has not been distributed to the third party in advance prior to public release. The following explains the rating system in the report as compared to KOSPI, based on the beliefs of the author(s) of this report. "1": the security could outperform the KOSPI by more than 15% over the next six months. "2": the security is expected to outperform the KOSPI by 5-15% over the next six months. "3": the security is expected to perform within 5% of the KOSPI (better or worse) over the next six months. "4": the security is expected to underperform the KOSPI by 5-15% over the next six months. "5": the security could underperform the KOSPI by more than 15% over the next six months. “Positive” means that the analyst expects the sector to outperform the KOSPI over the next six months. “Neutral” means that the analyst expects the sector to be in-line with the KOSPI over the next six months “Negative” means that the analyst expects the sector to underperform the KOSPI over the next six months Additional information may be available upon request.

Asia Oil & Gas Sector 5 July 2013
- 35 -
Singapore This research is distributed in Singapore by Daiwa Capital Markets Singapore Limited and it may only be distributed in Singapore to accredited investors, expert investors and institutional investors as defined in the Financial Advisers Regulations and the Securities and Futures Act (Chapter 289), as amended from time to time. By virtue of distribution to these category of investors, Daiwa Capital Markets Singapore Limited and its representatives are not required to comply with Section 36 of the Financial Advisers Act (Chapter 110) (Section 36 relates to disclosure of Daiwa Capital Markets Singapore Limited’s interest and/or its representative’s interest in securities). Recipients of this research in Singapore may contact Daiwa Capital Markets Singapore Limited in respect of any matter arising from or in connection with the research. Australia This research is distributed in Australia by Daiwa Capital Markets Stockbroking Limited and it may only be distributed in Australia to wholesale investors within the meaning of the Corporations Act. Recipients of this research in Australia may contact Daiwa Capital Markets Stockbroking Limited in respect of any matter arising from or in connection with the research. Ownership of Securities For “Ownership of Securities” information, please visit BlueMatrix disclosure Link at https://daiwa3.bluematrix.com/sellside/Disclosures.action. India This research is distributed by Daiwa Capital Markets India Private Limited (DAIWA) which is an intermediary registered with Securities & Exchange Board of India. This report is not to be considered as an offer or solicitation for any dealings in securities. While the information in this report has been compiled by DAIWA in good faith from sources believed to be reliable, no representation or warranty, express of implied, is made or given as to its accuracy, completeness or correctness. DAIWA its officers, employees, representatives and agents accept no liability whatsoever for any loss or damage whether direct, indirect, consequential or otherwise howsoever arising (whether in negligence or otherwise) out of or in connection with or from any use of or reliance on the contents of and/or omissions from this document. Consequently DAIWA expressly disclaims any and all liability for, or based on or relating to any such information contained in or errors in or omissions in this report. Accordingly, you are recommended to seek your own legal, tax or other advice and should rely solely on your own judgment, review and analysis, in evaluating the information in this document. The data contained in this document is subject to change without any prior notice DAIWA reserves its right to modify this report as maybe required from time to time. DAIWA is committed to providing independent recommendations to its Clients and would be happy to provide any information in response to any query from its Clients. This report is strictly confidential and is being furnished to you solely for your information. The information contained in this document should not be reproduced (in whole or in part) or redistributed in any form to any other person. We and our group companies, affiliates, officers, directors and employees may from time to time, have long or short positions, in and buy sell the securities thereof, of company(ies) mentioned herein or be engaged in any other transactions involving such securities and earn brokerage or other compensation or act as advisor or have the potential conflict of interest with respect to any recommendation and related information or opinion. DAIWA prohibits its analyst and their family members from maintaining a financial interest in the securities or derivatives of any companies that the analyst cover. This report is not intended or directed for distribution to, or use by any person, citizen or entity which is resident or located in any state or country or jurisdiction where such publication, distribution or use would be contrary to any statutory legislation, or regulation which would require DAIWA and its affiliates/ group companies to any registration or licensing requirements. The views expressed in the report accurately reflect the analyst’s personal views about the securities and issuers that are subject of the Report, and that no part of the analyst’s compensation was, is or will be directly or indirectly, related to the recommendations or views expressed in the Report. This report does not recommend to US recipients the use of Daiwa Capital Markets India Private Limited or any of its non – US affiliates to effect trades in any securities and is not supplied with any understanding that US recipients will direct commission business to Daiwa Capital Markets India Private Limited. Taiwan This research is distributed in Taiwan by Daiwa-Cathay Capital Markets Co., Ltd and it may only be distributed in Taiwan to institutional investors or specific investors who have signed recommendation contracts with Daiwa-Cathay Capital Markets Co., Ltd in accordance with the Operational Regulations Governing Securities Firms Recommending Trades in Securities to Customers. Recipients of this research in Taiwan may contact Daiwa-Cathay Capital Markets Co., Ltd in respect of any matter arising from or in connection with the research. Philippines This research is distributed in the Philippines by DBP-Daiwa Capital Markets Philippines, Inc. which is regulated by the Philippines Securities and Exchange Commission and the Philippines Stock Exchange, Inc. Recipients of this research in the Philippines may contact DBP-Daiwa Capital Markets Philippines, Inc. in respect of any matter arising from or in connection with the research. DBP-Daiwa Capital Markets Philippines, Inc. recommends that investors independently assess, with a professional advisor, the specific financial risks as well as the legal, regulatory, tax, accounting, and other consequences of a proposed transaction. DBP-Daiwa Capital Markets Philippines, Inc. may have positions or may be materially interested in the securities in any of the markets mentioned in the publication or may have performed other services for the issuers of such securities. For relevant securities and trading rules please visit SEC and PSE Link at http://www.sec.gov.ph/irr/AmendedIRRfinalversion.pdf and http://www.pse.com.ph/ respectively. United Kingdom This research report is produced by Daiwa Capital Markets Europe Limited and/or its affiliates and is distributed in the European Union, Iceland, Liechtenstein, Norway and Switzerland. Daiwa Capital Markets Europe Limited is authorised and regulated by The Financial Conduct Authority (“FCA”) and is a member of the London Stock Exchange, Eurex and NYSE Liffe. Daiwa Capital Markets Europe Limited and/or its affiliates may, from time to time, to the extent permitted by law, participate or invest in other financing transactions with the issuers of the securities referred to herein (the “Securities”), perform services for or solicit business from such issuers, and/or have a position or effect transactions in the Securities or options thereof and/or may have acted as an underwriter during the past twelve months for the issuer of such securities. In addition, employees of Daiwa Capital Markets Europe Limited and/or its affiliates may have positions and effect transactions in such securities or options and may serve as Directors of such issuers. Daiwa Capital Markets Europe Limited may, to the extent permitted by applicable UK law and other applicable law or regulation, effect transactions in the Securities before this material is published to recipients. This publication is intended for investors who are not Retail Clients in the United Kingdom within the meaning of the Rules of the FCA and should not therefore be distributed to such Retail Clients in the United Kingdom. Should you enter into investment business with Daiwa Capital Markets Europe’s affiliates outside the United Kingdom, we are obliged to advise that the protection afforded by the United Kingdom regulatory system may not apply; in particular, the benefits of the Financial Services Compensation Scheme may not be available. Daiwa Capital Markets Europe Limited has in place organisational arrangements for the prevention and avoidance of conflicts of interest. Our conflict management policy is available at http://www.uk.daiwacm.com/about-us/corporate-governance-and-regulatory . Regulatory disclosures of investment banking relationships are available at https://daiwa3.bluematrix.com/sellside/Disclosures.action. Germany This document has been approved by Daiwa Capital Markets Europe Limited and is distributed in Germany by Daiwa Capital Markets Europe Limited, Niederlassung Frankfurt which is regulated by BaFin (Bundesanstalt fuer Finanzdienstleistungsaufsicht) for the conduct of business in Germany. Bahrain
This research material is issued/compiled by Daiwa Capital Markets Europe Limited, Bahrain Branch, regulated by The Central Bank of Bahrain and holds Investment Business Firm – Category 2 license and having its official place of business at the Bahrain World Trade Centre, South Tower, 7th floor, P.O. Box 30069, Manama, Kingdom of Bahrain. Tel No. +973 17534452 Fax No. +973 535113
This material is provided as a reference for making investment decisions and is not intended to be a solicitation for investment. Investment decisions should be made at your own discretion and risk. Accordingly, no representation or warranty, express or implied, is made as to and no reliance should be placed on the fairness, accuracy, completeness or correctness of the information and opinions contained in this document, Content herein is based on information available at the time the research material was prepared and may be amended or otherwise changed in the future without notice. All information is intended for the private use of the person to whom it is provided without any liability whatsoever on the part of Daiwa Capital Markets Europe Limited, Bahrain Branch, any associated company or the employees thereof. If you are in doubt about the suitability of the product or the research material itself, please consult your own financial adviser. Daiwa Capital Markets Europe Limited, Bahrain Branch retains all rights related to the content of this material, which may not be redistributed or otherwise transmitted without prior consent. United States This report is distributed in the U.S. by Daiwa Capital Markets America Inc. (DCMA). It may not be accurate or complete and should not be relied upon as such. It reflects the preparer’s views at the time of its preparation, but may not reflect events occurring after its preparation; nor does it reflect DCMA’s views at any time. Neither DCMA nor the preparer has any obligation to update this report or to continue to prepare research on this subject. This report is not an offer to sell or the solicitation of any offer to buy securities. Unless this report says otherwise, any recommendation it makes is risky and appropriate only for sophisticated speculative investors able to incur significant losses. Readers should consult their financial advisors to determine whether any such recommendation is consistent with their own investment objectives, financial situation and needs. This report does not recommend to U.S. recipients the use of any of DCMA’s non-U.S. affiliates to effect trades in any security and is not supplied with any understanding that U.S. recipients of this report will direct commission business to such non-U.S. entities. Unless applicable law permits otherwise, non-U.S. customers wishing to effect a transaction in any securities referenced in this material should contact a Daiwa entity in their local jurisdiction. Most countries throughout the world have their own laws regulating the types of securities and other investment products which may be offered to their residents, as well as a process for doing so. As a result, the securities discussed in this report may not be eligible for sales in some jurisdictions. Customers wishing to obtain further information about this report should contact DCMA: Daiwa Capital Markets America Inc., Financial Square, 32 Old Slip, New York, New York 10005 (telephone 212-612-7000). Ownership of Securities For “Ownership of Securities” information please visit BlueMatrix disclosure Link at https://daiwa3.bluematrix.com/sellside/Disclosures.action.

Asia Oil & Gas Sector 5 July 2013
- 36 -
Investment Banking Relationships For “Investment Banking Relationships” please visit BlueMatrix disclosure link at https://daiwa3.bluematrix.com/sellside/Disclosures.action. DCMA Market Making For “DCMA Market Making” please visit BlueMatrix disclosure link at https://daiwa3.bluematrix.com/sellside/Disclosures.action. Research Analyst Conflicts For updates on “Research Analyst Conflicts” please visit BlueMatrix disclosure link at https://daiwa3.bluematrix.com/sellside/Disclosures.action. The principal research analysts who prepared this report have no financial interest in securities of the issuers covered in the report, are not (nor are any members of their household) an officer, director or advisory board member of the issuer(s) covered in the report, and are not aware of any material relevant conflict of interest involving the analyst or DCMA, and did not receive any compensation from the issuer during the past 12 months except as noted: no exceptions. Research Analyst Certification For updates on “Research Analyst Certification” and “Rating System” please visit BlueMatrix disclosure link at https://daiwa3.bluematrix.com/sellside/Disclosures.action. The views about any and all of the subject securities and issuers expressed in this Research Report accurately reflect the personal views of the research analyst(s) primarily responsible for this report (or the views of the firm producing the report if no individual analysts[s] is named on the report); and no part of the compensation of such analyst(s) (or no part of the compensation of the firm if no individual analyst[s)] is named on the report) was, is, or will be directly or indirectly related to the specific recommendations or views contained in this Research Report. The following explains the rating system in the report as compared to relevant local indices, based on the beliefs of the author of the report. "1": the security could outperform the local index by more than 15% over the next six months. "2": the security is expected to outperform the local index by 5-15% over the next six months. "3": the security is expected to perform within 5% of the local index (better or worse) over the next six months. "4": the security is expected to underperform the local index by 5-15% over the next six months. "5": the security could underperform the local index by more than 15% over the next six months. Additional information may be available upon request. Japan - additional notification items pursuant to Article 37 of the Financial Instruments and Exchange Law (This Notification is only applicable where report is distributed by Daiwa Securities Co. Ltd.) If you decide to enter into a business arrangement with us based on the information described in materials presented along with this document, we ask you to pay close attention to the following items. • In addition to the purchase price of a financial instrument, we will collect a trading commission* for each transaction as agreed beforehand with you. Since commissions may be included in
the purchase price or may not be charged for certain transactions, we recommend that you confirm the commission for each transaction. • In some cases, we may also charge a maximum of ¥ 2 million (including tax) per year as a standing proxy fee for our deposit of your securities, if you are a non-resident of Japan. • For derivative and margin transactions etc., we may require collateral or margin requirements in accordance with an agreement made beforehand with you. Ordinarily in such cases, the
amount of the transaction will be in excess of the required collateral or margin requirements. • There is a risk that you will incur losses on your transactions due to changes in the market price of financial instruments based on fluctuations in interest rates, exchange rates, stock prices,
real estate prices, commodity prices, and others. In addition, depending on the content of the transaction, the loss could exceed the amount of the collateral or margin requirements. • There may be a difference between bid price etc. and ask price etc. of OTC derivatives handled by us. • Before engaging in any trading, please thoroughly confirm accounting and tax treatments regarding your trading in financial instruments with such experts as certified public accountants.
*The amount of the trading commission cannot be stated here in advance because it will be determined between our company and you based on current market conditions and the content of each transaction etc.
When making an actual transaction, please be sure to carefully read the materials presented to you prior to the execution of agreement, and to take responsibility for your own decisions regarding the signing of the agreement with us. Corporate Name: Daiwa Securities Co. Ltd. Financial instruments firm: chief of Kanto Local Finance Bureau (Kin-sho) No.108 Memberships: Japan Securities Dealers Association, Financial Futures Association of Japan Japan Securities Investment Advisers Association Type II Financial Instruments Firms Association