
LMR Master S412E Product Brochurecdn1.shopmania.biz/files/s1/106709629/content/LMR Master...
28
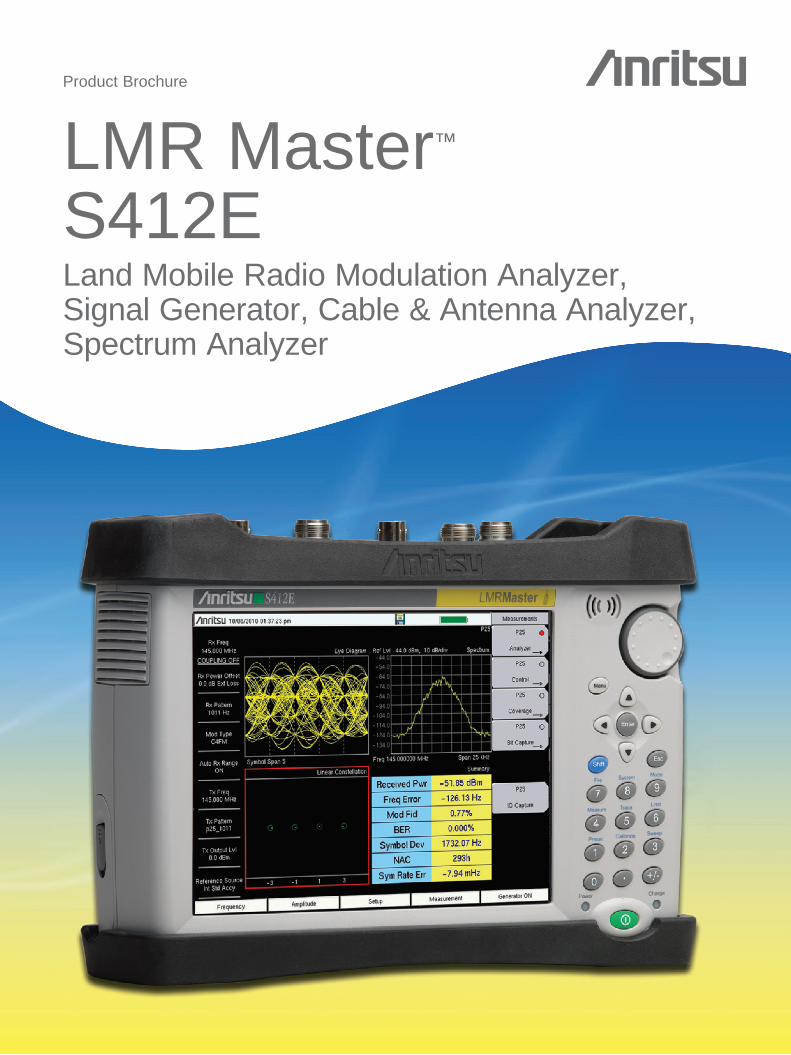
Product Brochure LMR Master ™ S412E Land Mobile Radio Modulation Analyzer, Signal Generator, Cable & Antenna Analyzer, Spectrum Analyzer
Transcript of LMR Master S412E Product Brochurecdn1.shopmania.biz/files/s1/106709629/content/LMR Master...
Product Brochure
LMR Master™
S412ELand Mobile Radio Modulation Analyzer, Signal Generator, Cable & Antenna Analyzer, Spectrum Analyzer

2 of 28
LMR Master™ S412E Features
Overview
Introduction
The LMR Master S412E is a compact handheld multi-function analyzer that has been specifically developed for technicians and engineers who install and maintain public safety, utility and private mobile communications systems. The LMR Master also offers support for the emerging Positive Train Control (PTC) standard mandated by the U.S. government. Despite being a battery powered handheld instrument, the S412E offers unmatched measurement breadth, depth, and precision, reducing the number of different tools needed to verify operation and diagnose problems.
Standard features are:
•2-Port Vector Network Analyzer: 500 kHz to 1.6 GHz
•Spectrum Analyzer: 100 kHz to 1.6 GHz
•CW Signal Generator: 500 kHz to 1.6 GHz
•Power Meter: 10 MHz to 1.6 GHz
•Narrowband FM Analysis of Received Power, Carrier Frequency, Frequency Error, Deviation, Modulation Rate, SINAD, THD, CTCSS, DCS, and DTMF. Auto Scan locatesandlocksontounidentifiedNBFMsignalsourcesbetween 10 MHz and 1.6 GHz. Indoor Coverage Mapping of RSSI and transmitter SINAD is standard on the LMR Master. Outdoor Coverage Mapping is available with the optional GPS Receiver.
LMR Master S412E offers many options, including:
•Extension of Spectrum Analyzer to 6 GHz
•Extension of Vector Network Analyzer to 6 GHz
•Distance Domain Analysis on 1-path 2-port VNA
•Vector Voltmeter
•HighVoltageBiasTee(forbothVNAandSpectrum Analyzer applications)
•High Accuracy Power Meter
• Interference Analyzer
•Channel Scanner
•GPS Receiver
•P25 Analyzer, including P25 Signal Generation
•NXDN Analyzer, including NXDN Signal Generation
•DMR Tier 2 Analyzer, including DMR Tier 2 Signal Generation
•PTC Analyzer, including PTC Signal Generation
•CoverageMappingofRSSI,BER,andEVM(ModulationFidelity)forNBFM,P25,NXDN,DMR,andPTCincludingthe industry’s only solution for indoor coverage mapping!
•LTE Analyzer including RF, Modulation Quality, and Over-the-Air Measurement
• IEEE 802.16 Fixed WiMAX Analyzer including RF and Demodulation Measurements
• IEEE 802.16 Mobile WiMAX Analyzer including RF, Demodulation, and Over-the-Air Measurements
LMR site technicians and RF engineers can use the S412E to accurately and quickly test and verify the installation and commissioning of base stations, mobiles, and portables. The LMR Master is equally suited for preventative maintenance and troubleshooting to help ensure the operation of wireless network infrastructures, including broadband and microwave backhaul systems.
S412E LMR Master™
3 of 28
LMR Master™ S412E Features
2 Port Vector Network Analyzer
Measurements
1-port Measurements
• VSWR, Return Loss, Phase, Linear Polar, Log Polar
Smith Chart
•Log/Mag/2 (1-port Cable Loss)
•Distance-to-Fault (DTF) Return Loss
•Distance-to-Fault (DTF) VSWR
Windowing Functions in Distance Domain
•Rectangular
•Normal Side Lobe
•Low Side Lobe
•Minimum Side Lobe
2-port Measurements
• Log Mag Insertion Loss/Gain, Phase,
Linear Polar, Log Polar, Group Delay
Calibration
•User-variable Data Points from 2 to 4001
•Full S11 (Open, Short, Load)
•1P2P (Open, Short, Load, Through)
•Response S11
•Response S21
Sweep Functions
•Run/Hold, Single/Continuous
•RF Immunity (High/Low)
•Averaging/Smoothing
•Output Power (High/Low)
Trace Functions
•Save/Recall, Copy to Display Memory
•No Trace Math, Trace ± Memory
•Trace Overlay
Marker Functions
•Up to 8 Markers, each with a Delta Marker
•Marker to Peak/Valley
•Marker to/Peak Valley between Markers
•Marker Table
Limit Line Functions
•Limit Lines
•Single Limit
•Multi-segment (41)
•Limit Alarm
•Limit Line Edit
•Frequency, Amplitude
•Add/Delete Point
•Next Point Left/Right
•Move Limit
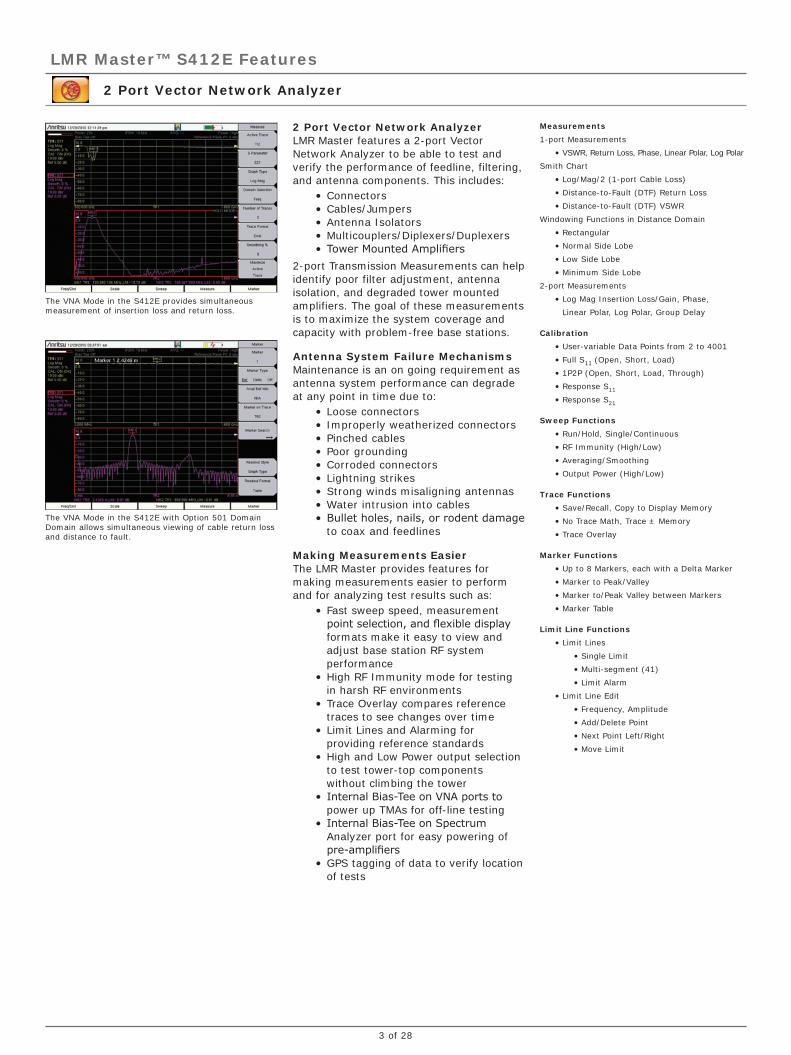
2 Port Vector Network AnalyzerLMR Master features a 2-port Vector Network Analyzer to be able to test and verify the performance of feedline, filtering, and antenna components. This includes:
•Connectors•Cables/Jumpers•Antenna Isolators•Multicouplers/Diplexers/Duplexers• TowerMountedAmplifiers
2-port Transmission Measurements can help identify poor filter adjustment, antenna isolation, and degraded tower mounted amplifiers. The goal of these measurements is to maximize the system coverage and capacity with problem-free base stations.
Antenna System Failure MechanismsMaintenance is an on going requirement as antenna system performance can degrade at any point in time due to:
•Loose connectors• Improperly weatherized connectors•Pinched cables•Poor grounding•Corroded connectors•Lightning strikes•Strong winds misaligning antennas•Water intrusion into cables•Bulletholes,nails,orrodentdamage
to coax and feedlines
Making Measurements EasierThe LMR Master provides features for making measurements easier to perform and for analyzing test results such as:
• Fast sweep speed, measurement pointselection,andflexibledisplayformats make it easy to view and adjust base station RF system performance
•High RF Immunity mode for testing in harsh RF environments
•Trace Overlay compares reference traces to see changes over time
• Limit Lines and Alarming for providing reference standards
•High and Low Power output selection to test tower-top components without climbing the tower
• InternalBias-TeeonVNAportstopower up TMAs for off-line testing
• InternalBias-TeeonSpectrumAnalyzer port for easy powering of pre-amplifiers
•GPS tagging of data to verify location of tests
The VNA Mode in the S412E with Option 501 Domain Domain allows simultaneous viewing of cable return loss and distance to fault.
The VNA Mode in the S412E provides simultaneous measurement of insertion loss and return loss.

4 of 28
LMR Master™ S412E Features
Spectrum Analyzer
Measurements
•OneButtonMeasurements
•FieldStrength–indBm/m2ordBmV/m
•OccupiedBandwidth-1%to99%ofpower
•Emission Mask
•ChannelPower-inspecifiedbandwidth
•ACPR - adjacent channel power ratio
•AM/FM/SSBDemodulation-audiooutonly
•C/I - carrier-to-interference ratio
Sweep Functions
•Sweep
• Single/Continuous, Manual Trigger,
Reset, Minimum Sweep Time
•Detection
• Peak, RMS, Negative, Sample,
Quasi-peak
•Triggers
• Free Run, External, Video, Change
Position, Manual
Trace Functions
•Traces
•1-3Traces(A,B,C),View/Blank,
Write/Hold
•Trace A Operations
• Normal, Max Hold, Min Hold, Average,
Number of Averages, (always the live trace)
•TraceBOperations
•A B,BC, Max Hold, Min Hold
•Trace C Operations
• A C,BC, Max Hold, Min Hold,
A-B C,
•B-AC,RelativeReference(dB),Scale
Marker Functions
•Markers
• 1-6 Markers each with a Delta Marker, or
Marker 1 Reference with 6 Delta Markers
•Marker Types
• Fixed, Tracking, Noise, Frequency Counter
•Marker Auto-Position
• Peak Search, Next Peak (Right/Left),
PeakThreshold%,ToChannel,To
Center,To Reference Level, Delta Marker
to Span
•Marker Table
• 1-6 markers’ frequency & amplitude
plus delta markers’ frequency offset
& amplitude
Limit Line Functions
•Limit Lines
•Upper/Lower, Limit Alarm, Default Limit
•Limit Line Edit
• Frequency, Amplitude, Add/Delete Point,
Add Vertical, Next Point Left/Right
•Limit Line Move
•ToCurrentCenterFrequency,BydB
or Hz, To Marker 1, Offset from Marker 1
•Limit Line Envelope
• Create, Update Amplitude, Number of
Points (41), Offset, Shape Square/Slope
•Limit Line Advanced
•Absolute/Relative, Mirror, Save/Recall
Spectrum Analyzer The S412E features the most powerful handheld spectrum analyzer in its class with unmatched performance such as:
•Sensitivity
•Dynamic Range
•Phase Noise
•Frequency Accuracy
•ResolutionBandwidth(RBW)
The goal of Spectrum Analyzer measurements is to be able to accurately monitor, measure, and analyze RF signals and their environments. It finds rouge signals, measures carriers and distortion, and verifies base stations’ signal performance. It validates carrier frequency and identifies desired and undesired signals.
Simple But Powerful The LMR Master features dedicated routines for one-button measurements. For more in-depth analysis, the technician has control over settings and features that are not found even on lab-grade benchtop spectrum analyzers. For example, the S412E offers:
•Multiple sweep detection methods – Peak, Negative, True RMS, Quasi-Peak, Sample
•Advanced marker functions – noise marker, tracking marker, peak search, sequential peak search, delta markers
•Advanced marker functions – noise marker, tracking marker, peak search, sequential peak search, delta markers
•Advanced limit line functions – automatic envelope creation, relative limits, limit mirror, point/segment/line adjustment
•Save-on-Event – automatically saves a sweep when crossing a limit line
The LMR Master offers full control over bandwidth and sweep settings, or can be set to automatically optimize for best possible trade-off between accuracy and speed.
GPS-Assisted Frequency AccuracyWith GPS Option 31 the frequency accuracy is improved to < 50 ppb (parts per billion). Also all measurements can be GPS tagged for exporting to maps.
Rx Noise Floor TestingThe LMR Master can measure the receive noise floor on a base station’s uplink channel using the channel power measurement. An elevated noise floor indicates interference that can lead to call blocking, denial of service, call drops, low data rates, and lowered system capacity.
The spectrum analyzer mode in the S412E offers fast sweep speeds for interference hunting intermittent signals.
The Spectrum Analyzer mode in the S412E offers automated measurements including occupied bandwidth, adjacent channel power, and emission mask, as shown above. The mask can be quickly created using the standard limit line editor. The emission mask measurement function automatically moves the trace to match the peak of a modulated signal to conform to common mask standards.

5 of 28
LMR Master™ S412E Features
Spectrum Analyzer Signal Generator
Measurements
•OneButtonMeasurements
•FieldStrength–indBm/m2ordBmV/m
•OccupiedBandwidth-1%to99%of
power
•ChannelPower-inspecifiedbandwidth
•ACPR - adjacent channel power ratio
•AM/FM/SSBDemodulation-audiooutonly
•C/I - carrier-to-interference ratio
Sweep Functions
•Sweep
• Single/Continuous, Manual Trigger,
Reset, Minimum Sweep Time
•Detection
• Peak, RMS, Negative, Sample,
Quasi-peak
Triggers
• Free Run, External, Video, Change
Position, Manual
AM/FM/PM Modulation Measurements
Option509AM/FM/PMModulationAnalyzerprovides analysis and graphical display of common analog modulations. The RF Spectrum View displays the RF spectrum withcarrierpower(powerindBvs.frequency) along with center frequency, andoccupiedBW.AudioSpectrumshowsthe demodulated audio spectrum along with the audio rate, RMS deviation, Pk-Pk deviation (FM/PM) or depth (AM), SINAD, Total Harmonic Distortion (THD), and Total Distortion. Each demodulation also includes an Audio Waveform display that shows the time-domain demodulated waveform. A summary table shows a tabular list of all the RF and Demod measurement results.
AM/FM/PM Coverage Measurements
Coverage Mapping Option 431 provides on screen map displays of RSSI and ACPR.
Users can convert existing map images to a format compatible with the S412E using the included Map Master PC software. RSSI and ACPR measurements can then be superimposed on the maps with the S412E. Maps with GPS coordinates can take advantage of the optional GPS receiver to place measurements appropriately. For indoor measurements, without GPS, the user just touches the S412E display to place measurements at the proper location. The maps with measurements can be exported through thebuilt-inUSBporttoasJPEGorGoogle Earth™ KML files.
TheAM/FM/PMoption509displaysthedemodulatedaudiospectrumvs.frequencywithAM(%),Deviation(kHz) or Deviation (rad) for AM/FM/PM, respectively.
The Coverage Mapping Option 0431 provides measurement RSSI or ACPR of a single channel along with a user downloaded map and GPS location.
The S412E includes a standard Signal Generator with coveragefrom500kHzto1.6GHzand120dBpowercontrol range.
TheAM/FM/PMoption509displaysthedemodulatedaudiospectrumvs.timewithAM(%),Deviation(kHz),or Deviation (rad) for AM/FM/PM, respectively.
Setup Parameters
•Generator
•On/Off
•Tx Output Level
•-120 dBm to 0 dBm
•Tx Pattern
CW RF Characteristics
•Power Level Accuracy
•2.0dB(CWPattern,temperaturerange
15°Cto35°C,-120dBmto0dBm)Typical
•Frequency Range
•500 kHz to 1.6 GHz
•Frequency Accuracy
•Same as Spectrum Analyzer
•Modulation Adjustments
•AM depth
•FM deviation
Signal Generator
The S412E includes a Signal Generator mode for use as a general purpose test signal. The generator can produce CW, modulated AM, and modulated FM signals. frequency can be adjusted from 500 kHz to 1.6 GHz in 1 Hz steps. Power can be adjustedfrom1to-120dBmin0.1dBsteps. The frequency accuracy follows the spectrum analyzer mode and is better than 50 ppb when the GPS is on and functioning.
6 of 28
LMR Master™ S412E Features
Power Meter High Accuracy Power Meter (Option 19)
Power Meters
The LMR Master offers a standard built-in Power Meter utilizing the RF In port, and an optional High Accuracy Power Meter when used with optional external power sensors.
Properly setting the transmitter output power of a base station is critical to the overall operation of a wireless network. A1.5dBchangeinpowerlevelsindicatesa15%changeincoveragearea.Toomuchpower means overlapping coverage that translates into cell-to-cell self interference. Too little power, or too little coverage, creates island cells with non-overlapping cell sites and reduced in-building coverage. High or low values will cause dead zones/dropped calls, lower data rates/reduced capacity near cell edges, and cell loading imbalances/blocked calls.
High Accuracy Power Meter (Option 19)
To address the most accurate power measurement requirements, select the high accuracy measurement option and a choice of sensors with:
• Frequency ranges: 10 MHz to 26 GHz1
• Powerranges:-40dBmto+51.76dBm1
• Measurementuncertainties:=±0.18dB1Depending on choice of sensor
These sensors enable users to make accurate measurements for CW and digitally modulated signals for LMR and cellular wireless networks.
The power sensor easily connects to the LMRMasterviaaUSBA/Mini-Bcable.AnadditionalbenefitofusingtheUSBconnection is that a separate DC supply (or battery) is not needed because the necessary power is supplied by the LMRMaster’sUSBhostport.
PC Power Meter
These power sensors can be used stand-alone with a PC running Microsoft Windows®viaUSB.TheycomewiththePowerXpert™ application, an advanced data analysis and control software. The application has abundant features, such as data logging, power vs. time graph, large numerical display, and many more features, that enable quick and accurate measurements.
Remote Power Monitoring via LAN
AUSB-to-LANhubconverterenablesremote power monitoring via the Internet, if desired.
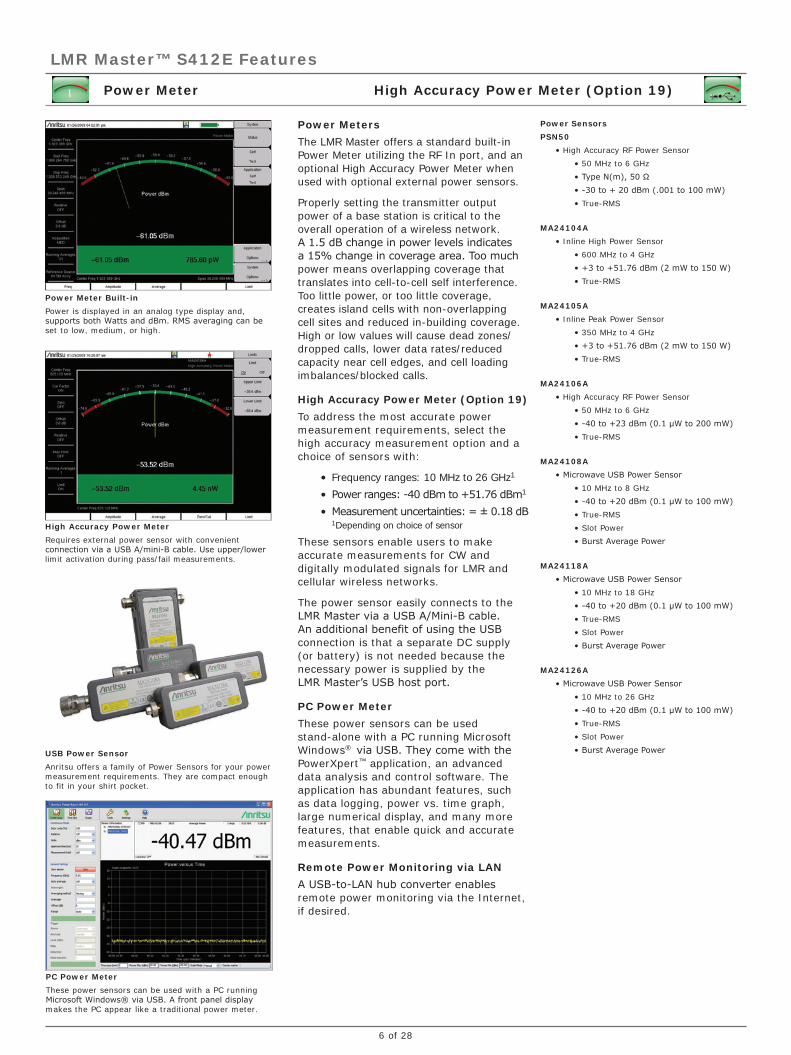
Power Meter Built-in
Power is displayed in an analog type display and, supportsbothWattsanddBm.RMSaveragingcanbeset to low, medium, or high.
High Accuracy Power Meter
Requires external power sensor with convenient connectionviaaUSBA/mini-Bcable.Useupper/lowerlimit activation during pass/fail measurements.
USB Power Sensor
Anritsu offers a family of Power Sensors for your power measurement requirements. They are compact enough to fit in your shirt pocket.
PC Power Meter
These power sensors can be used with a PC running MicrosoftWindows®viaUSB.Afrontpaneldisplaymakes the PC appear like a traditional power meter.
Power Sensors
PSN50
•High Accuracy RF Power Sensor
•50 MHz to 6 GHz
•TypeN(m),50Ω
•-30to+20dBm(.001to100mW)
•True-RMS
MA24104A
•Inline High Power Sensor
•600 MHz to 4 GHz
•+3to+51.76dBm(2mWto150W)
•True-RMS
MA24105A
•Inline Peak Power Sensor
•350 MHz to 4 GHz
•+3to+51.76dBm(2mWto150W)
•True-RMS
MA24106A
•High Accuracy RF Power Sensor
•50 MHz to 6 GHz
•-40to+23dBm(0.1µWto200mW)
•True-RMS
MA24108A
•MicrowaveUSBPowerSensor
•10 MHz to 8 GHz
•-40to+20dBm(0.1µWto100mW)
•True-RMS
•Slot Power
•BurstAveragePower
MA24118A
•MicrowaveUSBPowerSensor
•10 MHz to 18 GHz
•-40to+20dBm(0.1µWto100mW)
•True-RMS
•Slot Power
•BurstAveragePower
MA24126A
•MicrowaveUSBPowerSensor
•10 MHz to 26 GHz
•-40to+20dBm(0.1µWto100mW)
•True-RMS
•Slot Power
•BurstAveragePower

7of28
LMR Master™ S412E Features
Interference Analyzer (Option 25) Channel Scanner (Option 27)
Interference Analyzer Measurements
•Spectrogram
•Signal Strength Meter
•Received Signal Strength Indicator (RSSI)
•Signal ID (up to 12 signals)
•FM
•GSM/GPRS/EDGE
•W-CDMA/HSDPA
•CDMA/EV-DO
•Wi-Fi
•Spectrum
•FieldStrength–indBm/m2ordBmV/m
•OccupiedBandwidth-1%to99%ofpower
•ChannelPower-inspecifiedbandwidth
•ACPR - adjacent channel power ratio
•AM/FM/SSBaudiomonitor
•C/I - carrier-to-interference ratio
Channel Scanner
•Scan
• 20 channels at once, by frequency
or channel
•Noncontiguous channels
• Different channel bandwidths in one scan
•Display
•Current plus Max hold display
•Graph View
•Table View
•Script Master™
•Up to 1200 Channels
•Auto-repeat sets of 20 channels and total
•Auto-save with GPS tagging
Interference Analyzer (Option 25)Channel Scanner (Option 27)
Interference is a continuously growing problem for wireless network operators. Compounding the problem are the many sources that can generate interference such as:
• Intentional Radiators
•Unintentional Radiators
•Self Interference
Interference causes Carrier-to-Interference degradation, robbing the network of capacity. In many instances, interference can cause an outage to a sector, a cell, and/or neighboring cells. The goal of these measurements is to resolve interference issues as quickly as possible.
Monitoring Interference
The LMR Master offers many tools for monitoring intermittent interferers over time to determine patterns:
•Spectrogram
•Received Signal Strength Indicator
•Remote Monitoring over the Internet
•Save-on-Event – crossing a limit line
Master Software Tools for your PC features diagnostic tools for efficient analysis of the data collected during interference monitoring. These features include:
•Folder Spectrogram – creates a compositefileofmultipletracesforquick review
•Movie playback – playback data in the familiar frequency domain view
• Histogram–filterdataandsearchfornumber of occurrences and time of day
• 3D Spectrogram – for in-depth analysis with 3-axis rotation viewing control
Identifying Interference
The LMR Master provides several tools to identify the interference – either from a neighboring wireless operator, illegal repeater or jammer, or self-interference:
•Signal ID (up to 12 signals at once)
•Signal Analyzer Over-the-Air Scanners
•Channel Scanner (up to 1200 channels, 20 at a time)
Locating Interference
Once interference has been identified, the Signal Strength Meter with its audible output beep coupled with a directional antenna makes finding the interference easier.
Channel Scanner
Works on any signal and is useful when looking for IM or harmonics. Can help spot signals widely separated in frequency that turn on and off together.
Spectrogram
For identifying intermittent interference and tracking signallevelsovertimeforupto72hourswithanexternalUSBflashdrive.
Signal Strength Meter
Can locate an interfering signal, by using a directional antenna and measuring the signal strength and by an audible beep proportional to its strength.
Interference Mapping
Eliminates the need to use printed maps and draw lines to triangulate location. Use on-screen maps generated with GPS coordinates with Map Master™.

8 of 28
Measurements
•DTF Return Loss
•DTFInsertionLoss
Setup Parameters
•Start Distance
•Stop Distance
•Start Frequency (FDR)
•Stop Frequency (FDR)
• Windowing: Rectangular, Nominal Side Lobe,
Low Side Lobe, Minimum Side Lobe
•Propagation Velocity
•Cable Loss
•Units: meters or feet
•Distance Info display
Distance Domain (Option 501)
Distance-to-Fault Analysis is a powerful field test tool to analyze cables for faults, including minor discontinuities that may occur due to a loose connection, corrosion, orotheragingeffects.ByusingFrequencyDomain Reflectometry (FDR), the LMR Master sweeps a user-specified band of full power operational frequencies (instead of fast narrow pulses from TDR-type approaches) to more precisely identify discontinuities.
The LMR Master converts S-parameters from frequency domain into distance (or time) domain on the horizontal display axis, using a mathematical computation called Inverse Fourier Transform. Connect a reflection at the opposite end of the cable and the discontinuities appear versus distance to reveal any potential maintenance issues. When access to both ends of the cable is convenient, a similar time domain analysis is available on transmission (S21) measurements.
Option 501 Distance Domain will improve your productivity with displays of the cable in terms of discontinuities versus distance. This readout can then be compared against previous measurements (from stored data) to determine whether any degradations have occurred since installation (or the last maintenance activity). More importantly, you will know precisely where to go to fix the problem and so minimize or prevent downtime of the system.
LMR Master™ S412E Features
Distance Domain Analysis
InitialLaunch
Short
Adapter
Wire Cable Bundle Diagnostics for Aircraft and Shipboard
This innovative new Distance-to-Faulttechniquefindsdamagedaircraft wire bundles at bulkheads or other points of vulnerability. It uses the Time Domain option and FrequencyDomainReflectometrywithspecialfixturestolaunchhighfrequency sweep signals into the wiring harnesses. Find out more by downloading Anritsu’s Application Note 11410-00565, “Troubleshoot Wire Cable Assemblies with Frequency-Domain-Reflectometry.”
Distance-to-Fault Analysis
This illustration shows a typical cable measurement scenario with an adapter between the near and far end of the cable. With a short on the far end, the VNA Master can convert frequency domain results into corresponding distance-domain readout. Moving left to right, we can see the initial launch (MK1), the intermediate adapter (MK2), and the short at the far end of the cable (MK3). It is easy to interpret the discontinuities as normal or faults by simply looking at the location and amplitude of the peaks.Sincetheshortshowsas-20dB,thismeansthattheone-waycablelossmustbe10dB.

9of28
LMR Master™ S412E Features
Introduction to Signal Analyzers
Signal Analyzers
•NarrowbandFM(NBFM)
•P25
•NXDN
•DMR Tier 2
•Positive Train Control (PTC)
•LMR Coverage Measurements
•Public Safety LTE
•WiMAX (IEEE 802.16, Fixed and Mobile
Signal Analyzers
The LMR Master features Signal Analyzers for the major wireless standards around the world. The Signal Analyzers are designed to test and verify the:
•RF Signal Strength and Quality
•Modulation Quality
•Downlink (Talk-Out) Coverage
•Downlink Channel Capture
•Receiver Sensitivity
Trunked System Control Channel Downlink Messages
The low phase noise of the S412E supports refined measurement of the RF modulation quality and improves sensitivity for realistic coverage mapping measurements. The optional internal GPS receiver provides location information for coverage mapping plus improves the internal reference accuracy to 50 ppb.
A wide variety of LMR coverage mapping options are available to support in-service and out-of-service measurements of FM, P25, NXDN, DMR, and PTC systems. Thesignalgeneratoroffersa120dBpower control range to measure receiver sensitivity. The signal generator provides CW, modulated FM, and digital LMR modulation test patterns for use in downlink and uplink (talk-in) coverage mapping. The signal generator’s amplitude, frequency, and deviation or test pattern are independently adjustable to allow stimulus of a repeater input while observing the transmitter output.
The LTE and WiMAX Measurement options support testing the downlink signals while cabled directly to a base station or when testing over the air.
LMR Master testing from a service vehicle

10 of 28
LMR Master™ S412E Features
NBFM Analyzer
RF Measurements
•Received Channel Power
•Carrier Frequency
•Frequency Error
•OccupiedBandwidth(%ofPoweror>dBc
method)
•RSSI Coverage Mappin
Modulation Measurements
•Deviation
•Modulation Rate
•SINAD
•THD
•CTCSS / DCS / Inverted DCS / DTMF
•THD Coverage Mapping
•SINAD Coverage Mapping
•Quieting
Filter Types
•750µsPre-Emphasis
•750µsDe-Emphasis
•High Pass: 300 Hz, 3 kHz, None
•Low Pass: 300 Hz, 3 kHz, 15 kHz, None
Analyzer Adjustments
•Auto Scan (10 MHz - 1.6 GHz)
•RX Frequency
•TX Frequency
•RX/TX Coupling
•RX/TX Duplex Offset
•Channel Span
•Audio Span
•Audio Sweep Time
•RX Units
•TX Units
•Numerical Squelch Level
Signal Generator Test Patterns
•CW
•FM+CTCSS
•FM+DCS
•FM+DTMF
•FM+1kHz+CTCSS
•FM+1kHz+DCS
NBFM Analyzer
TheNBFMAnalyzerisastandardfeatureon all LMR Master S412E instruments and is designed to analyze the performance of both receivers and transmitters according to guidelines in the TIA-603-D Measurement and Performance Standard.
Auto Scan can be used to identify (and automatically tune to) the center frequency of an unknown transmitter. Once locked to the center frequency the Summary display shows Received Power, Frequency Error, Deviation, ModulationRate,OccupiedBandwidthand THD. Standard values for CTCSS, DCS (both Normal and Inverted), and DTMFaredecodedanddisplayed.20dBQuietingand12dBSINADtestscreensare provided for receiver alignment. Units areadjustablefordBm,Volts,orWattsas needed.
Filters (high-pass, low-pass, pre-emphasis and de-emphasis) allow selection of audio passband components for precise measurements.
The built-in signal generator can provide everything from pure clean CW to modulated FM with test tone and privacy tone at variable deviations.
NBFMCoverageMappingisalsostandardon the S412E LMR Master. When GPS signals are available, the optional GPS receiver (Option 31) allows location tagging of RSSI, THD, and SINAD points which are displayed on the S412E’s map viewer. Results are then exportable as tab-delimited data, JPEG image, and industry-standard KML for offline analysis in Google Earth(tm) or other mapping applications. The S412E LMR Master offers the industry’s only indoor mapping solution for land mobile radio — simply load a building floorplan and begin taking measurements by tapping locations right on the instrument’s high-resolution touchscreen display.
•RF Quality
•Modulation Quality
•Downlink (Talk-Out) Coverage
•BasebandI-QChannelCapture
•Trunked System Control Channel Messages
•P25 Test Signal Generator for Receiver Sensitivity and Coverage Measurements
Dedicated20dBQuietingand12dBSINADtoolsprovide quick and accurate measurement of analog receiver performance.
TheNBFMAnalyzercangenerateaCWorFMcarrierwith adjustable deviation for modulation patterns including 1 kHz, CTCSS/DCS, and DTMF.
Whencabledtoaradio,theNBFMAnalyzerfeaturesanAuto Scan function that can automatically determine and tune to the carrier frequency of an unknown transmitter.

11 of 28
LMR Master™ S412E Features
P25 Signal Analyzer (Option 521)
RF Measurements
•Received channel power
•Frequency error
•Channel Spectrum
•Eye Diagram
•Constellation
Modulation Measurements
•Modulation Fidelity
•Symbol Deviation
•Symbol Rate Error
•Symbol Histogram
Protocol Measurements
•BERandEVMon1011Hz,O.153,Voice,
or Control Channel
•NAC
P25 Analyzer Patterns
•1011 Hz
•O.153(V.52,PN9)
•Voice
•Control Channel
P25 Generator Test Patterns
•p25_1011
•p25_511(O.153)
•p25_1011_cal
•p25_intfr
•p25_silence
•p25_busy
•p25_idle
•p25_high_dev
•p25_low_dev
•p25_fidelity
•cw
•am_1khz_audio
•fm_1khz_audio
P25 Analyzer
The P25 Signal Analyzer, Option 521, is designed to test and verify the performance of P25 conventional and trunked radio systems. The P25 Analyzer supports measurement of P25 transmitted signals while directly connected to the transmitter (through a power attenuator) or over-the-air with an antenna. The signal analyzer input has the sensitivity to measureP25signalsdownto-115dBmallowing transmitter problems to be analyzed and verified miles away. Separate demodulators are available for C4FM (Phase 1 P25 systems) and π()/4 DQPSK (LSM and Phase 2 P25 systems). Receive test patterns include the P25 standard 1011HzBERpattern,theO.153PN9BERpattern, a proprietary voice pattern that estimatesBERfromaudiotransmissions,and a control channel pattern that measures the control channel message error rate and estimates the control channelBERbasedontheforwarderrorcorrection bits.
The built-in P25 signal generator offers over ten P25 test patterns including the standard 1011 Hz voice-framed BERpatternandtheO.153PN9BERpattern. The generator power level canbecontrolledovera120dBrangefrom0to-120dBmtosupportreceiversensitivitymeasurements.The0dBmsignal level supports amplification to higher levels with an external amplifier for useasatemporaryBERtesttransmitterfor coverage assessment. The frequency of the P25 signal generator can be either locked to or controlled independently from the P25 Analyzer frequency.
Control channel messages on trunked P25 Phase 1 systems can be captured as hexidecimal data to the LMR Master displayandexportedtoUSBmemoryforconversion to standard test messages using a Python script available from Anritsu at no charge.
A 12.5 kHz channel I-Q capture function is also available to record a channel’s basebanddatatoUSBmemoryastab-delimited data for later analysis and replay.
•RF Quality
•Modulation Quality
•Downlink (Talk-Out) Coverage
•BasebandI-QChannelCapture
•Trunked System Control Channel Messages
•P25 Test Signal Generator for Receiver Sensitivity and Coverage Measurements
The P25 Control channel display provides a hex display of the Trunked Downlink data in hex format. Anritsu offers a free software script to convert the hex information to text messages.
TheP25BitCapturedisplaydisplaystheuplinktrafficandexportsthistoUSBmemory.
The P25 analyzer display gives a complete summary of the RF Quality.

12 of 28
LMR Master™ S412E Features
DMR2 Signal Analyzer (Option 591)
RF Measurements
•Receivedchannelpower
•Frequencyerror
•ChannelSpectrum
•EyeDiagram
•Constellation
Modulation Measurements
•ModulationTypes:BaseStation(BS)
and Mobile Station (MS)
•ModulationFidelity
•SymbolDeviation
•SymbolRateError
•SymbolHistogram
Protocol Measurements
•BERandEVMon1031Hz,O.153,Voice,
or Control Channel
•ColorCode
DMR Analyzer Patterns
•1031Hz
•O.153(V.52,PN9)
•Voice
•ControlChannel
•Silence
•Idle
Base Station Test Patterns
•dmr_bs_1031
•dmr_bs_511(O.153)
•dmr_bs_silence
•dmr_bs_1031_1_pcnt_ber
•dmr_bs_511(O.153)_1_pcnt_ber
•dmr_bs_tscc
•cw
•am_1khz_audio
•fm_1khz_audio
Mobile Station Test Patterns
•dmr_ms_1031
•dmr_ms_511(O.153)
•dmr_ms_silence
•dmr_ms_1031_1_pcnt_ber
•dmr_ms_511(O.153)_1_pcnt_ber
•cw
•am_1khz_audio
•fm_1khz_audio
DMR2 Analyzer
TheDMRAnalyzer,Option591,isdesignedto test and verify the performance of DMR Tier 2 radio systems. The DMR Analyzer supports measurement of time-slotted DMR transmitted signals while directly connected to the transmitter (through a power attenuator) or over-the-air with an antenna. The signal analyzer input has the sensitivity to measure DMR signals downto-115dBmallowingtransmitterproblems to be analyzed and verified miles away. Separate demodulators are available forBaseStation(BS)andMobileStation(MS) systems. Receive test patterns includetheDMRstandard1031HzBERpattern,theO.153PN9BERpattern,aproprietary voice pattern that estimates BERfromaudiotransmissions,Silenceand Idle patterns, and a control channel pattern that measures the control channel message error rate and estimates the controlchannelBERbasedontheforwarderror correction bits.
The built-in DMR signal generator offers over ten DMR test patterns including the standard 1031 Hz voice-framed BERpatternandtheO.153PN9BERpattern. The generator power level can be controlledovera120dBrangefrom0to-120dBmtosupportreceiversensitivitymeasurements.The0dBmsignallevelsupports amplification to higher levels with an external amplifier for use as atemporaryBERtesttransmitterforcoverage assessment. The frequency of the DMR signal generator can be either locked to or controlled independently from the DMR Analyzer frequency.
A 12.5 kHz channel I-Q capture function is also available to record a channel’s basebanddatatoUSBmemoryastabdelimited data for later analysis and replay.
•RF Quality
•Modulation Quality
•Downlink (Talk-Out) Coverage
•BasebandI-QChannelCapture
•DMR Test Signal Generator for Receiver Sensitivity and Coverage Measurements
The P25 Control channel display provides a hex display of the Trunked Downlink data in hex format. Anritsu offers a free software script to convert the hex information to text messages.
TheDMRBitCapturedisplaydisplaystheuplinktrafficandexportsthistoUSBmemory.
The DMR analyzer display gives a complete summary of the RF and Modulation Quality.

13 of 28
LMR Master™ S412E Features
NXDN Signal Analyzer (Option 531)
RF Measurements
•Received channel power
•Frequency error
•Channel Spectrum
•Eye Diagram
•Constellation
Modulation Measurements
•Modulation Fidelity
•Symbol Deviation
•Symbol Rate Error
•Symbol Histogram
Protocol Measurements
•BERon1031Hz,O.153,Voice,or
Control Channel
•RAN
NXDN Analyzer Patterns
•1031 Hz
•O.153(V.52,PN9)
•Voice
•Control Channel
NXDN Generator Test Patterns
•nxdn_1031_9600
•nxdn_511(O.153)_9600
•nxdn_high_dev_9600
•nxdn_low_dev_9600
•nxdn_udch_pat_10_9600
•nxdn_cac_9600
•cw
•am_1khz_audio
•fm_1khz_audio
NXDN Analyzer
The NXDN Analyzer, Option 531, is designed to test and verify the performance of NXDN conventional and trunked radio systems. The NXDN Analyzer supports measurement of NXDN transmitted signals with a direct connection to the transmitter (through a power attenuator) or over-the-air with an antenna. The signal analyzer input has the sensitivity to measure NXDN signals downto-115dBm,allowingtransmitterproblems to be analyzed and verified miles away. Separate demodulators are available for 12.5 kHz and 6.25 kHz NXDN systems. ReceiveBERtestpatternsincludetheNXDNstandard1031“Tone”BERpatternandtheO.153(PN9)BERpattern.Forin-serviceBERtesting,Option0531offersa proprietary voice pattern that estimates BERfromforwarderrorcorrectionbits,andacontrolchannelBERpatternthatmeasures the control channel message error rate, and estimates the control channelBERfromtheforwarderrorcorrection bits.
The built-in NXDN signal generator offers over seven NXDN test patterns atboth9600(12.5kHz)and4800(6.25 kHz) rates including the standard 1031“Tone”BERpatternandthe511(O.153)BERpattern.
The generator power level can be controlledovera120dBrangefrom0to-120dBmtosupportreceiversensitivitymeasurements.The0dBmsignal level supports amplification to higher levels with an external amplifier foruseasatemporaryBERtesttransmitter for coverage assessment. The frequency of the NXDN signal generator is independently settable from the NXDN Analyzer frequency.
Control channel messages on trunked NXDN systems can be captured as hex data to the internal display and exported toUSBmemoryforconvertingtostandardtest messages using a Python script available from Anritsu at no charge.
A 12.5 kHz channel I-Q capture is also available to capture channel baseband datatoUSBmemoryastabdelimiteddatafor later analysis and replay.
•RF Quality
•Modulation Quality
•Downlink (Talk-Out) Coverage
•BasebandI-QChannelCapture
• Trunked System Control Channel Messages
• NXDN Test Signal Generator for Receiver Sensitivity Measurements
The NXDN Control channel display provides a hex display of the Trunked Downlink data in hex format. Anritsu offers a free software script to convert the hex information to text messages.
TheNXDNBitCapturedisplaydisplaystheuplinktrafficandexportsthistoUSBmemory.
The NXDN analyzer display gives a complete summary of the RF Quality.

14 of 28
LMR Master™ S412E Features
PTC Analyzer (Option 721)
RF Measurements
•Receivedchannelpower
•Frequencyerror
•ChannelSpectrum
•EyeDiagram
•Constellation
4FSK Modulation Measurements
•ModulationFidelity
•BER
•SymbolDeviation
•SymbolRateError
•SymbolHistogram
DQPSK Modulation Measurements
•ErrorVectorMagnitude
•BER
•IQImbalance
•Magnitude&PhaseError
•SymbolRateError
PTC Analyzer Patterns
•Pattern0=O.153(akaPN9)patternwith
no Preamble
•Pattern1=O.153(akaPN9)patternwith
FF0A Preamble
•Pattern2=O.153(akaPN9)patternwith
F337Preamble
•cw
•am_1khz_audio
•fm_1khz_audio
PTC Signal Analyzer
ThePTCAnalyzer,Option721,isdesignedto test and verify the performance of Positive Train Control radio systems compliant with the ITCR v1.0 R02 standard. The PTC Analyzer supports measurement of PTC transmitted signals with a direct connection to the transmitter (through a power attenuator) or over-the-air with an antenna. The signal analyzer input has the sensitivity to measure PTCsignalsdownto-115dBm,allowingtransmitter problems to be analyzed and verified miles away. Support for both 4-level FSK and Differential QPSK at 8 ksps and 16 ksps symbol rates is provided.
The built-in PTC signal generator offers three test patterns with various combinations ranging from simple O.153 (PN9)patterntoO.153patternswithvarious preambled (as defined by ITCR v1.0 R02).
The generator power level can be controlledovera120dBrangefrom0to-120dBmtosupportreceiversensitivitymeasurements.The0dBmsignallevelsupports amplification to higher levels with an external amplifier for use as atemporaryBERtesttransmitterforcoverage assessment. The frequency of the PTC signal generator is independently settable from the PTC Analyzer frequency.
Features include analysis of:
•RFQuality
•ModulationQuality
•ChannelQuality
PTC Main Screen DQPSK
PTC Main Screen 4FSK
15 of 28
LMR Master™ S412E Features
LMR Coverage Measurements
Coverage Mapping Parameters
•Received Channel Frequency
•Receive Signal Pattern
•Auto Receive Range
• Indoor Mapping Repeat Type (Time or Distance)
•Repeat Time
•Repeat Distance
•Distance Units
Coverage Mapping Types
•Analog FM: RSSI, THD, SINAD
•DigitalLMR:RSSI,BER,ModFid
Mapping Color Codes
•5 Levels
•4BreakPoints
•User-adjustable
LMR Coverage Measurements
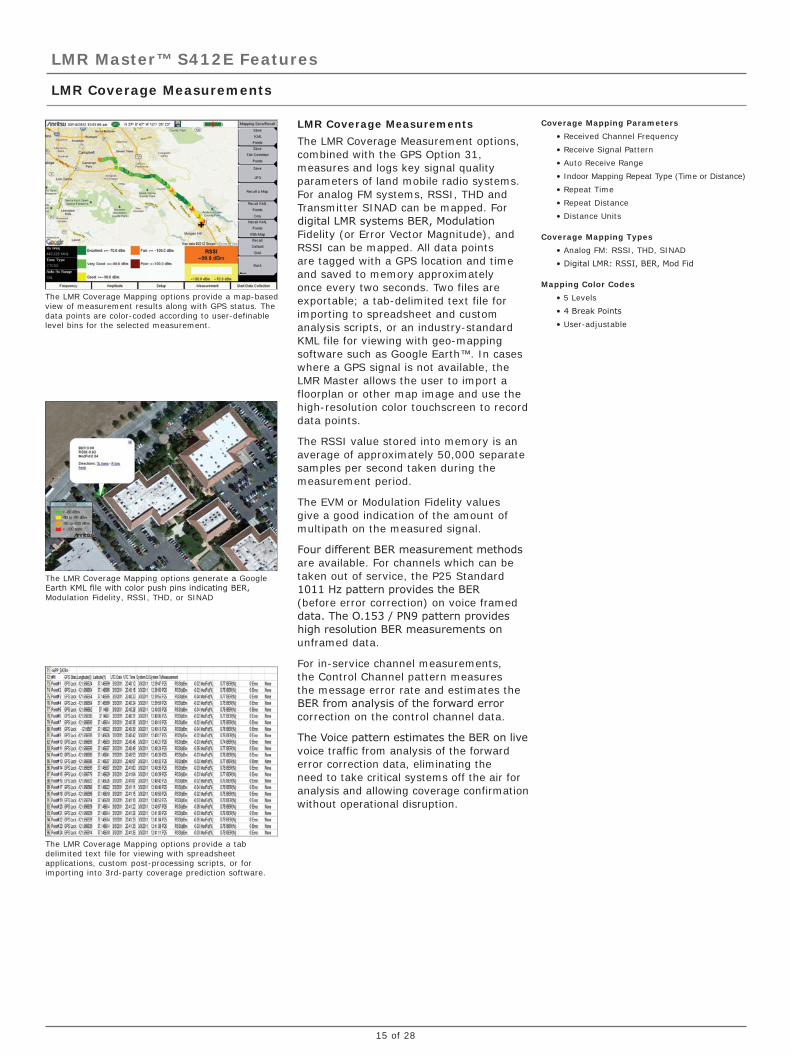
The LMR Coverage Measurement options, combined with the GPS Option 31, measures and logs key signal quality parameters of land mobile radio systems. For analog FM systems, RSSI, THD and Transmitter SINAD can be mapped. For digitalLMRsystemsBER,ModulationFidelity (or Error Vector Magnitude), and RSSI can be mapped. All data points are tagged with a GPS location and time and saved to memory approximately once every two seconds. Two files are exportable; a tab-delimited text file for importing to spreadsheet and custom analysis scripts, or an industry-standard KML file for viewing with geo-mapping software such as Google Earth™. In cases where a GPS signal is not available, the LMR Master allows the user to import a floorplan or other map image and use the high-resolution color touchscreen to record data points.
The RSSI value stored into memory is an average of approximately 50,000 separate samples per second taken during the measurement period.
The EVM or Modulation Fidelity values give a good indication of the amount of multipath on the measured signal.
FourdifferentBERmeasurementmethodsare available. For channels which can be taken out of service, the P25 Standard 1011HzpatternprovidestheBER(before error correction) on voice framed data.TheO.153/PN9patternprovideshighresolutionBERmeasurementsonunframed data.
For in-service channel measurements, the Control Channel pattern measures the message error rate and estimates the BERfromanalysisoftheforwarderrorcorrection on the control channel data.
TheVoicepatternestimatestheBERonlivevoice traffic from analysis of the forward error correction data, eliminating the need to take critical systems off the air for analysis and allowing coverage confirmation without operational disruption.
The LMR Coverage Mapping options provide a map-based view of measurement results along with GPS status. The data points are color-coded according to user-definable level bins for the selected measurement.
The LMR Coverage Mapping options generate a Google EarthKMLfilewithcolorpushpinsindicatingBER,Modulation Fidelity, RSSI, THD, or SINAD
The LMR Coverage Mapping options provide a tab delimited text file for viewing with spreadsheet applications, custom post-processing scripts, or for importing into 3rd-party coverage prediction software.

16 of 28
LMR Master™ S412E Features
LTE Signal Analyzers (Options 541, 542, 546)
RF Measurements
(Option 541)
•Channel Spectrum
•Channel Power
•OccupiedBandwidth
•ACLR
Modulation Measurements
(10 MHz Bandwidth)
(Option 542)
•Constellation
•Reference Signal Power
•Sync Signal Power
•EVM
•Frequency Error
•Carrier Frequency
•Cell ID
•Control Channel Power
•RS
•P-SS
•S-SS
•PBCH
•PCFICH
Over-the-Air Scanner (OTA)
(Option 546)
•Synch Signal Power (Six Strongest)
•Power
•Cell ID
•Sector ID
•Group ID
•Dominance
•Auto-Save with GPS Tagging and Logging
LTE Signal Analyzers
The LMR Master features three LTE measurement modes:
•RF Measurements
•Modulation Measurements
•Over-the-Air Measurements (OTA)
The goal of these measurements is to increase data rate and capacity by accurate power settings, ensuring low out-of-channel emissions and good signal quality. These attributes help to create a low dropped call rate, a low blocked call rate, and a good customer experience.
Cell site technicians or RF engineers can make measurements Over-the-Air (OTA) to spot-check a transmitter’s coverage and signal quality without taking the cell site off-line. When the OTA test results are ambiguous, one can directly connect to the base station to check the signal quality and transmitter power.
Adjacent Channel Leakage Ratio (ACLR)
Adjacent Channel Leakage Ratio (ACLR) measureshowmuchBTSsignalgetsintoneighboring RF channels. ACLR checks the closest (adjacent) and the second closest (alternate) channels. Poor ACLR can lead to interference with adjacent carriers and legal liability. It also can indicate poor signal quality which leads to low throughput.
Cell ID (Sector ID, Group ID)
Cell ID indicates which base station is being measured OTA. The strongest base station at your current location is selected for measurement. Wrong values for Cell ID lead to inability to register. If the cause is excessive overlapping coverage, it also will lead to poor EVM and low data rates
Frequency Error
Frequency Error is a check to see that the carrier frequency is precisely correct. The Cell Master can accurately measure Carrier Frequency Error OTA if the instrument is GPS enabled or in GPS holdover. Calls will drop when mobiles travel at higher speed. In some cases, cell phones cannot hand off into, or out of the cell.
Sync Signal Mapping
Sync Signal Scanner can be used with the GPS to save scan results for later display on a map. The EVM of the strongest synch signal available at that spot is also recorded. The Cell, Sector, and Group ID information is also included so that it’s easier to interpret the results. Once the Synch Signals are mapped, it becomes much easier to understand and troubleshoot any interference or coverage issues.
RF Measurements – Occupied Bandwidth
Thebandwidththatcontains99%ofthetotalcarrierpower. Excessive occupied bandwidth means excessive adjacent channel interference.
Modulation Quality – EVM
High values will create larger areas of cell-to-cell interference and create lower data rates near cell edges.
Over-the-Air Measurements – Sync Signal Power
Too many strong sectors at the same location create co-channel interference. This leads to low data rate, low capacity, and excessive handoffs.

17of28
LMR Master™ S412E Features
Fixed and Mobile WiMAX Signal Analyzers (Options 46, 47, 66, 67, 37)
RF Measurement – Preamble Power
High or low values will create larger areas of cell-to-cell interference and create lower data rates near cell edges. Low values affect in-building coverage.
Demodulation – Frequency Error
Calls will drop when user’s equipment travels at high speed. In severe cases, handoffs will not be possible at any speed, creating island cells.
Over-the-Air Measurements – PCINR
A low Physical Carrier to Interference plus Noise Ratio (PCINR) indicates poor signal quality, low data rate and reduced sector capacity.
Pass/Fail Test
Set up common test limits, or sets of limits, for each instrument. Inconsistent settings between base stations, leads to inconsistent network behavior.
RF Measurements
(Option 46/66, Fixed/Mobile)
•Channel Spectrum
•Channel Power
•OccupiedBandwidth
•Power vs. Time
•Channel Power
•Preamble Power
•DownlinkBurstPower(Mobileonly)
•UplinkBurstPower(Mobileonly)
•DataBurstPower(Fixedonly)
•Crest Factor (Fixed only)
•ACPR
Demodulation (10 MHz maximum)
(Option 47/67, Fixed/Mobile)
•Constellation
•RCE (RMS/Peak)
•EVM (RMS/Peak)
•Frequency Error
•CINR (Mobile only)
•BaseStationID
•Carrier Frequency
•Sector ID
•Spectral Flatness
•Adjacent Subcarrier Flatness
•EVM vs. Subcarrier/Symbol
•RCE (RMS/Peak)
•EVM (RMS/Peak)
•Frequency Error
•CINR (Mobile only)
•BaseStationID
•Sector ID (Mobile only)
•DL-MAP (Tree View) (Mobile only)
Over-the-Air (OTA)
(Option 37 Mobile only)
•Channel Power Monitor
•Preamble Scanner (Six)
•Preamble
•Relative Power
•Cell ID
•Sector ID
•PCINR
•Dominant Preamble
•BaseStationID
•Auto-Save with GPS Tagging and Logging
Fixed and Mobile WiMAX Signal Analyzers
The LMR Master features two Fixed WiMAX and three Mobile WiMAX measurement modes:
•RF Measurements
•Demodulation (up to 10 MHz)
•Over-the Air Measurements (OTA) (Mobile only)
The goal of these measurements is to increase data rate and capacity by accurate power settings, ensuring low out-of-channel emissions, and good signal quality. These attributes help to create a low dropped call rate, a low blocked call rate, and a good customer experience.
Cell site technicians or RF engineers can make measurements Over-the-Air (OTA) to spot-check a transmitter’s coverage and signal quality without taking the cell site off-line. When the OTA test results are ambiguous one can directly connect to the base station to check the signal quality and transmitter power.
Cell ID, Sector ID, and Preamble
Cell ID, Sector ID, and Preamble show which cell, sector, and segment are being measured OTA. The strongest signal is selected automatically for the additional PCINRandBaseStationIDmeasurement.Wrong values for cell, sector and segment ID lead to dropped handoffs and island cells. If the cause is excessive coverage, it also will lead to large areas of low data rates.
Error Vector Magnitude (EVM) Reletive Constellation Error (RCE)
RCE and EVM measure the difference between the actual and ideal signal. RCEismeasuredindBandEVMinpercent. A known modulation is required to make these measurements. High RCE and EVM causes low signal quality, low data rate, and low sector capacity. This is the single most important signal quality measurement.
Preamble Mapping (Mobile WiMAX)
Preamble Scanner can be used with the GPS to save scan results for later display on a map. PCINR ratio for the strongest WiMAX preamble available at thatspot.TheBaseStationIDandSectorID information are also included so that it’s easier to interpret the results. Once PCINR data is mapped, it becomes much easier to understand and troubleshoot any interference or coverage issues.

18 of 28
LMR Master™ S412E Features
Line Sweep Tools™ and Master Software Tools™ (for your PC)
3D Spectrogram
For in-depth analysis with 3-axis rotation viewing, threshold, reference level, and marker control. Turn on Signal ID to see the types of signals.
Line Sweep Features
Presets
7setsof6markersand1limitline
Next trace capability
File Types
Input: HHST DAT, MNA and VNA Measurements:
Return Loss (VSWR), Cable Loss, DTF-RL,
DTF-VSWR, PIM
Output:LSDAT,MNA,VNA,CSV,PNG,BMP,JPG,PDF
Report Generator
Logo, title, company name, customer name,
location,dateandtime,filename,PDF,HTML,
all open traces
Tools
Cable Editor
Distance to Fault
Measurement calculator
Signal Standard Editor
Renaming Grid
Interfaces
Serial,Ethernet,USB
Capture Plots to
Screen,Database,DATfiles,JPEG,Instrument
Master Software Tools Features
Database Management
Full Trace Retrieval
Trace Catalog
Group Edit
Trace Editor
Data Analysis
Trace Math and Smoothing
Data Converter
Measurement Calculator
Mapping (GPS Required)
Spectrum Analyzer Mode
Mobile WiMAX OTA Option
TS-SCDMA OTA Option
LTE, both FDD and TDD Options
Folder Spectrogram
Folder Spectrogram – 2D View
Video Folder Spectrogram – 2D View
Folder Spectrogram – 3D View
List/Parameter Editors
Traces
Antennas, Cables, Signal Standards
Product Updates
Firmware Upload
Pass/Fail
VSG Pattern Converter
Languages
Mobile WiMAX
Display
Line Sweep Tools™Line Sweep Tools increases productivity for people who deal with dozens of Cable and Antenna traces, or Passive Inter-Modulation (PIM) traces, every day.
User Interface
Line Sweep Tools has a user interface that will be familiar to users of Anritsu’s Hand Held Software Tools. This will lead to a short learning curve.
Marker and Limit Line Presets
Presets make applying markers and a limit line to similar traces, as well as validating traces, a quick task.
Renaming Grid
A renaming grid makes changing file names, trace titles, and trace subtitles from field values to those required for a report much quicker than manual typing and is less prone to error.
Report Generator
The report generator will generate a professional looking PDF of all open traces with additional information such as contractor logos and contact information.
Master Software Tools™Master Software Tools (MST) is a powerful PC software post-processing tool designed to enhance the productivity of technicians in data analysis and testing automation.
Folder Spectrogram
Folder Spectrogram – creates a composite file of up to 15,000 multiple traces for quick review, also create:
•Peak Power, Total Power, and Peak Frequency plotted over time
•Histogram–filterdataandplotnumber of occurrences over time
•Minimum, Maximum, and Average Power plotted over frequency
•Movie playback – playback data in the familiar frequency domain view
• 3D Spectrogram – for in-depth analysis with 3-axis rotation viewing control
Trace Validation
Marker and Limit Line presets allow quick checks of traces for limit violations.
Report Generation
Create reports with company logo, GPS tagging information, calibration status, and serial number of the instrument for complete reporting.

19of28
LMR Master™ S412E Features
All Connectors are conveniently located on the top panel, leaving the sides clear for handheld use
Handheld Size: 273 x 199 x 91 mm, (10.7 x 7.8 x 3.6 in), Lightweight: 3.6 kg, (7.9 lbs)
Fan Exhaust Port
On/Off Button
Shift Key
Speaker
Touch Screen Main Menu Keys
Touch Screen Submenu Keys
Fan Inlet Port
Fan Inlet Port
Rotary Knob
Numeric Keypad/Shift Menu Keys Printed In Blue
External Reference In
External Trigger In RF In USB Mini-B
USB A-TypeAudio In Signal Generator Out
External Power
GPS
VNA Port 2 VNA Port 1

20 of 28
Touchscreen Menu
The Menu Key activates the touchscreen menu for one button access to all of the Analyzers.
User defined shortcuts can be created for one-button access to commonly used functions.
Touchscreen Keyboard
A built-in touchscreen keyboard saves valuable time in the field when entering trace names.
For Cable and Antenna Analysis, a Quick Name Matrix can be customized for quickly naming your line sweeps.
Tilt bails are integrated into the case and soft case for better screen viewing.
LMR Master™ S412E Features

21 of 28
LMR Master™ S412E Ordering Information
Ordering Information – Options
S412E Description
500 kHz to 1.6 GHz Vector Network Analyzer
100 kHz to 1.6 GHz Spectrum Analyzer
10 MHz to 1.6 GHz Power Meter
500 kHz to 1.6 GHz CW Signal Generator
Options
S412E-0010 HighVoltageVariableBiasTee
S412E-0501 Distance Domain
S412E-0031 GPS Receiver (requires external GPS antenna 2000-1528-R or 2000-1652-R)
S412E-0019 High-Accuracy Power Meter (requires External Power Sensor)
S412E-0025 Interference Analyzer (Option 0031 recommended)
S412E-0027 Channel Scanner
S412E-0006 6 GHz Coverage on Spectrum Analyzer
S412E-0016 6 GHz Coverage on Vector Network Analyzer
S412E-0015 Vector Voltmeter
S412E-0431 Coverage Mapping (requires Option 0031)
S412E-0509 AM/FM/PM Analyzer
S412E-0521 P25 Analyzer Measurements
S412E-0522 P25 Coverage Measurements (requires Options 0031 and 0521)
S412E-0591 DMR2 Analyzer Measurements
S412E-0592 DMR2CoverageMeasurements(requiresOptions0031and0591)
S412E-0531 NXDN Analyzer Measurements
S412E-0532 NXDN Coverage Measurements (requires Options 0031 and 0531)
S412E-0721 PTC Analyzer Measurements
S412E-0722 PTCCoverageMeasurements(requiresOptions0031and0721)
S412E-0541 LTE RF Measurements (requires Option 0031)
S412E-0542 LTE Modulation Quality (requires Option 0031)
S412E-0546 LTE Over-the-Air Measurements (requires Option 0031)
S412E-0046 IEEE 802.16 Fixed WiMAX RF Measurements (requires Option 0031)
S412E-0047 IEEE 802.16 Fixed WiMAX Demodulation (requires Option 0031)
S412E-0066 IEEE 802.16 Mobile WiMAX RF Measurements (requires Option 0031)
S412E-0067 IEEE 802.16 Mobile WiMAX Demodulation (requires Option 0031)
S412E-0037 IEEE 802.16 Mobile WiMAX Over-the-Air Measurements (requires Option 0031)
S412E-0098 StandardCalibration(ANSI2540-1-1994)
S412E-0099 Premium Calibration to Z540 plus test data
22 of 28
LMR Master™ S412E Ordering Information
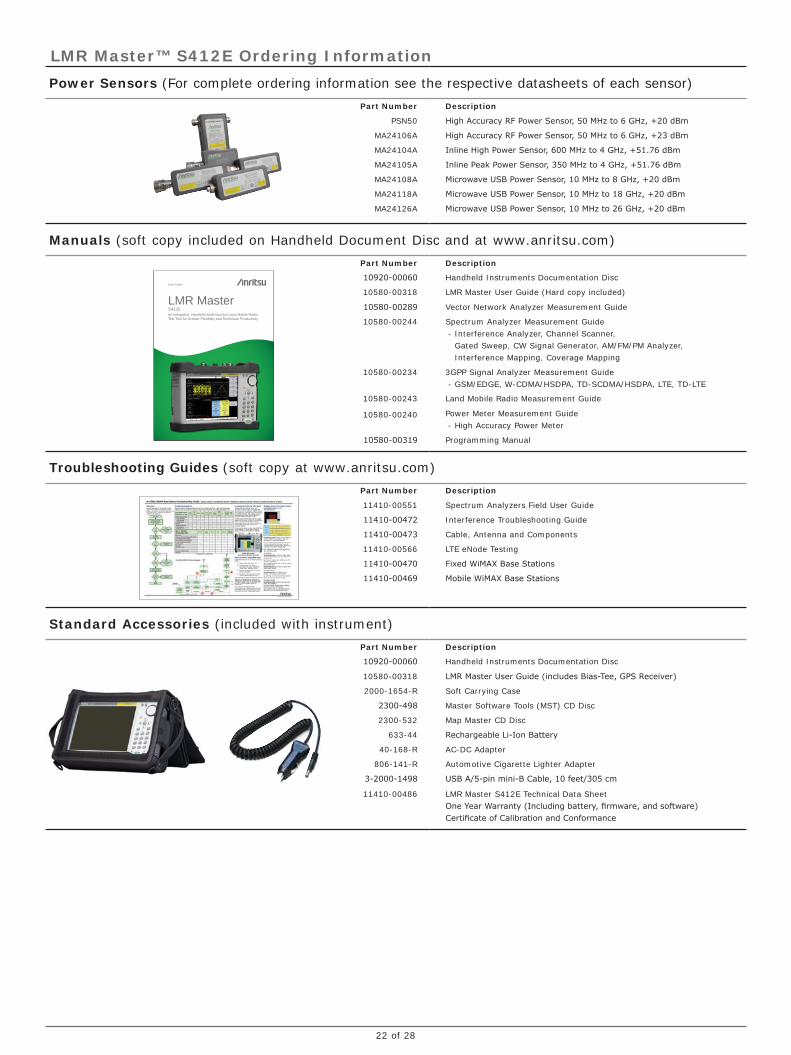
Power Sensors (For complete ordering information see the respective datasheets of each sensor)
Part Number Description
PSN50 HighAccuracyRFPowerSensor,50MHzto6GHz,+20dBm
MA24106A HighAccuracyRFPowerSensor,50MHzto6GHz,+23dBm
MA24104A InlineHighPowerSensor,600MHzto4GHz,+51.76dBm
MA24105A InlinePeakPowerSensor,350MHzto4GHz,+51.76dBm
MA24108A MicrowaveUSBPowerSensor,10MHzto8GHz,+20dBm
MA24118A MicrowaveUSBPowerSensor,10MHzto18GHz,+20dBm
MA24126A MicrowaveUSBPowerSensor,10MHzto26GHz,+20dBm
Manuals (soft copy included on Handheld Document Disc and at www.anritsu.com)
Part Number Description
10920-00060 Handheld Instruments Documentation Disc
10580-00318 LMR Master User Guide (Hard copy included)
10580-00289 Vector Network Analyzer Measurement Guide
10580-00244
Spectrum Analyzer Measurement Guide - Interference Analyzer, Channel Scanner,
Gated Sweep, CW Signal Generator, AM/FM/PM Analyzer, Interference Mapping, Coverage Mapping
10580-00234 3GPP Signal Analyzer Measurement Guide - GSM/EDGE, W-CDMA/HSDPA, TD-SCDMA/HSDPA, LTE, TD-LTE
10580-00243 Land Mobile Radio Measurement Guide
10580-00240 Power Meter Measurement Guide - High Accuracy Power Meter
10580-00319 Programming Manual
Troubleshooting Guides (soft copy at www.anritsu.com)
Part Number Description
11410-00551 Spectrum Analyzers Field User Guide
11410-00472 Interference Troubleshooting Guide
11410-00473 Cable, Antenna and Components
11410-00566 LTE eNode Testing
11410-00470 FixedWiMAXBaseStations
11410-00469 MobileWiMAXBaseStations
Standard Accessories (included with instrument)
Part Number Description
10920-00060 Handheld Instruments Documentation Disc
10580-00318 LMRMasterUserGuide(includesBias-Tee,GPSReceiver)
2000-1654-R Soft Carrying Case
2300-498 Master Software Tools (MST) CD Disc
2300-532 Map Master CD Disc
633-44 RechargeableLi-IonBattery
40-168-R AC-DC Adapter
806-141-R Automotive Cigarette Lighter Adapter
3-2000-1498 USBA/5-pinmini-BCable,10feet/305cm
11410-00486 LMR Master S412E Technical Data SheetOneYearWarranty(Includingbattery,firmware,andsoftware)CertificateofCalibrationandConformance
LMR MasterUser Guide
S412EAn Integrated, Handheld Multi-function Land Mobile Radio Test Tool for Greater Flexibility and Technician Productivity
23 of 28
LMR Master™ S412E Ordering Information
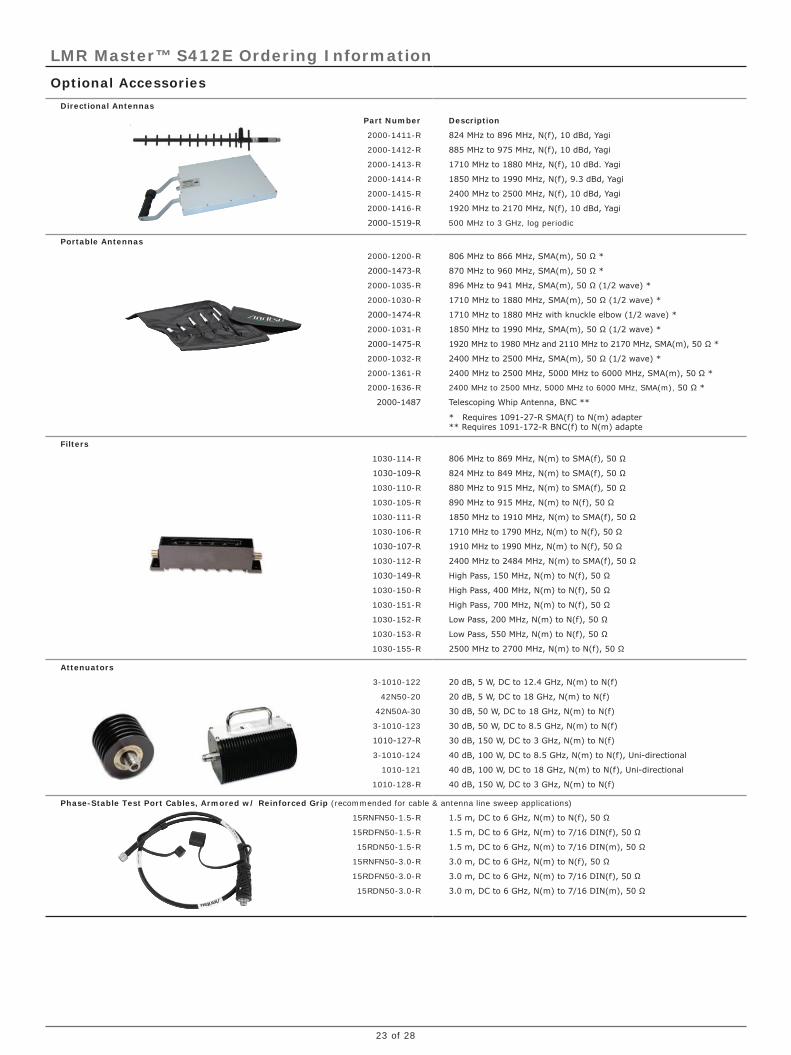
Optional Accessories
Directional Antennas
Part Number Description
2000-1411-R 824MHzto896MHz,N(f),10dBd,Yagi
2000-1412-R 885MHzto975MHz,N(f),10dBd,Yagi
2000-1413-R 1710MHzto1880MHz,N(f),10dBd.Yagi
2000-1414-R 1850MHzto1990MHz,N(f),9.3dBd,Yagi
2000-1415-R 2400MHzto2500MHz,N(f),10dBd,Yagi
2000-1416-R 1920MHzto2170MHz,N(f),10dBd,Yagi
2000-1519-R 500 MHz to 3 GHz, log periodic
Portable Antennas
2000-1200-R 806MHzto866MHz,SMA(m),50Ω*
2000-1473-R 870MHzto960MHz,SMA(m),50Ω*
2000-1035-R 896MHzto941MHz,SMA(m),50Ω(1/2wave)*
2000-1030-R 1710MHzto1880MHz,SMA(m),50Ω(1/2wave)*
2000-1474-R 1710MHzto1880MHzwithknuckleelbow(1/2wave)*
2000-1031-R 1850MHzto1990MHz,SMA(m),50Ω(1/2wave)*
2000-1475-R 1920MHzto1980MHzand2110MHzto2170MHz,SMA(m),50Ω*
2000-1032-R 2400MHzto2500MHz,SMA(m),50Ω(1/2wave)*
2000-1361-R 2400MHzto2500MHz,5000MHzto6000MHz,SMA(m),50Ω*
2000-1636-R 2400 MHz to 2500 MHz, 5000 MHz to 6000 MHz, SMA(m), 50Ω*
2000-1487 TelescopingWhipAntenna,BNC**
*Requires1091-27-RSMA(f)toN(m)adapter **Requires1091-172-RBNC(f)toN(m)adapte
Filters
1030-114-R 806MHzto869MHz,N(m)toSMA(f),50Ω
1030-109-R 824MHzto849MHz,N(m)toSMA(f),50Ω
1030-110-R 880MHzto915MHz,N(m)toSMA(f),50Ω
1030-105-R 890MHzto915MHz,N(m)toN(f),50Ω
1030-111-R 1850MHzto1910MHz,N(m)toSMA(f),50Ω
1030-106-R 1710MHzto1790MHz,N(m)toN(f),50Ω
1030-107-R 1910MHzto1990MHz,N(m)toN(f),50Ω
1030-112-R 2400MHzto2484MHz,N(m)toSMA(f),50Ω
1030-149-R HighPass,150MHz,N(m)toN(f),50Ω
1030-150-R HighPass,400MHz,N(m)toN(f),50Ω
1030-151-R HighPass,700MHz,N(m)toN(f),50Ω
1030-152-R LowPass,200MHz,N(m)toN(f),50Ω
1030-153-R LowPass,550MHz,N(m)toN(f),50Ω
1030-155-R 2500MHzto2700MHz,N(m)toN(f),50Ω
Attenuators
3-1010-122 20dB,5W,DCto12.4GHz,N(m)toN(f)
42N50-20 20dB,5W,DCto18GHz,N(m)toN(f)
42N50A-30 30dB,50W,DCto18GHz,N(m)toN(f)
3-1010-123 30dB,50W,DCto8.5GHz,N(m)toN(f)
1010-127-R 30dB,150W,DCto3GHz,N(m)toN(f)
3-1010-124 40dB,100W,DCto8.5GHz,N(m)toN(f),Uni-directional
1010-121 40dB,100W,DCto18GHz,N(m)toN(f),Uni-directional
1010-128-R 40dB,150W,DCto3GHz,N(m)toN(f)
Phase-Stable Test Port Cables, Armored w/ Reinforced Grip (recommended for cable & antenna line sweep applications)
15RNFN50-1.5-R 1.5m,DCto6GHz,N(m)toN(f),50Ω
15RDFN50-1.5-R 1.5m,DCto6GHz,N(m)to7/16DIN(f),50Ω
15RDN50-1.5-R 1.5m,DCto6GHz,N(m)to7/16DIN(m),50Ω
15RNFN50-3.0-R 3.0m,DCto6GHz,N(m)toN(f),50Ω
15RDFN50-3.0-R 3.0m,DCto6GHz,N(m)to7/16DIN(f),50Ω
15RDN50-3.0-R 3.0m,DCto6GHz,N(m)to7/16DIN(m),50Ω

24 of 28
LMR Master™ S412E Ordering Information
Optional Accessories (continued)
Phase-Stable Test Port Cables, Armored (recommended for use with tightly spaced connectors and other general purpose applications)
15NNF50-1.5C 1.5m,DCto6GHz,N(m)toN(f),50Ω
15NN50-1.5C 1.5m,DCto6GHz,N(m)toN(m),50Ω
15NDF50-1.5C 1.5m,DCto6GHz,N(m)to7/16DIN(f),50Ω
15ND50-1.5C 1.5m,DCto6GHz,N(m)to7/16DIN(m),50Ω
15NNF50-3.0C 3.0m,DCto6GHz,N(m)toN(f),50Ω
15NN50-3.0C 3.0m,DCto6GHz,N(m)toN(m),50Ω
Adapters
1091-26-R SMA(m)toN(m),DCto18GHz,50Ω
1091-27-R SMA(f)toN(m),DCto18GHz,50Ω
1091-80-R SMA(m)toN(f),DCto18GHz,50Ω
1091-81-R SMA(f)toN(f),DCto18GHz,50Ω
1091-172 BNC(f)toN(m),DCto1.3GHz,50Ω
510-102-R N(m)toN(m),DCto11GHz,50Ω,90degreesrightangle
Precision Adapters
34NN50A PrecisionAdapter,N(m)toN(m),DCto18GHz,50Ω
34NFNF50 PrecisionAdapter,N(f)toN(f),DCto18GHz,50Ω
Miscellaneous Accessories
2000-1528-R GPS Antenna, SMA(m)
2000-1528-R GPS Antenna, SMA(m) with 15 ft cable
2000-1652-R GPS Antenna, SMA(m) with 1 ft cable
633-44 ExtraRechargeableLi-IonBattery
2000-1374 ExternalChargerforLi-lonBattery
2300-532 Map Master CD
2000-1653 Protective Screen Cover (Package of 2)
66864 Rack Mount Kit, Master Platform
Backpack and Transit Case
67135 AnritsuBackpack(ForHandheldInstrumentandPC)
760-243-R Large Transit Case with Wheels and Handle

25 of 28
Notes

26 of 28
Notes

27of28
Notes

Please Contact:
11410-00594, Rev. C Printed in United States 2012-05©2012 Anritsu Company. All Rights Reserved.
® Anritsu All trademarks are registered trademarks of their respective companies. Data subject to change without notice. For the most recent specifications visit: www.us.anritsu.com
The Master Users Group is an organization dedicated to providing training, technical support, networking opportunities and links to Master product development teams. As a member you will receive the Insite Quarterly Newsletter with user stories, measurement tips, new product news and more.Visit us to register today: www.anritsu.com/MUG
To receive a quote to purchase a product or order accessories visit our online ordering site: www.ShopAnritsu.com
Training at AnritsuAnritsu has designed courses to help you stay up to date with technologies important to your job.For available training courses visit: www.anritsu.com/training
• U.S.A. Anritsu Company1155 East Collins Boulevard, Suite 100, Richardson, TX, 75081 U.S.A. Toll Free: 1-800-ANRITSU (267-4878) Phone: +1-972-644-1777 Fax: +1-972-671-1877• Canada Anritsu Electronics Ltd.700 Silver Seven Road, Suite 120, Kanata, Ontario K2V 1C3, Canada Phone: +1-613-591-2003 Fax: +1-613-591-1006
• Brazil Anritsu Electrônica Ltda.Praça Amadeu Amaral, 27 - 1 Andar 01327-010 - Bela Vista - São Paulo - SP - Brazil Phone: +55-11-3283-2511 Fax: +55-11-3288-6940
• Mexico Anritsu Company, S.A. de C.V.Av. Ejército Nacional No. 579 Piso 9, Col. Granada 11520 México, D.F., México Phone: +52-55-1101-2370 Fax: +52-55-5254-3147
• U.K. Anritsu EMEA Ltd.200 Capability Green, Luton, Bedfordshire LU1 3LU, U.K. Phone: +44-1582-433280 Fax: +44-1582-731303
• France Anritsu S.A.12 avenue du Québec, Batiment Iris 1-Silic 612, 91140 VILLEBON SUR YVETTE, France Phone: +33-1-60-92-15-50 Fax: +33-1-64-46-10-65
• Germany Anritsu GmbHNemetschek Haus, Konrad-Zuse-Platz 1 81829 München, Germany Phone: +49 (0) 89 442308-0 Fax: +49 (0) 89 442308-55
• Italy Anritsu S.r.l.Via Elio Vittorini 129 00144 Roma Italy Phone: +39-06-509-9711 Fax: +39-06-502-2425
• Sweden Anritsu ABBorgafjordsgatan 13A, 164 40 KISTA, Sweden Phone: +46-8-534-707-00 Fax: +46-8-534-707-30
• Finland Anritsu ABTeknobulevardi 3-5, FI-01530 Vantaa, Finland Phone: +358-20-741-8100 Fax: +358-20-741-8111
• Denmark Anritsu A/S (for Service Assurance) Anritsu AB (for Test & Measurement)Kay Fiskers Plads 9, 2300 Copenhagen S, Denmark Phone: +45-7211-2200 Fax: +45-7211-2210
• RussiaAnritsu EMEA Ltd. Representation Office in RussiaTverskaya str. 16/2, bld. 1, 7th floor. Russia, 125009, Moscow Phone: +7-495-363-1694 Fax: +7-495-935-8962
• United Arab Emirates Anritsu EMEA Ltd. Dubai Liaison OfficeP O Box 500413 - Dubai Internet City Al Thuraya Building, Tower 1, Suite 701, 7th Floor Dubai, United Arab Emirates Phone: +971-4-3670352 Fax: +971-4-3688460
• Singapore Anritsu Pte. Ltd.60 Alexandra Terrace, #02-08, The Comtech (Lobby A) Singapore 118502 Phone: +65-6282-2400 Fax: +65-6282-2533
• India Anritsu Pte. Ltd. India Branch Office2nd & 3rd Floor, #837/1, Binnamangla 1st Stage, Indiranagar, 100ft Road, Bangalore - 560038, India Phone: +91-80-4058-1300 Fax: +91-80-4058-1301
• P. R. China (Shanghai) Anritsu (China) Co., Ltd.Room 1715, Tower A CITY CENTER of Shanghai, No. 100 Zunyi Road Chang Ning District, Shanghai 200051, P.R. China Phone: +86-21-6237-0898 Fax: +86-21-6237-0899
• P. R. China (Hong Kong) Anritsu Company Ltd.Unit 1006-7, 10/F., Greenfield Tower, Concordia Plaza, No. 1 Science Museum Road, Tsim Sha Tsui East, Kowloon, Hong Kong, P. R. China Phone: +852-2301-4980 Fax: +852-2301-3545
• Japan Anritsu Corporation8-5, Tamura-cho, Atsugi-shi, Kanagawa, 243-0016 Japan Phone: +81-46-296-1221 Fax: +81-46-296-1238
• Korea Anritsu Corporation, Ltd.502, 5FL H-Square N B/D, 681, Sampyeong-dong, Bundang-gu, Seongnam-si, Gyeonggi-do, 463-400 Korea Phone: +82-31-696-7750 Fax: +82-31-696-7751
• Australia Anritsu Pty Ltd.Unit 21/270 Ferntree Gully Road, Notting Hill, Victoria 3168, Australia Phone: +61-3-9558-8177 Fax: +61-3-9558-8255
• Taiwan Anritsu Company Inc.7F, No. 316, Sec. 1, Neihu Rd., Taipei 114, Taiwan Phone: +886-2-8751-1816 Fax: +886-2-8751-1817
Anritsu prints on recycled paper with vegetable soybean oil ink.


![AP-LMR2000 LMR Gateway Presentation File [호환 모드] Contents • Product Overview AP-LMR2000 LMR Gateway Product Overview • Hardware Specification • APOS Technology • LMR(Land-to-Mobile](https://static.fdocuments.in/doc/165x107/5e06d97e4d6fba74fe28842f/ap-lmr2000-lmr-gateway-presentation-file-eeoe-contents-a-product-overview.jpg)


![Services & Supportdl.cdn-anritsu.com/en-us/test-measurement/files/Software/...[SPH-4000] regional language Support for S412E LMR Master is available. What will the customer see in](https://static.fdocuments.in/doc/165x107/5f709a4e6eccac13601c8a04/services-sph-4000-regional-language-support-for-s412e-lmr-master-is.jpg)

