LLOYD’S UPDATE - Risk - Retirement - Health | Aon€™S UPDATE - 2009 RESULTS & 2010 CAPACITY 4...
25
LLOYD’S UPDATE 2009 Results and 2010 Capacity reDEFINING Capital | Access | Advocacy | Innovation
Transcript of LLOYD’S UPDATE - Risk - Retirement - Health | Aon€™S UPDATE - 2009 RESULTS & 2010 CAPACITY 4...

LLOYD’S UPDATE2009 Results and 2010 Capacity
reDEFININGCapital | Access | Advocacy | Innovation

About Aon BenfieldAs the industry leader in treaty, facultative and capital markets, Aon Benfield is redefining the role of the reinsurance intermediary
and capital advisor. Through our unmatched talent and industry-leading proprietary tools and products, we help our clients to
redefine themselves and their success. Aon Benfield offers unbiased capital advice and customized access to more reinsurance and
capital markets than anyone else. As a trusted advocate, we provide local reach to the world’s markets, an unparalleled investment
in innovative analytics, including catastrophe management, actuarial, and rating agency advisory, and the right professionals
to advise clients in making the optimal capital choice for their business. With an international network of more than 4,000
professionals in 50 countries, our worldwide client base is able to access the broadest portfolio of integrated capital solutions and
services. Learn more at aonbenfield.com.

AON BENFIELD
3
Contents Capital & Capacity 4 2010 Capacity and Lloyd’s Strategy 2010-2012 5
Syndicate New Entrants and Departures 5 Lloyd’s Strategic Review 2010-2012 5
Lloyd’s 2009 Pro Forma Results 6 Balance Sheet 7 Investment Return 8 Underwriting Profit 9
Listed Integrated Lloyd’s Vehicles (ILVs) 11 Balance Sheet 11 Investment Return 11 Underwriting Profit 12 Pre-Tax Profits 14 1Q 2010 Catastrophe Losses 15
Appendix 1 16 Business Split 16
Appendix 2 17 Capacity 17
Appendix 3 20 Lloyd’s Market and Syndicate Ratings 20
Appendix 4 22 Lloyd’s Chain of Security 22
Appendix 5 23 Realistic Disaster Scenarios (RDS) 23
LLOYD’S UPDATE - 2009 RESULTS & 2010 CAPACITY
4
Capital & Capacity Lloyd’s pro forma capital increased by 28% in 2009, rising to GBP18.2bn. Market estimates suggest that 1 January 2010 stamp capacity increased by 30%, largely due to the need to allow for the significant foreign exchange movements in 2008/9. Gross premiums written increased by 22%, or 8% in local currency terms, to GBP22bn. Reinsurance premiums accounted for 36% of the total, at GBP8bn. Pro forma pre-tax profits doubled to GBP3.9bn, reflecting in part a benign year for natural catastrophes and an 85% increase in the investment return.
Lloyd’s continues to pursue its stated ambition to be the market of choice, as reiterated in its Strategic Review for 2010-2012 published in February 2010. During 2009, Lloyd’s resolved the Equitas deal and saw its ratings affirmed by A.M. Best, Standard & Poor’s and Fitch.
As at Lloyd’s, 2009 gross written premium growth for the listed Integrated Lloyd’s Vehicles (ILVs) was, in general, assisted by foreign currency movements. The ILVs also benefited from improved rates on catastrophe exposed business lines, a relatively benign claims environment and improved investment returns, although this was partly offset by the negative impact of foreign exchange translation of non monetary liabilities. Shareholders’ funds for the nine listed ILVs increased by 24%, mainly reflecting capital raising by a number of the companies in late 2008 and early 2009.
Both Lloyd’s and a number of the ILVs remain cautious on the outlook for pricing in 2010, particularly given the replenishment of capital levels in the (re)insurance industry. The emphasis was on maintaining underwriting discipline until events result in a change in the pricing environment. To date, it appears that catastrophe losses announced in the first quarter of 2010 are unlikely to result in such a change.
AON BENFIELD
5
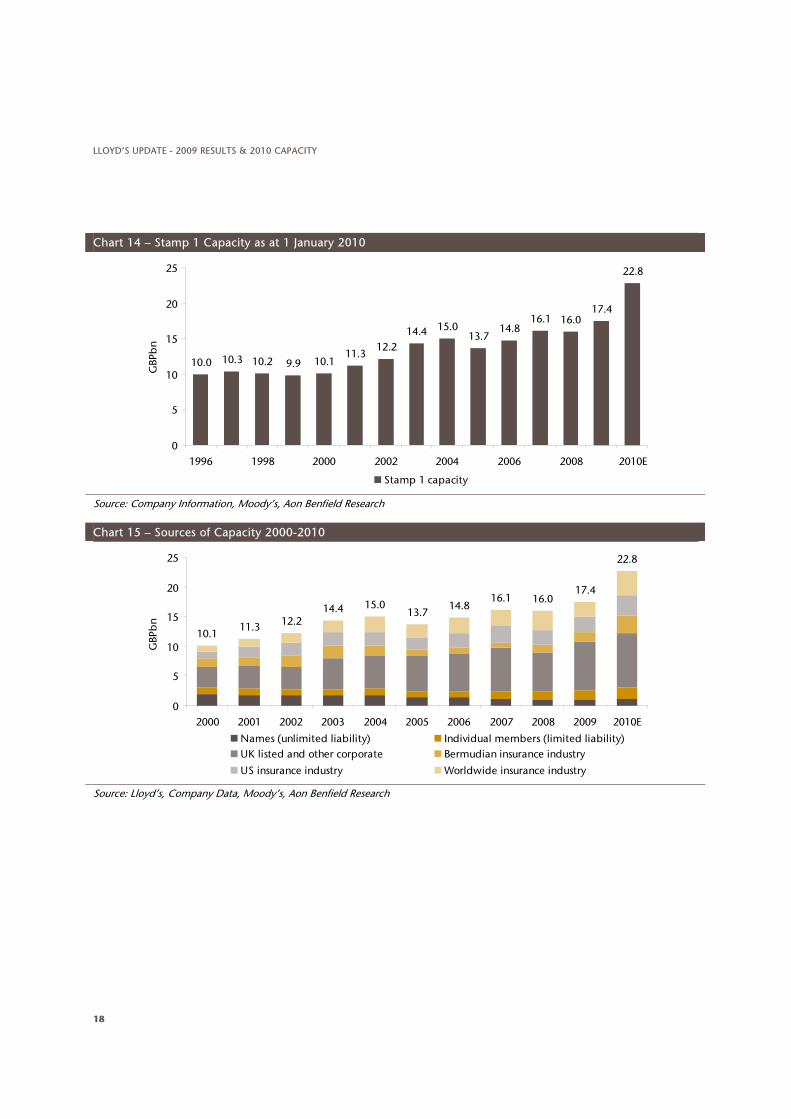
2010 Capacity and Lloyd’s Strategy 2010-2012 While Lloyd’s no longer publishes capacity figures, market estimates have suggested that opening capacity for 2010 was 30% higher than in 20091. The increase was largely due to syndicates allowing for foreign exchange movements, as new capacity from 2010 start-ups was minimal in comparison to previous years. A key element of Lloyd’s recently announced Strategic Review was the desire to improve access to the Lloyd’s market.
Syndicate New Entrants and Departures As detailed in Appendix 2, four new syndicates were formed for 1 January 2010, all by existing Lloyd’s players. This was much fewer than the 12 new syndicates formed during 2009 to take advantage of the more attractive rate environment in some of Lloyd’s key markets and diversification benefits of the Lloyd’s franchise. As shown in Chart 1 capacity for the four new syndicates was GBP165mn, more than offsetting the GBP70mn of capacity lost as syndicate 2112 was placed into run-off. The departing syndicates, 1231 and 4040 have merged into syndicates 5820 and 4141 respectively.
Chart 1 – Syndicate New Entrants and Exits 2009/2010
Marlborough Commenced 1/1/2010
Argenta Commenced 1/1/2010
Beaufort Commenced 1/1/2010
Beazley Special Purpose Syndicate (SPS)
Jubilee Merged with s.5820
HCC Merged with s.4141
Spectrum In run-off
-80 -40 0 40 80
2112
4040
1231
6107
2318
1110
1969
Capacity GBPmn
2009 Departures
New Entrants
Source: Lloyd’s, Moody’s, Company data, Aon Benfield Research
Lloyd’s Strategic Review 2010-2012 On February 8, 2010, Lloyd’s announced the completion of its 2010-2012 Strategic Review. Stated aims were to maintain and develop the attractiveness of the Lloyd’s brand, and to focus on underwriting discipline and risk management. In addition, the Corporation’s priorities for 2010 were preparations for Solvency II, increased use of The Exchange, claims transformation and improving access to business through streamlining coverholder management.
Richard Ward, Lloyd’s Chief Executive Officer, placed particular emphasis on reiterating the strength of Lloyd’s as a broker market and on the need for Lloyd’s “to take a more outward view”2. Lloyd’s hopes that this greater external focus will enable it to achieve its stated aim to be the market of choice for specialist casualty and property risks while strengthening the position of London as a financial services centre.
1 Company Information, Moody’s, Aon Benfield Research 2 Chief Executive Officer’s Introduction, Lloyd’s Strategy 2010-2012
LLOYD’S UPDATE - 2009 RESULTS & 2010 CAPACITY
6
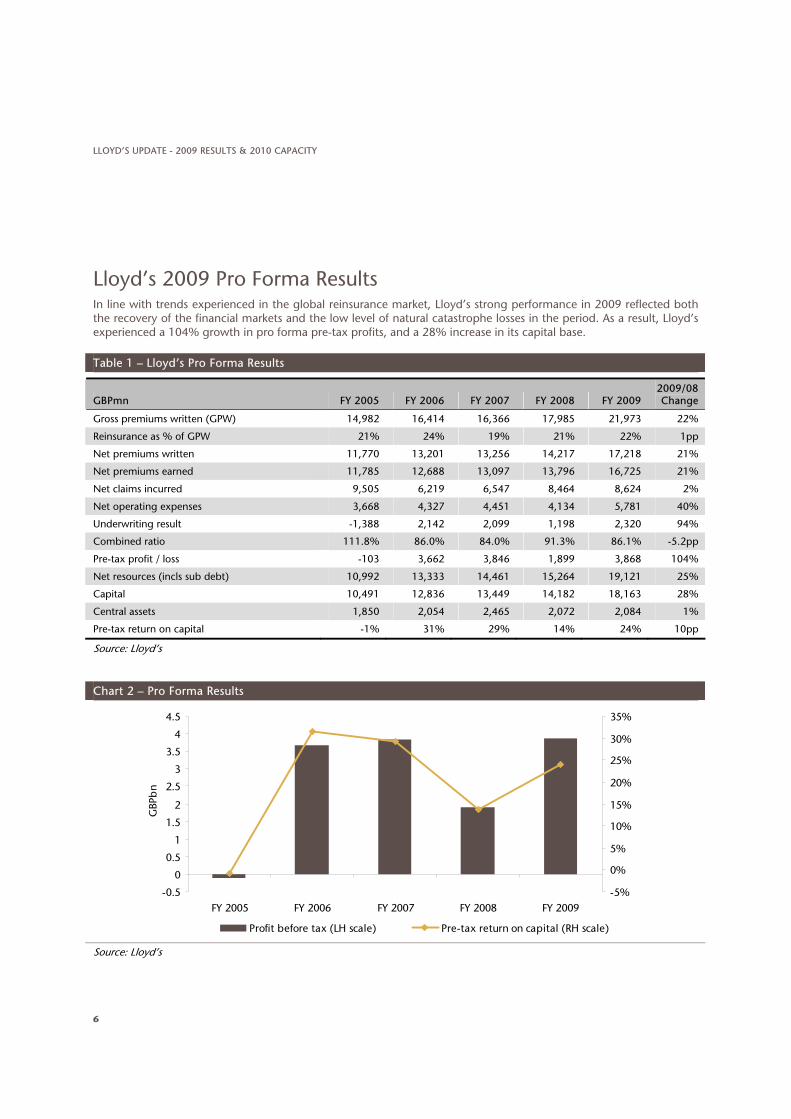
Lloyd’s 2009 Pro Forma Results In line with trends experienced in the global reinsurance market, Lloyd’s strong performance in 2009 reflected both the recovery of the financial markets and the low level of natural catastrophe losses in the period. As a result, Lloyd’s experienced a 104% growth in pro forma pre-tax profits, and a 28% increase in its capital base.
Table 1 – Lloyd’s Pro Forma Results
GBPmn FY 2005 FY 2006 FY 2007 FY 2008 FY 2009 2009/08 Change
Gross premiums written (GPW) 14,982 16,414 16,366 17,985 21,973 22%
Reinsurance as % of GPW 21% 24% 19% 21% 22% 1pp
Net premiums written 11,770 13,201 13,256 14,217 17,218 21%
Net premiums earned 11,785 12,688 13,097 13,796 16,725 21%
Net claims incurred 9,505 6,219 6,547 8,464 8,624 2%
Net operating expenses 3,668 4,327 4,451 4,134 5,781 40%
Underwriting result -1,388 2,142 2,099 1,198 2,320 94%
Combined ratio 111.8% 86.0% 84.0% 91.3% 86.1% -5.2pp
Pre-tax profit / loss -103 3,662 3,846 1,899 3,868 104%
Net resources (incls sub debt) 10,992 13,333 14,461 15,264 19,121 25%
Capital 10,491 12,836 13,449 14,182 18,163 28%
Central assets 1,850 2,054 2,465 2,072 2,084 1%
Pre-tax return on capital -1% 31% 29% 14% 24% 10pp
Source: Lloyd’s
Chart 2 – Pro Forma Results
-0.5
0
0.5
1
1.5
2
2.5
3
3.5
4
4.5
FY 2005 FY 2006 FY 2007 FY 2008 FY 2009
GBP
bn
-5%
0%
5%
10%
15%
20%
25%
30%
35%
Profit before tax (LH scale) Pre-tax return on capital (RH scale)
Source: Lloyd’s

AON BENFIELD
7
Balance Sheet As Lloyd’s is a partially mutualized market rather than an insurance company, it does not hold conventional equity. Instead, its capital base is comprised of members’ Funds at Lloyd’s (FAL), Members’ Balances and Central Reserves. This increased by 28% in 2009 to GBP18.2bn. The main drivers of the increase were a 24% increase in FAL and a 51% increase in Members’ Balances, reflecting the improved profit contribution from the syndicates during 2009. The Central Reserves represent the mutual assets of Lloyd’s and increased by 1% in 2009, to GBP1.1bn. Further details of the Lloyd’s capital base can be found in Appendix 4.
Syndicate premium assets comprise the largest proportion of invested assets for the Lloyd’s market. As the syndicates are required to maintain a high level of liquidity, the majority of the investments are held in cash and short-term fixed interest securities. Chart 3 illustrates the composition of Lloyd’s Market Invested Assets, which is generally unchanged from 2008. The breakdown of corporate bond ratings is also given in Chart 3. 70% of corporate bonds are rated AA or above, compared to 77% in 2008.
Chart 3 – Lloyd’s Market Invested Assets
FY 2009 Total: GBP46.3bn
35%
28%
33%
2% 2%
Cash and LOCs
Corporate Bonds
Government Bonds*
Equities
Alternative Investments
FY 2009 Corporate Bonds GBP16.2bn
25%
21%
9%45%
AAA
AA
A
Below A
*Includes supra nationals and government agencies Source: Lloyd’s
Chart 4 shows the asset split for the Society of Lloyd’s (the Central Fund). This changed significantly during 2009, with corporate bonds increasing to 45% of the total, from 14% at the end of 2008. The shift in composition reflected the improvement in the corporate bond market during the year. There was a commensurate reduction in the level of government bonds within the portfolio, from 66% at December 31, 2008, to 35% at the end of 2009.

LLOYD’S UPDATE - 2009 RESULTS & 2010 CAPACITY
8
Chart 4 – Central Fund Assets
FY 2009 Central Fund Assets GBP2.1bn
45%
35%
6%
4%3%
3%2% 2%
FY 2008 Central Fund Assets GBP2.1bn
1%2%2%6%
4%
5%
64%
16%
Fixed Income - Corporate
Fixed Income - Government*
Global Equity
Hedge Funds
Cash
Emerging Markets & High Yield Bonds
Property Equity
Emerging Equity
*Includes supra nationals and government agencies Source: Lloyd’s
Investment Return The pro forma accounts include a notional investment return on FAL, an investment return on central assets and syndicate investment return. This split is illustrated in Chart 5. The investment return includes both realized and unrealized investments. The improvement in the total investment return mainly reflects the recovery in corporate bond values.
Chart 5 – Investment Return
0
500
1,000
1,500
2,000
2,500
FY 2005 FY 2006 FY 2007 FY 2008 FY 2009
GBP
mn
0.0
1.0
2.0
3.0
4.0
5.0
6.0
Inve
stm
ent
Retu
rn %
Investment Return on Society Assets (LH scale)*Notional Return on FAL (LH scale)Syndicate Investment Return (LH scale)Investment Return (RH scale)
Source: Lloyd’s, Aon Benfield Research

AON BENFIELD
9
Underwriting Profit As shown in Table 1, Lloyd’s gross premiums written increased by 22% in 2009. Foreign currency movements accounted for 13 percentage points (pp) of this increase, giving a local currency increase in gross premiums written of 8%. Chart 6 shows the development of the combined ratio over the past three years. The 2009 accident year ratio, excluding catastrophes and prior year reserve movements, was 89.6%, compared to 87.8%. Excluding the impact of foreign exchange on non-monetary items, the accident year combined ratio fell to 87.3% in 2009 from 90.5% in 2008. Lloyd’s benefited strongly from a benign hurricane season, particularly in the Gulf of Mexico. Catastrophe losses added only 2.1% (GBP347mn) to the combined ratio in 2009, compared to 12.7% (GBP1,750mn) in 2008.
Chart 6 – Lloyd’s Pro Forma Combined Ratio
86.7% 87.8% 89.6%
84.0%91.3%
86.1%
-10%
10%
30%
50%
70%
90%
110%
FY 2007 FY 2008 FY 2009
Com
bin
ed r
atio
Accident year Catastrophes Net Prior Year Development
Source: Lloyd’s
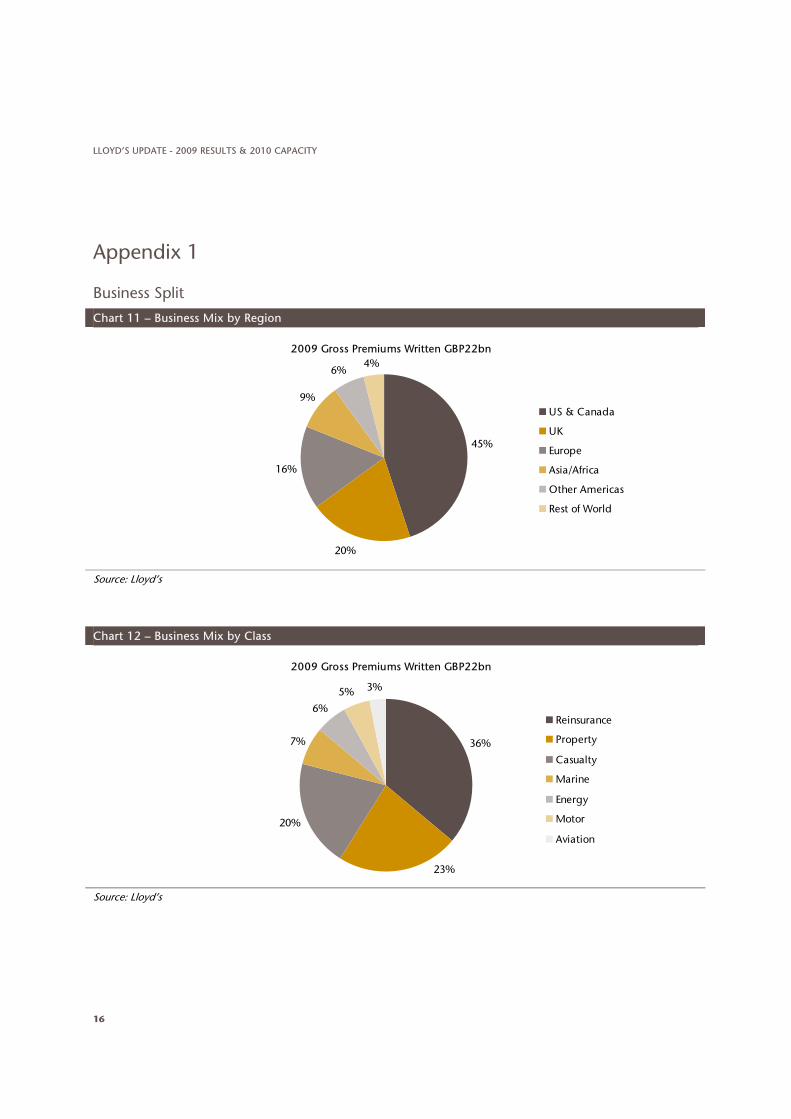
Chart 7 depicts the combined ratio by business category, while Chart 8 illustrates the reserve development by line of business. A split of business by 2009 gross premiums written is given in Appendix 1. In 2009, Reinsurance accounted for 36% of business written (2008: 35%). Property and Casualty accounted for a further 23% (23%) and 20% (21%).
Prior year reserve releases benefited the combined ratio by 5.6% in 2009, down from 9.2% in 2008. Lloyd’s flagged that “future years are likely to see further reductions in the levels of release”3.
3 Lloyd’s Annual Report, 2009

LLOYD’S UPDATE - 2009 RESULTS & 2010 CAPACITY
10
Chart 7 – Combined Ratio by Business Line
84.1%
108.4%
92.4% 90.8%97.1%
88.7%
78.4%
60%
70%
80%
90%
100%
110%
120%
130%
Energy Motor Property Casualty Aviation Marine Reinsurance
Cal
end
ar y
ear
com
bin
ed r
atio
2008 2009
Source: Lloyd’s
Chart 8 – Prior Year Reserve Adjustments
3.9%
-3.4%
-7.4% -6.2%-8.3%
-5.8%
-16.6%
-30%
-25%
-20%
-15%
-10%
-5%
0%
5%
10%
Motor Property Marine Energy Casualty Reinsurance Aviation
Prio
r ye
ar r
eser
ve m
ovem
ent
%
2008 2009
Source: Lloyd’s

AON BENFIELD
11
Listed Integrated Lloyd’s Vehicles (ILVs) Due to a combination of capital raising and profit recovery in 2009, shareholders’ funds for the group increased 24% year on year. Premium growth benefited from currency movements, acquisitions and organic growth as the ILVs took advantage of available rate increases at the start of 2009. A benign claims environment, particularly in the Gulf of Mexico, combined with improved investment returns, generated strong profit growth for most of the ILVs, offsetting the negative impact of foreign exchange adjustments.
Balance Sheet Table 2 shows shareholders’ funds of the listed ILVs. Total shareholders’ funds for the group increased by 24% in 2009, compared to 10% growth in 2008. However, there was considerable variation in growth between the companies, largely related to the extent to which each company raised capital in 2008/9. Beazley, Chaucer, Hardy and Omega raised the largest amount of capital relative to their equity base, and delivered the strongest growth in shareholders’ funds in 2009. Brit and Novae did not raise additional capital and therefore delivered the lowest levels of growth. While most of the ILVs stated that capital levels were above the level required, most commented that they wanted to hold additional capital to protect against severe losses and Solvency II. Capital redistribution was mentioned as a possibility if deemed to be in shareholders’ interests in future.
Table 2 – Shareholders’ Funds
Company Reporting Currency 31/12/2005 31/12/2006 31/12/2007 31/12/2008 31/12/2009
2009/2008 Change
Amlin GBPmn 785 936 1,052 1,216 1,593 31%
Beazley GBPmn 280 320 399 413 619 50%
Brit GBPmn 725 813 849 850 895 5%
Catlin USDmn 931 2,018 3,017 2,469 3,278 33%
Chaucer GBPmn 156 217 283 226 317 40%
Hardy GBPmn 68 77 85 102 152 50%
Hiscox GBPmn 578 682 824 951 1,121 18%
Novae GBPmn 112 240 270 301 314 4%
Omega USDmn 114 265 309 284 496 75%
Source: Company data, Aon Benfield Research
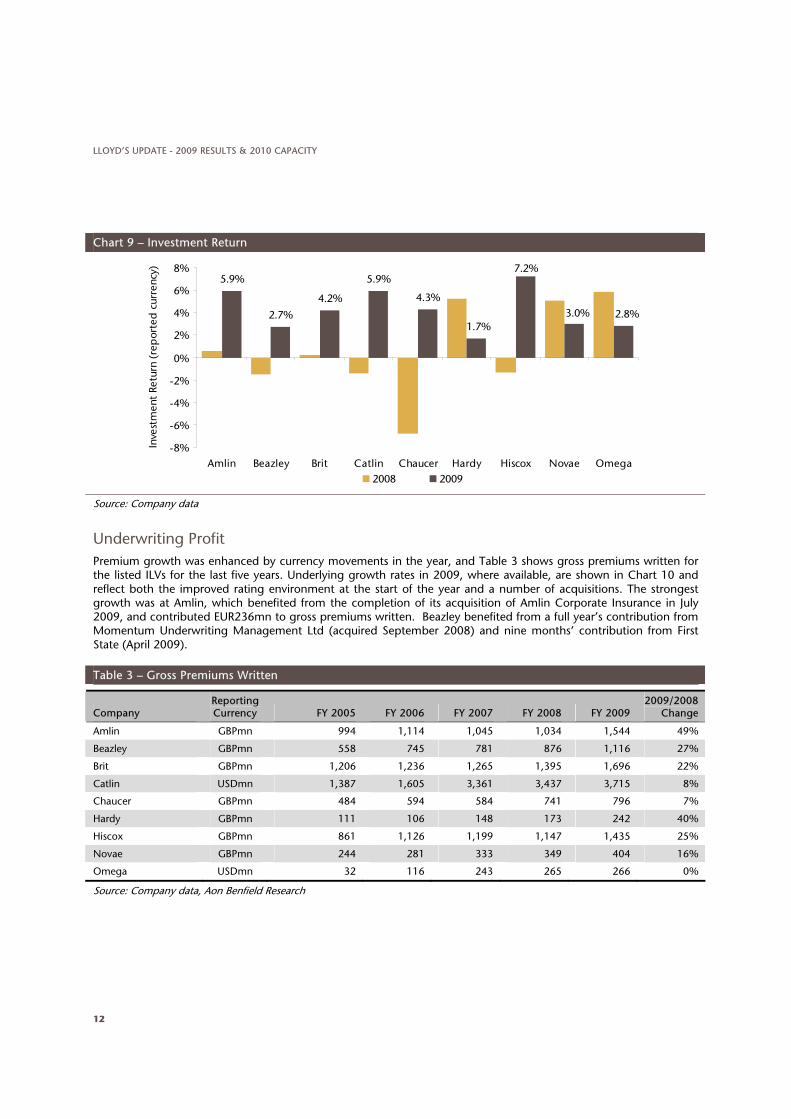
Investment Return Chart 9 illustrates the improvement in investment yield experienced by most of the ILVs in 2009. In line with the experience of Lloyd’s and the Aon Benfield Aggregate companies4, this recovery was largely driven by the recovery in the corporate bond market during the year. The strongest return on investments was demonstrated by Hiscox at 7.2% (2008: -1.3%), reflecting the recovery of corporate and asset-backed securities in the company’s investment portfolio. In contrast, Hardy’s relatively low return of 1.7% (5.2%) was indicative of its relatively high exposure to government backed securities, lower corporate bond holdings and absence of asset-backed securities.
4 The Aon Benfield Aggregate, Full year ended December 31, 2009, April 2010
LLOYD’S UPDATE - 2009 RESULTS & 2010 CAPACITY
12
Chart 9 – Investment Return
5.9%
2.7%
4.2%
5.9%
4.3%
7.2%
2.8%3.0%1.7%
-8%
-6%
-4%
-2%
0%
2%
4%
6%
8%
Amlin Beazley Brit Catlin Chaucer Hardy Hiscox Novae Omega
Inve
stm
ent
Retu
rn (
rep
orte
d c
urre
ncy)
2008 2009
Source: Company data
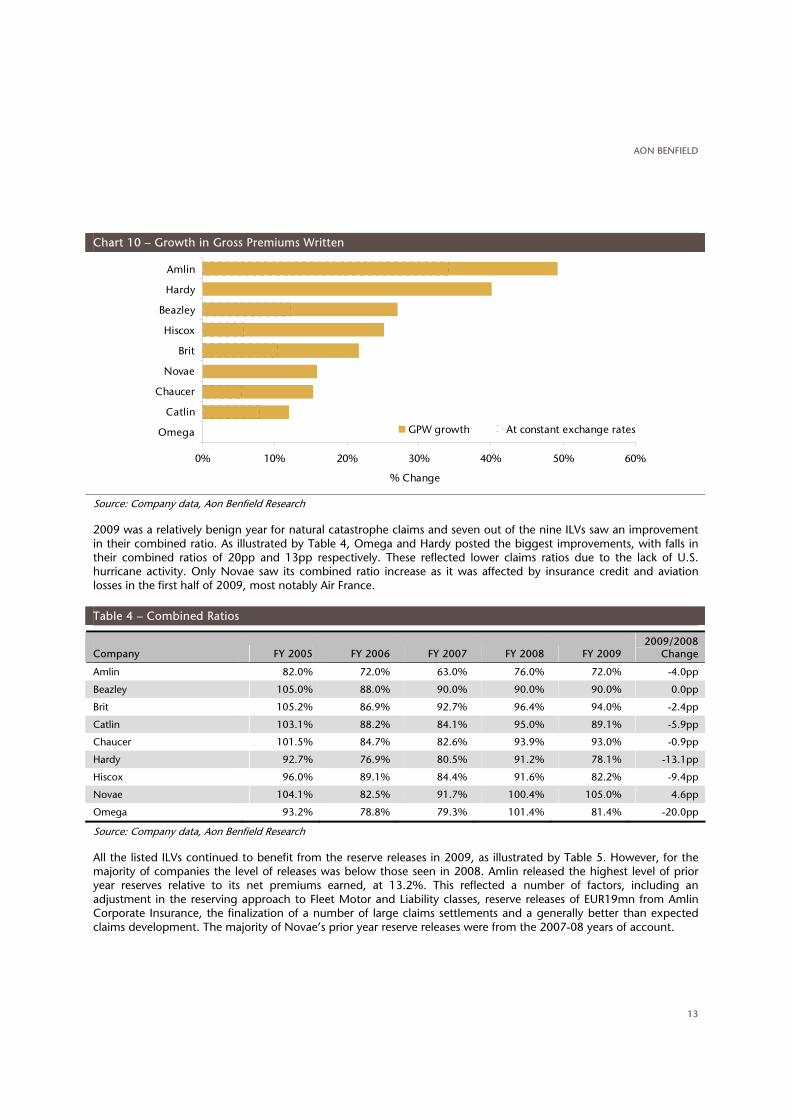
Underwriting Profit Premium growth was enhanced by currency movements in the year, and Table 3 shows gross premiums written for the listed ILVs for the last five years. Underlying growth rates in 2009, where available, are shown in Chart 10 and reflect both the improved rating environment at the start of the year and a number of acquisitions. The strongest growth was at Amlin, which benefited from the completion of its acquisition of Amlin Corporate Insurance in July 2009, and contributed EUR236mn to gross premiums written. Beazley benefited from a full year’s contribution from Momentum Underwriting Management Ltd (acquired September 2008) and nine months’ contribution from First State (April 2009).
Table 3 – Gross Premiums Written
Company Reporting Currency FY 2005 FY 2006 FY 2007 FY 2008 FY 2009
2009/2008 Change
Amlin GBPmn 994 1,114 1,045 1,034 1,544 49%
Beazley GBPmn 558 745 781 876 1,116 27%
Brit GBPmn 1,206 1,236 1,265 1,395 1,696 22%
Catlin USDmn 1,387 1,605 3,361 3,437 3,715 8%
Chaucer GBPmn 484 594 584 741 796 7%
Hardy GBPmn 111 106 148 173 242 40%
Hiscox GBPmn 861 1,126 1,199 1,147 1,435 25%
Novae GBPmn 244 281 333 349 404 16%
Omega USDmn 32 116 243 265 266 0%
Source: Company data, Aon Benfield Research
AON BENFIELD
13
Chart 10 – Growth in Gross Premiums Written
0% 10% 20% 30% 40% 50% 60%
Omega
Catlin
Chaucer
Novae
Brit
Hiscox
Beazley
Hardy
Amlin
% Change
GPW growth At constant exchange rates
Source: Company data, Aon Benfield Research
2009 was a relatively benign year for natural catastrophe claims and seven out of the nine ILVs saw an improvement in their combined ratio. As illustrated by Table 4, Omega and Hardy posted the biggest improvements, with falls in their combined ratios of 20pp and 13pp respectively. These reflected lower claims ratios due to the lack of U.S. hurricane activity. Only Novae saw its combined ratio increase as it was affected by insurance credit and aviation losses in the first half of 2009, most notably Air France.
Table 4 – Combined Ratios
Company FY 2005 FY 2006 FY 2007 FY 2008 FY 2009 2009/2008
Change
Amlin 82.0% 72.0% 63.0% 76.0% 72.0% -4.0pp
Beazley 105.0% 88.0% 90.0% 90.0% 90.0% 0.0pp
Brit 105.2% 86.9% 92.7% 96.4% 94.0% -2.4pp
Catlin 103.1% 88.2% 84.1% 95.0% 89.1% -5.9pp
Chaucer 101.5% 84.7% 82.6% 93.9% 93.0% -0.9pp
Hardy 92.7% 76.9% 80.5% 91.2% 78.1% -13.1pp
Hiscox 96.0% 89.1% 84.4% 91.6% 82.2% -9.4pp
Novae 104.1% 82.5% 91.7% 100.4% 105.0% 4.6pp
Omega 93.2% 78.8% 79.3% 101.4% 81.4% -20.0pp
Source: Company data, Aon Benfield Research
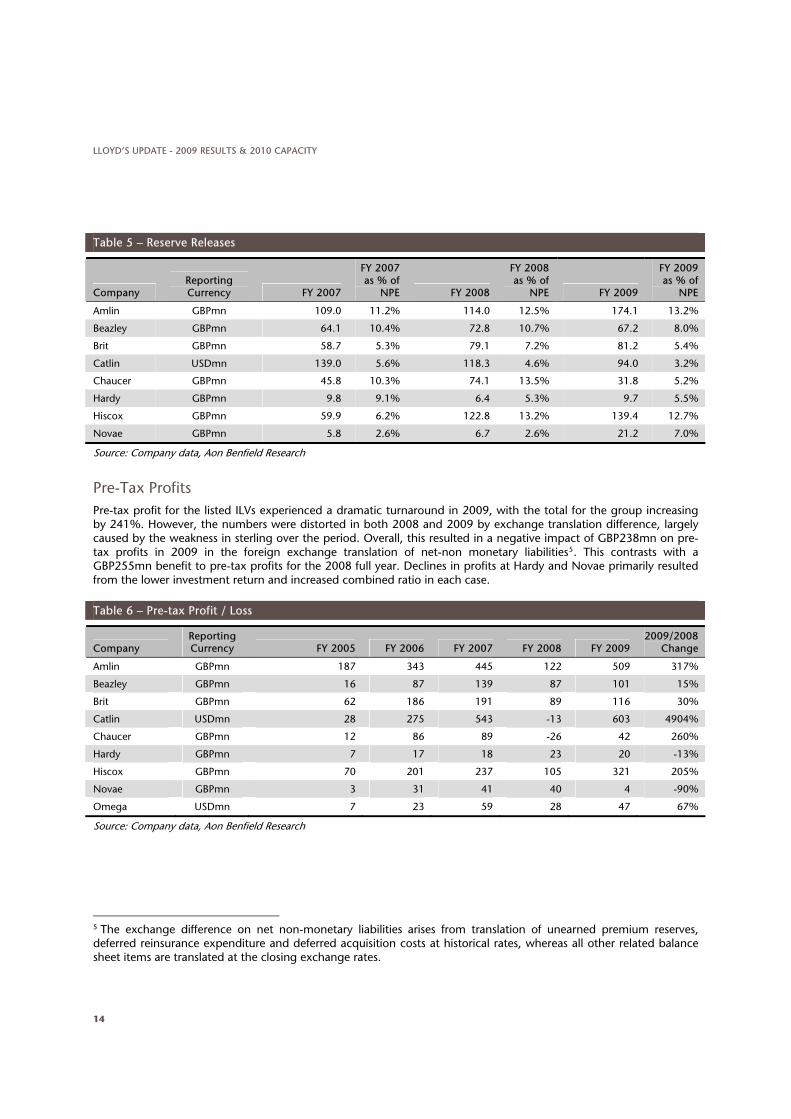
All the listed ILVs continued to benefit from the reserve releases in 2009, as illustrated by Table 5. However, for the majority of companies the level of releases was below those seen in 2008. Amlin released the highest level of prior year reserves relative to its net premiums earned, at 13.2%. This reflected a number of factors, including an adjustment in the reserving approach to Fleet Motor and Liability classes, reserve releases of EUR19mn from Amlin Corporate Insurance, the finalization of a number of large claims settlements and a generally better than expected claims development. The majority of Novae’s prior year reserve releases were from the 2007-08 years of account.
LLOYD’S UPDATE - 2009 RESULTS & 2010 CAPACITY
14
Table 5 – Reserve Releases
Company Reporting Currency FY 2007
FY 2007 as % of
NPE FY 2008
FY 2008 as % of
NPE FY 2009
FY 2009 as % of
NPE
Amlin GBPmn 109.0 11.2% 114.0 12.5% 174.1 13.2%
Beazley GBPmn 64.1 10.4% 72.8 10.7% 67.2 8.0%
Brit GBPmn 58.7 5.3% 79.1 7.2% 81.2 5.4%
Catlin USDmn 139.0 5.6% 118.3 4.6% 94.0 3.2%
Chaucer GBPmn 45.8 10.3% 74.1 13.5% 31.8 5.2%
Hardy GBPmn 9.8 9.1% 6.4 5.3% 9.7 5.5%
Hiscox GBPmn 59.9 6.2% 122.8 13.2% 139.4 12.7%
Novae GBPmn 5.8 2.6% 6.7 2.6% 21.2 7.0%
Source: Company data, Aon Benfield Research
Pre-Tax Profits Pre-tax profit for the listed ILVs experienced a dramatic turnaround in 2009, with the total for the group increasing by 241%. However, the numbers were distorted in both 2008 and 2009 by exchange translation difference, largely caused by the weakness in sterling over the period. Overall, this resulted in a negative impact of GBP238mn on pre-tax profits in 2009 in the foreign exchange translation of net-non monetary liabilities5. This contrasts with a GBP255mn benefit to pre-tax profits for the 2008 full year. Declines in profits at Hardy and Novae primarily resulted from the lower investment return and increased combined ratio in each case.
Table 6 – Pre-tax Profit / Loss
Company Reporting Currency FY 2005 FY 2006 FY 2007 FY 2008 FY 2009
2009/2008 Change
Amlin GBPmn 187 343 445 122 509 317%
Beazley GBPmn 16 87 139 87 101 15%
Brit GBPmn 62 186 191 89 116 30%
Catlin USDmn 28 275 543 -13 603 4904%
Chaucer GBPmn 12 86 89 -26 42 260%
Hardy GBPmn 7 17 18 23 20 -13%
Hiscox GBPmn 70 201 237 105 321 205%
Novae GBPmn 3 31 41 40 4 -90%
Omega USDmn 7 23 59 28 47 67%
Source: Company data, Aon Benfield Research
5 The exchange difference on net non-monetary liabilities arises from translation of unearned premium reserves, deferred reinsurance expenditure and deferred acquisition costs at historical rates, whereas all other related balance sheet items are translated at the closing exchange rates.
AON BENFIELD
15
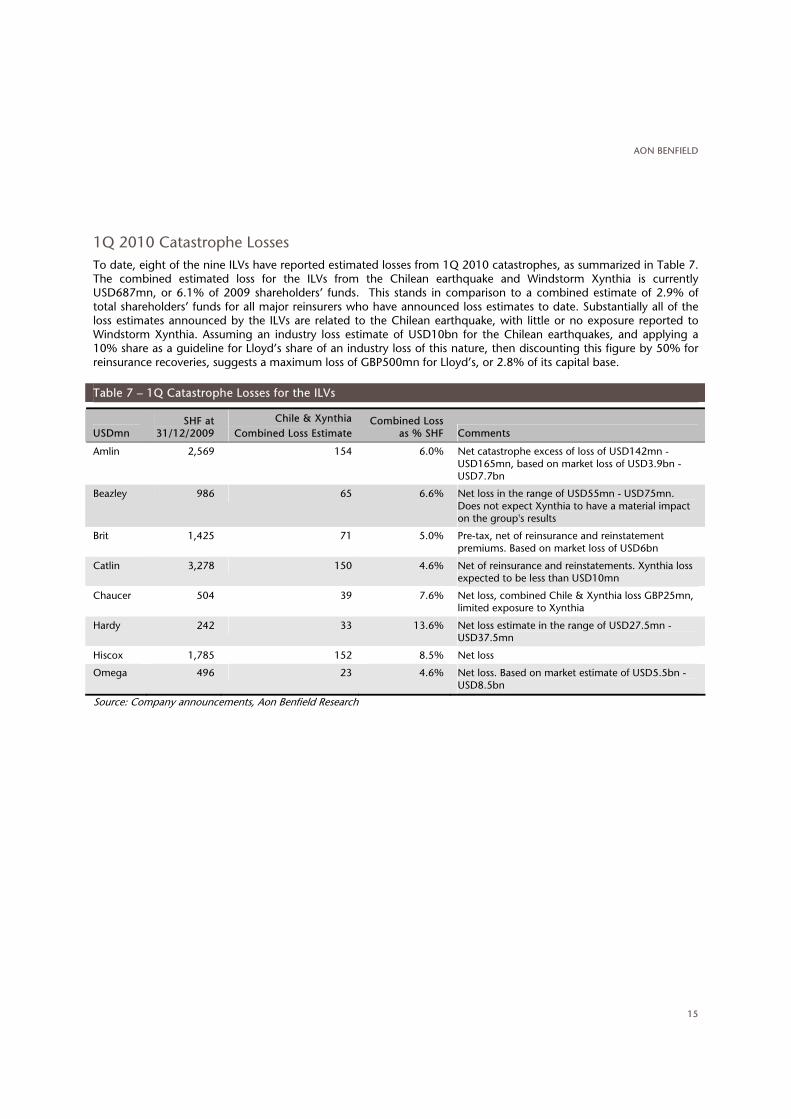
1Q 2010 Catastrophe Losses To date, eight of the nine ILVs have reported estimated losses from 1Q 2010 catastrophes, as summarized in Table 7. The combined estimated loss for the ILVs from the Chilean earthquake and Windstorm Xynthia is currently USD687mn, or 6.1% of 2009 shareholders’ funds. This stands in comparison to a combined estimate of 2.9% of total shareholders’ funds for all major reinsurers who have announced loss estimates to date. Substantially all of the loss estimates announced by the ILVs are related to the Chilean earthquake, with little or no exposure reported to Windstorm Xynthia. Assuming an industry loss estimate of USD10bn for the Chilean earthquakes, and applying a 10% share as a guideline for Lloyd’s share of an industry loss of this nature, then discounting this figure by 50% for reinsurance recoveries, suggests a maximum loss of GBP500mn for Lloyd’s, or 2.8% of its capital base.
Table 7 – 1Q Catastrophe Losses for the ILVs
USDmn SHF at
31/12/2009 Chile & Xynthia
Combined Loss Estimate Combined Loss
as % SHF Comments
Amlin 2,569 154 6.0% Net catastrophe excess of loss of USD142mn - USD165mn, based on market loss of USD3.9bn - USD7.7bn
Beazley 986 65 6.6% Net loss in the range of USD55mn - USD75mn. Does not expect Xynthia to have a material impact on the group's results
Brit 1,425 71 5.0% Pre-tax, net of reinsurance and reinstatement premiums. Based on market loss of USD6bn
Catlin 3,278 150 4.6% Net of reinsurance and reinstatements. Xynthia loss expected to be less than USD10mn
Chaucer 504 39 7.6% Net loss, combined Chile & Xynthia loss GBP25mn, limited exposure to Xynthia
Hardy 242 33 13.6% Net loss estimate in the range of USD27.5mn -USD37.5mn
Hiscox 1,785 152 8.5% Net loss
Omega 496 23 4.6% Net loss. Based on market estimate of USD5.5bn - USD8.5bn
Source: Company announcements, Aon Benfield Research
LLOYD’S UPDATE - 2009 RESULTS & 2010 CAPACITY
16
Appendix 1
Business Split
Chart 11 – Business Mix by Region
2009 Gross Premiums Written GBP22bn
45%
20%
16%
9%
6%4%
US & Canada
UK
Europe
Asia/Africa
Other Americas
Rest of World
Source: Lloyd’s
Chart 12 – Business Mix by Class
2009 Gross Premiums Written GBP22bn
36%
23%
20%
7%
6%
5% 3%
Reinsurance
Property
Casualty
Marine
Energy
Motor
Aviation
Source: Lloyd’s

AON BENFIELD
17
Appendix 2
Capacity
Table 8 – 2010 New Entrants
Syndicate Number Managing Agent
2010 Indicative Capacity
GBPmn Comments
1110 Argenta Syndicate Management Ltd 53.0 Commenced underwriting 1/1/10
1969 Marlborough Underwriting Agency Limited 64.0 New Flagstone Syndicate commenced underwriting 1/1/10
2318 Beaufort Underwriting Agency Limited 33.0 New Munich Re Syndicate commenced underwriting 1/1/10
6107 Beazley Furlonge Limited 15.0 SPS writing QS of s.623/2623 worldwide catastrophe reinsurance account
Total 165.0
Source: Company Information, Aon Benfield Research, Moody’s
Table 9 – 2009 Departures
Syndicate Number Managing Agent
2009 Capacity GBPmn Comments
1231 Jubilee Managing Agency Limited 45.0 Merged into s.5820
2112 Spectrum Syndicate Management Limited 70.0 In run-off from end 2009
4040 HCC Underwriting Agency Limited 53.9 Merged into s.4141
5500 Capita Managing Agency Limited n.a. RITC syndicate in run-off
Total 168.9
Source: Company Information, Aon Benfield Research, Moody’s
Chart 13 – Number of Syndicates and Average Estimated Capacity as at 1 January 2010
0
50
100
150
200
250
300
1990 1994 1998 2002 2006 2010E
GBP
mn
0
50
100
150
200
250
300
350
400
450
Num
ber
of s
ynd
icat
es
Average syndicate capacity (LH scale)
Number of syndicates (RH scale) Number of managing agents (RH scale)
Source: Company Information, Moody’s, Aon Benfield Research
LLOYD’S UPDATE - 2009 RESULTS & 2010 CAPACITY
18
Chart 14 – Stamp 1 Capacity as at 1 January 2010
10.0 10.3 10.2 9.9 10.111.3
12.214.4 15.0
13.714.8
16.1 16.017.4
22.8
0
5
10
15
20
25
1996 1998 2000 2002 2004 2006 2008 2010E
GBP
bn
Stamp 1 capacity
Source: Company Information, Moody’s, Aon Benfield Research
Chart 15 – Sources of Capacity 2000-2010
10.111.3 12.2
14.4 15.013.7
14.816.1 16.0
17.4
22.8
0
5
10
15
20
25
2000 2001 2002 2003 2004 2005 2006 2007 2008 2009 2010E
GBP
bn
Names (unlimited liability) Individual members (limited liability)UK listed and other corporate Bermudian insurance industry
US insurance industry Worldwide insurance industry
Source: Lloyd’s, Company Data, Moody’s, Aon Benfield Research

AON BENFIELD
19
Chart 16 – Estimated 2010 Capacity for Ten Largest Syndicates
0 200 400 600 800 1,000 1,200 1,400 1,600
2003 (Catlin)
2001 (Amlin)
33 (Hiscox)
2999 (QBE)
510 (R J Kiln)
4472 (Liberty)
2623 (Beazley Furlonge)
2987 (Brit)
1084 (Chaucer)
1414 (Ascot Underwriting)
GBPmn
2009 2010E
Source: Company Information, Moody’s, Aon Benfield Research,

LLOYD’S UPDATE - 2009 RESULTS & 2010 CAPACITY
20
Appendix 3
Lloyd’s Market and Syndicate Ratings The Lloyd’s market ratings are shown in Table 10 and apply to all business written by all syndicates, and consequently to all policies issued by Lloyd’s from the 1993 year of account onwards.
Table 10 – Ratings for Lloyd’s Market
Rating Outlook Action
A.M. Best A+ (Excellent) Stable Affirmed July 13, 2009
Fitch A+ Stable Affirmed July 23, 2009
Standard & Poor's A+ (Strong) Stable Affirmed August 12, 2009
Source: Rating Agencies
While all syndicates benefit from the Lloyd’s market ratings above, some syndicates are also rated or graded individually by the rating agencies. Table 11 lists those syndicates which currently carry either an A.M. Best Financial Strength Rating (FSR), Moody’s Continuity Opinion (CO) and/or Lloyd’s Syndicate Assessment (LSA) grade by Standard & Poor’s. The major syndicates of each of the listed integrated Lloyd’s vehicles (ILVs) are highlighted.
Table 11 – Current Lloyd’s Syndicate Ratings
Syndicate Number Managing Agent A.M. Best FSR Moody’s CO S&P LSA
33 Hiscox Syndicates Ltd A s A- NA
218 Equity Syndicate Management Ltd NR A- NA
260 KGM Underwriting Agencies Ltd NR C+ 1pi
308 R J Kiln and Co Ltd NR B 2pi
318 Beaufort Underwriting Agency Ltd NR B+ 2pi
382 Hardy (Underwriting Agencies) Ltd A s B+ 3pi
386 QBE Underwriting Ltd NR A 5/Stable
435 Faraday Underwriting Ltd NR B+ 3pi
457 Munich Re Underwriting Ltd NR B 3pi
510 R J Kiln and Co Ltd A s A- 4pi
557 R J Kiln and Co Ltd NR A- 3pi
570 Atrium Underwriters Ltd A s A- NA
609 Atrium Underwriters Ltd A s A- NA
623 Beazley Furlonge Ltd A s A- 4/Stable
727 S A Meacock & Co Ltd NR B 2pi
779 Jubilee Managing Agency Ltd NR B+ 2pi
780 Advent Underwriting Ltd NR B- 2+/Stable
807 R J Kiln and Co Ltd NR B 3pi
958 Omega Underwriting Agents Ltd A s B+ 3pi
1084 Chaucer Syndicates Ltd A s B+ 3/Stable
1176 Chaucer Syndicates Ltd NR A- 3pi
…/2

AON BENFIELD
21
Table 11 – Current Lloyd’s Syndicate Ratings (cont’d)
Syndicate Number Managing Agent A.M. Best FSR Moody’s CO S&P LSA
1183 Talbot Underwriting Ltd NR B+ NA
1200 Argo Managing Agency NR NR 3pi
1206 Sagicor at Lloyd's Ltd NR B- 1pi
1209 XL London Market Ltd NR B NA
1218 Newline Underwriting Management Ltd NR NR 2pi
1221 Navigators Underwriting Agency Ltd NR B+ NA
1225 AEGIS Managing Agency Ltd A s NR 3pi
1301 Chaucer Syndicates Ltd NR NR 2pi
1414 Ascot Underwriting Ltd NR NR 3pi
1965 Argenta Syndicate Management Ltd NR NR NA
2001 Amlin Underwriting Ltd A+ s A 4/Stable
2003 Catlin Underwriting Agencies Ltd A s B+ 4/Stable
2007 Novae Syndicates Ltd A s B 3-/Stable
2010 Cathedral Underwriting Agencies Ltd A s NR 3pi
2468 Marketform Managing Agency Ltd NR 2pi
2488 ACE Underwriting Agencies Ltd NR A- NA
2623 Beazley Furlonge Ltd A s A- 4/Stable
2791 Managing Agency Partners Ltd NR NR 4pi
2987 Brit Syndicates Ltd NR B 3pi
2999 QBE Underwriting Ltd NR B+ 4-/Stable
3000 Markel Syndicate Management Ltd A s A- 3pi
3210 Mitsui Sumitomo Insurance Underwriting at Lloyd's Ltd NR B+ NA
3334 Sportscover Underwriting Ltd NR NR 1pi
3622 Beazley Furlonge Ltd A s NR 4/Stable
3623 Beazley Furlonge Ltd A s NR 4/Stable
4040 HCC Underwriting Agency Ltd NR NR 2pi
4444 Canopius Managing Agents Ltd NR B- 3-/Stable
4472 Liberty Syndicate Management Ltd NR B NA
5000 Travelers Syndicate Management Ltd NR NR 3-/Stable
5151 Montpelier Underwriting Agencies Ltd NR NR 3-/Stable
pi = Syndicate is assessed on a public information basis S&P LSAs are based on the level of dependency a syndicate has on Lloyd's: 1 = very high dependency; 5= very low dependency NA = not assessed; NR = not rated All ratings current as at 12 April 2010
Source: A.M. Best, Moody’s, Standard & Poor’s
LLOYD’S UPDATE - 2009 RESULTS & 2010 CAPACITY
22
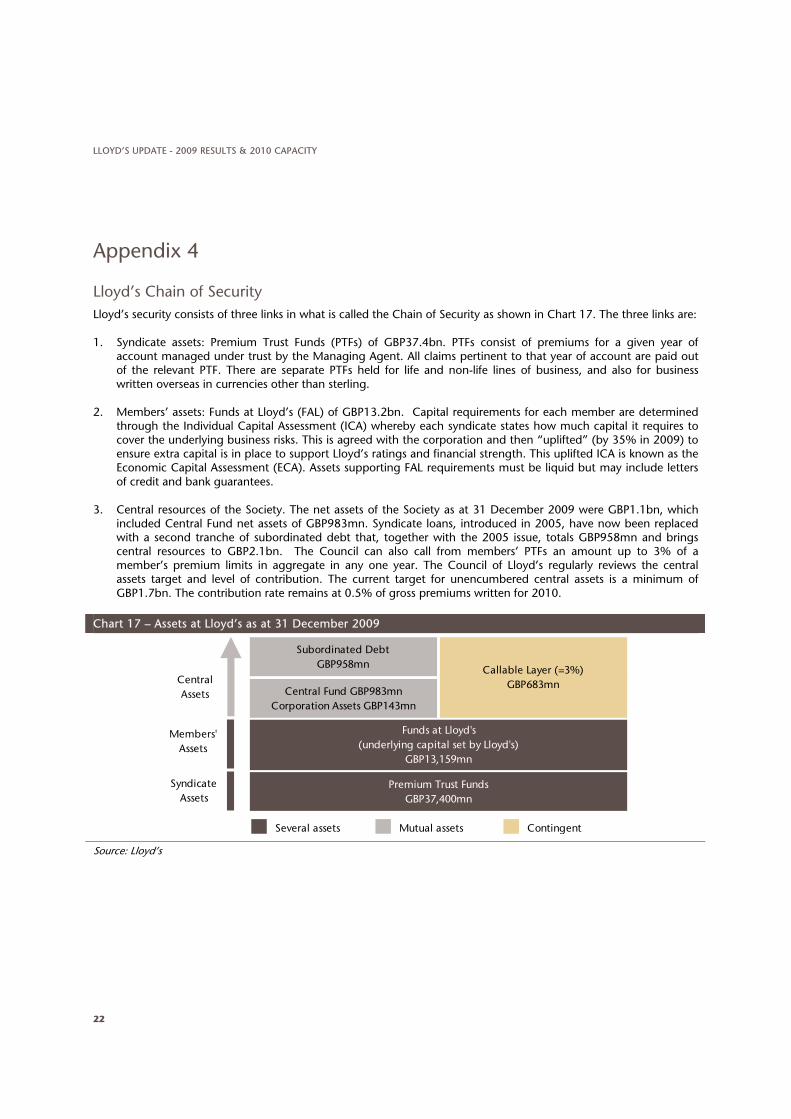
Appendix 4
Lloyd’s Chain of Security Lloyd’s security consists of three links in what is called the Chain of Security as shown in Chart 17. The three links are:
1. Syndicate assets: Premium Trust Funds (PTFs) of GBP37.4bn. PTFs consist of premiums for a given year of account managed under trust by the Managing Agent. All claims pertinent to that year of account are paid out of the relevant PTF. There are separate PTFs held for life and non-life lines of business, and also for business written overseas in currencies other than sterling.
2. Members’ assets: Funds at Lloyd’s (FAL) of GBP13.2bn. Capital requirements for each member are determined through the Individual Capital Assessment (ICA) whereby each syndicate states how much capital it requires to cover the underlying business risks. This is agreed with the corporation and then “uplifted” (by 35% in 2009) to ensure extra capital is in place to support Lloyd’s ratings and financial strength. This uplifted ICA is known as the Economic Capital Assessment (ECA). Assets supporting FAL requirements must be liquid but may include letters of credit and bank guarantees.
3. Central resources of the Society. The net assets of the Society as at 31 December 2009 were GBP1.1bn, which included Central Fund net assets of GBP983mn. Syndicate loans, introduced in 2005, have now been replaced with a second tranche of subordinated debt that, together with the 2005 issue, totals GBP958mn and brings central resources to GBP2.1bn. The Council can also call from members’ PTFs an amount up to 3% of a member’s premium limits in aggregate in any one year. The Council of Lloyd’s regularly reviews the central assets target and level of contribution. The current target for unencumbered central assets is a minimum of GBP1.7bn. The contribution rate remains at 0.5% of gross premiums written for 2010.
Chart 17 – Assets at Lloyd’s as at 31 December 2009
Funds at Lloyd's(underlying capital set by Lloyd's)
GBP13,159mn
Premium Trust FundsGBP37,400mn
Subordinated DebtGBP958mn
Central Fund GBP983mnCorporation Assets GBP143mn
Callable Layer (=3%)GBP683mnCentral
Assets
Members'Assets
Several assets Mutual assets Contingent
Syndicate Assets
Source: Lloyd’s

AON BENFIELD
23
Appendix 5
Realistic Disaster Scenarios (RDS) Lloyd’s has developed a number of Realistic Disaster Scenarios (RDSs) to stress test both individual syndicates and the market as a whole to see how they stand up to exposure to extreme events. These event scenarios are detailed each year by Lloyd’s and used to assess both aggregate market exposures and the exposure of each syndicate to those specific events.
Every syndicate is required to prepare syndicate-specific scenarios according to the type of business it writes. For Lloyd’s, the RDSs form an input to capital setting and facilitate the monitoring of aggregated exposure to specific catastrophe scenarios at a market level on a gross and net basis. This enables Lloyd’s to understand existing reinsurance protections and profile prospective reinsurance assets. The current 18 scenarios are listed in Table 12.
Table 12 – Realistic Disaster Scenarios
Industry Loss
Generic Scenarios subject to de-minimus tests Specific Event-Based Scenarios
2008 USDbn
2009 USDbn
2010 USDbn
1 Marine Event 9 Two Event 74+34 78+36 78+36
2 Loss of Major Complex 10 Florida Windstorm 119 125 125
3 Aviation Collision 11 California Earthquake 74 78 78
4 Satellite Risks 12 New Madrid Earthquake 45 47 47
5 Liability Risks 13 European Windstorm 31 31 31
6 Political Risks 14 Japanese Earthquake 51 51 51
7 Alternative RDS: A 15 Terrorism n.a. n.a. n.a.
8 Alternative RDS: B 16 Gulf of Mexico Windstorm 113 113 111
17 Japanese Typhoon 15 15 15
18 UK Flood n.a. 6* 6*
*UK Flood estimates in GBPbn Source: Lloyd’s
The offshore component of the Gulf of Mexico Windstorm RDS has been altered for 2010 to an estimated industry loss of USD4bn (2009: USD5.5bn) due to higher retentions and tighter limits for wind cover sold. All other event-based scenarios remain relatively unchanged.
Reflecting its awareness of emerging risks and the potential effects of climate change, Lloyd’s added a major UK flood to its set of RDSs for 2009. The scenario is based on heavy rainfall resulting in extensive flooding of the River Thames from Oxford to Teddington, with secondary flooding on the River Colne from Ruislip south, and surface flooding on the western and southern edges of Heathrow. The total flood area covers 194 square kilometers and would impact the towns of Oxford, Reading, Slough, Henley and parts of west London. The UK flood RDS generates an estimated industry insured loss of GBP6.2bn. Of this, GBP4.5bn relates to residential losses and GBP1.6bn to commercial losses.

3
Should you have questions about this report, please do not hesitate to contact a member of the Aon Benfield Analytics team, including:
Kathryn [email protected]: +44 (0)20 7522 8173 Eleanore [email protected]: +44 (0)20 7522 3823 Aon Benfield [email protected]: +44 (0)20 7522 3823
©Aon Limited trading as Aon Benfield (for itself and on behalf of each subsidiary company of Aon Corporation) (“Aon Benfield”) reserves all rights to the content of this report (“Report”). This Report is for distribution to Aon Benfield and the organisation to which it was originally delivered only. Copies may be made by that organisation for its own internal purposes but this Report may not be distributed in whole or in part to any third party without both (i) the prior written consent of Aon Benfield. and (ii) the third party having first signed a “recipient of report” letter in a form acceptable to Aon Benfield. Aon Benfield cannot accept any liability to any third party to whom this Report is disclosed, whether disclosed in compliance with the preceding sentence of otherwise.
To the extent this Report expresses any recommendation or assessment on any aspect of risk, the recipient acknowledges that any such recommendation or assessment is an expression of Aon Benfields opinion only, and is not a statement of fact. Any decision to rely on any such recommendation or assessment of risk is entirely the responsibility of the recipient. Aon Benfield will not in any event be responsible for any losses that may be incurred by any party as a result of any reliance placed on any such opinion. The recipient acknowledges that this Report does not replace the need for the recipient to undertake its own assessment.
The recipient acknowledges that in preparing this Report Aon Benfield may have based analysis on data provided by the recipient and/or from third party sources. This data may have been subjected to mathematical and/or empirical analysis and modelling. Aon Benfield has not verified, and accepts no responsibility for, the accuracy or completeness of any such data. In addition, the recipient acknowledges that any form of mathematical and/or empirical analysis and modelling (including that used in the preparation of this Report) may produce results which differ from actual events or losses.
The Aon Benfield analysis has been undertaken from the perspective of a reinsurance broker. Consequently this Report does not constitute an opinion of reserving levels or accounting treatment. This Report does not constitute any form of legal, accounting, taxation, regulatory or actuarial advice.

55 Bishopsgate, London, EC2N 3BD t: +44 (0)20 7088 0044 | f: +44 (0)20 7575 7001 | www.aonbenfield.com
Copyright Aon Limited trading as Aon Benfield 2009 | #3979 - 4/2010