Living Wage Report - ISEAL Alliance · Methodology is internationally comparable as living wage...
53
Living Wage Report Rural Vietnam Soc Trang to Thai Binh Context Provided in the Seafood Processing Industry By: Research Center for Employment Relations (ERC) Shrimp-processing workers and their Family in Soc Trang province, March 2016. Photo courtesy of ERC. Series 1, Report 11 June 2017 Prepared for: The Global Living Wage Coalition Under the Aegis of Fairtrade International, Forest Stewardship Council, GoodWeave International, Rainforest Alliance, Social Accountability International, Sustainable Agriculture Network, and UTZ, in partnership with the ISEAL Alliance and Richard Anker and Martha Anker
Transcript of Living Wage Report - ISEAL Alliance · Methodology is internationally comparable as living wage...

Living Wage Report
Rural Vietnam
Soc Trang to Thai Binh Context Provided in the Seafood Processing Industry
By: Research Center for Employment Relations (ERC)
Shrimp-processing workers and their Family in Soc Trang province, March 2016. Photo courtesy of ERC.
Series 1, Report 11
June 2017
Prepared for: The Global Living Wage Coalition
Under the Aegis of Fairtrade International, Forest Stewardship Council, GoodWeave International, Rainforest Alliance, Social Accountability International, Sustainable Agriculture Network, and UTZ, in partnership with the ISEAL Alliance and Richard Anker and Martha Anker
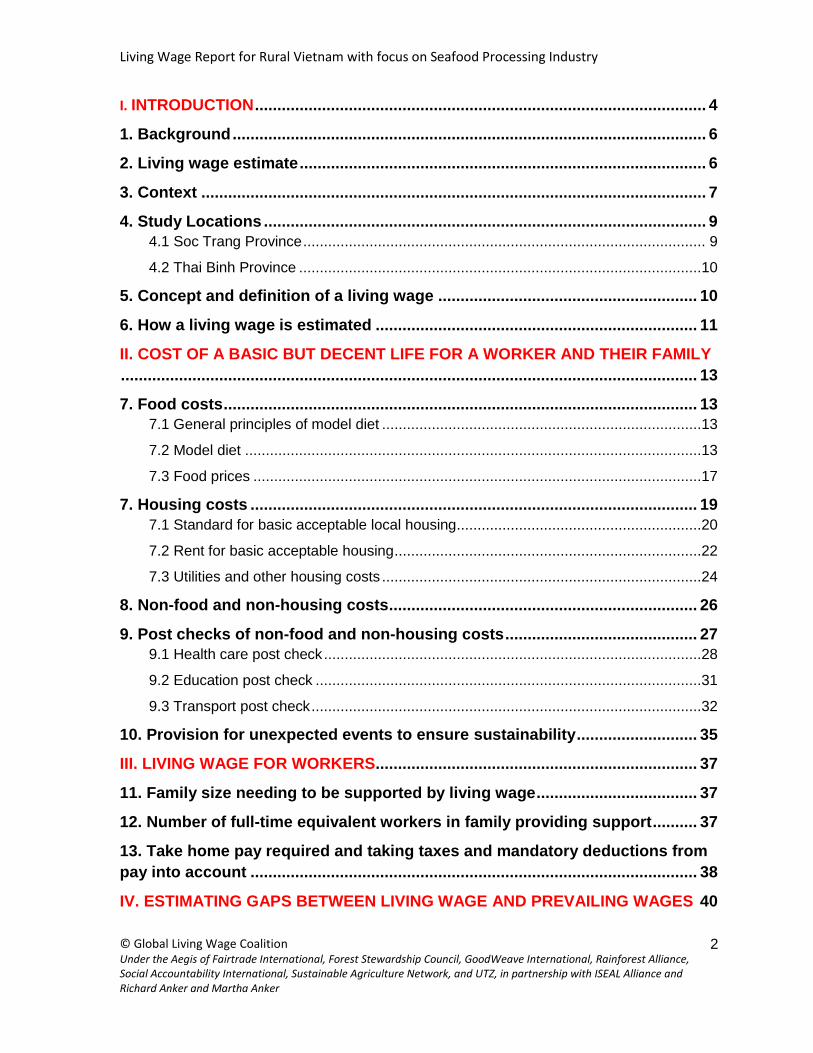
Living Wage Report for Rural Vietnam with focus on Seafood Processing Industry
© Global Living Wage Coalition Under the Aegis of Fairtrade International, Forest Stewardship Council, GoodWeave International, Rainforest Alliance, Social Accountability International, Sustainable Agriculture Network, and UTZ, in partnership with ISEAL Alliance and Richard Anker and Martha Anker
2
I. INTRODUCTION ..................................................................................................... 4
1. Background .......................................................................................................... 6
2. Living wage estimate ........................................................................................... 6
3. Context ................................................................................................................. 7
4. Study Locations ................................................................................................... 9
4.1 Soc Trang Province ................................................................................................. 9
4.2 Thai Binh Province .................................................................................................10
5. Concept and definition of a living wage .......................................................... 10
6. How a living wage is estimated ........................................................................ 11
II. COST OF A BASIC BUT DECENT LIFE FOR A WORKER AND THEIR FAMILY
................................................................................................................................. 13
7. Food costs .......................................................................................................... 13
7.1 General principles of model diet .............................................................................13
7.2 Model diet ..............................................................................................................13
7.3 Food prices ............................................................................................................17
7. Housing costs .................................................................................................... 19
7.1 Standard for basic acceptable local housing ...........................................................20
7.2 Rent for basic acceptable housing ..........................................................................22
7.3 Utilities and other housing costs .............................................................................24
8. Non-food and non-housing costs ..................................................................... 26
9. Post checks of non-food and non-housing costs ........................................... 27
9.1 Health care post check ...........................................................................................28
9.2 Education post check .............................................................................................31
9.3 Transport post check ..............................................................................................32
10. Provision for unexpected events to ensure sustainability ........................... 35
III. LIVING WAGE FOR WORKERS ........................................................................ 37
11. Family size needing to be supported by living wage .................................... 37
12. Number of full-time equivalent workers in family providing support .......... 37
13. Take home pay required and taking taxes and mandatory deductions from
pay into account .................................................................................................... 38
IV. ESTIMATING GAPS BETWEEN LIVING WAGE AND PREVAILING WAGES 40

Living Wage Report for Rural Vietnam with focus on Seafood Processing Industry
© Global Living Wage Coalition Under the Aegis of Fairtrade International, Forest Stewardship Council, GoodWeave International, Rainforest Alliance, Social Accountability International, Sustainable Agriculture Network, and UTZ, in partnership with ISEAL Alliance and Richard Anker and Martha Anker
3
14. Prevailing wages in SEAFOOD PROCESSING industry ............................... 40
14.1 Basic wage, cash allowances and bonuses, and overtime pay .............................41
14.2 In-kind benefits as partial payment of living wage .................................................43
15. Living wage in context and compared to other wages ................................. 46
15.1 Wage ladder .........................................................................................................46
15.2 Recent wage trends .............................................................................................48
16. Conclusions ..................................................................................................... 49
REFERENCES ........................................................................................................ 53
Living Wage Report for Rural Vietnam with focus on Seafood Processing Industry
© Global Living Wage Coalition Under the Aegis of Fairtrade International, Forest Stewardship Council, GoodWeave International, Rainforest Alliance, Social Accountability International, Sustainable Agriculture Network, and UTZ, in partnership with ISEAL Alliance and Richard Anker and Martha Anker
4
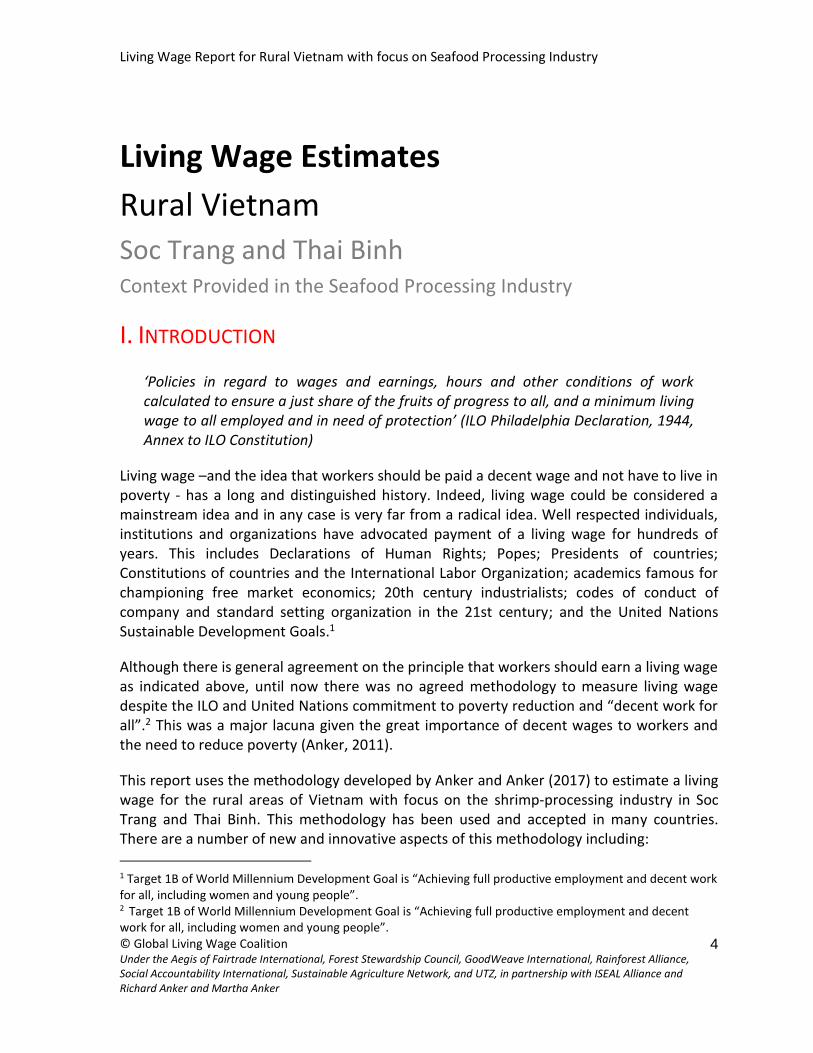
Living Wage Estimates
Rural Vietnam
Soc Trang and Thai Binh Context Provided in the Seafood Processing Industry
I. INTRODUCTION
‘Policies in regard to wages and earnings, hours and other conditions of work calculated to ensure a just share of the fruits of progress to all, and a minimum living wage to all employed and in need of protection’ (ILO Philadelphia Declaration, 1944, Annex to ILO Constitution)
Living wage –and the idea that workers should be paid a decent wage and not have to live in poverty - has a long and distinguished history. Indeed, living wage could be considered a mainstream idea and in any case is very far from a radical idea. Well respected individuals, institutions and organizations have advocated payment of a living wage for hundreds of years. This includes Declarations of Human Rights; Popes; Presidents of countries; Constitutions of countries and the International Labor Organization; academics famous for championing free market economics; 20th century industrialists; codes of conduct of company and standard setting organization in the 21st century; and the United Nations Sustainable Development Goals.1
Although there is general agreement on the principle that workers should earn a living wage as indicated above, until now there was no agreed methodology to measure living wage despite the ILO and United Nations commitment to poverty reduction and “decent work for all”.2 This was a major lacuna given the great importance of decent wages to workers and the need to reduce poverty (Anker, 2011).
This report uses the methodology developed by Anker and Anker (2017) to estimate a living wage for the rural areas of Vietnam with focus on the shrimp-processing industry in Soc Trang and Thai Binh. This methodology has been used and accepted in many countries. There are a number of new and innovative aspects of this methodology including:
1 Target 1B of World Millennium Development Goal is “Achieving full productive employment and decent work for all, including women and young people”. 2 Target 1B of World Millennium Development Goal is “Achieving full productive employment and decent work for all, including women and young people”.

Living Wage Report for Rural Vietnam with focus on Seafood Processing Industry
© Global Living Wage Coalition Under the Aegis of Fairtrade International, Forest Stewardship Council, GoodWeave International, Rainforest Alliance, Social Accountability International, Sustainable Agriculture Network, and UTZ, in partnership with ISEAL Alliance and Richard Anker and Martha Anker
5
Transparency with assumptions used to estimate living wage clearly indicated. We feel that it is important for stakeholders and others to understand how living wage benchmarks are estimated and what workers and their families would be able to afford if they earned a living wage. Typical other methodologies are not transparent as regards indicating what it means to live on less than a living wage.
Living wage is based on normative standards for nutritious diet, healthy housing, adequate health care, and education for children. This normative basis in the Anker methodology contrasts to the typical methodology that only ensures that workers and families are able to afford a sufficient number of calories.
Living wage is time and place specific so that the living wage is seen as realistic for the location for which it is estimated. This means that living wage increases with economic development and rising incomes. This also means that separate living wage benchmarks are necessary for rural and urban areas.
Wages used to compare current wages paid by establishments to living wage includes all relevant forms of remuneration including fair and reasonable values for in kind benefits and cash allowances while excluding overtime.
Methodology is internationally comparable as living wage estimates are based on the same principles everywhere.
Methodology is universal and relevant for all countries in the world (not just lower income countries).
Methodology is practical and relatively inexpensive, as it uses a judicious mix of critical analyses of secondary data and rapid assessment methods for collection of primary data.
This report has 4 sections. Section I introduces the Anker methodology and how it is applied to estimate the living wage.
Section II explores the food cost, housing cost, and non-food and non-housing cost needed to ensure decent living standards for a reference size family by using the national survey data and post checks based on new field research. At the end of this section, an estimate of living cost for a reference family is presented.
Section III estimates the number of full-time workers in a reference family, the net living wage, compulsory deductions from pay and the gross wage a worker should be paid to ensure a living wage.
The last section calculates the prevailing wages of shrimp-processing workers in Soc Trang and estimates the gaps between the living wage benchmarks and the prevailing wages.

Living Wage Report for Rural Vietnam with focus on Seafood Processing Industry
© Global Living Wage Coalition Under the Aegis of Fairtrade International, Forest Stewardship Council, GoodWeave International, Rainforest Alliance, Social Accountability International, Sustainable Agriculture Network, and UTZ, in partnership with ISEAL Alliance and Richard Anker and Martha Anker
6
1. BACKGROUND
This report was commissioned by Superunie, in partnership with Foppen Eal and Salmon and FairFood International for the Global Living Wage Coalition. The Global Living Wage Coalition (GLWC) brings together Fairtrade International, Forest Stewardship Council (FSC), GoodWeave International, Rainforest Alliance (RA), Social Accountability International (SAI), Sustainable Agriculture Network (SAN), and UTZ, in partnership with the ISEAL Alliance, and world-remowned living wage experts Richard Anker and Martha Anker. The members and partners of the GLWC share the mission of seeing continuous improvements in workers' wages, in the farms, factories and supply chains participating in their respective certification systems and beyond, and come together with the long-term goal for workers to be paid a living wage. Each living wage benchmark commissioned by the Coalition is made public to further this aim and to increase the opportunity for collaboration toward payment of a Living Wage.
The Global Living Wage Coalition sees the calculation and release of living wage benchmarks as the first step in a long-term process. The Coalition does not believe the benchmarks will or should supplant collective bargaining rights, but will serve as a replicable tool to support social dialogue between workers and employers. For many developing country producers, wages form an important part of the costs of production. As such, it is important to introduce wage requirements in the standards systems of Coalition members only in combination with dialogue and involvement of actors at all levels of the supply chain.
The work of the Global Living Wage Coalition, including activities leading to this living wage study, is further supported by the Ministry of Foreign Affairs of the Netherlands, Directorate-General for International Cooperation (DGIS).
2. LIVING WAGE ESTIMATE
Our estimate of a living wage for rural Vietnam for March 2016 is VND 3,991,841 (USD 181)3 per month, and therefore VND 153,532 (USD 7.0) per workday.
The net living wage (take-home pay) after mandatory deductions is VND 3,572,698 (USD 162)4 per month, and therefore VND 137,411 (USD 6.25) per workday.
In order to estimate the living wage for the rural areas of Vietnam, we conducted research in rural areas of two provinces: Soc Trang, a province in the Mekong Delta southwest of Vietnam and Thai Binh, a province in the Red River Delta in the northeast of the country. Both provinces share some important commonalities: their populations mostly live in the
3 The exchange rate used here is 1 USD=22,200 VND.The actual exchange rates during the research period fluctuated from 22,200 VND to 22,400 VND for 1 USD. 4 The exchange rate used here is 1 USD=22,200 VND although the actual exchange rates during the research period fluctuated from 22,200 VND to 22,400 VND for 1 USD.
Living Wage Report for Rural Vietnam with focus on Seafood Processing Industry
© Global Living Wage Coalition Under the Aegis of Fairtrade International, Forest Stewardship Council, GoodWeave International, Rainforest Alliance, Social Accountability International, Sustainable Agriculture Network, and UTZ, in partnership with ISEAL Alliance and Richard Anker and Martha Anker
7
rural areas and agriculture makes up more than half of the provincial GDP. However, both provinces have developed export-oriented manufacturing and food processing, industries which include shrimp-processing in Soc Trang and garments in Thai Binh.
We averaged the local costs we found in these two areas to obtain our estimate of living costs and a living wage for rural Vietnam. These estimates should be seen as providing approximate estimates of living costs and a living wage for rural Vietnam. First, these two areas are small, and Vietnam is a large country and so they may not be fully representative of rural Vietnam in its entirety. Second, we found that food costs were significantly different in the two areas as they tended to be considerably lower in Soc Trang compared to Thai Binh, although we found that other costs were similar. This means it would be worthwhile to undertake additional future work on living costs and living wages in other rural areas of Vietnam to find out variability in costs of living across different rural areas of Vietnam.
The study in the south of the country focused on workers employed by shrimp-processing factories and who are eligible to the labour rights provided for by the Vietnam Labour Code. Over 80% of the shrimp-processing workers in Soc Trang are local people who live with their families in their own houses. Apart from the income from the factories, other family members of the workers may be working in agriculture or aquaculture. Still, the income from the factory job is often the most important livelihood for the whole family.
Since 2006, the Government of Vietnam has significantly increased the minimum wages each year with the real minimum wage increased by more than 10%/year on average in the past decade.5 And with the current weakness of the trade unions and the absence of genuine collective bargaining in Vietnam in general, the minimum wages are being used as the basic salary paid to the rank-and-file workers.6 Our gross living wage is 56.4% higher than the minimum wage applicable for Region 4 (that is for rural areas such as in Soc Trang and Thai Binh). On the other hand, our living wage is only 12.8% higher than the average monthly prevailing wage in the shrimp processing sector at the time our fieldwork was conducted because most workers receive cash allowances and in-kind beneifts that are of significant value in addition to their basic wage.
3. CONTEXT
The Socialist Republic of Vietnam is the eastern-most country on the Indochina Peninsula in Southeast Asia. With a population of 94.1 million, as of March 20167, it is the world's 14th most populous country, and the eighth most populous Asian country. According to the
5 ILO Global Wage Report 2015. 6 For a detailed discussion of freedom of association and collective bargaining in the garment industry of Vietnam, see the 2015 Vietnam Country Study of Fair Wear Foundation (Link: http://www.fairwear.org/ul/cms/fck-uploaded/documents/countrystudies/othercountries/vietnam/CountryStudyVietnam2015.pdf). 7 http://www.worldometers.info/world-population/vietnam-population/.

Living Wage Report for Rural Vietnam with focus on Seafood Processing Industry
© Global Living Wage Coalition Under the Aegis of Fairtrade International, Forest Stewardship Council, GoodWeave International, Rainforest Alliance, Social Accountability International, Sustainable Agriculture Network, and UTZ, in partnership with ISEAL Alliance and Richard Anker and Martha Anker
8
UNDP Human Development Report, Vietnam’s Human Development Index (HDI) value for 2013 was 0.638 which is in the medium human development category positioning the country at 121 out of 187 countries and territories. Compared with regional countries, Vietnam’s HDI remains lower than those for China and Indonesia.
The economic reform (‘Doi Moi’) launched in 1986 has transformed Vietnam from one of the poorest countries in the world, with per capita income below US $100, to a lower middle-income country within a quarter of a century with per capita income of over US $2,000 by the end of 2014. Over the last few decades, Vietnam has made remarkable progress in reducing poverty and has become a lower-middle income country.8
The Multidimensional Poverty Index (MPI), which identifies multiple deprivations in the same households in the areas of education, health and living standards, calculates the share of the population that is multi-dimensionally poor, adjusted by the intensity of the deprivations. The MPI gave Vietnam a score of 6.4 in 2014. According to this index, 6.4% of the population is multidimensionally poor, while an additional 8.7% is near multidimensional poverty.
Table 3.1 provides economic and social indicators for Vietnam. The multidimensional poverty headcount was 10.5 percentage points lower than income poverty rate, which implies that individuals living below the income poverty line may have access to non-income resources.
Table 3.1: Economic and Social Indicators for Vietnam (2015)
Indicators Vietnam Soc Trang Thai Binh
Population 93.4 million 1.3 million 1.8 million
Working population .73 million 1.1 million
GDP per capita USD 2,109 USD 1,600 USD 1,400
Human Development Index 0.666 (Ranking: 116)
GSO-World Bank poverty headcount9
20% (rural) 27%10 19%
GSO-World Bank extreme poverty headcount
6% (rural) 7% 3%
8 World Bank database (Link: http://data.worldbank.org/country/vietnam). 9 http://www.worldbank.org/mapvietnam/. 10 http://www.worldbank.org/mapvietnam/.

Living Wage Report for Rural Vietnam with focus on Seafood Processing Industry
© Global Living Wage Coalition Under the Aegis of Fairtrade International, Forest Stewardship Council, GoodWeave International, Rainforest Alliance, Social Accountability International, Sustainable Agriculture Network, and UTZ, in partnership with ISEAL Alliance and Richard Anker and Martha Anker
9
Indicators Vietnam Soc Trang Thai Binh
Inequality (Gini Coeficient) 38.7
4. STUDY LOCATIONS
As Soc Trang and Thai Binh are typical provinces for the southern and northern regions of Vietnam respectively, they presented a good sample for the research team to estimate the living wage for the rural areas of Vietnam as a whole.
4.1 Soc Trang Province
Soc Trang is a province in Mekong Delta, around 230km to the southwest of Ho Chi Minh city. The total area of the province is 3,223 km², and a population of approximately 1,303,700 in 2011.11 Apart from the Kinh majority, the Khmer accounts for 30% of households in the province. The Khmer concentrates mostly in the rural areas of the province, and many of them are employed in shrimp farms and shrimp-processing factories.
Soc Trang has a coastline of 72km, so it is rich in agro and aqua resources. Shrimp-farming and shrimp-processing industry plays an important role in the provincical economy. Soc Trang has 65,000 hectares of aquaculture, among which 51,000 hectares are for shrimp-farming. The total catch of shrimp in 2015 of Soc Trang accounted for 6.2% of the national harvest. By the end of 2011, the agro-forestry-aqua sector had made up 52.35% of the provincial economy, industrial and construction sector 18.35% and trade and service sector 29.30%.12
Soc Trang also has over 50 exporting shrimp-processing factories with the total export value of USD 500 million in 2015.13
11 https://en.wikipedia.org/wiki/S%C3%B3c_Tr%C4%83ng_Province. 12http://www.soctrang.gov.vn/wps/portal/stipc/!ut/p/c4/04_SB8K8xLLM9MSSzPy8xBz9CP0os3gLR1dvZ09LYwODAEs3A09HH1OXQAMPw1BfA_2CbEdFAJ_oxA4!/?PC_7_8AEKCI930O1D90IQE9NLC12SL1_WCM_CONTEXT=/wps/wcm/connect/stipc/stipcsite/tintucsukien/kinhtexahoi/emerging+economic+potential+in+soc+trang. 13 http://www.thuysanvietnam.com.vn/soc-trang-dat-kim-ngach-xuat-khau-thuy-san-gan-500-trieu-usd-article-9784.tsvn.
Living Wage Report for Rural Vietnam with focus on Seafood Processing Industry
© Global Living Wage Coalition Under the Aegis of Fairtrade International, Forest Stewardship Council, GoodWeave International, Rainforest Alliance, Social Accountability International, Sustainable Agriculture Network, and UTZ, in partnership with ISEAL Alliance and Richard Anker and Martha Anker
10
Despite the growth of aquaculture and the seafood-processing industry, the poverty rate of Soc Trang remains higher than the national poverty rate (27% compared to 20%).
4.2 Thai Binh Province
Thai Binh is a coastal eastern province in the Red River Delta region (North of Vietnam), around 100km to the southeast of Hanoi. With a population of 1.8 million people, 90% of the local people live in the rural areas. Aquaculture is also a major economic sector for Thai Binh with the focus on fish farming.
In the past decade, Thai Binh has attracted investment in export-oriented manufacturing industries, especially garment, footwear, and food processing. In 2015, there were 30 exporting garment companies in the province.
However, Thai Binh is still a poor rural province with the GDP per capita of USD 1,400, much lower than the national figure. The poverty rate of the province is 19%, slightly lower than the national average while the extreme poverty rate is 3%.
5. CONCEPT AND DEFINITION OF A LIVING WAGE
A main idea behind the Anker methodology is that living costs differ within the same country. So the methodology avoids any attempt to come up with a single estimate for living wage, especially for such a large country as Vietnam.
There is general agreement on the definition of living wage, and the methodology used in this report (Anker and Anker 2017) provides a reliable way to measure it. A living wage is a right according to the international community, is place and time specific, needs to be sufficient for a basic and decent standard of living, and needs to be earned during regular working hours. Following from these assumptions, a common definition was agreed upon by the Global Living Wage Coalition members which include seven standard setting organisations in partnership with ISEAL and Richard Anker and Martha Anker:
Remuneration received for a standard work week by a worker in a particular place sufficient to afford a decent standard of living for the worker and her or his family. Elements of a decent standard of living include food, water, housing, education, health care, transport, clothing, and other essential needs including provision for unexpected events
So it is no longer acceptable to argue on the grounds of absence of a reliable methodology and concrete definition as reasons for companies not to pay a living wage. The methodology and definition are already in place and this report is further evidence of this new reality.
Living Wage Report for Rural Vietnam with focus on Seafood Processing Industry
© Global Living Wage Coalition Under the Aegis of Fairtrade International, Forest Stewardship Council, GoodWeave International, Rainforest Alliance, Social Accountability International, Sustainable Agriculture Network, and UTZ, in partnership with ISEAL Alliance and Richard Anker and Martha Anker
11
However, paying a living wage may require a period of time before workers are able to increase performance and changes across the value chain are undertaken in order to redistribute revenues between its main actors.
6. HOW A LIVING WAGE IS ESTIMATED
The methodology used in this report is based on the following principles: transparency in the process of calculating costs; normative basis for diet and housing standards (both international and national); mix of fieldwork and secondary data in order to make it practical; and estimates of all relevant forms of worker pay to estimate prevailing wages.
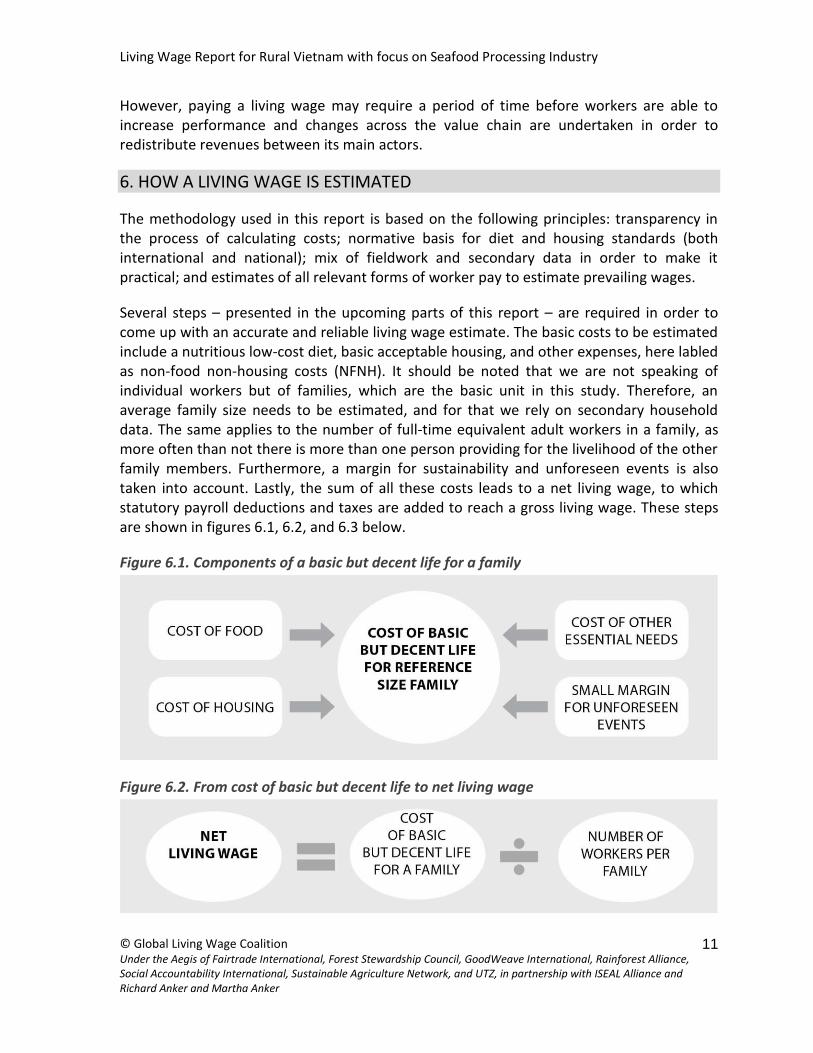
Several steps – presented in the upcoming parts of this report – are required in order to come up with an accurate and reliable living wage estimate. The basic costs to be estimated include a nutritious low-cost diet, basic acceptable housing, and other expenses, here labled as non-food non-housing costs (NFNH). It should be noted that we are not speaking of individual workers but of families, which are the basic unit in this study. Therefore, an average family size needs to be estimated, and for that we rely on secondary household data. The same applies to the number of full-time equivalent adult workers in a family, as more often than not there is more than one person providing for the livelihood of the other family members. Furthermore, a margin for sustainability and unforeseen events is also taken into account. Lastly, the sum of all these costs leads to a net living wage, to which statutory payroll deductions and taxes are added to reach a gross living wage. These steps are shown in figures 6.1, 6.2, and 6.3 below.
Figure 6.1. Components of a basic but decent life for a family
Figure 6.2. From cost of basic but decent life to net living wage
Living Wage Report for Rural Vietnam with focus on Seafood Processing Industry
© Global Living Wage Coalition Under the Aegis of Fairtrade International, Forest Stewardship Council, GoodWeave International, Rainforest Alliance, Social Accountability International, Sustainable Agriculture Network, and UTZ, in partnership with ISEAL Alliance and Richard Anker and Martha Anker
12
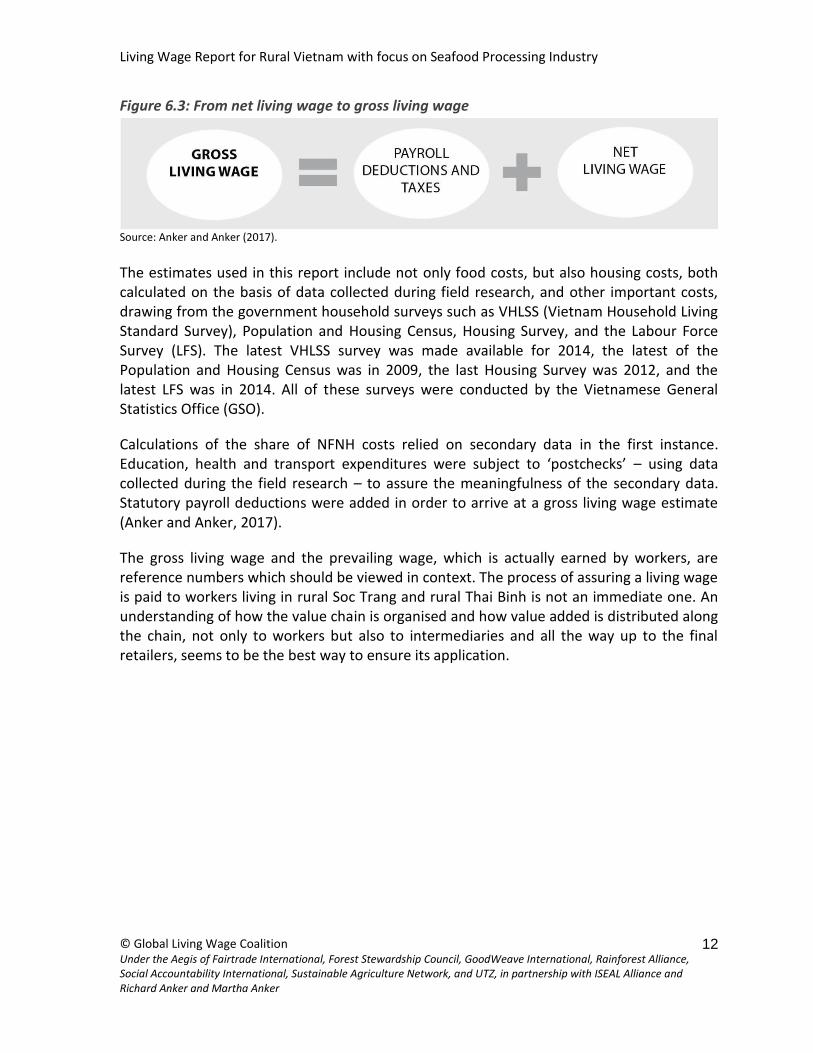
Figure 6.3: From net living wage to gross living wage
Source: Anker and Anker (2017).
The estimates used in this report include not only food costs, but also housing costs, both calculated on the basis of data collected during field research, and other important costs, drawing from the government household surveys such as VHLSS (Vietnam Household Living Standard Survey), Population and Housing Census, Housing Survey, and the Labour Force Survey (LFS). The latest VHLSS survey was made available for 2014, the latest of the Population and Housing Census was in 2009, the last Housing Survey was 2012, and the latest LFS was in 2014. All of these surveys were conducted by the Vietnamese General Statistics Office (GSO).
Calculations of the share of NFNH costs relied on secondary data in the first instance. Education, health and transport expenditures were subject to ‘postchecks’ – using data collected during the field research – to assure the meaningfulness of the secondary data. Statutory payroll deductions were added in order to arrive at a gross living wage estimate (Anker and Anker, 2017).
The gross living wage and the prevailing wage, which is actually earned by workers, are reference numbers which should be viewed in context. The process of assuring a living wage is paid to workers living in rural Soc Trang and rural Thai Binh is not an immediate one. An understanding of how the value chain is organised and how value added is distributed along the chain, not only to workers but also to intermediaries and all the way up to the final retailers, seems to be the best way to ensure its application.
Living Wage Report for Rural Vietnam with focus on Seafood Processing Industry
© Global Living Wage Coalition Under the Aegis of Fairtrade International, Forest Stewardship Council, GoodWeave International, Rainforest Alliance, Social Accountability International, Sustainable Agriculture Network, and UTZ, in partnership with ISEAL Alliance and Richard Anker and Martha Anker
13
SECTION II
II. COST OF A BASIC BUT DECENT LIFE FOR A WORKER AND THEIR
FAMILY
7. FOOD COSTS
Food is the most important expense of households in developing countries. It is estimated that households in low income countries spend around 48% of all their spending on food on average (Anker 2011). Therefore estimating food costs is a very important part of estimating a living wage. This section will estimate food costs using a model diet that is nutritious in more than only calories, low in cost for a nutritious diet, consistent with local food preferences and based on local food prices found in a local market survey. This section includes (i) general principles used to develop the model diet, (ii) description of the model diet, and (iii) food prices used to estimate cost of the model diet.
7.1 General principles of model diet
Development of a model diet was guided by the following principles. The model diet should be:
Nutritious according to national and international standards with sufficient number of calories, proteins, fats, carbohydrates and fruits and vegetables
Follow local food habits because workers should be able to afford foods that they consider palatable, as food is part of history and culture, and people will not eat foods that are not considered acceptable
Whenever possible, low-cost food items and brands should be chosen as the main idea is a healthy but basic diet that is affordable. The total food costs, therefore, set a sort of threshold level for these expenditures, below which a wage cannot be considered a living wage
Consistent with the country’s development level
When possible, the number of grams of food should be expressed in portions to be easy to understand by laypersons.
7.2 Model diet
In order to estimate food costs, several steps were taken based on the Anker methodology. First, in order to obtain a model diet, we started with the diet of households at the 30th percentile of the household expenditure distribution in the rural areas in the VHLSS 2012.

Living Wage Report for Rural Vietnam with focus on Seafood Processing Industry
© Global Living Wage Coalition Under the Aegis of Fairtrade International, Forest Stewardship Council, GoodWeave International, Rainforest Alliance, Social Accountability International, Sustainable Agriculture Network, and UTZ, in partnership with ISEAL Alliance and Richard Anker and Martha Anker
14
The second step was to choose the specific food items for each food group that make up the basic diet of the population of rural areas, for which we benefited from interviews with shrimp-processing workers and their families, and local food market surveys in the rural district of Tran De in Soc Trang province and the rural district of Dong Hung in Thai Binh province.
The required number of calories for each person was estimated using the Excel calorie requirements program from Anker and Anker (2017). Average number of calories per person in the reference family was estimated using the following information.
i. The average height of adults, as reported in the Vietnam National Institute of
Nutrition, of 1.64m for men and 1.53m for women, on average, for rural areas in
Vietnam.
ii. The reference family size of 4 people, 2 adults and 2 children, as explained in section
11.
iii. Moderate physical activity levels for both adults and children in the reference family.
This results in an estimated 2348 calories required per person per day.
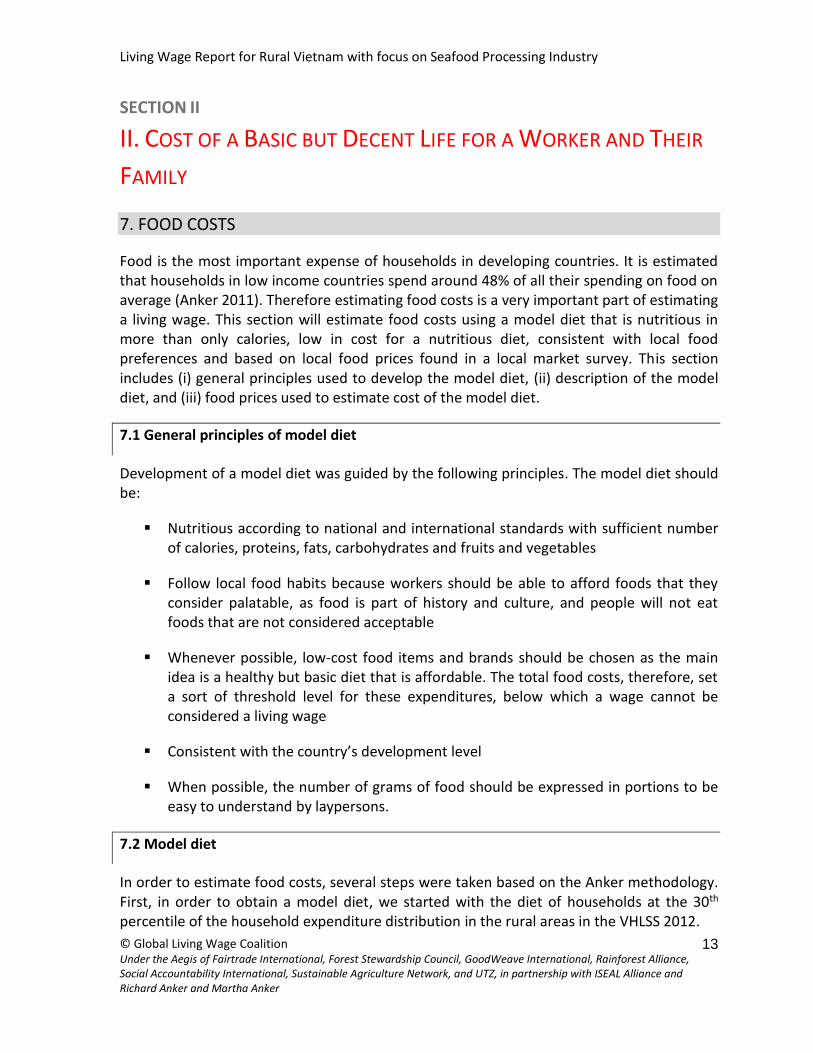
The model diet was also designed so that it has sufficient nutrition as regards the number of grams of proteins, fats, carbohydrates, and fruits and vegetables. Table 2 below presents total edible grams per person in the family per day for each food item in the model diet. Inedible parts of foods such as skins, seeds, bones, and shells were excluded from total edible grams. Calculations of the edible percentage of each food item were based on data from the USDA (United States Department of Agriculture, 2014) and the Vietnam Food Composition Table published by Vietnam Ministry of Health in 2007. Inedible parts of foods were, of course, included when we collected local food prices through a survey of local markets.
We chose the least expensive acceptable food items and brands for each food group. For instance, both people in Soc Trang and Thai Binh prefer fish to pork and beef as fish is cheaper and more available compared to beef and pork (and we used average price of tilapia and red snapper, two less expensive fishes). Both eat a lot of vegetables and fruits. The local people have a wide variety of vegetables in their every day meal including morning glory, mustard green, and tomato. These are local vegetables and less expensive. Bananas and watermelon are included in the model diet both because they are the lowest cost and most commonly eaten fruits in both Soc Trang and Thai Binh.
For milk, children aged over 1 years old drink UHT milk from boxes of 110ml and 180ml. UHT milk is relatively expensive for workers. Drinking milk is not a habit for adults in Vietnam. Therefore, we assumed one box of 180ml of milk per day per child.
The diet of rural southerners in Soc Trang and rural northerners in Thai Binh are different in certain food preferences. For instance, rural northerners eat potato frequently in their daily

Living Wage Report for Rural Vietnam with focus on Seafood Processing Industry
© Global Living Wage Coalition Under the Aegis of Fairtrade International, Forest Stewardship Council, GoodWeave International, Rainforest Alliance, Social Accountability International, Sustainable Agriculture Network, and UTZ, in partnership with ISEAL Alliance and Richard Anker and Martha Anker
15
meals but rural southerners do not (potato was not found in the markets in Soc Trang). Rural southerners tend to put more sugar and oil in food than rural northerners. In order to create a common model diet for rural areas of Vietnam that takes into account variations in different areas, we included food items that are preferred in one of our two provinces but not the other such as potato; however, we use only half of the quantity for such food items.
Since food items in general are more expensive in Thai Binh than in Soc Trang, we averaged the prices to obtain a general estimate of food prices for rural areas of Vietnam.
Table 7.1: Model diet for Soc Trang and Thai Binh
Food items Edible grams
Purchased grams
Cost per kg
edible grams X cost per kilo/1,000
Comments (Diet is for average person in family of 5)
Plain rice 415 415 10,000 4,152
Sticky rice 35 35 13,500 468
Noodles 9 9 50,000 429
Bread 6 6 20,000 114
Potato 15 20 10,625 213
Tofu 17 17 19,861 333
Peanuts 14 14 55,000 786
UHT milk 90 90 36,679 3,301 1 box of UHT milk (180 ml) for child
Eggs (duck) 51 58 32,679 1,894 1 egg per day
Pork 18 21 65,000 1,376 6 fish or meat meals per week
Fish 53 88 25,000 2,208
Morning glory
70 140 12,917 1,808
Tomato 70 77 8,708 670
Mustard green
70 88 6,917 605
Banana 50 78 5,857 458
Watermelon 50 96 7,000 673
Living Wage Report for Rural Vietnam with focus on Seafood Processing Industry
© Global Living Wage Coalition Under the Aegis of Fairtrade International, Forest Stewardship Council, GoodWeave International, Rainforest Alliance, Social Accountability International, Sustainable Agriculture Network, and UTZ, in partnership with ISEAL Alliance and Richard Anker and Martha Anker
16
Food items Edible grams
Purchased grams
Cost per kg
edible grams X cost per kilo/1,000
Comments (Diet is for average person in family of 5)
Oil 20 20 22,500 450
Sugar 16 16 16,000 256
Tea 50 50 13,750 688 Fresh tea leaves. 2 big cups per day.
Fish sauce 16 16 20,083 321
Total cost not including additional costs 21,203
Total cost including additional costs 24,171
1% added for salt, spices, sauces, and condiments 3% added for spoilage and waste 10% added for variety
According to WHO/FAO (2003), a healthy diet is one with the following distribution of macronutrients: 10-15% of calories from proteins (with this percentage around 11-12% in lower-middle income countries according to Anker and Anker 2017); 55-75% of calories from carbohydrates; and 15-30% of calories from fats. Figure 7.1 presents the distribution of of our model diet, which is within the above-mentioned intervals.

Living Wage Report for Rural Vietnam with focus on Seafood Processing Industry
© Global Living Wage Coalition Under the Aegis of Fairtrade International, Forest Stewardship Council, GoodWeave International, Rainforest Alliance, Social Accountability International, Sustainable Agriculture Network, and UTZ, in partnership with ISEAL Alliance and Richard Anker and Martha Anker
17
Figure 7.1: Distribution of macronutrients in rural model diet (in%)
7.3 Food prices
For Soc Trang, we collected food prices in Tran De district and for Thai Binh, prices were collected in Dong Hung district. In each district, we visited different types of markets where workers often shop. There are typically 3 types of markets in Soc Trang: the port markets where fresh catch from the sea (fish, shell, shrimp, etc.) is sold at lower price; the central markets where wholesale and retail of almost every food item are found; and spontaneous markets which comprise various street vendors gathering outside factories. We collected food prices from 4 markets: 1 port market, 2 central markets and 1 spontaneous market.
In Thai Binh, the workers and their families basically shop at 3 types of markets: (i) central markets; (ii) spontaneous markets outside factories; and (iii) convenience stores that sell non-perishable goods. In Thai Binh, we collected food prices from 4 markets: 2 central markets, 2 spontaneous markets, and 4 convenience stores near where workers and their families live.
The food prices in Thai Binh are generally more expensive than in Soc Trang. Therefore, we used the average of the food prices of the same food items we found in the two provinces.
Fats15.3%
Proteins11.2%
Carbohydrates73.5%

Living Wage Report for Rural Vietnam with focus on Seafood Processing Industry
© Global Living Wage Coalition Under the Aegis of Fairtrade International, Forest Stewardship Council, GoodWeave International, Rainforest Alliance, Social Accountability International, Sustainable Agriculture Network, and UTZ, in partnership with ISEAL Alliance and Richard Anker and Martha Anker
18
Food prices were collected in March 2016. March food prices are reasonably representative of food prices throughout the year.14
Table 7.2: Total food cost for a family
Food Costs
Food cost per person per day 24,604 ($1.11)
Total food costs for a family of four people per day
98,416
Monthly food costs for a family 2,993,487
14 Some important food prices in Soc Trang can be found in the official website of Soc Trang government: https://www.soctrang.gov.vn/wps/portal/!ut/p/c5/04_SB8K8xLLM9MSSzPy8xBz9CP0os3gLR1dvZ09LYwOL4GAnA08TRwsfvxBDR2MvE6B8pFm8s7ujh4m5j4GBv1GYgYGRn2lwoEFosLGBpzEB3eEg-_DrB8kb4ACOBvp.- Hvm5qfoFuREGWSaOigD_akWv/dl3/d3/L3dDb0EvUU5RTGtBISEvWUZSdndBISEvNl84QUVLQ0k5MzA4U1NCMEk0QThMTlQxMlZRMw!!/

Living Wage Report for Rural Vietnam with focus on Seafood Processing Industry
© Global Living Wage Coalition Under the Aegis of Fairtrade International, Forest Stewardship Council, GoodWeave International, Rainforest Alliance, Social Accountability International, Sustainable Agriculture Network, and UTZ, in partnership with ISEAL Alliance and Richard Anker and Martha Anker
19
7. HOUSING COSTS
Housing is usually the second biggest expense for workers in developing countries (after food). Therefore, it is important that the cost of decent housing for a worker and his/her family is well measured when a living wage is estimated.
In this study, housing costs are estimated by summing up the costs of rent for an acceptable dwelling, utility costs, and possibly minor repairs and maintenance. The Anker methodology differs from the usual methodology to measure living wages and poverty lines where all non-food costs (including housing costs) are estimated together, based on actual household expenditure data from a national household expenditure survey. The approach in the Anker methodology has several advantages:
First, the Anker methodology ensures that sufficient funds are available for workers to be able to afford healthy housing for their family and so avoids the problem facing the typical methodology that replicates the substandard housing found in many developing countries;
Second, this approach avoids the problem that many national statistical offices do not properly measure the cost and value of owner occupied housing and so cause housing expenditure and all non-food costs to be underestimated (which is a problem with using Vietnam statistics to measure housing cost);
Third, this approach allows for much better estimates of living wages for rural and urban areas as the local housing costs are measured directly which results in better estimates of living costs for rural and urban areas.

Living Wage Report for Rural Vietnam with focus on Seafood Processing Industry
© Global Living Wage Coalition Under the Aegis of Fairtrade International, Forest Stewardship Council, GoodWeave International, Rainforest Alliance, Social Accountability International, Sustainable Agriculture Network, and UTZ, in partnership with ISEAL Alliance and Richard Anker and Martha Anker
20
The field research leads to the final housing cost estimate and amounts for rent and utilities as well as what percentage of all costs are accounted for by housing for a reference size family. This percentage is then compared to percentage for housing according to the national data.
7.1 Standard for basic acceptable local housing
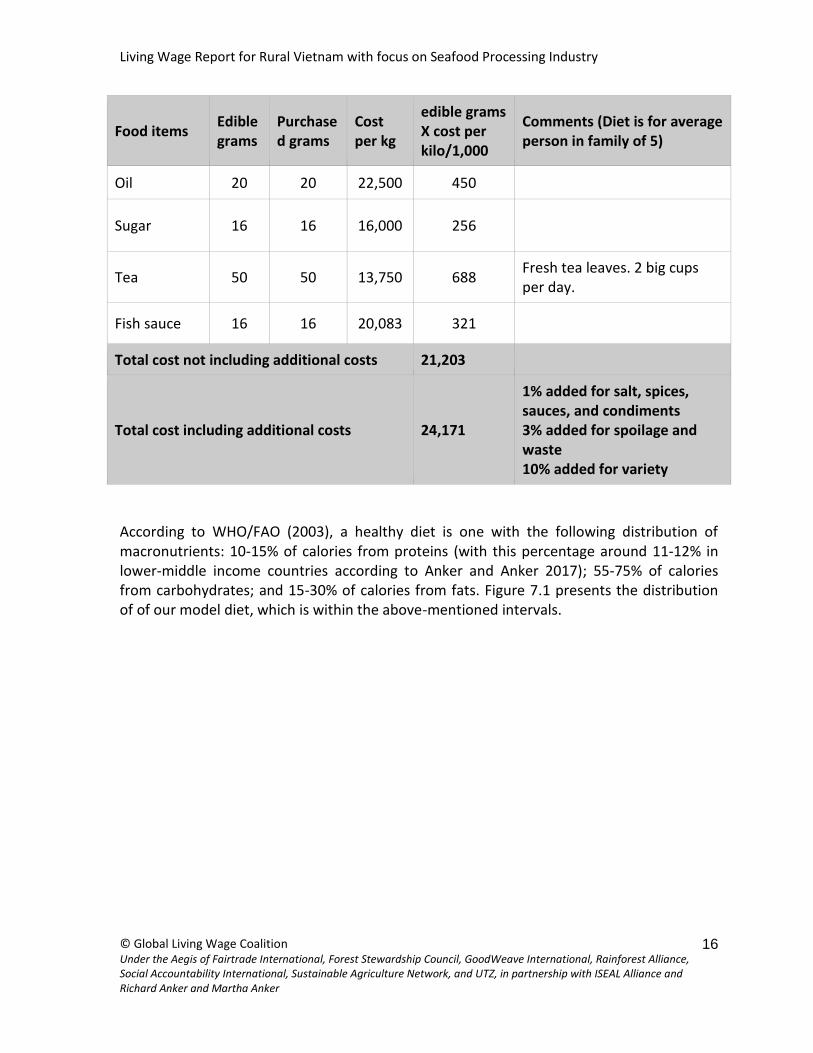
In order to estimate the cost of local housing, we used both international and Vietnamese minimum standards for adequate housing (the 2005 Housing Law). Additionally, we also considered the actual housing conditions of Vietnam rural areas and Soc Trang from the 2012 VHLSS (see Table 7.1).
Table 7.1: Current housing conditions of rural Vietnam, Soc Trang and international
minimum standards
Housing Conditions Rural (%) Soc Trang (%) International Minimum
Standards (Anker and Anker
2017)
Structure Durable structure (protection against elements) Permanent floor above ground
Permanent 24.5 10.1
Semi permanent 64.7 59.2
Temporary 10.8 30.6
Roof Permanent roof without leaks Extreme temperature not acceptable
Corrugated Iron 42.5 71.9
Concrete/tiles 53.3 8.9
Thatched 3.9 19.3
Walls Permanent wall
Cement/stone/brick 75.1 45.0
Wooden planks/iron sheets
13.2 16.9
Lighting At least 1 window per room Electricity 96.6 99.9
Paraffin/kerosene/Gas
1.7 0.1
Water Safe water in or near house Running water in
house
12.4 N/I
Public tap 10.5 N/I
Borehole/tube well 29.9 N/I
Protected well 22.7 N/I
Unprotected well 4.0 N/I
Toilet and sewage disposal Toilet in or near house shared
Living Wage Report for Rural Vietnam with focus on Seafood Processing Industry
© Global Living Wage Coalition Under the Aegis of Fairtrade International, Forest Stewardship Council, GoodWeave International, Rainforest Alliance, Social Accountability International, Sustainable Agriculture Network, and UTZ, in partnership with ISEAL Alliance and Richard Anker and Martha Anker
21
Housing Conditions Rural (%) Soc Trang (%) International Minimum
Standards (Anker and Anker
2017)
Flush toilet 43.5 26.7 by few families
Ventilation At least 1 window per room Minimal indoor air pollution from cooking
Space
Min. 30m2/household15
Approximately 30m2
Ceiling at least 2 meters
Note: N/I indicates not indicated.
Upon comparing the local conditions, the national and international minimum acceptable standards housing, we decided to apply the following standards for this study:
Housing should provide physical and structural safety and protection from the cold, heat, humidity, rain, wind, flood and other health threats
Walls should be made of brick, cement, or stones
Roofs should be made of concrete, zinc/iron sheets, or tiles
For a family of four, a house should have a living room, one bedroom, an indoor bathroom with clean toilet, and a separate kitchen. Total living should be at least approximately 30m2.
Electricity
Access to clean water (either tap water or protected well, indoor or near house)
Access to garbage disposal
Adequate lighting
Adequate ventilation: at least one window for each room, minimal indoor ventilation for cooking
Neighborhood is safe with minimal garbage
In Soc Trang and Thai Binh, the research team visited 20 different apartments/houses either owned or rented by the shrimp-processing workers (in Soc Trang) and garment workers (in Thai Binh). The search for houses that meet the above standards was difficult because the actual housing conditions of shrimp-processing workers and low-income people in both
15 Art. 47, 2005 Housing Law of Vietnam.

Living Wage Report for Rural Vietnam with focus on Seafood Processing Industry
© Global Living Wage Coalition Under the Aegis of Fairtrade International, Forest Stewardship Council, GoodWeave International, Rainforest Alliance, Social Accountability International, Sustainable Agriculture Network, and UTZ, in partnership with ISEAL Alliance and Richard Anker and Martha Anker
22
provinces lag far behind the set standards. Most workers and low-income families live in small apartments of 10-16m2, usually without windows (see pictures below). The typical design of these apartments is one room which serves as living room, bedroom, and kitchen. Toilet is included and separated from the main room (see picture below).
Rented accommodation of garment
workers in Dong Hung, Thai Binh
Inside a rented apartment in Dong Hung,
Thai Binh
Inside a rented apartment in Tran De, Soc
Trang
Accommodation of some shrimp-processing
workers in Tran De, Soc Trang
7.2 Rent for basic acceptable housing
As explained earlier, there is a gap between the normal housing conditions of workers in Soc Trang and Thai Binh with the minimum standards used for this study. We visited 10 workers’ houses in each province (but could not find the houses that meet our standards) and then visited 3-5 houses more to find the accommodation that met our minimum standards. In Soc Trang, the dormitory for workers provided by the shrimp-processing
Living Wage Report for Rural Vietnam with focus on Seafood Processing Industry
© Global Living Wage Coalition Under the Aegis of Fairtrade International, Forest Stewardship Council, GoodWeave International, Rainforest Alliance, Social Accountability International, Sustainable Agriculture Network, and UTZ, in partnership with ISEAL Alliance and Richard Anker and Martha Anker
23
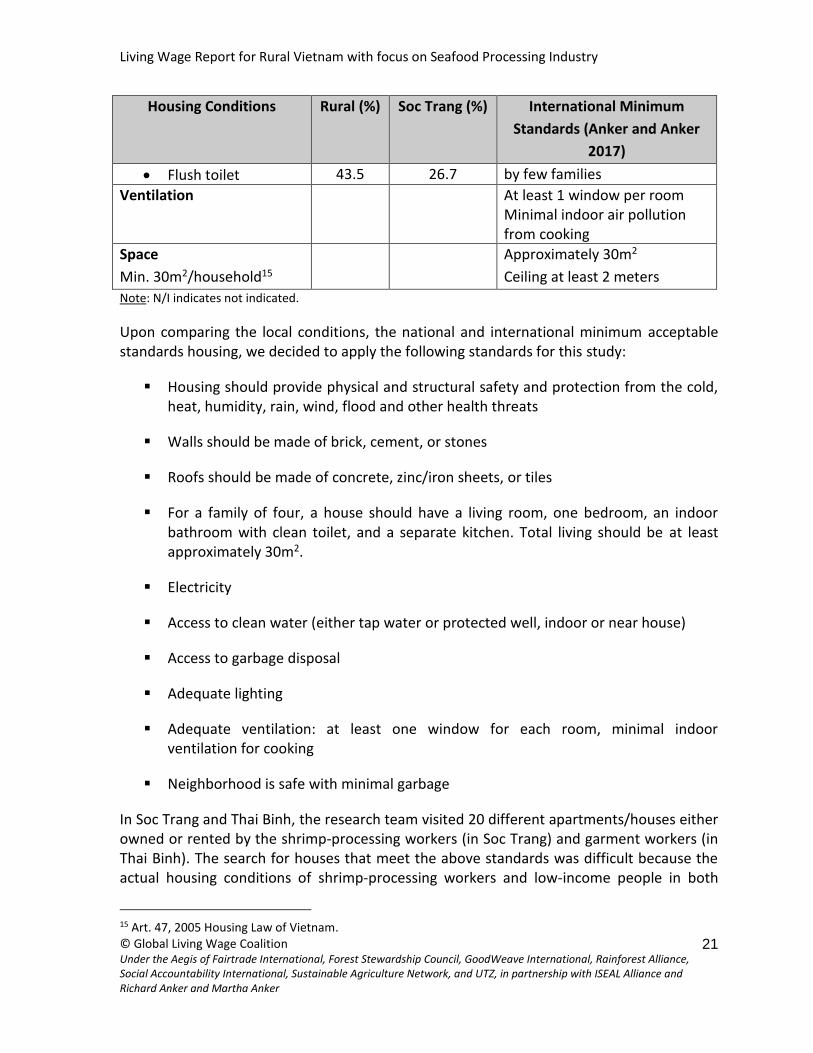
company almost met our minimum standards with good structure and conditions, proper ventilation and access to water and electricity but the size was small (26m2) and each apartment had only 1 room. None of the workers’ apartments outside of the dormitory met our standards. We finally found the accommodation that satistied our minimum housing standards which were apartments rented to teachers and office staff.
In Thai Binh, the housing conditions of the garment workers were very poor (moldy walls, leaking roof), the typical apartment was small, ranging from 12-20m2 with just one room for all purposes. We finally found 2 apartments that met the minimum standards except that there was only one room for each. However, it is possible to divide the room into 2 if needed.
The rent for accommodation that meets minimum standards in Soc Trang and Thai Binh are similar, approximately VND 800,000/month.
Table 7.2 Rental cost and acceptability of housing visited in Soc Trang and Thai Binh
Acceptable standard?
Rent in VND (monthly)
Size & rooms
Comments
Soc Trang
No Old dorm provided free by the employer
20m2 Only one room. Moldy walls, cover falling out. Floor has cracks. Fair ventilation with 2 windows. Toilet inside but smelly without separated ventilation. Cooking inside.
No New dorm provided free by the employer
26m2 Only one room. Walls, roof and floor in good condition. Toilet outside. Cooking inside. Good ventilation with 2 windows.
No 250,000 13m2 Only one room. Two side walls are thatched, leakage when rain. Tin roof, not heat proof, hot. Poor ventilation with one small window. Water from wells. Latrine outside and shared with others. Open pit toilet, poor conditions. Cooking outside.
No 300,000 15m2 Only one room. Two side walls are thatched, leakage when rain. Tint roof, not heat proof, very hot. Poor ventilation with one small window. Water from wells. Latrine outside shared with others. Open pit toilet, dark and moldy, very dirty. Cooking inside.

Living Wage Report for Rural Vietnam with focus on Seafood Processing Industry
© Global Living Wage Coalition Under the Aegis of Fairtrade International, Forest Stewardship Council, GoodWeave International, Rainforest Alliance, Social Accountability International, Sustainable Agriculture Network, and UTZ, in partnership with ISEAL Alliance and Richard Anker and Martha Anker
24
Acceptable standard?
Rent in VND (monthly)
Size & rooms
Comments
Yes 800,000 28m2 Two rooms (1 bed room, 1 living room). Kitchen and toilet inside. Toilet covered.
Thai Binh
No 120,000 13m2 One room. Moldy walls, broken roof. Wet and dirty toilet inside. No window, only 2 tiny holes. Old, damp and narrow.
No 400,000 12m2 Walls moldy, broken foam on roof. Toilet inside but no door, very smelly. Only 1 window, poor ventilation and damp.
No 400,000 14m2 One room only. Roof has holes. Electricity only 5 hours/day. Old, dirty toilet inside. Only 1 window, poor ventilation, damp.
No 400,000 12m2 One room only. Roof is falling out. Electricity only 5 hours/day. Walls have cracks. Toilet inside but wet and smell. Only 1 window, poor ventilation.
No 400,000 14m2 One room only. Moldy walls. Electricity only 5 hours/day. Toilet inside. No separate area for kitchen (use gas cooker).
No 650,000 20m2 One room. Flush toilet in good condition. Cooking inside. 1 window and 3 openings, high ceiling, good ventilation. Good conditions except that it’s too small.
Yes 700,000 27m2 One room. Electricity 8 hours/day. 2 windows, high ceiling. Toilet and kitchen inside. Good conditions
Yes 800,000 30m2 One room but can be divided into 2. Toilet and kitchen inside. Walls old but in acceptable conditions. Good ventilation.
7.3 Utilities and other housing costs
During our interviews with 20 workers and their families in the two provinces, we asked them the cost of utilities and any other costs related to their housing. The costs include: electricity, water, gabbage collection, gas for cooking, and contribution for public lighting in
Living Wage Report for Rural Vietnam with focus on Seafood Processing Industry
© Global Living Wage Coalition Under the Aegis of Fairtrade International, Forest Stewardship Council, GoodWeave International, Rainforest Alliance, Social Accountability International, Sustainable Agriculture Network, and UTZ, in partnership with ISEAL Alliance and Richard Anker and Martha Anker
25
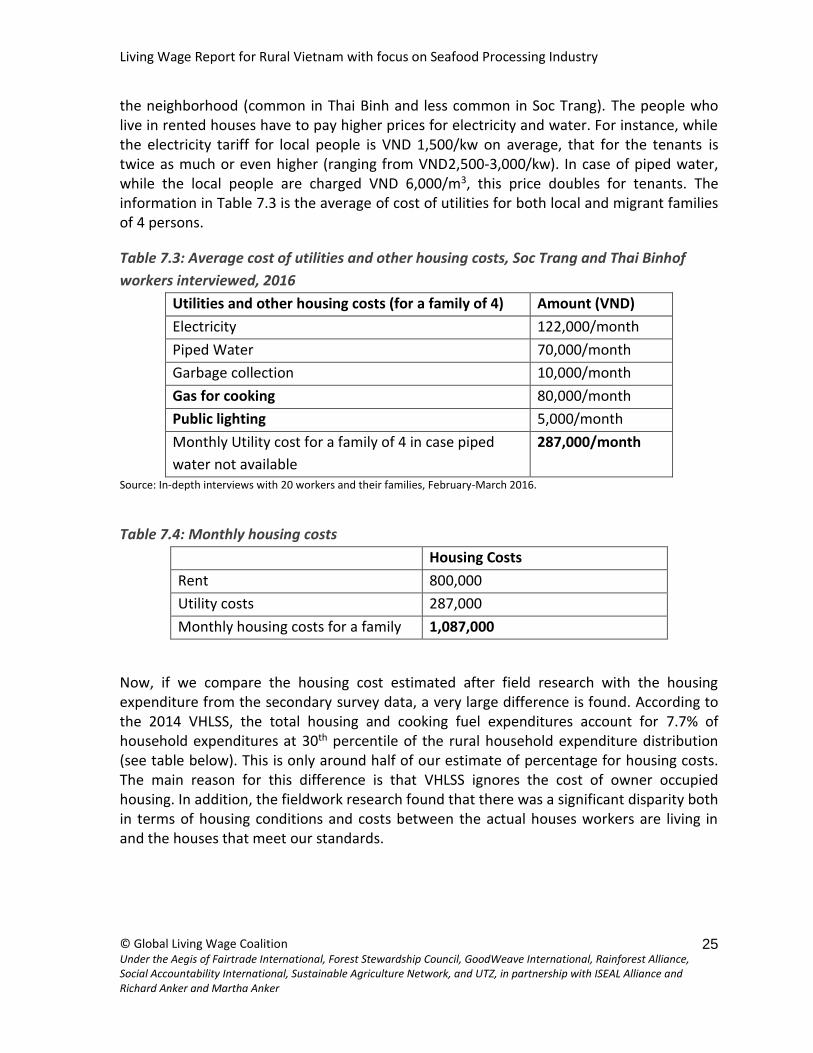
the neighborhood (common in Thai Binh and less common in Soc Trang). The people who live in rented houses have to pay higher prices for electricity and water. For instance, while the electricity tariff for local people is VND 1,500/kw on average, that for the tenants is twice as much or even higher (ranging from VND2,500-3,000/kw). In case of piped water, while the local people are charged VND 6,000/m3, this price doubles for tenants. The information in Table 7.3 is the average of cost of utilities for both local and migrant families of 4 persons.
Table 7.3: Average cost of utilities and other housing costs, Soc Trang and Thai Binhof
workers interviewed, 2016
Utilities and other housing costs (for a family of 4) Amount (VND)
Electricity 122,000/month
Piped Water 70,000/month
Garbage collection 10,000/month
Gas for cooking 80,000/month
Public lighting 5,000/month
Monthly Utility cost for a family of 4 in case piped
water not available
287,000/month
Source: In-depth interviews with 20 workers and their families, February-March 2016.
Table 7.4: Monthly housing costs
Housing Costs
Rent 800,000
Utility costs 287,000
Monthly housing costs for a family 1,087,000
Now, if we compare the housing cost estimated after field research with the housing expenditure from the secondary survey data, a very large difference is found. According to the 2014 VHLSS, the total housing and cooking fuel expenditures account for 7.7% of household expenditures at 30th percentile of the rural household expenditure distribution (see table below). This is only around half of our estimate of percentage for housing costs. The main reason for this difference is that VHLSS ignores the cost of owner occupied housing. In addition, the fieldwork research found that there was a significant disparity both in terms of housing conditions and costs between the actual houses workers are living in and the houses that meet our standards.

Living Wage Report for Rural Vietnam with focus on Seafood Processing Industry
© Global Living Wage Coalition Under the Aegis of Fairtrade International, Forest Stewardship Council, GoodWeave International, Rainforest Alliance, Social Accountability International, Sustainable Agriculture Network, and UTZ, in partnership with ISEAL Alliance and Richard Anker and Martha Anker
26
8. NON-FOOD AND NON-HOUSING COSTS
In most countries, poverty lines are calculated by estimating food costs and then adding a non-food value, the latter accounting for the rest of the basic revenue a family needs in order not to be considered poor. The Anker methodology is different. It estimates food and housing costs using normative standards. It also estimates non-food and non-housing costs.
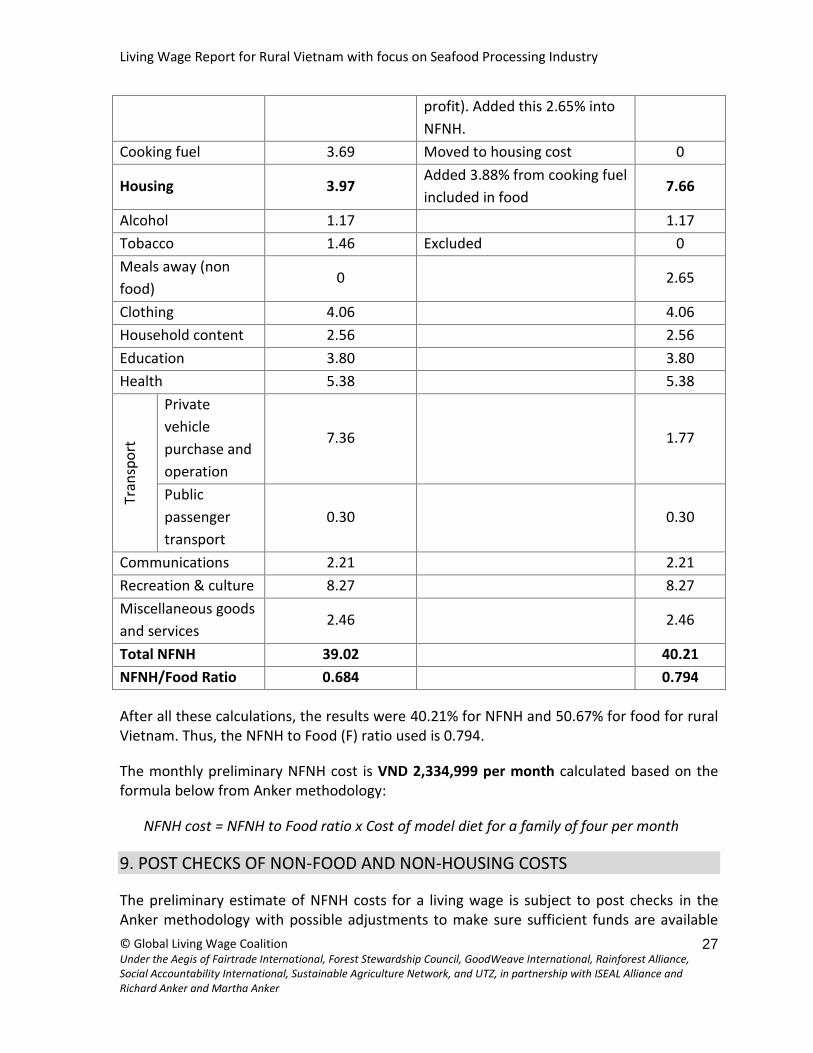
In order to estimate NFNH costs, secondary data were taken from the VHLSS 2014 as our point of departure. The 30th percentile of the household expenditure distribution for rural areas was selected as the reference for this study. For this part of the rural income distribution, NFNH expenditures are 39.02% of total household expenditure. We then made a few adjustments to more accurately estimate NFNH expenses for a living wage.
First, tobacco was excluded from NFNH expenditure (1.46%), because it was not considered necessary for a decent standard of living.
Second, we separated the cost of meals away (13.25% of all household expenditures) into the costs for food and the costs for non-food items such as service, fuel, rent, and restaurant owners’ profit. According to previous inquiries, a typical percentage for the cost of the food in meals away in rural areas of Vietnam is around 80% of the cost of such meals (Anker and Anker 2017).16 Therefore, we kept 80% of the total ‘meals away’ expenditure in the food expenditure group and shifted 20% to NFNH.
Third, cooking fuel expenditure (3.69%), which is included in the food expenditure group in Vietnam statistics, was moved to housing expenditure group because we count cooking fuel in the housing cost and cooking fuel is not included in our model diet.
Table 8.1: Household expenditure patterns from VHLSS 2014 before and after necessary
adjustments using 30th percentile of rural household expenditure distribution, rural areas,
Vietnam
Major expenditure
group
% Expenditure
according to VHLSS
Adjustments % After
adjustment
Total Food 57.01 50.67
Food and non-
alcoholic beverages 40.07
40.07
Meals away 13.25
Subtracted 2.65% (as assumed
20% of cost of meals away is
for services, overheads and
10.60
16 This ratio varies from country to country. For instance, this ratio in Costa Rica and Dominican Republic is 50%/50% while that in the USA is 30%/70%, probably because wages and profits are higher in more developed countries as a share of total sales.
Living Wage Report for Rural Vietnam with focus on Seafood Processing Industry
© Global Living Wage Coalition Under the Aegis of Fairtrade International, Forest Stewardship Council, GoodWeave International, Rainforest Alliance, Social Accountability International, Sustainable Agriculture Network, and UTZ, in partnership with ISEAL Alliance and Richard Anker and Martha Anker
27
profit). Added this 2.65% into
NFNH.
Cooking fuel 3.69 Moved to housing cost 0
Housing 3.97 Added 3.88% from cooking fuel
included in food 7.66
Alcohol 1.17 1.17
Tobacco 1.46 Excluded 0
Meals away (non
food) 0
2.65
Clothing 4.06 4.06
Household content 2.56 2.56
Education 3.80 3.80
Health 5.38 5.38
Tran
spo
rt
Private
vehicle
purchase and
operation
7.36
1.77
Public
passenger
transport
0.30
0.30
Communications 2.21 2.21
Recreation & culture 8.27 8.27
Miscellaneous goods
and services 2.46
2.46
Total NFNH 39.02 40.21
NFNH/Food Ratio 0.684 0.794
After all these calculations, the results were 40.21% for NFNH and 50.67% for food for rural Vietnam. Thus, the NFNH to Food (F) ratio used is 0.794.
The monthly preliminary NFNH cost is VND 2,334,999 per month calculated based on the formula below from Anker methodology:
NFNH cost = NFNH to Food ratio x Cost of model diet for a family of four per month
9. POST CHECKS OF NON-FOOD AND NON-HOUSING COSTS
The preliminary estimate of NFNH costs for a living wage is subject to post checks in the Anker methodology with possible adjustments to make sure sufficient funds are available

Living Wage Report for Rural Vietnam with focus on Seafood Processing Industry
© Global Living Wage Coalition Under the Aegis of Fairtrade International, Forest Stewardship Council, GoodWeave International, Rainforest Alliance, Social Accountability International, Sustainable Agriculture Network, and UTZ, in partnership with ISEAL Alliance and Richard Anker and Martha Anker
28
for health care, education and transport, because health care and education are considered human rights around the world and transport is an important expense. Post checks are needed because actual current expenditures for these indicated by secondary data may not be sufficient for decency.
These post checks compare the amount implicitly included in the preliminary estimate of NFNH costs allocated for health care, education and transport to rapid assessment estimates from new fieldwork of typical costs for acceptable education, health care, and transport.
The next step was to check the secondary household expenditure data implied costs for transport, health and education against the needed expenditure for decency according to our new fieldwork. According to the secondary household expenditure data, these expenditures were:
Transport (7.66%of total expenditures, VND 444,817)
Health care (5.38% of total expenditures, VND 312,417)
Education (3.80% of total expenditures, VND 220,666)
The values above were estimated by multiplying our preliminary NFNH cost estimates by the percentage of NFNH for each of these costs (transport, health care, and education).
9.1 Health care post check
There are three types of health care providers in the rural areas of Vietnam:
i. Public hospitals. Public hospitals offer two types of services including services
covered by health insurance and self-paid services in which patients may enjoy
better conditions but have to cover all the costs.
ii. Community clinics. These are public clinics, providing first aid and common
medicines for the local people.
iii. Private general practitioners. These are doctors and nurses who work for public
hospitals/community clinics but also provide private health care services outside of
official working time.
There are no data about the number of episodes of illness per year, so, we used the average number of episodes of illness as 3.5/person/year or 14 illness episodes per year for a family of 4 as suggested by Anker and Anker (2017). Among the people in rural areas who used outpatient services, only 17% were supported by health insurance. While 79.56% of inpatients stayed in public hospitals, only 32.2% of outpatients visited public hospitals and 34.2% visited private healthcare providers in the rural areas of Vietnam.

Living Wage Report for Rural Vietnam with focus on Seafood Processing Industry
© Global Living Wage Coalition Under the Aegis of Fairtrade International, Forest Stewardship Council, GoodWeave International, Rainforest Alliance, Social Accountability International, Sustainable Agriculture Network, and UTZ, in partnership with ISEAL Alliance and Richard Anker and Martha Anker
29
Given the limited coverage of health insurance and the high rate of people seeking outpatient services from private health care providers, it is reasonable to include some funds in a living wage for visits to private health care providers.
Regarding the typical types of illness, in Vietnam, the most common are diarrhea, respiratory diseases, and infectious diseases.17
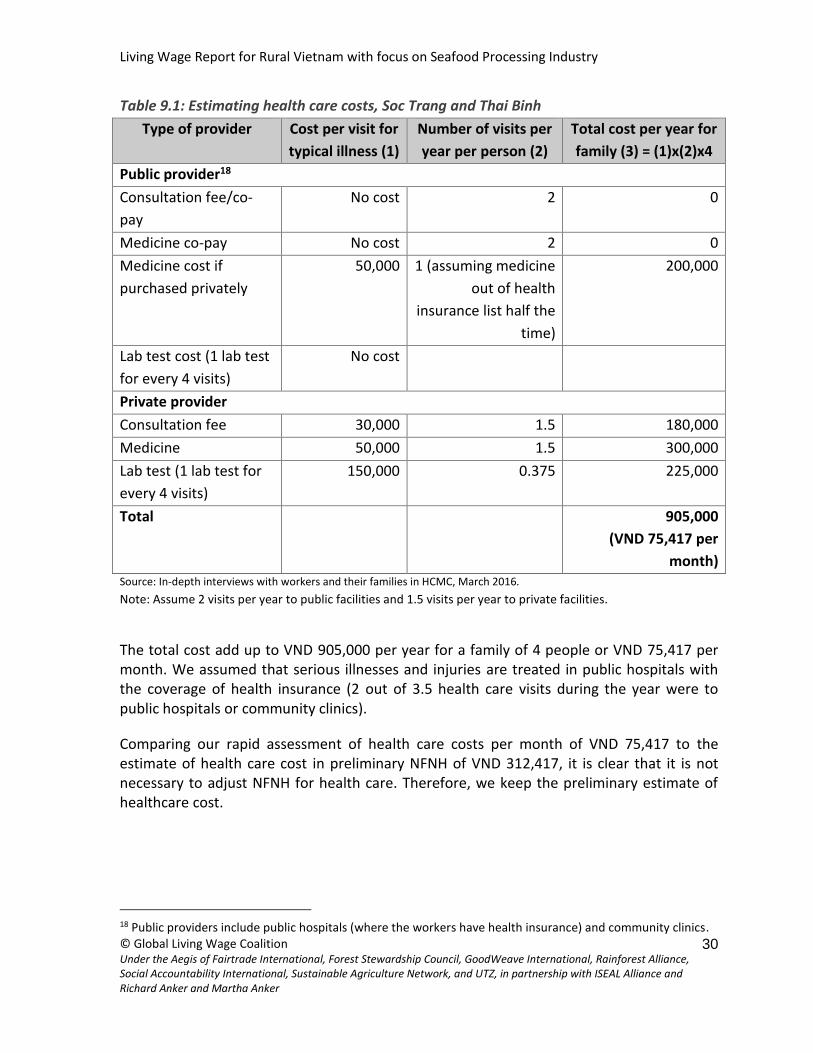
We visited public and private clinics and pharmacies in Soc Trang and Thai Binh and collected information from the workers on health care costs. We found that the consultation for a visit to a private clinic typically costs VND 30,000/visit. Common medicine for common respiratory diseases such as sore throat, flu and diarrhea (mostly antibiotics) costs around VND 50,000. Laboratory tests were often used in case of respiratory infection (especially for children), which costs around VND 150,000/test. We assumed that 1 lab test for every 4 visits was required.
The health care costs for a family of 4 people are specified in table 9.1.
17 http://khoahoc.tv/nhung-benh-nguy-hiem-nguoi-viet-thuong-gap-phai-49392.
Living Wage Report for Rural Vietnam with focus on Seafood Processing Industry
© Global Living Wage Coalition Under the Aegis of Fairtrade International, Forest Stewardship Council, GoodWeave International, Rainforest Alliance, Social Accountability International, Sustainable Agriculture Network, and UTZ, in partnership with ISEAL Alliance and Richard Anker and Martha Anker
30
Table 9.1: Estimating health care costs, Soc Trang and Thai Binh
Type of provider Cost per visit for
typical illness (1)
Number of visits per
year per person (2)
Total cost per year for
family (3) = (1)x(2)x4
Public provider18
Consultation fee/co-
pay
No cost 2 0
Medicine co-pay No cost 2 0
Medicine cost if
purchased privately
50,000 1 (assuming medicine
out of health
insurance list half the
time)
200,000
Lab test cost (1 lab test
for every 4 visits)
No cost
Private provider
Consultation fee 30,000 1.5 180,000
Medicine 50,000 1.5 300,000
Lab test (1 lab test for
every 4 visits)
150,000 0.375 225,000
Total 905,000
(VND 75,417 per
month) Source: In-depth interviews with workers and their families in HCMC, March 2016.
Note: Assume 2 visits per year to public facilities and 1.5 visits per year to private facilities.
The total cost add up to VND 905,000 per year for a family of 4 people or VND 75,417 per month. We assumed that serious illnesses and injuries are treated in public hospitals with the coverage of health insurance (2 out of 3.5 health care visits during the year were to public hospitals or community clinics).
Comparing our rapid assessment of health care costs per month of VND 75,417 to the estimate of health care cost in preliminary NFNH of VND 312,417, it is clear that it is not necessary to adjust NFNH for health care. Therefore, we keep the preliminary estimate of healthcare cost.
18 Public providers include public hospitals (where the workers have health insurance) and community clinics.

Living Wage Report for Rural Vietnam with focus on Seafood Processing Industry
© Global Living Wage Coalition Under the Aegis of Fairtrade International, Forest Stewardship Council, GoodWeave International, Rainforest Alliance, Social Accountability International, Sustainable Agriculture Network, and UTZ, in partnership with ISEAL Alliance and Richard Anker and Martha Anker
31
9.2 Education post check
The education system of Vietnam has 5 years of primary school (beginning at age 6), 4 years of lower secondary school, and 3 years of upper secondary school. It is also compulsory for children to attend at least 1 year of pre-primary school (at age of 5). According to the 2012 VHLSS, almost all children attend public schools. The percentage of children attending public schools at all levels is 97.2% for household income quintile 2 and as many as 92.4% of children attend primary school at the age of 6. The attendance rates for lower secondary and upper secondary schools remain high at 92% and 71.9% respectively.
For every school year, the Ministry of Education and Training provides for a range of school fees for rural and urban areas, based on which the provincial departments of education and training specify the school fees for each education level (urban and rural separately) for the local education institutes. Apart from the school fees, interviews with workers and their families showed that they are still expected to contribute certain amounts for school funds, purchase of uniforms and text books, etc. (see Table 9.2 below). The school terms for primary, lower secondary and upper secondary last for 9 months per year while the pre-primary children are expected to go to class the whole year.
While in the urban areas, the children are expected to attend pre-primary school early (around the age of 1 or 2), pre-primary school for children in the rural areas usually starts at age 3. Before that, the children are taken care of by their grandparents or relatives.
The researchers interviewed 10 families in Soc Trang and 10 families in Thai Binh. All of the interviewees were local people in the two provinces. The research team also checked the education costs reported by talking to local teachers in a few other rural areas of the country such as Thanh Hoa, Yen Bai and Nghe An to see if there were major differences among the rural regions.
Table 9.2: Typical annual household costs per public school student by level, – for Soc Tang
and Thai Binh
Type of expenses Pre-
primary
Primary Lower
secondary
Upper
secondary
Whether classified
as education
expenditure in
national statistics
School fees19 360,000 360,000 360,000 480,000 Yes
School funds 300,000 400,000 400,000 500,000 Yes
Compulsory
health insurance20
434,700 434,700 434,700 434,700 No
19 HCMC’s regulations on school fees in 2015-2016: http://tuoitre.vn/tin/giao-duc/20151001/tphcm-cong-bo-muc-hoc-phi-chinh-thuc/978262.html.

Living Wage Report for Rural Vietnam with focus on Seafood Processing Industry
© Global Living Wage Coalition Under the Aegis of Fairtrade International, Forest Stewardship Council, GoodWeave International, Rainforest Alliance, Social Accountability International, Sustainable Agriculture Network, and UTZ, in partnership with ISEAL Alliance and Richard Anker and Martha Anker
32
Uniforms Not
required
200,000 200,000 200,000 Yes
Learning
materials (eg: text
books)
Not
required
200,000 200,000 300,000 Yes
Milk and snacks 1,100,000 No cost No cost No cost No
Total cost per
yeara
660,000 1,160,000 1,160,000 1,480,000
Number of years
in each level
3 5 4 3
Total annual cost
x number of years
in each level
1,980,000 5,800,000 4,640,000 4,440,000 16,860,000
Average cost per child per year (assuming parents responsible for
children for 18 years)
936,667
Notes: a Meals and snacks are excluded in the calculation of total education costs, because these reduce food costs at home. Also, they are not included in the education group in Vietnam household expenditure statistics. Health insurance is not included in this calculation, because it is not included in the education group in Vietnam household expenditure statistics.
School fees in the public education system were indicated by the provincial authority. The school fee (from pre-primary to junior secondary) for rural areas in 2016 for Soc Trang was VND 30,000/month and for upper secondary this was VND 40,000/month.
Based on the above cost figures, we estimated that school expenses for a family with 2 children (our reference family size in Vietnam) is VND 1,873,833 per year or VND 156,111 per month. This amount is lower than the preliminary education cost of VND 220,666implicitly included in the NFNH cost.
Therefore, we did not make any adjustment to the preliminary NFNH estimate for education.
9.3 Transport post check
Almost all households in rural Vietnam own a motorbike. According to the 2012 VHLSS, 76.4% of rural households own a motorbike and they have one motorbike on average. It is clear that the norm in rural Vietnam is to own a motorbike and use it to commute to work, bring children to school, and shop. Therefore, the cost of owning and operating a common relatively low cost motorbike was included in the transport post check for rural areas of Vietnam. 20 Each student pays 70% of health insurance and the state pays 30%.

Living Wage Report for Rural Vietnam with focus on Seafood Processing Industry
© Global Living Wage Coalition Under the Aegis of Fairtrade International, Forest Stewardship Council, GoodWeave International, Rainforest Alliance, Social Accountability International, Sustainable Agriculture Network, and UTZ, in partnership with ISEAL Alliance and Richard Anker and Martha Anker
33
All of the 20 families interviewed owned at least one motorbike. We asked them the costs of owning a motorbike and checked with 3 motorbike shops in the towns nearby (as all of them purchased their motorbikes from the nearby towns).
Purchase price. Here we used the price of a used motorbike that is expected to last for 10 years more after purchase.
The reference model is Honda Wave Alpha 100cc, which is common among the lower-income families in the rural areas.
Checkup and oil change. We assumed three checkups and oil changes per year.
Table 9.3: Estimated cost of owning and operating a common low-cost motorbike in Soc
Trang and Thai Binh
Item Cost per
event
(VND)
Frequency Estimated cost per
month
(VND/month)
Comments
Purchase price 10,000,000 Once 83,333
Average price, used
but of acceptable
quality motorbike
Registration
fees and taxes
on purchase
750,000 Once 6,250
Helmet 100,000 Once 833 New helmet
Annual
insurance 66,000 Annual 5,500 Required by law
Checkup and
Oil change 200,000
Three times
per year 50,000
Petrol 15,000/liter Often See next table
Tires, brakes,
chain, springs 400,000 Annual 33,333
Total VND 179,250/month
Monthly cost for
owning and
operating a
motorbike excluding
petrol cost Source: In-depth interviews with workers and their families in Thai Binh and Soc Trang, February-March 2016.
Living Wage Report for Rural Vietnam with focus on Seafood Processing Industry
© Global Living Wage Coalition Under the Aegis of Fairtrade International, Forest Stewardship Council, GoodWeave International, Rainforest Alliance, Social Accountability International, Sustainable Agriculture Network, and UTZ, in partnership with ISEAL Alliance and Richard Anker and Martha Anker
34
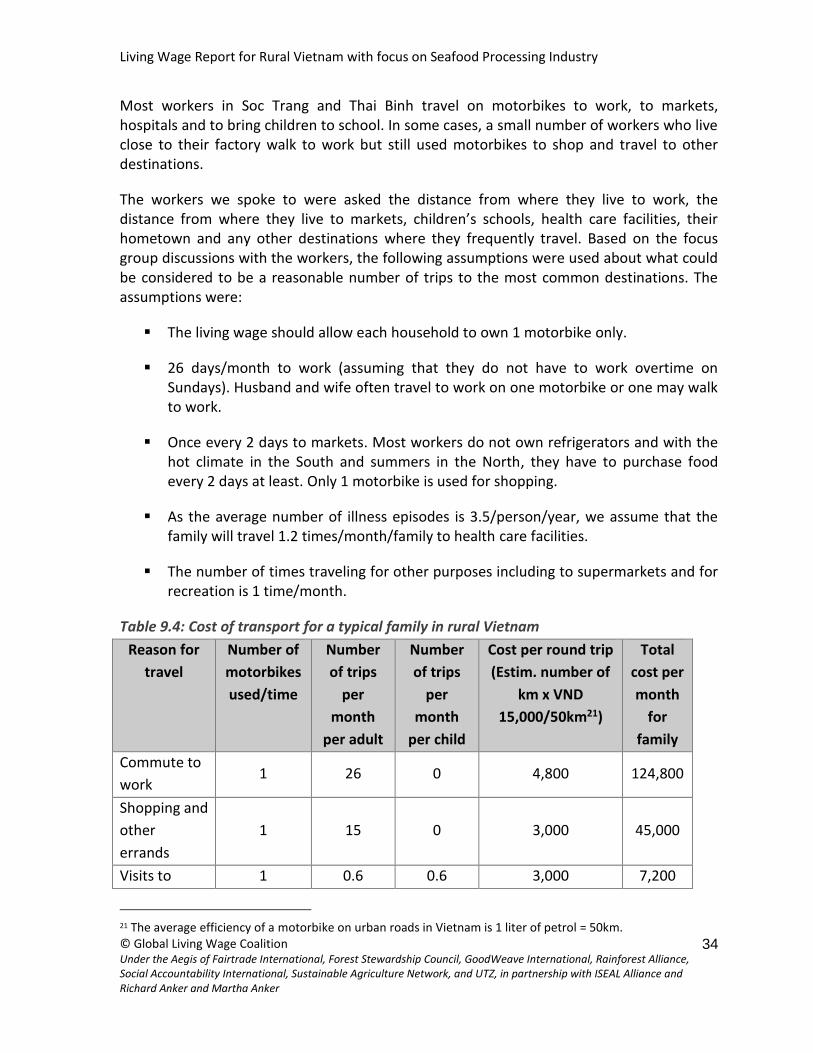
Most workers in Soc Trang and Thai Binh travel on motorbikes to work, to markets, hospitals and to bring children to school. In some cases, a small number of workers who live close to their factory walk to work but still used motorbikes to shop and travel to other destinations.
The workers we spoke to were asked the distance from where they live to work, the distance from where they live to markets, children’s schools, health care facilities, their hometown and any other destinations where they frequently travel. Based on the focus group discussions with the workers, the following assumptions were used about what could be considered to be a reasonable number of trips to the most common destinations. The assumptions were:
The living wage should allow each household to own 1 motorbike only.
26 days/month to work (assuming that they do not have to work overtime on Sundays). Husband and wife often travel to work on one motorbike or one may walk to work.
Once every 2 days to markets. Most workers do not own refrigerators and with the hot climate in the South and summers in the North, they have to purchase food every 2 days at least. Only 1 motorbike is used for shopping.
As the average number of illness episodes is 3.5/person/year, we assume that the family will travel 1.2 times/month/family to health care facilities.
The number of times traveling for other purposes including to supermarkets and for recreation is 1 time/month.
Table 9.4: Cost of transport for a typical family in rural Vietnam
Reason for
travel
Number of
motorbikes
used/time
Number
of trips
per
month
per adult
Number
of trips
per
month
per child
Cost per round trip
(Estim. number of
km x VND
15,000/50km21)
Total
cost per
month
for
family
Commute to
work 1 26 0 4,800 124,800
Shopping and
other
errands
1 15 0 3,000 45,000
Visits to 1 0.6 0.6 3,000 7,200
21 The average efficiency of a motorbike on urban roads in Vietnam is 1 liter of petrol = 50km.

Living Wage Report for Rural Vietnam with focus on Seafood Processing Industry
© Global Living Wage Coalition Under the Aegis of Fairtrade International, Forest Stewardship Council, GoodWeave International, Rainforest Alliance, Social Accountability International, Sustainable Agriculture Network, and UTZ, in partnership with ISEAL Alliance and Richard Anker and Martha Anker
35
Reason for
travel
Number of
motorbikes
used/time
Number
of trips
per
month
per adult
Number
of trips
per
month
per child
Cost per round trip
(Estim. number of
km x VND
15,000/50km21)
Total
cost per
month
for
family
health facility
Visits to
supermarket
s and for
recreation
1 1 0 3,000 3,000
Total Monthly cost of petrol for family transport 180,000
Monthly cost of owning and running a motorbike (petrol excluded)
motorbikes/family
179,250
Total monthly cost of transport for family 359,250
Then the transport cost of a rural reference family is estimated to be VND 359,250 per month. This amount is lower than the preliminary estimate of transport of VND444,817, which was based on the data from the 2014 VHLSS. We therefore did not make any adjustment for transport costs to the preliminary NFNH cost.
After all the post checks, the adjusted NFNH cost remained VND 2,334,999/month.
10. PROVISION FOR UNEXPECTED EVENTS TO ENSURE SUSTAINABILITY
As Anker and Anker (2017) point out, a marginal amount should be added to the living wage to allow for unexpected events. This is important as workers should not fall into poverty due to short-term economic and social circumstances. Part of the scholarly literature on the subject adopts a value of 5% which is added to total costs, i.e., to total food, housing and NFNH expenditures. The living wage methodology being applied here works with a standard percentage of 5%. We decided to use 5% because the methodology is fairly comprehensive in the goods and services covered as well as in application of decency of standards. In Vietnam, although the Vietnamese workers’ core labour rights (sick leave, maternity leave, unemployment insurance) are granted by the law, enforcement is weak, resulting in various violations (including employers’ evasion of social security contributions).
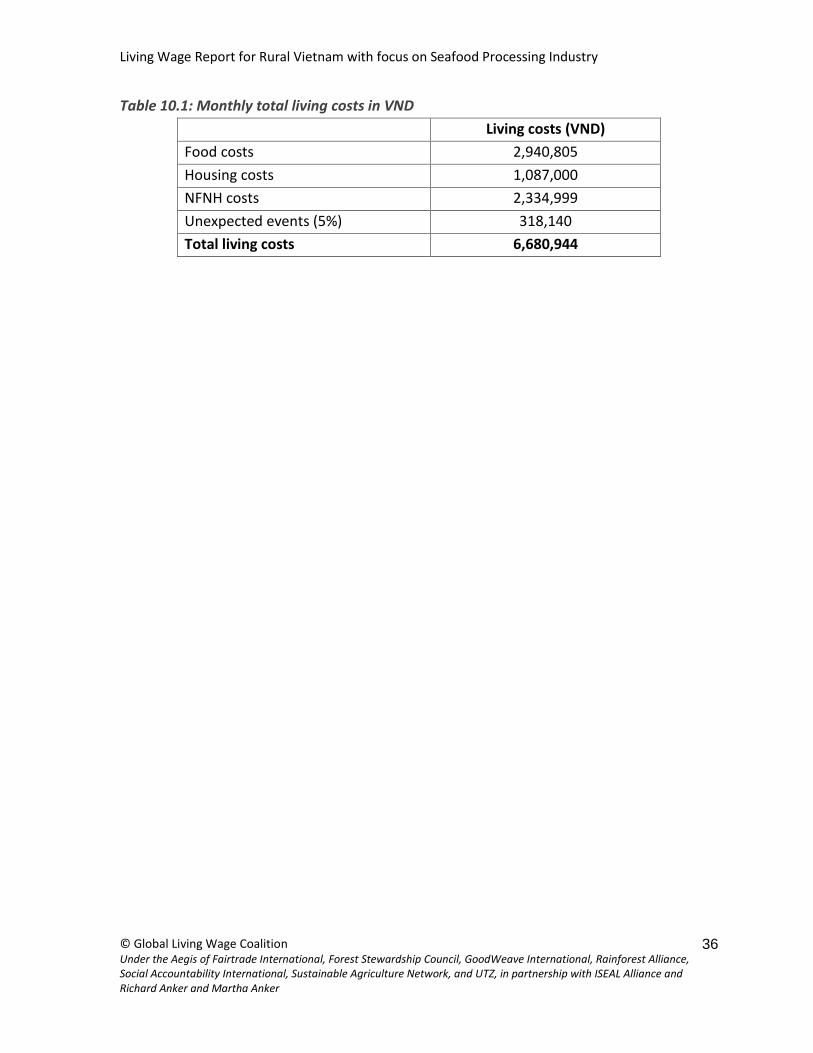
Living Wage Report for Rural Vietnam with focus on Seafood Processing Industry
© Global Living Wage Coalition Under the Aegis of Fairtrade International, Forest Stewardship Council, GoodWeave International, Rainforest Alliance, Social Accountability International, Sustainable Agriculture Network, and UTZ, in partnership with ISEAL Alliance and Richard Anker and Martha Anker
36
Table 10.1: Monthly total living costs in VND
Living costs (VND)
Food costs 2,940,805
Housing costs 1,087,000
NFNH costs 2,334,999
Unexpected events (5%) 318,140
Total living costs 6,680,944

Living Wage Report for Rural Vietnam with focus on Seafood Processing Industry
© Global Living Wage Coalition Under the Aegis of Fairtrade International, Forest Stewardship Council, GoodWeave International, Rainforest Alliance, Social Accountability International, Sustainable Agriculture Network, and UTZ, in partnership with ISEAL Alliance and Richard Anker and Martha Anker
37
SECTION III
III. LIVING WAGE FOR WORKERS
11. FAMILY SIZE NEEDING TO BE SUPPORTED BY LIVING WAGE
The estimate for the family size used in this report was based on the VHLSS survey data for rural areas. Excluding one-person households from our estimate because they do not include children, we came to 4.10 people per family. Another way of measuring family size would be by adding rural areas’ total fertility rate of 2.03 to the number corresponding to a couple (2), which gives us 4.03 people according to the same data.
Since both of these figures are around 4, we decided to use 4 as the reference family size for estimating our living wage
12. NUMBER OF FULL-TIME EQUIVALENT WORKERS IN FAMILY PROVIDING SUPPORT
Now we proceed to estimate the number of full-time workers in the family, as we should not assume that only one person is responsible for meeting the cost of living in our average family. In order to do so, once again, we followed the recommendations in the manual for estimating the living wage (Anker and Anker, 2017). The formula for estimating the average probability that prime age adults in the reference family are full-time workers is the following:
Likelihood of full time worker = Average prime age adult labour force participation rate * (1.0 – unemployment rate) * (1.0-[0.5*part-time employment rate])
We use the labour force participation rate (LFPR) for adults ages 25-59 for this study. According to Anker and Anker (2017), the LFPRs are much lower for young (ages 15-24) than for adults (ages 15+ or 18+) because these rates typically increase from age 15 as youth leave school and join the labour force; rates are typically fairly stable from age 25 especially for men until later ages when rates decline as workers retire and leave the labour force (which is 60 for men and 55 for women in the case of Vietnam). For the world, LFPRs are 48.5% for youth ages 15-24 compared to 68.8% for adults ages 25+. Indeed, a large difference in youth and adult LFPRs is found in every region of the world (Anker and Anker, April 2017). For this reason, we use LFPRs for persons 25-59 for men and 25-54 for women to estimate number of full-time equivalent workers per couple.
LFPRs are lower for women than for men throughout the world because some or many women are out of the labour force due to child and elder care (for the world, LFPR is 83.7% for men ages 25+ compared to 54.2% for women ages 25+). In the case of Vietnam, we used
Living Wage Report for Rural Vietnam with focus on Seafood Processing Industry
© Global Living Wage Coalition Under the Aegis of Fairtrade International, Forest Stewardship Council, GoodWeave International, Rainforest Alliance, Social Accountability International, Sustainable Agriculture Network, and UTZ, in partnership with ISEAL Alliance and Richard Anker and Martha Anker
38
the LFPRs for men ages 25-59 and women ages 25-54 because the retirement ages of men and women are 60 and 55 respectively. Then, the LFPRs for men and women were averaged to determine the participate for couples and families.
Data for rural areas in the 2012 VHLSS are used. The values were calculated for 2012 for the appropriate ages for all the rates using the above formula. The cut-off level set for part-time work was 30 hours a week. The calculated rates are shown below:
Unemployment rate: 0.8%
Part-time work rate: 14.67%
Labor force participation rate: 95.07%.
The average proportion of full-time equivalent work per prime working age adult is 0.87. As we have by assumption one adult already working in a factory, the number of full-time equivalent workers in the family is 1.87. The main idea underlying the formula is that the higher the labor force participation rate, the lower the unemployment rate, and the lower the part-time work, the more likely that another adult family member will be working full-time, which would result in a lower living wage.
For our case, this means dividing the total living costs of VND 6,680,944 by 1.87, resulting in VND 3,572,698 for the net living wage for rural Vietnam.
13. TAKE HOME PAY REQUIRED AND TAKING TAXES AND MANDATORY DEDUCTIONS FROM PAY INTO ACCOUNT
One final step is required. The living wage presented above was estimated having in mind the total costs workers should be able to afford. It should be looked at as a net take-home pay for the rural areas. However, the gross wage, which needs to be actually paid, should take into account the amount that workers have to contribute to social security, health insurance, unemployment insurance, and pay union dues.
In terms of statutory deductions, Vietnamese workers have the following:
8% for social insurance
1.5% for health insurance
1% for unemployment insurance
1% for union dues (only applicable to union members).
The total deduction is 10.5% (or 11.5% for workers who are union members). The unionisation rate in the state owned enterprises sector is 78% and that in the non-state

Living Wage Report for Rural Vietnam with focus on Seafood Processing Industry
© Global Living Wage Coalition Under the Aegis of Fairtrade International, Forest Stewardship Council, GoodWeave International, Rainforest Alliance, Social Accountability International, Sustainable Agriculture Network, and UTZ, in partnership with ISEAL Alliance and Richard Anker and Martha Anker
39
sector (private domestic and foreign-owned companies) is 33%.22 However, according to a VGCL official, the rate of collection of union dues is only 40% because the workers and employers evade union dues or workers pay a flat union dues (rather than 1% of their basic salary). The latter case was found among the 2 companies visited by the research team. Therefore, we did not include 1% for union dues in our calculation here but leave it for specific cases.
As of 1st January 2016, the basis for calculation of mandatory deductions includes the basic salary and wage-related allowances such as seniority allowances, attendance allowances, and dangerous working condition allowance.23 By 2018, all components of workers’ cash-based pay will be taxable.The part of the living wage that is included in the basis for calculation for mandatory reduction is hereinafter referred to as ‘the applicable part of the living wage’.
Therefore, to ensure the net living wage for workers, the gross living wage needs to be increased to take into account the statutory deductions from pay. Otherwise, workers would not have sufficient take home pay.
The formula for calculating the gross pay required for living wage is:
𝐺𝑟𝑜𝑠𝑠 𝑝𝑎𝑦 𝑟𝑒𝑞𝑢𝑖𝑟𝑒𝑑 𝑓𝑜𝑟 𝑙𝑖𝑣𝑖𝑛𝑔 𝑤𝑎𝑔𝑒 = 𝑁𝑜𝑛 − 𝑎𝑝𝑝𝑙𝑖𝑐𝑎𝑏𝑙𝑒 𝑝𝑎𝑟𝑡 𝑜𝑓 𝑛𝑒𝑡 𝑙𝑖𝑣𝑖𝑛𝑔 𝑤𝑎𝑔𝑒 + [𝐴𝑝𝑝𝑙𝑖𝑐𝑎𝑏𝑙𝑒 𝑝𝑎𝑟𝑡 𝑜𝑓 𝑛𝑒𝑡 𝑙𝑖𝑣𝑖𝑛𝑔 𝑤𝑎𝑔𝑒]/[1.0 − 0.105 (𝑡𝑎𝑥𝑒𝑠)]
This results in a gross living wage estimate for rural Vietnam of VND 3,991,841.
22 World Bank 2015. 23 Art. 4, Circular 47/2015 of the Ministry of Labour, Invalids and Social Affairs.

Living Wage Report for Rural Vietnam with focus on Seafood Processing Industry
© Global Living Wage Coalition Under the Aegis of Fairtrade International, Forest Stewardship Council, GoodWeave International, Rainforest Alliance, Social Accountability International, Sustainable Agriculture Network, and UTZ, in partnership with ISEAL Alliance and Richard Anker and Martha Anker
40
SECTION IV
IV. ESTIMATING GAPS BETWEEN LIVING WAGE AND PREVAILING
WAGES
14. PREVAILING WAGES IN SEAFOOD PROCESSING INDUSTRY
One of the most important reasons for estimating a living wage is to determine if workers receive a living wage and if employers and industries pay a living wage. For this reason, we also provide information in this section on different wages paid in the seafood processing industry.
Our field research indicated that it can be tricky to determine which forms of remuneration should be included in the prevailing wage for comparison to a living wage. We, therefore, followed the general principles set in the living wage manual Anker and Anker (2017). These principles include:
Received by most production workers in an industry
This means that cash allowances and in kind benefits should be received by most
production workers in an industry or establishment to be considered.24 A list of
allowed cash allowances and in kind benefits would need to be established. This
criterion will help to simplify auditing of establishments.
Received regularly
Workers need to receive wages regularly so that they can more or less count on it to
pay for ongoing expenses. This criterion means that production bonuses that are not
regularly received should not be counted for comparisons with living wage.
Received within one year
Workers have limited capacity to smooth their spending over time without having to
borrow and run the considerable risk of getting into perpetual debt. We assume that
workers are able to smooth out expenditures over the year when they know that
they have a guaranteed cash allowance during the year. This criterion means that
24 If an in kind benefit (such as a free lunch) is unusual for an industry, the value of lunch should not be counted when determining the gap between living wage and prevailing wage in such an industry. However, when an establishment in such an industry provides free lunch, the value of the free lunch should be counted when determining the gap between living wage and prevailing wages for this establishment.

Living Wage Report for Rural Vietnam with focus on Seafood Processing Industry
© Global Living Wage Coalition Under the Aegis of Fairtrade International, Forest Stewardship Council, GoodWeave International, Rainforest Alliance, Social Accountability International, Sustainable Agriculture Network, and UTZ, in partnership with ISEAL Alliance and Richard Anker and Martha Anker
41
guaranteed cash allowances such as a National Day cash bonus and a 13th month
cash payment would qualify for inclusion in wages for comparison to living wage. On
the other hand, this criterion means that pension and provident fund contributions
by employers would not qualify for inclusion in wages for comparison to living wage,
because pensions and provident funds are received well in the future. Nor would
eventual severance pay qualify as it is received at some unknown time in the future.
Earned during normal working hours
One aspect of the definition of a living wage is that it must be earned in normal
working hours. This means that overtime pay and pay premiums for holidays,
weekends and night work are not appropriate to include in remuneration for
comparison of current wages to living wage.
Received in cash except for in kind benefits and medical insurance that are for the personal benefit and use of workers and their families
In kind benefits and medical insurance can reduce the cash wage required for a
decent living standard. However to avoid possible abuse, special rules are used to
determine fair and reasonable monetary values for in kind benefits as explained
below.
14.1 Basic wage, cash allowances and bonuses, and overtime pay
Vietnam’s seafood exports have expanded sharply in recent years, reaching approximately US$8 billion in value, and 6.8 million tons by weight in 2014 (an increase of some 40% in the five-year period since 2009). It has now become one of the world’s top five global seafood producers and exporters. The main seafood products in Vietnam are pangas, tuna, shrimp and marine fish. By value, the structure of export products in 2012 was frozen shrimp (36.5%), pangas (28.4%), other fish (14.5%), mollusks (9.5%), tuna (9.3%), and other crustaceans (1.9%). By value, the EU accounted for some 18.5% of all seafood exports. Vietnam is also an important producer of processed products.
By 2013, there were 567 recorded seafood processing plants, some 450 of which were qualified for exporting to the EU. Many of these products (with a value-added ratio estimated at a minimum of 45%) are accepted by big supermarket chains in the EU, Japan, and the US.
The total labour force in Vietnamese fisheries has been estimated at around 4.5 million, some 670,000 of these in aquaculture. Seafood processing has generated considerable employment over the past two decades, some three- quarters of this for women. Seafood

Living Wage Report for Rural Vietnam with focus on Seafood Processing Industry
© Global Living Wage Coalition Under the Aegis of Fairtrade International, Forest Stewardship Council, GoodWeave International, Rainforest Alliance, Social Accountability International, Sustainable Agriculture Network, and UTZ, in partnership with ISEAL Alliance and Richard Anker and Martha Anker
42
processing is a under-researched industry in Vietnam. There are no recent surveys or figures about the labour force or labour standards in this industry in Vietnam.
The seafood processing industry in Asia in general and in Vietnam in particular is characterized by the domination of female low-skilled workers who are mostly paid on piece rate.25 For this study, we visited a shrimp-processing factory in Soc Trang. All of the rank-and-file workers, no matter how long they have worked in the factory, were paid on piece rate and the basic salary was merely 1.5% higher than the regional minimum wage.26 There are typically 4 types of workers in a food processing factory: (i) Material sorters; (ii) Packers; (iii) Freezers; and (iv) Processors. Workers only need a few hours of training before they can start working and after a week they can catch up with the pace of production lines.
Workers are paid on a fixed piece rate calculated by the average per person production of the whole department in the previous year or month. The rate paid is higher during overtime. The piece rate is multiplied by the number of hours that workers perform their work. The mandatory deductions including social insurance, health insurance, and union dues are based on the basic salary which is largely defined at the minimum wage level.
Apart from the main salary, the workers in the seafood processing industry receive a few allowances including:
Attendance allowance. According to a 2016 MOLISA survey, 60% of the workers received attendance allowance in Region 4 and receive on average VND 150,000/month. We include this in the prevailing wage for comparison with our living wage
Dangerous, heavy working condition allowance. This is 5% of the basic salary, VND 120,000/month. As this is not common, we do not include this in prevailing wages for comparison to our living wage.
Tet bonus. The survey of MOLISA27 of over 13,178 enterprises and 2,4 million workers in January 2016 showed that 87% of the enterprises paid Tet bonus with an average of one month’s basic salary to workers. As most workers receive Tet bonus, we include it in the prevailing wage for comparison with our living wage.
Year-end bonus. According to the MOLISA survey in 2016, 72% of the enterprises reported paying year-end bonus to workers with the average amount of VND 1.18 million/person. As most workers receive year-end bonus, we include it in the prevailing wage for comparison with our living wage.
25 Fairfood. 2014. Caught in a trap. Link: http://www.fairfood.org/wp-content/uploads/2015/04/Caught-in-a-trap.pdf. 26 Minimum wage for Soc Trang in 2016 was VND 2,400,000/person/month. 27 http://www.tienphong.vn/xa-hoi/chinh-thuc-cong-bo-luong-thuong-tet-ca-nuoc-nam-2016-961082.tpo.
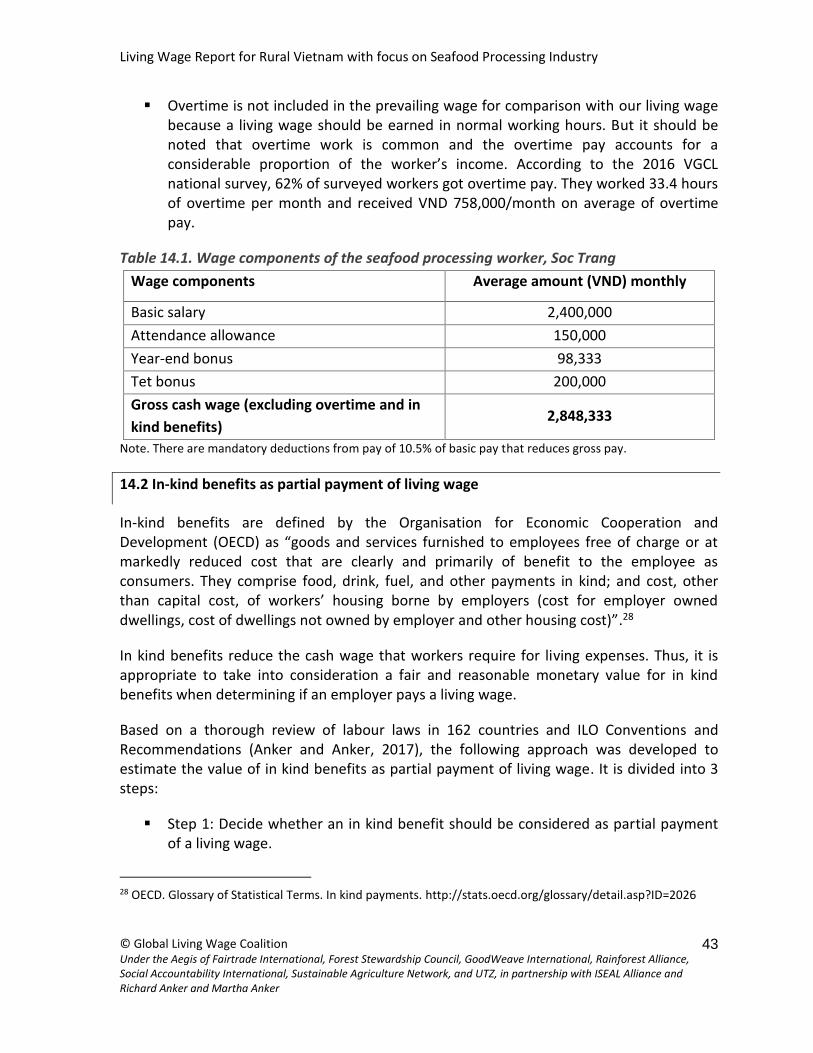
Living Wage Report for Rural Vietnam with focus on Seafood Processing Industry
© Global Living Wage Coalition Under the Aegis of Fairtrade International, Forest Stewardship Council, GoodWeave International, Rainforest Alliance, Social Accountability International, Sustainable Agriculture Network, and UTZ, in partnership with ISEAL Alliance and Richard Anker and Martha Anker
43
Overtime is not included in the prevailing wage for comparison with our living wage because a living wage should be earned in normal working hours. But it should be noted that overtime work is common and the overtime pay accounts for a considerable proportion of the worker’s income. According to the 2016 VGCL national survey, 62% of surveyed workers got overtime pay. They worked 33.4 hours of overtime per month and received VND 758,000/month on average of overtime pay.
Table 14.1. Wage components of the seafood processing worker, Soc Trang
Wage components Average amount (VND) monthly
Basic salary 2,400,000
Attendance allowance 150,000
Year-end bonus 98,333
Tet bonus 200,000
Gross cash wage (excluding overtime and in
kind benefits) 2,848,333
Note. There are mandatory deductions from pay of 10.5% of basic pay that reduces gross pay.
14.2 In-kind benefits as partial payment of living wage
In-kind benefits are defined by the Organisation for Economic Cooperation and Development (OECD) as “goods and services furnished to employees free of charge or at markedly reduced cost that are clearly and primarily of benefit to the employee as consumers. They comprise food, drink, fuel, and other payments in kind; and cost, other than capital cost, of workers’ housing borne by employers (cost for employer owned dwellings, cost of dwellings not owned by employer and other housing cost)”.28
In kind benefits reduce the cash wage that workers require for living expenses. Thus, it is appropriate to take into consideration a fair and reasonable monetary value for in kind benefits when determining if an employer pays a living wage.
Based on a thorough review of labour laws in 162 countries and ILO Conventions and Recommendations (Anker and Anker, 2017), the following approach was developed to estimate the value of in kind benefits as partial payment of living wage. It is divided into 3 steps:
Step 1: Decide whether an in kind benefit should be considered as partial payment of a living wage.
28 OECD. Glossary of Statistical Terms. In kind payments. http://stats.oecd.org/glossary/detail.asp?ID=2026

Living Wage Report for Rural Vietnam with focus on Seafood Processing Industry
© Global Living Wage Coalition Under the Aegis of Fairtrade International, Forest Stewardship Council, GoodWeave International, Rainforest Alliance, Social Accountability International, Sustainable Agriculture Network, and UTZ, in partnership with ISEAL Alliance and Richard Anker and Martha Anker
44
Step 2: Estimate monetary value for each acceptable in kind benefit.
Step 3: Ensure that the total estimated monetary value for all in kind benefits is less than maximum percentage(s) limit(s) allowed for in kind benefits.
To be considered as partial payment of a living wage, in-kind benefits should meet the following criteria:
Considered of personal benefit and value to workers or their families for personal use
Customary for an industry when estimating typical prevailing wages in an industry
Meet minimum standard. This implies for example that meals should be balanced and nutritious and housing should meet a minimum standard for healthy housing
Receive regularly so that worker can count on receiving the in kind benefit
Included on list of common and desirable in kind benefits
List of acceptable in kind benefits as partial payment of living wage in Anker and Anker (2017):
Meals at work
Food rations or commodities sold at concession rates
Housing (including electricity, water, and fuel) 29
Transport to and from work (and to town on weekends from agricultural estates)
Child care
School
Medical clinic and medical care (not required by law)
Medical insurance (not required by law)
List of common benefits that are not to be considered as partial payment of a living wage:
Visas or work permits for migrant workers
29 Note that housing for seasonal workers in dormitories should not be counted as partial payment of wages because this housing does not reduce the need for a permanent home for the worker’s family.
Living Wage Report for Rural Vietnam with focus on Seafood Processing Industry
© Global Living Wage Coalition Under the Aegis of Fairtrade International, Forest Stewardship Council, GoodWeave International, Rainforest Alliance, Social Accountability International, Sustainable Agriculture Network, and UTZ, in partnership with ISEAL Alliance and Richard Anker and Martha Anker
45
Clothing and equipment for work
Work-related supplies
Dormitories or shared housing for seasonal workers
Drinking water provided to workers at work
Land for kitchen garden
Charitable contributions to the community that do not go exclusively to workers
Contributions to Social Security or National Health Service required by law
Paid time off work for vacation, sick leave, maternity leave, or public holidays when workers are paid on monthly basis.
In kind benefits in the seafood processing industry in rural Vietnam:
The seafood processing companies in Soc Trang have the following types of in kind benefits, although the specific list varies from company to company:
Lunch. 85.2% of workers in Region 4 are provided with free lunches (VGCL 2016). The cost of the lunch to the employer is VND 13,800/person. This benefit satisfies the above-mentioned criteria (such as: of value and for workers’ personal use, provided frequently, and customary for the seafood processing industry) and so it is included prevailing wage for comparison to our living wage.
Dinner. Those who work overtime for at least 2 hours get free dinner. But only 5% of VGCL surveyed workers got dinners in 2016. This benefit, therefore, is not customary for Vietnam and is not included in prevailing wage for comparison to our living wage.
Transportation to and from work in commute buses for workers who live far from the factories. The coverage of this benefit is only 4.7% (VGCL 2016). This benefit, therefore, is not customary for Vietnam and is not included inprevailing wage for comparison to our living wage.
Free or subsidised accommodation. Although bigger companies provide free accommodation for (single) workers, others subsidize part of the accommodation fees to support workers. For rural areas (Region 4), 70.7% of workers are living in their own houses with their families so this benefit does not cover them (VGCL 2016). This benefit, therefore, is not customary in rural areas and is not included in the prevailing wage for comparison to our living wage.

Living Wage Report for Rural Vietnam with focus on Seafood Processing Industry
© Global Living Wage Coalition Under the Aegis of Fairtrade International, Forest Stewardship Council, GoodWeave International, Rainforest Alliance, Social Accountability International, Sustainable Agriculture Network, and UTZ, in partnership with ISEAL Alliance and Richard Anker and Martha Anker
46
For this study, therefore, we only include ‘lunch’ with the average value of VND 13,800/workday in the prevailing wage for comparison with the living wage.
In kind benefit = VND 13,800/day x 26 days = VND 358,800/month
15. LIVING WAGE IN CONTEXT AND COMPARED TO OTHER WAGES
15.1 Wage ladder
To put the prevailing wage in context, we present the prevailing wage of seafood processing workers in Soc Trang in a wage ladder and compare this with the estimate of living wage from this study as well as other wage benchmarks including:
VGCL’s estimate of the minimum living expenses for 2016, Region 4 for one worker and one child dependent of VND 2,915,000/month which is equivalent to a wage of VND 3,117,647 per month using the Anker methodology (i.e. multiplied by 2 to represent a family of 4 instead of 2 and divided by 1.87 full-time workers per family)
Rural government poverty line wage for 2016: VND 2,030,457/month
World Bank poverty line wage for 2015: VND 1,872,000
Asia Floor Wage for 2106: VND 8,949,153
Minimum Wage for 2016 for Region 4: VND 2,400,000/month
Average wage of rural formal sector employees for 201630: VND 4,200,000/month
Low-income employee in Vietnam income tax law: VND 5,000,000/month
Our estimate of the prevailing wage of the seafood processing workers in Soc Trang is VND 3,207,133 without overtime (VND 2,400,000 minimum/basic wage plus VND 358,800 common in kind benefits plus VND 448,333 common cash allowances) which is around 20% lower than the gross living wage (VND 3,991,841) estimated by this study.
30 MOLISA’s Quarterly Labour Bulletin, Quarter 1 of 2016.
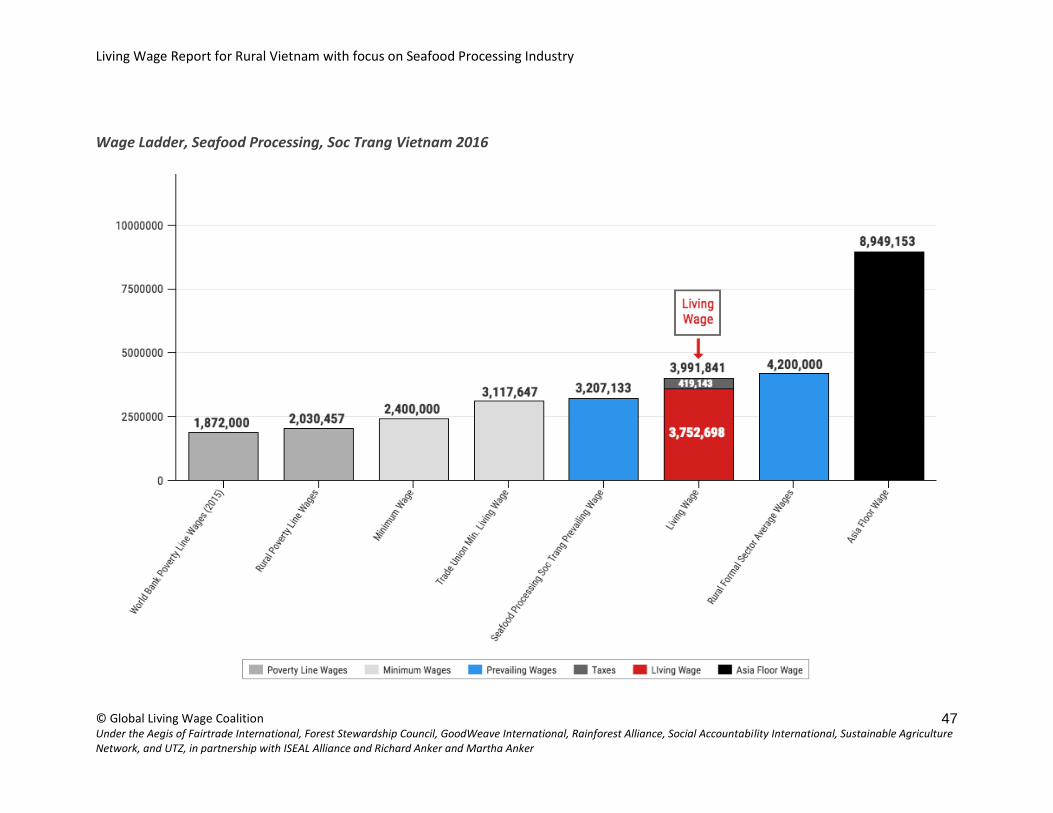
Living Wage Report for Rural Vietnam with focus on Seafood Processing Industry
© Global Living Wage Coalition Under the Aegis of Fairtrade International, Forest Stewardship Council, GoodWeave International, Rainforest Alliance, Social Accountability International, Sustainable Agriculture Network, and UTZ, in partnership with ISEAL Alliance and Richard Anker and Martha Anker
47
Wage Ladder, Seafood Processing, Soc Trang Vietnam 2016

Living Wage Report for Rural Vietnam with focus on Seafood Processing Industry
© Global Living Wage Coalition Under the Aegis of Fairtrade International, Forest Stewardship Council, GoodWeave International, Rainforest Alliance, Social Accountability International, Sustainable Agriculture Network, and UTZ, in partnership with ISEAL Alliance and Richard Anker and Martha Anker
48
15.2 Recent wage trends
While the real GDP per capita of Vietnam has increased steadily since 2001, real minimum wages have fluctuated significantly. The minimum wage policy of Vietnam in the past 15 years can be divided into 3 periods. Before 2006, Vietnam had a complicated system of regional and sectoral minimum wages. The minimum wages were frozen between 1998 and 2005 due to the impact of the Asian Financial Crisis and as a result the real minimum wage in this period fell steadily. In 2006, a large wave of strikes exploded in the south of Vietnam with hundreds of thousands of workers walking out to demand an increase of the minimum wage. Since 2006, the Government of Vietnam has greatly increased real minimum wages, especially after 2011 when the inflation rate fell below 5%.
However, real minimum wages have been increasing at a much faster rate than labour productivity (Figure 15.1). According to the World Bank, the real minimum wage in Vietnam increased by around 12% on an annual basis since 2006 while labour productivity increased by only 3.4%/year in the last decade.
Figure 15.1: Real regional minimum wages and labour productivity (indexed to 2006)
Source: World Bank Vietnam 2015.
Recently, the National Wage Council agreed to a lower rate of increase in minimum wages of 7.3% for 2017 as compared to previous years. Considering the slower increase in real minimum wages starting in 2017 along with the continuing slow increase in labour productivity, the issue of living wage and the voluntary participation of factories and brands in improving the wages for workers in Vietnam will be crucial to ensuring decent living standards for workers.
0
200
400
600
800
1000
1200
2 0 0 1 2 0 0 2 2 0 0 3 2 0 0 4 2 0 0 5 2 0 0 6 2 0 0 7 2 0 0 8 2 0 0 9 2 0 1 0 2 0 1 1 2 0 1 2 2 0 1 3
Domestic region 4 Domestic region 1 FIE region 4 GDP per capita (constant 2005 USD)
Living Wage Report for Rural Vietnam with focus on Seafood Processing Industry
© Global Living Wage Coalition Under the Aegis of Fairtrade International, Forest Stewardship Council, GoodWeave International, Rainforest Alliance, Social Accountability International, Sustainable Agriculture Network, and UTZ, in partnership with ISEAL Alliance and Richard Anker and Martha Anker
49
16. CONCLUSIONS
This report estimated a living wage for rural areas of Vietnam, focusing on Soc Trang and Thai Binh and the seafood processing industry in Soc Trang, by using the new methodology developed by Anker and Anker (2017). We feel that our living wage can be applied to all wage workers in rural Vietnam.
Our living wage estimate considered all of the important costs that a family of four in rural Vietnam faces in order to have a basic and decent living standard. Our living wage is VND 3,991,841 (USD 181) per month. This is approximately 66% higher than the minimum wage in Region 4 (rural). Our living wage is approximately 24% higher than the prevailing wages of workers in the seafood processing industry in Soc Trang when common in kind benefits and cash allowances are considered part of prevailing wages (but not overtime pay, since a living wage should be earned in normal working time).31
Workers in seafood processing factories in Vietnam have to pay 10.5% for social taxes including social insurance, health insurance, and unemployment insurance. If the worker is a union member, s/he has to pay dues for up to 1% of the basic salary. The net living wage take home pay required for decency after mandatory deductions (for non-union members) is VND 3,572,698 (USD 162).
To estimate our living wage, we were clear about the assumptions we used so that stakeholders and others understand how our living wage benchmarks were estimated and what workers and their families would be able to afford if they earned a living wage. Our living wage is based on normative standards for nutritious diet, healthy housing, adequate health care, education of children through secondary school, and transportation. We based our living wage estimates on available national survey data as well as new fieldwork research we conducted (interviews with workers and their families, sellers, service providers, managers) to determine realistic expenditures for workers’ families in the region. Therefore, our living wage estimate is time and place specific. Also, our living wage benchmark is a conservative estimate of how much workers need to earn for decency because we used the lower costs to ensure the acceptable standards (e.g. acceptable living space for a family of only 4 persons is only 30 square meters including space for a garret). Therefore, our living wage benchmark is far from an exaggerated and utopian estimate of needs. In this regard, it is worth noting that our gross rural living wage is less than half of the Asian Floor Wage and around 20% less than what is considered to be a low-income employee in Vietnam income tax law.
Although the Vietnamese government has increased the minimum wages by over 12% per year over the past decade as indicated above, the rural minimum wages is still considerably lower than a rural living wage. The prevailing wage of food processing workers is closer to
31 The minimum wage (unskilled worker) for Region 4 (including Soc Trang and Thai Binh) is VND 2,400,000 in 2016.

Living Wage Report for Rural Vietnam with focus on Seafood Processing Industry
© Global Living Wage Coalition Under the Aegis of Fairtrade International, Forest Stewardship Council, GoodWeave International, Rainforest Alliance, Social Accountability International, Sustainable Agriculture Network, and UTZ, in partnership with ISEAL Alliance and Richard Anker and Martha Anker
50
our estimate of a rural living wage but it should be noted that the remuneration of workers is highly unstable as almost all of seafood processing workers are paid by piece rate. The pay that workers receive depend first and foremost on their length of work, and much less on their seniority and skill levels. Female workers who have bad health or have young children are often faced with considerable reduction of pay due to their lower hours of work and so lower production. According to female seafood processing workers we interviewed, their salaries were reduced in months when their kids were sick.
At the same time, it will be difficult for the Vietnam government to continue raising the minimum wages at the same rate as in recent years because the rate of labour productivity increases in the past decade have lagged far behind increases in the real minimum wage. In fact, the minimum wage increase for 2017 will be 7.3% only, much lower than the average increase of recent years.
To raise the wages for workers to a living wage level will require the concerted effort of factories, brands, social compliance companies, local trade unions and the government to figure out the best measures that fit with the specific conditions of the industry and the region.
Table 16.1: Summary table for calculating our living wages
ITEM VND USD32
PART I. FAMILY EXPENSES
Food cost per month for reference family (1) 2,940,805 134
Food cost per person per day 24,171 1.10
Housing costs per month (2) 1,087,000 49
Rent per month for acceptable housing 800,000 36
Utilities and minor repairs per month 287,000 13
Non-food non-housing costs per month taking into consideration post checks (3)
2,334,000 106
Preliminary estimate of non-food non-housing costs 2,334,999 106
Health care post check adjustment 0 0
Education post check adjustment 0 0
Transport post check adjustment 0 0
321 USD = 22,200 VND.

Living Wage Report for Rural Vietnam with focus on Seafood Processing Industry
© Global Living Wage Coalition Under the Aegis of Fairtrade International, Forest Stewardship Council, GoodWeave International, Rainforest Alliance, Social Accountability International, Sustainable Agriculture Network, and UTZ, in partnership with ISEAL Alliance and Richard Anker and Martha Anker
51
ITEM VND USD32
Additional 5% for sustainability and emergencies (4) 318,170 14
Total household costs per month for basic but decent living standard for reference family (5) [5=1+2+3+4]
6,680,944 304
PART II. LIVING WAGE PER MONTH
Living wage per month, net take home pay (6) [6=5/1.87 full-time equivalent workers]
3,572,698 162
Mandatory deductions from pay (7) (listed in notes to table)a
419,143 19
Gross wage required per month for Living Wage (9) [9=6-7]
3,991,841 181
PART III: LIVING WAGE BASIC CASH WAGE IN INDUSTRY CONSIDERING VALUE OF COMMON IN KIND BENEFITS, CASH ALLOWANCES, AND BONUSES IN INDUSTRY
Typical value per month of common in kind benefits in industry (10A) (list in notes to table)b
358,800 16
Typical value per month of common cash allowances and bonuses in industry (10B) (list in notes to table)c
448,333 20
Net cash living wage basic wage when workers receive typical in kind benefits, cash allowances, and bonuses in industry (11) [11= 6-10A-10B],
2,765,565 125
Gross cash living wage basic wage when worker receives typical in kind benefits, cash allowance, and bonuses in industry (12) [12= 9-10A-10B]
3,184,708 143
Notes: 1. Mandatory deductions from pay and universal bonus include the following items and percentages:
a. 8% for social insurance b. 1.5% for health insurance c. 1% for unemployment insurance
2. Common in-kind benefits include: a. Lunch: VND 358,800/month
3. Common cash allowances and bonuses include: a. Attendance allowance: VND 150,000/month b. Tet bonus: VND 200,000/month on prorated basis c. Year-end bonus: VND 98,333/month on prorated basis

Living Wage Report for Rural Vietnam with focus on Seafood Processing Industry
© Global Living Wage Coalition Under the Aegis of Fairtrade International, Forest Stewardship Council, GoodWeave International, Rainforest Alliance, Social Accountability International, Sustainable Agriculture Network, and UTZ, in partnership with ISEAL Alliance and Richard Anker and Martha Anker
52
Table 16.2: Key values and assumptions for a living wage estimate
KEY VALUES AND ASSUMPTIONS Comments
Location (& industry if relevant) Rural. Soc Trang (Seafood processing) and Thai Binh
Exchange rate of local currency to USD 22,200
Number of full-time workdays per month 26
Number of hours in normal workweek 48
Number of workers per couple 1.87
Reference family size 4
Number of children in reference family 2
Preliminary ratio of non-food non-housing costs to food costs
0.794
Living Wage Report for Rural Vietnam with focus on Seafood Processing Industry
© Global Living Wage Coalition Under the Aegis of Fairtrade International, Forest Stewardship Council, GoodWeave International, Rainforest Alliance, Social Accountability International, Sustainable Agriculture Network, and UTZ, in partnership with ISEAL Alliance and Richard Anker and Martha Anker
53
REFERENCES Anker, R. And Anker, M. (2017). Living wages around the world: Manual for measurement.
Edward Elgar Publishing. Cheltenham and Northampton.
Anker, R and Anker, N. (2017a). In kind benefits as partial payment of wages: A review of
laws around the world. Political Economy Research Institute. University of
Massachusetts. Amherst.
Anker, R. (2011). Estimating a living wage: A methodological review. International Labour
Office. Geneva.
Do, Q.Chi and Tom, N. (2016). Minimum Wage and Collective Bargaining – Country study of
Vietnam. ILO. Geneva.
Fair Wear Foundation (2015). Country Study for Vietnam (Link:
http://www.fairwear.org/534/news/news_item/country-study-vietnam-
online/?id=877).
General Statistics Office (2012). Vietnam Household Living Standards Survey. Hanoi, GSO.
General Statistics Office (2012). Vietnam Labour Force Survey. Hanoi, GSO.
HID (2011). Migrant workers’ access to pre-primary education services in Ho Chi Minh city.
Link to access:
http://www.hids.hochiminhcity.gov.vn/c/document_library/get_file?uuid=b56cbade
-c321-41df-a143-2907f96fbabc&groupId=13025.
ILO (2015). Global Wage Report. Geneva, ILO .
MOLISA (2016). Report on the Survey on Tet Bonus and Wages.
Oxfam Vietnam (2015). Migrant Workers’ Access to Social Security. Oxfam Vietnam, Hanoi.
Socialist Republic of Vietnam (2005). Law on Housing, issued on 29th November 2005
(Available at:
http://www.moj.gov.vn/vbpq/en/lists/vn%20bn%20php%20lut/view_detail.aspx?ite
mid=5972).
UNDP (2014). Human Development Report 2014. New York, UNDP.
VGCL (2016). Report on the Survey on Workers’ Minimum Living Expenses and
Recommendations for Minimum Wage Adjustments.
World Bank (2015).Taking stock: An update on Vietnam's recent economic developments.
Washington, D.C. : World Bank Group.
http://documents.worldbank.org/curated/en/2015/07/24790418/taking-stock-
update-vietnams-recent-economic-developments .